Embed Size (px)
Citation preview
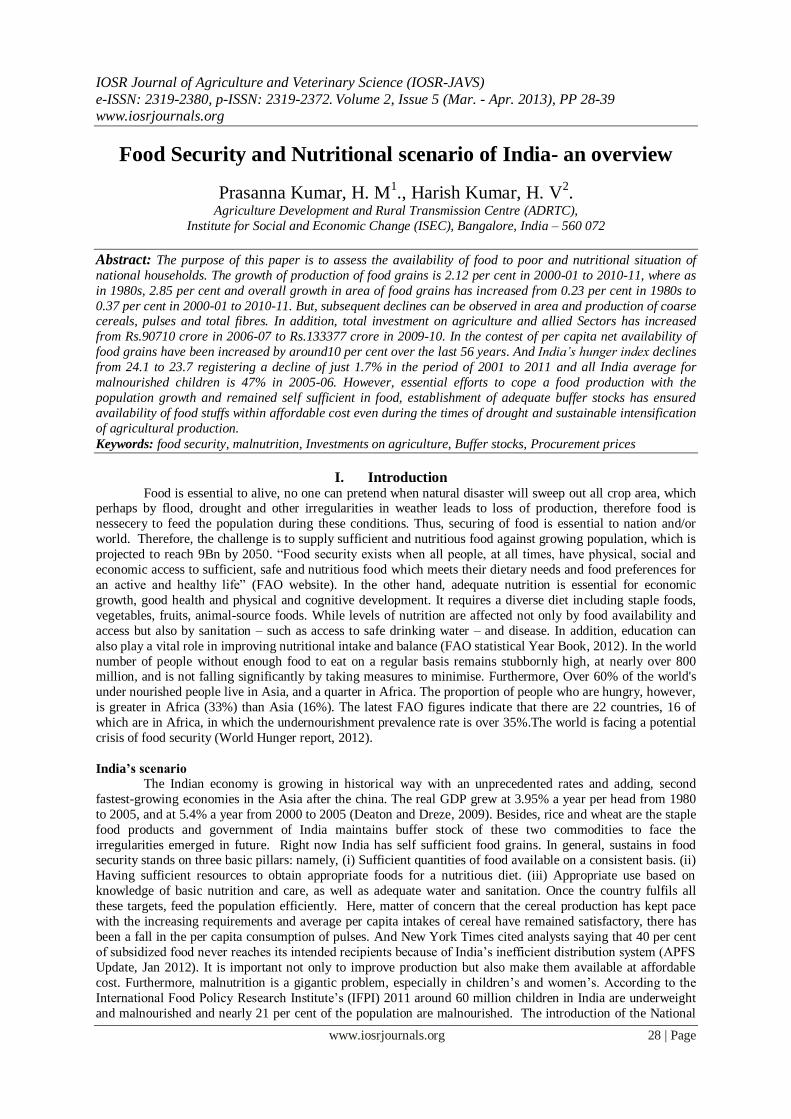
IOSR Journal of Agriculture and Veterinary Science (IOSR-JAVS)
e-ISSN: 2319-2380, p-ISSN: 2319-2372. Volume 2, Issue 5 (Mar. - Apr. 2013), PP 28-39 www.iosrjournals.org
www.iosrjournals.org 28 | Page
Food Security and Nutritional scenario of India- an overview
Prasanna Kumar, H. M1., Harish Kumar, H. V
2.
Agriculture Development and Rural Transmission Centre (ADRTC),
Institute for Social and Economic Change (ISEC), Bangalore, India – 560 072
Abstract: The purpose of this paper is to assess the availability of food to poor and nutritional situation of
national households. The growth of production of food grains is 2.12 per cent in 2000-01 to 2010-11, where as
in 1980s, 2.85 per cent and overall growth in area of food grains has increased from 0.23 per cent in 1980s to
0.37 per cent in 2000-01 to 2010-11. But, subsequent declines can be observed in area and production of coarse cereals, pulses and total fibres. In addition, total investment on agriculture and allied Sectors has increased
from Rs.90710 crore in 2006-07 to Rs.133377 crore in 2009-10. In the contest of per capita net availability of
food grains have been increased by around10 per cent over the last 56 years. And India’s hunger index declines
from 24.1 to 23.7 registering a decline of just 1.7% in the period of 2001 to 2011 and all India average for
malnourished children is 47% in 2005-06. However, essential efforts to cope a food production with the
population growth and remained self sufficient in food, establishment of adequate buffer stocks has ensured
availability of food stuffs within affordable cost even during the times of drought and sustainable intensification
of agricultural production.
Keywords: food security, malnutrition, Investments on agriculture, Buffer stocks, Procurement prices
I. Introduction Food is essential to alive, no one can pretend when natural disaster will sweep out all crop area, which
perhaps by flood, drought and other irregularities in weather leads to loss of production, therefore food is
nessecery to feed the population during these conditions. Thus, securing of food is essential to nation and/or
world. Therefore, the challenge is to supply sufficient and nutritious food against growing population, which is
projected to reach 9Bn by 2050. “Food security exists when all people, at all times, have physical, social and
economic access to sufficient, safe and nutritious food which meets their dietary needs and food preferences for
an active and healthy life” (FAO website). In the other hand, adequate nutrition is essential for economic
growth, good health and physical and cognitive development. It requires a diverse diet including staple foods,
vegetables, fruits, animal-source foods. While levels of nutrition are affected not only by food availability and
access but also by sanitation – such as access to safe drinking water – and disease. In addition, education can
also play a vital role in improving nutritional intake and balance (FAO statistical Year Book, 2012). In the world
number of people without enough food to eat on a regular basis remains stubbornly high, at nearly over 800 million, and is not falling significantly by taking measures to minimise. Furthermore, Over 60% of the world's
under nourished people live in Asia, and a quarter in Africa. The proportion of people who are hungry, however,
is greater in Africa (33%) than Asia (16%). The latest FAO figures indicate that there are 22 countries, 16 of
which are in Africa, in which the undernourishment prevalence rate is over 35%.The world is facing a potential
crisis of food security (World Hunger report, 2012).
India’s scenario
The Indian economy is growing in historical way with an unprecedented rates and adding, second
fastest-growing economies in the Asia after the china. The real GDP grew at 3.95% a year per head from 1980
to 2005, and at 5.4% a year from 2000 to 2005 (Deaton and Dreze, 2009). Besides, rice and wheat are the staple
food products and government of India maintains buffer stock of these two commodities to face the
irregularities emerged in future. Right now India has self sufficient food grains. In general, sustains in food security stands on three basic pillars: namely, (i) Sufficient quantities of food available on a consistent basis. (ii)
Having sufficient resources to obtain appropriate foods for a nutritious diet. (iii) Appropriate use based on
knowledge of basic nutrition and care, as well as adequate water and sanitation. Once the country fulfils all
these targets, feed the population efficiently. Here, matter of concern that the cereal production has kept pace
with the increasing requirements and average per capita intakes of cereal have remained satisfactory, there has
been a fall in the per capita consumption of pulses. And New York Times cited analysts saying that 40 per cent
of subsidized food never reaches its intended recipients because of India’s inefficient distribution system (APFS
Update, Jan 2012). It is important not only to improve production but also make them available at affordable
cost. Furthermore, malnutrition is a gigantic problem, especially in children’s and women’s. According to the
International Food Policy Research Institute’s (IFPI) 2011 around 60 million children in India are underweight
and malnourished and nearly 21 per cent of the population are malnourished. The introduction of the National
Food Security and Nutritional scenario of India- an overview
www.iosrjournals.org 29 | Page
Food Security Bill threatening to continue market inefficiencies in food supply and extend the problem of
malnutrition far into the future (diplomat.com). In addition, the report of World Bank says productivity losses in
India due to stunted growth, iodine deficiencies, and iron deficiencies are equivalent to almost 3 percent of
GDP.
The objective of this paper is to (a) Evaluate the status of food availability in India. (b) Accessibility to
food and nutrition requirements at the household at national level. (c) Measures and policies taken to realize
food and nutrition security. The main goals of this paper are to evaluate the performance, challenges, and policies in food security by means of availability and access to food and nutrition.
Food production and availability
Food security is both physical and economic access to food that meets people's dietary needs as well as
their food preference. Food security as “when all people at all times have access to sufficient, safe, nutritious
food to maintain a healthy and active life” (World Food Summit 1996). Food security is a complex sustainable
development issue, linked to health through malnutrition, but also to sustainable economic development,
environment, and trade. There is a great deal of debate around food security with some arguing that there is
enough food in the world to feed everyone adequately; the problem is distribution, Future food needs can - or
cannot - be met by current levels of production and National food security is paramount (WHO website, 2012).
Food production depends on a wide range of factors, including access to fertile land, availability of labour, appropriate seeds and tools and climatic conditions. Alternatively, factors affecting food purchases include
household income and assets as well as food availability and price in local markets. In emergency situations,
other factors may come into play including physical security and mobility, the integrity of markets and access to
land.
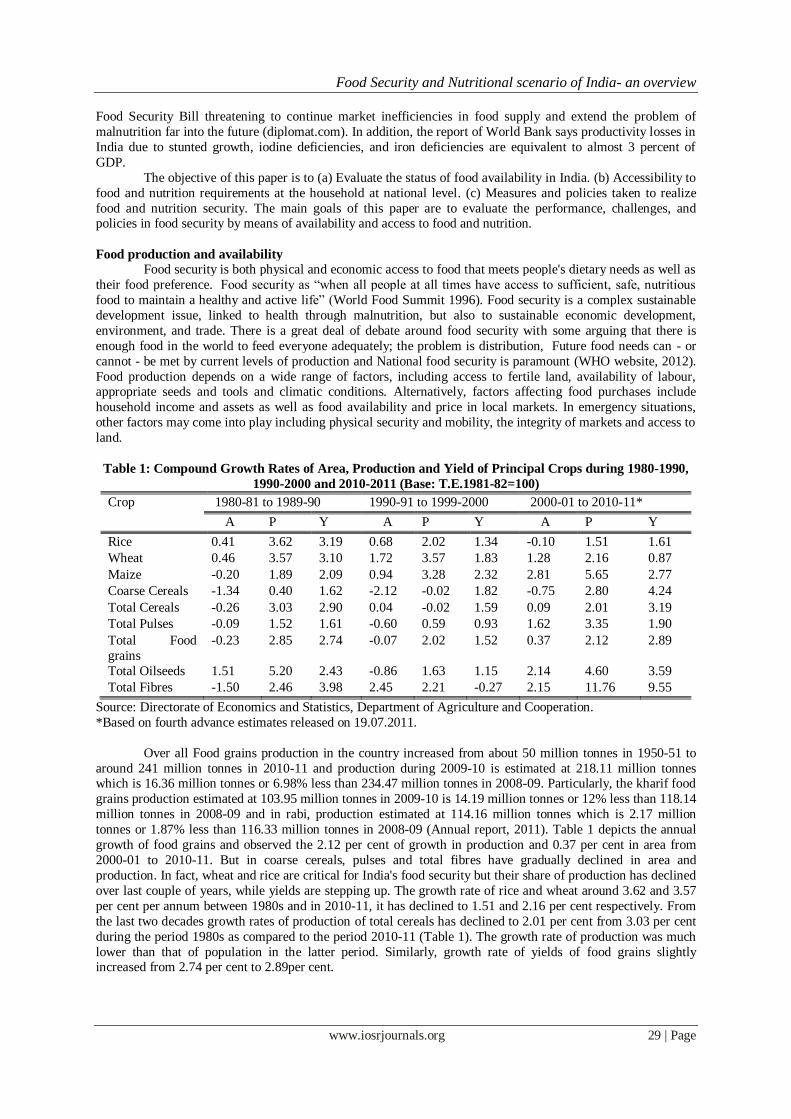
Table 1: Compound Growth Rates of Area, Production and Yield of Principal Crops during 1980-1990,
1990-2000 and 2010-2011 (Base: T.E.1981-82=100)
Crop 1980-81 to 1989-90 1990-91 to 1999-2000 2000-01 to 2010-11*
A P Y A P Y A P Y
Rice 0.41 3.62 3.19 0.68 2.02 1.34 -0.10 1.51 1.61
Wheat 0.46 3.57 3.10 1.72 3.57 1.83 1.28 2.16 0.87
Maize -0.20 1.89 2.09 0.94 3.28 2.32 2.81 5.65 2.77
Coarse Cereals -1.34 0.40 1.62 -2.12 -0.02 1.82 -0.75 2.80 4.24
Total Cereals -0.26 3.03 2.90 0.04 -0.02 1.59 0.09 2.01 3.19
Total Pulses -0.09 1.52 1.61 -0.60 0.59 0.93 1.62 3.35 1.90
Total Food
grains
-0.23 2.85 2.74 -0.07 2.02 1.52 0.37 2.12 2.89
Total Oilseeds 1.51 5.20 2.43 -0.86 1.63 1.15 2.14 4.60 3.59
Total Fibres -1.50 2.46 3.98 2.45 2.21 -0.27 2.15 11.76 9.55
Source: Directorate of Economics and Statistics, Department of Agriculture and Cooperation.
*Based on fourth advance estimates released on 19.07.2011.
Over all Food grains production in the country increased from about 50 million tonnes in 1950-51 to
around 241 million tonnes in 2010-11 and production during 2009-10 is estimated at 218.11 million tonnes which is 16.36 million tonnes or 6.98% less than 234.47 million tonnes in 2008-09. Particularly, the kharif food
grains production estimated at 103.95 million tonnes in 2009-10 is 14.19 million tonnes or 12% less than 118.14
million tonnes in 2008-09 and in rabi, production estimated at 114.16 million tonnes which is 2.17 million
tonnes or 1.87% less than 116.33 million tonnes in 2008-09 (Annual report, 2011). Table 1 depicts the annual
growth of food grains and observed the 2.12 per cent of growth in production and 0.37 per cent in area from
2000-01 to 2010-11. But in coarse cereals, pulses and total fibres have gradually declined in area and
production. In fact, wheat and rice are critical for India's food security but their share of production has declined
over last couple of years, while yields are stepping up. The growth rate of rice and wheat around 3.62 and 3.57
per cent per annum between 1980s and in 2010-11, it has declined to 1.51 and 2.16 per cent respectively. From
the last two decades growth rates of production of total cereals has declined to 2.01 per cent from 3.03 per cent
during the period 1980s as compared to the period 2010-11 (Table 1). The growth rate of production was much
lower than that of population in the latter period. Similarly, growth rate of yields of food grains slightly increased from 2.74 per cent to 2.89per cent.
Food Security and Nutritional scenario of India- an overview
www.iosrjournals.org 30 | Page
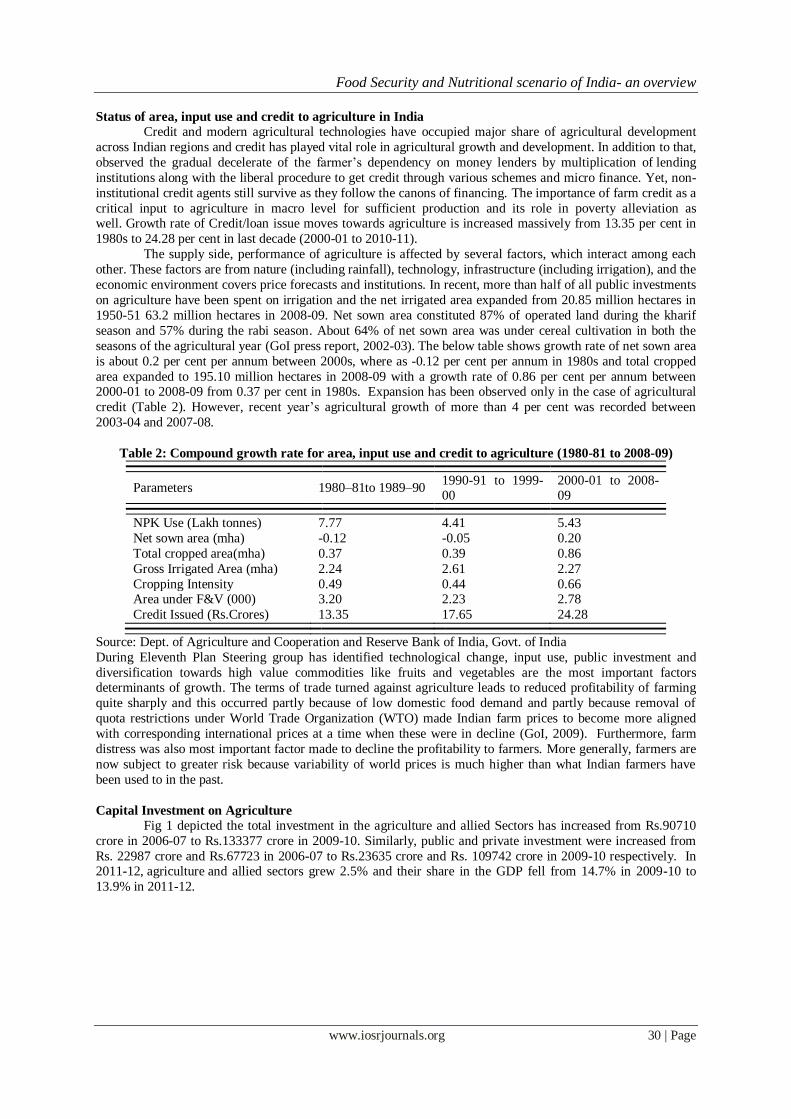
Status of area, input use and credit to agriculture in India Credit and modern agricultural technologies have occupied major share of agricultural development
across Indian regions and credit has played vital role in agricultural growth and development. In addition to that,
observed the gradual decelerate of the farmer’s dependency on money lenders by multiplication of lending
institutions along with the liberal procedure to get credit through various schemes and micro finance. Yet, non-
institutional credit agents still survive as they follow the canons of financing. The importance of farm credit as a
critical input to agriculture in macro level for sufficient production and its role in poverty alleviation as well. Growth rate of Credit/loan issue moves towards agriculture is increased massively from 13.35 per cent in
1980s to 24.28 per cent in last decade (2000-01 to 2010-11).
The supply side, performance of agriculture is affected by several factors, which interact among each
other. These factors are from nature (including rainfall), technology, infrastructure (including irrigation), and the
economic environment covers price forecasts and institutions. In recent, more than half of all public investments
on agriculture have been spent on irrigation and the net irrigated area expanded from 20.85 million hectares in
1950-51 63.2 million hectares in 2008-09. Net sown area constituted 87% of operated land during the kharif
season and 57% during the rabi season. About 64% of net sown area was under cereal cultivation in both the
seasons of the agricultural year (GoI press report, 2002-03). The below table shows growth rate of net sown area
is about 0.2 per cent per annum between 2000s, where as -0.12 per cent per annum in 1980s and total cropped
area expanded to 195.10 million hectares in 2008-09 with a growth rate of 0.86 per cent per annum between 2000-01 to 2008-09 from 0.37 per cent in 1980s. Expansion has been observed only in the case of agricultural
credit (Table 2). However, recent year’s agricultural growth of more than 4 per cent was recorded between
2003-04 and 2007-08.
Table 2: Compound growth rate for area, input use and credit to agriculture (1980-81 to 2008-09)
Parameters 1980–81to 1989–90 1990-91 to 1999-00
2000-01 to 2008-09
NPK Use (Lakh tonnes) 7.77 4.41 5.43
Net sown area (mha) -0.12 -0.05 0.20
Total cropped area(mha) 0.37 0.39 0.86
Gross Irrigated Area (mha) 2.24 2.61 2.27
Cropping Intensity 0.49 0.44 0.66 Area under F&V (000) 3.20 2.23 2.78
Credit Issued (Rs.Crores) 13.35 17.65 24.28
Source: Dept. of Agriculture and Cooperation and Reserve Bank of India, Govt. of India
During Eleventh Plan Steering group has identified technological change, input use, public investment and
diversification towards high value commodities like fruits and vegetables are the most important factors determinants of growth. The terms of trade turned against agriculture leads to reduced profitability of farming
quite sharply and this occurred partly because of low domestic food demand and partly because removal of
quota restrictions under World Trade Organization (WTO) made Indian farm prices to become more aligned
with corresponding international prices at a time when these were in decline (GoI, 2009). Furthermore, farm
distress was also most important factor made to decline the profitability to farmers. More generally, farmers are
now subject to greater risk because variability of world prices is much higher than what Indian farmers have
been used to in the past.
Capital Investment on Agriculture
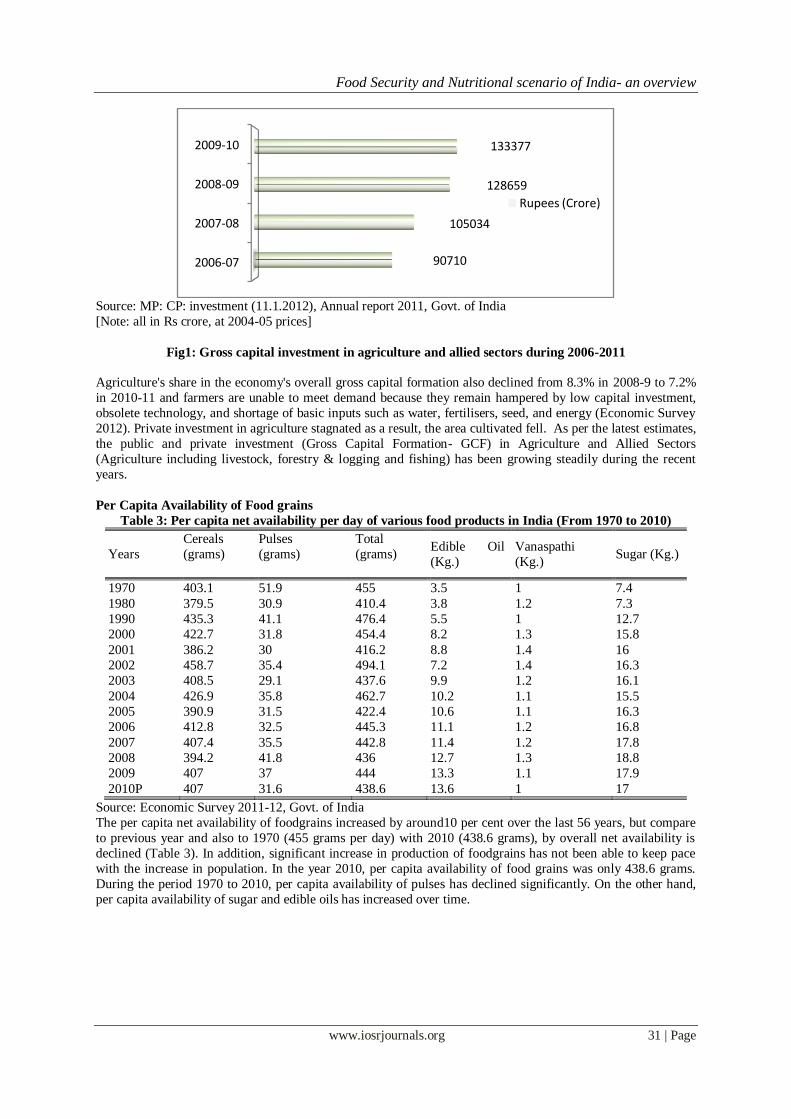
Fig 1 depicted the total investment in the agriculture and allied Sectors has increased from Rs.90710
crore in 2006-07 to Rs.133377 crore in 2009-10. Similarly, public and private investment were increased from
Rs. 22987 crore and Rs.67723 in 2006-07 to Rs.23635 crore and Rs. 109742 crore in 2009-10 respectively. In 2011-12, agriculture and allied sectors grew 2.5% and their share in the GDP fell from 14.7% in 2009-10 to
13.9% in 2011-12.
Food Security and Nutritional scenario of India- an overview
www.iosrjournals.org 31 | Page
Source: MP: CP: investment (11.1.2012), Annual report 2011, Govt. of India
[Note: all in Rs crore, at 2004-05 prices]
Fig1: Gross capital investment in agriculture and allied sectors during 2006-2011
Agriculture's share in the economy's overall gross capital formation also declined from 8.3% in 2008-9 to 7.2%
in 2010-11 and farmers are unable to meet demand because they remain hampered by low capital investment,
obsolete technology, and shortage of basic inputs such as water, fertilisers, seed, and energy (Economic Survey
2012). Private investment in agriculture stagnated as a result, the area cultivated fell. As per the latest estimates,
the public and private investment (Gross Capital Formation- GCF) in Agriculture and Allied Sectors
(Agriculture including livestock, forestry & logging and fishing) has been growing steadily during the recent
years.
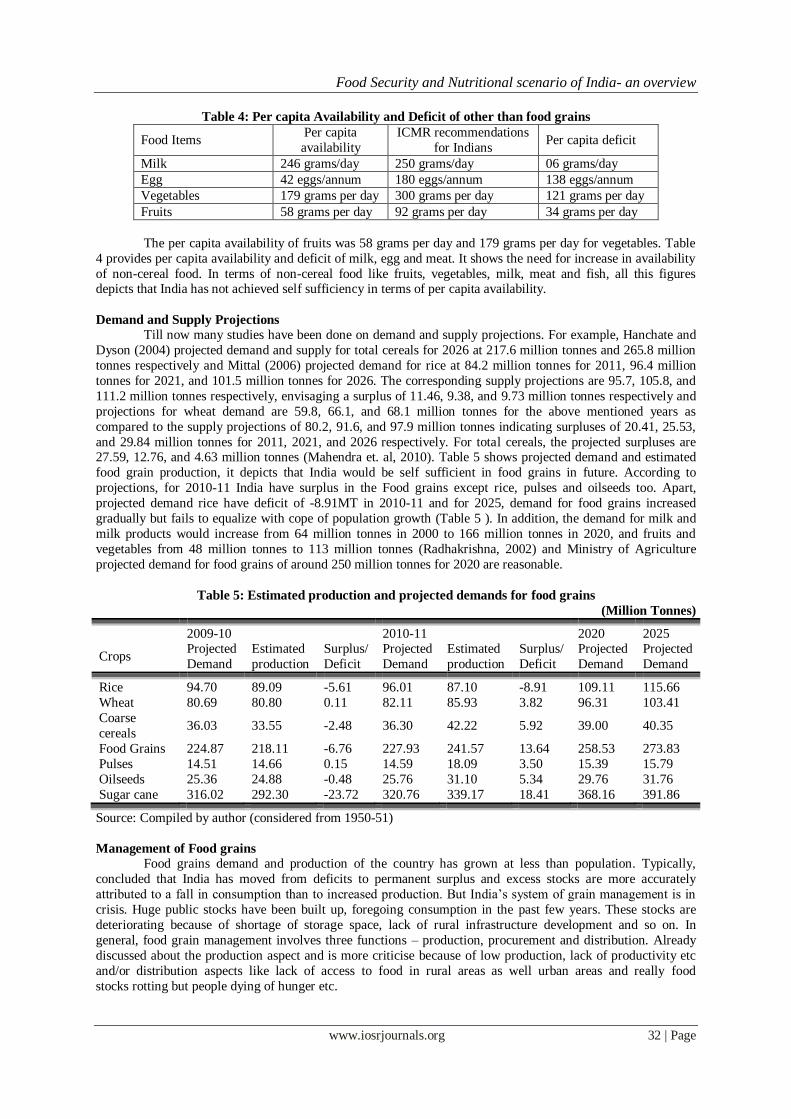
Per Capita Availability of Food grains
Table 3: Per capita net availability per day of various food products in India (From 1970 to 2010)
Years
Cereals
(grams)
Pulses
(grams)
Total
(grams)
Edible Oil
(Kg.)
Vanaspathi
(Kg.) Sugar (Kg.)
1970 403.1 51.9 455 3.5 1 7.4
1980 379.5 30.9 410.4 3.8 1.2 7.3
1990 435.3 41.1 476.4 5.5 1 12.7
2000 422.7 31.8 454.4 8.2 1.3 15.8
2001 386.2 30 416.2 8.8 1.4 16
2002 458.7 35.4 494.1 7.2 1.4 16.3
2003 408.5 29.1 437.6 9.9 1.2 16.1
2004 426.9 35.8 462.7 10.2 1.1 15.5
2005 390.9 31.5 422.4 10.6 1.1 16.3
2006 412.8 32.5 445.3 11.1 1.2 16.8
2007 407.4 35.5 442.8 11.4 1.2 17.8
2008 394.2 41.8 436 12.7 1.3 18.8
2009 407 37 444 13.3 1.1 17.9
2010P 407 31.6 438.6 13.6 1 17
Source: Economic Survey 2011-12, Govt. of India
The per capita net availability of foodgrains increased by around10 per cent over the last 56 years, but compare
to previous year and also to 1970 (455 grams per day) with 2010 (438.6 grams), by overall net availability is
declined (Table 3). In addition, significant increase in production of foodgrains has not been able to keep pace
with the increase in population. In the year 2010, per capita availability of food grains was only 438.6 grams.
During the period 1970 to 2010, per capita availability of pulses has declined significantly. On the other hand,
per capita availability of sugar and edible oils has increased over time.
2006-07
2007-08
2008-09
2009-10
90710
105034
128659
133377
Rupees (Crore)
Food Security and Nutritional scenario of India- an overview
www.iosrjournals.org 32 | Page
Table 4: Per capita Availability and Deficit of other than food grains
Food Items Per capita
availability
ICMR recommendations
for Indians Per capita deficit
Milk 246 grams/day 250 grams/day 06 grams/day
Egg 42 eggs/annum 180 eggs/annum 138 eggs/annum
Vegetables 179 grams per day 300 grams per day 121 grams per day
Fruits 58 grams per day 92 grams per day 34 grams per day
The per capita availability of fruits was 58 grams per day and 179 grams per day for vegetables. Table
4 provides per capita availability and deficit of milk, egg and meat. It shows the need for increase in availability
of non-cereal food. In terms of non-cereal food like fruits, vegetables, milk, meat and fish, all this figures depicts that India has not achieved self sufficiency in terms of per capita availability.
Demand and Supply Projections
Till now many studies have been done on demand and supply projections. For example, Hanchate and
Dyson (2004) projected demand and supply for total cereals for 2026 at 217.6 million tonnes and 265.8 million
tonnes respectively and Mittal (2006) projected demand for rice at 84.2 million tonnes for 2011, 96.4 million
tonnes for 2021, and 101.5 million tonnes for 2026. The corresponding supply projections are 95.7, 105.8, and
111.2 million tonnes respectively, envisaging a surplus of 11.46, 9.38, and 9.73 million tonnes respectively and
projections for wheat demand are 59.8, 66.1, and 68.1 million tonnes for the above mentioned years as
compared to the supply projections of 80.2, 91.6, and 97.9 million tonnes indicating surpluses of 20.41, 25.53,
and 29.84 million tonnes for 2011, 2021, and 2026 respectively. For total cereals, the projected surpluses are 27.59, 12.76, and 4.63 million tonnes (Mahendra et. al, 2010). Table 5 shows projected demand and estimated
food grain production, it depicts that India would be self sufficient in food grains in future. According to
projections, for 2010-11 India have surplus in the Food grains except rice, pulses and oilseeds too. Apart,
projected demand rice have deficit of -8.91MT in 2010-11 and for 2025, demand for food grains increased
gradually but fails to equalize with cope of population growth (Table 5 ). In addition, the demand for milk and
milk products would increase from 64 million tonnes in 2000 to 166 million tonnes in 2020, and fruits and
vegetables from 48 million tonnes to 113 million tonnes (Radhakrishna, 2002) and Ministry of Agriculture
projected demand for food grains of around 250 million tonnes for 2020 are reasonable.
Table 5: Estimated production and projected demands for food grains
(Million Tonnes)
2009-10 2010-11 2020 2025
Crops Projected
Demand
Estimated
production
Surplus/
Deficit
Projected
Demand
Estimated
production
Surplus/
Deficit
Projected
Demand
Projected
Demand
Rice 94.70 89.09 -5.61 96.01 87.10 -8.91 109.11 115.66
Wheat 80.69 80.80 0.11 82.11 85.93 3.82 96.31 103.41
Coarse
cereals 36.03 33.55 -2.48 36.30 42.22 5.92 39.00 40.35
Food Grains 224.87 218.11 -6.76 227.93 241.57 13.64 258.53 273.83
Pulses 14.51 14.66 0.15 14.59 18.09 3.50 15.39 15.79
Oilseeds 25.36 24.88 -0.48 25.76 31.10 5.34 29.76 31.76
Sugar cane 316.02 292.30 -23.72 320.76 339.17 18.41 368.16 391.86
Source: Compiled by author (considered from 1950-51)
Management of Food grains Food grains demand and production of the country has grown at less than population. Typically,
concluded that India has moved from deficits to permanent surplus and excess stocks are more accurately
attributed to a fall in consumption than to increased production. But India’s system of grain management is in
crisis. Huge public stocks have been built up, foregoing consumption in the past few years. These stocks are
deteriorating because of shortage of storage space, lack of rural infrastructure development and so on. In
general, food grain management involves three functions – production, procurement and distribution. Already
discussed about the production aspect and is more criticise because of low production, lack of productivity etc
and/or distribution aspects like lack of access to food in rural areas as well urban areas and really food
stocks rotting but people dying of hunger etc.
Food Security and Nutritional scenario of India- an overview
www.iosrjournals.org 33 | Page
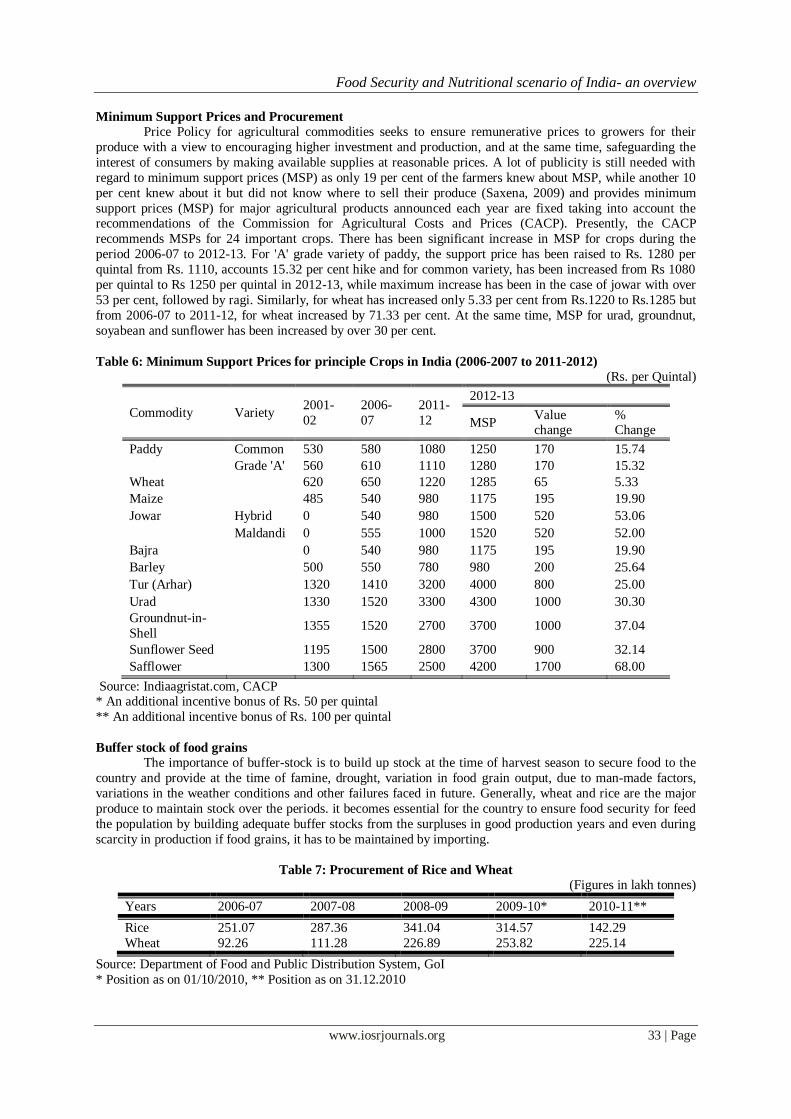
Minimum Support Prices and Procurement
Price Policy for agricultural commodities seeks to ensure remunerative prices to growers for their
produce with a view to encouraging higher investment and production, and at the same time, safeguarding the
interest of consumers by making available supplies at reasonable prices. A lot of publicity is still needed with
regard to minimum support prices (MSP) as only 19 per cent of the farmers knew about MSP, while another 10
per cent knew about it but did not know where to sell their produce (Saxena, 2009) and provides minimum
support prices (MSP) for major agricultural products announced each year are fixed taking into account the recommendations of the Commission for Agricultural Costs and Prices (CACP). Presently, the CACP
recommends MSPs for 24 important crops. There has been significant increase in MSP for crops during the
period 2006-07 to 2012-13. For 'A' grade variety of paddy, the support price has been raised to Rs. 1280 per
quintal from Rs. 1110, accounts 15.32 per cent hike and for common variety, has been increased from Rs 1080
per quintal to Rs 1250 per quintal in 2012-13, while maximum increase has been in the case of jowar with over
53 per cent, followed by ragi. Similarly, for wheat has increased only 5.33 per cent from Rs.1220 to Rs.1285 but
from 2006-07 to 2011-12, for wheat increased by 71.33 per cent. At the same time, MSP for urad, groundnut,
soyabean and sunflower has been increased by over 30 per cent.
Table 6: Minimum Support Prices for principle Crops in India (2006-2007 to 2011-2012)
(Rs. per Quintal)
Commodity Variety 2001-
02
2006-
07
2011-
12
2012-13
MSP Value change
% Change
Paddy Common 530 580 1080 1250 170 15.74
Grade 'A' 560 610 1110 1280 170 15.32
Wheat
620 650 1220 1285 65 5.33
Maize
485 540 980 1175 195 19.90
Jowar Hybrid 0 540 980 1500 520 53.06
Maldandi 0 555 1000 1520 520 52.00
Bajra
0 540 980 1175 195 19.90
Barley
500 550 780 980 200 25.64
Tur (Arhar)
1320 1410 3200 4000 800 25.00
Urad
1330 1520 3300 4300 1000 30.30
Groundnut-in-
Shell 1355 1520 2700 3700 1000 37.04
Sunflower Seed
1195 1500 2800 3700 900 32.14
Safflower
1300 1565 2500 4200 1700 68.00
Source: Indiaagristat.com, CACP * An additional incentive bonus of Rs. 50 per quintal
** An additional incentive bonus of Rs. 100 per quintal
Buffer stock of food grains
The importance of buffer-stock is to build up stock at the time of harvest season to secure food to the
country and provide at the time of famine, drought, variation in food grain output, due to man-made factors,
variations in the weather conditions and other failures faced in future. Generally, wheat and rice are the major
produce to maintain stock over the periods. it becomes essential for the country to ensure food security for feed
the population by building adequate buffer stocks from the surpluses in good production years and even during
scarcity in production if food grains, it has to be maintained by importing.
Table 7: Procurement of Rice and Wheat
(Figures in lakh tonnes)
Years 2006-07 2007-08 2008-09 2009-10* 2010-11**
Rice 251.07 287.36 341.04 314.57 142.29
Wheat 92.26 111.28 226.89 253.82 225.14
Source: Department of Food and Public Distribution System, GoI
* Position as on 01/10/2010, ** Position as on 31.12.2010
Food Security and Nutritional scenario of India- an overview
www.iosrjournals.org 34 | Page
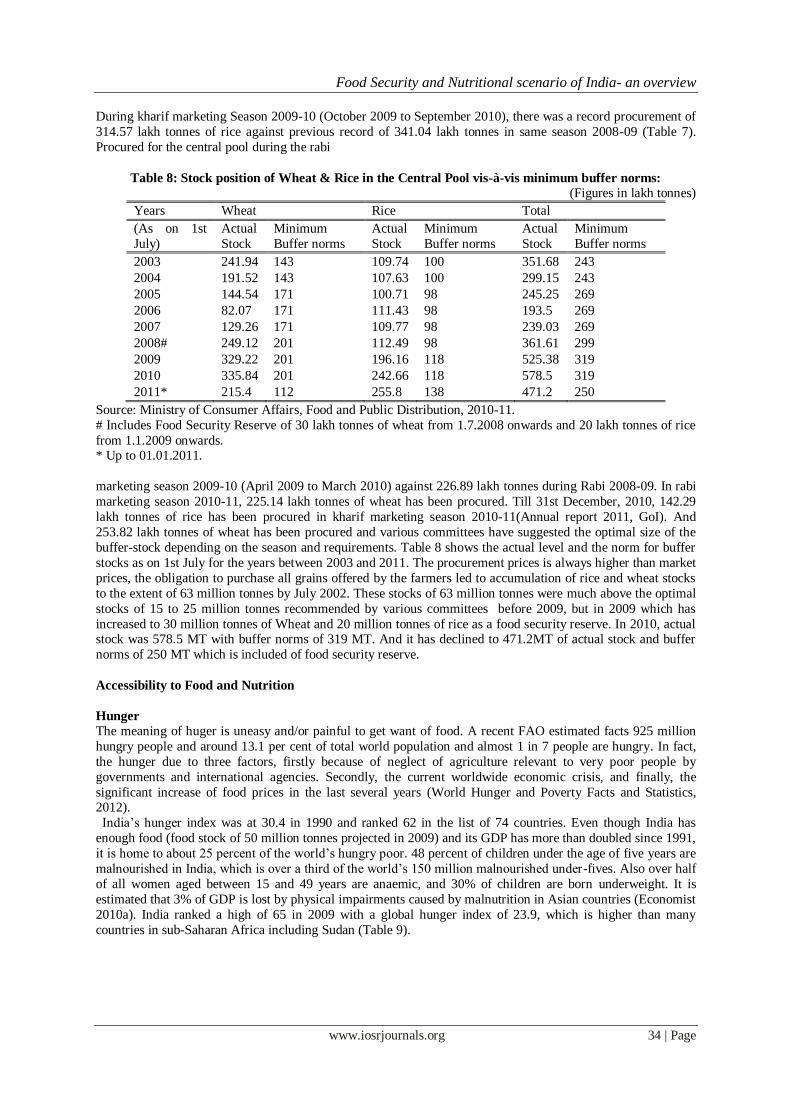
During kharif marketing Season 2009-10 (October 2009 to September 2010), there was a record procurement of
314.57 lakh tonnes of rice against previous record of 341.04 lakh tonnes in same season 2008-09 (Table 7).
Procured for the central pool during the rabi
Table 8: Stock position of Wheat & Rice in the Central Pool vis-à-vis minimum buffer norms:
(Figures in lakh tonnes)
Years Wheat Rice Total
(As on 1st
July)
Actual
Stock
Minimum
Buffer norms
Actual
Stock
Minimum
Buffer norms
Actual
Stock
Minimum
Buffer norms
2003 241.94 143 109.74 100 351.68 243
2004 191.52 143 107.63 100 299.15 243
2005 144.54 171 100.71 98 245.25 269
2006 82.07 171 111.43 98 193.5 269
2007 129.26 171 109.77 98 239.03 269
2008# 249.12 201 112.49 98 361.61 299
2009 329.22 201 196.16 118 525.38 319
2010 335.84 201 242.66 118 578.5 319
2011* 215.4 112 255.8 138 471.2 250
Source: Ministry of Consumer Affairs, Food and Public Distribution, 2010-11.
# Includes Food Security Reserve of 30 lakh tonnes of wheat from 1.7.2008 onwards and 20 lakh tonnes of rice
from 1.1.2009 onwards. * Up to 01.01.2011.
marketing season 2009-10 (April 2009 to March 2010) against 226.89 lakh tonnes during Rabi 2008-09. In rabi
marketing season 2010-11, 225.14 lakh tonnes of wheat has been procured. Till 31st December, 2010, 142.29
lakh tonnes of rice has been procured in kharif marketing season 2010-11(Annual report 2011, GoI). And
253.82 lakh tonnes of wheat has been procured and various committees have suggested the optimal size of the
buffer-stock depending on the season and requirements. Table 8 shows the actual level and the norm for buffer
stocks as on 1st July for the years between 2003 and 2011. The procurement prices is always higher than market
prices, the obligation to purchase all grains offered by the farmers led to accumulation of rice and wheat stocks
to the extent of 63 million tonnes by July 2002. These stocks of 63 million tonnes were much above the optimal
stocks of 15 to 25 million tonnes recommended by various committees before 2009, but in 2009 which has
increased to 30 million tonnes of Wheat and 20 million tonnes of rice as a food security reserve. In 2010, actual stock was 578.5 MT with buffer norms of 319 MT. And it has declined to 471.2MT of actual stock and buffer
norms of 250 MT which is included of food security reserve.
Accessibility to Food and Nutrition
Hunger
The meaning of huger is uneasy and/or painful to get want of food. A recent FAO estimated facts 925 million
hungry people and around 13.1 per cent of total world population and almost 1 in 7 people are hungry. In fact,
the hunger due to three factors, firstly because of neglect of agriculture relevant to very poor people by
governments and international agencies. Secondly, the current worldwide economic crisis, and finally, the
significant increase of food prices in the last several years (World Hunger and Poverty Facts and Statistics, 2012).
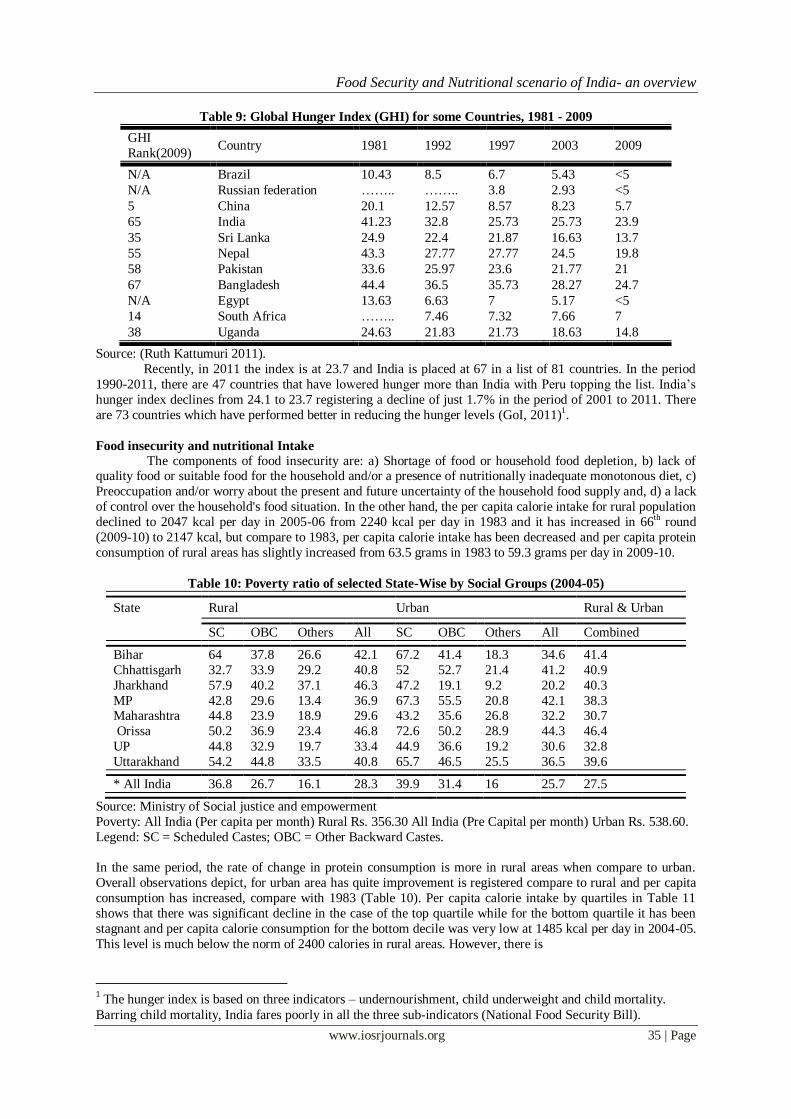
India’s hunger index was at 30.4 in 1990 and ranked 62 in the list of 74 countries. Even though India has
enough food (food stock of 50 million tonnes projected in 2009) and its GDP has more than doubled since 1991,
it is home to about 25 percent of the world’s hungry poor. 48 percent of children under the age of five years are
malnourished in India, which is over a third of the world’s 150 million malnourished under-fives. Also over half
of all women aged between 15 and 49 years are anaemic, and 30% of children are born underweight. It is
estimated that 3% of GDP is lost by physical impairments caused by malnutrition in Asian countries (Economist
2010a). India ranked a high of 65 in 2009 with a global hunger index of 23.9, which is higher than many
countries in sub-Saharan Africa including Sudan (Table 9).
Food Security and Nutritional scenario of India- an overview
www.iosrjournals.org 35 | Page
Table 9: Global Hunger Index (GHI) for some Countries, 1981 - 2009
GHI
Rank(2009) Country 1981 1992 1997 2003 2009
N/A Brazil 10.43 8.5 6.7 5.43 <5
N/A Russian federation …….. …….. 3.8 2.93 <5
5 China 20.1 12.57 8.57 8.23 5.7
65 India 41.23 32.8 25.73 25.73 23.9
35 Sri Lanka 24.9 22.4 21.87 16.63 13.7
55 Nepal 43.3 27.77 27.77 24.5 19.8
58 Pakistan 33.6 25.97 23.6 21.77 21
67 Bangladesh 44.4 36.5 35.73 28.27 24.7
N/A Egypt 13.63 6.63 7 5.17 <5
14 South Africa …….. 7.46 7.32 7.66 7
38 Uganda 24.63 21.83 21.73 18.63 14.8
Source: (Ruth Kattumuri 2011).
Recently, in 2011 the index is at 23.7 and India is placed at 67 in a list of 81 countries. In the period
1990-2011, there are 47 countries that have lowered hunger more than India with Peru topping the list. India’s
hunger index declines from 24.1 to 23.7 registering a decline of just 1.7% in the period of 2001 to 2011. There
are 73 countries which have performed better in reducing the hunger levels (GoI, 2011)1.
Food insecurity and nutritional Intake
The components of food insecurity are: a) Shortage of food or household food depletion, b) lack of quality food or suitable food for the household and/or a presence of nutritionally inadequate monotonous diet, c)
Preoccupation and/or worry about the present and future uncertainty of the household food supply and, d) a lack
of control over the household's food situation. In the other hand, the per capita calorie intake for rural population
declined to 2047 kcal per day in 2005-06 from 2240 kcal per day in 1983 and it has increased in 66th round
(2009-10) to 2147 kcal, but compare to 1983, per capita calorie intake has been decreased and per capita protein
consumption of rural areas has slightly increased from 63.5 grams in 1983 to 59.3 grams per day in 2009-10.
Table 10: Poverty ratio of selected State-Wise by Social Groups (2004-05)
State Rural Urban Rural & Urban
SC OBC Others All SC OBC Others All Combined
Bihar 64 37.8 26.6 42.1 67.2 41.4 18.3 34.6 41.4
Chhattisgarh 32.7 33.9 29.2 40.8 52 52.7 21.4 41.2 40.9
Jharkhand 57.9 40.2 37.1 46.3 47.2 19.1 9.2 20.2 40.3
MP 42.8 29.6 13.4 36.9 67.3 55.5 20.8 42.1 38.3 Maharashtra 44.8 23.9 18.9 29.6 43.2 35.6 26.8 32.2 30.7
Orissa 50.2 36.9 23.4 46.8 72.6 50.2 28.9 44.3 46.4
UP 44.8 32.9 19.7 33.4 44.9 36.6 19.2 30.6 32.8
Uttarakhand 54.2 44.8 33.5 40.8 65.7 46.5 25.5 36.5 39.6
* All India 36.8 26.7 16.1 28.3 39.9 31.4 16 25.7 27.5
Source: Ministry of Social justice and empowerment
Poverty: All India (Per capita per month) Rural Rs. 356.30 All India (Pre Capital per month) Urban Rs. 538.60.
Legend: SC = Scheduled Castes; OBC = Other Backward Castes.
In the same period, the rate of change in protein consumption is more in rural areas when compare to urban.
Overall observations depict, for urban area has quite improvement is registered compare to rural and per capita
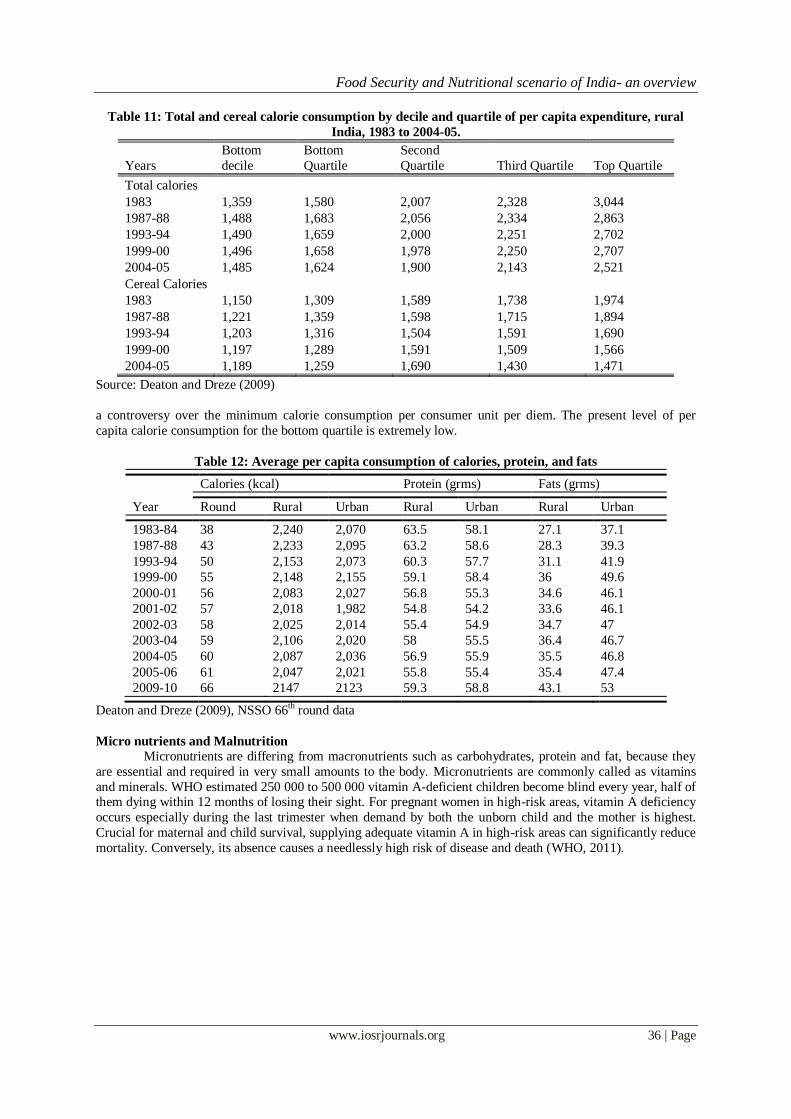
consumption has increased, compare with 1983 (Table 10). Per capita calorie intake by quartiles in Table 11
shows that there was significant decline in the case of the top quartile while for the bottom quartile it has been
stagnant and per capita calorie consumption for the bottom decile was very low at 1485 kcal per day in 2004-05.
This level is much below the norm of 2400 calories in rural areas. However, there is
1 The hunger index is based on three indicators – undernourishment, child underweight and child mortality.
Barring child mortality, India fares poorly in all the three sub-indicators (National Food Security Bill).
Food Security and Nutritional scenario of India- an overview
www.iosrjournals.org 36 | Page
Table 11: Total and cereal calorie consumption by decile and quartile of per capita expenditure, rural
India, 1983 to 2004-05.
Years
Bottom
decile
Bottom
Quartile
Second
Quartile Third Quartile Top Quartile
Total calories
1983 1,359 1,580 2,007 2,328 3,044
1987-88 1,488 1,683 2,056 2,334 2,863
1993-94 1,490 1,659 2,000 2,251 2,702
1999-00 1,496 1,658 1,978 2,250 2,707
2004-05 1,485 1,624 1,900 2,143 2,521
Cereal Calories
1983 1,150 1,309 1,589 1,738 1,974
1987-88 1,221 1,359 1,598 1,715 1,894
1993-94 1,203 1,316 1,504 1,591 1,690
1999-00 1,197 1,289 1,591 1,509 1,566
2004-05 1,189 1,259 1,690 1,430 1,471
Source: Deaton and Dreze (2009)
a controversy over the minimum calorie consumption per consumer unit per diem. The present level of per
capita calorie consumption for the bottom quartile is extremely low.
Table 12: Average per capita consumption of calories, protein, and fats
Calories (kcal)
Protein (grms) Fats (grms)
Year Round Rural Urban Rural Urban Rural Urban
1983-84 38 2,240 2,070 63.5 58.1 27.1 37.1
1987-88 43 2,233 2,095 63.2 58.6 28.3 39.3
1993-94 50 2,153 2,073 60.3 57.7 31.1 41.9
1999-00 55 2,148 2,155 59.1 58.4 36 49.6
2000-01 56 2,083 2,027 56.8 55.3 34.6 46.1
2001-02 57 2,018 1,982 54.8 54.2 33.6 46.1
2002-03 58 2,025 2,014 55.4 54.9 34.7 47
2003-04 59 2,106 2,020 58 55.5 36.4 46.7
2004-05 60 2,087 2,036 56.9 55.9 35.5 46.8
2005-06 61 2,047 2,021 55.8 55.4 35.4 47.4
2009-10 66 2147 2123 59.3 58.8 43.1 53
Deaton and Dreze (2009), NSSO 66th round data
Micro nutrients and Malnutrition
Micronutrients are differing from macronutrients such as carbohydrates, protein and fat, because they
are essential and required in very small amounts to the body. Micronutrients are commonly called as vitamins
and minerals. WHO estimated 250 000 to 500 000 vitamin A-deficient children become blind every year, half of them dying within 12 months of losing their sight. For pregnant women in high-risk areas, vitamin A deficiency
occurs especially during the last trimester when demand by both the unborn child and the mother is highest.
Crucial for maternal and child survival, supplying adequate vitamin A in high-risk areas can significantly reduce
mortality. Conversely, its absence causes a needlessly high risk of disease and death (WHO, 2011).
Food Security and Nutritional scenario of India- an overview
www.iosrjournals.org 37 | Page
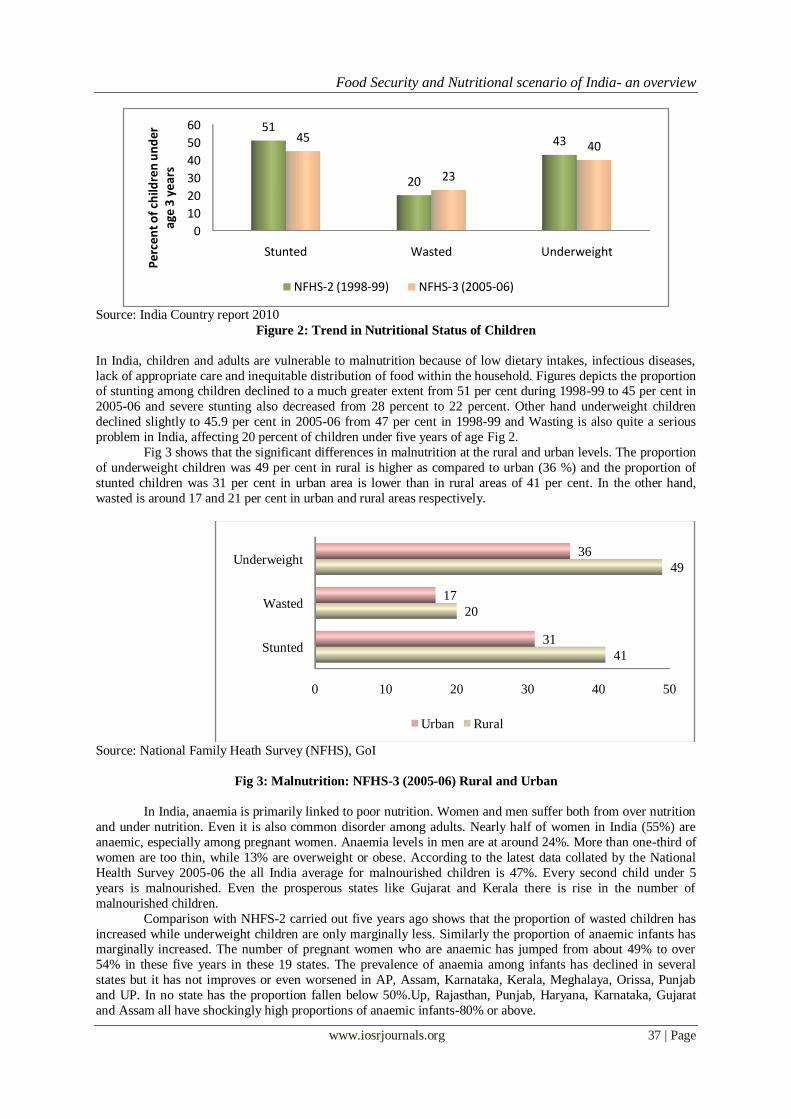
Source: India Country report 2010
Figure 2: Trend in Nutritional Status of Children
In India, children and adults are vulnerable to malnutrition because of low dietary intakes, infectious diseases,
lack of appropriate care and inequitable distribution of food within the household. Figures depicts the proportion of stunting among children declined to a much greater extent from 51 per cent during 1998-99 to 45 per cent in
2005-06 and severe stunting also decreased from 28 percent to 22 percent. Other hand underweight children
declined slightly to 45.9 per cent in 2005-06 from 47 per cent in 1998-99 and Wasting is also quite a serious
problem in India, affecting 20 percent of children under five years of age Fig 2.
Fig 3 shows that the significant differences in malnutrition at the rural and urban levels. The proportion
of underweight children was 49 per cent in rural is higher as compared to urban (36 %) and the proportion of
stunted children was 31 per cent in urban area is lower than in rural areas of 41 per cent. In the other hand,
wasted is around 17 and 21 per cent in urban and rural areas respectively.
Source: National Family Heath Survey (NFHS), GoI
Fig 3: Malnutrition: NFHS-3 (2005-06) Rural and Urban
In India, anaemia is primarily linked to poor nutrition. Women and men suffer both from over nutrition
and under nutrition. Even it is also common disorder among adults. Nearly half of women in India (55%) are
anaemic, especially among pregnant women. Anaemia levels in men are at around 24%. More than one-third of
women are too thin, while 13% are overweight or obese. According to the latest data collated by the National
Health Survey 2005-06 the all India average for malnourished children is 47%. Every second child under 5
years is malnourished. Even the prosperous states like Gujarat and Kerala there is rise in the number of
malnourished children.
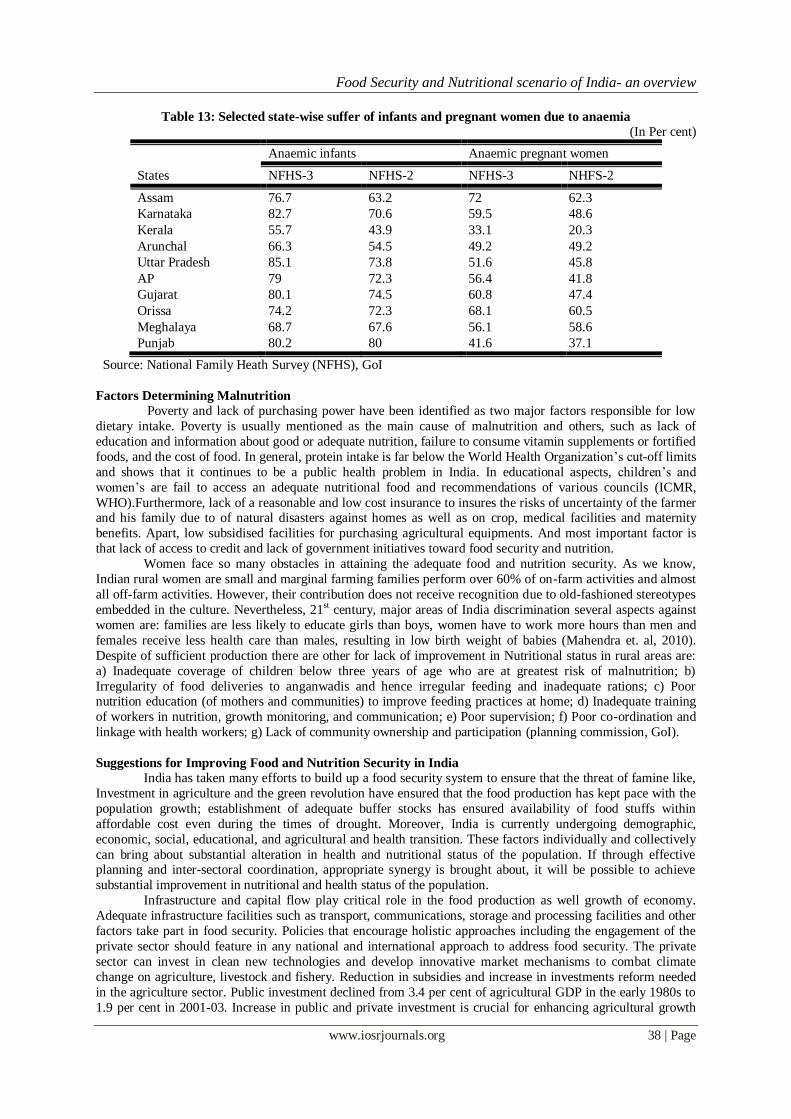
Comparison with NHFS-2 carried out five years ago shows that the proportion of wasted children has
increased while underweight children are only marginally less. Similarly the proportion of anaemic infants has marginally increased. The number of pregnant women who are anaemic has jumped from about 49% to over
54% in these five years in these 19 states. The prevalence of anaemia among infants has declined in several
states but it has not improves or even worsened in AP, Assam, Karnataka, Kerala, Meghalaya, Orissa, Punjab
and UP. In no state has the proportion fallen below 50%.Up, Rajasthan, Punjab, Haryana, Karnataka, Gujarat
and Assam all have shockingly high proportions of anaemic infants-80% or above.
0
10
20
30
40
50
60
Stunted Wasted Underweight
51
20
4345
23
40P
erc
en
t o
f ch
ildre
n u
nd
er
age
3 y
ear
s
NFHS-2 (1998-99) NFHS-3 (2005-06)
0 10 20 30 40 50
Stunted
Wasted
Underweight
41
20
49
31
17
36
Urban Rural
Food Security and Nutritional scenario of India- an overview
www.iosrjournals.org 38 | Page
Table 13: Selected state-wise suffer of infants and pregnant women due to anaemia
(In Per cent)
Anaemic infants Anaemic pregnant women
States NFHS-3 NFHS-2 NFHS-3 NHFS-2
Assam 76.7 63.2 72 62.3
Karnataka 82.7 70.6 59.5 48.6
Kerala 55.7 43.9 33.1 20.3
Arunchal 66.3 54.5 49.2 49.2
Uttar Pradesh 85.1 73.8 51.6 45.8
AP 79 72.3 56.4 41.8
Gujarat 80.1 74.5 60.8 47.4
Orissa 74.2 72.3 68.1 60.5
Meghalaya 68.7 67.6 56.1 58.6
Punjab 80.2 80 41.6 37.1
Source: National Family Heath Survey (NFHS), GoI
Factors Determining Malnutrition
Poverty and lack of purchasing power have been identified as two major factors responsible for low
dietary intake. Poverty is usually mentioned as the main cause of malnutrition and others, such as lack of
education and information about good or adequate nutrition, failure to consume vitamin supplements or fortified
foods, and the cost of food. In general, protein intake is far below the World Health Organization’s cut-off limits
and shows that it continues to be a public health problem in India. In educational aspects, children’s and
women’s are fail to access an adequate nutritional food and recommendations of various councils (ICMR,
WHO).Furthermore, lack of a reasonable and low cost insurance to insures the risks of uncertainty of the farmer and his family due to of natural disasters against homes as well as on crop, medical facilities and maternity
benefits. Apart, low subsidised facilities for purchasing agricultural equipments. And most important factor is
that lack of access to credit and lack of government initiatives toward food security and nutrition.
Women face so many obstacles in attaining the adequate food and nutrition security. As we know,
Indian rural women are small and marginal farming families perform over 60% of on-farm activities and almost
all off-farm activities. However, their contribution does not receive recognition due to old-fashioned stereotypes
embedded in the culture. Nevertheless, 21st century, major areas of India discrimination several aspects against
women are: families are less likely to educate girls than boys, women have to work more hours than men and
females receive less health care than males, resulting in low birth weight of babies (Mahendra et. al, 2010).
Despite of sufficient production there are other for lack of improvement in Nutritional status in rural areas are:
a) Inadequate coverage of children below three years of age who are at greatest risk of malnutrition; b)
Irregularity of food deliveries to anganwadis and hence irregular feeding and inadequate rations; c) Poor nutrition education (of mothers and communities) to improve feeding practices at home; d) Inadequate training
of workers in nutrition, growth monitoring, and communication; e) Poor supervision; f) Poor co-ordination and
linkage with health workers; g) Lack of community ownership and participation (planning commission, GoI).
Suggestions for Improving Food and Nutrition Security in India
India has taken many efforts to build up a food security system to ensure that the threat of famine like,
Investment in agriculture and the green revolution have ensured that the food production has kept pace with the
population growth; establishment of adequate buffer stocks has ensured availability of food stuffs within
affordable cost even during the times of drought. Moreover, India is currently undergoing demographic,
economic, social, educational, and agricultural and health transition. These factors individually and collectively
can bring about substantial alteration in health and nutritional status of the population. If through effective planning and inter-sectoral coordination, appropriate synergy is brought about, it will be possible to achieve
substantial improvement in nutritional and health status of the population.
Infrastructure and capital flow play critical role in the food production as well growth of economy.
Adequate infrastructure facilities such as transport, communications, storage and processing facilities and other
factors take part in food security. Policies that encourage holistic approaches including the engagement of the
private sector should feature in any national and international approach to address food security. The private
sector can invest in clean new technologies and develop innovative market mechanisms to combat climate
change on agriculture, livestock and fishery. Reduction in subsidies and increase in investments reform needed
in the agriculture sector. Public investment declined from 3.4 per cent of agricultural GDP in the early 1980s to
1.9 per cent in 2001-03. Increase in public and private investment is crucial for enhancing agricultural growth
Food Security and Nutritional scenario of India- an overview
www.iosrjournals.org 39 | Page
and public investment in rural infrastructure, like roads, irrigation, etc is more important than other factors and
its investment has increased significantly during this period.
In addition to above, require more focus on productivity attributed factors like soil quality and water
management including ground water, and land management should be given the first priority such as investment
in irrigation, watershed development, and water conservation practices. All these features take part in the
efficient food production and security as well. Furthermore, build up bridge between researchers and farmers on
the existing technology and also on extension, because these are crucial for dissemination of information and technology improving agricultural productivity and credit supply to agriculture is increases significantly from
last couple of years. But small and marginal farmers still depends on money lenders at village level because of
poor and inequality institutional credit to these farming sectors and therefore, essential polices require to modify
the existed rules. Other adaptation to change in land use and timing of farming operations, improved crop and
livestock management practices including improved input use efficiencies, crop systems diversification,
forecasting tools and early warning systems and improve water management. In addition, fragmentation and
diversification of land into non-agricultural purposes and non-food crops may also leads to insecurity of food.
Need to develop varieties which are resistant to climate change. In other hand, producers share in consumer
rupee is very less even consumer pay more price to produce. It’s necessary of price stabilization for agricultural
produce to safeguard the farmer’s interest.
References [1]. Angus Deaton and Jean Drèze. 2009. Food and Nutrition in india: Facts and interpretations. February14, 2009. vol xliv No.7EPW
Ecoomic & Political Weekly.
[2]. APFS. 2012. Asia Pacific Food Situation Update. Jan 2012.
[3]. Dev, S.Mahendra. 2003. Right to Food in India. Working Paper no. 50, Centre For Economic and Social Studies, Hyderabad.
[4]. FAO. 2012. FAO statistical Year Book 2012.
[5]. GoI. 2012. Annual report 2011.
[6]. GoI. 2012. Economic Survey 2011-12.
[7]. GoI 2011. Ministry of Consumer Affairs, Food and Public Distribution.
[8]. GoI. 2011. Economic Survey 2010-11.
[9]. GoI. 2011. Ministry of Finance, New Delhi, India
[10]. GoI. 2008. 11th Five Year Plan, Planning Commission, Government of India.
[11]. GoI. 2012. Department of Food and Public Distribution System, Govt. of India.
[12]. GoI. 2009. India Country report 2010.
[13]. Ruth Kattumuri. 2011. ASIA RESEARCH CENTRE WORKING PAPER 38.
[14]. S. Mahendra Dev and Alakh N. Sharma. 2010. Food Security in India: Performance, Challenges and Policies, Oxfam India
working papers series, September 2010. OIWPS – VII.
[15]. Saxena, N.C. 2008. Hunger, Undernutrition and Food Security in India. New Delhi.
[16]. Sen, Amartya and S. Sengupta. 1983. Malnutrition of Rural Indian Children and the Sex Bias. Economic and Political Weekly, Vol.
19, No.24.
[17]. WHO. 2012. World Hunger report 2012.
[18]. Zeller, M., and M. Sharma. 1998. Rural Finance and Poverty Alleviation. Food Policy Report, IFPRI, Washington D.C.
[19]. http://www.worldhunger.org
[20]. (http://the-diplomat.com).
[21]. http://dbie.rbi.org.in
[22]. http://agricoop.nic.in/
[23]. http://www.indiastat.com
[24]. http://www.fao.org