Embed Size (px)
Citation preview
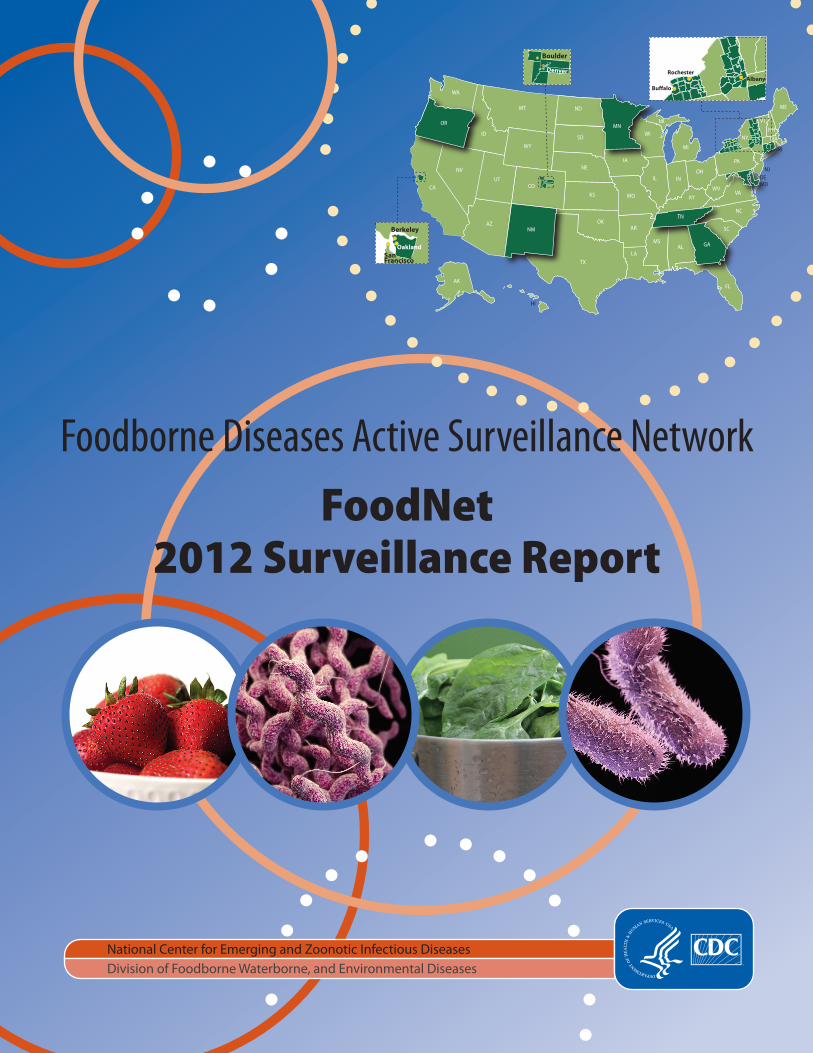
National Center for Emerging and Zoonotic Infectious DiseasesDivision of Foodborne Waterborne, and Environmental Diseases
Foodborne Diseases Active Surveillance NetworkFoodNet
2012 Surveillance Report
WA
OR
CA
NV
AK
AZNM
TX
OK
KS
NE
SD
NDMT
ID
WY
COUT
HI
LA
AR
MO
IA
WI
MI
MI
IL INOH
KY
TN
MSAL
SC
NC
VA
PA
NY
ME
WVMD
NJDE
CT RI
MA
NH
VT
FL
GA
MN
San Francisco
Berkeley
Oakland
Denver
Boulder
Rochester
Buffalo
Albany
2
We would like to thank all of our site and federal partners for their participation in the FoodNet program. • California Emerging Infections Program
• Colorado Department of Public Health and Environment
• Connecticut Emerging Infections Program
• Georgia Department of Public Health and Emerging Infections Program
• Maryland Department of Health and Mental Hygiene
• Minnesota Department of Health
• New Mexico Emerging Infections Program
• New York State Department of Health
• Oregon Public Health Division
• Tennessee Department of Health
• U.S. Department of Agriculture Food Safety and Inspection Service
• U.S. Food and Drug Administration
• Centers for Disease Control’s Emerging Infections Program
• Centers for Disease Control’s Division of Foodborne, Waterborne, and Environmental Diseases
The following persons from CDC contributed substantially to compiling this report:• Stacy Crim
• Olga Henao
• Jennifer Huang
• Ruthie Luna-Gierke
• Rajal Mody
• Mary Patrick
• Preethi Sundararaman
Suggested Citation:CDC. Foodborne Diseases Active Surveillance Network (FoodNet): FoodNet Surveillance Report for 2012 (Final Report). Atlanta, Georgia: U.S. Department of Health and Human Services, CDC. 2014.
3
Table of Contents PageAcknowledgements ....................................................................................................................................2Citation .......................................................................................................................................................2Table of contents ..................................................................................................................................... 3-4Background ................................................................................................................................................5Methods ......................................................................................................................................................5Analysis .......................................................................................................................................................6Results ..................................................................................................................................................... 6-7Limitations .................................................................................................................................................7Publications and Abstracts in 2012 ..................................................................................................... 8-10Tables and Figures .............................................................................................................................. 11-36
Demographics and Census ................................................................................................................11-13Table.1. FoodNet Surveillance Area, by State and County — 1996-2012 ............................ 11Table.2. Comparison of FoodNet Surveillance Population to U.S. Population,
Overall and by Site — 2012 .......................................................................................... 12Figure.1. Foodborne Diseases Active Surveillance Network (FoodNet) Sites, 2012 ............ 13
Counts and Incidence ........................................................................................................................14-20Table.3. Number of Laboratory-Confirmed Bacterial and Parasitic Infections,
by Site and Pathogen — FoodNet, 2012 ..................................................................... 14Table.4. Incidence of Cases of Bacterial and Parasitic Infection Compared
with National Health Objectives, by Site and Pathogen — FoodNet, 2012 ........... 14Table.5-5a. Number and Incidence of FoodNet Pathogens, by Age, Sex, Race, and
Ethnicity — 2012 ......................................................................................................15-16Table.6. Number of Laboratory-Confirmed Campylobacter Infections, by Species—
FoodNet, 2012................................................................................................................ 17 Table.7. Number and Incidence of Laboratory-Confirmed Salmonella Infections
Caused by the Top 20 Salmonella Serotypes, FoodNet 2012 ................................... 17Table.8. Number and Incidence of Laboratory-Confirmed STEC non-O157 Infections
Caused by the Top Ten O Antigens—FoodNet, 2012............................................... 18Table.9. Number and Incidence of Laboratory-Confirmed Shigella Infections,
by Species — FoodNet, 2012 ........................................................................................ 18Table.10. Number and Incidence of Laboratory-Confirmed Vibrio
Infections, by Species — FoodNet, 2012 .................................................................... 18Figure.2. Incidence of Campylobacter, Salmonella, and Shigella Infections,
by Age Group — FoodNet, 2012 ................................................................................. 19Figure.3. Incidence of Cryptosporidium, Listeria, and Yersinia Infections,
by Age Group — FoodNet, 2012 ................................................................................. 19 Figure.4. Incidence of STEC O157 and STEC Non-O157 Infections,
by Age Group — FoodNet, 2012 ................................................................................. 20
4
Hospitalization ...................................................................................................................................20-24Table.11. Number and Percentage of Cases Hospitalized,
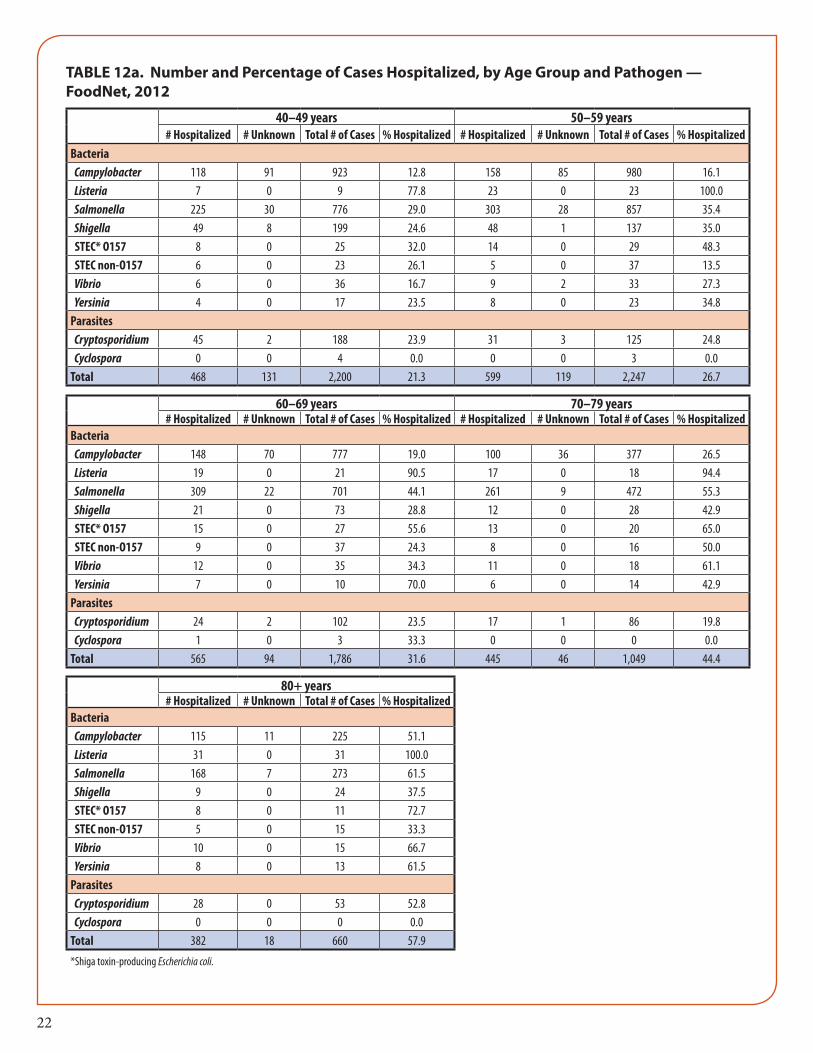
by Pathogen — FoodNet, 2012 .................................................................................... 20Table.12-12a. Number and Percentage of Cases Hospitalized, by Age Group and
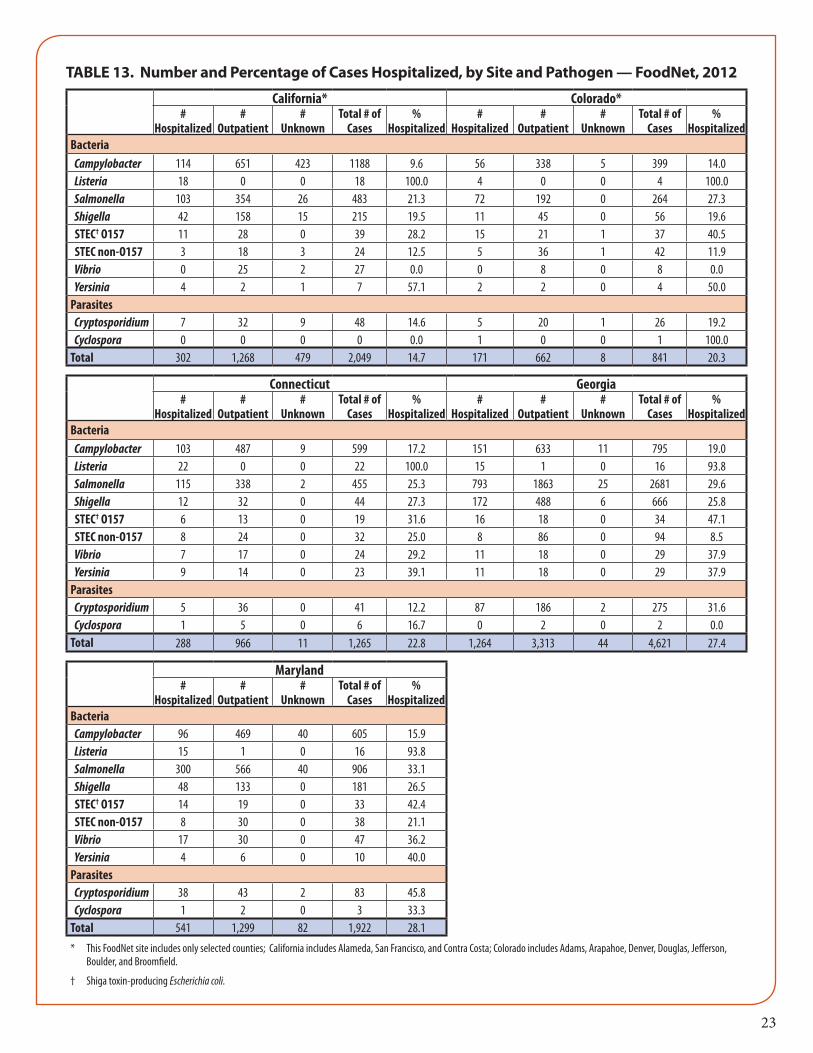
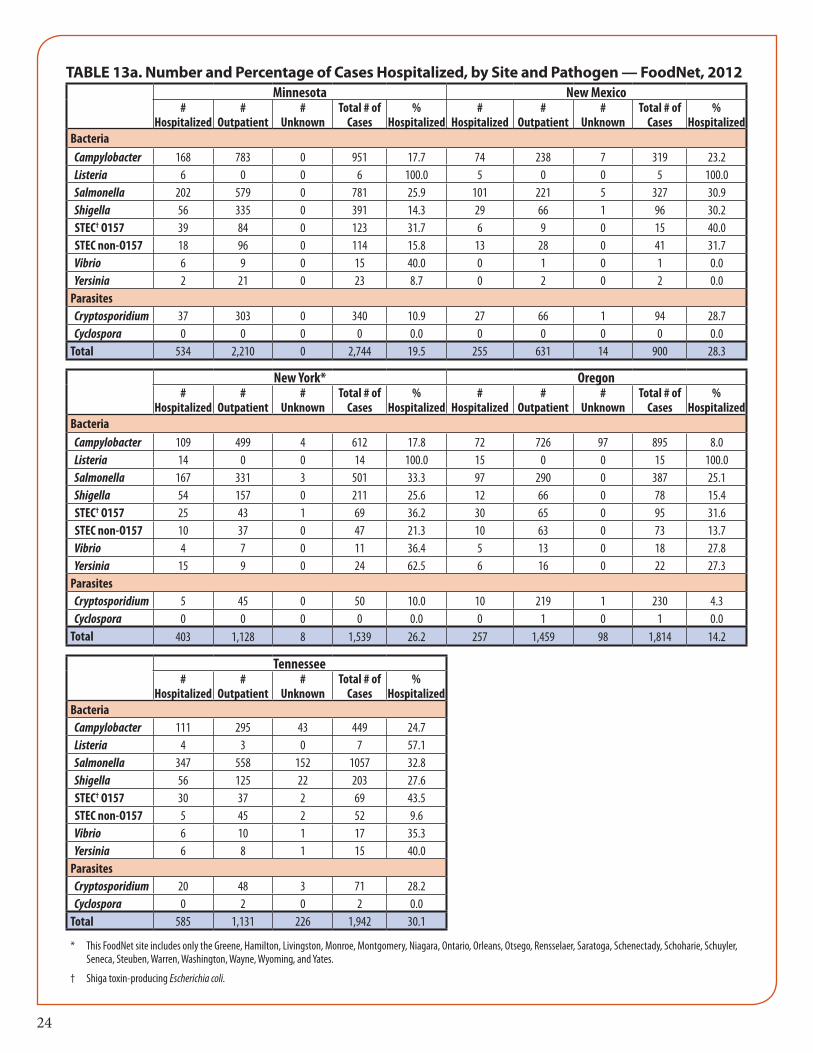
Pathogen — FoodNet, 2012 ....................................................................................21-22Table.13-13a. Number and Percentage of Cases Hospitalized, by Site and Pathogen —
FoodNet, 2012...........................................................................................................23-24Death ...................................................................................................................................................25-29
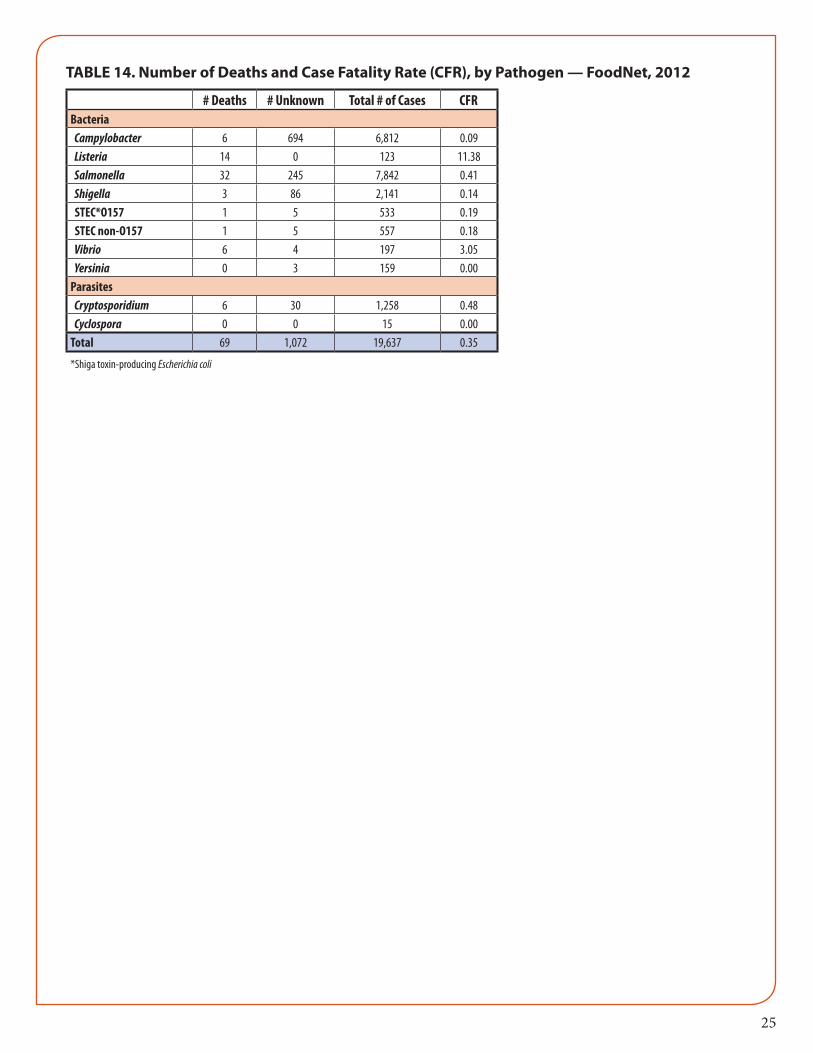
Table.14. Number of Deaths and Case Fatality Rate (CFR), by Pathogen — FoodNet, 2012 .................................................................................... 25
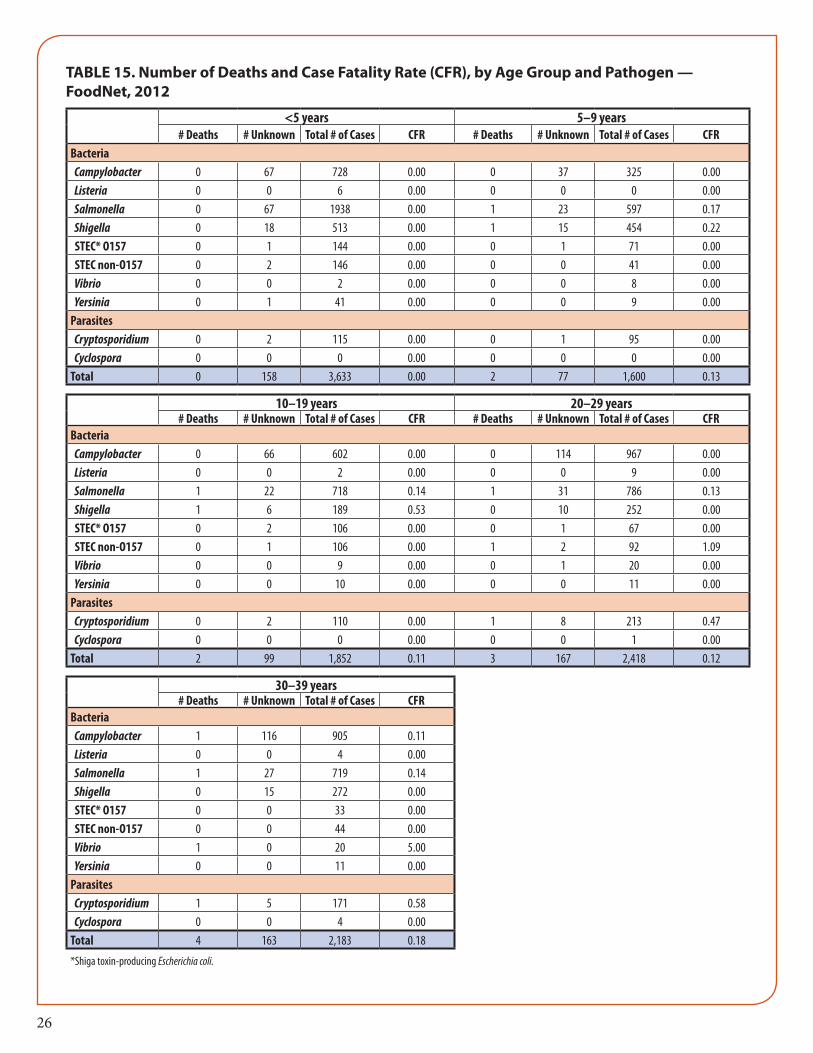
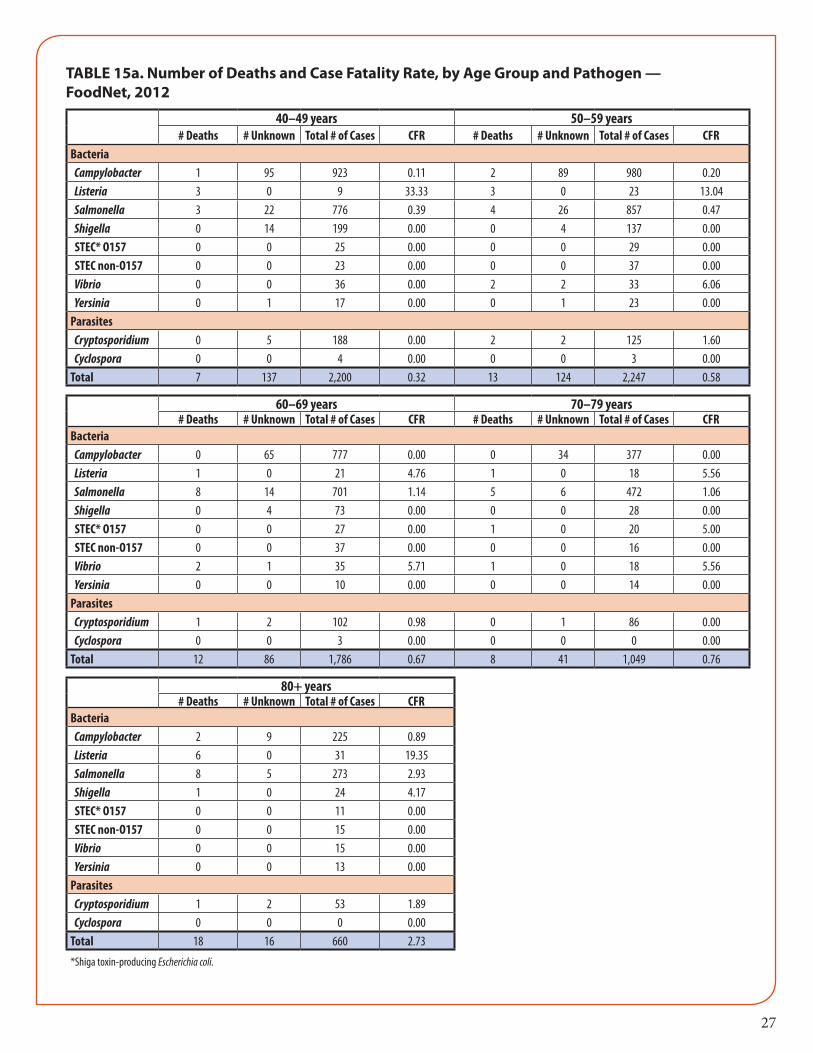
Table.15-15a. Number of Deaths and Case Fatality Rate (CFR), by Age Group and Pathogen - FoodNet, 2012......................................................26-27
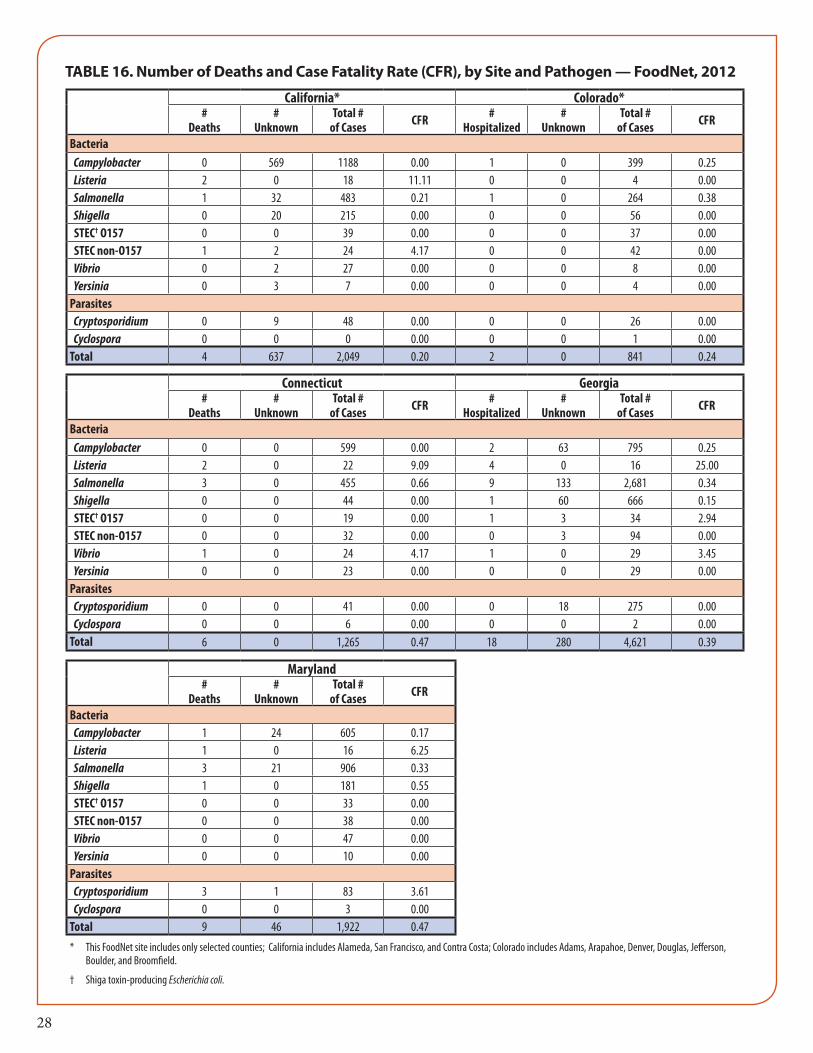
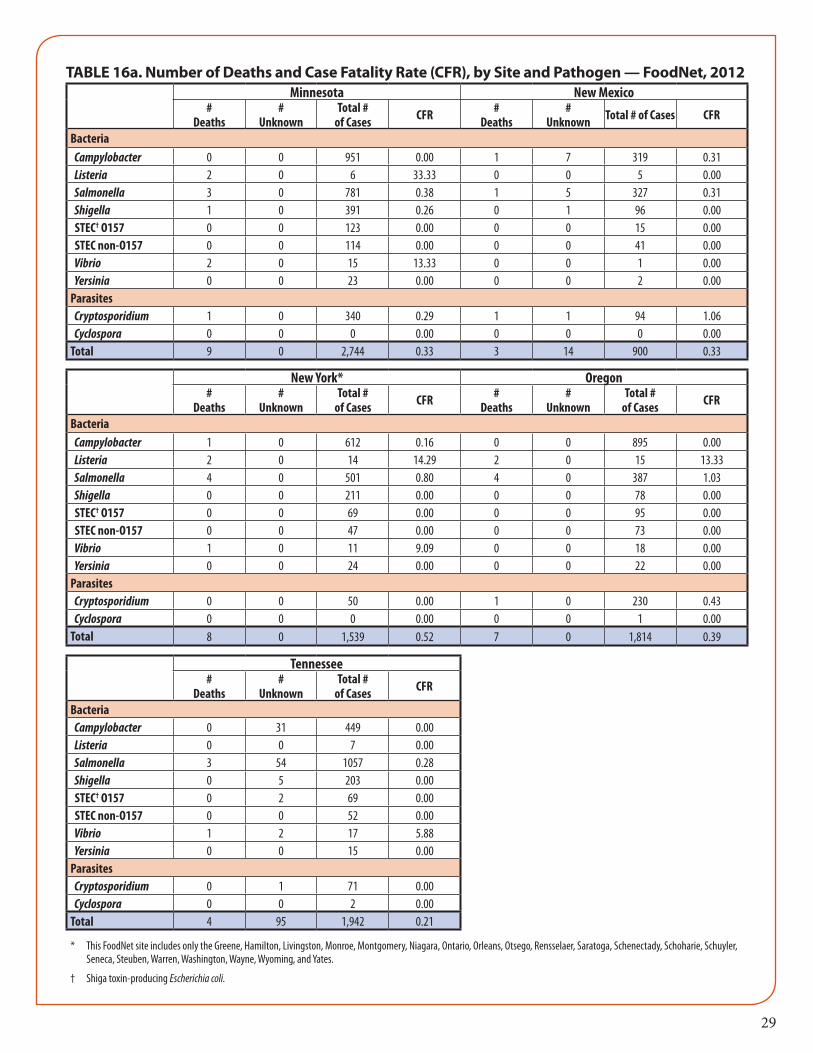
Table.16-16a. Number of Deaths and Case Fatality Rate (CFR), by Site and Pathogen - FoodNet, 2012 ..................................................................28-29
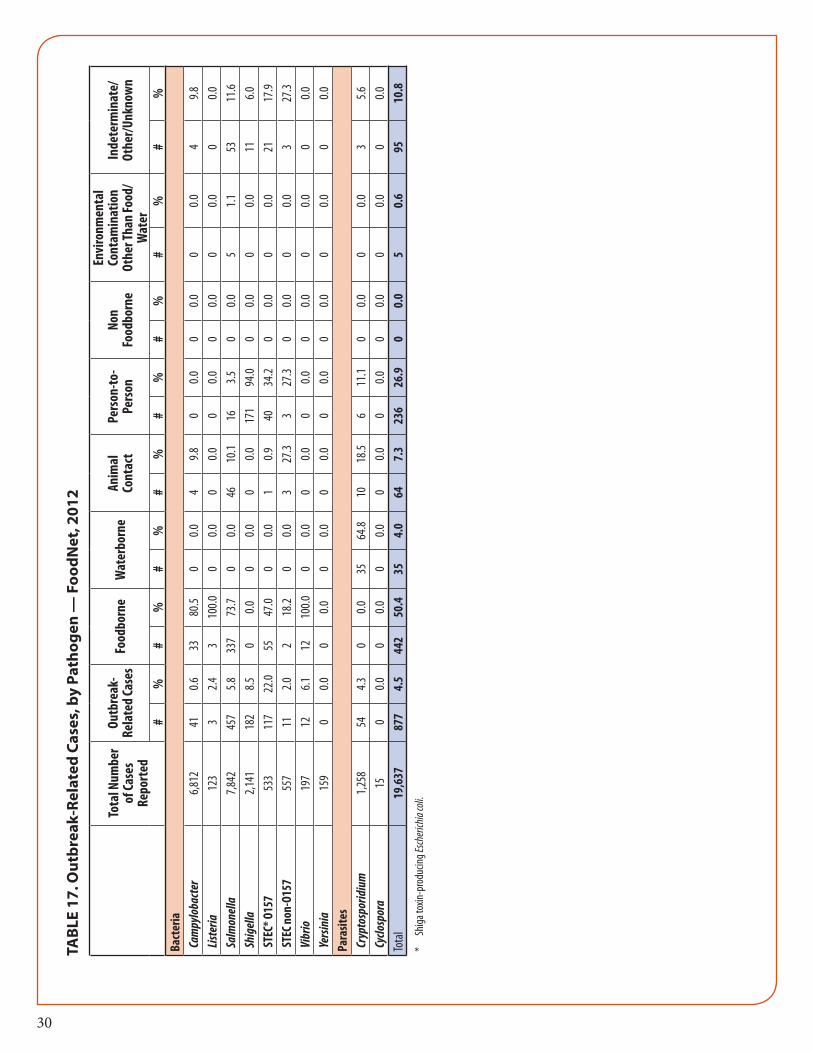
Outbreak-related cases ............................................................................................................................30Table.17. Outbreak-Related Cases, by Pathogen — FoodNet, 2012 ........................................ 30
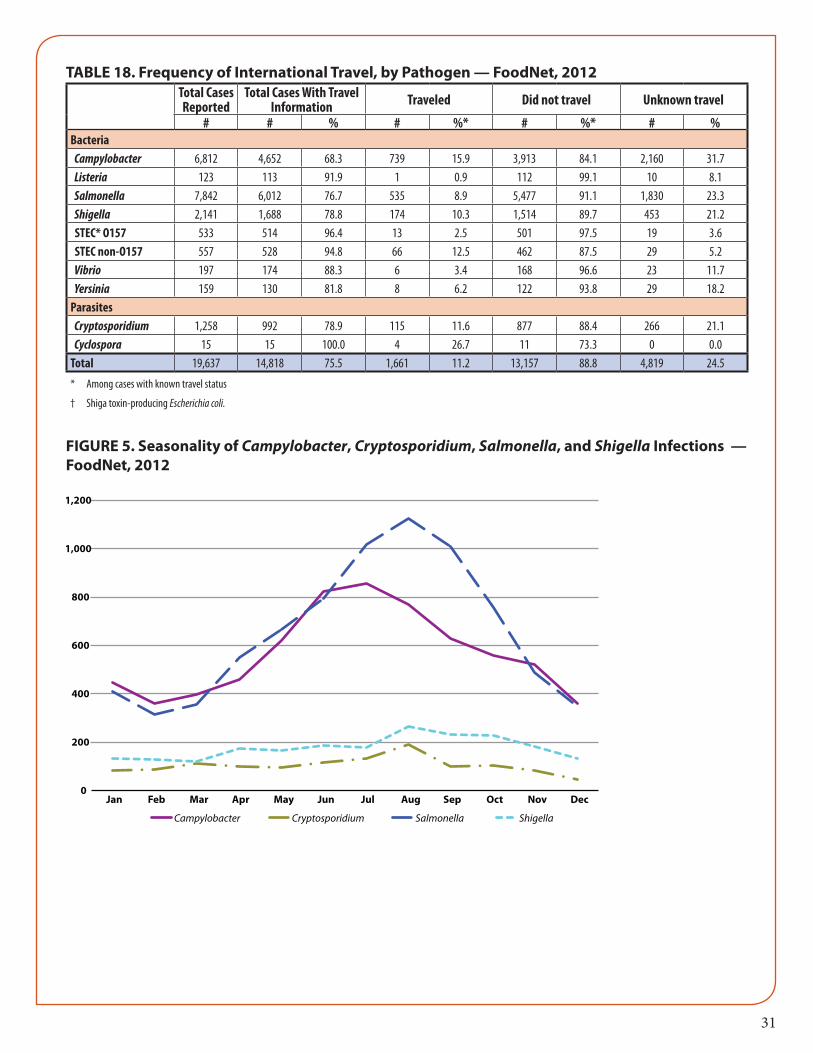
International Travel .................................................................................................................................31Table.18. Frequency of International Travel, by Pathogen — FoodNet, 2012 ....................... 31
Seasonality ..........................................................................................................................................31-32Figure.5. Seasonality of Campylobacter, Cryptosporidium, Salmonella, and Shigella
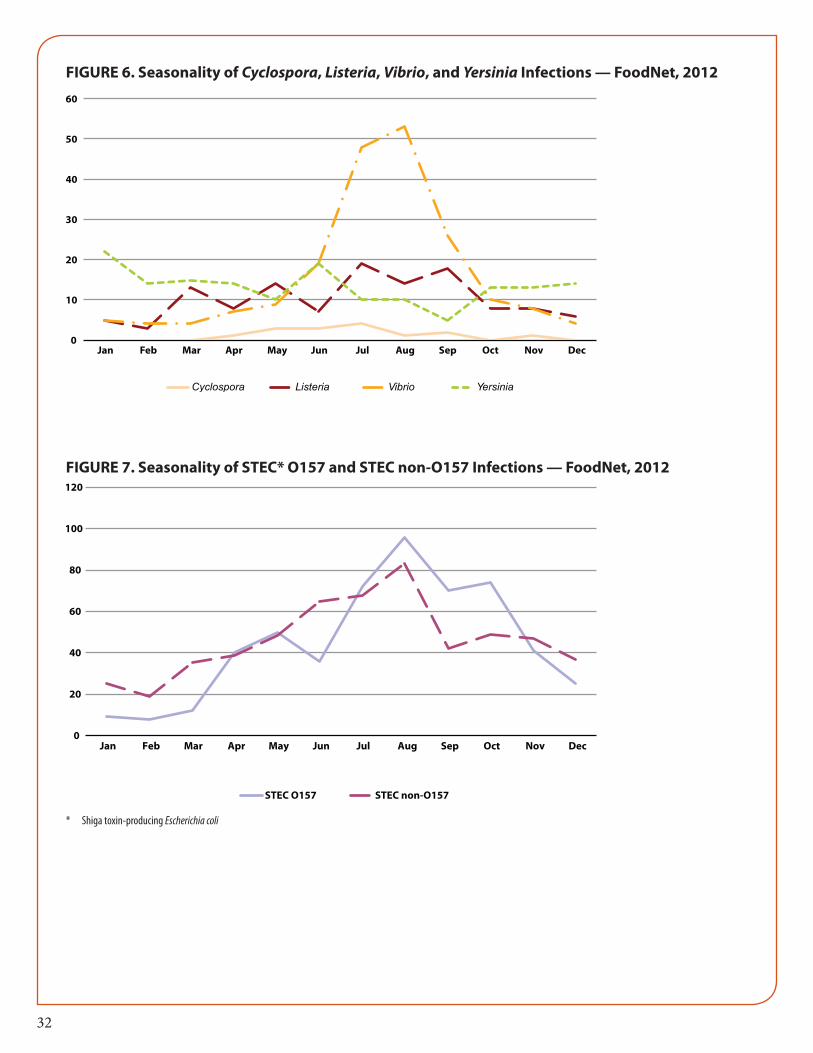
Infections — FoodNet, 2012 ........................................................................................ 31Figure.6. Seasonality of Cyclospora, Listeria, Vibrio, and Yersinia Infections —
FoodNet, 2012................................................................................................................ 32Figure.7. Seasonality of STEC O157 and STEC non-O157 Infections — FoodNet, 2012 ... 32
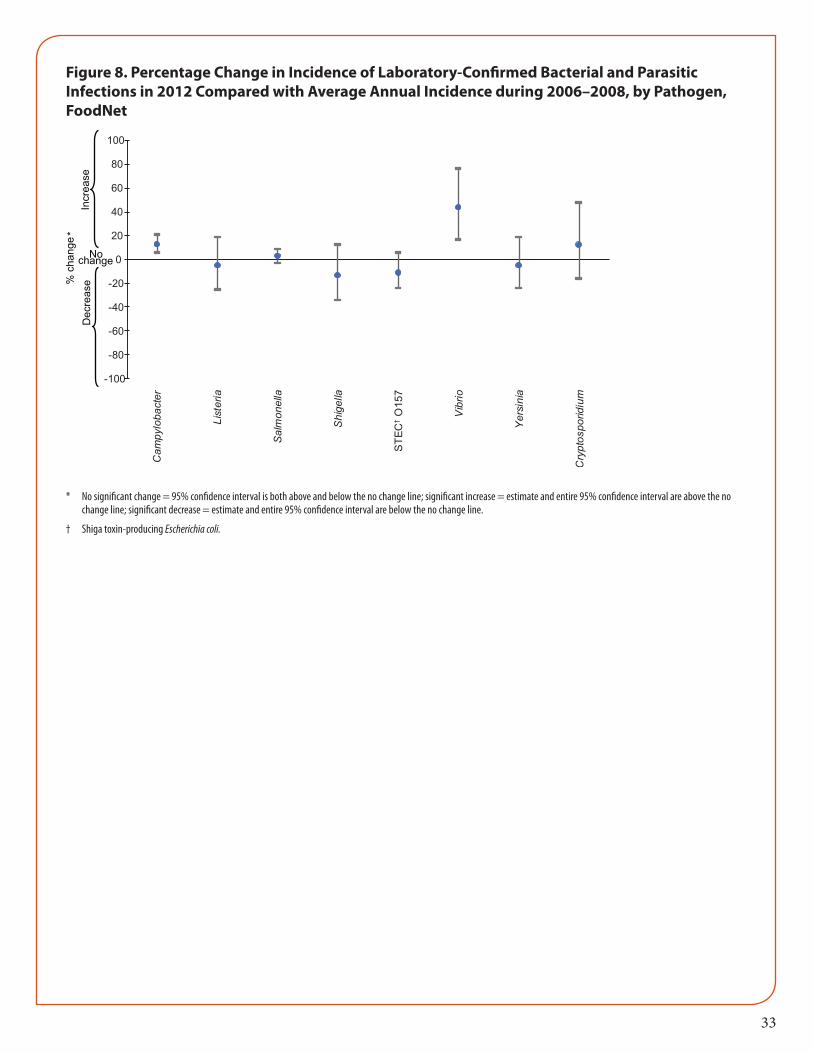
Changes in Incidence ....................................................................................................................33-34Figure.8. Percentage Change in Incidence of Laboratory-Confirmed Bacterial
and Parasitic Infections in 2012 Compared with Average Annual Incidence during 2006-2008, by Pathogen — FoodNet .......................................... 33
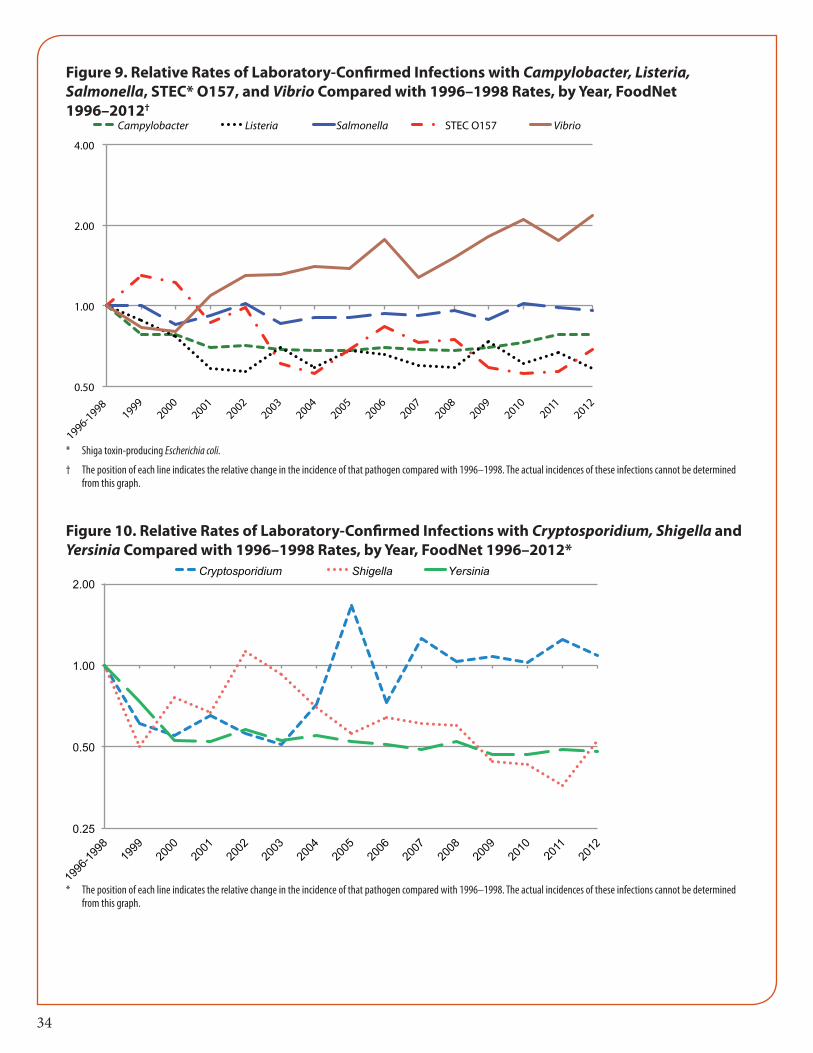
Figure.9. Relative Rates of Laboratory-Confirmed Infections with Campylobacter, Listeria, Salmonella, STEC O157, and Vibrio Compared with 1996-1998 Rates, by Year — FoodNet, 1996-2012 ....................................................................... 34
Figure.10. Relative Rates of Laboratory-Confirmed Infections with Cryptosporidium, Shigella, and Yersinia Compared with 1996-1998 Rates, by Year—FoodNet, 1996-2012 ....................................................................................................................... 34
Hemolytic Uremic Syndrome (HUS) ............................................................................................35-36Table.19. Summary of Post-Diarrheal Hemolytic Uremic Syndrome (HUS)
Cases, All Ages - FoodNet, 1997-2011 ....................................................................... 35Table.20. Results of Microbiologic Testing for Shiga Toxin-producing Escherichia coli
(STEC) Infection among Post-Diarrheal HUS Case-Patients, 1997-2011 ............ 35Table.21. Number and Incidence Rate of Post-Diarrheal Pediatric HUS Cases,
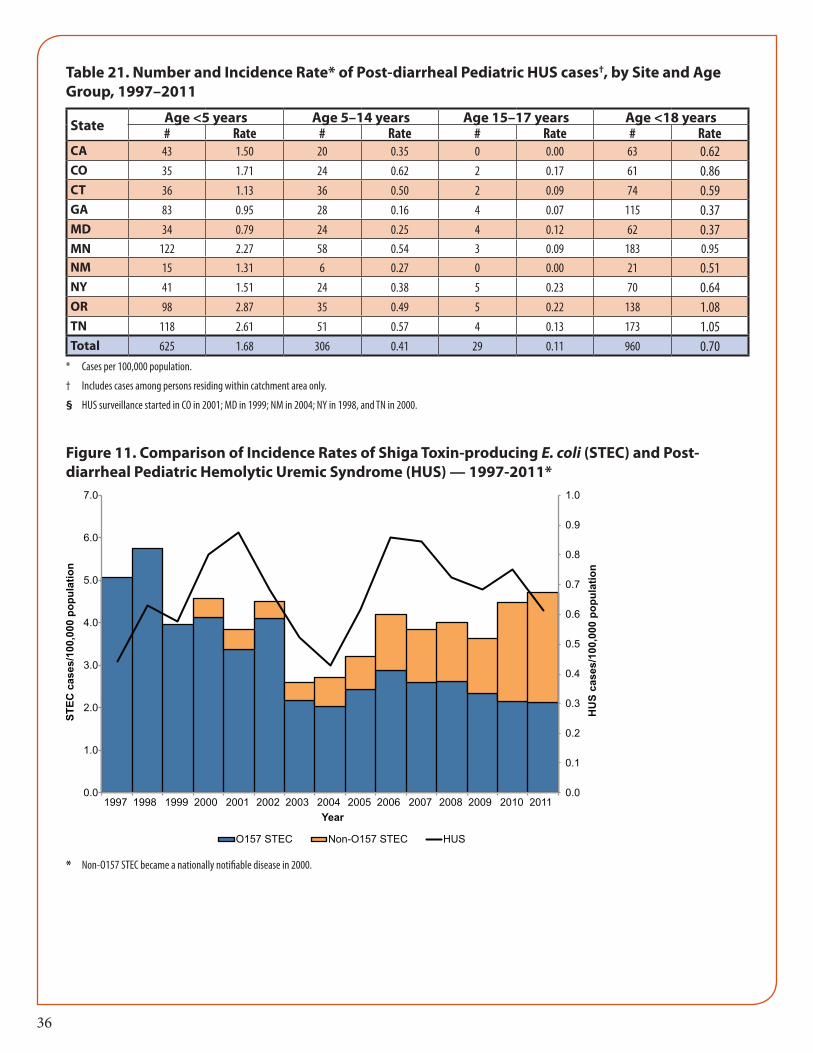
by Site and Age Group — FoodNet, 1997-2011 ........................................................ 36Figure.11. Comparison of Incidence Rates of Shiga Toxin-producing
E. coli (STEC) and Post-Diarrheal Pediatric Hemolytic Uremic Syndrome (HUS) — 1997-2011 .................................................................................. 36
5
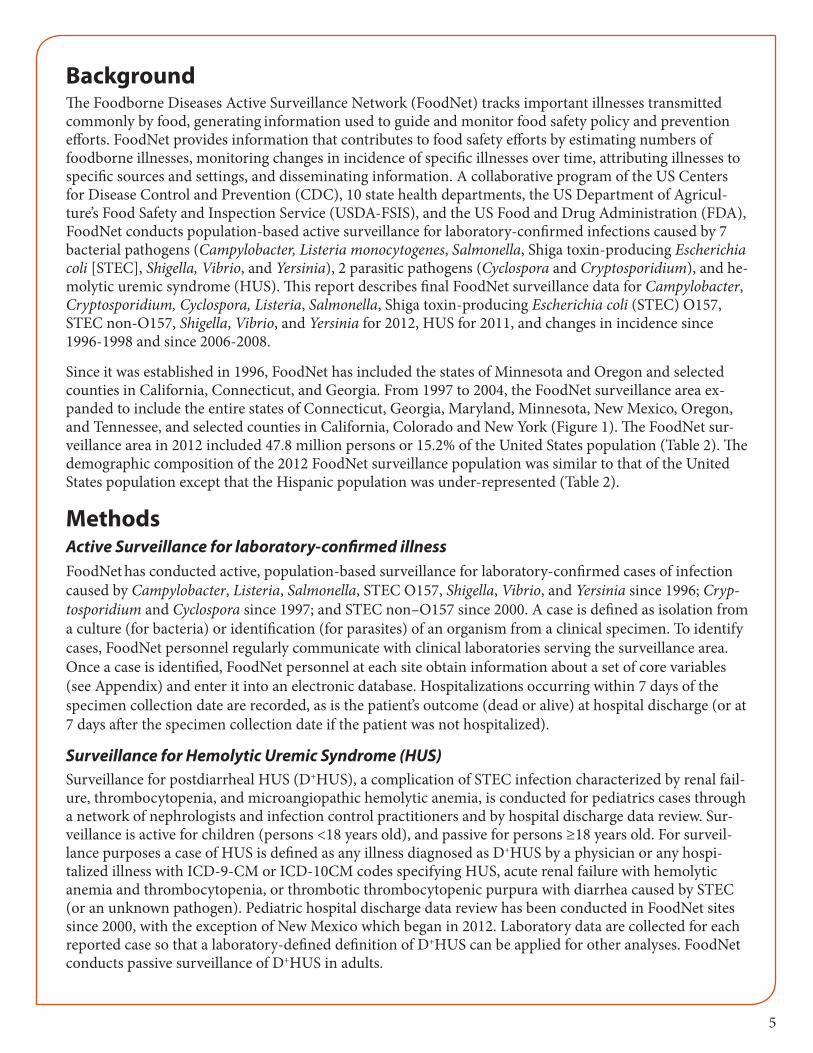
BackgroundThe Foodborne Diseases Active Surveillance Network (FoodNet) tracks important illnesses transmitted commonly by food, generating information used to guide and monitor food safety policy and prevention efforts. FoodNet provides information that contributes to food safety efforts by estimating numbers of foodborne illnesses, monitoring changes in incidence of specific illnesses over time, attributing illnesses to specific sources and settings, and disseminating information. A collaborative program of the US Centers for Disease Control and Prevention (CDC), 10 state health departments, the US Department of Agricul-ture’s Food Safety and Inspection Service (USDA-FSIS), and the US Food and Drug Administration (FDA), FoodNet conducts population-based active surveillance for laboratory-confirmed infections caused by 7 bacterial pathogens (Campylobacter, Listeria monocytogenes, Salmonella, Shiga toxin-producing Escherichia coli [STEC], Shigella, Vibrio, and Yersinia), 2 parasitic pathogens (Cyclospora and Cryptosporidium), and he-molytic uremic syndrome (HUS). This report describes final FoodNet surveillance data for Campylobacter, Cryptosporidium, Cyclospora, Listeria, Salmonella, Shiga toxin-producing Escherichia coli (STEC) O157, STEC non-O157, Shigella, Vibrio, and Yersinia for 2012, HUS for 2011, and changes in incidence since 1996-1998 and since 2006-2008.
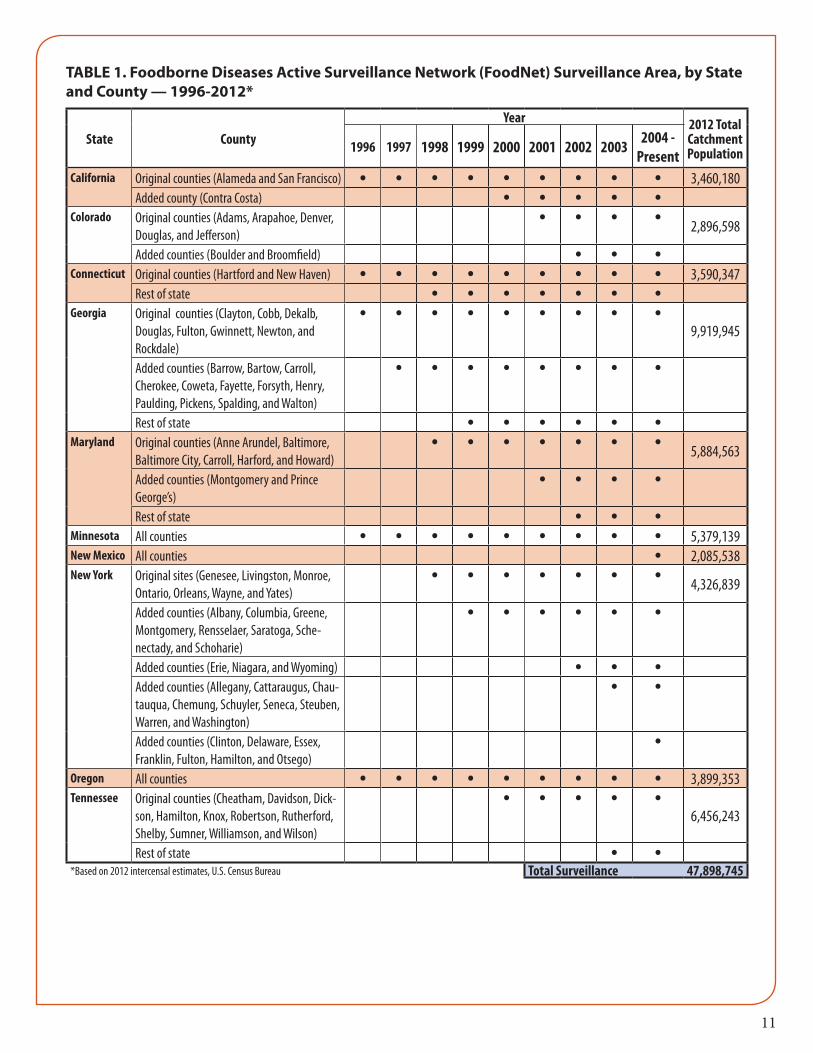
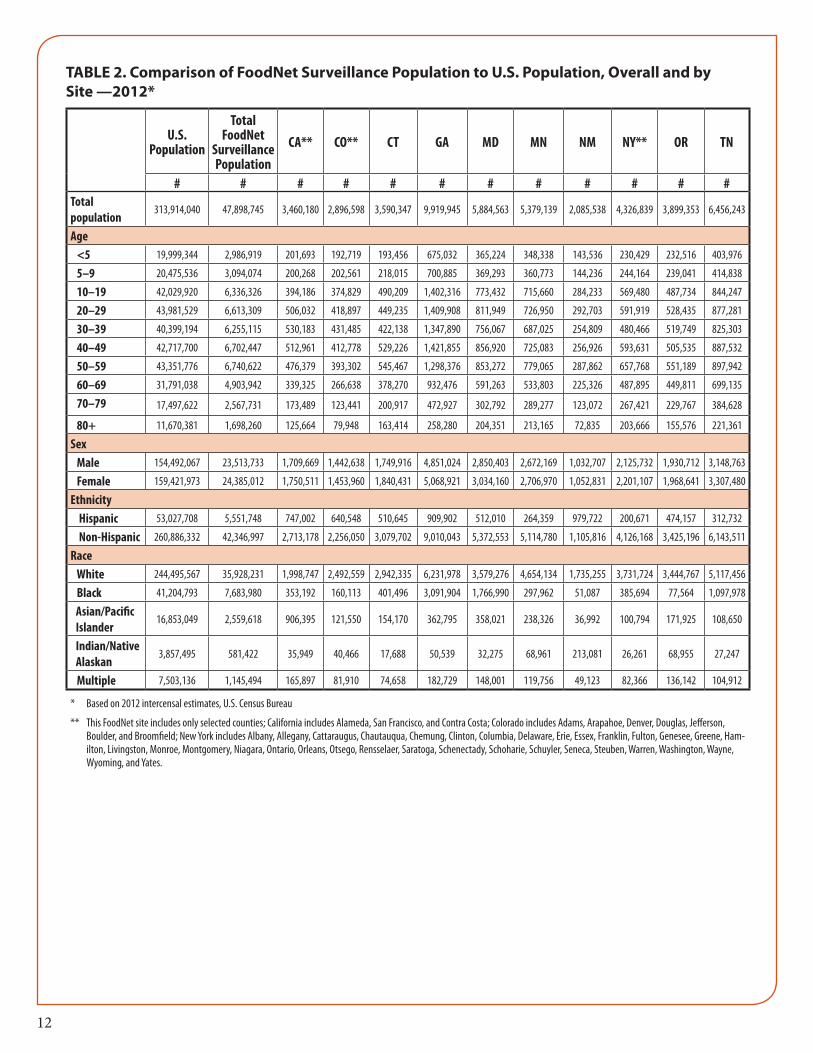
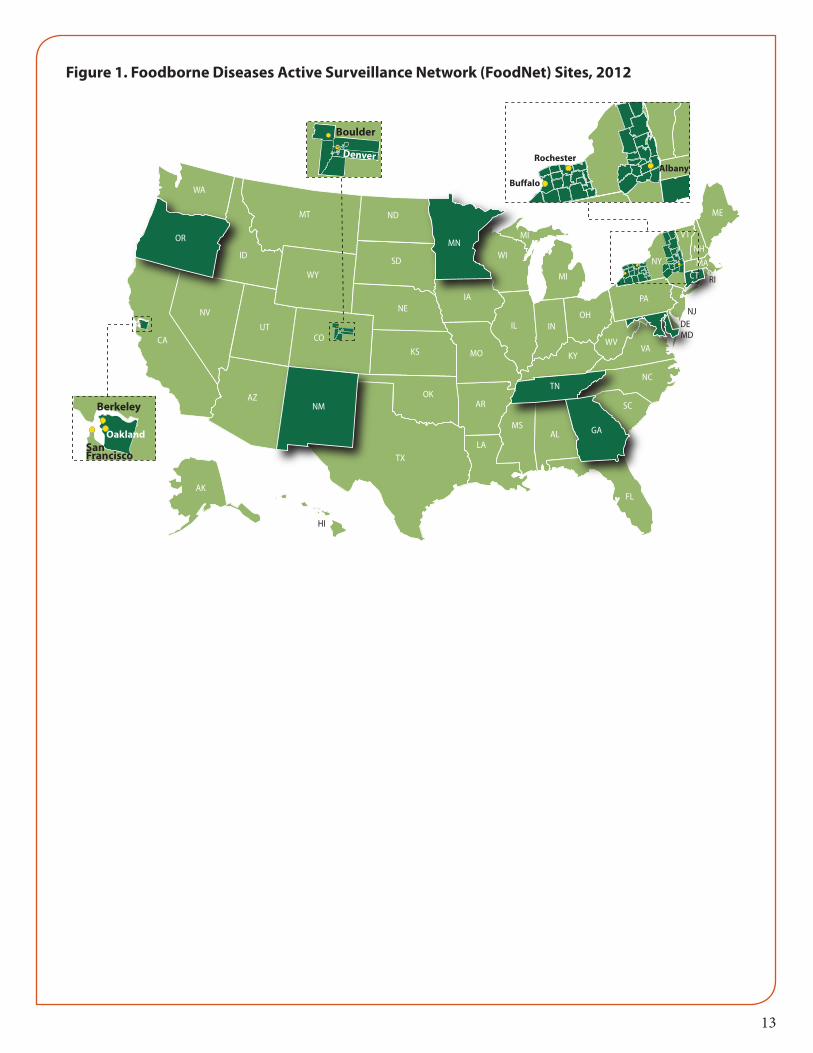
Since it was established in 1996, FoodNet has included the states of Minnesota and Oregon and selected counties in California, Connecticut, and Georgia. From 1997 to 2004, the FoodNet surveillance area ex-panded to include the entire states of Connecticut, Georgia, Maryland, Minnesota, New Mexico, Oregon, and Tennessee, and selected counties in California, Colorado and New York (Figure 1). The FoodNet sur-veillance area in 2012 included 47.8 million persons or 15.2% of the United States population (Table 2). The demographic composition of the 2012 FoodNet surveillance population was similar to that of the United States population except that the Hispanic population was under-represented (Table 2).
MethodsActive Surveillance for laboratory-confirmed illnessFoodNet has conducted active, population-based surveillance for laboratory-confirmed cases of infection caused by Campylobacter, Listeria, Salmonella, STEC O157, Shigella, Vibrio, and Yersinia since 1996; Cryp-tosporidium and Cyclospora since 1997; and STEC non–O157 since 2000. A case is defined as isolation from a culture (for bacteria) or identification (for parasites) of an organism from a clinical specimen. To identify cases, FoodNet personnel regularly communicate with clinical laboratories serving the surveillance area. Once a case is identified, FoodNet personnel at each site obtain information about a set of core variables (see Appendix) and enter it into an electronic database. Hospitalizations occurring within 7 days of the specimen collection date are recorded, as is the patient’s outcome (dead or alive) at hospital discharge (or at 7 days after the specimen collection date if the patient was not hospitalized).
Surveillance for Hemolytic Uremic Syndrome (HUS)Surveillance for postdiarrheal HUS (D+HUS), a complication of STEC infection characterized by renal fail-ure, thrombocytopenia, and microangiopathic hemolytic anemia, is conducted for pediatrics cases through a network of nephrologists and infection control practitioners and by hospital discharge data review. Sur-veillance is active for children (persons <18 years old), and passive for persons ≥18 years old. For surveil-lance purposes a case of HUS is defined as any illness diagnosed as D+HUS by a physician or any hospi-talized illness with ICD-9-CM or ICD-10CM codes specifying HUS, acute renal failure with hemolytic anemia and thrombocytopenia, or thrombotic thrombocytopenic purpura with diarrhea caused by STEC (or an unknown pathogen). Pediatric hospital discharge data review has been conducted in FoodNet sites since 2000, with the exception of New Mexico which began in 2012. Laboratory data are collected for each reported case so that a laboratory-defined definition of D+HUS can be applied for other analyses. FoodNet conducts passive surveillance of D+HUS in adults.
6
AnalysisIncidence was calculated by dividing the number of laboratory-confirmed infections in 2012 by U.S. Census Bureau population estimates for the same year. Case fatality rates (CFRs) were calculated by divid-ing the number of deaths by the number of laboratory-confirmed infections and multiplying by 100. Age groups were defined as <5 years, 5-9 years, 10-19 years, 20–29 years, 30-39 years, 40-49 years, 50-59 years, 60-69 years, 70-79 years and ≥80 years of age.
A main-effects, log-linear Poisson regression model (negative binomial model) was used to estimate chang-es in incidence from 1996–1998 to 2012 and from 2006–2008 to 2012 with 95% confidence intervals (CIs). The model accounts for site-to-site variation and changes in the size of the population under surveillance in FoodNet over time. As a measure of overall change in incidence of infection with pathogens transmitted commonly through food, data were combined for Campylobacter, Listeria, Salmonella, STEC O157, Vibrio, and Yersinia, six key bacterial pathogens for which >50% of illnesses are estimated to be foodborne, weight-ing by incidence of infection for each pathogen. For D+HUS, changes in incidence from 2006–2008 to 2011 were estimated. Changes in incidence were not assessed for Cyclospora because data were sparse or for STEC non-O157 because of changes in diagnostic practices.
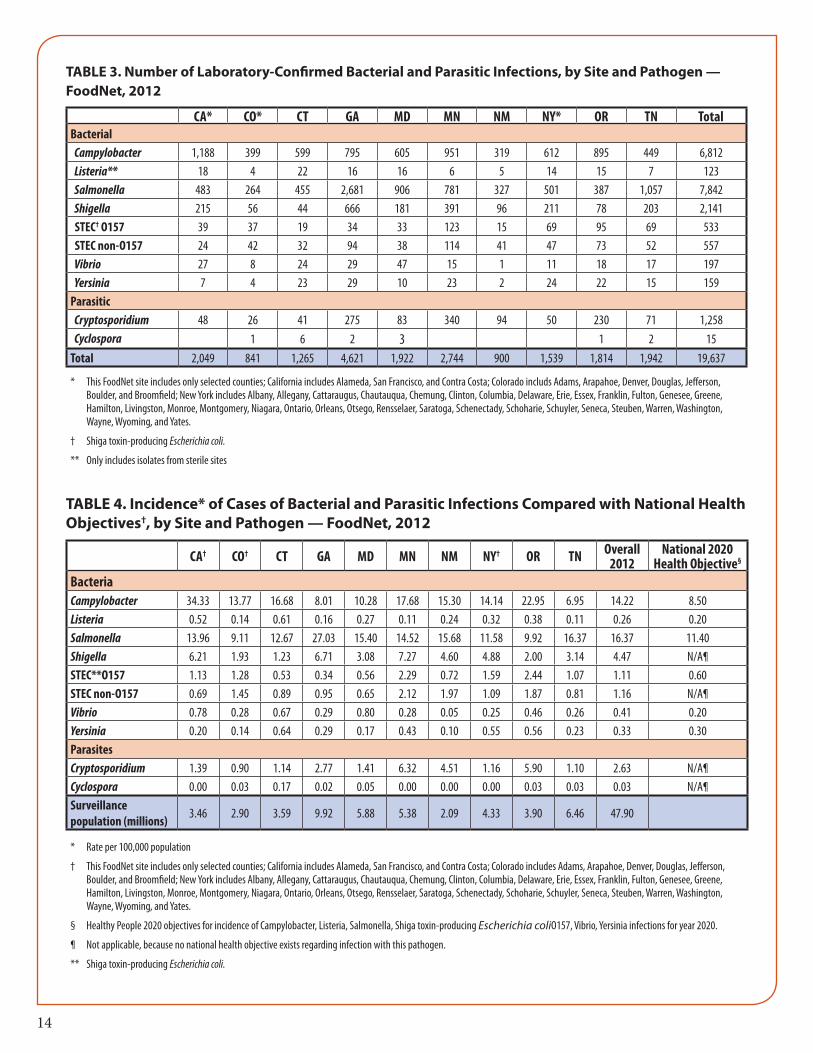
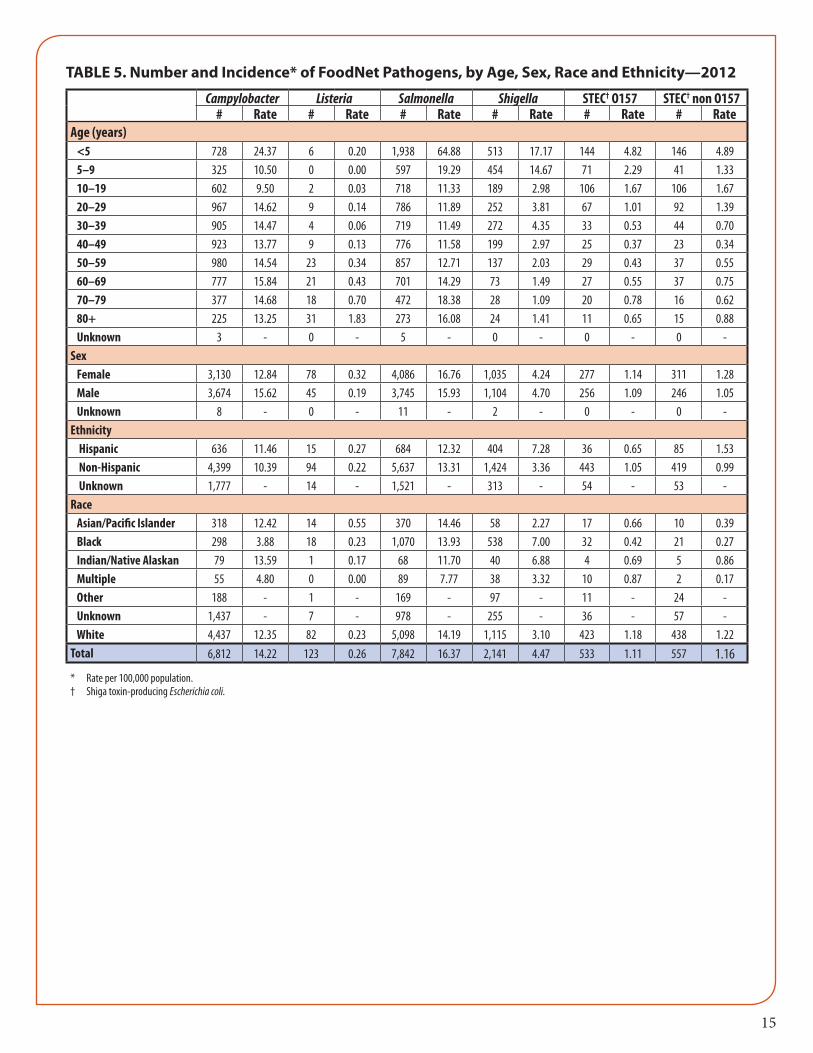
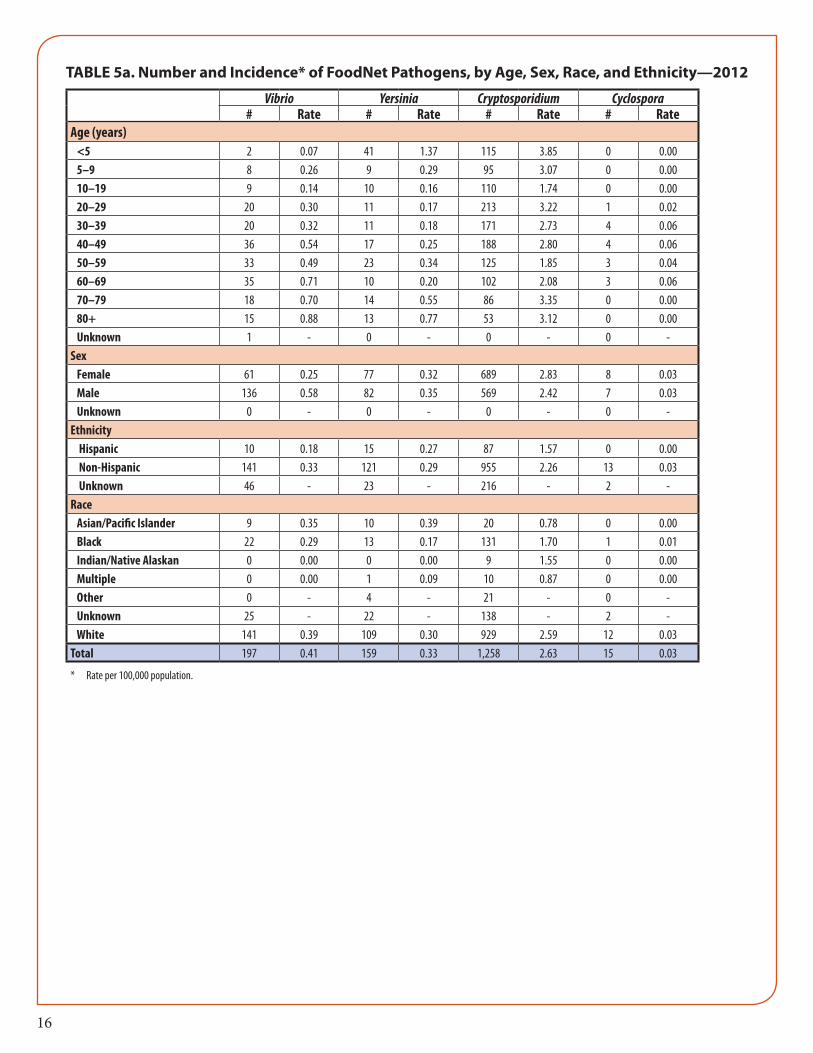
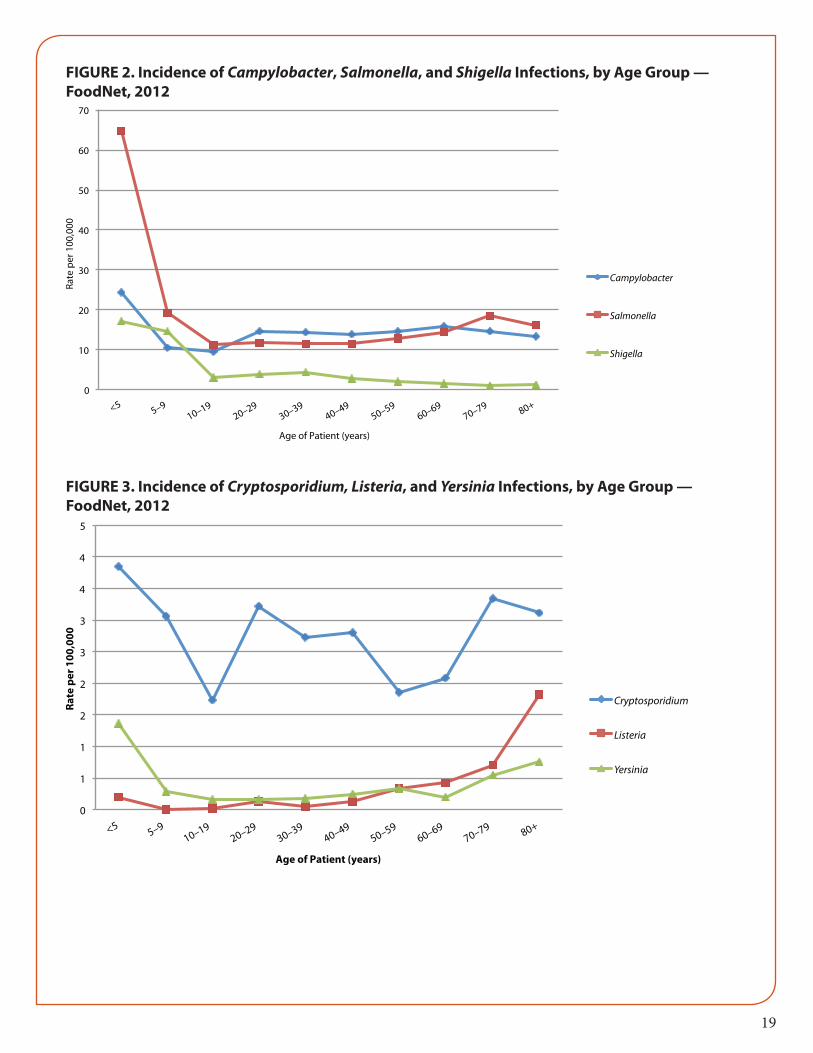
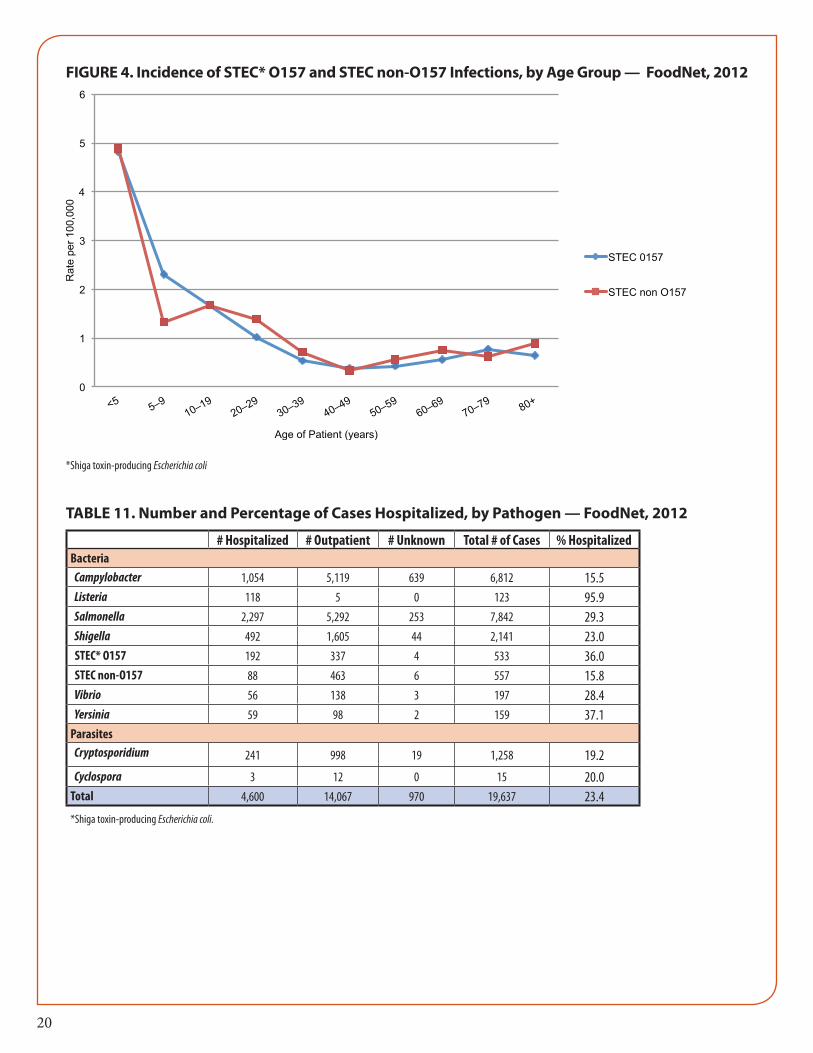
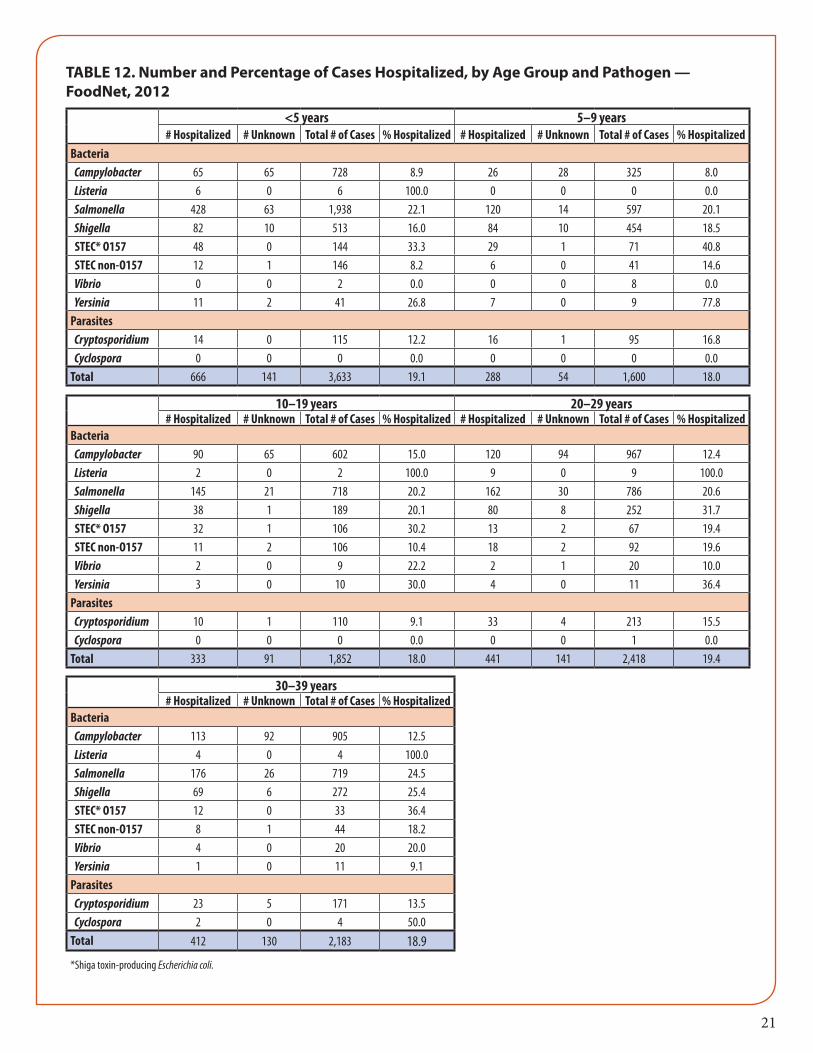
ResultsIn 2012, FoodNet identified a total of 19,637 laboratory-confirmed cases of infection, 4,600 hospitaliza-tions, and 69 deaths (Tables 11, 14). For individual pathogens tracked, the number of infections and in-cidence were as follows: Salmonella (7,842; 16.37 per 100,000), Campylobacter (6,812; 14.22 per 100,000), Shigella (2,141; 4.47 per 100,000), Cryptosporidium (1,258; 2.63 per 100,000), STEC non-O157 (557; 1.16 per 100,000); STEC O157 (533; 1.11 per 100,000), Vibrio (197; 0.41 per 100,000),Yersinia (159; 0.33 per 100,000), Listeria (123; 0.26 per 100,000), and Cyclospora (15; 0.03 per 100,000) (Tables 3, 4). Incidence was highest in children aged <5 years for all pathogens except Listeria, Vibrio, and Cyclospora, for which inci-dence was highest in persons aged ≥60 years (Tables 5,5a). Both the percentage of persons hospitalized and the case fatality rates (CFRs) were highest among persons aged ≥60 years (Tables 12, 12a, 15, 15a).
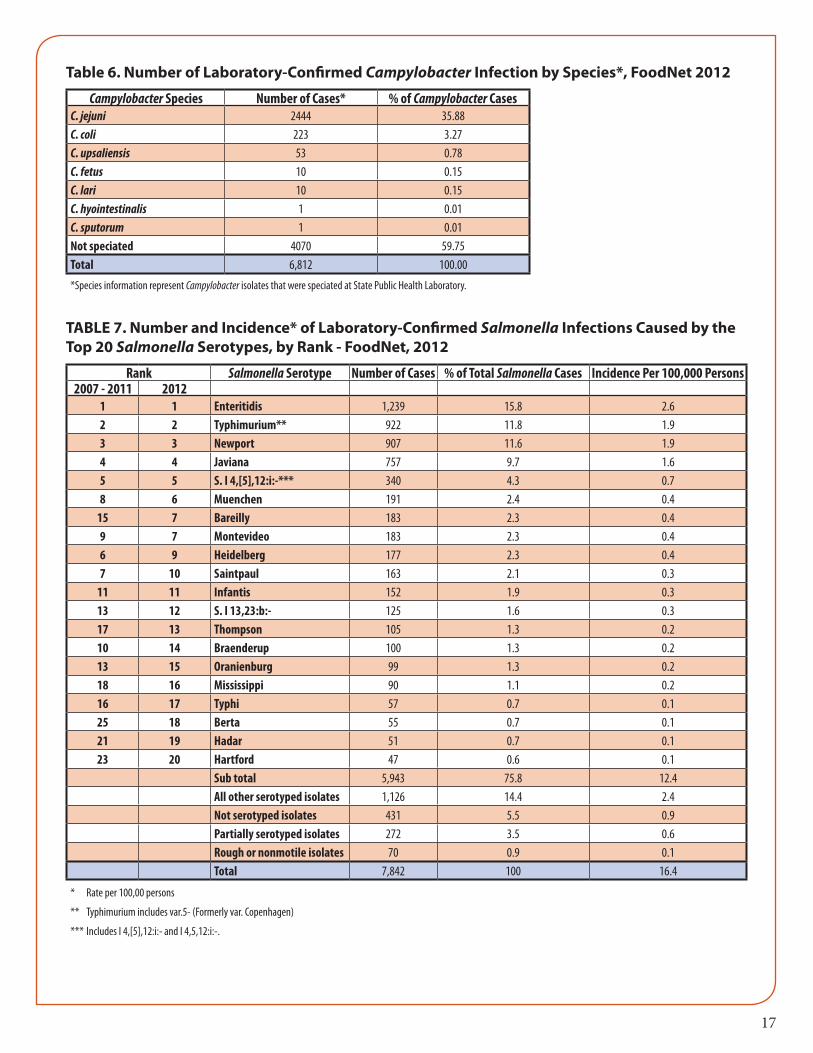
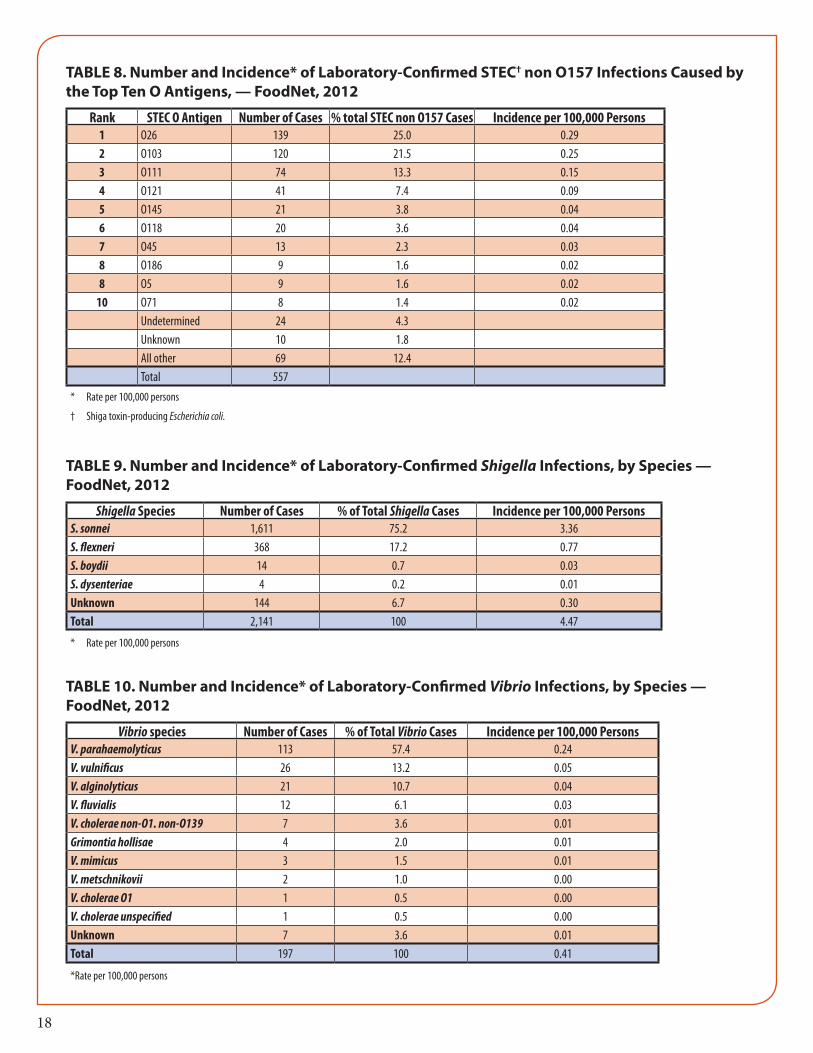
Among 6,812 (40%) Campylobacter isolates speciated at the state public health laboratory, the most com-mon species were C. jejuni (2444 [89%]), C. coli (223 [8%]), and C. upsaliensis 53 [2%]). Among 7,842 (90%) Salmonella isolates serotyped, the most common serotypes were Enteritidis (1,239 [18%]), Ty-phimurium (922 [13%]), and Newport 907 [13%]). Among the 1,090 (97%) STEC infections with O sero-group identified, the most common serogroups were O157 (533 [49%]), O26 (139 [13%]), and O103 (120 [11%]). Among the 2,141 (93%) Shigella isolates with species information, the most common were S. sonnei (1611 [80%]), S. flexneri (368 [18%]), and S. boydii (14[0.7%]). Among the 195 (96%) Vibrio isolates with species information, the most common were V. parahaemolyticus (113 [59%]), V. alginolyticus (26 [14%]), and V. vulnificus (21[11%]).
In 2012, the overall estimated incidence of infection with six key pathogens transmitted commonly through food did not change significantly compared with 2006–2008. For individual pathogens, the inci-dence of infection was significantly higher for Vibrio (44% increase; CI = 17%–77%) and Campylobacter (13% increase; CI = 6%–21%); incidence did not change significantly for Cryptosporidium, Listeria, Salmo-nella, STEC O157, Shigella or Yersinia (Figures 8). Among the top three Salmonella serotypes, incidence of infection was significantly lower for Typhimurium (19% decrease; CI = 10%–28%), higher for Newport (23% increase; CI = 0.5%–50%), and unchanged for Enteritidis. For D+HUS, in 2011 compared with 2006–2008, the incidence was significantly lower in children aged <5 years (38% decrease; CI = 12%–57%) and was unchanged for all children.
7
In 2012, the overall estimated incidence of infection with six key pathogens transmitted commonly through food was 22% lower compared with 1996–1998. For individual pathogens, the incidence of infec-tion was significantly lower during the same period for Yersinia (52% decrease; CI = 38%–62%), Shigella (47% decrease; CI = 25%–62%), Listeria (42% decrease; CI = 24%–55%), STEC O157 (31% decrease; CI = 15%–43%), and Campylobacter (22% decrease; CI = 16%–28%), and was higher for Vibrio (117% increase; CI = 63%–188%) (Figures 9 and 10). Incidence did not change significantly for Salmonella or Cryptospo-ridium. Incidence of infection was significantly lower for Salmonella serotype Typhimurium (58% decrease; CI = 52%–63%), and higher for serotypes Newport (80% increase; CI = 37%–135%) and Enteritidis (29% increase; CI = 6%–56%).
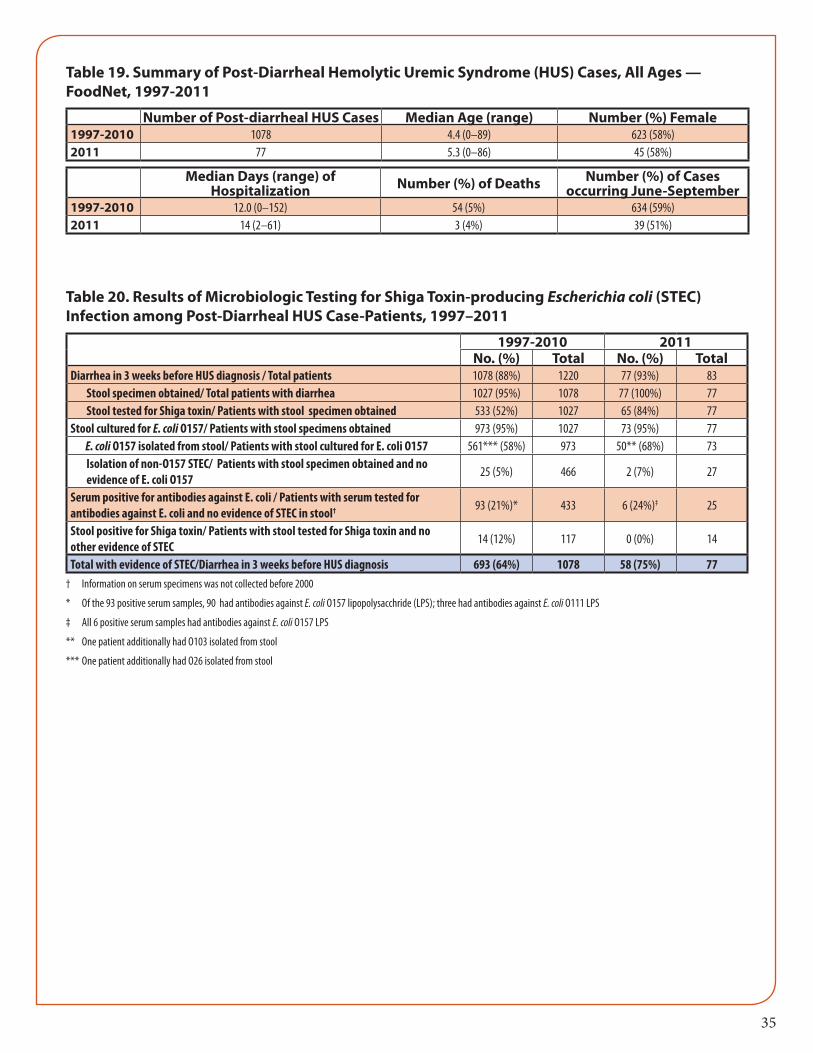
In 2011, FoodNet ascertained 83 HUS cases, including 77 (93%) post-diarrheal cases. Among post-diar-rheal HUS cases, 3 (4%) persons died. Sixty-eight (88%) pediatric post-diarrheal HUS cases were reported; among these, 37 (54%) cases were in children aged <5 years. Of all post-diarrheal HUS cases, 58 (75%) had evidence of STEC infection, defined as isolation of STEC by stool culture, stool positive for Shiga toxin or detection of antibodies to E. coli O157 or O111 lipopolysaccharide in serum; 51% of all D+HUS cases were diagnosed during June through September.
Detailed information about active surveillance and HUS data can be found in Tables 19–21 and Figure 11.
LimitationsThe findings in this report are subject to at least five limitations. First, health-care–seeking behaviors and other characteristics of the population in the surveillance area might affect the generalizability of the findings. Second, many infections transmitted commonly through food (e.g., norovirus infection) are not monitored by FoodNet because these pathogens are not identified routinely in clinical laboratories. Third, the proportion of illnesses transmitted by nonfood routes differs by pathogen, and the route cannot be determined for individual, nonoutbreak-associated illnesses and, therefore, the data provided in this report do not exclusively relate to infections from foodborne sources. Fourth, in some cases counted as fatal, the infection with the enteric pathogen might not have been the primary cause of death. Finally, year-to-year changes in incidence might reflect either annual variation or sustained trends; further data are needed to discern trends clearly.
8
Publications and Abstracts in 2012 That Used Data From FoodNet SurveillancePublications1. Ailes E, Scallan E, Berkelman RL, Kleinbaum DG, Tauxe RV, Moe CL. Do differences in risk factors, medical care seeking,
or medical practices explain the geographic variation in campylobacteriosis in Foodborne Diseases Active Surveillance Network (FoodNet) sites? Clin Infect Dis. 2012 Jun; 54(Suppl 5):S464–71.
2. Chai SJ, White PL, Lathrop SL, Solghan SM, Medus C, McGlinchey BM, et al. Salmonella enterica serotype enteritidis: increasing incidence of domestically acquired infections. Clin Infect Dis. 2012 Jun; 54(Suppl 5):S488–97.
3. Clogher P, Hurd S, Hoefer D, Hadler JL, Pasutti L, Cosgrove S, et al. Assessment of physician knowledge and practices con-cerning STEC infection and enteric illness, 2009, Foodborne Diseases Active Surveillance Network (FoodNet). Clin Infect Dis. 2012 Jun; 54(Suppl 5):S446–52.
4. Cronquist AB, Mody RK, Atkinson R, Besser J, Tobin D’Angelo M, Hurd S, et al. Impacts of culture-independent diagnostic practices on public health surveillance for bacterial enteric pathogens. Clin Infect Dis. 2012 Jun; 54(Suppl 5):S432-9.
5. Fullerton KE, Scallan E, Kirk MD, Mahon BE, Angulo FJ, de Valk H, et al. Case-control studies of sporadic enteric infections: a review and discussion of studies conducted internationally from 1990 to 2009. Foodborne Pathog Dis. 2012 Apr; 9(4):281-292.
6. Hale CR, Scallan E, Cronquist AB, Dunn J, Smith K, Robinson T, et al. Estimates of enteric illness attributable to contact with animals and their environments in the United States. Clin Infect Dis. 2012 Jun; 54(Suppl 5):S472–9.
7. Hall RL, Jones JL, Hurd S, Smith G, Mahon BE, Herwaldt BL. Population-based active surveillance for Cyclospora infec-tion—United States, Foodborne Diseases Active Surveillance Network (FoodNet), 1997–2009. Clin Infect Dis. 2012 Jun; 54(Suppl 5):S411–7.
8. Henao OL, Crim SM, Hoekstra RM. Calculating a measure of overall change in the incidence of selected laboratory-con-firmed infections with pathogens transmitted commonly through food, Foodborne Diseases Active Surveillance Network (FoodNet), 1996–2010. Clin Infect Dis. 2012 Jun; 54(Suppl 5):S418–20.
9. Hurd S, Patrick M, Hatch J, Clogher P, Wymore K, Cronquist AB, et al. Clinical laboratory practices for the isolation and identification of Campylobacter in Foodborne Diseases Active Surveillance Network (FoodNet) sites: baseline information for understanding changes in surveillance data. Clin Infect Dis. 2012 Jun; 54(Suppl 5):S440–5.
10. Kendall ME, Crim S, Fullerton K, Han PV, Cronquist AB, Shiferaw B, et al. Travel-associated enteric infections diagnosed after return to the United States, Foodborne Diseases Active Surveillance Network (FoodNet), 2004–2009. Clin Infect Dis. 2012 Jun; 54(Suppl 5):S480–7.
11. Manikonda K, Palmer A, Wymore K, McMillian M, Nicholson C, Hurd S, et al. Validating deaths reported in the Food-borne Diseases Active Surveillance Network (FoodNet): are all deaths being captured? Clin Infect Dis. 2012 Jun; 54(Suppl 5):S421-3.
12. Mody RK, Luna-Gierke RE, Jones TF, Comstock N, Hurd S, Scheftel J, et al. Infections in pediatric postdiarrheal hemolytic uremic syndrome: factors associated with identifying Shiga toxin-producing Escherichia coli. Arch Pediatr Adolesc Med. 2012 Oct; 166(10):902-909.
13. Murphree R, Garman K, Phan Q, Everstine K, Gould LH, Jones TF. Characteristics of foodborne disease outbreak investi-gations conducted by FoodNet sites, 2003–2008. Clin Infect Dis. 2012 Jun; 54(Suppl 5):S498–503.
14. Newton A, Kendall M, Vugia DJ, Henao O, Mahon BE. Increasing rates of vibriosis in the United States: review of surveil-lance data from two systems, 1996–2010. Clin Infect Dis. 2012 Jun; 54(Suppl 5):S391–5.
15. Ong KL, Apostal M, Comstock N, Hurd S, Hayes Webb T, Mickelson S, et al. Strategies for surveillance of pediatric hemo-lytic uremic syndrome: Foodborne Diseases Active Surveillance Network (FoodNet), 2000–2007. Clin Infect Dis. 2012 Jun; 54(Suppl 5):S424–31.
16. Ong KL, Gould LH, Chen DL, Jones TF, Scheftel J, Hayes Webb T, et al. Changing epidemiology of Yersinia enterocolitica infections: markedly decreased rates in young black children, Foodborne Diseases Active Surveillance Network (FoodNet), 1996–2009. Clin Infect Dis. 2012 Jun; 54(Suppl 5):S385–90.
9
17. Pouillot R, Hoelzer K, Jackson KA, Henao OL, Silk BJ. Relative risk of listeriosis in Foodborne Diseases Active Surveillance Network (FoodNet) sites according to age, pregnancy, and ethnicity. Clin Infect Dis. 2012 Jun; 54(Suppl 5):S405-10.
18. Rounds JM, Boxrud DJ, Jawahir SL, Smith KE. Dynamics of Escherichia coli O157:H7 outbreak detection and investigation, Minnesota 2000-2008. Epidemiol Infect. 2012 Aug; 140:1430-8.
19. Scallan E, Mahon BE. Foodborne Diseases Active Surveillance Network (FoodNet) in 2012: a foundation for food safety in the United States. Clin Infect Dis. 2012 Jun; 54(Suppl 5):S381-4.
20. Shiferaw B, Solghan S, Palmer A, Joyce K, Barzilay EJ, Krueger A, et al. Antimicrobial susceptibility patterns of Shigella iso-lates in Foodborne Diseases Active Surveillance Network (FoodNet) sites, 2000–2010. Clin Infect Dis. 2012 Jun; 54(Suppl 5):S458–63.
21. Shiferaw B, Verrill L, Booth H, Zansky SM, Norton DM, Crim S, et al. Sex-based differences in food consumption: Food-borne Diseases Active Surveillance Network (FoodNet) population survey, 2006–2007. Clin Infect Dis. 2012 Jun; 54(Suppl 5):S453–7.
22. Silk BJ, Date KA, Jackson KA, Pouillot R, Holt KG, Graves LM, et al. Invasive listeriosis in the Foodborne Diseases Active Surveillance Network (FoodNet), 2004–2009: further targeted prevention needed for higher-risk groups. Clin Infect Dis. 2012 Jun; 54(Suppl 5):S396-404.
23. Smith KE, Wilker PR, Reiter PL, Hedican EB, Bender JB, Hedberg CW. Antibiotic treatment of Escherichia coli O157 infec-tion and the risk of hemolytic uremic syndrome, Minnesota. Ped Infect Dis J. 2012 Jan; 31:37-41.
24. Taylor EV, Holt KG, Mahon BE, Ayers T, Norton D, Gould LH. Ground Beef Consumption Patterns in the United States, FoodNet, 2006 through 2007. J Food Prot. 2012 Feb; 75(2):341-346.
25. Weisent J, Rohrbach B, Dunn JR, Odoi A. Socioeconomic determinants of geographic disparities in campylobacteriosis risk: a comparison of global and local modeling approaches. Int J Health Geogr. 2012 Oct; 11(1):45.
Conference Abstracts1. Bemis K, Marcus R, Hadler J. Neighborhood level socioeconomic status and Campylobacter incidence: Connecticut, 1999-
2009. In: Proceedings of the International Conference on Emerging Infectious Diseases; 2012 Mar 11-14; Atlanta, GA. Abstract 260.
2. Chai SJ, Crim S, Nisler A, Reynolds J, Swanson KC, Gould LH, et al. The increasing problem of Salmonella enterica sero-type Newport in infants and in the South, United States. In: Proceedings of the International Conference on Emerging Infectious Diseases; 2012 Mar 11-14; Atlanta, GA. Abstract 150.
3. Gu W, Hoekstra RM, Vieira A, Cole D. Statistical estimation of association between reported exposure and sporadic Sal-monella serotype Enteritidis illnesses based on logistic and lasso model. In: Proceedings of the International Conference on Emerging Infectious Diseases; 2012 Mar 11-14; Atlanta, GA. Abstract 57.
4. Heiman K, Henao O, Kendall M, Mody R. Correlations between incidence of pediatric post-diarrheal hemolytic uremic syndrome and Shiga toxin-producing Escherichia coli infection in active and passive surveillance in the United States, 2000-2009. In: Proceedings of the International Conference on Emerging Infectious Diseases; 2012 Mar 11-14; Atlanta, GA. Abstract 312.
5. Huang J, Cronquist A, Patrick M, Wymore K, Hurd S, Spina NL, et al. Diagnostic practices for detection of enteric infec-tions in clinical laboratories – FoodNet, 2012. In: Proceedings of IDWeek; 2012 Oct 17-21; San Diego, CA. Abstract 216.
6. Huang J, Patrick ME, Jung C, Meyer R, Henao O. Does geographic residence play a role in Salmonella enterica serotype Ja-viana infections? Data from FoodNet, 2005-2010. In: Proceedings of the International Conference on Emerging Infectious Diseases; 2012 Mar 11-14; Atlanta, GA. Abstract 328.
7. Kendall ME, Scallan E, Greene SA, Ryan P, Robinson T, Shiferaw B, et al. Differences by age group in the prevalence of di-arrhea and vomiting, rates of seeking health care, and stool sample submission: FoodNet Population Survey, 1996-2007. In: Proceedings of the International Conference on Emerging Infectious Diseases; 2012 Mar 11-14; Atlanta, GA. Abstract 361.
10
8. Luna RE, Wymore K, Gierke RW, Clogher P, Solghan S, Medus C, et al. Mixed etiology infections involving non-O157 Shiga toxin-producing Escherichia coli (STEC) – FoodNet, 2001-2010. In: Proceedings of the International Symposium on Shiga Toxin (Verocytotin) Producing Escherichia coli Infections (VTEC); 2012 May 6-9; Amsterdam, Netherlands. Abstract P-007.
9. Luna-Gierke RE, Garman K, Booth E, Rounds J, Meyer R, Nicholson C, et al. Factors associated with finding evidence of Shiga toxin-producing Escherichia coli (STEC) infection in adults with post-diarrheal HUS – FoodNet, 2000-2010. In: Proceedings of IDWeek; 2012 Oct 17-21; San Diego, CA. Abstract 1372.
10. Mody RK, Luna RE, Gu W, Hurd S, Comstock N, Tobin-D’Angelo M, et al. Predictors of poor outcome in children with post-diarrheal HUS – United States, 2004-2010. In: Proceedings of the International Symposium on Shiga Toxin (Verocy-totin) Producing Escherichia coli Infections (VTEC); 2012 May 6-9; Amsterdam, Netherlands. Abstract P-220.
11. Mody R, Medus C, Huang JY, Patrick ME, Cronquist A, Wymore K, et al. Changes in diagnostic methods used by clinical laboratories to detect Shiga toxin-producing Escherichia coli (STEC) infections – FoodNet, 2007-2012. In: Proceedings of IDWeek; 2012 Oct 17-21; San Diego, CA. Abstract 156.
12. Palmer AM, Jung C, Hogan BC, Blythe D. Epidemiology of international travel-associated Campylobacter cases in Mary-land, 2004-2009. In: Proceedings of the International Conference on Emerging Infectious Diseases; 2012 Mar 11-14; Atlanta, GA. Abstract 222.
13. Patrick ME, Cronquist A, Wymore K, Hatch J, Solghan S, Robinson T, et al. Description of Campylobacter cases identified through culture-independent methods and their impact on the incidence of Campylobacter infections, Foodborne Diseases Active Surveillance Network (FoodNet), 2010-2011. In: Proceedings of the International Conference on Emerging Infec-tious Diseases; 2012 Mar 11-14; Atlanta, GA. Abstract 24.
14. Robinson TJ, Cebelinski EA, Smith KE. Molecular and descriptive epidemiology of sporadic cases of Cryptosporidiosis, Minnesota, 2000-2010. In: Proceedings of the International Conference on Emerging Infectious Diseases; 2012 Mar 11-14; Atlanta, GA. Abstract 331.
15. Sashti N, Jones TF, Rounds J, Kendall M, Gould LH. An analysis of epidemiologic responses to pulsed-field gel electropho-resis clusters, Foodborne Diseases Active Surveillance Network (FoodNet), 2009-2011. In: Proceedings of OutbreakNet; 2012 Aug 27-30; Atlanta, GA. Oral Presentation.
16. Smith K, Hedican E, Cebelinski E, Lappi V, Medus C, Koziol B, et al. Evaluation of the role of the Shiga toxin 2 subtypes in virulence of non-O157 Shiga toxin-producing Escherichia coli strains in Minnesota. In: Proceedings of the International Conference on Emerging Infectious Diseases; 2012 Mar 11-14; Atlanta, GA. Abstract 333.
17. Spina NL, Malloy KP, Smith GL, Dumas NB, Zansky SM. Clinical comparison of pediatric hemolytic uremic syndrome cases, with and without stool culture confirmation of Shiga toxin positive E. coli; New York State Emerging Infections Program, 1999-2011. In: Proceedings of the International Conference on Emerging Infectious Diseases; 2012 Mar 11-14; Atlanta, GA. Abstract 296.
18. Swanson KC, Cole DJ, Fullerton KE, Henao O, Clogher P, Chai SJ. Exposure ascertainment among sporadic campylobacte-riosis cases – Assessing the utility of a data collection tool, Foodborne Diseases Active Surveillance Network. In: Proceed-ings of the International Conference on Emerging Infectious Diseases; 2012 Mar 11-14; Atlanta, GA. Abstract 134.
19. Swanson K, Crim S, Dunn J, Henao O, Mahon BE, Medalla F, et al. Decreasing incidence of Salmonella Typhimurium infections in the United States, 2004-2011. In: Proceedings of IDWeek; 2012 Oct 17-21; San Diego, CA. Abstract 219.
20. Vieira AR, Chai SJ, Karp B, Gu W, Golden NJ, White PL, et al. Review of surveillance data sources for food source attribu-tion for Salmonella enterica serotype Enteritidis. In: Proceedings of the International Conference on Emerging Infectious Diseases; 2012 Mar 11-14; Atlanta, GA. Abstract 332.
21. Williamson A, Wymore K. Epidemiology of Shiga toxin-producing Escherichia coli in the California FoodNet catchment area, 2008-2011. In: Proceedings of IDWeek; 2012 Oct 17-21; San Diego, CA. Abstract 218.
Further information concerning FoodNet, including previous surveillance reports, MMWR articles, and other FoodNet publications, can be obtained by visiting www.cdc.gov/foodnet, emailing FoodNet at [email protected] or contacting the Enteric Diseases Epidemiology Branch at (404) 639-2206
11
TABLE 1. Foodborne Diseases Active Surveillance Network (FoodNet) Surveillance Area, by State and County — 1996-2012*
State CountyYear 2012 Total
Catchment Population1996 1997 1998 1999 2000 2001 2002 2003 2004 -
PresentCalifornia Original counties (Alameda and San Francisco) • • • • • • • • • 3,460,180
Added county (Contra Costa) • • • • •Colorado Original counties (Adams, Arapahoe, Denver,
Douglas, and Jefferson)• • • •
2,896,598
Added counties (Boulder and Broomfield) • • •Connecticut Original counties (Hartford and New Haven) • • • • • • • • • 3,590,347
Rest of state • • • • • • •Georgia Original counties (Clayton, Cobb, Dekalb,
Douglas, Fulton, Gwinnett, Newton, and Rockdale)
• • • • • • • • •9,919,945
Added counties (Barrow, Bartow, Carroll, Cherokee, Coweta, Fayette, Forsyth, Henry, Paulding, Pickens, Spalding, and Walton)
• • • • • • • •
Rest of state • • • • • •Maryland Original counties (Anne Arundel, Baltimore,
Baltimore City, Carroll, Harford, and Howard)• • • • • • •
5,884,563
Added counties (Montgomery and Prince George’s)
• • • •
Rest of state • • •Minnesota All counties • • • • • • • • • 5,379,139New Mexico All counties • 2,085,538New York Original sites (Genesee, Livingston, Monroe,
Ontario, Orleans, Wayne, and Yates)• • • • • • •
4,326,839
Added counties (Albany, Columbia, Greene, Montgomery, Rensselaer, Saratoga, Sche-nectady, and Schoharie)
• • • • • •
Added counties (Erie, Niagara, and Wyoming) • • •Added counties (Allegany, Cattaraugus, Chau-tauqua, Chemung, Schuyler, Seneca, Steuben, Warren, and Washington)
• •
Added counties (Clinton, Delaware, Essex, Franklin, Fulton, Hamilton, and Otsego)
•
Oregon All counties • • • • • • • • • 3,899,353Tennessee Original counties (Cheatham, Davidson, Dick-
son, Hamilton, Knox, Robertson, Rutherford, Shelby, Sumner, Williamson, and Wilson)
• • • • •6,456,243
Rest of state • •*Based on 2012 intercensal estimates, U.S. Census Bureau Total Surveillance 47,898,745
12
TABLE 2. Comparison of FoodNet Surveillance Population to U.S. Population, Overall and by Site —2012*
U.S. Population
Total FoodNet
Surveillance Population
CA** CO** CT GA MD MN NM NY** OR TN
# # # # # # # # # # # #Total population
313,914,040 47,898,745 3,460,180 2,896,598 3,590,347 9,919,945 5,884,563 5,379,139 2,085,538 4,326,839 3,899,353 6,456,243
Age <5 19,999,344 2,986,919 201,693 192,719 193,456 675,032 365,224 348,338 143,536 230,429 232,516 403,976
5–9 20,475,536 3,094,074 200,268 202,561 218,015 700,885 369,293 360,773 144,236 244,164 239,041 414,838
10–19 42,029,920 6,336,326 394,186 374,829 490,209 1,402,316 773,432 715,660 284,233 569,480 487,734 844,247
20–29 43,981,529 6,613,309 506,032 418,897 449,235 1,409,908 811,949 726,950 292,703 591,919 528,435 877,281
30–39 40,399,194 6,255,115 530,183 431,485 422,138 1,347,890 756,067 687,025 254,809 480,466 519,749 825,303
40–49 42,717,700 6,702,447 512,961 412,778 529,226 1,421,855 856,920 725,083 256,926 593,631 505,535 887,532
50–59 43,351,776 6,740,622 476,379 393,302 545,467 1,298,376 853,272 779,065 287,862 657,768 551,189 897,942
60–69 31,791,038 4,903,942 339,325 266,638 378,270 932,476 591,263 533,803 225,326 487,895 449,811 699,135
70–79 17,497,622 2,567,731 173,489 123,441 200,917 472,927 302,792 289,277 123,072 267,421 229,767 384,628
80+ 11,670,381 1,698,260 125,664 79,948 163,414 258,280 204,351 213,165 72,835 203,666 155,576 221,361
Sex Male 154,492,067 23,513,733 1,709,669 1,442,638 1,749,916 4,851,024 2,850,403 2,672,169 1,032,707 2,125,732 1,930,712 3,148,763
Female 159,421,973 24,385,012 1,750,511 1,453,960 1,840,431 5,068,921 3,034,160 2,706,970 1,052,831 2,201,107 1,968,641 3,307,480
Ethnicity Hispanic 53,027,708 5,551,748 747,002 640,548 510,645 909,902 512,010 264,359 979,722 200,671 474,157 312,732
Non-Hispanic 260,886,332 42,346,997 2,713,178 2,256,050 3,079,702 9,010,043 5,372,553 5,114,780 1,105,816 4,126,168 3,425,196 6,143,511
Race White 244,495,567 35,928,231 1,998,747 2,492,559 2,942,335 6,231,978 3,579,276 4,654,134 1,735,255 3,731,724 3,444,767 5,117,456
Black 41,204,793 7,683,980 353,192 160,113 401,496 3,091,904 1,766,990 297,962 51,087 385,694 77,564 1,097,978
Asian/Pacific Islander
16,853,049 2,559,618 906,395 121,550 154,170 362,795 358,021 238,326 36,992 100,794 171,925 108,650
Indian/Native Alaskan
3,857,495 581,422 35,949 40,466 17,688 50,539 32,275 68,961 213,081 26,261 68,955 27,247
Multiple 7,503,136 1,145,494 165,897 81,910 74,658 182,729 148,001 119,756 49,123 82,366 136,142 104,912
* Based on 2012 intercensal estimates, U.S. Census Bureau
** This FoodNet site includes only selected counties; California includes Alameda, San Francisco, and Contra Costa; Colorado includes Adams, Arapahoe, Denver, Douglas, Jefferson, Boulder, and Broomfield; New York includes Albany, Allegany, Cattaraugus, Chautauqua, Chemung, Clinton, Columbia, Delaware, Erie, Essex, Franklin, Fulton, Genesee, Greene, Ham-ilton, Livingston, Monroe, Montgomery, Niagara, Ontario, Orleans, Otsego, Rensselaer, Saratoga, Schenectady, Schoharie, Schuyler, Seneca, Steuben, Warren, Washington, Wayne, Wyoming, and Yates.
13
Figure 1. Foodborne Diseases Active Surveillance Network (FoodNet) Sites, 2012
WA
OR
CA
NV
AK
AZNM
TX
OK
KS
NE
SD
NDMT
ID
WY
COUT
HI
LA
AR
MO
IA
WI
MI
MI
IL INOH
KY
TN
MSAL
SC
NC
VA
PA
NY
ME
WVMD
NJDE
CT RI
MA
NH
VT
FL
GA
MN
San Francisco
Berkeley
Oakland
Denver
Boulder
Rochester
Buffalo
Albany
14
TABLE 3. Number of Laboratory-Confirmed Bacterial and Parasitic Infections, by Site and Pathogen — FoodNet, 2012
CA* CO* CT GA MD MN NM NY* OR TN TotalBacterial Campylobacter 1,188 399 599 795 605 951 319 612 895 449 6,812 Listeria** 18 4 22 16 16 6 5 14 15 7 123 Salmonella 483 264 455 2,681 906 781 327 501 387 1,057 7,842 Shigella 215 56 44 666 181 391 96 211 78 203 2,141 STEC† O157 39 37 19 34 33 123 15 69 95 69 533 STEC non-O157 24 42 32 94 38 114 41 47 73 52 557 Vibrio 27 8 24 29 47 15 1 11 18 17 197 Yersinia 7 4 23 29 10 23 2 24 22 15 159Parasitic Cryptosporidium 48 26 41 275 83 340 94 50 230 71 1,258 Cyclospora 1 6 2 3 1 2 15Total 2,049 841 1,265 4,621 1,922 2,744 900 1,539 1,814 1,942 19,637
* This FoodNet site includes only selected counties; California includes Alameda, San Francisco, and Contra Costa; Colorado includs Adams, Arapahoe, Denver, Douglas, Jefferson, Boulder, and Broomfield; New York includes Albany, Allegany, Cattaraugus, Chautauqua, Chemung, Clinton, Columbia, Delaware, Erie, Essex, Franklin, Fulton, Genesee, Greene, Hamilton, Livingston, Monroe, Montgomery, Niagara, Ontario, Orleans, Otsego, Rensselaer, Saratoga, Schenectady, Schoharie, Schuyler, Seneca, Steuben, Warren, Washington, Wayne, Wyoming, and Yates.
† Shiga toxin-producing Escherichia coli.
** Only includes isolates from sterile sites
TABLE 4. Incidence* of Cases of Bacterial and Parasitic Infections Compared with National Health Objectives†, by Site and Pathogen — FoodNet, 2012
CA† CO† CT GA MD MN NM NY† OR TN Overall 2012
National 2020 Health Objective§
BacteriaCampylobacter 34.33 13.77 16.68 8.01 10.28 17.68 15.30 14.14 22.95 6.95 14.22 8.50Listeria 0.52 0.14 0.61 0.16 0.27 0.11 0.24 0.32 0.38 0.11 0.26 0.20Salmonella 13.96 9.11 12.67 27.03 15.40 14.52 15.68 11.58 9.92 16.37 16.37 11.40Shigella 6.21 1.93 1.23 6.71 3.08 7.27 4.60 4.88 2.00 3.14 4.47 N/A¶STEC**O157 1.13 1.28 0.53 0.34 0.56 2.29 0.72 1.59 2.44 1.07 1.11 0.60STEC non-O157 0.69 1.45 0.89 0.95 0.65 2.12 1.97 1.09 1.87 0.81 1.16 N/A¶Vibrio 0.78 0.28 0.67 0.29 0.80 0.28 0.05 0.25 0.46 0.26 0.41 0.20Yersinia 0.20 0.14 0.64 0.29 0.17 0.43 0.10 0.55 0.56 0.23 0.33 0.30ParasitesCryptosporidium 1.39 0.90 1.14 2.77 1.41 6.32 4.51 1.16 5.90 1.10 2.63 N/A¶Cyclospora 0.00 0.03 0.17 0.02 0.05 0.00 0.00 0.00 0.03 0.03 0.03 N/A¶Surveillance population (millions) 3.46 2.90 3.59 9.92 5.88 5.38 2.09 4.33 3.90 6.46 47.90
* Rate per 100,000 population
† This FoodNet site includes only selected counties; California includes Alameda, San Francisco, and Contra Costa; Colorado includes Adams, Arapahoe, Denver, Douglas, Jefferson, Boulder, and Broomfield; New York includes Albany, Allegany, Cattaraugus, Chautauqua, Chemung, Clinton, Columbia, Delaware, Erie, Essex, Franklin, Fulton, Genesee, Greene, Hamilton, Livingston, Monroe, Montgomery, Niagara, Ontario, Orleans, Otsego, Rensselaer, Saratoga, Schenectady, Schoharie, Schuyler, Seneca, Steuben, Warren, Washington, Wayne, Wyoming, and Yates.
§ Healthy People 2020 objectives for incidence of Campylobacter, Listeria, Salmonella, Shiga toxin-producing Escherichia coliO157, Vibrio, Yersinia infections for year 2020.
¶ Not applicable, because no national health objective exists regarding infection with this pathogen.
** Shiga toxin-producing Escherichia coli.
15
TABLE 5. Number and Incidence* of FoodNet Pathogens, by Age, Sex, Race and Ethnicity—2012
Campylobacter Listeria Salmonella Shigella STEC† O157 STEC† non O157# Rate # Rate # Rate # Rate # Rate # Rate
Age (years) <5 728 24.37 6 0.20 1,938 64.88 513 17.17 144 4.82 146 4.89 5–9 325 10.50 0 0.00 597 19.29 454 14.67 71 2.29 41 1.33 10–19 602 9.50 2 0.03 718 11.33 189 2.98 106 1.67 106 1.67 20–29 967 14.62 9 0.14 786 11.89 252 3.81 67 1.01 92 1.39 30–39 905 14.47 4 0.06 719 11.49 272 4.35 33 0.53 44 0.70 40–49 923 13.77 9 0.13 776 11.58 199 2.97 25 0.37 23 0.34 50–59 980 14.54 23 0.34 857 12.71 137 2.03 29 0.43 37 0.55 60–69 777 15.84 21 0.43 701 14.29 73 1.49 27 0.55 37 0.75 70–79 377 14.68 18 0.70 472 18.38 28 1.09 20 0.78 16 0.62 80+ 225 13.25 31 1.83 273 16.08 24 1.41 11 0.65 15 0.88 Unknown 3 - 0 - 5 - 0 - 0 - 0 -Sex Female 3,130 12.84 78 0.32 4,086 16.76 1,035 4.24 277 1.14 311 1.28 Male 3,674 15.62 45 0.19 3,745 15.93 1,104 4.70 256 1.09 246 1.05 Unknown 8 - 0 - 11 - 2 - 0 - 0 -Ethnicity Hispanic 636 11.46 15 0.27 684 12.32 404 7.28 36 0.65 85 1.53 Non-Hispanic 4,399 10.39 94 0.22 5,637 13.31 1,424 3.36 443 1.05 419 0.99 Unknown 1,777 - 14 - 1,521 - 313 - 54 - 53 -Race Asian/Pacific Islander 318 12.42 14 0.55 370 14.46 58 2.27 17 0.66 10 0.39 Black 298 3.88 18 0.23 1,070 13.93 538 7.00 32 0.42 21 0.27 Indian/Native Alaskan 79 13.59 1 0.17 68 11.70 40 6.88 4 0.69 5 0.86 Multiple 55 4.80 0 0.00 89 7.77 38 3.32 10 0.87 2 0.17 Other 188 - 1 - 169 - 97 - 11 - 24 - Unknown 1,437 - 7 - 978 - 255 - 36 - 57 - White 4,437 12.35 82 0.23 5,098 14.19 1,115 3.10 423 1.18 438 1.22Total 6,812 14.22 123 0.26 7,842 16.37 2,141 4.47 533 1.11 557 1.16
* Rate per 100,000 population.† Shiga toxin-producing Escherichia coli.
16
TABLE 5a. Number and Incidence* of FoodNet Pathogens, by Age, Sex, Race, and Ethnicity—2012
Vibrio Yersinia Cryptosporidium Cyclospora# Rate # Rate # Rate # Rate
Age (years) <5 2 0.07 41 1.37 115 3.85 0 0.00 5–9 8 0.26 9 0.29 95 3.07 0 0.00 10–19 9 0.14 10 0.16 110 1.74 0 0.00 20–29 20 0.30 11 0.17 213 3.22 1 0.02 30–39 20 0.32 11 0.18 171 2.73 4 0.06 40–49 36 0.54 17 0.25 188 2.80 4 0.06 50–59 33 0.49 23 0.34 125 1.85 3 0.04 60–69 35 0.71 10 0.20 102 2.08 3 0.06 70–79 18 0.70 14 0.55 86 3.35 0 0.00 80+ 15 0.88 13 0.77 53 3.12 0 0.00 Unknown 1 - 0 - 0 - 0 -Sex Female 61 0.25 77 0.32 689 2.83 8 0.03 Male 136 0.58 82 0.35 569 2.42 7 0.03 Unknown 0 - 0 - 0 - 0 -Ethnicity Hispanic 10 0.18 15 0.27 87 1.57 0 0.00 Non-Hispanic 141 0.33 121 0.29 955 2.26 13 0.03 Unknown 46 - 23 - 216 - 2 -Race Asian/Pacific Islander 9 0.35 10 0.39 20 0.78 0 0.00 Black 22 0.29 13 0.17 131 1.70 1 0.01 Indian/Native Alaskan 0 0.00 0 0.00 9 1.55 0 0.00 Multiple 0 0.00 1 0.09 10 0.87 0 0.00 Other 0 - 4 - 21 - 0 - Unknown 25 - 22 - 138 - 2 - White 141 0.39 109 0.30 929 2.59 12 0.03Total 197 0.41 159 0.33 1,258 2.63 15 0.03
* Rate per 100,000 population.
17
Table 6. Number of Laboratory-Confirmed Campylobacter Infection by Species*, FoodNet 2012
Campylobacter Species Number of Cases* % of Campylobacter CasesC. jejuni 2444 35.88C. coli 223 3.27C. upsaliensis 53 0.78C. fetus 10 0.15C. lari 10 0.15C. hyointestinalis 1 0.01C. sputorum 1 0.01Not speciated 4070 59.75Total 6,812 100.00
*Species information represent Campylobacter isolates that were speciated at State Public Health Laboratory.
TABLE 7. Number and Incidence* of Laboratory-Confirmed Salmonella Infections Caused by the Top 20 Salmonella Serotypes, by Rank - FoodNet, 2012
Rank Salmonella Serotype Number of Cases % of Total Salmonella Cases Incidence Per 100,000 Persons2007 - 2011 2012
1 1 Enteritidis 1,239 15.8 2.62 2 Typhimurium** 922 11.8 1.93 3 Newport 907 11.6 1.94 4 Javiana 757 9.7 1.65 5 S. I 4,[5],12:i:-*** 340 4.3 0.78 6 Muenchen 191 2.4 0.4
15 7 Bareilly 183 2.3 0.49 7 Montevideo 183 2.3 0.46 9 Heidelberg 177 2.3 0.47 10 Saintpaul 163 2.1 0.3
11 11 Infantis 152 1.9 0.313 12 S. I 13,23:b:- 125 1.6 0.317 13 Thompson 105 1.3 0.210 14 Braenderup 100 1.3 0.213 15 Oranienburg 99 1.3 0.218 16 Mississippi 90 1.1 0.216 17 Typhi 57 0.7 0.125 18 Berta 55 0.7 0.121 19 Hadar 51 0.7 0.123 20 Hartford 47 0.6 0.1
Sub total 5,943 75.8 12.4All other serotyped isolates 1,126 14.4 2.4Not serotyped isolates 431 5.5 0.9Partially serotyped isolates 272 3.5 0.6Rough or nonmotile isolates 70 0.9 0.1Total 7,842 100 16.4
* Rate per 100,00 persons
** Typhimurium includes var.5- (Formerly var. Copenhagen)
*** Includes I 4,[5],12:i:- and I 4,5,12:i:-.
18
TABLE 8. Number and Incidence* of Laboratory-Confirmed STEC† non O157 Infections Caused by the Top Ten O Antigens, — FoodNet, 2012
Rank STEC O Antigen Number of Cases % total STEC non O157 Cases Incidence per 100,000 Persons1 O26 139 25.0 0.292 O103 120 21.5 0.253 O111 74 13.3 0.154 O121 41 7.4 0.095 O145 21 3.8 0.046 O118 20 3.6 0.047 O45 13 2.3 0.038 O186 9 1.6 0.028 O5 9 1.6 0.02
10 O71 8 1.4 0.02Undetermined 24 4.3Unknown 10 1.8All other 69 12.4Total 557
* Rate per 100,000 persons
† Shiga toxin-producing Escherichia coli.
TABLE 9. Number and Incidence* of Laboratory-Confirmed Shigella Infections, by Species — FoodNet, 2012
Shigella Species Number of Cases % of Total Shigella Cases Incidence per 100,000 PersonsS. sonnei 1,611 75.2 3.36S. flexneri 368 17.2 0.77S. boydii 14 0.7 0.03S. dysenteriae 4 0.2 0.01Unknown 144 6.7 0.30Total 2,141 100 4.47
* Rate per 100,000 persons
TABLE 10. Number and Incidence* of Laboratory-Confirmed Vibrio Infections, by Species — FoodNet, 2012
Vibrio species Number of Cases % of Total Vibrio Cases Incidence per 100,000 PersonsV. parahaemolyticus 113 57.4 0.24V. vulnificus 26 13.2 0.05V. alginolyticus 21 10.7 0.04V. fluvialis 12 6.1 0.03V. cholerae non-O1. non-O139 7 3.6 0.01Grimontia hollisae 4 2.0 0.01V. mimicus 3 1.5 0.01V. metschnikovii 2 1.0 0.00V. cholerae O1 1 0.5 0.00V. cholerae unspecified 1 0.5 0.00Unknown 7 3.6 0.01Total 197 100 0.41
*Rate per 100,000 persons
19
FIGURE 2. Incidence of Campylobacter, Salmonella, and Shigella Infections, by Age Group — FoodNet, 2012
FIGURE 3. Incidence of Cryptosporidium, Listeria, and Yersinia Infections, by Age Group — FoodNet, 2012
20
FIGURE 4. Incidence of STEC* O157 and STEC non-O157 Infections, by Age Group — FoodNet, 2012
*Shiga toxin-producing Escherichia coli
TABLE 11. Number and Percentage of Cases Hospitalized, by Pathogen — FoodNet, 2012
# Hospitalized # Outpatient # Unknown Total # of Cases % HospitalizedBacteria Campylobacter 1,054 5,119 639 6,812 15.5 Listeria 118 5 0 123 95.9 Salmonella 2,297 5,292 253 7,842 29.3 Shigella 492 1,605 44 2,141 23.0 STEC* O157 192 337 4 533 36.0 STEC non-O157 88 463 6 557 15.8 Vibrio 56 138 3 197 28.4 Yersinia 59 98 2 159 37.1Parasites Cryptosporidium 241 998 19 1,258 19.2 Cyclospora 3 12 0 15 20.0Total 4,600 14,067 970 19,637 23.4*Shiga toxin-producing Escherichia coli.
21
TABLE 12. Number and Percentage of Cases Hospitalized, by Age Group and Pathogen — FoodNet, 2012
<5 years 5–9 years# Hospitalized # Unknown Total # of Cases % Hospitalized # Hospitalized # Unknown Total # of Cases % Hospitalized
Bacteria Campylobacter 65 65 728 8.9 26 28 325 8.0 Listeria 6 0 6 100.0 0 0 0 0.0 Salmonella 428 63 1,938 22.1 120 14 597 20.1 Shigella 82 10 513 16.0 84 10 454 18.5 STEC* O157 48 0 144 33.3 29 1 71 40.8 STEC non-O157 12 1 146 8.2 6 0 41 14.6 Vibrio 0 0 2 0.0 0 0 8 0.0 Yersinia 11 2 41 26.8 7 0 9 77.8Parasites Cryptosporidium 14 0 115 12.2 16 1 95 16.8 Cyclospora 0 0 0 0.0 0 0 0 0.0Total 666 141 3,633 19.1 288 54 1,600 18.0
10–19 years 20–29 years# Hospitalized # Unknown Total # of Cases % Hospitalized # Hospitalized # Unknown Total # of Cases % Hospitalized
Bacteria Campylobacter 90 65 602 15.0 120 94 967 12.4 Listeria 2 0 2 100.0 9 0 9 100.0 Salmonella 145 21 718 20.2 162 30 786 20.6 Shigella 38 1 189 20.1 80 8 252 31.7 STEC* O157 32 1 106 30.2 13 2 67 19.4 STEC non-O157 11 2 106 10.4 18 2 92 19.6 Vibrio 2 0 9 22.2 2 1 20 10.0 Yersinia 3 0 10 30.0 4 0 11 36.4Parasites Cryptosporidium 10 1 110 9.1 33 4 213 15.5 Cyclospora 0 0 0 0.0 0 0 1 0.0Total 333 91 1,852 18.0 441 141 2,418 19.4
30–39 years# Hospitalized # Unknown Total # of Cases % Hospitalized
Bacteria Campylobacter 113 92 905 12.5 Listeria 4 0 4 100.0 Salmonella 176 26 719 24.5 Shigella 69 6 272 25.4 STEC* O157 12 0 33 36.4 STEC non-O157 8 1 44 18.2 Vibrio 4 0 20 20.0 Yersinia 1 0 11 9.1Parasites Cryptosporidium 23 5 171 13.5 Cyclospora 2 0 4 50.0Total 412 130 2,183 18.9
*Shiga toxin-producing Escherichia coli.
22
TABLE 12a. Number and Percentage of Cases Hospitalized, by Age Group and Pathogen — FoodNet, 2012
40–49 years 50–59 years# Hospitalized # Unknown Total # of Cases % Hospitalized # Hospitalized # Unknown Total # of Cases % Hospitalized
Bacteria Campylobacter 118 91 923 12.8 158 85 980 16.1 Listeria 7 0 9 77.8 23 0 23 100.0 Salmonella 225 30 776 29.0 303 28 857 35.4 Shigella 49 8 199 24.6 48 1 137 35.0 STEC* O157 8 0 25 32.0 14 0 29 48.3 STEC non-O157 6 0 23 26.1 5 0 37 13.5 Vibrio 6 0 36 16.7 9 2 33 27.3 Yersinia 4 0 17 23.5 8 0 23 34.8Parasites Cryptosporidium 45 2 188 23.9 31 3 125 24.8 Cyclospora 0 0 4 0.0 0 0 3 0.0Total 468 131 2,200 21.3 599 119 2,247 26.7
60–69 years 70–79 years# Hospitalized # Unknown Total # of Cases % Hospitalized # Hospitalized # Unknown Total # of Cases % Hospitalized
Bacteria Campylobacter 148 70 777 19.0 100 36 377 26.5 Listeria 19 0 21 90.5 17 0 18 94.4 Salmonella 309 22 701 44.1 261 9 472 55.3 Shigella 21 0 73 28.8 12 0 28 42.9 STEC* O157 15 0 27 55.6 13 0 20 65.0 STEC non-O157 9 0 37 24.3 8 0 16 50.0 Vibrio 12 0 35 34.3 11 0 18 61.1 Yersinia 7 0 10 70.0 6 0 14 42.9Parasites Cryptosporidium 24 2 102 23.5 17 1 86 19.8 Cyclospora 1 0 3 33.3 0 0 0 0.0Total 565 94 1,786 31.6 445 46 1,049 44.4
80+ years# Hospitalized # Unknown Total # of Cases % Hospitalized
Bacteria Campylobacter 115 11 225 51.1 Listeria 31 0 31 100.0 Salmonella 168 7 273 61.5 Shigella 9 0 24 37.5 STEC* O157 8 0 11 72.7 STEC non-O157 5 0 15 33.3 Vibrio 10 0 15 66.7 Yersinia 8 0 13 61.5Parasites Cryptosporidium 28 0 53 52.8 Cyclospora 0 0 0 0.0Total 382 18 660 57.9
*Shiga toxin-producing Escherichia coli.
23
TABLE 13. Number and Percentage of Cases Hospitalized, by Site and Pathogen — FoodNet, 2012
California* Colorado*#
Hospitalized#
Outpatient#
UnknownTotal # of
Cases%
Hospitalized#
Hospitalized#
Outpatient#
UnknownTotal # of
Cases%
HospitalizedBacteria Campylobacter 114 651 423 1188 9.6 56 338 5 399 14.0 Listeria 18 0 0 18 100.0 4 0 0 4 100.0 Salmonella 103 354 26 483 21.3 72 192 0 264 27.3 Shigella 42 158 15 215 19.5 11 45 0 56 19.6 STEC† O157 11 28 0 39 28.2 15 21 1 37 40.5 STEC non-O157 3 18 3 24 12.5 5 36 1 42 11.9 Vibrio 0 25 2 27 0.0 0 8 0 8 0.0 Yersinia 4 2 1 7 57.1 2 2 0 4 50.0Parasites Cryptosporidium 7 32 9 48 14.6 5 20 1 26 19.2 Cyclospora 0 0 0 0 0.0 1 0 0 1 100.0Total 302 1,268 479 2,049 14.7 171 662 8 841 20.3
Connecticut Georgia#
Hospitalized#
Outpatient#
UnknownTotal # of
Cases%
Hospitalized#
Hospitalized#
Outpatient#
UnknownTotal # of
Cases%
HospitalizedBacteria Campylobacter 103 487 9 599 17.2 151 633 11 795 19.0 Listeria 22 0 0 22 100.0 15 1 0 16 93.8 Salmonella 115 338 2 455 25.3 793 1863 25 2681 29.6 Shigella 12 32 0 44 27.3 172 488 6 666 25.8 STEC† O157 6 13 0 19 31.6 16 18 0 34 47.1 STEC non-O157 8 24 0 32 25.0 8 86 0 94 8.5 Vibrio 7 17 0 24 29.2 11 18 0 29 37.9 Yersinia 9 14 0 23 39.1 11 18 0 29 37.9Parasites Cryptosporidium 5 36 0 41 12.2 87 186 2 275 31.6 Cyclospora 1 5 0 6 16.7 0 2 0 2 0.0Total 288 966 11 1,265 22.8 1,264 3,313 44 4,621 27.4
Maryland#
Hospitalized#
Outpatient#
UnknownTotal # of
Cases%
HospitalizedBacteria Campylobacter 96 469 40 605 15.9 Listeria 15 1 0 16 93.8 Salmonella 300 566 40 906 33.1 Shigella 48 133 0 181 26.5 STEC† O157 14 19 0 33 42.4 STEC non-O157 8 30 0 38 21.1 Vibrio 17 30 0 47 36.2 Yersinia 4 6 0 10 40.0Parasites Cryptosporidium 38 43 2 83 45.8 Cyclospora 1 2 0 3 33.3Total 541 1,299 82 1,922 28.1
* This FoodNet site includes only selected counties; California includes Alameda, San Francisco, and Contra Costa; Colorado includes Adams, Arapahoe, Denver, Douglas, Jefferson, Boulder, and Broomfield.
† Shiga toxin-producing Escherichia coli.
24
TABLE 13a. Number and Percentage of Cases Hospitalized, by Site and Pathogen — FoodNet, 2012Minnesota New Mexico
# Hospitalized
# Outpatient
# Unknown
Total # of Cases
% Hospitalized
# Hospitalized
# Outpatient
# Unknown
Total # of Cases
% Hospitalized
Bacteria Campylobacter 168 783 0 951 17.7 74 238 7 319 23.2 Listeria 6 0 0 6 100.0 5 0 0 5 100.0 Salmonella 202 579 0 781 25.9 101 221 5 327 30.9 Shigella 56 335 0 391 14.3 29 66 1 96 30.2 STEC† O157 39 84 0 123 31.7 6 9 0 15 40.0 STEC non-O157 18 96 0 114 15.8 13 28 0 41 31.7 Vibrio 6 9 0 15 40.0 0 1 0 1 0.0 Yersinia 2 21 0 23 8.7 0 2 0 2 0.0Parasites Cryptosporidium 37 303 0 340 10.9 27 66 1 94 28.7 Cyclospora 0 0 0 0 0.0 0 0 0 0 0.0Total 534 2,210 0 2,744 19.5 255 631 14 900 28.3
New York* Oregon#
Hospitalized#
Outpatient#
UnknownTotal # of
Cases%
Hospitalized#
Hospitalized#
Outpatient#
UnknownTotal # of
Cases%
HospitalizedBacteria Campylobacter 109 499 4 612 17.8 72 726 97 895 8.0 Listeria 14 0 0 14 100.0 15 0 0 15 100.0 Salmonella 167 331 3 501 33.3 97 290 0 387 25.1 Shigella 54 157 0 211 25.6 12 66 0 78 15.4 STEC† O157 25 43 1 69 36.2 30 65 0 95 31.6 STEC non-O157 10 37 0 47 21.3 10 63 0 73 13.7 Vibrio 4 7 0 11 36.4 5 13 0 18 27.8 Yersinia 15 9 0 24 62.5 6 16 0 22 27.3Parasites Cryptosporidium 5 45 0 50 10.0 10 219 1 230 4.3 Cyclospora 0 0 0 0 0.0 0 1 0 1 0.0Total 403 1,128 8 1,539 26.2 257 1,459 98 1,814 14.2
Tennessee#
Hospitalized#
Outpatient#
UnknownTotal # of
Cases%
HospitalizedBacteria Campylobacter 111 295 43 449 24.7 Listeria 4 3 0 7 57.1 Salmonella 347 558 152 1057 32.8 Shigella 56 125 22 203 27.6 STEC† O157 30 37 2 69 43.5 STEC non-O157 5 45 2 52 9.6 Vibrio 6 10 1 17 35.3 Yersinia 6 8 1 15 40.0Parasites Cryptosporidium 20 48 3 71 28.2 Cyclospora 0 2 0 2 0.0Total 585 1,131 226 1,942 30.1
* This FoodNet site includes only the Greene, Hamilton, Livingston, Monroe, Montgomery, Niagara, Ontario, Orleans, Otsego, Rensselaer, Saratoga, Schenectady, Schoharie, Schuyler, Seneca, Steuben, Warren, Washington, Wayne, Wyoming, and Yates.
† Shiga toxin-producing Escherichia coli.
25
TABLE 14. Number of Deaths and Case Fatality Rate (CFR), by Pathogen — FoodNet, 2012
# Deaths # Unknown Total # of Cases CFRBacteria Campylobacter 6 694 6,812 0.09 Listeria 14 0 123 11.38 Salmonella 32 245 7,842 0.41 Shigella 3 86 2,141 0.14 STEC*O157 1 5 533 0.19 STEC non-O157 1 5 557 0.18 Vibrio 6 4 197 3.05 Yersinia 0 3 159 0.00Parasites Cryptosporidium 6 30 1,258 0.48 Cyclospora 0 0 15 0.00Total 69 1,072 19,637 0.35
*Shiga toxin-producing Escherichia coli
26
TABLE 15. Number of Deaths and Case Fatality Rate (CFR), by Age Group and Pathogen — FoodNet, 2012
<5 years 5–9 years# Deaths # Unknown Total # of Cases CFR # Deaths # Unknown Total # of Cases CFR
Bacteria Campylobacter 0 67 728 0.00 0 37 325 0.00 Listeria 0 0 6 0.00 0 0 0 0.00 Salmonella 0 67 1938 0.00 1 23 597 0.17 Shigella 0 18 513 0.00 1 15 454 0.22 STEC* O157 0 1 144 0.00 0 1 71 0.00 STEC non-O157 0 2 146 0.00 0 0 41 0.00 Vibrio 0 0 2 0.00 0 0 8 0.00 Yersinia 0 1 41 0.00 0 0 9 0.00Parasites Cryptosporidium 0 2 115 0.00 0 1 95 0.00 Cyclospora 0 0 0 0.00 0 0 0 0.00Total 0 158 3,633 0.00 2 77 1,600 0.13
10–19 years 20–29 years# Deaths # Unknown Total # of Cases CFR # Deaths # Unknown Total # of Cases CFR
Bacteria Campylobacter 0 66 602 0.00 0 114 967 0.00 Listeria 0 0 2 0.00 0 0 9 0.00 Salmonella 1 22 718 0.14 1 31 786 0.13 Shigella 1 6 189 0.53 0 10 252 0.00 STEC* O157 0 2 106 0.00 0 1 67 0.00 STEC non-O157 0 1 106 0.00 1 2 92 1.09 Vibrio 0 0 9 0.00 0 1 20 0.00 Yersinia 0 0 10 0.00 0 0 11 0.00Parasites Cryptosporidium 0 2 110 0.00 1 8 213 0.47 Cyclospora 0 0 0 0.00 0 0 1 0.00Total 2 99 1,852 0.11 3 167 2,418 0.12
30–39 years# Deaths # Unknown Total # of Cases CFR
Bacteria Campylobacter 1 116 905 0.11 Listeria 0 0 4 0.00 Salmonella 1 27 719 0.14 Shigella 0 15 272 0.00 STEC* O157 0 0 33 0.00 STEC non-O157 0 0 44 0.00 Vibrio 1 0 20 5.00 Yersinia 0 0 11 0.00Parasites Cryptosporidium 1 5 171 0.58 Cyclospora 0 0 4 0.00Total 4 163 2,183 0.18
*Shiga toxin-producing Escherichia coli.
27
TABLE 15a. Number of Deaths and Case Fatality Rate, by Age Group and Pathogen — FoodNet, 2012
40–49 years 50–59 years# Deaths # Unknown Total # of Cases CFR # Deaths # Unknown Total # of Cases CFR
Bacteria Campylobacter 1 95 923 0.11 2 89 980 0.20 Listeria 3 0 9 33.33 3 0 23 13.04 Salmonella 3 22 776 0.39 4 26 857 0.47 Shigella 0 14 199 0.00 0 4 137 0.00 STEC* O157 0 0 25 0.00 0 0 29 0.00 STEC non-O157 0 0 23 0.00 0 0 37 0.00 Vibrio 0 0 36 0.00 2 2 33 6.06 Yersinia 0 1 17 0.00 0 1 23 0.00Parasites Cryptosporidium 0 5 188 0.00 2 2 125 1.60 Cyclospora 0 0 4 0.00 0 0 3 0.00Total 7 137 2,200 0.32 13 124 2,247 0.58
60–69 years 70–79 years# Deaths # Unknown Total # of Cases CFR # Deaths # Unknown Total # of Cases CFR
Bacteria Campylobacter 0 65 777 0.00 0 34 377 0.00 Listeria 1 0 21 4.76 1 0 18 5.56 Salmonella 8 14 701 1.14 5 6 472 1.06 Shigella 0 4 73 0.00 0 0 28 0.00 STEC* O157 0 0 27 0.00 1 0 20 5.00 STEC non-O157 0 0 37 0.00 0 0 16 0.00 Vibrio 2 1 35 5.71 1 0 18 5.56 Yersinia 0 0 10 0.00 0 0 14 0.00Parasites Cryptosporidium 1 2 102 0.98 0 1 86 0.00 Cyclospora 0 0 3 0.00 0 0 0 0.00Total 12 86 1,786 0.67 8 41 1,049 0.76
80+ years# Deaths # Unknown Total # of Cases CFR
Bacteria Campylobacter 2 9 225 0.89 Listeria 6 0 31 19.35 Salmonella 8 5 273 2.93 Shigella 1 0 24 4.17 STEC* O157 0 0 11 0.00 STEC non-O157 0 0 15 0.00 Vibrio 0 0 15 0.00 Yersinia 0 0 13 0.00Parasites Cryptosporidium 1 2 53 1.89 Cyclospora 0 0 0 0.00Total 18 16 660 2.73
*Shiga toxin-producing Escherichia coli.
28
TABLE 16. Number of Deaths and Case Fatality Rate (CFR), by Site and Pathogen — FoodNet, 2012
California* Colorado*#
Deaths#
UnknownTotal #
of Cases CFR # Hospitalized
# Unknown
Total # of Cases CFR
Bacteria Campylobacter 0 569 1188 0.00 1 0 399 0.25 Listeria 2 0 18 11.11 0 0 4 0.00 Salmonella 1 32 483 0.21 1 0 264 0.38 Shigella 0 20 215 0.00 0 0 56 0.00 STEC† O157 0 0 39 0.00 0 0 37 0.00 STEC non-O157 1 2 24 4.17 0 0 42 0.00 Vibrio 0 2 27 0.00 0 0 8 0.00 Yersinia 0 3 7 0.00 0 0 4 0.00Parasites Cryptosporidium 0 9 48 0.00 0 0 26 0.00 Cyclospora 0 0 0 0.00 0 0 1 0.00Total 4 637 2,049 0.20 2 0 841 0.24
Connecticut Georgia#
Deaths#
UnknownTotal #
of Cases CFR # Hospitalized
# Unknown
Total # of Cases CFR
Bacteria Campylobacter 0 0 599 0.00 2 63 795 0.25 Listeria 2 0 22 9.09 4 0 16 25.00 Salmonella 3 0 455 0.66 9 133 2,681 0.34 Shigella 0 0 44 0.00 1 60 666 0.15 STEC† O157 0 0 19 0.00 1 3 34 2.94 STEC non-O157 0 0 32 0.00 0 3 94 0.00 Vibrio 1 0 24 4.17 1 0 29 3.45 Yersinia 0 0 23 0.00 0 0 29 0.00Parasites Cryptosporidium 0 0 41 0.00 0 18 275 0.00 Cyclospora 0 0 6 0.00 0 0 2 0.00Total 6 0 1,265 0.47 18 280 4,621 0.39
Maryland#
Deaths#
UnknownTotal #
of Cases CFR
Bacteria Campylobacter 1 24 605 0.17 Listeria 1 0 16 6.25 Salmonella 3 21 906 0.33 Shigella 1 0 181 0.55 STEC† O157 0 0 33 0.00 STEC non-O157 0 0 38 0.00 Vibrio 0 0 47 0.00 Yersinia 0 0 10 0.00Parasites Cryptosporidium 3 1 83 3.61 Cyclospora 0 0 3 0.00Total 9 46 1,922 0.47
* This FoodNet site includes only selected counties; California includes Alameda, San Francisco, and Contra Costa; Colorado includes Adams, Arapahoe, Denver, Douglas, Jefferson, Boulder, and Broomfield.
† Shiga toxin-producing Escherichia coli.
29
TABLE 16a. Number of Deaths and Case Fatality Rate (CFR), by Site and Pathogen — FoodNet, 2012 Minnesota New Mexico
# Deaths
# Unknown
Total # of Cases CFR #
Deaths#
Unknown Total # of Cases CFR
Bacteria Campylobacter 0 0 951 0.00 1 7 319 0.31 Listeria 2 0 6 33.33 0 0 5 0.00 Salmonella 3 0 781 0.38 1 5 327 0.31 Shigella 1 0 391 0.26 0 1 96 0.00 STEC† O157 0 0 123 0.00 0 0 15 0.00 STEC non-O157 0 0 114 0.00 0 0 41 0.00 Vibrio 2 0 15 13.33 0 0 1 0.00 Yersinia 0 0 23 0.00 0 0 2 0.00Parasites Cryptosporidium 1 0 340 0.29 1 1 94 1.06 Cyclospora 0 0 0 0.00 0 0 0 0.00Total 9 0 2,744 0.33 3 14 900 0.33
New York* Oregon#
Deaths#
UnknownTotal #
of Cases CFR # Deaths
# Unknown
Total # of Cases CFR
Bacteria Campylobacter 1 0 612 0.16 0 0 895 0.00 Listeria 2 0 14 14.29 2 0 15 13.33 Salmonella 4 0 501 0.80 4 0 387 1.03 Shigella 0 0 211 0.00 0 0 78 0.00 STEC† O157 0 0 69 0.00 0 0 95 0.00 STEC non-O157 0 0 47 0.00 0 0 73 0.00 Vibrio 1 0 11 9.09 0 0 18 0.00 Yersinia 0 0 24 0.00 0 0 22 0.00Parasites Cryptosporidium 0 0 50 0.00 1 0 230 0.43 Cyclospora 0 0 0 0.00 0 0 1 0.00Total 8 0 1,539 0.52 7 0 1,814 0.39
Tennessee#
Deaths#
UnknownTotal #
of Cases CFR
Bacteria Campylobacter 0 31 449 0.00 Listeria 0 0 7 0.00 Salmonella 3 54 1057 0.28 Shigella 0 5 203 0.00 STEC† O157 0 2 69 0.00 STEC non-O157 0 0 52 0.00 Vibrio 1 2 17 5.88 Yersinia 0 0 15 0.00Parasites Cryptosporidium 0 1 71 0.00 Cyclospora 0 0 2 0.00Total 4 95 1,942 0.21
* This FoodNet site includes only the Greene, Hamilton, Livingston, Monroe, Montgomery, Niagara, Ontario, Orleans, Otsego, Rensselaer, Saratoga, Schenectady, Schoharie, Schuyler, Seneca, Steuben, Warren, Washington, Wayne, Wyoming, and Yates.
† Shiga toxin-producing Escherichia coli.
30
TABL
E 17
. Out
brea
k-Re
late
d Ca
ses,
by
Path
ogen
— F
oodN
et, 2
012
Tota
l Num
ber
of Ca
ses
Repo
rted
Outb
reak
-Re
late
d Ca
ses
Food
born
eW
ater
born
eAn
imal
Co
ntac
tPe
rson
-to-
Pers
onNo
n
Food
born
e
Envi
ronm
enta
l Co
ntam
inat
ion
Othe
r Tha
n Fo
od/
Wat
er
Inde
term
inat
e/Ot
her/U
nkno
wn
#%
#%
#%
#%
#%
#%
#%
#%
Bact
eria
Cam
pylo
bacte
r6,8
1241
0.633
80.5
00.0
49.8
00.0
00.0
00.0
49.8
List
eria
123
32.4
310
0.00
0.00
0.00
0.00
0.00
0.00
0.0 S
alm
onell
a7,8
4245
75.8
337
73.7
00.0
4610
.116
3.50
0.05
1.153
11.6
Shi
gella
2,141
182
8.50
0.00
0.00
0.017
194
.00
0.00
0.011
6.0 S
TEC*
O15
753
311
722
.055
47.0
00.0
10.9
4034
.20
0.00
0.021
17.9
STE
C non
-O15
755
711
2.02
18.2
00.0
327
.33
27.3
00.0
00.0
327
.3 V
ibrio
197
126.1
1210
0.00
0.00
0.00
0.00
0.00
0.00
0.0 Y
ersin
ia15
90
0.00
0.00
0.00
0.00
0.00
0.00
0.00
0.0Pa
rasit
es C
rypt
ospo
ridiu
m1,2
5854
4.30
0.035
64.8
1018
.56
11.1
00.0
00.0
35.6
Cyc
losp
ora
150
0.00
0.00
0.00
0.00
0.00
0.00
0.00
0.0To
tal
19,6
3787
74.
544
250
.435
4.0
647.
323
626
.90
0.0
50.
695
10.8
* Sh
iga to
xin-p
rodu
cing E
scheri
chia
coli.
31
TABLE 18. Frequency of International Travel, by Pathogen — FoodNet, 2012Total Cases Reported
Total Cases With Travel Information Traveled Did not travel Unknown travel
# # % # %* # %* # %Bacteria Campylobacter 6,812 4,652 68.3 739 15.9 3,913 84.1 2,160 31.7 Listeria 123 113 91.9 1 0.9 112 99.1 10 8.1 Salmonella 7,842 6,012 76.7 535 8.9 5,477 91.1 1,830 23.3 Shigella 2,141 1,688 78.8 174 10.3 1,514 89.7 453 21.2 STEC* O157 533 514 96.4 13 2.5 501 97.5 19 3.6 STEC non-O157 557 528 94.8 66 12.5 462 87.5 29 5.2 Vibrio 197 174 88.3 6 3.4 168 96.6 23 11.7 Yersinia 159 130 81.8 8 6.2 122 93.8 29 18.2 Parasites Cryptosporidium 1,258 992 78.9 115 11.6 877 88.4 266 21.1 Cyclospora 15 15 100.0 4 26.7 11 73.3 0 0.0 Total 19,637 14,818 75.5 1,661 11.2 13,157 88.8 4,819 24.5
* Among cases with known travel status
† Shiga toxin-producing Escherichia coli.
FIGURE 5. Seasonality of Campylobacter, Cryptosporidium, Salmonella, and Shigella Infections — FoodNet, 2012
32
FIGURE 6. Seasonality of Cyclospora, Listeria, Vibrio, and Yersinia Infections — FoodNet, 2012
FIGURE 7. Seasonality of STEC* O157 and STEC non-O157 Infections — FoodNet, 2012
* Shiga toxin-producing Escherichia coli
33
Figure 8. Percentage Change in Incidence of Laboratory-Confirmed Bacterial and Parasitic Infections in 2012 Compared with Average Annual Incidence during 2006–2008, by Pathogen, FoodNet
* No significant change = 95% confidence interval is both above and below the no change line; significant increase = estimate and entire 95% confidence interval are above the no change line; significant decrease = estimate and entire 95% confidence interval are below the no change line.
† Shiga toxin-producing Escherichia coli.
34
Figure 9. Relative Rates of Laboratory-Confirmed Infections with Campylobacter, Listeria, Salmonella, STEC* O157, and Vibrio Compared with 1996–1998 Rates, by Year, FoodNet 1996–2012†
* Shiga toxin-producing Escherichia coli.
† The position of each line indicates the relative change in the incidence of that pathogen compared with 1996–1998. The actual incidences of these infections cannot be determined from this graph.
Figure 10. Relative Rates of Laboratory-Confirmed Infections with Cryptosporidium, Shigella and Yersinia Compared with 1996–1998 Rates, by Year, FoodNet 1996–2012*
* The position of each line indicates the relative change in the incidence of that pathogen compared with 1996–1998. The actual incidences of these infections cannot be determined from this graph.
35
Table 19. Summary of Post-Diarrheal Hemolytic Uremic Syndrome (HUS) Cases, All Ages — FoodNet, 1997-2011
Number of Post-diarrheal HUS Cases Median Age (range) Number (%) Female 1997-2010 1078 4.4 (0–89) 623 (58%)2011 77 5.3 (0–86) 45 (58%)
Median Days (range) of Hospitalization Number (%) of Deaths Number (%) of Cases
occurring June-September1997-2010 12.0 (0–152) 54 (5%) 634 (59%)2011 14 (2–61) 3 (4%) 39 (51%)
Table 20. Results of Microbiologic Testing for Shiga Toxin-producing Escherichia coli (STEC) Infection among Post-Diarrheal HUS Case-Patients, 1997–2011
1997-2010 2011No. (%) Total No. (%) Total
Diarrhea in 3 weeks before HUS diagnosis / Total patients 1078 (88%) 1220 77 (93%) 83Stool specimen obtained/ Total patients with diarrhea 1027 (95%) 1078 77 (100%) 77Stool tested for Shiga toxin/ Patients with stool specimen obtained 533 (52%) 1027 65 (84%) 77
Stool cultured for E. coli O157/ Patients with stool specimens obtained 973 (95%) 1027 73 (95%) 77 E. coli O157 isolated from stool/ Patients with stool cultured for E. coli O157 561*** (58%) 973 50** (68%) 73
Isolation of non-O157 STEC/ Patients with stool specimen obtained and no evidence of E. coli O157 25 (5%) 466 2 (7%) 27
Serum positive for antibodies against E. coli / Patients with serum tested for antibodies against E. coli and no evidence of STEC in stool† 93 (21%)* 433 6 (24%)‡ 25
Stool positive for Shiga toxin/ Patients with stool tested for Shiga toxin and no other evidence of STEC 14 (12%) 117 0 (0%) 14
Total with evidence of STEC/Diarrhea in 3 weeks before HUS diagnosis 693 (64%) 1078 58 (75%) 77† Information on serum specimens was not collected before 2000
* Of the 93 positive serum samples, 90 had antibodies against E. coli O157 lipopolysacchride (LPS); three had antibodies against E. coli O111 LPS
‡ All 6 positive serum samples had antibodies against E. coli O157 LPS
** One patient additionally had O103 isolated from stool
*** One patient additionally had O26 isolated from stool
36
Table 21. Number and Incidence Rate* of Post-diarrheal Pediatric HUS cases†, by Site and Age Group, 1997–2011
State Age <5 years Age 5–14 years Age 15–17 years Age <18 years# Rate # Rate # Rate # Rate
CA 43 1.50 20 0.35 0 0.00 63 0.62CO 35 1.71 24 0.62 2 0.17 61 0.86CT 36 1.13 36 0.50 2 0.09 74 0.59GA 83 0.95 28 0.16 4 0.07 115 0.37MD 34 0.79 24 0.25 4 0.12 62 0.37MN 122 2.27 58 0.54 3 0.09 183 0.95NM 15 1.31 6 0.27 0 0.00 21 0.51NY 41 1.51 24 0.38 5 0.23 70 0.64OR 98 2.87 35 0.49 5 0.22 138 1.08TN 118 2.61 51 0.57 4 0.13 173 1.05Total 625 1.68 306 0.41 29 0.11 960 0.70
* Cases per 100,000 population.
† Includes cases among persons residing within catchment area only.
§ HUS surveillance started in CO in 2001; MD in 1999; NM in 2004; NY in 1998, and TN in 2000.
Figure 11. Comparison of Incidence Rates of Shiga Toxin-producing E. coli (STEC) and Post-diarrheal Pediatric Hemolytic Uremic Syndrome (HUS) — 1997-2011*
* Non-O157 STEC became a nationally notifiable disease in 2000.