Embed Size (px)
Citation preview

U.S. Department of TransportationFederal Aviation Administration
COMPUTER TESTING SUPPLEMENTFOR
COMMERCIAL PILOT
FAA-CT-8080-1C
DO NOT MARK IN THIS BOOK
CT-8080-10A_Cover 04/18/2005, 12:50 PM1

i
COMPUTER TESTING SUPPLEMENTFOR
COMMERCIAL PILOT
2005
U.S. DEPARTMENT OF TRANSPORTATION
FEDERAL AVIATION ADMINISTRATIONFlight Standards Service
CT-8080-1C FrontPages 04/18/2005, 12:19 PM1

ii
CT-8080-1C FrontPages 04/18/2005, 12:19 PM2

iii
PREFACE
This computer testing supplement is designed by the Flight Standards Service of the Federal Aviation Administration(FAA) for use by computer testing designees (CTDs)and testing centers in the administration of airman knowledge testsin the following knowledge areas:
Commercial Pilot—Airplane (CAX)Commercial Pilot—Glider (CGX)Commercial Pilot—Lighter-Than-Air–Airship (CLA)Commercial Pilot—Rotorcraft/Gyroplane (CRG)Commercial Pilot—Rotorcraft/Helicopter (CRH)Commercial Pilot—Balloon Gas (CBG)Commercial Pilot—Balloon–Hot Air (CBH)Military Competence—Airplane (MCA)Military Competence—Rotorcraft/Helicopter (MCH)
FAA-CT-8080-1C supercedes FAA-CT-8080-1B, Computer Testing Supplement for Commercial Pilot, dated 1998.
Comments regarding this supplement should be sent to:
U.S. Department of TransportationFederal Aviation AdministrationFlight Standards ServiceAirman Testing Standards Branch, AFS-630P.O. Box 25082Oklahoma City, OK 73125
CT-8080-1C FrontPages 04/18/2005, 12:19 PM3

iv
CT-8080-1C FrontPages 04/18/2005, 12:19 PM4

v
CONTENTS
Preface ................................................................................................................................................................ iiiContents ............................................................................................................................................................... v
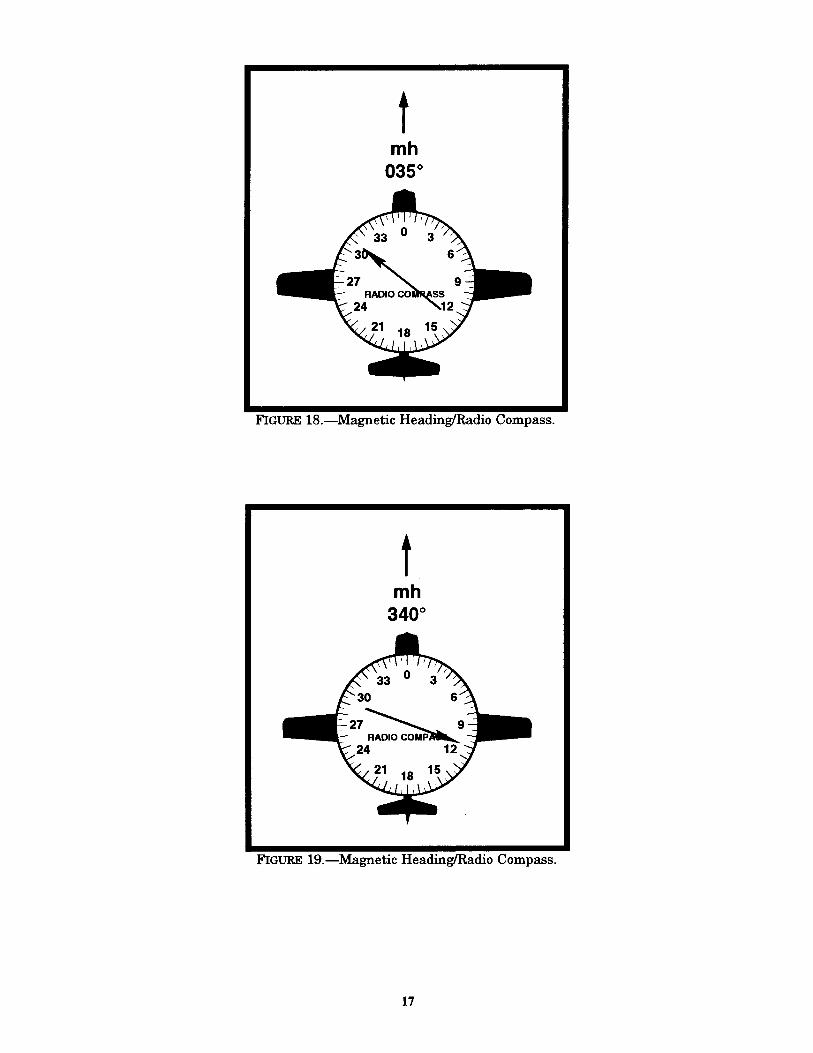
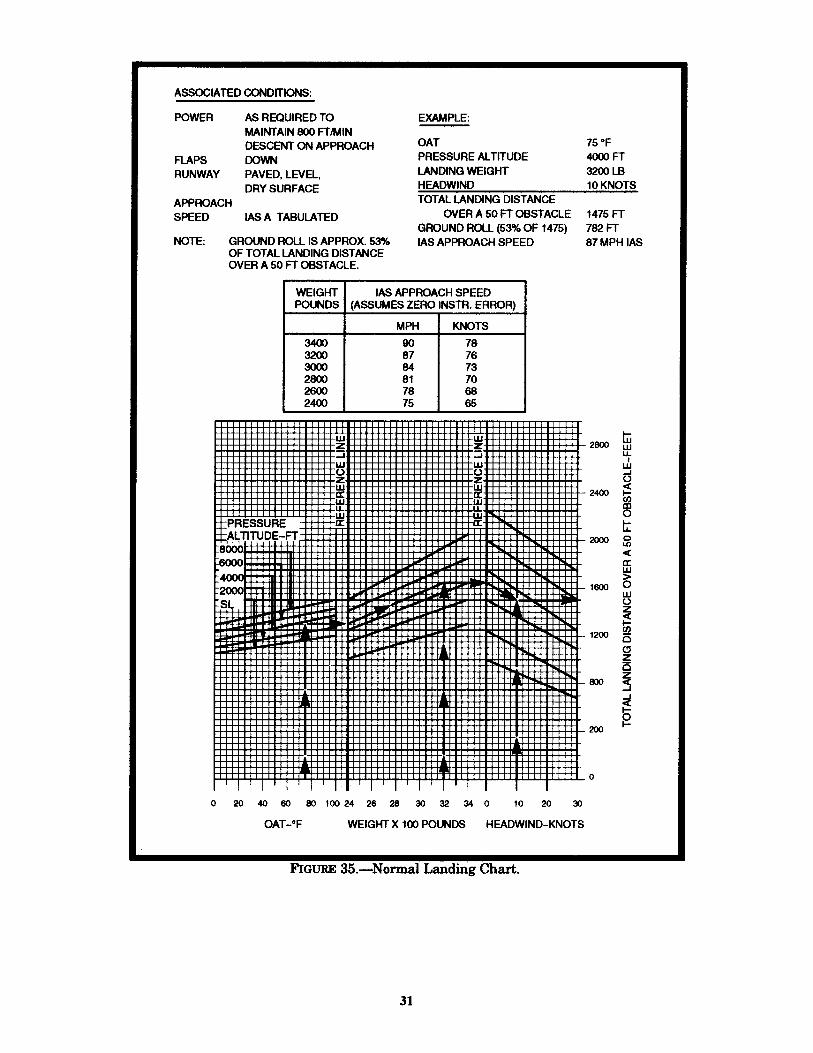
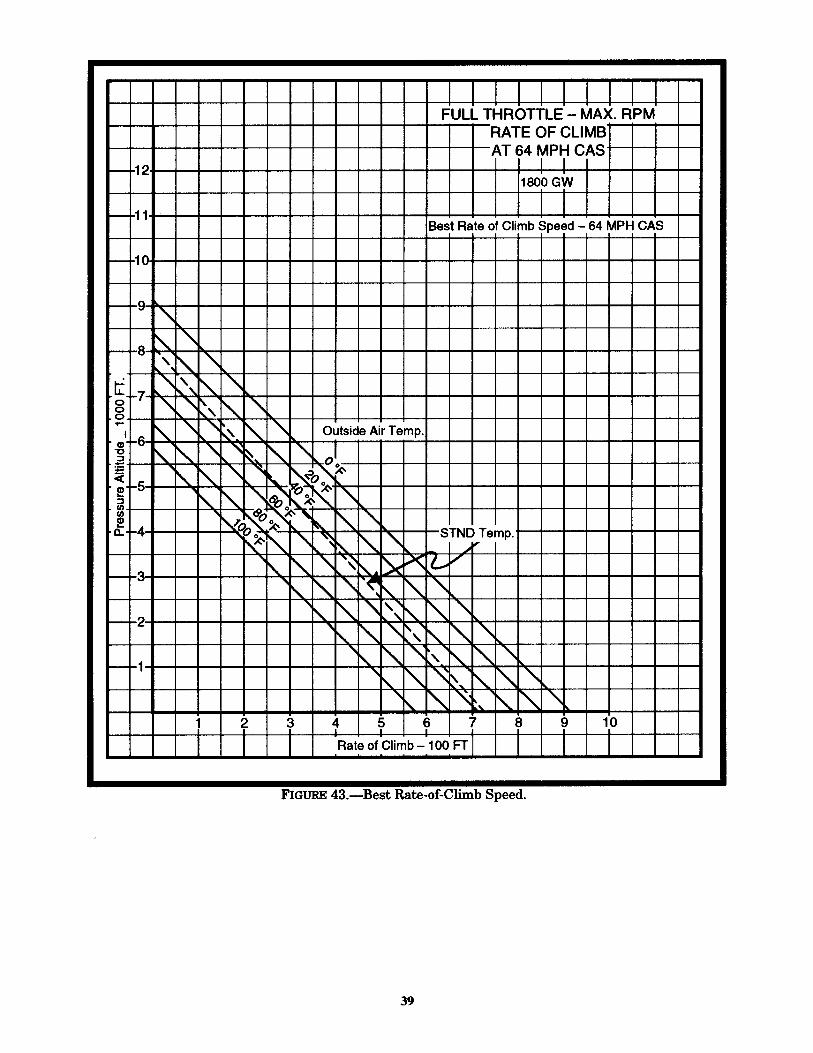
FIGURE 1.—Drag vs. Speed .................................................................................................................................. 1FIGURE 2.—Stall Speeds ....................................................................................................................................... 1FIGURE 3.—Angle of Attack, Degrees ................................................................................................................. 2FIGURE 4.—Stall Speed/Load Factor .................................................................................................................... 3FIGURE 5.—Velocity vs. G-Loads ........................................................................................................................ 4FIGURE 6.—Adiabatic Chart ................................................................................................................................. 5FIGURE 7.—Stability Chart ................................................................................................................................... 6FIGURE 8.—Fuel Consumption vs. Brake Horsepower ........................................................................................ 7FIGURE 9.—Fuel, Time, and Distance to Climb ................................................................................................... 8FIGURE 10.—Fuel, Time, and Distance to Climb ................................................................................................. 9FIGURE 11.—Cruise and Range Performance .................................................................................................... 10FIGURE 12.—Cruise Performance ...................................................................................................................... 11FIGURE 13.—Fuel, Time, and Distance to Climb ............................................................................................... 12FIGURE 14.—Fuel, Time, and Distance to Climb ............................................................................................... 13FIGURE 15.—Fuel, Time, and Distance to Climb ............................................................................................... 14FIGURE 16.—Magnetic Compass/ADF .............................................................................................................. 15FIGURE 17.—Horizontal Situation Indicator (HSI) ............................................................................................ 16FIGURE 18.—Magnetic Heading/Radio Compass .............................................................................................. 17FIGURE 19.—Magnetic Heading/Radio Compass .............................................................................................. 17FIGURE 20.—Radio Magnetic Indicator (RMI) .................................................................................................. 18FIGURE 21.—Isosceles Triangle ......................................................................................................................... 19FIGURE 22.—Isosceles Triangle ......................................................................................................................... 19FIGURE 23.—Isosceles Triangle ......................................................................................................................... 20FIGURE 24.—Isosceles Triangle ......................................................................................................................... 20FIGURE 25.—ILS RWY 13L (DSM) .................................................................................................................. 21FIGURE 26.—ILS RWY 24R (LAX) .................................................................................................................. 22FIGURE 27.—ILS/DME RWY 35R (DEN) ........................................................................................................ 23FIGURE 28.—ILS RWY 31R (DSM) .................................................................................................................. 24FIGURE 29.—ILS RWY 8L (ATL) ..................................................................................................................... 25FIGURE 30.—VOR/DME–A (7D3) .................................................................................................................... 26FIGURE 31.—Wind Component Chart ................................................................................................................ 27FIGURE 32.—ObstacleTake-off Chart ................................................................................................................ 28FIGURE 33.—Maximum Rate-of-Climb Chart ................................................................................................... 29FIGURE 34.—Cruise Performance Chart ............................................................................................................. 30FIGURE 35.—Normal Landing Chart .................................................................................................................. 31FIGURE 36.—Stations Diagram .......................................................................................................................... 32FIGURE 37.—Center-of-Gravity Envelope and Loading Graph ......................................................................... 33FIGURE 38.—Loading Graph and Center-of-Gravity Envelope ......................................................................... 34FIGURE 39.—Stations Diagram .......................................................................................................................... 35FIGURE 40.—Weight and Balance Chart ............................................................................................................ 36FIGURE 41.—Hover Ceiling vs. Gross Weight ................................................................................................... 37FIGURE 42.—Rate of Climb (Ft/Min) ................................................................................................................. 38FIGURE 43.—Best Rate-of-Climb Speed ............................................................................................................ 39FIGURE 44.—Rate of Climb ................................................................................................................................ 40
CT-8080-1C FrontPages 04/18/2005, 12:19 PM5

vi
CONTENTS—Continued
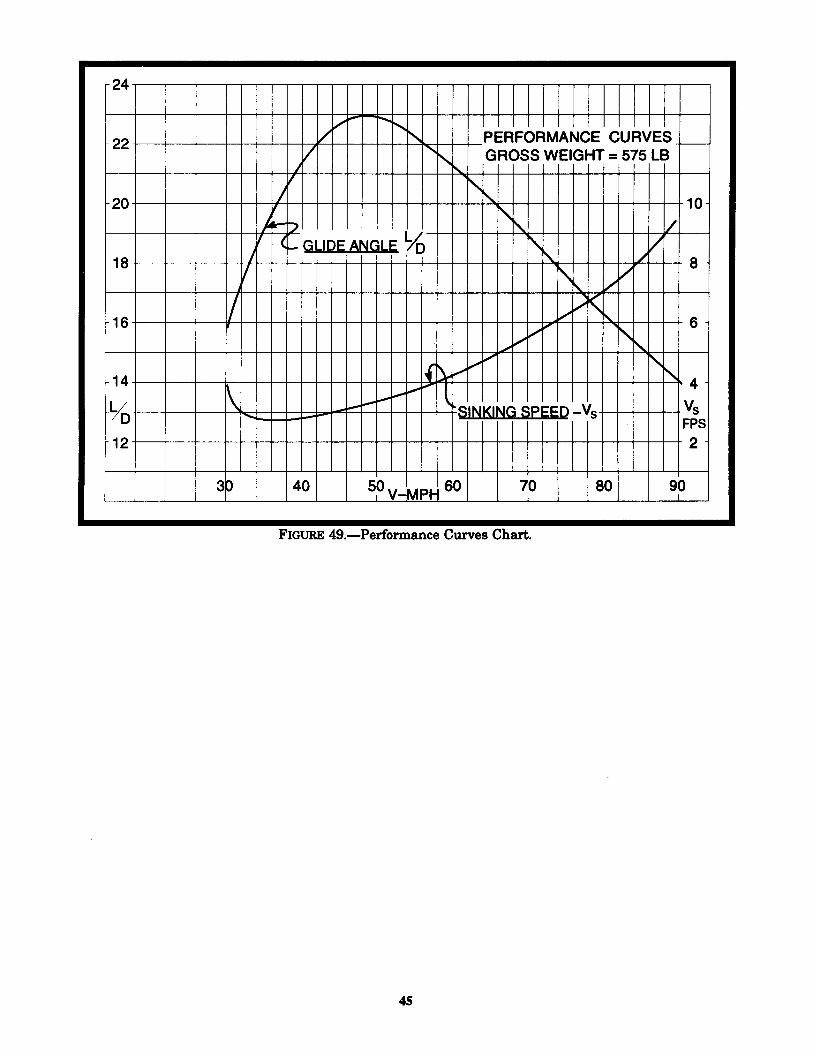
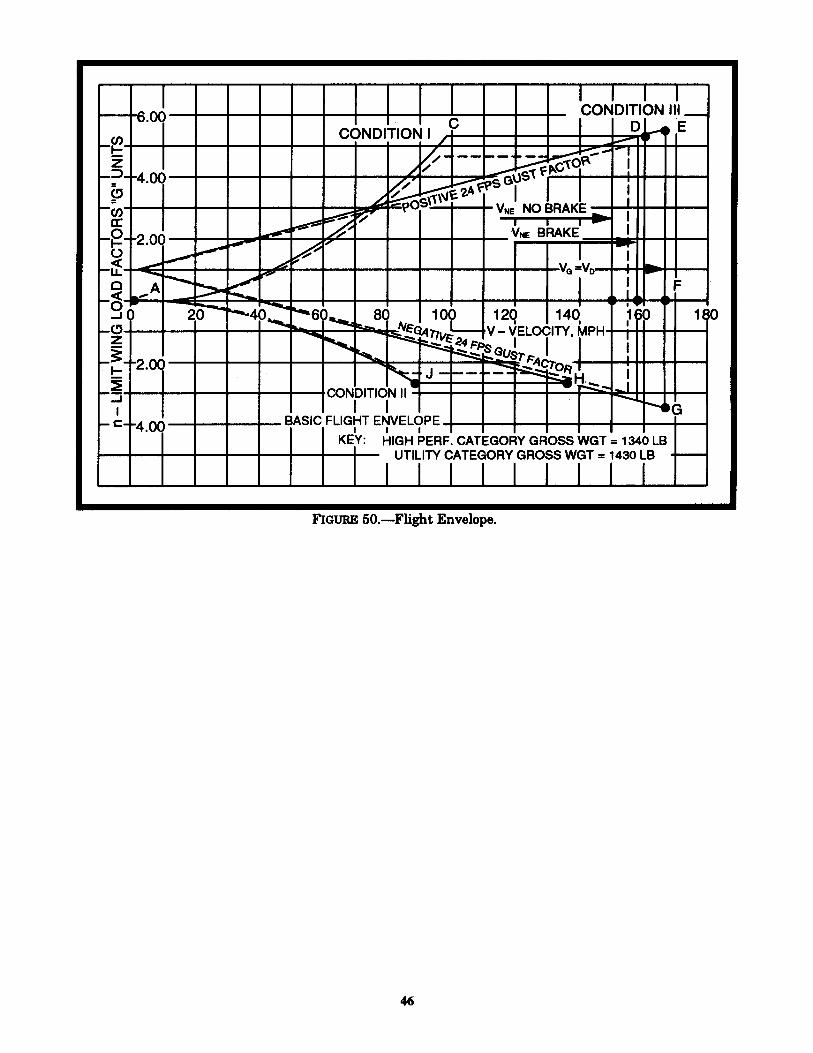
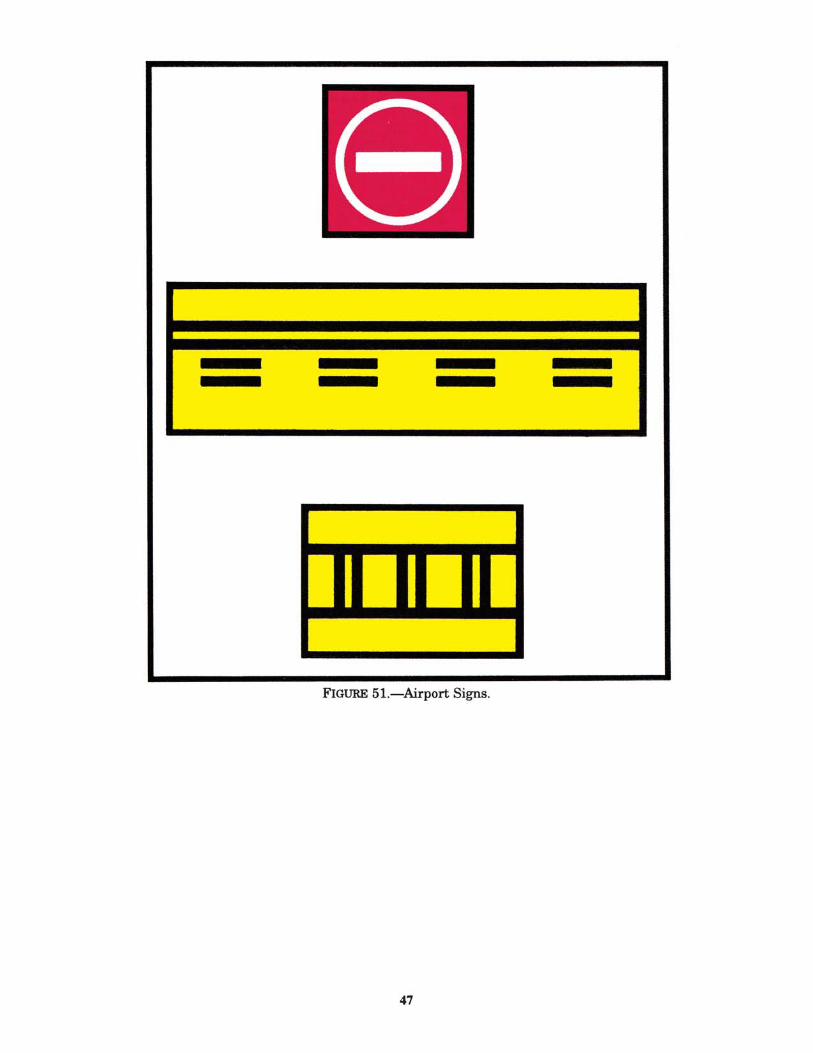
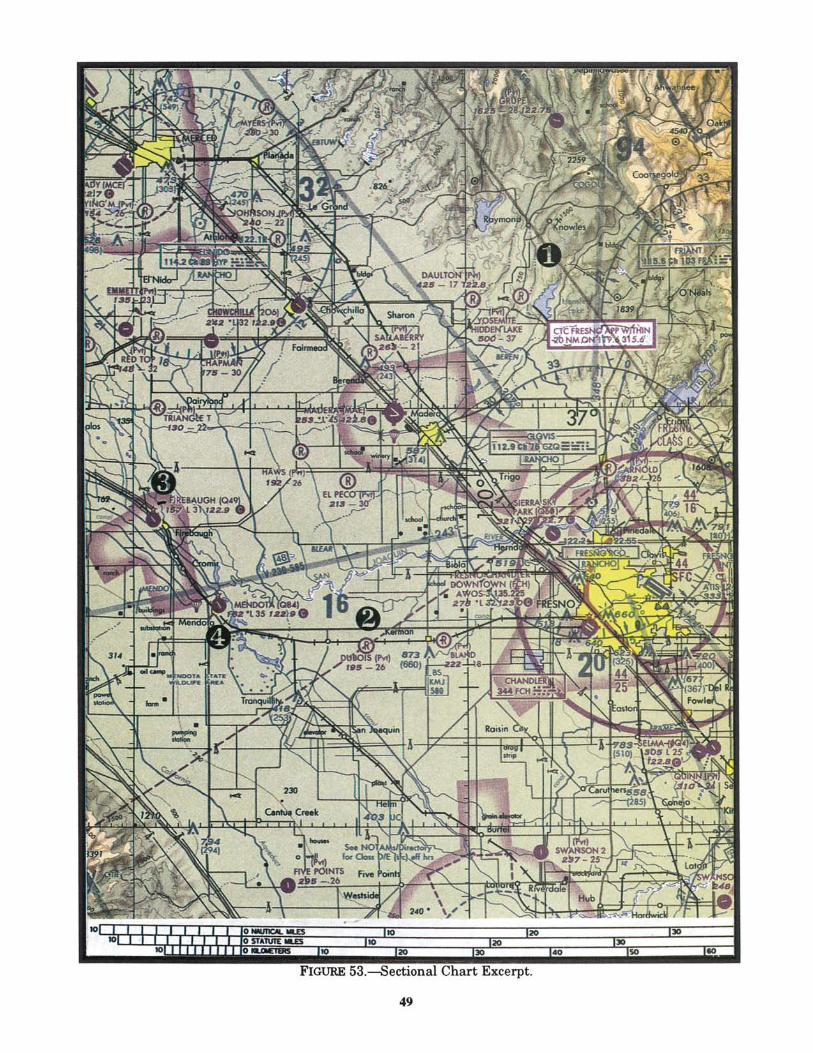
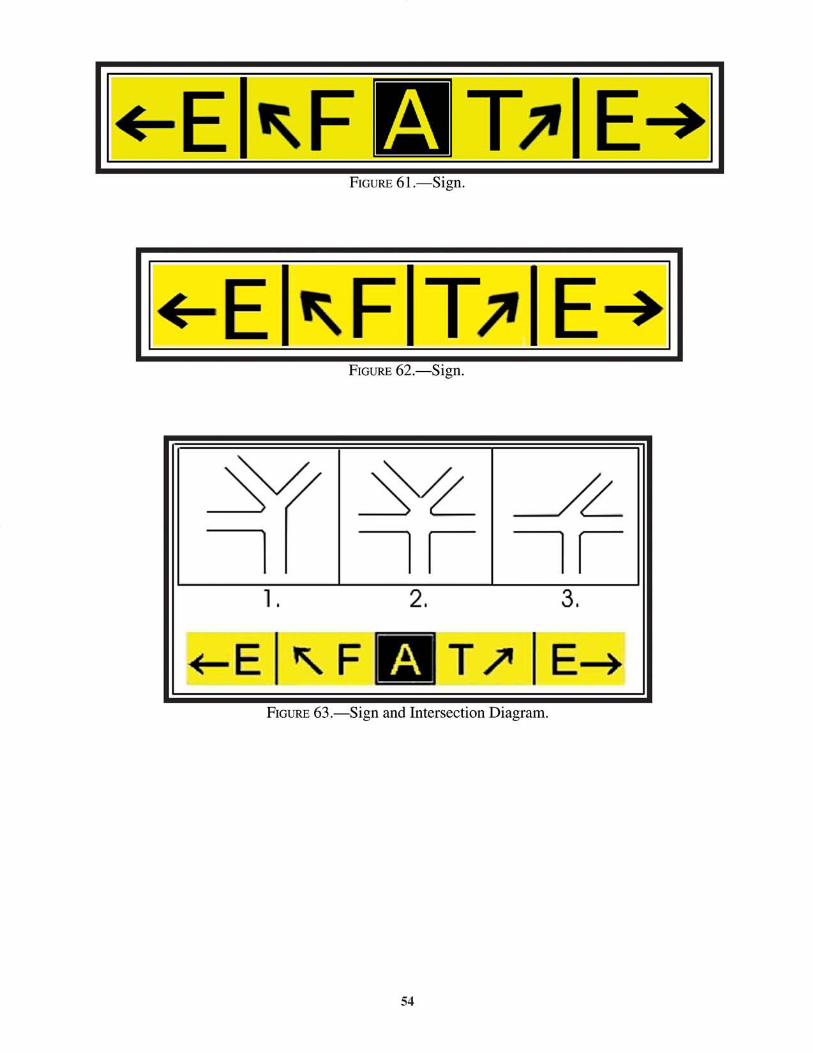
FIGURE 45.—Running Takeoff ........................................................................................................................... 41FIGURE 46.—Jump Takeoff ................................................................................................................................ 42FIGURE 47.—(Withdrawn) PAGE INTENTIONALLY LEFT BLANK ............................................................ 43FIGURE 48.—Performance Curves Chart ............................................................................................................ 44FIGURE 49.—Performance Curves Chart ............................................................................................................ 45FIGURE 50.—Flight Envelope ............................................................................................................................. 46FIGURE 51.—Airport Signs ................................................................................................................................. 47FIGURE 52.—Sectional Chart Excerpt ................................................................................................................ 48FIGURE 53.—Sectional Chart Excerpt ................................................................................................................ 49FIGURE 54.—Sectional Chart Excerpt ................................................................................................................ 50FIGURE 55.—En Route Low Altitude Chart Segment ........................................................................................ 51FIGURE 56.—Two Signs ..................................................................................................................................... 52FIGURE 57.—Sign ............................................................................................................................................... 52FIGURE 58.—Airport Diagram and Sign ............................................................................................................ 52FIGURE 59.—Taxiway Diagram and Sign .......................................................................................................... 53FIGURE 60.—Two Signs ..................................................................................................................................... 53FIGURE 61.—Sign ............................................................................................................................................... 54FIGURE 62.—Sign ............................................................................................................................................... 54FIGURE 63.—Sign and Intersection Diagram ..................................................................................................... 54FIGURE 64.—Sign ............................................................................................................................................... 55FIGURE 65.—Sign ............................................................................................................................................... 55
CT-8080-1C FrontPages 04/18/2005, 12:19 PM6