Embed Size (px)
Citation preview

DOCUMENT RESUME
ED 099 011 JC 740 451
AUTBOR Feinblatt, Joseph G.TITLE A comparison of District and Statewide Instructor
Loads--Fall 1973. Research Report No. 74-06.INSTITUTION Los Angeles Community Coll. District, Calif. Div. of
Educational Planning and Development.PUB DATE Nov 74NOTE 30p.
EDRS PRICE BP -$4.75 HC-$1.85 PLUS POSTAGEDESCRIPTORS *Community Colleges; *Comparative Analysis; Post
Secondary Education; *Stite Surveys; *StatisticalData; Tables (Data); *Teaching Load
IDENTIFIERS *California Community College Presidents Study
ABSTRACTThis publice.tion provides data on day faculty loads
in the Los Angeles Community College District for fall 1973. Thesedata will aid in the evaluation of current programs and in planningfor future program improvements. All data are based on informationprovided in the "California Community College President& Study ofTeaching Loads." The faculty loads in the Los Angeles CommunityCollege District closely parallel the average loads for the state.The average faculty load in the district, 507, is 2 percent lowerthan the state average of 517. The district and college loads foreach major discipline are compared with the statewide average loads,and those disciplines which dLffer significantly from the statewidepattern in terms of their staLdard percent deviations are isolatedfor discussion. The disciplines found to have district loadssignificantly lower than the statewide averages include libertyscience, social science, and interdisciplinary studies; those withhigher than expected loads include communications, engineering,commerce, and apprenticeship. Thy important factors contributing tovariations in faculty loads include special characteristics ofparticular disciplines, program size, and fluctuations in programpopularity from year to year. (Author)
Le pAet mt s? Of I4E at. tCje.rtill, 6 *Let AVEPiAbr 'Of elit. 11M5111t.t OF
EDuC41.0,*., tr t % rE Pk.I I ' .t koN..r . % . % % p %
% . A a a.vORO: r VI PNt" . % 1%. I (1$
LOS ANGELES COMMUNITY COLLEGE DISTRICT
A COMPARISON OF DISTRICT AND
STATEWIDE INSTRUCTOR LOADS - FALL 1973
RESEARCH REPORT 74-06
NOVEMBER 1974
Joseph G. Feinblatt
Staff Aide
DIVISION OF EDUCATIONAL PLANNING AND DEVELOPMENT
OFFICE OF EDUCATIONAL RESEARCH AND ANALYSIS
Arthur N. Cherdack, Director

LOS ANGELES COMMUNITY COLLEGES PALL 1973 INSTRUCTOR LOADS
TABLE OF CONTENTS
Page
Abstract ii
Glossary iii
:troduction 1
District-Wide Comparisons 2
East Los Angeles College 8
Los Angeles City College 10
Los Angeles Harbor College 12
Los Angeles Pierce College 14
Los Angeles Southwest College16
Los Angeles Trade-Tech College 18
Los Angeles Valley College 20
West Los Angeles College 22
Appendix 24
i

LOS ANGELES COMMUNITY COLLEGES FALL 1973 INSTRUCTOR LOADS..ably01......*.olimommi.MOMM...01WWwW4.1.011,0111ftem.
GLOSSARY
Census day is a fixed date during a semester (usually Monday of the fourthweek of classes) at which time counts of weekly student contact hours andenrollment are taken for State reporting purposes.
Classification of Instructional Disciplines (CID) is a system of four-digitcodes used throughout the State for the classification of instructional pro-grams. CID codes consist of 23 major classifications all of which arereported in this publication.
Illsiallatullsougal are organized sequences of courses covering relatedsubject matter.
Faculty Load or simply Load is found by dividing the weekly student contacthours in a program by tie number of full-time equivalent faculty assigned tothat discipline.
allzantaUti,L.2_,g.ITEFacit is a college-provided estimate of the num-ber of full-time faculty teaching each discipline. When an instructortaught more than one discipline, his or her time was apportioned accordingly.
jars&S21.1.1m were defined in the Presidents, qtpdy (see Introduction) ashaving 60,000 or more WSCH.
BALI Coll, es were defined as having fewer than 60,000 WSCH.
Weejcly Studenontaat Hogr# CWSCH) are computed by multiplying the number ofstudents enrolled in a class by the number of hours per week for which theclass meets. It is based upon the enrollment on census day.
iii

LOS ANGELES COMMUNITY COLLEGES
Introduction
For several years the Foothill Community College District and the
City College of San Francisco have published data on program popularity
and faculty load for day classes in the annual California Community college
Presidents' Study. Northern California community colleges have participated
in the study since Fall 1968 and a few Southern California colleges since
1971, but Fall 1973 was the first year that all eight of the Los Angeles
Community Colleges were included.
The purpose of this Research Report is to highlight faculty load
data pertaining to the eight Los Angeles Community Colleges aks to compare
these data with various statewide averages.
True "faculty load" is difficult to define by a si-,le measure.
However, the measure used in the Presidents' Study is the ratio between
weekly student contact hours (WSCH) in an instructional discipline and the
number of full-time equivalent (FTE) faculty assigned to that discipline.
It is not possible to give a simple numerical definition of FTE
faculty because norms vary from discipline to discipline and from campus to
campus. In the Los Angeles Community College District the number of FTE
faculty in each discipline was furnished by the colleges themselves. The
lack of a universal definition of an FTE instructor throughout the state
may lead to some error in the interpretation of small differences in instructor
loads but should not obscure the significance of the larger trends described
in this report.
The number of FTEs contributed by each instructor was apportioned to
each discipline according to his or her daytime assignment. For example,
ProLessor Jones taught Sociology half-time in the day, Psychology quartez-time
in the day, and Psychology quarter-time in the evening. Since we are only
44.111111111u11.11111101.M11,
FALL 1973 INSTRUCTOR LOADS
4111MA111111110101V =1.4101101.1,0mOVII
1

Pe 014MUNITY COLLECTS FALL 1973 INSTRUCTOR LOADS
concerned with day instruction, his total FTE contribution was 0.5 FIE in
Sociology and 0.25 FTE in Psychology.
The number of weekly student contact hours is found by multi-
plying the number of students enrolled in a class during Census Week by
the number of hours for which the class met. Total weekly student contact
hours are than divided by total full-time equivalent faculty in each
discipline to determine the faculty load.
The "overall" or "average" load at a college is found by dividing
the total weekly student contact hours in all disciplines by the total
full-time equivalent. It is therefore an indication of the average load
per instructor at the college rather than of the average load per discipline.
(Average load per discipline would lend undue weight to disciplines with
small enrollments). The average loads for the District and for the state
are similarly computed from total weekly student contact hours and total
full-time equivalent.
Since teaching loads seem to vary according to college size, the
'residents' Report divided California community colleges into "large" and
"small" groups. Large colleges were defined as those with 60,000 or more
weekly student contact hours in the Fall semester and small colleges as
those with under 60,000 weekly student contact hours. Of the eight colleges
in the Los Angeles Community College District, two (West and Southwest) are
classified as small colleges and th.: remainder as large colleges.
The method used to compare the statewide average loads with the
District and college loads is described in detail in the Appendix.
District-Wide Comparisons
Table I summarizes the faculty loads for the District, the state,
large and small colleges throughout the state, and each of the Los Angeles
2

LOS ANGELES COIVrft;l'iY coilEcrs
TARTY.1
Faculty Load Summary
CID SUBJECTEAST CITY HARBOR PIERCE SOUTHW TR'
0100 Agr. & Nat. Resource 0 0 0 532 0
0200 Arch. & Env. Design 356 384 533 532 160
0400 Biological Science 679 508 542 590 533 3
0500 Business & Mgmt. 452 547 536 462 423 5'
0600 Communications 290 570 322 300 189 4
0700 Computer Sciences 449 382 643 547 306 5
0800 Education 731 643 601 639 517 8
0900 Engineering 375 305 458 372 357
1000 Fine & Applied Arts 399 514 472 418 392
1100 Foreign Language 656 335 359 464 327
1200 Health Professions 308 343 288 244 261 4
1300 'Home Economics 381 307 487 0 241
1400 Law 602 515 0 0 0 It
1500 Letters 399 525 419 451 333
1600 Library Science 143 0 0 0 0
1700 Mathematics 492 507 506 618 324
1900 Physical Science 529 499 536 564 361
2000 Psychology 562 581 546 482 486
2100 Pub. Affairs & Serv. 925 465 654 528 0
2200 Social Science 561 484 499 507 432
3000 Commerce 0 0 0 0 0
4900 Interdiscip. Stds. 0 428 551 291 539
5300 Apprenticeship 0 0 0 769 011111
TOTAL 496 482 483 495 381

FALL 1973 INSTRUCTOR LOADS
STATE LARGE SMALLHARBOR PIERCE SO:.:THW TRADE VALLEY WEST DISTRICT AVERAGE AVERAGE AVERAGE
0 532 0 0 0 0
533 532 160 588 143 660
547. 59C 533 590 514 505
53t 4,2 423 573 515 566IMINI..322 300 189 476 562 251
643 547 306 511 307 405
601 639 517 838 654 747
458 , 372 357 607 484 306
472 418 392 616 560 458
359 464 327,,,- -503----...,472 380
288 244 261 471 260 0
487 0 241 725 825
0 0 0 1005 653 715
419 451 333 522 459 438
0 0 0 428 430 0
506 618 324 582 579 543
536 564 361 532 480 483
546 482 486 617 630 557
654 528 0 0 314 0
499 507 432 60. 560 578
0 0 0 684 0 0
551 '''.fil 539 0 717 415
0 769 0 691 0 0
483 495-*.........
381 611 516 516
532P.
446
558
513
508
463
589
546
415
459
654
466
520
424
351
487
673
419
510
514
534
613
609
575
507 517
558
487
600
549
460
327
556
532
442 322
475 398
680 581
485 399
540 452
445 383
351 352
509 417
677 626
424 401
573 227
527 469menPlammnall
544 503
612 617
633 524
589 529
588 509
611 508
650 502
529 476

LOS ANGELES CCIMM1tNi Ty COLLEGES FALL 1973 1NSTRUCIOR LOADS
Community Colleges. Leads are shown for each of the various academic
disciplines listed along the left margin by their Classification of
Instructional Discipline (CID) numbers. Table 1 shows that the overall
faculty load in the Los Angeles Community College District was 507 in
Fall 1973. That value is 27. less than the statewide average of 517
during the same period. Table 2 on page 4 presents the weekly student
contact hours and full-time equivalent faculty data from which the
District faculty loads were calculated; statewide loads are included for
comparative purposes.
When considering the faculty loads ft: a given discipline it is
important to remember that District averages tend to obscure variations
among the various District colleges. For example. several colleges in the
District have loads in Architecture and Environmental Design (0200),
Biological Science (0400), and Home E7onomics (1300) which differ signifi-
cantly from the statewide lver;1,s, and yet the District averages in those
disciplines are acceptably close to those expected from the statewide
averages.
There is a reasc.ahlv cInsistent relationship between the loads
by discioline in the state and those in the Los Angeles Community College
District. In general, those disci?lines with heavier than average faculty
loads statewide have heavier than average loads within the District; the
same relationship exists for disciplines with lighter than average loads.
Figure 1 portrays this relationship. The dark irregular line represents
the District average for each of the instructional disciplines, the
horizontal line the overall District average of 507, and the shaded area
the statewide average plus Er minus one-half of the average deviation for
each discipline. Therefore Lhe width of the shaded area in Figure 1 is an
3

LOS ANGELES COMMUNITY COLLEGES FALL 1973 INSTRUCTOR LOADS
TABLE 2District Faculty Loads
CID SUBJECT WSCHFACULTY
FTEFACULTYLOAD
STATEAVERAGE LOAD
0100 Agr. & Nat. Resource 6434 12.10 532 508
0200 Arch. & Env. Design 7523 16.85 446 463
0400 Biological Science 37186 66.66 558 589
0500 Business & Mgmt. 61614 120.14 513 546
0600 Communications 13533 29.00 467 415
0700 Computer Sciences 9480 20.75 457 459
0800 Education 100757 151.97 663 654
0903 Engineering 58396 112.92 517 466
1000 Fine & Applied Arts 80919 163.11 496 520
1100 Foreign Language 25368 59.66 425 424
1200 Health Professions l',236 123.62 317 351
1300 Home Economics 11805 25.84 457 487
1400 Law 4710 8.00 589 673
1500 Letters 88964 197.80 450 419
1600 Library Science 395 0.97 407 510
1700 Mathematics 46789 89.72 522 514
1900 Physical Science 50413 98.41 512 534
2000 Psychology 43396 78.42 553 613
2100 Pub. Affairs & Serv. 4171 8.37 498 609
2200 Social Science 98963 187.77 527 575
3000 Commerce 18456 27.00 684 564
4900 Interdiscip. Stds. 5426 13.17 412 591
5300 Apprenticeship 14977 21.54 695 618
TOTALS 828911 1633.79 507 517
4

0/00 70
0
63`A
O
etto
o06
0041
)
0.01
42cn or
l rrO
to
c2.
°900
.100
0
rt11
°0Pcbo
a pit
+0
4°0
ev
1417
o4.4
16°0
1)00
c
841 8
O
CI
P4 8 CA

'OS COMMVNITY- FALL 1973 INSTRUCTOR LOADS
4.11...1110
indication of the large statewide variation in the load for many
,iisetplines. Note, for example, how much greater the variation is for
,ihrar- Sk.ience (1600 than for Biological Science (0400).
A simple mathematical concept, "standard percent deviation,"
uas used to identify District and college loads that varied appreciably
troll the statewide pattern (See Appendix). The disciplines found to have
::rirt loads significantly lower than the statewide averages using this
mlthod include Library Science (1600), Social Science (2200), and Inter-
disciplinary Studies (4900). Those with higher than expected faculty
loads include Communications (0600), Engineering (0900), Commerce (3000),
and Apprenticeship (5300). However, although the loads of all seven of
these disciplines differ significantly from the statewide average loads,
the values for three of them fall within the shaded region of the figure;
this fact reflects the extremely wide statewide variation that exists in
those disciplines.
The pattern of faculty load statewide and the deviations from
that pattern in the District seem to reflect three important factors:
characteristics of individual disciplines, program size, and variations in
program popularity from year to year. Health Professions (1200) is an
example of the first factor. There were considerably lower than average
faculty loads throughout the state for the Health Professions in 1973. It
is understandable, however, that the individualized skills being taught in
disciplines such as the Health Professions would necessitate a relatively
high student-teecher ratio.
In regard to program size, all of the programs with very large
qi:atewide variation in faculty load (Library Science, Law, Commerce, Appren-
ticeship, Inter-disciplinary Studies, and Home Economics) are relatively small
6

LOS ANGELES COMMUNITY COLLEGES FALL 1973 INSTRUCTOR LOADS
programs. Similarly, most of the disciplines found to deviate from the
statewide load pattern were in the lowest quartile by size of the programs
in the Los Angeles Community College District. For example, Library
Science, the District's smallest program, had a lower than expected faculty
load.
The third factor influencing load patterns, yearly fluctuations in
program popularity, appears especially significant in view of the large
statewide fluctuation in program popularity during the past few years. An
unexpected drop in program enrollment could result in a temporarily higher-
than-average faculty load for that discipline. For this reason, it may be
helpful to compare the results summarized in this Research Report with those
contained in a forthcoming publication of this Office on historical trends
in program enrollment in the Los Angeles Community Colleges.
The lack of historical data on faculty load for the Los Angeles
Community College District precludes specific recommendations in this
Research Report. However, it is hoped that the data and analysis provided
herein can prove a useful resource in campus program planning.
7

!.OS 4s,TLES CCMMUNITY COLLEGES FALL 1973 INSTRUCTOR LOADS
EAL:2EArmisLCoatat
A summary of faculty loads at East Los Angeles College is
presented in Table 3. The average faculty load at East, 496, was 6% less
than the statewide average for large colleges and slightly below the
District average of 507. Using the method described in the Appendix, the
.cads at East were found to differ more from the statewide pattern than
Y-csr of any other college in the District. Exceptionally large deviations
from the statewide averages occurred in three minor disciplines: Library
Science (1600) with a load of 143, Public Affairs and Service (2100)
with a load of 925, and Communications (0600) with a load of 290. Major
disciplines with higher than expected loads include Foreign Language
(1100) with a load of 656 and Biological Science (0400) with a load of 679.
8

LOS ANGELES COMMUNITY COLLEGES FALL 1973 INSTRUCTOR LOADS
TABLE 3East Los Angeles College Faculty Loads
CID
0100
SUBJECT
Agr. & Nat. Resource
WSCH
_.-
FACULTYFTE
....
FACULTYLOAD
--
LARGE COLLEGEAVERAGE LOAD
--0200 Arch. & Env. Design 783 2.20 356 487
0400 Biological Science 6697 9.86 679 600
0500 Business & Mgmt. 6006 13.30 452 549
0600 Communications 725 2.50 290 442
0700 Computer Sciences 628 1.40 449 475
0800 Education 14620 20.00 731 680
0900 Engineering 1988 5.30 375 485
1000 Fine & Applied Arts 7038 17.64 399 540
1100 Foreign Language 3720 5.67 656 445
1200 Health Professions 4735 15.36 308' 351
1300 Home Economics 2236 5.87 381 509
1400 Law 843 1.40 602 677
1500 Letters 12781 32.01 399 424
1600 Library Science 10 0.07 143 573
1700 Mathematics 7020 14.26 492 527
1900 Physical Science 7569 14.30 529 544
2000 Psychology 5958 10.60 562 612
2100 Pub. Affairs & Serv. 555 0.60 925 633
2200 Social Science 13349 23.80 561 589
3000 Commerce -- MN*
4900 Tnterdiscip. Stds.mom mmin
5300 Apprenticeship Pm abm .. &NWAN. w,.
TOTALS 97261 196.14 496 529
9

LOS ANGELES CriMMUNITY COLLEGES FALL 1973 INSTRUCTOR LOADS
Los Angeles City (' 'llee
A summary of faculty loads at Los Angeles City College is
presented in Table 4. The average faculty load at City, 482, was 970 less
than the statewide average for large colleges and one of the two lowest
among the large colleges in the District. Using the method described in the
Appendix, the loads at City were found to parallel the statewide pattern
very closely. This relatively narrow variation may in part reflect the
absence of many very small disciplines. Disciplines at City with higher
than expected loads include :.ommunications (0600) and Letters (1500).
Disciplines with lower than expected loads include Engineering (0900),
Home Economics (1300), Law (1400), Letters (1500), Public Affairs and
Service (2100), and Interdisciplinary Studies (4900). The load in
Engineering (0900), 305, is the lowest load in the District' for that
discipline.
Footnotes to Table 4:
Includes Allied Health (0410)
Does not include Educational Assistants (0850)
Corrected value10

LOS ANGELES COMMUNITY COLLEGES FALL 1973 INSTRUCTOR LOADS
TABLE 4Los Angeles City College Faculty Loads
CID
0100
SUBJECT
Agr. & Nat. Resource
WSCH
RP* WM.
FACULTYFTE
II.M
FACULTYLOAD
01111 Dim
LARGE COLLEGEAVERAGE LOAD
IM
0200 Arch. & Env. Design 1288 3.35 384 487
0400 Biological Science 6943 * 13.67 508 600
0500 Business & Mgmt. 12482 22.81 547 549
0600 Communications 6624 11.63 570 442
0700 Computer Sciences 2102 5.50 382 475
0800 Education 16663 25.92 643 680
0900 Engineering 3103 10.17 305 485
1000 Fine & Applied Arts 19354 37.66 514 540
1100 Foreign Language 5924 *** 17.67 335 445
1200 Health Professions 12423 36.23 343' 351
1300 Home Economics 2914 9.49 307 509
1400 Law 2061 4.00 515 677
1500 Letters 15594 29.73 525 424
1600 Library Science =Wm.*
1700 Mathematics 9909 19.53 507 527
1900 Physical Science 8952 17.95 499 544
2000 Psychology 10188 17.53 581 612
2100 Pub. Affairs & Serv. 2485 5.34 465 633
2200 Social Science 13/55 28.40 484 589
3000 Commerce O. OM M.. Poo
4900 Interdiscip. Stds. 513 1.20 428 611
5300 Apprenticeship Wm .1.OM am.
TOTALS 153277 317.78 482 529
11

LOS ANGELES COMMUNITY COLLEGES FALL 1973 INSTRUCTOR LOADS
Los Angeles Harbor College
A summary of loads at Los Angeles Harbor College is presented
in Table 5. The average faculty load at Harbor, 482, was 97, less than
the statewide average for large colleges and one of the two lowest among
the large colleges in the District. Using the method described :t.n the
Appendix, the loads at Harbor were found to follow the statewide pattern
very closely. The exceptions include Architecture and Environmental
Design (0200), which had higher than expected loads, and Communications
(0600) and Computer Sciences (0700), which had loads lower than expected.
These latter disciplines were among the smallest at Harbor.
Footnotes to Table 5:
***
Industrial Arts (0839) listed under 0900
Corrected value
12

LOS ANGELES COMMUNITY COLLEGES FALL 1973 INSTRUCTOR LOADS
TABLE 5Los Angeles Harbor College Faculty Loads
CID
0100
SUBJECT
Agr. & Nat. Resource
WSCHFACULTYFTE
--
FACULTYLOAD
..-
LARGE COLLEGEAVERAGE LOAD
--
0200 Arch. & Env. Design 1065 2.00 533 487
0400 Biological Science 4990 9.21 542 600
0500 Business & Mgmt. 7532 14.05 536 549
0600 Communications 322 1.00 322 442
0700 Computer Sciences 996 1.55 643 475
0800 Education 11039 * 18.37 601 680
0900 Engineering 4626 * 10.09 458 485
1000 Fine & Applied Arts 5811 12.32 472 540
1100 Foreign Language 2044 5.69 359 445
1200 Health Professions 4673 16.25 288 351
1300 Home Economics 1436 2.95 487 509
1400 Law __ _- -- --
1500 Letters 9238 22.06 419 424
1600 Library Science -- ...... -- --
1700 Mathematics 4973 9.83 506 527
1900 Physical Science 6121 11.42 536 544
2000 Psychology 5606 10.26 546 612
2100 Pub. Affairs & Serv. 543 0.83 654 633
2200 Social Science 10379 20.80 499 589
3000 Commerce -- -- maw --4900 Interdiscip. Stds. 1322 2.40 551 611
5300 Apprenticeship _- ea.* alm, --
TOTALS 82716 171.08 483 529
13

LOS ANGELES COMMUNIT coLLE;;ES FALL 1973 INSTRUCTOR LOADS
Cos An4ples Pierce College
A summary of taculAy loads at Los Angeles Pierce College is
presented in Table 6. T:ie average faculty load at Pierce, 495, was ea
less than the statowid.' nvel.age for large colleges and slightly less than
the District avera).,e. the method described in the Appendix, the
loads at Pierce were fo.11.1 to he generally close to the statewide pattern.
Communications f0t)00 Interdisciplinary Studies (4900) had lower than
expected loads, Matherocics (1700) and Apprenticeship (5300) loads higher
than expected.
14

LOS ANGELES COITCNITY COLLEGES FALL 1973 INSTRUCTOR LOADS
TABLE 1Los AnI;eles Pierce tollege Faculty Loads
CID SUBJECT WSCHFACULTYFTE
FACULTYLOAD
LARGE COLLEGEAVERAGE LOAD
0100 Agr. & Nat. Resource 6434 12.10 532 558
0200 Arch. & rnv. Design 1597 3.00 532 487
0400 Biological Science 7125 12.07 590 600
0500 Business & Mgmt. 11263 24.39 462 549
0600 C(mmunications 1232 4.10 300 442
0700 Computer Sciences 2516 4.60 547 475
0800 Education 24159 37.80 639 680
0900 Engineering 4759 12.80 372 485
1000 Fine & Applied Arts 12401 29.67 418 540
1100 Foreign Language 5289 /1.40 464 445
1200 Health Professions 2560 10.50 244 351
1300 Home Economies-- AP Wm
1400 Law-- -- _
1500 Letters 14792 32.79 451 424
1600 Library Science-- -- --
1700 Mathematics 8597 13.90 618 527
1900 Physical Sciencv 11212 19.87 564 544
2000 Psychology 8385 17.40 482 612
2100 Pub. Affairs & Serv. 211 0.40 528 633
2200 Social Science 21640 42.70 507 589
3000 Commerce -- -- _-
4900 interdiscip. Stds. 1629 5.60 291' 6 .
5300 Apprenticeship 1000 1.30 769 650
TOTALS 146801 296.39 495 529
Corrected vnItle
15

LOS ANGELES COMMUNITY COLLEGES FALL 1973 INSTRUCTOR LOADS
Los Angeles Southwest College
A summary of loads at Los Angeles Southwest College is presented
in Table 7. The average faculty load at Southwest, 381, was 207 less
than the statewide average for small colleges and the lowest in the
District. Using the method described in the Appendix, the average load
at Southwest was considerably lower than the small college average.
However, the loads at Southwest were found to follow the statewide pattern
very closely. Architecture and Environmental Design (0200), Communications
(0600), and Home Economics (1300) had lower loads than expected.
Biolo4cal Sciences (0400) and Tnterdisciplinary Studies (4900) were close
to the small college averages but higher than would have been expected
from the average load at So'. hwest. The average program size at Southwest,
1692 WSCH, is considerably less than the District average of 5600 WSCH.
It seems reasonable, therefore, to ascribe the relatively low loads at
Southwest to the small size of the programs at t, is college.
16

LOS ANGELES COMMUNITY COLLEGES FALL 1973 INSTRUCTOR LOADS
TABLE 7Los Angeles Southwest College Faculty Loads
CID
0100
SUBJECT
Agr. & Nat. Resource
WSCH
...
FACULTYFTE
..
FACULTYLOAD
4001...
SMALL COLLEGEAVERAGE LOAD
--
0200 Arch. & Env. Design 80 0.50 160 327
0400 Biological Science 2357 4.42 533 556
0500 Business & Mgmt. 2405 5.69 423 532
0600 Communications 89 0.47 189 322
0700 Computer Sciences 306 * 1.00 306 398
0800 Education 3404 6.58 517 581
0900 Engineering 806 2.26 357 399
1000 Fine & Applied Arts 1798 4.59 392 452
1100 Foreign Language 765 2.34 327 383
1200 Health Professions 2346 * 8.98 261 352
1300 Home Economics 369 * 1.53 241 417
1400 Law AIM WIN.OND Ma mil --
1500 Letters 3930 11.80 333 401
1600 Library Science -- -- .mb --1700 Mathematics 2808 8.67 324 469
1900 Physical Science 1180 3.27 361 503
2000 Psychology 1619 3.33 486 617
2100 Pub. Affairs & Serv. -- GM. ft. --2200 Social Science 3921 9.07 432 529
3000 Commerce ...... Mt e. ...W.& --4900 Interdiscip. Stds. 577 1.07 539 508
5300 Apprenticeship NO MB M.. Mr MD OP --TOTALS 28760 75.57 381 476
* corrected values
17

LOS ANGELES COMM TY COLLEGES FALL 1973 INSTRUCTOR LOADS
Los Angeles Trade -Tech College
A summary of faculty loads at Los Angeles Trade-Tech College is
presented in Tahl.. 8. The average faculty load at Trade-Tech, 611, was
higher than the statewide average for large colleges and the highest
load in the District. Using the method described in the Appendix, the
loads at Trade-Tech were found to follow the statewide pattern very
closely. Although Biological Science (0400) was close to the large
college average, it was lower than would have been expected from the
average load at Trade-Tech. Library Science (1600) also had a lower than
expected load. HOMO Economics (1300) and Law had heavier loads than would
have been expected. All four of these exceptional disciplines were
relatively small in size, ranging from 201 to 1179 WSCH.
Footnotes to Table 8
For the purpose of the Presidents' Study, two disciplinesgiven 1300 CID codes in this District were assigned 3000CID codes.
Does not include 270 WSCH for Electrolysis (1920)
18

LOS A'.!(WLES ConiirNITY COLLEGESFALL 1973 INSTRUCTOR LOADS
TABLE 8Los Angeles Trade-Tech College Faculty Loads
CID
0100
SUBJECT
Agr. & Nat. Resource
WSCH
_-
FACULTYFTE
FACULTYLOAD
OM POO
LARGE COLLEGEAVERAGE LOAD
--
02n0 Arch. & Env. Design 2350 4.00 588 487
0400 Biological Science 1179 2.00 590 600
0500 Business & Mgmt. 11237 19.60 573 549
0600 Communications 1572 3.30 476 442
0700 Computer Sciences 2044 4.00 511 475
0800 Education 8378 10.00 838 680
0900 Engineering 40970 67.50 607 485
1000 Fine & Applied Arts 14732 23.90 616 540
1100 Foreign Language 352 0.70 503 445
1200 Health Professions 6825 14.50 471 351
1300 Home Economics 725 * 1.00 725 509
1400 Law 201 0.20 1005 677
1500 Letters 8796 16.85 522 424
1600 Library Science 342 0.80 428 573
1700 Mathematics 2755 4.73 582 527
1900 Physical Science 1810 ** 3.40 532 544
2000 Psychology 1850 3.00 617 612
2100 Pub. Affairs & Serv. -- .... - -- --2200 Social Science 5553 9.20 604 589
6 /3000 Commerce 18456 27.00 684 588
4900 Tnterdiscip. Stds. -- 0.11a 440.0. M.O.
5300 Apprenticeship 13977 20.24 691 650
TOTALS 144104 235.92 611 529
19

LOS ANGELES COMMUNITY c0LLEGEs FALL 1473 INSTRUCTOR !DADS
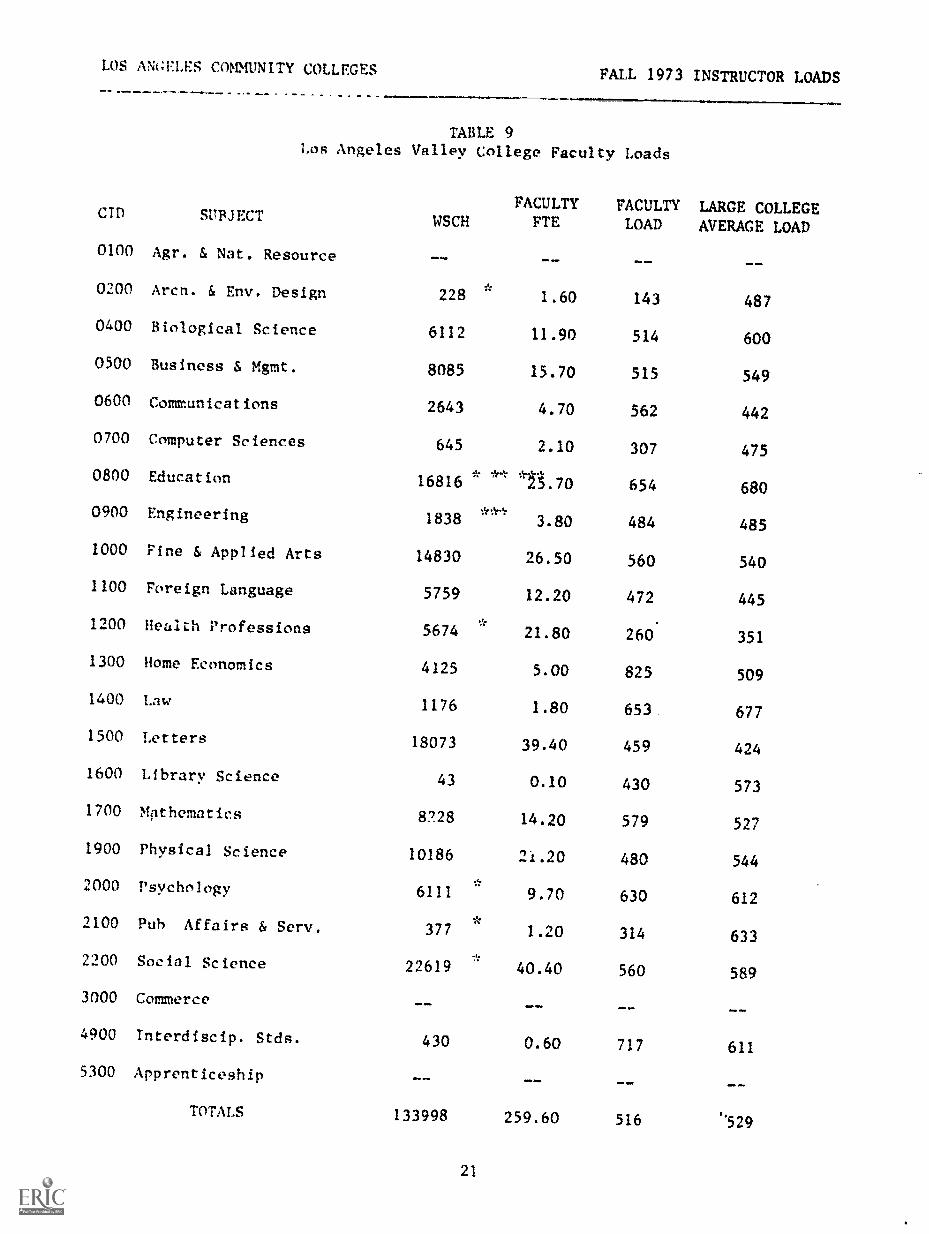
1412AAnales Valley Collew
A summary of faculty loads at Los Angeles Valley College is
presented in Table 4. The average load at Valley, 51h. was 2' lower than
the statewide average for large colleges, and slightly higher than the
District average'. Although the average load at Valley was quite close to
the statewide average, th. loads for individual disciplines varied more
from this average than those at any other District college (see Appendix
for methodology). This relatively large deviation reflects very low
loads in thr. small disciplines: Architecture and Environmental Design
(0200), Computer sciences (0700), and Public Affairs and Service (2100),
and a relatively heavy load in Home Economics (1300). The load in Archi-
tecture and Environmental Design (0200). 143. was the lovest in the
District.
Footnotes to Table 9
Corrected value
Educational Assistants (0850) were not included
Industrial Arts (0839) is listed under 0900
20
LOS ANGELES COMMUNITY COLLEGESFALL 1973 INSTRUCTOR LOADS
TABLE 9Los Angeles Valley College Faculty Loads
CID
0100
SUBJECT
Agr. & Nat. Resource
WSCH
--
FACULTYFTE
MOW.
FACULTYLOAD
LARGE COLLEGEAVERAGE LOAD
Mb SIM.
0200 Arcn. & Env. Design 228 1.60 143 487
0400 Biological Science 6112 11.90 514 600
0500 Business & Mgmt. 8085 15.70 515 549
0600 Communications 2643 4.70 562 442
0700 Computer Sciences 645 2.10 307 475
0800 Education 16816 ** *n.70 654 680
0900 Engineering 1838***
3.80 484 485
1000 Fine & Applied Arts 14830 26.50 560 540
1100 Foreign Language 5759 12.20 472 445
1200 Health Professions 5674 21.80 260 351
1300 Home Economics 4125 5.00 825 509
1400 Law 1176 1.80 653. 677
1500 Letters 18073 39.40 459 424
1600 Library Science 43 0.10 430 573
1700 Mathematics 8:/28 14.20 579 527
1900 Physical Science 10186 21.20 480 544
2000 Psychology 6111 * 9.70 630 612
2100 Pub Affairs & Serv. 377*
1.20 314 633
2200 Social Science 22619 40.40 560 589
3000 Commerce T. OM NM Oil. 0= --4900 Interdiscip. Stds. 430 0.60 717 611
5300 Apprenticeship M. OM Of .1* 41.0 Om
TOTALS 133998 259.60 516 2'529
21

LOS ANGELES COMMUNITY COLLLGES PALL 1973 INSTRUCTOR LOADS
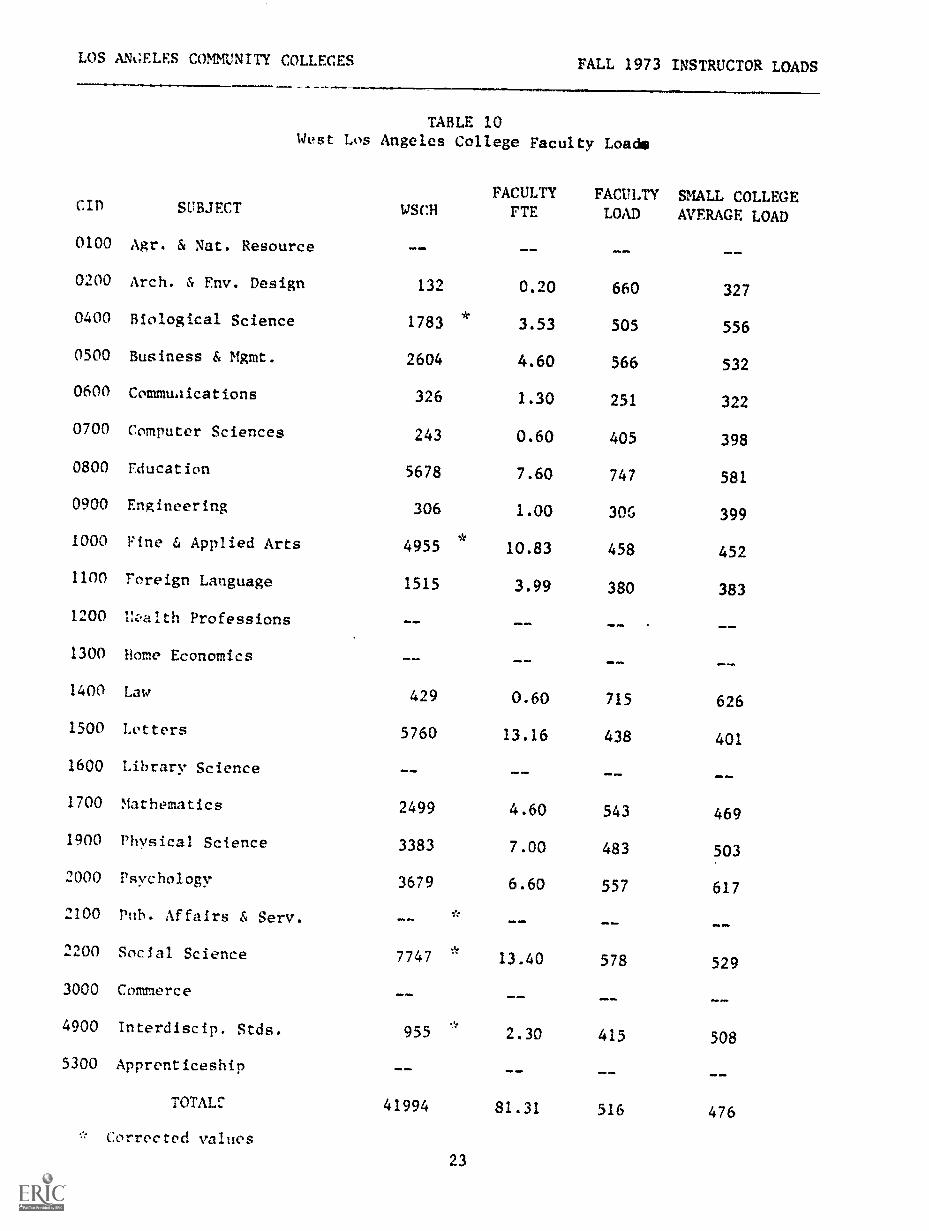
West Los An;;eles College
Faculty loads at West Los Angeles College are presented in
Table 10. The average faculty load at West Los Angeles. 51h, was 8%
higher than the statewide average for small colleges, and slightly higher
than the District average. tfsing rho method described in the Appendix,
the loads at West Los Angeles College were found to differ more from the
statewide pattern than those at most other District colleges. This
variation was due in part to the heavy load for Architecture and Environ-
mental Design (0200) , A very small program. Education (0800) also had a
heavier than expected load. The loads in two small programs, Engineering
(0900) and Interdisciplinary Studies (4900), and in the larger Psychology
program (2000), were lighter than expected. Although the average program
size at West Los Angeles College, 2625 WSCH, Is much larger than that at
Southwest College, it is much smaller than the District average and may
explain the wide deviation of the loads from the statewide averages.
22
LOS ANi,ELES COMMUNITY COLLEGES FALL 1973 INSTRUCTOR LOADS
TABLE 10West Los Angeles College Faculty Loads
CID
0100
SUBJECT
Agr. & Nat. Resource
WSCH
ORA .M1
FACULTYFTE
...00
FACULTYLOAD
SMALL COLLEGEAVERAGE LOAD
--
0200 Arch. & Env. Design 132 0.20 660 327
0400 Biological Science 1783 * 3.53 505 556
0500 Business & Mgmt. 2604 4.60 566 532
0600 Commuaications 326 1.30 251 322
0700 Computer Sciences 243 0.60 405 398
0800 Education 5678 7.60 747 581
0900 Engineering 306 1.00 30G 399
1000 Fine & Applied Arts 4955*
10.83 458 452
1100 Foreign Language 1515 3.99 380 383
1200 Ezralth Professions MM MEI AW .M. OM --1300 Home Economics _- __ __ --
1400 Law 429 0.60 715 626
1500 Letters 5760 13.16 438 401
1600 Library Science -- ...... ,. INI /km
1700 Mathematics 2499 4.60 543 469
1900 Physical Science 3383 7.00 483 503
2000 Psychology 3679 6.60 557 617
2100 Pub. Affairs & Serv. N. Mbl MO Mai Om --2200 Social Science 7747 * 13.40 578 529
3000
4900
Commerce
Interdiscip. Stds.
_
955
......
2.30
Oft
415
P. PM
508
5300 Apprenticeship O. ME =I. GEO, Oft IPS
T0TAL: 41994 81.31 516 476
Corrected values
23

LOS ANGELES COMMUNITY COLLEGES FALL 1973 INSTRUCTOR LOADS.,,111. .1.01 amme=.11..1.wwww...,
Appendix
It was necessary to utilize a simple mathematical measure for
identifying District and college loads that varied appreciably from the state-
wide pattern. The measure chosen was the standard percent deviation: which was
computed as shown below.
Standard PercentDeviation
E(Actual Load - Expected LoadExpected Load X 100) 2
Number of Disciplines
Where the expected load for each discipline was computed as follows:
District (or college)Expected . Average x Statewide
Load Statewide LoadAverage
The standard percent deviation was computed for the District as a whole and
for each college within the District. Those loads that varied by more than
the standard percent deviation were selected for discussion in the body of this
Research Report. Since loads varied considerably from discipline to discipline,
a difference of 100 units of faculty load would not have meant the same thing
for a discipline with a load of 800 units as for a discipline with a load of
300 units. Consequently, the "standard percent deviation" was found to be a
more useful measure than the more common "standard deviation."
24
UNIVERSITY OF CALIF.
LOS ANGELES
LJE'.; 1974
CLEARINGHOUSEFORJUNIOR COLLEGE
INFORMATION