Embed Size (px)
Citation preview

For further information please contact: Email: [email protected]
Phone: (08) 8204 1910
Post: Coorong, Lower Lakes and Murray Mouth Program Department of Environment and Natural Resources Reply paid 1047 ADELAIDE SA 5001
Website: www.environment.sa.gov.au
Permissive licence © State of South Australia through the Department of Environment and Natural Resources. Apart from fair dealings and other uses permitted by the Copyright Act 1968 (Cth), no part of this publication may be reproduced, published, communicated, transmitted, modified or commercialised without the prior written approval of the Department of Environment and Natural Resources. Written requests for permission should be addressed to: Coorong, Lower Lakes and Murray Mouth Program DepartmenGPO Box 10Adelaide SA
t of Environment and Natural Resources 47 5001
Ecological consequences of managing water levels to prevent acidification in Lakes Alexandrina and Albert:
Summary Report. Disclaimer While reasonable efforts have been made to ensure the contents of this publication are factually correct, the Department of Environment and Natural Resources makes no representations and accepts no responsibility for the accuracy, completeness or fitness for any particular purpose of the contents and shall not be liable for any loss or damage that may be occasioned directly or indirectly through the use of or reliance on the contents of this publication. Printed on recycled paper December 2011
Citation This report should be cited as:
Muller K.L. (2011). Ecological consequences of managing water levels to prevent acidification in Lakes Alexandrina and Albert: Summary Report. Prepared for Department for Environment and Natural Resources, Adelaide, South Australia. This is a summary of the complete Technical Report: Muller K.L. (2011). Ecological consequences of managing water levels toprevent acidification in Lakes Alexandrina and Albert: Technical Report. Prepared for Department for Environment and Natural Resources, Adelaide, South Australia. December 2011. ISBN: 978-1-921800-47-4
�
December 2011

Ecological consequences of managing water levels to prevent acidification in Lakes Alexandrina and Albert: Summary Report. Prepared by Dr. Kerri L. Muller, Principal, Kerri Muller NRM. for the SA Department of Environment and Natural Resources, as part of the South Australian Government’s $610 million Murray Futures program funded by the Australian Government’s Water for the Future initiative, and the Murray-Darling Basin Authority. December 2011
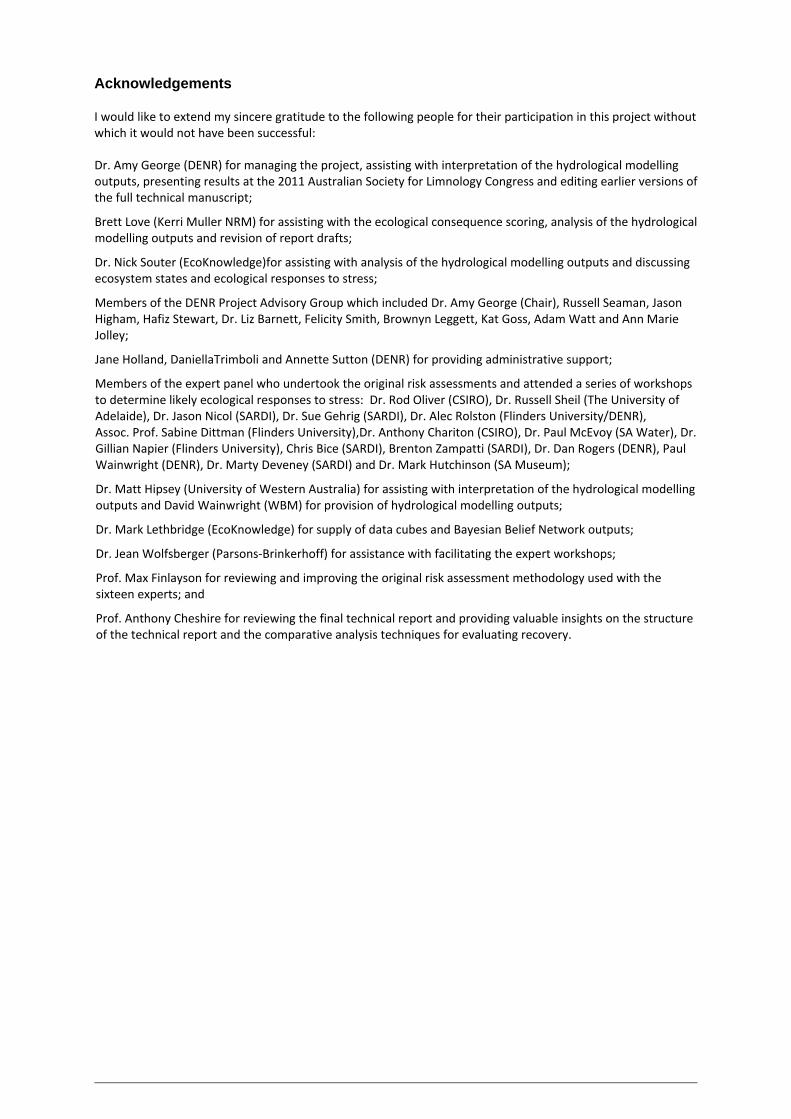
Acknowledgements I would like to extend my sincere gratitude to the following people for their participation in this project without which it would not have been successful:
Dr. Amy George (DENR) for managing the project, assisting with interpretation of the hydrological modelling outputs, presenting results at the 2011 Australian Society for Limnology Congress and editing earlier versions of the full technical manuscript;
Brett Love (Kerri Muller NRM) for assisting with the ecological consequence scoring, analysis of the hydrological modelling outputs and revision of report drafts;
Dr. Nick Souter (EcoKnowledge)for assisting with analysis of the hydrological modelling outputs and discussing ecosystem states and ecological responses to stress;
Members of the DENR Project Advisory Group which included Dr. Amy George (Chair), Russell Seaman, Jason Higham, Hafiz Stewart, Dr. Liz Barnett, Felicity Smith, Brownyn Leggett, Kat Goss, Adam Watt and Ann Marie Jolley;
Jane Holland, DaniellaTrimboli and Annette Sutton (DENR) for providing administrative support;
Members of the expert panel who undertook the original risk assessments and attended a series of workshops to determine likely ecological responses to stress: Dr. Rod Oliver (CSIRO), Dr. Russell Sheil (The University of Adelaide), Dr. Jason Nicol (SARDI), Dr. Sue Gehrig (SARDI), Dr. Alec Rolston (Flinders University/DENR), Assoc. Prof. Sabine Dittman (Flinders University),Dr. Anthony Chariton (CSIRO), Dr. Paul McEvoy (SA Water), Dr. Gillian Napier (Flinders University), Chris Bice (SARDI), Brenton Zampatti (SARDI), Dr. Dan Rogers (DENR), Paul Wainwright (DENR), Dr. Marty Deveney (SARDI) and Dr. Mark Hutchinson (SA Museum);
Dr. Matt Hipsey (University of Western Australia) for assisting with interpretation of the hydrological modelling outputs and David Wainwright (WBM) for provision of hydrological modelling outputs;
Dr. Mark Lethbridge (EcoKnowledge) for supply of data cubes and Bayesian Belief Network outputs;
Dr. Jean Wolfsberger (Parsons‐Brinkerhoff) for assistance with facilitating the expert workshops;
Prof. Max Finlayson for reviewing and improving the original risk assessment methodology used with the sixteen experts; and
Prof. Anthony Cheshire for reviewing the final technical report and providing valuable insights on the structure of the technical report and the comparative analysis techniques for evaluating recovery.

Table of Contents Introduction.............................................................................................................................................................................. 1�Do-Nothing............................................................................................................................................................................... 5�Introduce Seawater................................................................................................................................................................ 9�Deliver Freshwater................................................................................................................................................................. 12�Capacity to recover under Entitlement and Average flows ........................................................................................ 15�Conclusions............................................................................................................................................................................ 18�
�List of Figures Figure 1: Aerial photographs of the area around the barrages at normal pool level (+0.6 mAHD, left) in 2003 and during the drawdown in 2009 (-0.8 mAHD, right). ...................................................................................... 1 Figure 2: A map of the site showing the permanent barrages between the islands in the south of Lake Alexandrina (blue lines) and the temporary flow regulators in place at Clayton, Currency Creek and across Narrung Narrows (red lines). .................................................................................................................................... 3 Figure 3: Conceptual diagrams of the Ramsar state n 2006 and the baseline state in October 2009 when the actions of Do-Nothing, introduce Seawater and deliver Freshwater began............................................................... 4 Figure 4: Lake Alexandrina Salinity in the Do nothing-pumping scenario at February 2012. ................................... 5 Figure 5: Conceptual diagrams of the Do-Nothing management option at the end of the action period (2015). .......................................................................................................................................................................... 6 Figure 6: Lake Alexandrina Do-nothing pumping acidification event in June 2013. ............................................... 7 Figure 7:Lake Albert Salinity in the Do-nothing pumping scenario at January 2014................................................... 8 Figure 8: Typical illustration of Lake Albert when dry under any of the cease-pumping scenarios. ....................... 8 Figure 9: Lake Alexandrina Salinity Seawater pumping at December 2012 showing the freshening effect of River Murray water in the north and seawater in the south. ......................................................................................... 9 Figure 10: Conceptual diagrams of the Seawater management option at the end of the action period (2015). ........................................................................................................................................................................ 10 Figure 11: Lake Albert salinity in the Seawater-pumping scenario at October 2012. ............................................ 11 Figure 12: Lake Alexandrina salinity in the Freshwater pumping (a) and cease-pumping (b) scenarios at April 2012. ........................................................................................................................................................................ 12 Figure 13: Conceptual diagrams of the Freshwater management option at the end of the action period (2015). ....................................................................................................................................................................... 13 Figure 14: Lake Albert salinity for the Freshwater-pumping scenario at February 2015 showing the north-south gradient. ............................................................................................................................................................................... 14 Figure 15: Conceptual diagrams of the various management options, grouped under ecosystem state, at the end of the Entitlement flows recovery period (2025).......................................................................................... 16 Figure 16: Conceptual diagrams of the various management options, grouped under ecosystem state, at the end of the Average flows recovery period (2025).............................................................................................. 17
List of Tables Table 1: Summary of salinity, acidification and water level impacts for the action and recovery periods for each scenario in Lake Alexandrina. ................................................................................................................................ 19 Table 2: Summary of salinity, acidification and water level impacts for the action and recovery periods for each scenario in Lake Albert. ........................................................................................................................................... 20
Appendices Appendix A: Bathymetry maps for Lake Alexandrina (upper) and Lake Albert (lower) in May 2009................... 22�Appendix B: Aerial photographs of blocking banks at Narrung Narrows (upper) and Clayton (lower) in September 2009. ................................................................................................................................................................... 23�Appendix C: Salinity conversion table. ............................................................................................................................ 24�

Introduction Lakes Alexandrina and Albert, at the junction of the River Murray and the Southern Ocean in South Australia, are at risk of widespread acidification if River Murray inflows are low and lake levels drop to -1.5 and -0.5 m AHD (approximate metres below sea level), respectively. To address this, the Department of Environment and Natural Resources (DENR) commissioned an assessment of the likely ecological consequences associated withdifferentwater management options.
The first option is to Do-nothing, let the lakes drawdown and potentially acidify. Another option is to introduce seawater into Lake Alexandrina, through the barrages that separate the lakes from the Coorong, Murray Mouth and the sea, to just above the critical levels. Athirdoption is to deliver additional River Murray flows and use freshwater to maintain lake levels. Within each of these regional optionsis the additional choice of pumping water from Lake Alexandrina to Lake Albert, or not. This gives a total of six management options.
The start date for assessment was October 2009. At that time, water levels in the lakes were very low (approximately -0.8 mAHD compared to full supply level of +0.75 mAHD) and large areas of acid sulfate soils had been exposed (Figure 1; Appendix A1).
It was not known whether future River Murray inflows would be sufficient to prevent further drawdown and widespread acidification of the lake water.
1 Appendix A contains the bathymetry maps for Lakes Alexandrina and Albert for reference throughout the document where water levels are discussed.
1
Figure 1: Aerial photographs of the area around the barrages at normal pool level (+0.6 mAHD, left) in 2003 and during the drawdown in 2009 (-0.8 mAHD, right).

Flow regulators were in place at Clayton and across the Narrung Narrows (Figure 2 and Appendix B).
It was also assumed that the Pomanda Island weir near Wellington would be built and that the barrages would be closed, except for when seawater was being introduced in the seawater scenarios.
The ecosystem in October 2009 (the Baseline ecosystem state) was in relatively poor condition compared to the Ramsar ecosystem state (Figure 3)2.
The aquatic plants that had circled the lakes prior to 2006 were dried out and dead. Many indicator animal species were thought to be absent or under high levels of stress from the extensive disconnection of habitats, rising salinities and lack of aquatic plants.
The options to either Do-nothing, introduce Seawater or deliver Freshwater (with or without pumping to Lake Albert) were actioned for five years, from spring 2009 to the end of March 2015, and hydrologically modelled for salinity, pH and water levels.
After March 2015, a ten-year “recovery” period was modelled to show whether water levels, pH and salinity would return to typical operating levels by 2025, that is:
• water levels of approximately +0.6 m AHD,
• near-neutral pH (pH of 7) and
• salinity of < 0.64 g/L (or 1,000 μS cm-1 E.C.3) in Lake Alexandrina and < 0.84 g/L (or 1,400 μS cm-1 E.C.) in Lake Albert.
River Murray inflows during the recovery period were modelled as being either Entitlement flows (1850 GL/y across the SA border) or Average flows (4,000 to 5,000 GL/y across the SA border).
Literature reviews, ecological theory and experts’ opinions on likely ecological responses to changing salinity, water levels and pH were used to determine the ecological consequences associated with implementing the six management options for five years and ten years of recovery that are presented here.
2 In 1985, Australia designated the Coorong and Lakes Alexandrina and Albert as a Wetland of International Importance under the Ramsar Convention on Wetlands (1971). This designation carries with it the obligation to manage the site in a way that will maintain Ecological Character.
2
3 A conversion table and explanation of salinity definitions appears in Appendix C for reference throughout the document where salinity values are given.

3
Figure 2:A map of the site showing the permanent barrages between the islands in the south of Lake Alexandrina (blue lines) and the temporary flow regulators in place at
Clayton, Currency Creek and across Narrung Narrows (red lines).

4
Figure 3: Conceptual diagrams of the Ramsar state in 2006 and the Baseline state in October 2009 when the actions of Do-nothing, introduce Seawater and deliver
Freshwater began.

Do-Nothing Lake Alexandrina
Evaporation of impounded water in Lake Alexandrina will lead to a progressive increase in salinity and a drop in water levels in the Do-Nothing scenario during the action period (2009 to 2015; Figure 4). These changes will be less extreme if pumping to Lake Albert ceases, in order to conserve water in Lake Alexandrina, compared to if pumping continues.
If pumping to Lake Albert ceases, acidified areas will appear each autumn around the fringes of Lake Alexandrina as the water levels drop to around -1.4 m AHD but widespread acidification will not occur.
There will, however, be serial losses of all freshwater plants and most freshwater animals present in the baseline state due to the combined impacts of reduced lake area, increased salinity, acidification, trophic interactions and disruption of sensitive life stages (Figure 5).
Losses of the most salt-sensitive taxa will occur in the first year (salinity > 10 g/L).Within two years, there will be a shift to more simple ecosystem dominated by plankton, insect larvae (including mosquitoes), tubeworms and the more salt-tolerant fish and macroinvertebrates as salinities reach around 25 g/L. Golden perch, Murray cod and Common carp may persist in the northern parts of the lake directly under the influence of River Murray inflows although their populations will likely be small and severely salt stressed.
5
Figure 4: Lake Alexandrina Salinity in the Do nothing-pumping scenario at February 2012. Scale is in g/L.

�
Figure 5: Conceptual diagrams of the Do-Nothing management option at the end of the action period (2015).
6

Disconnection of the southern parts of the lake from the Coorong and Murray Mouth will limit or prevent colonisation by most estuarine biota that might replace declining or lost freshwater taxa. Continued pumping from Lake Alexandrina to Lake Albert will exacerbate the problems in Lake Alexandrina by further increasing salinity and lowering the water levels to below the acidification tipping point and inducing widespread acidification within 3 to 4 years. This will be fatal for 75 to 100% of all native and introduced populations (Figure 6). Only fish or plankton able to tolerate these high salinity levels and avoid the acid by retreating to deep-water habitats will be able to survive and then in only in highly stressful conditions with very poor food supplies. Birds may experience periods of high food availability, especially during fish kills, but will ultimately leave the site. This constitutes ecological collapse and loss of the aquatic ecosystem (Figure 5).
Figure 6: Acidification event in Lake Alexandrina under the Do-nothing pumping scenario in June 2013.
Note mid to dark blue is pH < 4 and orange to red is pH > 7.
Lake Albert If pumping continues, the water levels in Lake Albert will remain high enough that acidification will not occur (around -0.4 m AHD). However, increases in salinity alone will lead to serial losses of all freshwater plants and animals, such that the salt-sensitive ones will have perished within 18 months (28 g/L; Figure 5). Disconnection and dispersal distance will severely limit colonisation by estuarine species. Salinities will continue to increase to hypersaline concentrations (> 60 g/L; Figure 7), which will be fatal for any fresh, brackish, estuarine and marine biota occupying the lake. The resulting ecosystem will be extremely simple, containing small-mouthed hardyhead fish, insect larvae, highly generalist birds and little else (analogous to the very simple, hypersaline communities seen in the South Lagoon of the Coorong).
7

Figure 7: Lake Albert salinity in the Do‐nothing pumping scenario at January 2014. Scale is in g/L.
If pumping ceases, Lake Albert will become increasingly saline before widespread acidification occurs and the lake dries. This will result in loss of all aquatic habitat and complete ecological collapse within two years (Figures 5 and 8).
Figure 8: Typical illustration of Lake Albert when dry under any of the cease‐pumping scenarios. The white outline shows the acidification tipping point(‐0.5 m AHD). Refer to the map in Appendix A
for Lake Albert bathymetry.
8

Introduce Seawater Lake Alexandrina
Introducing seawater to maintain target water levels (around -1.3 m AHD) will effectively prevent widespread acidification of Lake Alexandrina. Only short-lived patches of low pH water will occur around the lake fringes in some years. However, salinities in Lake Alexandrina will increase rapidly and greatly after seawater is introduced each spring, leading to catastrophic ecological outcomes.
In the first year, salinities will increase to typically estuarine concentrations (around 20 g/L), which will persist for approximately 12 months before salinities will increase further to marine and then hypersaline concentrations (up to 100 g/L). River Murray inflows each winter will freshen the confluence but will not be sufficient to penetrate the main lake body. Subsequent seawater inputs will ‘freshen’ the southern parts of the lake to near seawater concentrations (36 g/L; Figure 9).
Figure 9: Lake Alexandrina salinity in the Seawater pumping scenario at December 2012 showing the freshening effect of River Murray water in the north and seawater in the south.
Note that salinities increase beyond this in subsequent years. Scale is in g/L.
The opening of the barrages will temporarily connect the Murray Mouth and the Coorong to Lake Alexandrina each spring but seasonal timing, unfavourable salinity gradients and low pH will limit colonisation by estuarine or marine taxa as well as limiting other biotic movements. The barrages will be closed at all other times. Therefore, those species that require free passage between fresh and saline habitats to complete their life cycles (e.g. diadromous) will become extinct. The net effect of Seawater introduction is, therefore, loss of salt-sensitive taxa in the first year followed by serial loss of all freshwater and any colonising estuarine taxa (including fish) within the second and third year of seawater introduction. Insect larvae, the hardiest macroinvertebrates, small-mouthed hardyhead fish and the birds that prey upon them will persist into the fourth, and possibly fifth, years but will be increasingly stressed and decline over time (Figure 10).
9

Figure 10: Conceptual diagrams of the Seawater management option at the end of the action period (2015).
10

Pumping to Lake Albert will have no significant effect on the ecological consequences in Lake Alexandrina other than to slow the rise in salinity to hypersaline conditions equivalent to those in the cease-pumping scenario, thereby delaying the loss of any one biotic group by several months. The overall effect of ecological collapse will, however, be the same (Figure 10). Lake Albert If pumping continues, Lake Albert will not acidify. Salinity will, however, increase so rapidly that the freshwater taxa will be lost in the first year (20 g/L) and estuarine taxa in the second year (60 g/L; Figure 11). In the third year, even the hardiest taxa will be in severe decline (115 g/L), indicating near complete ecological loss (Figure 10).
Figure 11: Lake Albert salinity in the Seawater‐pumping scenario at October 2012. Note scale is in g/L and extends to 100 g/L. The Narrung Narrows will be fresher at this time.
If pumping ceases, the Lake Albert ecosystem will be lost from the combined impacts of widespread acidification and desiccation as in the Do-Nothing scenario (Figures 8 and 10).
Murray Mouth and Coorong Introduction of seawater will not induce salinity stress in biota within the Murray Mouth and Coorong because the resulting increase in salinity is ecologically insignificant against the high background salinity. There will be adverse effects associated with water level changes and unfavourable periods of sediment drying for some estuarine biota. There may also be increased scouring and deposition of sediments around the barrages.
11

Deliver Freshwater Lake Alexandrina
Delivering enough River Murray water to keep the lakes at the target water levels (around -1.3 m AHD) will prevent widespread acidification. It will not, however, prevent ecological harm from increasing salinity. Salinities in Lake Alexandrina will increase over time to the upper end of the fresh salinity band (8 to 10 g/L; Figure 12a),more than ten times the Ramsar salinity target (0.64 g/L). Even so, salinities will remain much lower than in the Do-nothing or introduce Seawater options.
(a) (b)
Figure 12: Lake Alexandrina salinity in the Freshwater pumping (a) and cease‐pumping (b) scenarios at April 2012.Note that salinity patterns will be similar but salinities will be higher in
the cease‐pumping than the pumping scenario.
This salinity increase will lead to loss of the fourteen most salt-sensitive freshwater taxa present in the baseline state (Figure 13). Many of the more salt-tolerant freshwater taxa will persist, although towards the end of the action period, they will be highly stressed and may perish due to loss of critical trophic interactions and disruption of their life cycles.
On-going disconnection will lead to extinction of the diadromous fish that rely on connection between fresh and saline habitats, even though lake salinities may be suitable. Invasive tubeworms will not be able to tolerate winter freshening, which will lead to their decline over time. Other estuarine taxa, with the exception of highly dispersive plankton, will not establish.
Pumping to Lake Albert will improve the salinity regime in Lake Alexandrina (5 to 7.5 g/L; Figure 12b) presumably because more freshwater will flow through Lake Alexandrina than if pumping ceases and salt will be exported to Lake Albert. However, the fourteen most salt-sensitive freshwater taxa will still perish and the adverse impacts of disconnection will be unchanged from the cease-pumping scenario(Figure 13).
12

Figure 13: Conceptual diagrams of the Freshwater management option at the end of the action period (2015).
13

Lake Albert
Pumping freshwater in from Lake Alexandrina will prevent widespread acidification in Lake Albert but it will cause a progressive increase in salinity (up to 65 g/L; Figure 14). This will lead to the serial loss of all but the ten most salt-tolerant taxa within the first year (Figure 13). The remaining biota will become increasingly stressed by habitat loss and resource limitations over time, indicating severe ecological damage.
Figure 14: Lake Albert salinity for the Freshwater‐pumping scenario at February 2015 showing the north‐south gradient.
Note the scale is in g/L and extends to 60 g/L even though salinities will be higher at this time.
As for the Do-nothing and introduce Seawater options, the Lake Albert ecosystem will collapse from acidification and desiccation if pumping ceases in the Freshwater scenario (Figures 8 and 13).
14

Capacity to recover under Entitlement and Average flows
Lake Alexandrina
Under Entitlement flows (1,850 GL/y over the SA Border) the water levels will remain low, recovering to near the baseline level (around -0.75 m AHD) if pumping to Lake Albert continues and to near sea level (0 m AHD) if pumping ceases. All the flow regulators will remain in place and the barrages will remain closed.
The former riparian zone will not be reconnected to the lake water body. It is highly unlikely that the aquatic vegetation will establish down gradient at the ‘new’ shoreline. Therefore, the vegetation will not recover and neither will most of the other taxa because of their dependence upon the initial recovery of vegetated habitats.
The resulting ecological communities will differ between the different management options depending on whether there will be a transition to a hypersaline or acidic ecosystem, or not, during the action period (Figure 15).
In all cases, there is an on-going loss of freshwater biota and an extended trend away from the Ramsar state under Entitlement recovery flows.
Water levels will return to typical operating levels (approximately +0.6 m AHD) within 18 months under Average recovery flows (4,000 to 5,000 GL/y over the SA Border). Salinities will decrease during the recovery period (< 2 g/L in the Do-nothing and ~1 g/L in the Freshwater scenarios) but will not be low enough to meet the Ramsar target (0.64 g/L) or support self-sustaining populations of all biota seen in the Ramsar state (Figure 3).
Salinities in the seawater scenarios will remain higher for longer across larger lake areas (20 g/L until 2019), than in the other scenarios, but will decrease to within the freshwater band (4 g/L) by the end of the 10-year recovery period.
Water levels will be high enough (+0.6 m AHD) to inundate of the former lakeshore under Average recovery flows. This will stimulate growth of simple reed beds with low diversity and relatively poor ecological function compared to the Ramsar state (Figures 3 and 16).
Strong, diverse beds of emergent and submerged plants will not recover. This means that the aquatic plant community will be unable to support recovery of the complete Ramsar ecosystem state.
Overall, the greatest number of Ramsar taxa will recover in the Freshwater scenario. Recovery potential will be lower in the Do-Nothing and lowest in the Seawater scenarios.
15
Recovery will be better following the catastrophic impacts of widespread acidification in the Do-nothing pumping scenario than following the catastrophic impacts of hypersalinity in the Seawater scenarios. This is primarily due to low pH (acidic) conditions being readily reversed (chemical neutralisation) by incoming River Murray water, whereas salts need to be physically flushed out of the system which will take considerable time (~ 8 years) and will lead to on-going and severe salt stress.

Figure 15: Conceptual diagrams of the various management options, grouped under ecosystem state, at the end of the Entitlement flows recovery period (2025).
16

Figure 16: Conceptual diagrams of the various management options, grouped under ecosystem state, at the end of the Average flows recovery period (2025).
17

Lake Albert Under Entitlement flows with continued pumping into Lake Albert, the water levels will be too low (0 m AHD) to reconnect the former riparian zone in Lake Albert and salinities will remain very high, being near seawater concentrations (36 g/L) in the Do-nothing and Freshwater scenarios and Ultrasaline (170 g/L) in the Seawater scenarios. As a consequence, ecological recovery will not occur (Figure 15). If pumping ceases, then Lake Albert will remain dry until the end of the assessment period (2025). Under Average recovery flows, water levels will return to normal operating levels in Lake Albert (around +0.6 m AHD), reconnecting the former riparian zone. However, salinities will be significantly higher for longer (ultrasaline to brackish) than in the respective Lake Alexandrina scenarios, which will limit recovery to just the hardiest taxa (Figure 16). Simple reed beds will eventually establish with the highest recovery potential in the Freshwater and the lowest in the Seawater pumping scenarios. The catastrophic impacts in the cease-pumping scenarios will prevent recovery in Lake Albert, regardless of the management option. There will be comparatively much lower recovery in Lake Albert if pumping ceases than if pumping continues even if the Narrung Narrows flow regulator is removed and the lake refills and freshens rapidly after 2015, as will be the case under Average recovery flows (Figure 16).
Conclusions Summaries of the key physico-chemical changes and corresponding ecological responses of taxa present in the Ramsar ecosystem state (Figure 3) and invasive taxa are shown in Tables 1 and 2. The conclusions that can be drawn from the ecological consequences assessment are presented below:
Maintenance of lake water levels above the acidification tipping points (-1.5 mAHD and -0.5 m AHD in Lakes Alexandrina and Albert, respectively) using Seawater or Freshwater will prevent the widespread acidification seen in the Do-nothing option and when pumping ceases in Lake Albert.
Salinity will be a key driver of ecological change in all scenarios, regardless of whether acidification occurs or not.
The introduction of seawater to Lake Alexandrina will lead to extreme increases in salinity and transition to highly simplified, hypersaline ecosystems. A healthy, estuarine/marine community will not establish.
Delivering just the amount of River Murray water required to prevent acidification will not maintain the ecosystem and there will be on-going loss of taxa central to the Ramsar ecosystem state.
18
Only invasive taxa will increase in abundance under any scenario, suggesting a significant shift from the Ramsar state to ones increasingly dominated by pest species.

Table 1: Summary of salinity, acidification and water level impacts for the action and recovery periods for each scenario in Lake Alexandrina. The two recovery scenarios are Entitlement (1.850 GL/y over SA border) and Average (4,000 to 5,000 GL/y) flows. Numbers of taxa are out of a possible 36 Ramsar taxa (present in Ramsar state) and 6 invasive taxa (not present in Ramsar state). Fresh < 10 g/L, Brackish 10-15 g/L, Saline 15-25, Marine 25-50 g/L, Hypersaline 50 -150 g/L and Ultrasaline > 150 g/L. The salinity threshold for the Ramsar-state is < 0.64 g/L in Lake Alexandrina.
19
Scenario Action period Entitlement Recovery
Average Recovery
Do-Nothing No Pumping Brackish to Saline
Localised acidification Low water levels (-1.4 m AHD) 16 Ramsar taxa 6 Invasive taxa
Fresh No acidification Low water level (0.0 m AHD) 12 Ramsar taxa 4 Invasive taxa
Fresh No acidification Typical water level (+0.6 m AHD) 24 Ramsar taxa 4 Invasive taxa
Pumping to Lake Albert
Fresh to Brackish Widespread acidification Very low water level (-2.2 m AHD) 4 Ramsar taxa 2 Invasive taxa
Fresh No acidification Low water level (-0.75 m AHD) 8 Ramsar taxa 4 Invasive taxa
Fresh No acidification Typical water level (+0.6 m AHD) 21 Ramsar taxa 3 Invasive taxa
Seawater No Pumping Saline to Hypersaline
Localised acidification Water levels maintained (-1.3 m AHD) 7 Ramsar taxa 2 Invasive taxa
Marine to Fresh No acidification Low water level (0.0 m AHD) 4 Ramsar taxa 1 Invasive taxa
Brackish to Fresh No acidification Typical water level (+0.6 m AHD) 19 Ramsar taxa 4 Invasive taxa
Pumping to Lake Albert
Saline to Hypersaline Localised acidification Water levels maintained (-1.3 m AHD) 7 Ramsar taxa 2 Invasive taxa
Saline to Fresh No acidification Low water level (-0.75 m AHD) 4 Ramsar taxa 1 Invasive taxa
Brackish to Fresh No acidification Typical water level (+0.6 m AHD) 19 Ramsar taxa 4 Invasive taxa
Freshwater No Pumping Fresh
Negligible acidification Water levels maintained (-1.3 m AHD) 22 Ramsar taxa 6 Invasive taxa
Fresh No acidification Low water level (0.0 m AHD) 12 Ramsar taxa 4 Invasive taxa
Fresh No acidification Typical water level (+0.6 m AHD) 24 Ramsar taxa 4 Invasive taxa
Pumping to Lake Albert
Fresh Negligible acidification Water levels maintained (-1.3 m AHD) 22 Ramsar taxa 6 Invasive taxa
Fresh No acidification Low water level (-0.75 m AHD) 12 Ramsar taxa 4 Invasive taxa
Fresh No acidification Typical water level (+0.6 m AHD) 24 Ramsar taxa 4 Invasive taxa

Table 2: Summary of salinity, acidification and water level impacts for the action and recovery periods for each scenario in Lake Albert. The two recovery scenarios are Entitlement (1850 GL/y over SA border) and Average (4,000 to 5,000 GL/y) flows. Numbers of taxa are out of a possible 34 Ramsar taxa (present in Ramsar state) and 6 invasive taxa (not present in Ramsar state).Fresh < 10 g/L, Brackish 10-15 g/L, Saline 15-25, Marine 25-50 g/L, Hypersaline 50 -150 g/L and Ultrasaline > 150 g/L. The salinity threshold for the Ramsar-state is < 0.84 g/L in Lake Albert (Phillips and Muller 2006).
Scenario Action period Entitlement Recovery
Average Recovery
Do-Nothing Pumping from Lake Alexandrina
Saline to Hypersaline No acidification Water levels maintained (-0.4 m AHD) 8 Ramsar taxa 2 Invasive taxa
Marine No acidification Low lake levels (0.0 m AHD) 4 Ramsar taxa 1 Invasive taxa
Saline to Fresh No acidification Typical lake levels (+0.6 m AHD) 14 Ramsar taxa 3 Invasive taxa
No pumping Hypersaline Widespread acidification Complete drying 0 Ramsar taxa 0 Invasive taxa
Hypersaline Acidified pools Complete drying 2 Ramsar taxa 1 Invasive taxa
Marine to Fresh No acidification Typical lake levels (+0.6 m AHD) 9 Ramsar taxa 1 Invasive taxa
Seawater Pumping from Lake Alexandrina
Saline to Hypersaline No acidification Water levels maintained (-0.4 m AHD) 7 Ramsar taxa 2 Invasive taxa
Ultrasaline No acidification Low lake levels (0.0mAHD) 2 Ramsar taxa 1 Invasive taxa
Ultrasaline to Brackish No acidification Typical lake levels (+0.6 m AHD) 8 Ramsar taxa 3 Invasive taxa
No pumping Hypersaline Widespread acidification Complete drying 0 Ramsar taxa 0 Invasive taxa
Hypersaline Acidified pools Complete drying 2 Ramsar taxa 1 Invasive taxa
Saline to Brackish No acidification Typical lake levels (+0.6 m AHD) 5 Ramsar taxa 1 Invasive taxa
Freshwater Pumping from Lake Alexandrina
Saline to Hypersaline No acidification Water levels maintained (-0.4 mAHD) 8 Ramsar taxa 2 Invasive taxa
Marine No acidification Low lake levels (0.0 m AHD) 4 Ramsar taxa 1 Invasive taxa
Saline to Fresh No acidification Typical lake levels (+0.6 m AHD) 20 Ramsar taxa 3 Invasive taxa
No pumping Hypersaline Widespread acidification Complete drying 0 Ramsar taxa 0 Invasive taxa
Hypersaline Acidified pools Complete drying 2 Ramsar taxa 1 Invasive taxa
Marine to Fresh No acidification Typical lake levels (+0.6 m AHD) 10 Ramsar taxa 1 Invasive taxa
20

Capacity to recover will be less following Seawater introduction than the other management options. Furthermore, introduction of seawater is likely to affect nutrient cycling, enhance metal bioavailability and increase potential acid sulfate soils in the future, which have not been considered here.
Recovery of key physico-chemical parameters (e.g. salinity, pH and water levels) will not necessarily lead to ecological recovery. This is primarily because of the constraints associated with trophic interactions and the dispersal, establishment and persistence mechanisms of different taxa.
Some new alternate ecosystem states will be highly resilient to restoration towards the Ramsar state and very little recovery will occur.
Recovery potential will be lower under entitlement flows (1,850 GL/y over the SA border) than under average recovery flows (4,000 to 5,000 GL/y over the SA border) in all scenarios, primarily because water levels will not reconnect the lake water body to the former riparian zone and new riparian vegetation will not establish further down the elevation gradient under entitlement flows.
Entitlement flows over the recovery period will not halt the decline in freshwater ecosystem components nor prevent transition away from the Ramsar state in any scenario.
The shift under most recovery scenarios from saline and/or acidic conditions to fresh, circum-neutral conditions will occur so quickly that it will constitute an additional ecological disturbance rather than an alleviation of stress.
Out of all the management options, Freshwater delivery is the only one which will trend towards the Ramsar state. However, there will still be decline in ecological viability and increased dominance of invasive taxa, even under average recovery flows.
Any recovery towards the Ramsar state will take decades of average or greater River Murray inflows as well as extensive interventions (e.g. captive breeding, revegetation, water level management, translocations). It is highly likely that the ecological consequences associated with any of the management options evaluated here will persist beyond 2025.
21

Appendix A: Bathymetry maps for Lake Alexandrina (upper) and Lake Albert (lower) in May 2009.
22

Appendix B: Aerial photographs of blocking banks at Narrung Narrows (upper) and Clayton (lower) in September 2009.
23
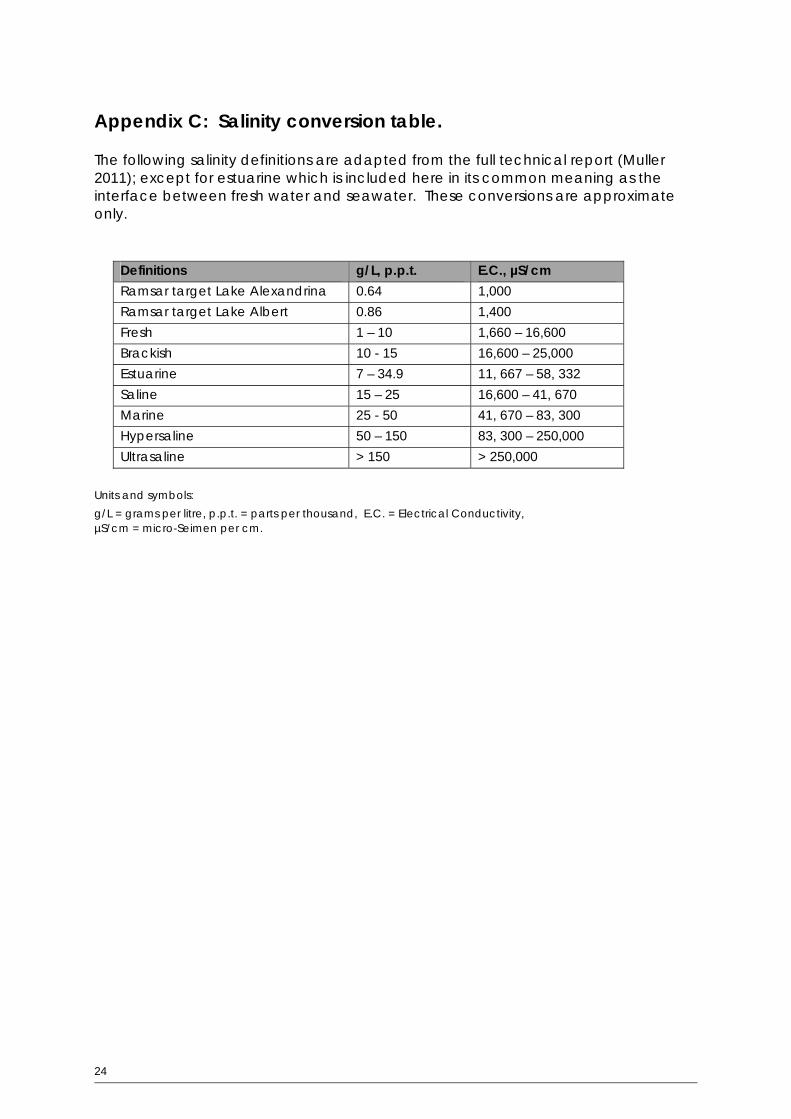
Appendix C: Salinity conversion table. The following salinity definitions are adapted from the full technical report (Muller 2011); except for estuarine which is included here in its common meaning as the interface between fresh water and seawater. These conversions are approximate only.
Definitions g/L, p.p.t. E.C., µS/cm Ramsar target Lake Alexandrina 0.64 1,000 Ramsar target Lake Albert 0.86 1,400 Fresh 1 – 10 1,660 – 16,600 Brackish 10 - 15 16,600 – 25,000 Estuarine 7 – 34.9 11, 667 – 58, 332 Saline 15 – 25 16,600 – 41, 670 Marine 25 - 50 41, 670 – 83, 300 Hypersaline 50 – 150 83, 300 – 250,000 Ultrasaline > 150 > 250,000
Units and symbols: g/L = grams per litre, p.p.t. = parts per thousand, E.C. = Electrical Conductivity, µS/cm = micro-Seimen per cm.
24

1