Embed Size (px)
Citation preview

For Peer ReviewBiosorption, metals
Journal: Wiley Encyclopedia of Industrial Biotechnology Manuscript ID: draft
Wiley - Manuscript type: Article Date Submitted by the
Author: n/a
Complete List of Authors: NAJA, Ghinwa; McGill University, Chemical Engineering Murphy, Vanessa; Waterford Institute of Technology Volesky, Bohumil
Keywords: Biosorption process, Sorption mechanisms, Isotherm, Modeling, Equilibrium and Dynamics
John Wiley & Sons
2t-S-1Ed-D-P
For Peer Review
1
Biosorption, MetalsG. NAJA, McGill University, Montreal, CanadaV. MURPHY, Waterford Institute of Technology, Waterford, IrelandB. VOLESKY, McGill University, Montreal, Canada
KEY WORDSModeling, equilibrium, dynamics, biosorption process, breakthrough curves, isotherm, potentiometric titration, Gran's method, seaweeds, sorption mechanisms.
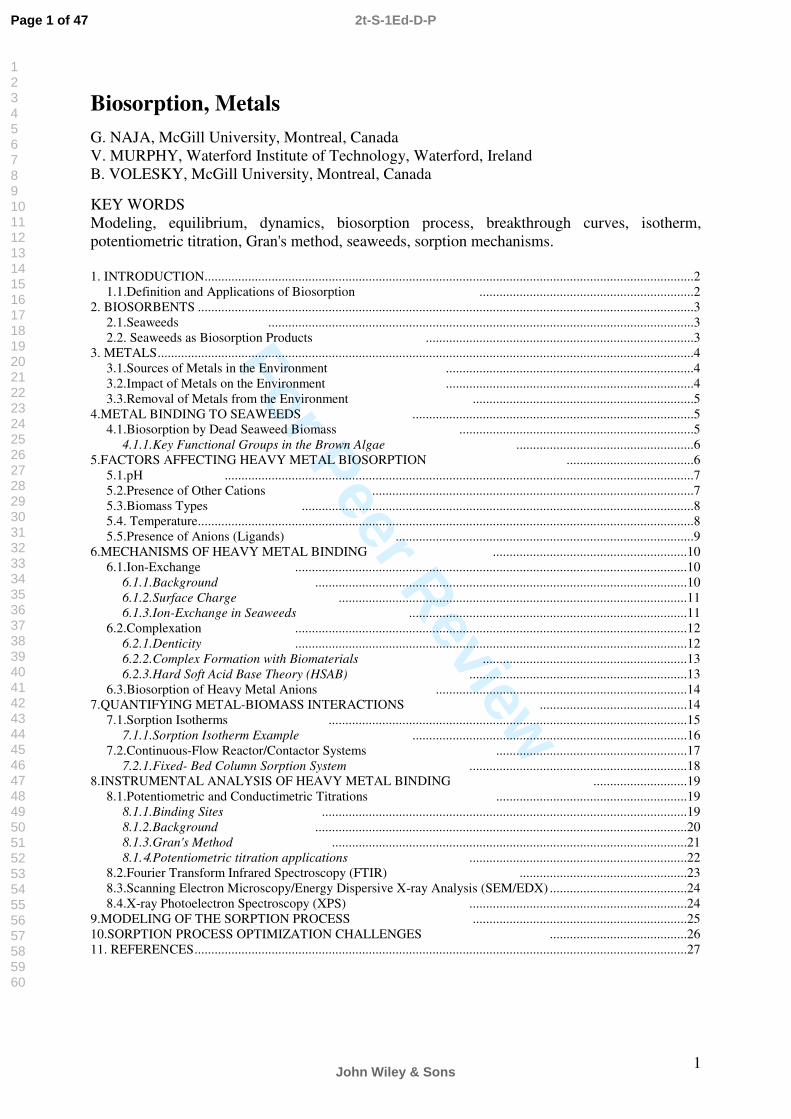
1. INTRODUCTION..................................................................................................................................................21.1.Definition and Applications of Biosorption ................................................................2
2. BIOSORBENTS ....................................................................................................................................................32.1.Seaweeds ...............................................................................................................................32.2. Seaweeds as Biosorption Products ................................................................................3
3. METALS................................................................................................................................................................43.1.Sources of Metals in the Environment ..........................................................................43.2.Impact of Metals on the Environment ..........................................................................43.3.Removal of Metals from the Environment ..................................................................5
4.METAL BINDING TO SEAWEEDS ....................................................................................54.1.Biosorption by Dead Seaweed Biomass ......................................................................5
4.1.1.Key Functional Groups in the Brown Algae .....................................................65.FACTORS AFFECTING HEAVY METAL BIOSORPTION ......................................6
5.1.pH ............................................................................................................................................75.2.Presence of Other Cations ................................................................................................75.3.Biomass Types .....................................................................................................................85.4. Temperature....................................................................................................................................................85.5.Presence of Anions (Ligands) .........................................................................................9
6.MECHANISMS OF HEAVY METAL BINDING ..........................................................106.1.Ion-Exchange .....................................................................................................................10
6.1.1.Background ...............................................................................................................106.1.2.Surface Charge ........................................................................................................116.1.3.Ion-Exchange in Seaweeds ...................................................................................11
6.2.Complexation .....................................................................................................................126.2.1.Denticity .....................................................................................................................126.2.2.Complex Formation with Biomaterials .............................................................136.2.3.Hard Soft Acid Base Theory (HSAB) .................................................................13
6.3.Biosorption of Heavy Metal Anions ...........................................................................147.QUANTIFYING METAL-BIOMASS INTERACTIONS ............................................14
7.1.Sorption Isotherms ...........................................................................................................157.1.1.Sorption Isotherm Example ..................................................................................16
7.2.Continuous-Flow Reactor/Contactor Systems .........................................................177.2.1.Fixed- Bed Column Sorption System .................................................................18
8.INSTRUMENTAL ANALYSIS OF HEAVY METAL BINDING ............................198.1.Potentiometric and Conductimetric Titrations .........................................................19
8.1.1.Binding Sites .............................................................................................................198.1.2.Background ...............................................................................................................208.1.3.Gran's Method ..........................................................................................................218.1.4.Potentiometric titration applications .................................................................22
8.2.Fourier Transform Infrared Spectroscopy (FTIR) ..................................................238.3.Scanning Electron Microscopy/Energy Dispersive X-ray Analysis (SEM/EDX) .........................................248.4.X-ray Photoelectron Spectroscopy (XPS) .................................................................24
9.MODELING OF THE SORPTION PROCESS ................................................................2510.SORPTION PROCESS OPTIMIZATION CHALLENGES .........................................2611. REFERENCES...................................................................................................................................................27
Page 1 of 47
John Wiley & Sons
2t-S-1Ed-D-P
123456789101112131415161718192021222324252627282930313233343536373839404142434445464748495051525354555657585960
For Peer Review
2
1. INTRODUCTION
Metal ions in the environment are bio-magnified in the food chain and accumulated in tissues. Cadmium for example has a half life of 10 - 30 years in the human body (1). Therefore, toxic effects of heavy metals in particular are especially pronounced in animals of higher trophic levels and especially in humans. In the past decades, efficient biological treatment systems for sewage have been installed in most industrial countries. In most cases, however, there is no specific treatment for removing heavy metals that, once “unearthed”, keep circulating in the environment in ever-increasing amounts. While the heavy metal ions may be accumulated in the biomass (sludge) of biological sewage treatment steps (which leads to a purification of the liquid phase) (2), these resulting byproduct sludges may carry a heavy freight of toxic metal ions. As this restricts the possible use of the sludge as a soil conditioner in the fields the demands for its final disposal (in safe landfills) or incineration keep increasing. While the latter presents air-pollution and/or ash disposal problems, the former is undesirable in terms of land requirements and costs involved in a safe long-term deposition.
It is thus quite beneficial to devise separate pre-treatment facilities for the elimination of heavy metals from waste water, ideally at the site of those plants that discharge significant amounts of heavy metal ions with their waste water. Such on-site treatment of waste streams contributing a load of heavy metals would be more efficient than treating the large volumes of mixed, diluted metal-contaminated waste water in a general (municipal) sewage treatment plant. Additionally, it appears reasonable from a policy viewpoint that the one who causes the so persistent metal pollution should be responsible for its elimination.
Natural metal recycling in the environment makes metal recovery the only effective way of preventing heavy metals from accumulation and poisoning of the environment. If a cost-effective way of 'completely' eliminating heavy metal contamination could be found, this goal could be attainable. Current research activity in the field attempts to evaluate whether biosorption may eventually provide such an effective and economical treatment process alternative.
1.1. Definition and Applications of BiosorptionThe term biosorption commonly refers to the passive binding of metal ions or
radioactive elements by dead biomass. It has to be distinguished from bio-accumulation which is usually understood to be an active, metabolically mediated metal-accumulation process occurring specifically in living organisms.
It has been known for decades that different brown algae bind trace metal ions, achieving concentration factors (compared to the sea water) of 1000 or more (3). The focus in early studies has been exclusively on the toxicological aspects of biosorption. Recently, however, efforts are being made to harness this phenomenon into a technique for the detoxification of metal-bearing industrial effluents by removing and/or eventually also recovering the metals. The latter is even more attractive in case of precious element recovery from the sea water or from residual industrial processing solutions. The process of gold sorption by Sargassum has been patented, and the immobilized biosorbents AlgaSORB and AMT-BIOCLAIM have been made commercially available at one time (4).
Biosorption removal of toxic heavy metals is especially suited as a 'polishing' wastewater treatment step because it can produce close to drinking water quality (from initial metal concentrations of 1-100 mg L-1, final concentration < 0.01 - 0.1 mg L-1), especially in packed-bed flow-through applications. In order to prevent unnecessarily rapid exhaustion of the sorption capacity when the metal concentrations in the waste water to be treated are very high
Page 2 of 47
John Wiley & Sons
2t-S-1Ed-D-P
123456789101112131415161718192021222324252627282930313233343536373839404142434445464748495051525354555657585960
For Peer Review
3
(> 100 mg L-1) a pretreatment by different techniques (such as precipitation or electrolytic recovery) may be desirable to remove the bulk of the metal (5).
Metal-saturated used-up biosorbent materials can be easily regenerated by a simple (e.g. acidic) wash which then contains a very high concentration of released metals in a small volume making the solution quite amenable to economical metal recovery by applyingcommon electro-winning techniques. The overall achievement of biosorption (complete adsorption + desorption cycle) is to concentrate the metal solution, possibly by a factor of ~ 100 or more. Alternatively, due to is low cost, even the unprocessed, once-through used-up metal-laden biosorbent can be disposed of by either incineration or it could be landfilled, having a rather small volume when compared to the wastewater - the biosorption process serves to reduce the overall waste volume.
Compared to conventional wastewater "polishing" techniques such as ion-exchange, activated carbon treatment or membrane technologies (electro-dialysis, reverse osmosis), the advantage of biosorption is not only in that it can be operated under a broad range of conditions (pH, temperature) but especially that it appears to be economically attractive due to the cheap raw materials that can be used as biosorbents (6). These include waste products from other industries (e.g. fermentation byproducts) or renewable and naturally abundant biomass (e.g. ubiquitous marine algae).
2. BIOSORBENTS
Biosorbent materials are derived from raw microbial, seaweed or even some plant biomass through different kinds of simple procedures. They may be chemically pretreated for better performance and/or suitability for process applications. Biosorbents are capable of directly sorbing metal ionic species from aqueous solutions. A multitude of biomass types (7), comprising fungal biomass (8), bacterial biomass (9), algae (10), (11), (12), peat (13), (14) etc. have been studied for their biosorption of metals. Table 1 illustrates some of the results of biosorption studies appearing in the literature after 2000 (15 - 44). From this Table, it is clear that marine algae have been among the most promising metal biosorbents. Metal uptake by some of the brown seaweed species has been established as significantly higher than that observed for fungal or yeast biomass pointing to the particular suitability of this renewable resource as a raw material supply for new biosorbents. 2.1. Seaweeds
Seaweeds are marine algae: saltwater-dwelling, simple organisms that fall into the general category of "plants" (45). They are found throughout the world’s oceans and are classified into brown, red and green seaweeds (46). The mixture of pigments in their chloroplasts lends characteristic colors to the algae and many of their common and scientific names are based on these colors. Seaweeds may be classified as follows (47): The largest and most comprehensive taxonomic group within plants is called the division. There are seven divisions of algae, four of which contain seaweeds as members. Divisions which include the larger visible seaweeds are the Cyanophyta (blue-green algae), Chlorophyta (green algae), Rhodophyta (red algae) and Phaeophyta (brown algae) (48). However, the Cyanophyta are eubacteria, and are therefore evolutionarily distinct from seaweeds (49). These divisions are subdivided into orders (e.g. Fucales), which are subsequently divided into families (e.g. Fucaceae), and then into genus (e.g. Fucus) and species (e.g. vesiculosus) (47).
2.2. Seaweeds as Biosorption ProductsSeaweeds have developed a reputation as one of the most promising types of
biosorbents in view of their rigid macro-structure and high uptake capacity as well as the ready
Page 3 of 47
John Wiley & Sons
2t-S-1Ed-D-P
123456789101112131415161718192021222324252627282930313233343536373839404142434445464748495051525354555657585960
For Peer Review
4
abundance of the biomass in many parts of the world's oceans (50). The Phaeophyta algal embedding matrix is predominately alginic acid (a long-chained heteropolysaccharide), with smaller amounts of the sulphated polysaccharide fucoidan, while the Rhodophyta contain a number of sulphated galactans (e.g. agar, carrageenan, porphyran, etc.). Both the Phaeophytaand Rhodophyta contain the largest amount of amorphous embedding matrix polysaccharides making them potentially excellent materials for heavy metal binding (49).
3. METALS
3.1. Sources of Metals in the EnvironmentMetals in the aquatic environment may exist in dissolved or particulate forms. They may
be dissolved as free hydrated ions or as complex ions chelated with inorganic ligands such as OH-, Cl- or CO3
2- or they may be complexed with organic ligands such as amines, humic or fulvic acids and proteins (51).
Knowledge about metal speciation i.e. the different physical or chemical forms in which a metal occurs is widely regarded as crucial to the understanding and prediction of metal behavior and impact in any environmental system (52). The chemical speciation of a metal depends upon its oxidation state and its interactions with other components in the system as well as on other parameters including pH, redox potential, ionic strength, salinity and alkalinity (51). Changes in these variables can result in transformation of the metal’s chemical form and can alter its availability and toxicity.
Modern industry is to a large degree responsible for contamination of the environment. Among the toxic substances reaching hazardous levels are heavy metals. Recovery of heavy metals from industrial waste streams is becoming increasingly important as society realizes theenvironmental impact of these persistent and toxic contaminants as well as the necessity for recycling and conservation of essential metals. Increasingly stricter discharge limits on heavy metals have also accelerated the search for highly efficient yet economically attractive treatment methods for their removal (53). When assessing pollution, a distinction must be made between natural sources of metals and those ‘unearthed’ and released into the environment through human activity (anthropogenic source). Metals in minerals and rocks are generally harmless, becoming potentially toxic only when they dissolve in water. They can enter the environment through natural weathering of rocks, leaching of soils and vegetation and through volcanic activity. Most of the metal load is transported by water in a dissolved or particulate state, and reaches the ocean via rivers or land runoff. Humans, on the other hand, contribute metals to the environment during a variety of activities including mining and ore-processing activities, burning fossil fuels (e.g. coal-fired power generation) and disposing of industrial waste (e.g. electroplating, leather tannng, etc.) (54).
3.2. Impact of Metals on the EnvironmentDepending on the angle of interest and the environmental impacts, metals can be divided
into four major categories: (1) Toxic heavy metals, (2) strategic metals, (3) precious metals, and (4) radionuclides (51). Figure 1 summarizes the classification of metals for biosorption applications. In terms of environmental threat it is mainly categories 1 and 4 that are of interest for removal from the environment.
According to Duffus (55), the term “heavy metal” is often used in the literature as a group name for metals and semi-metals (metalloids) that have been associated with contamination and potential toxicity. However, the term has never been defined by any authoritative body such as IUPAC and research shows that the term “heavy metals” has been used inconsistently. Some authors define it in relation to density or specific gravity (56), others define it in terms of atomic mass (57) or atomic number (58) while some definitions have no clear basis except
Page 4 of 47
John Wiley & Sons
2t-S-1Ed-D-P
123456789101112131415161718192021222324252627282930313233343536373839404142434445464748495051525354555657585960
For Peer Review
5
toxicity (59). This term is misleading because they are not all “heavy” in terms of atomic weight, density, or atomic number and some are not even entirely metallic in character e.g. arsenic (metalloid). For the purpose of this review, a rough generalization of the term “heavy metals” shall include all the metals of the Periodic Table except those in Groups I and II (60).
In humans, lead is extremely toxic and can damage the nervous system, kidneys, and reproductive system, particularly in children while chronic exposure to elevated levels of cadmium is known to cause renal dysfunction, bone degeneration, liver damage, and blood damage (61). The EPA requires lead and cadmium in drinking water not to exceed 0.015 and 0.005 mg L-1, respectively. Exposure to mercury may cause allergic skin reactions, possible negative reproductive effects as well as disruption of the nervous system and damage to brain function.
3.3. Removal of Metals from the EnvironmentAs previously discussed, the removal of metals from the environment is extremely
important. Industrial wastewaters containing heavy metals require efficient and cost effective treatment (30) to remove these metals. Figure 2 lists the major target industrial sectors as outlined by Volesky (50).
Conventional methods of heavy metal removal include chemical precipitation, electrochemical techniques, reverse osmosis, evaporation and ion-exchange (62). However, these processes may be ineffective or extremely expensive especially when the metals in solution are present in the range of 1–100 mg L−1 (63, 64). These techniques may also cause secondary environmental problems due to the creation of metal-bearing sludges which are extremely difficult to dispose of. For example, conventional Cr(VI) removal from wastewaters has traditionally been carried out using ion-exchange resins, filtration and chemical treatment (65, 66). However, these methods are not completely satisfactory as they generate large amounts of secondary waste due to the various reagents used in treatments such as reduction of Cr(VI), neutralization of acidic solution and precipitation. The instability of ion-exchange resins due to serious oxidation by Cr(VI) also points to the need for alternative removal methodologies.
For these reasons, alternative technologies that are practical, efficient and cost effective at low metal concentrations are being investigated. Biosorption has been emerging as the most prominent alternative technology for heavy metal removal.
4. METAL BINDING TO SEAWEEDS
4.1. Biosorption by Dead Seaweed BiomassAs previously outlined, biosorption is a passive process of metal uptake whereby the
metal is sequestered by chemical sites naturally present and functional even when the biomass is dead (50). It is important to note that biosorption of metals by seaweed is not based solely on a single mechanism. It consists of several mechanisms that may quantitatively and qualitatively differ according to the species used. Therefore, the differences in metal uptake capacities of the seaweeds may be related to compositional differences among the cell walls, as well as different binding mechanisms involved for different heavy metal ions (37).
Metal sequestration follows complex mechanisms including ion-exchange and complexation with oxidation/reduction reactions also a possibility in some cases (7). Due to the complexity of biomaterials such as seaweed it is quite possible that at least some of these mechanisms are acting simultaneously to varying degrees depending on the seaweed, the metal ion and the solution environment (37).
Page 5 of 47
John Wiley & Sons
2t-S-1Ed-D-P
123456789101112131415161718192021222324252627282930313233343536373839404142434445464748495051525354555657585960
For Peer Review
6
4.1.1. Key Functional Groups in the Brown Algae
The constituents of the cell wall provide an extensive array of ligands with various functional groups capable of binding metallic ions. However, the actual role that any functional group plays in metal binding depends on factors such as the number of sites on the biosorbent material, their accessibility and chemical state (i.e. availability), and the affinity between site and metal (i.e. binding strength) (49). The various key structures (and their component functionalities) within each algal division are discussed below.
4.1.1.1. Phaeophyta: Alginic acidThe cell wall structure in Phaeophyta is schematically illustrated in Figure 3. Alginic
acid is an extracellular polysaccharide that occurs in all brown algae (67). It is the most abundant cell wall polysaccharide in brown algae and offers carboxyl (-COOH) groups for metal binding (49). It is a linear polysaccharide containing 1,4-linked β-D-mannuronic acid (M) and α-L-guluronic acid residues arranged in a non-regular block wise order along the chain(68). The residues typically occur as (-M-) n, (-G-) n and (-MG-) n sequences or blocks (49). The carboxylic acid dissociation constants have been determined as pKa=3.38 and pKa=3.65 for M and G respectively with similar values obtained for the polymers (69).
Figure 4 illustrates the structure of β-D-mannuronic acid (M) and α-L-guluronic acid (G).Mannuronic and guluronic acids are classed as uronic acids. Figure 5 illustrates the possible cadmium binding sites on polyuronic acids as proposed by Schweiger (70). Alginic acidusually constitutes about 10–40% of brown algal dry weight (71) but for Sargassum, alginate contents between 17% and 45% have been reported (72, 73) which corresponds to 0.85–1.25 meq g-1 of carboxyl groups per dry weight.
4.1.1.2. Fucoidan: Sulphonic Acid and ProteinsThe second most abundant acidic functional group in brown algae is the sulphonic acid of
fucoidan (72). Fucoidan is a branched matrix polysaccharide sulphate ester with L-fucose building blocks as the major component with predominantly α (1→ 2)-linkages (74). Brown algae contain about 5–20% fucoidan (72), about 40% of which are sulphate esters. The structure of fucoidan is shown in Figure 6. The concentration of R-OSO3
- detected in Sargassum was estimated to range from 0.2 to 0.3 meq g-1, representing approximately 10% of the overall metal binding sites in this seaweed (73). Sulphonic acid groups are present in the three algal divisions but typically play a secondary role in metal binding, except when metal binding takes place at low pH (49). Hydroxyl groups are also present in all polysaccharides but they are less abundant and only become negatively charged at pH >10 thus playing a secondary role in metal binding at lower pH values (75).
The protein content of seaweed varieties varies greatly and demonstrates a dependence on such factors as season and environmental growth conditions (76). In brown algae the protein content has been shown to be less than 30% (77). For Sargassum 10% protein was reported comprising ~0.17 meq g-1 carboxyl groups and ~0.07 meq g-1 amino groups (78). This means that in brown algae the carboxyl groups of alginic acid are more abundant than either carboxyl or amino groups of the protein and are therefore likely to be the main binding sites (79).
5. FACTORS AFFECTING HEAVY METAL BIOSORPTION
Although, there are many variables which can influence metal biosorption, experimental parameters such as the biomass type, pH, ionic strength and competition between metal ions can have a significant effect on metal binding to seaweeds. Some of the most important factors affecting metal binding are discussed below.
Page 6 of 47
John Wiley & Sons
2t-S-1Ed-D-P
123456789101112131415161718192021222324252627282930313233343536373839404142434445464748495051525354555657585960
For Peer Review
7
5.1. pHOf great importance in sorption is the pH value of the solution. It is commonly agreed
that the sorption of metal cations (e.g. Cd, Cu, Zn, Pb, Ni, Mn, Al, Co) increases with increasing pH (12, 80 - 85). Only those metal ions which can occur as negatively charged complexes or that have a strong "b" character (i.e. tendency to form strong covalent bonds) such as Ag, Hg or Au (e.g. as tetrachloroaureate), may show either a decrease in binding with increasing pH or may have no significant pH effect at all (81, 84, 86). There are three ways in which the pH can influence metal biosorption:
First, the state of the active sites may be changed. When the binding groups are acidic, the availability of free sites depends on pH: at lower pH the active sites are protonated and therefore competition between protons and metal ions for the sorption site occurs (87, 88). At low enough pH, virtually all sites become protonated and complete desorption of the bound metal ions is possible (89), which is why acid treatment is a method for metal elution and regeneration of the sorbent material. Decreasing the pH value by 2 units can in some cases result in a ~ 90 % reduction of metal binding (12, 80, 84, 86, 89).
Second, extreme pH values, as they are employed in the regeneration (desorption) of the sorbent, may damage the structure of the biosorbent material. Microscopic observations have shown distorted cells; significant weight loss and decrease in the sorption capacity have been observed (90).
Third, the speciation of the metal in solution is pH dependent. Whereas metals in aqueous solutions occur as hydrated cations in solvation shells when the pH is low, hydroxides may form at higher pH, especially for cations of high charge and small size (91 - 93). The formation of metal oxide and hydroxide complexes and precipitates is often called hydrolysis (i.e. decomposition or conversion by water) (94).
Adsorption depends not only on the attraction of the sorbate to the solid surface but also on its lyophobic behavior (95). This means that, sorption increases with decreasing solubility.Since the solubility of many metal complexes in solution decreases with increasing pH, this provides an additional possible explanation why sorption increases with increasing pH.Especially in the narrow pH range where the metal ions are hydrolyzed, sorption is enhanced, so that even a charge reversal of the surface to positive values can occur (95, 96). Further possible explanations of increasing sorption with increasing pH are that hydrolyzed species have a lesser degree of hydration, i.e. less energy is necessary for removal or reorientation of the hydrated water molecules upon binding. Furthermore, OH shows affinity for some sorbents (97).
With a further increase of pH, the solubility of metal complexes decreases enough for precipitation to occur. Although precipitation may contribute to the overall removal of metals from solution (and therefore be desirable for metal removal applications), it renders the study of the biosorptive binding more difficult. For scientific purposes it is therefore recommendable to study biosorption at pH values where precipitation does not occur. Table 2 illustrates the effect of pH on lead sorption onto Corynebacterium glutamicum and Rhizopus arrhizus (98)thus demonstrating the negative influence of pH on metal sorption.
5.2. Presence of Other CationsOther sorbable ions in the solution may compete with the metal ion of interest for
sorption sites. The binding of this metal ion is then decreased. The amount of inhibition depends on the binding strength of the respective ions to the biomass.
For example, Mg and Na are effective in competing with Zn for binding sites of green algae (90 % reduction of Zn binding at 200 mM NaCl or Mg(NO3)2), but they interfere less strongly with the binding of Pb or Cu (< 50 % reduction of Pb or Cu binding at 200 mM NaCl or Mg(NO3)2) (12). The inhibition by alkali metals (K, Na) of heavy metal ion binding to microbial biomass was much less pronounced than the inhibition by heavy metals (Zn, Cu, Fe)
Page 7 of 47
John Wiley & Sons
2t-S-1Ed-D-P
123456789101112131415161718192021222324252627282930313233343536373839404142434445464748495051525354555657585960
For Peer Review
8
of uranium or radium binding (99). For Rhizopus arrhizus biomass, the presence of uranium reduced the binding of Cd, Zn and Ag more strongly than vice versa; especially Ag was a weak competitor, but nevertheless its binding was unaffected by the presence of Na (100). In the sorption of Cd, Cu and Zn on formaldehyde-crosslinked biomass of the brown alga Ascophyllum nodosum, the presence of each ion reduced the binding of each other ion, with Zn being the weakest binding ion and Cu the most strongly binding one among those three cations(101).
From the different literature sources it can be generally concluded that the light metals (alkaline and alkaline earth metals) bind less strongly than the heavy metal ions or radioactive elements. Therefore, the former do not strongly interfere with the binding of the latter. There are indications that among the heavy metals, Zn binds rather weakly and its binding is therefore more strongly affected by other ions.
In order to understand the reasons why some ions bind more strongly than others it is useful to look at the properties of different metals. Such knowledge can also serve to estimate how strongly an ion may bind that was not yet investigated. The impact of increasing concentration of iron on cadmium biosorption onto Sargassum is illustrated in Figure 7. This knowledge serves as a basis for better understanding of the metal binding mechanism.
5.3. Biomass TypesA multitude of biomass types (7), comprising fungal biomass (8), bacterial biomass (9),
algae (10 - 12), peat (13, 14) etc. have been studied for their biosorption of metals. It was observed that not only the species but also the growth conditions such as the culture medium and the physiological state or age of the organism influence sorption performance (99, 102). In several cases, the sorption by dead material proved to be more effective than that by living organisms (99, 102). Marine brown algae have been found to be particularly effective in metal ion binding (82, 103), showing similar or better performance than industrial ion-exchange resins. Gold accumulation by the brown alga Sargassum can constitute up to 40 % of the alga's dry weight (104). Further encouraging results with this sorbent material were obtained by Holan et al. (82), Kuyucak and Volesky (104), Leusch et al. (105) and Ramelow et al. (84).Table 1 presents some of these biosorbents examined for the metal uptake capacity.
5.4. TemperatureIt was noted that the temperature can influence the sorption process. Kuyucak and
Volesky (83) observed that the binding of Co by the brown alga Ascophyllum nodosumincreased by 50 - 70 % when the temperature was raised from 4 to 23 ˚C. With further temperature increase to 40 ˚C the binding increased only slightly, whereas temperatures of 60 ˚C or more caused a change in the texture of the sorbent and a loss in the sorption capacity. Simple physical sorption processes are generally exothermic, i.e. the equilibrium constant decreases with increasing temperature (106). This corresponds to the observation of Haug and Smidsrod (75) for exchange among alkaline earth metals in binding to alginate where the reaction was exothermic. For binding of Cu and release of alkaline earth metals, however, the reaction exhibited a positive enthalpy change (i.e. was endothermic), since the equilibrium constant rose with temperature. Haug and Smidsrod (75) concluded that (since the enthalpy change was in this case unfavorable), the driving force must have been a large positive entropy change, possibly caused by a larger ordering effect of Cu (than Ca) upon the water molecules in the hydration sphere. This is illustrated by Equation 1.
K = exp ( - ∆Go
R T) = exp ( - ∆Ho + T∆So
R T) = exp ( - ∆Ho
R T) exp ( ∆So
R)
(1)
Page 8 of 47
John Wiley & Sons
2t-S-1Ed-D-P
123456789101112131415161718192021222324252627282930313233343536373839404142434445464748495051525354555657585960
For Peer Review
9
A rise in K with increasing T means that ∆Ho > 0, i.e. that the reaction is endothermic. But since a reaction can only proceed when ∆Go = ∆Ηo - T ∆So < 0, it follows that ∆So must have been > 0, i.e. the system's entropy must have increased.
Similar results were obtained by Weppen and Hornburg (107) in calorimetric studies of the binding of divalent metal ions by potassium-saturated microbial biomass. The reactions were slightly endothermic and therefore driven by an increase in the entropy of the system (107). For most metals, the heat of reaction was constant, independent of the degree of site occupation. For Cu, however, the heat of reaction decreased with increasing degree of site occupation from 27 to 14 kJ/mol which may indicate the involvement of different binding sites or the formation of different types of Cu complexes with the biomass. For other heavy metals, the heat of reaction was between ~ 7-11 kJ/mol, for light metals between ~ 2.5-6 kJ/mol (107).
Overall, however, the effect of temperature is small as compared to other influencing factors (99) (less than a factor of two in the study of Kuyucak and Volesky (83)). Greene and Darnall (108) found that the distribution ratio (metal bound / metal in solution) for biosorption of Cd, Zn, Pb, Ni and Cu to Spirulina algae increased by only ~ 20% when the temperature was raised from 4 ˚C to 55 ˚C. Besides, possible application of biosorption is only reasonably to be expected in a rather narrow temperature range (~ 5 - 40 ˚C).
5.5. Presence of Anions (Ligands) Theoretically, the presence of ligands (at levels which do not cause precipitation) can
lead to (109):1) formation of complexes that have a higher affinity than the free metal ions to the sorbent, i.e. an enhancement of sorption; 2) formation of complexes that have a lower affinity than the free metal ions to the sorbent, i.e. a reduction of sorption;3) interaction of anions with the biomass, changing the state of the active sites such that the binding is either enhanced or reduced.Figure 8 illustrates the effect on several anions on lanthanum sorption onto Sargassum. The presence of sulfate notably decreased the metal uptake at pH 5. On the other hand, nitrate and chloride did not have any significant effect on the uptake (110).
It has been reported for sorption of Cu2+ and Ag+ to inorganic oxide surfaces that metal binding at low pH was enhanced in the presence of certain ligands. Since the ligand itself was able to bind to the oxide and since a 1:1 stoichiometry of ligand and metal bound was noted, it was concluded that some metal complexes may bind more strongly than the respective free ions (111). Negatively charged metal-EDTA complexes were bound to oxide surfaces (probably releasing OH-), with sorption decreasing with increasing pH (112).
Chen et al. (14) reports that up to 50 % of Cu binding by peat occurred as complexation of copper nitrate Cu(NO3)2 with the binding sites. The remaining metal binding was due to ion exchange such that the overall charge neutrality was conserved. The data allow, however, also another interpretation: instead of up to half of the Cu being bound as Cu(NO3)2 and the other half as Cu2+ , up to 100 % could have been bound as Cu(NO3)
+. Glaus et al. (113) found that the binding of Co and uranyl (UO2
2+) to humic substances could be modeled better when binding of metal-ligand (oxalate) complexes was included in the model.
In most cases of biosorption, however, metal binding tends to be reduced in the presence of ligands (exception: OH-) (86, 104). This means, the biomass apparently has less affinity for many metal-ligand complexes than for free hydrated metal ions. Therefore, the influence of ligands in solution can be understood as a competition with the biomass for binding of the metal ions.
Page 9 of 47
John Wiley & Sons
2t-S-1Ed-D-P
123456789101112131415161718192021222324252627282930313233343536373839404142434445464748495051525354555657585960
For Peer Review
10
This effect is, however, not very pronounced unless these anions show a strong complexing power for the metal ions of interest (e.g. EDTA) (84, 109): Tobin et al. (109) found that even by large excess (≥ 10 times) of the ligands glutamate, sulfate, phosphate, carbonate or chloride the maximum reduction of e.g. Cd binding to Rhizopus arrhizus biomass was only 21 %, while EDTA at only 1.5 times excess yielded a ~ 100 % inhibition of metal binding. The addition of 0.1 % EDTA resulted in > 90 % reduction of binding for most cases of Cd, Cu, Zn and Pb biosorption by seaweeds (also Sargassum) (84). Since significant concentrations of strong complexing agents are rare in typical metal-bearing industrial effluents, the effect of the presence of ligands is of secondary importance.
6. MECHANISMS OF HEAVY METAL BINDING
The effect of any of the above-mentioned influencing factors can be best quantitatively estimated when the mechanism of biosorption for different ions is known. The metal binding in biosorption has been attributed to a number of different sequestering mechanisms such as complexation, coordination, chelation, adsorption, ion exchange or micro- precipitation (as metal or metal complex) (60). It is a recognized fact that a combination of severalmechanisms, each functioning independently, can contribute to the overall metal uptake. In the studies of biosorption conducted so far, very little attention has been paid to examination of a well defined metal uptake (by a specific mechanism) as opposed to the overall uptake where several types of sequestration may be taking place simultaneously. Systematic understanding of the metal uptake mechanisms and their relationships may greatly clarify the otherwise confusing broad definition of biosorption mechanisms in the literature.
6.1. Ion-ExchangeDavis et al. (49) indicated that ion-exchange is an important concept in biosorption,
because it explains many of the observations made during heavy metal uptake experiments. It was noted that the term ion-exchange does not explicitly identify the mechanism of heavy metal binding to seaweeds, as the precise mechanism(s) may range from physical (i.e. electrostatic or London–van der Waals forces) to chemical binding (i.e. ionic and covalent), but that it is effective in describing the experimental observations.
6.1.1. BackgroundThe term sorption refers to the binding of a metal cation to a free site as opposed to one
that was previously occupied by another cation (49). The Langmuir adsorption model (114) assumes that all the binding sites on the sorbent are free sites that are ready to accept the sorbate from solution (7). Therefore an adsorption reaction can be described as:
BMMB →←+ +− (2)
Where, B represents the free binding site, M represents the sorbate (metal) and BM is the adsorbed sorbate M bound on B.
The ion-exchange model describes the reaction as:++ +→←+ HBMMBH (3)
Where B, the binding site is already occupied by a proton (H) that can take part in ion-exchange with a metal cation. However, a one-to-one stoichiometry is not complied with as typically two protons are released upon the binding of one divalent heavy metal ion.Figure 9 illustrates schematic representations of both adsorption and ion-exchange mechanisms for a biosorbent material.
Page 10 of 47
John Wiley & Sons
2t-S-1Ed-D-P
123456789101112131415161718192021222324252627282930313233343536373839404142434445464748495051525354555657585960

For Peer Review
11
The ion-exchange approach is probably somewhat closer to the reality than the simple Langmuir model, but does not completely and accurately describe biosorption (49). This is because the assumption of a constant number of free sites may be reasonable for a constant pH system, but, may not hold for systems with varying pH values.
6.1.2. Surface ChargeThe relevance of electrostatic attraction in biosorption depends on the types and amounts of sites present in the biomass and on whether they are ionized or occupied by protons or other ions. That, in turn, depends on the pH and on the pKa of the respective group. Usually, a good agreement between the pKa values of inorganic acids and their corresponding acidic groups in biomolecules exists, as evident from Table 3 (115 - 117). Amine groups are positively charged in their protonated form and neutral when deprotonated. Carboxyl, sulfate, and phosphate groups are neutral when protonated and negatively charged when deprotonated.
Greene et al. (81) mentioned that the isoelectric point (i.e. where the overall charge is neutral) of the freshwater alga Chlorella is at pH 3. At lower pH, the positive charge (possibly of amine groups) which leads to an attraction of anions prevails, at higher pH the negative charge (probably of carboxyl groups) which attracts cations and repels anions (81). Figure 10 illustrates the surface charge or the point of zero net proton charge of different industrial biomass (118). This value varies form 4.6 to 9 depending on the biomass.
Kuyucak and Volesky (83) noted that biomass of the marine brown alga Ascophyllum nodosum bears a negative charge whose magnitude sharply increased from pH 3 upward. It is probable that this surface charge originated from deprotonated carboxyl groups of the alginate in the cell wall.
6.1.3. Ion-Exchange in SeaweedsIt appears reasonable that in many cases ion exchange rather than sorption to free sites
is the relevant overall-mechanism for the binding of metal ions in biosorption. Since the overall charge of the biomass particle has to be neutral, any binding of one cation must be accompanied by either a stoichiometric release of other cations or by the binding of anions.Since the charge of algal biomass is negative (section "surface charge"), it appears unlikely that free anions will be bound by the biomass. This means sorption of free cations is ruled out. If complexes in solution occur, double exchange of cations and anions or binding of the complex may take place. Generally, sorption of neutral (metal cation + anion) complexes would be possible. However, it is unlikely at the moderate pH and metal as well as ligand concentration under which many biosorption studies are conducted.
Seaweed can be viewed as a natural ion-exchange material that primarily contains weakly acidic and basic groups. It follows from the theory of acid-base equilibrium that, in the pH range 2.5-5, the binding of heavy metal cations is determined primarily by the state of dissociation of the weakly acidic groups (119). Untreated algal biomass generally contains alkali and alkaline earth metal ions such as K+, Na+, Ca2+ and Mg2+ which are originally present from seawater. These ions are bound to the surface acidic functionalities. It has been reported that where the non-treated Sargassum was reacted with a heavy metal-bearing solution, a pH increase and the release of light metal ions were observed (120). This also was explained in terms of ion-exchange, whereby the observed release of light metals balanced the uptake of protons and heavy metals (121).
It was also reported by da Costa et al. (122) that alkali and alkaline earth ions played a key role in the ion-exchange properties of the biosorbent irrespective of the metal solute to be sorbed. Various authors have demonstrated this ion-exchange behavior for numerous seaweed-metal combinations (83, 123 - 125). Kuyucak and Volesky (126) noted that the amount of ions (K, Na, Ca, Mg) released from the marine brown alga Ascophyllum nodosum was much more pronounced in metal (Co) bearing than in metal free solutions. A linear correlation between Ca
Page 11 of 47
John Wiley & Sons
2t-S-1Ed-D-P
123456789101112131415161718192021222324252627282930313233343536373839404142434445464748495051525354555657585960

For Peer Review
12
release and Co uptake (2:3) was found when the biomass had been previously washed with CaCl and HCl. It was concluded that ion exchange was responsible for the sorption (126). If ion exchange was responsible, an exchange ratio of 1:1 should, however, be expected for two divalent ions such as Ca and Co. Since it can be expected that some sites would have been protonated due to the pre-treatment with a CaCl and HCl mixture and since some proton release was noticed, it would have been more appropriate to relate the Co binding to the sum of Ca and H released (everything in mequiv, not mol). This would have led to an exchange ratio much closer to 1:1.
Treen et al. (127) report that in column application of Rhizopus biosorbent two moles of protons were released for one mole of uranyl sequestered.
According to Chen et al. (14), the Cu binding to peat at low metal concentrations was predominantly ion exchange (with H, Ca, Mg) while at higher concentrations binding of copper nitrate complexes occurred. The latter mechanism was dominant above 6 mM of Cu (14).
It therefore appears that ion-exchange plays an important role in heavy metal binding to seaweeds.
6.2. ComplexationComplexation plays an important role both in metal-ligand and in sorbate-sorbent
interaction (128). A complex (also referred to as a coordination compound) is a poly-atomic molecule that consists of one or more (then: poly-nuclear complex) central atoms (usually metal cations) surrounded by ligands (other atoms or groups, usually of negative or neutral charge) that are attached to it. Complexes can be neutral or positively or negatively charged.The number of coordinating atoms (in the ligands) which are directly attached to the central atom is called coordination number and can be larger than the valence of the central atom (most common coordination numbers: 4 and 6, but 2 and 8 also occur frequently). If one ligand is attached to the central atom through two or more coordinating atoms, then the complex is called chelate. The bonds between the central atom and the coordinated groups can be arising from principal or auxiliary valence forces (129, 130).
A metal ion in aqueous solution represents an example of a metal complex. For example metal ions such as zinc are in fact surrounded by a shell of water molecules. Each water molecule is bound to the metal by donation of electrons originating from the lone pairs on the oxygen (131).
6.2.1. DenticityLigands are distinguished by the number of groups they contain which are capable of
binding to a metal. Unidentate ligands attach through only one coordinating group and in general, these tend to result in the formation of ionic water soluble complexes.Polydentate or multidentate ligands are molecules that contain more than one group that is capable of binding to the metal centre (132). A reagent that attaches to a single metal centre in this way is termed a chelating agent (131), and the complexes are referred to as chelates where ring closure with a metal ion occurs. A majority of chelating ligands contain the three most important donors, nitrogen, oxygen and sulphur (133).
The coordination number refers to the number of ligand atoms surrounding the central atom (49). Most metal cations engage in coordination of 2, 4, 6 and 8 with 4 and 6 being the most common. However, for polymers these values may be lower due to steric effects (49, 132). Figure 11 illustrates a monodendate and bidendate EDTA-Pb complex obtained after molecular modeling to determine the formation enthalpy (118).To summarize, it is the number of groups in the chelating agent and the number of available coordination sites on the metal that will govern the stoichiometry of the final compound.
Page 12 of 47
John Wiley & Sons
2t-S-1Ed-D-P
123456789101112131415161718192021222324252627282930313233343536373839404142434445464748495051525354555657585960

For Peer Review
13
6.2.2. Complex Formation with BiomaterialsMetal sequestration can be viewed as the complexation (or coordination) of a central
heavy metal to a multidentate ligand (the surface of the algae) (49). The algal surface is a complicated system, since it behaves as a heterogeneous ligand and can be treated as a polyfunctional macromolecule (134). The surface groups are not identical and therefore, it is not possible to determine the complexation constants for each group (135).
Binding of different metal ions on biomaterials having different functional groups depends on ionic properties such as electronegativity, ionization, potential, ionic radius and redox potential of these metals (136). Allen and Brown (136) proposed that more electronegative metal ions will be more strongly attracted to the surface. Their results also showed that the sorption capacity for Cu2+ was smaller than that for Pb2+ due to its lowerelectronegativity.
Heavy metal complexation to alginate polymers has been extensively studied by Haug et al. (69). Figure 12 gives a structural representation of the conformation of the alginate polymer showing both mannuronic (M) and guluronic (g) acid residues (49). The higher specificity of polyguluronic acid residues for divalent metals may be explained by its “zigzag” structure (Figure 12) which can accommodate the ions more easily (49). It has been shown that regions of the alginate polymer rich in ‘G’ residues display a higher selectivity for divalent metal ions over mannuronic rich regions. This is due to the fact that they provide a multidentate environment for complexation. On the other hand, in regions rich in mannuronic acid (“M” residues) complexation would be predominantly monodentate and therefore weaker(49). It would therefore be expected that the coordination number of the metal bound to guluronic acid residues should be larger than that for mannuronic acid. This appears to be supported by the higher selectivity observed in regions rich in guluronic acid (49).
6.2.3. Hard Soft Acid Base Theory (HSAB)There are two components to any complexation reaction i.e. the metal and the
complexing agent; both contribute to the formation of the complex and both have their own characteristics. Predicting which metal will be bound strongly by which ligand requires an understanding of the factors controlling the bond formation. From a consideration of the nature of the participating metals and ligands it is possible to break these down into two extreme cases. Metals are thereby categorized as being hard or soft acids while ligands are categorized as being hard or soft bases (121).
The basis of the Hard Soft Acid Base Theory is that “in a competitive situation, hard acids tend to form complexes with hard bases and soft acids tend to form complexes with soft bases” (131). In order to classify the behavior of metal ions, a division into so called hard and soft ions was introduced by Pearson (137). Table 4 indicates the classification of the metals and ligands according to the HSAB theory. Hard ions are characterized by predominantly electrostatic bonds where the entropy gain in the change of the orientation of the hydrated water molecules makes an important contribution to the free energy change ∆G (138). Hard ions have a weak polarizing power and retain their electrons strongly.
Soft ions participate in more covalent bonding where the free energy is mostly enthalpic (138). The characteristics of soft ions are opposite to the ones of hard ions, resulting in a reversed affinity sequence. The affinity sequence of soft ions for ligands is I > Br > Cl > F and S > N > O (139). A combined affinity sequence was described by Buffle (138): S > I > Br > Cl ~ N > O > F. Typical hard ions are the alkali and alkaline earth metals, transition elements up to class VI and e.g. Zn (140).
For any donor (and especially for soft ones) the binding strength increases with cation softness (138). Soft cations form more stable complexes with soft donors (S, P or As) while hard cations prefer hard donors (F or O) (137). N donors have intermediate characteristics. For O or N donor atoms, the Irving-Williams order of complex stability for divalent ions in the
Page 13 of 47
John Wiley & Sons
2t-S-1Ed-D-P
123456789101112131415161718192021222324252627282930313233343536373839404142434445464748495051525354555657585960

For Peer Review
14
first series is: Mn < Fe < Co < Ni < Cu > Zn (140). This can be explained by the electronegativity differences with respect to the donor atoms O or N.
Examples of hard ligands are carbonate, phosphate, sulfate or hydroxide ions (1, 140) as well as sulfate, carboxylate, alcohol or hydroxyl groups (139). Soft ligands are e.g. sulfhydryl, thioether and amino groups (139). Metals that tend to bond covalently preferentially form complexes with ligands that tend to bond covalently, and similarly, metals that tend to bond electrostatically preferentially form complexes with ligands that tend to bond electrostatically. Intermediate acids will bind with harder or softer bases depending on their oxidation state. The degree of hardness or softness refers also to the electron mobility or polarisability of a species(60).
6.3. Biosorption of Heavy Metal AnionsAlthough much of the current biosorption research is oriented towards the removal of
heavy metal cations (37, 141), the binding of anions to biomass is a growing area of study (20, 142). Effluents from major industrial activities such as mining, electroplating and power generation often contain heavy metals in anionic complex forms such as chromate (CrO4
2-), vanadate (VO4
3-), selenate (SeO42-) and gold cyanide (AuCN2
-) (20). These species have been conventionally recovered by precipitation, ion-exchange or activated carbon sorption (143).
However, anionic metal complexes may also be effectively bound by biomass types containing an abundance of amino groups such as chitin-containing biosorbents (119). The conjugated acid dissociation constant pKa of the chitin amide group is lower than 3.5 (144). Therefore, only when the solution pH is lower than this, the amide sites could be effectively protonated with a positive charge and an anion could thus be bound.
The removal of anionic Cr(VI) by various other biomaterials e.g. peat-moss (145), corn-cob (146), fungi (147) and seaweed (including Ecklonia sp. and Ulva lactuca) (148, 149) has also been studied with promising results. The optimum pH for Cr (VI) removal by all of these biomasses was reported to lie in the pH range 1.5–2.5. Moreover, the studies revealed that, although some Cr(VI) was taken up by the biomass, considerable quantities of Cr(VI) were reduced to Cr(III). However, more research is needed to assess the proposed mechanisms and develop mathematical models for the sorption of anions. Because some highly toxic metals occur in anionic forms (As, Se, Cr, Mo, Va etc.), studies of anion biosorption remain a relevantchallenge.
7. QUANTIFYING METAL-BIOMASS INTERACTIONS The case of a biosorption process involves a solid phase (sorbent) and a liquid phase
(solvent, normally water) containing a dissolved species to be sorbed (sorbate, e.g. metal ions).Due to the higher ‘affinity’ of the sorbent for the sorbate species the latter is attracted into the solid and bound there by different mechanisms. This process takes place until an equilibrium is established between the amount of solid-bound sorbate species and its portion remaining in solution (at a residual, final or equilibrium concentration Cf ). The degree of the sorbent ‘affinity’ for the sorbate determines its distribution between the solid and liquid phases.
The quality of the sorbent material is judged according to how much sorbate it can attract and retain in an ‘immobilized’ form. For this purpose it is customary to determine the metal uptake (q ) by the biosorbent as the amount of sorbate bound by the unit of solid phase (by weight, volume, etc.).
The calculation of the metal uptake [mgMet /g (dry!) sorbent] is based on the material balance of the sorption system. Correspondingly, the amount of metal bound by the sorbent which ‘disappeared’ from the solution can be calculated based on the mass balance for the sorbent in the system:V [L] (Ci) [mg/L] = all the sorbate in the system [mg] (4)
Page 14 of 47
John Wiley & Sons
2t-S-1Ed-D-P
123456789101112131415161718192021222324252627282930313233343536373839404142434445464748495051525354555657585960

For Peer Review
15
V [L] (Cf) [mg/L] = the sorbate left over in the solution [mg] (5)The uptake (sorbate in the solid phase) will be the difference:q = V [L] (Ci - Cf )[mg/L] / S [g] [in weight units mg/g] (6)
where V is the volume of the metal-bearing solution contacted (batch) with the sorbent [L]; Ciand Cf are the initial and equilibrium (residual) concentrations of the metal in the solution, respectively. They have to be analytically determined [mg/L]; S is the amount of the added (bio)sorbent on the dry basis [g].
7.1. Sorption Isotherms Most mathematical biosorption models used in the literature describe simple Langmuir
(11, 12, 82, 117, 126, 150) or Freundlich (14, 85, 151) sorption isotherms, where the metal ion binding is determined as a function of the equilibrium concentration of that metal ion in the solution, without reference to pH or other ions in the same solution system.
The Freundlich isotherm (152) is originally of empirical nature but has later been interpreted as sorption to sites with an affinity distribution, i.e. it is assumed that the stronger binding sites are occupied first and that the binding strength decreases with increasing degree of site occupation. More specifically, the Freundlich isotherm is obtained when a log-normal affinity distribution (i.e. a normal distribution of log(K)) is assumed (106, 153). The Freundlich isotherm is defined by the following expression:
Mq = K [M]1/n (7)
where k and n are empirically determined constants, with k being related to the maximum binding capacity and n related to the affinity or binding strength (99, 154).
The Langmuir isotherm (114) is based on considering sorption as a chemical phenomenon. It is assumed that the forces exerted by chemically unsaturated surface atoms(total number of binding sites) do not extend further than the diameter of one sorbed molecule and that therefore sorption is restricted to a monolayer. In the simplest case the following assumptions are made:
- all sorption sites are uniform (i.e. constant heat of adsorption);- there is only one sorbate;- one sorbate molecule reacts with one active site;- there is no interaction between sorbed species.
The rate of adsorption is proportional to the rate constant of the forward reaction BMKf, the number of free sites (B = tB - Mq) and the number of sorbate molecules hitting the surface per unit time (i.e. proportional to their concentration [M]). Under the same conditions, the rate of desorption is proportional to the rate constant of the backward reaction BMKb and the number of occupied sites Mq. The equilibrium is attained when the rate of adsorption equals the rate of desorption:The Langmuir isotherm relationship is of a hyperbolic form:
q qbC
bCf
f=
+max 1(8)
The Langmuir relationship can be linearized by plotting either (1/q ) vs (1/ Cf ) or (Cf /q) vs Cfwhere: qmax is the maximum sorbate uptake under the given conditions; e.g. [mg/g];
b is a coefficient related to the affinity between the sorbent and sorbate (the relationship between b and the affinity constant K). The Scatchard linearization of Langmuir is:
(q/Cf ) = b qmax - b q
Both Langmuir and Freundlich isotherms have been used to describe the equilibrium of metal biosorption. While it is possible to obtain good agreement between predictions of these
Page 15 of 47
John Wiley & Sons
2t-S-1Ed-D-P
123456789101112131415161718192021222324252627282930313233343536373839404142434445464748495051525354555657585960
For Peer Review
16
isotherms and the experimentally determined metal binding, these simple equations have significant limitations: they cannot predict the effect of pH or of other ions in the solution.
Other sorption isotherm relationships listed in Table 5 are commonly appearing in the biosorption literature. It is necessary to realize that these relationships basically do not reflect the physico-chemical underlying principles of the sorption process which, in most cases, may not even be well understood. For all practical purposes they are just mathematical models of the phenomenon capable of describing the (q ) vs (Cf ) relationship as experimentally observed.In this capacity, neither can any of these models offer any important clues as to the sorption mechanism nor could they be sensitive to external process variables (such as e.g. pH, ionic strength, etc.).
While the Langmuir adsorption model is valid for a single-layer adsorption, the BET model represents sorption isotherms reflecting apparent multi-layer adsorption. Both equations are limited by the assumption of uniform energies of adsorption on the surface. The BET isotherm, the more generally applicable of the two, reduces to the Langmuir model when the limit of adsorption is a mono-layer. Both models may be deduced from either kinetic considerations or the thermodynamics of adsorption. A further assumption of the BET model is that a given layer need not complete formation prior to initiation of subsequent layers; the equilibrium condition will therefore involve several types of surfaces in the sense of number of layers of molecules on each surface site. For adsorption from solution with the additional assumption that layers beyond the first have equal energies of adsorption, the BET equation takes the simplified form.
Needless to say, for different sorption systems and mechanisms outside of the scope of these assumptions the application and fit of the model equations is a matter of chance. They become just mathematical relationships which happen to be capable of following the experimental data. The problem with biosorption is that usually not very much specific information is available on the sorption mechanism(s) involved.
The usual concept of the solid-phase sorbent with physical pores and ‘surface area’ etc.may not be so close to the real structure, appearance and behavior of biosorbent materials.Particularly in conjunction with metallic ions as sorbate species, biosorbents may appear as gels, very transparent for the minute ions and protons. Actually, when it comes to an ion exchange process, which apparently plays a very important role in biosorption, at least one ion from within the molecular structure of the sorbent is exchanged for another one coming from outside. This leads to ever-changing conditions in the sorption system due to the stream of ‘exchanged’ ions also leaving the sorbent into the liquid environment. That is until the sorption equilibrium is established.
7.1.1. Sorption Isotherm ExampleIt is relatively simple and easy to obtain laboratory equilibrium sorption data for a
single sorbate. A small amount of the sorbent tested is brought into contact with solution containing the given sorbate. However, the ‘environmental’ parameters in the sorption system (particularly pH) have to be carefully controlled at the given value over the entire period of contact until the sorption equilibrium is reached (Figure 13). It may take a few hours or much longer depending on the size of sorption particles and the time it takes until they attain sorption equilibrium. A simple preliminary sorption kinetics test will establish the exposure time necessary for the given sorbent particles to reach the equilibrium state characterized by the unchanging sorbate concentration in the solution. That is determined by time-based analyses.
Safely ‘enough’ time will be allowed for the sorption system to reach equilibrium. The following procedure provides an example for obtaining the experimental sorption equilibrium data points for the isotherm as seen also in the procedure schematic flowchart:1) Prepare the sorbate in solution at the highest concentration of interest.2) Make dilutions to cover the entire concentration range (from 0 -blank, to the max.).
Page 16 of 47
John Wiley & Sons
2t-S-1Ed-D-P
123456789101112131415161718192021222324252627282930313233343536373839404142434445464748495051525354555657585960

For Peer Review
17
3) Adjust the ‘environmental parameters’ (e.g. pH, ionic strength, etc.).4) Determine the sorbate initial concentrations (Ci in all the liquid samples.5) Distribute the samples into appropriate-volume containers (record V = 30-150 mL of liquid)
such as flasks or test tubes (in duplicate, triplicate or as required).6) Weigh accurately each (approximate) amount of the (bio)sorbent solids to be used in each
contact test and record each amount (S mg).It may help to be able to roughly estimate the anticipated sorption uptake so that there is a well detectable sorbate final concentration left in the solution at equilibrium in each sample. If there is too much solids added there may be virtually no sorbate left in the solution for a reliable analysis.
7) Add the sorbent solids into each sample solution and provide for rather gentle mixing over the contact period (‘enough’ time!).
8) Make sure the ‘environmental’ parameters (pH!) are controlled at a constant value during the contact period (use appropriate acid or base for the purpose; do not ‘dilute’ the sorption system by adding excessive volume).
9) At the end of the contact period, separate the solids from the liquid (decantation, filtration, centrifugation, etc.)
10) Analyze the liquid portion for the residual, final, equilibrium sorbate concentration (Cf ).11) Calculate the sorbate uptake:
q = V [L] (Ci - Cf )[mg/L] / S [g] (9)Note that q could also be determined directly by analyzing the separated solids and thus closing the material balance on the sorbate in the system. However, this usually presents analytical difficulties (digestion-liquefaction of solids and/or very sophisticated analytical methods may be required).A variation of this approach is the “tea-bag experiment”, whereby Cf = Ci and only the solids are analyzed. In either case, the Cf in the liquid must be known for the sorption isotherm plotting:
12) Plot the sorption isotherm q vs (Cf ).
Note that for all practical purposes the choice of experimental variables narrows usually down to two: concentration Ci and the amount of sorbent solids S contacted. One or the other or both can be varied. In the above procedure it was the concentration of sorbate dilutions Ci.The key point is to obtain measurable and different values of Cf at the end of the contact experiment.
From the equilibrium principles it is easily seen that the initial concentration of sorbate (Ci ) is of little relevance in these kinds of sorption tests. It can assist in identifying the final concentration range which, of course, depends on the amount of sorbent solids (S) in the system. Also note that one has no control over the value of Cf, it sort of “happens” during the experiment.
7.2. Continuous-Flow Reactor/Contactor SystemsJust like with any other sorption process, biosorbent solids, powder, regular or irregular
granules, have to be brought into contact with the sorbate that may be metal-bearing liquid (predominantly considered as the biosorption example process here). Adsorbed and removed from the solution, the metal becomes ‘immobilized’ in the solids. In this form it can be eventually more easily separated from the liquid phase by solid/liquid (S/L) separation processes. Generally, the smaller the particles, the more difficult is their separation. However, the smaller the particles the more effective and rapid their metal uptake may be. With larger particles the metal ions have to gradually penetrate throughout the particle which becomes saturated more slowly. However, the separation of larger granules from suspensions is invariably easier and the flow through the bed composed of larger particles is easier.
Page 17 of 47
John Wiley & Sons
2t-S-1Ed-D-P
123456789101112131415161718192021222324252627282930313233343536373839404142434445464748495051525354555657585960

For Peer Review
18
Granulated biosorbent material also allows packing it into continuous flow-through columns which represent by far the most effective and convenient utilization of the contactor volume. The solids are in fact already separated, contained in the trickle-column arrangement which allows their subsequent regeneration and washing usually carried out in the same equipment. The actual size of the granules then has to be a compromise between the sorbent species mass transfer (penetration) into the granule and the pressure required to drive the liquid through the granule-packed column.
For the best mass transfer and utilization of the granule throughout the particles should be as small as possible. However, small particles tend to cause an excessive pressure drop across the bed packed with them. Practically, the granule size usually ranges between 0.5 to 2 mm. Figure 14 schematically summarizes the optimization between the pressure drop and the size of the granules. Biosorbent formulation and granulation produce particles possessing physical characteristics suitable for process application. There are three basic types of sorption solid/liquid contact systems:● the packed-bed column (and modifications), ● the fluidized-bed system, and ● the completely mixed system, often combined with a solid concentration operation.Below, only the fixed-bed column sorption will be further elaborated on. The other cases arewell discussed in the book by Volesky (6).
7.2.1. Fixed- Bed Column Sorption SystemBiosorbent granules are tightly packed in the column, however, allowing the metal-
bearing stream to be freely passed through the column (usually downward). Dissolved metals are gradually removed from the liquid phase which always meets fresher and fresher sorbent as it flows down the bed. Effluent leaving the column contains extremely low residual metals in the range of 10-50 ppb, often undetectable. The point in time when the biosorbent in the column eventually becomes fully loaded (approximately at the inflow metal ‘equilibrium’ concentration) and the effluent metal concentration at its exit starts gradually increasing is called the break-through point. The column, which at this point is practically not sorbing, not performing to its exit concentration specifications any more, is then shut down and the metal solution flow is diverted into a stand-by Column 2 containing fresh sorbent.Subsequently, the saturated Column 1 is then appropriately processed (regenerated, washed) to prepare it for another run. Figure 15 illustrates a typical dual-column continuous-flow operation sorption system.
The sorption column systems can be available in a variety of sizes in order to accommodate a wide spectrum of flow requirements and process performances. Cylindrical sorption columns do not typically exceed 1.5 m in diameter and 5 m in height. Virtually unlimited scale-up of the process is accomplished by using batteries of multiple columns that work in parallel and/or in series to optimize the performance of the process.
In sorption process applications, the most effective apparatus for cyclic sorption/desorption, making the most effective use of the reactor volume, is a fixed-bed column. It is also making the optimum use of the concentration gradient between the solute sorbed by the solids and that remaining in the liquid phase. This difference between the solute (metal) concentration in the solid and liquid phases is the driving force for the sorption process.The process of metal biosorption in a fixed-bed column is influenced by three key regimes: the sorption equilibrium (reaction), the sorption particle mass transfer, and the fluid-flow pattern through the packed bed.
Combination of the three determines the overall performance of the sorption column which is judged by its service time, i.e. the length of time until the sorbed species (metal) "breaks through" the bed to be detected (at a given concentration) in the column effluent. At that point the bed is considered for all practical purposes "saturated" and the used up sorption
Page 18 of 47
John Wiley & Sons
2t-S-1Ed-D-P
123456789101112131415161718192021222324252627282930313233343536373839404142434445464748495051525354555657585960

For Peer Review
19
column has to be taken out of operation for some kind of "regeneration". Figure 16 gives a general idea of the types of breakthrough that one should expect when conducting a biosorption experiment in a fixed-bed column.
The column bed is being saturated at the inflow concentration which then represents the equilibrium concentration for the part of the bed upstream from the transfer zone. The saturation of the bed within the transfer zone varies from zero (the zone front) to the full saturation (closer to the column entrance). This zone of partial saturation moves through the column in the direction of the flow at a certain velocity which is predominantly determined by the sorbate loading, sorbent capacity and the column feed rate. The column is operational until this zone reaches the end of the column. Until that time the effluent leaving the column has no trace of the sorbate in it. When the transfer zone reaches the column end, the sorbate concentration in the effluent starts to gradually increase and, for all practical purposes, the working life of the column is over: the “breakthrough point” occurs, marking the usable column “service time”. Both of these parameters are perhaps the most important ones from the process design point of view because they directly affect the feasibility and economics of the sorption process (Figure 16). While it is relatively easy to experimentally determine these values, they are very dependent on the column operating conditions and are, therefore, not applicable when the operating conditions change somewhat. More sophisticated handling of experimental data is required to lead to the prediction and relevant explanation of breakthrough curves for different sorption column operation scenarios.
At the breakthrough point a portion of the column contains the transfer zone with only partially saturated sorbent in it. As the column is shut down, this portion is incompletely saturated and the zone length inside the column is, for all practical purposes, wasted as the column is phased out for regeneration. The longer the transfer zone, the more sorbent ends up being not fully utilized. From the process economy point of view it is important to minimize the length of the transfer zone and increase thus the sorbent utilization.
The “steeper” the breakthrough curve, reflecting the length of the transfer zone, the more efficient is the overall utilization of the sorbent in the column.
8. INSTRUMENTAL ANALYSIS OF HEAVY METAL BINDING Many techniques have been used to study metal binding to biomaterials. These include
potentiometric titration (30, 73), infrared spectroscopy (73, 123), scanning electron microscopy (155) and X-ray photoelectron spectroscopy (37, 156).Knowledge of the chemical composition of the algal cell wall as well as the use of a variety of analytical techniques may help to elucidate metal binding mechanisms. The use of a single technique will not yield a complete picture of binding and therefore a range of techniques must be used to characterize the metal-biomass interactions.
8.1. Potentiometric and Conductimetric Titrations
8.1.1. Binding SitesWhich binding mechanism applies in any specific case depends, of course, largely on
the type of biosorbent used and on the types of binding sites it contains. Biosorption has been attributed to different types of groups such as carboxylate, carbonyl, hydroxyl, amine, amide, imidazole, phosphate, thio and thioether groups (81).
Crist et al. (157) proposed that e.g. carboxylate, sulfate and amino groups may be responsible for metal binding by freshwater algae. Indications for carboxyl and sulfate group participation were found by titration of marine algal biomass (117). The chelating ability of polysaccharides from Chlorella was connected to their content of uronic acids. Their carboxyl groups would be negatively charged and could bind metal ions (158). Tobin et al. (88)concluded that in Rhizopus arrhizus fungal biomass at pH 4 carboxylate and phosphate groups
Page 19 of 47
John Wiley & Sons
2t-S-1Ed-D-P
123456789101112131415161718192021222324252627282930313233343536373839404142434445464748495051525354555657585960
For Peer Review
20
offered the primary metal binding sites, supported by hydroxyl groups. Greene et al. (86)noticed a complete loss of available sulfhydryl groups (determined by polarimetric titration) after the binding of Au(III) to the freshwater alga Chlorella, thus giving evidence for the involvement of this group, but it could only account for a small amount of total gold binding.
For brown algae it is assumed that alginates play a key role in metal ion binding (126). Fourest and Volesky (73) investigated the binding of H, Cd and Pb by alginic acid and Sargassum fluitans biomass before and after modification of the carboxyl groups using acidic methanol or propylene oxide. A linear correlation between the binding capacity for Cd and the content of weak acidic groups (probably carboxylate) resulting from different degrees of blocking was noted. 48 h treatment with propylene oxide resulted in a ~ 90 % reduction of Cd binding and a ~ 80 % reduction of Pb binding as well as 80 % reduction of titrable weak acidic (carboxylic) groups. This indicated that a majority of the metal was bound by carboxyl groups.
The maximum metal binding capacity of different algae was linearly correlated with their titer of weak acidic groups, with a stoichiometric relation between metal bound and acidic titer of 0.36 to 0.5 mol/mol. This means about two acidic sites are necessary per bound metal ion (159).
8.1.2. BackgroundThe diversity of the functional groups in biomaterials and the polyelectrolytic nature of
the organic constituents have proposed that the acid-base potentiometric titration method, concepts and theory, previously used to study the formation of soluble organo-metallic complexes (160), can help to (1) estimate the cationic exchange capacities of different kind of organic materials, (2) identify the acid ionisable functional groups (binding sites) which can play the role of ligand in the presence of protons or others toxic metal ions and (3) describe the chemical heterogenic reactivity of the organic surface.
Potentiometric titrations commonly determine the end point (i.e. the inflection point) of the classical S-shape titration curves. The result is a plot of volume versus the potential of the electrode, giving direct information about the concentration in solution, using the Nernst equation:
E = E0+RT / nF log {H+} (10)Where E0 and E are the standardisation potential and the potential measured by the electrode (V), respectively, R the gas constant (8.3144 J.mol-1.K-1), T the temperature (K), n the number of the exchanged electrons, F the Faraday constant (96487C.eq-1) and {H+} the protons activity in solution. The inflection point of the curve pH = f(Volume) provides the end point and consequently the equivalence volume.
While for many applications this method is suitable, in some cases, this approach leads to unsatisfactory results, for example:- titrations of weak or polymeric acids, in which the inflection point is obscured partially by the buffering action of water or by the “undulation” of the titration curve. The determination of the inflection point becomes very difficult in these cases;- in reactions where the asymmetry of the curve may invalidate the assumptions that the inflection point corresponds exactly to the end point. Furthermore, the accuracy of a titration is generally limited by the correct and reproducible detection of the equivalence point.
One way to solve this problem is to use the derivative functions (first and second) by approximation of segments for each 5 points of the titration data set to a 3rd degree polynomial equation, two-fold derivation of this polynomial and then searching for zero values of the 2nd
derivative (161). For heterogeneous matter titrations, the derivative curve may be sometimes complicated to interpret and the determination of the inflection points becomes subjective. The
Page 20 of 47
John Wiley & Sons
2t-S-1Ed-D-P
123456789101112131415161718192021222324252627282930313233343536373839404142434445464748495051525354555657585960
For Peer Review
21
application of Gran's method to heterogeneous organic matters allows determining precisely the equivalence volume and the distribution of total acidities.
8.1.3. Gran's MethodIn 1952, G. Gran (162) presented a mathematical technique for converting a conventional S
shaped titration curve into two straight lines that intersect at the end point. To apply this method to a heterogeneous matter, the surface is regarded as a succession and a continuous distribution of acid sites, and the global reactions used during an acid-base titration of a multi-polymeric acid are considered:
G = (V0+V)10(k1-pH)
= k2(Ve-V) at pH< 7 (11)
G = (V0+V)10(k3-pH)
= k4(V-Ve) at pH> 7 (12)Where V0 is the initial volume (ml), V the added volume (ml), Ve the equivalence volume (ml) being the volume of base added when the equivalence point is reached and k1, k2, k3, k4 are different constants.
Gran’s formula follows from the definition of the acid constant Ka that can be written:
[ ] [ ][ ]AH
AHK
m
m-m
a
+
= (13)
with
[ ] ( )
[ ] { } [ ]+−+−+==
+=
+−
=+−
=
H*f10HandVV
VNA
;VV
VVN
VV
V NVAAH
H
pH
0
0m
0
e0
0
000m
(14)
Where N0 is the normality of the base used and A0 the acid concentration of the initial solution.Gran analysis applied to a heterogeneous matter offers several advantages:
- the use of several points to define the equivalence volume (when G = 0) as opposed to the inflection point, which reduces random error and increases the precision;- the validation of the linearity of the electrode within the studied pH range (NaClO4 control curve);- two independent Gran functions, before and after the endpoint, increase the statistical reliability of the analysis;- the partitioning of the total acidity into strong, weak and very weak acidities.
Figure 17 gives a general idea of the Gran’s function shape during a base titration of a heterogeneous matter. The shifts between the control and the sample curves correspond to different kinds of acidities. The following different volumes can be noted:- VeN and Ve, corresponding to the equivalence volumes of the control and the sample experiments, respectively, determined from the first derivative functions ∂pH/∂V or ∂G/∂V;- Va and Vb determined by the acidic and basic slopes of the Gran’s function. In the particular case of a control, VeN≈VaN≈VbN and 0.35 mL is an acceptable maximum difference between these values attributed to atmospheric CO2.
Supposing that a heterogeneous surface exhibits its acidities continuously as a function of the affinity constant (Ka) (163), then the titration curves can be adjusted using symmetric Gaussian distribution functions and the total organic acidity (ATO) of a sample can be divided into three different chemical acidic groups depending on their apparent ionization constants:- strong acidities (AS), evaluated from the difference between the volume of NaOH added (Va-VaN) and can be attributed to the presence of mineral acidities (with high affinities such as phosphoric or sulfonate groups) as well as carboxylic group linked to aromatic functions at pH < 4;
Page 21 of 47
John Wiley & Sons
2t-S-1Ed-D-P
123456789101112131415161718192021222324252627282930313233343536373839404142434445464748495051525354555657585960

For Peer Review
22
- weak acidities (AW), considered from the volume (Ve-Va), are attributed to the ionization of carboxylic and some proteic groups at 4 < pH < 7; and- very weak acidities (AVW), calculated from the volume (Vb-Ve), are attributed to phenolic and amine groups including the ionization of amino groups of proteins at pH > 7. The evaluation of theses acidities follow from the different equations:
00
aNa1-s N
V
)VV()(me.LA ∗
−= (15)
00
aNeNae1-W N
V
)VV()VV()(me.LA ∗
−−−= (16)
[ ][ ]0
0
bNbeNbNeb1-VW N
V
)V'V()VV()VV()VV()(me.LA ∗
−−−−−−= (17)
With ATO = AVW + AW + AS and VeN≈VaN≈VbN. The suffix N corresponds to the control.Where V0’ and V0 are the initial volume of the control and sample, respectively, V and V’ are the total volume of the base added after titration of the control and sample, respectively. To transform the obtained values from me.L-1 to me.g-1, the correction factor (V0/m) is introduced where m is the mass of the solid (g).
Comparing the two titrations, of the control (electrolyte) and of the sample (electrolyte + sample), at the same pH, the following equation (for example, applied to ATO) can be deduced:[H+] control = [H+] electrolyte + [H+] sample
A0V0'
(V ' +V0' )−
N0V'
(V' +V0' )=
A0V0
(V + V0 )−
N0V
(V + V0 )+ ATO *α *
V0
(V + V0 )⇒α =
A0 + N0( ) V ' 0 V − V0V '( )V0 * V ' +V' 0( )* ATO
(18) The dissociation coefficients α of the weak and very weak acidities are given by:
( )( )
( )( )( )
−+∗−+
∗==α S0
''0
'0
'000
WW
tWW A
VVV
VVVVNA
A
1
A
A)A( (19)
( )( )
( )( )( )
−−+∗−+
∗==α WS0
''0
'0
'000
VWVW
tVWVW AA
VVV
VVVVNA
A
1
A
A)A( (20)
To determine the different pKa values, the Henderson-Hasselbach equation was used to relate the dissociation sites coefficients α and the pKa value to the pH as follows:
αα−
+=1
logpHpKa m (21)
The pKa values of weak and very weak acidities, defined as the apparent constants, are derived from the pH value when α = 0.5.
8.1.4. Potentiometric titration applicationsPotentiometric titrations have been used by various authors to determine the quantity and
nature of acidic binding sites on the seaweed surface (30, 73, 123). Once the quantity of available functional groups has been established, its relationship with the maximum metal binding capacity of the seaweeds can be established.
Figure 18 presents the titration curves of Aspergilus niger and Rhizopus arrhizus (98).Naja et al. (98) explained the difference between the two mycelia revealed by titration by their taxonomic classification (Ascomycetes for A. niger and Zygomycetes for R. arrhizus). A. niger had a lower ATO (0.81 me.g-1) than R. arrhizus (2.54 me.g-1). This was due to lower AS
(mineral acidities) and AVW (amine groups). However, the two mycelia had a similar quantity of AW (carboxylic groups) (≈ 0.3 me.g-1). Consequently, R. arrhizus contains more amine groups as its cell wall is mainly composed of chitin (linear chains of acetylglucosamine groups)
Page 22 of 47
John Wiley & Sons
2t-S-1Ed-D-P
123456789101112131415161718192021222324252627282930313233343536373839404142434445464748495051525354555657585960
For Peer Review
23
conferring a global positive or neutral charge to the structure. Despite these differences, the pKa values (determined using the Henderson and Hasselbach representation) were quite similar. The pKa values for AW (4-4.4) were mainly attributed to carboxyl groups and the pKa values of AVW (8.2-8.3) corresponded to amine and not to phenol groups characterized by higher pKa
values >10. The distinction between the three types of acidities according to their affinity allowed the surface characterization of the different organic matter. These differences are important as they are responsible for establishment of different sorption metal binding type: weak and very weak acidities establish covalent links (inner sphere surface complex) whereas strong acidities promote ionic bonds (well know as outer sphere surface complex).
Figure 19 illustrates the potentiometric and conductimetric titration curves of three Sargassum species as determined by Davis et al. (30). The quantity of strong (As) and weak (Aw) acidic groups obtained from the potentiometric curves in Figure 19 as well as the seaweeds’ cadmium binding capacity is summarized in Table 6. From Table 6, it is clearly seen that carboxyl groups are significantly more abundant than sulphonate groups. It is also apparent that any correlation between metal binding capacity and the amount of acidic groups is related to the number of weak acidic groups. This is due to the fact that carboxyl groups have been shown to play a dominant role in metal binding to brown seaweeds (73). The relationship between weak acidic groups and metal uptake is very good if assuming a two-to-one stoichiometry between protons released and divalent metals bound (30).
8.2. Fourier Transform Infrared Spectroscopy (FTIR) As previously discussed, numerous chemical groups have been proposed to be
responsible for metal biosorption by seaweeds. These include carboxyl, amino, sulphonate and hydroxyl and their respective importance in metal binding depends on factors such as the quantity of sites, their accessibility and the affinity between the site and the metal (6). Once the quantity of available sites has been determined, say by potentiometric titration, other techniques such as Fourier transform Infrared Spectroscopy (FTIR) may be used to assess the interaction of the surface functional groups with metal ions.
Various authors have used FTIR spectroscopy to detect vibrational frequency changes in seaweeds (123, 164). FTIR offers excellent information on the nature of the bonds present on the surface of the algae and also presents three main advantages as an analytical technique: It is fast, non-destructive and requires only small sample quantities (165).
Several intense characteristic bands in the IR spectra (73) can be attributed to functional groups present in seaweed proteins and in polysaccharides. For example, bands at approximately 1740, 1640, 1420 and 1240 cm-1 can be attributed to various carboxyl stretches (free C=O, chelate/ asymmetric C=O, symmetric C=O and C-O respectively) while polysaccharide ether and hydroxyl groups exhibit stretches of around 1160 and 1030 cm-1 respectively. On the other hand, seaweed proteins exhibit –NH stretches at approximately 1540 cm-1. Changes in band intensity and frequency after metal binding can be used to identify the functionalities involved in binding.
Figure 20 illustrates sample FTIR spectra obtained by Lodeiro et al. (63) for Cd (II) and Pb (II) binding by Cystoseira baccata.Lodeiro et al. (63) found that cadmium and lead binding to Cystoseira baccata involved significant interaction of biomass carboxyl groups as well as amino groups while sulphonate groups did not appear to play a role in binding of these metals. Yang and Chen (166) also found that carboxyl and amino groups were involved in chromium binding to Sargassum sp. but, in addition to this, sulphonate groups also played a role in metal binding. Therefore, it is apparent that the groups involved in metal binding depend on both the metal ion involved and the seaweed species under consideration.
Page 23 of 47
John Wiley & Sons
2t-S-1Ed-D-P
123456789101112131415161718192021222324252627282930313233343536373839404142434445464748495051525354555657585960

For Peer Review
24
8.3. Scanning Electron Microscopy/Energy Dispersive X-ray Analysis (SEM/EDX) Scanning electron microscopy is a powerful technique that can be used to investigate
binding of metals to seaweed (155, 164, 166). SEM allows to evaluate morphological changes in the surface i.e. changes in the cell wall composition after metal binding, but when combinedwith EDX techniques it can provide valuable inputs in determining the distribution of various elements over the seaweed surface (164). However, it is worth noting that SEM provides only a qualitative estimation of the surface structure.
Yang and Chen (166) evaluated the surface of Sargassum sp. before and after metal loading. The SEM micrographs obtained by these authors are shown in Figure 21. The authors observed surface protuberance and microstructures in the raw seaweed (Figure 21a) and suggested that this may be due to calcium and other salt crystalloid deposition. This was in agreement with their EDX analysis which showed that calcium was a major component of the seaweed surface.
Raize et al. (155) also used SEM to evaluate the surface of Sargassum vulgaris before and after cadmium, nickel and lead binding. After metal binding, minor morphological changes including shrinking and layer sticking were seen in the cell wall matrix. Changes in surface morphology are usually related to disruption of the cross-linking between the metal ions and negatively charged chemical groups e.g. carboxyl groups in the cell wall polymers. Raw seaweeds usually contain high concentrations of calcium and magnesium (naturally present from seawater) in the cell wall, which creates a net of cross-linking (71). When the seaweed is exposed to metal solutions e.g. cadmium, the cadmium cations replace some of the calcium and magnesium ions thus changing the nature of the cross-linking on the surface and resulting in morphological changes.
8.4. X-ray Photoelectron Spectroscopy (XPS)X-ray photoelectron spectroscopy (XPS) involves irradiating a sample under vacuum
with mono-energetic X-rays. The electrons produced are then analyzed according to energy. Because each element has a unique set of binding energies for electrons, XPS can therefore be used to identify and determine the concentration of the elements on the surface (167). This technique facilitates quantitative elemental surface analysis, chemical state surface analysis, and determination of the molecular environment and/or oxidation state of metals (168).
Venkata Mohan et al. (169) showed that XPS was a suitable technique for the surface analysis of various biosorbents due to its sensitivity and chemical specificity. The technique has been used by a number of authors to determine interactions between seaweed functional groups and the metals bound to them in order to elucidate a metal binding mechanism (37, 155, 166).
Figure 22 illustrates the binding energy (BE) profiles of the carbon atom (C 1s) and the oxygen (O 1s) in raw Sargassum sp. before and after Cu (II) binding (as determined by Chen and Yang (123)). Analysis of these profiles before and after metal binding gives an indication of the degree of interaction between the various carbon and oxygen containing functionalities with metal ions. Similar BE profiles may be obtained for sulphur and nitrogen. From Figure 22 it is seen that the various carbon-containing functionalities such as hydrocarbons, alcohol, ether and carboxyl groups can be identified based on their respective binding energies (123). Deconvolution of the oxygen peak also reveals the presence of numerous oxygen species including alcohol, ether, carboxyl as well as metal oxides. Analysis of the area under each peak gives an estimate of the atomic percentage the functionalities in the biomass.
Apart from identifying the constituent elements contained within a sample; XPS is also a powerful tool for elucidating metal binding mechanism. This is especially important if differentiation between metal oxidation states is required. Figueira et al. (164) used XPS to gather chemical information on the interaction of iron with specific binding sites in the biomass. Sargassum biomass was exposed to sulphate solutions of either ferrous (II) or ferric
Page 24 of 47
John Wiley & Sons
2t-S-1Ed-D-P
123456789101112131415161718192021222324252627282930313233343536373839404142434445464748495051525354555657585960

For Peer Review
25
(III) iron. XPS results indicated the presence of iron in two oxidation states in the biomass exposed to ferrous solution whereas only Fe (III) was present in the ferric-iron exposed biomass. This suggested a partial oxidation of Fe (II) when in contact with the biomass.
9. MODELING OF THE SORPTION PROCESSFor evaluating the feasibility and effectiveness of biosorption in waste water treatment
it is essential to make predictions of the sorption performance, e.g. for facilitating process design. Therefore it is necessary to develop appropriate mathematical models of biosorptionbinding equilibrium and dynamic which are necessary as a prerequisite for all further work involving e.g. batch kinetic studies and column applications.
Since, ion exchange has been recognized as the principal mechanism of metal biosorption by algal biomass (170, 171), mathematical models have been proposed to predict biosorption in multimetal systems and to model the influence of ionic strength on the binding of toxic metals (172, 173). Numerical inversion techniques have also been developed to calculate the affinity distributions during metal sorption from experimental data. Various constrained and regularized least-squares algorithms are available in literature for the solution of such problems (125, 174).
However, the few models in the literature attempting to model biosorption in flow-through fixed-bed columns are considering the biosorption process as similar to the adsorption on activated carbon (175). Recently, also Janson-Charrier (176) used the Bohart-Adams sorption model (177) developed for sorption on granulated activated carbon (GAC) to analyze the performance of a biosorption column.
Several biosorption studies reported on in the literature attempted to develop mathematical equilibrium sorption models and to verify their suitability for describing biosorption of Cu by marine algal biomass (101) or the uptake of Cu onto Na-alginate (174). It has been agreed on that the major mechanism involved in heavy metal uptake by organic biomass, and implicitly by algae, is ion exchange (178 - 182). Consequently, ion exchange models have been introduced to fit and interpret the data obtained from both equilibrium and dynamic biosorption experiments (125, 173).
Studies of a biosorption column performance that are reported in the literature commonly use the conventional Bohart-Adams sorption model (176, 183). However, the most complete column model taking into account the dominant intraparticle mass transfer was developed for ion exchange by Tan and Spinner (184). In principle, this Mass Transfer Model can predict breakthrough curves for all of the species being removed by the biosorbent and also even for the elution curves obtained during sorbent regeneration (185).
Assuming isothermal conditions and constant physical properties for the feed solution, the differential molar balance for a sorbate species M is:
C
z Pe
C
z
C
tD
q
tM
c
M MgM
M
∂
∂
∂
∂
∂− + + =
10
2
2(22)
The sorption rate equation can be written as equation (23), assuming a linear driving force for the sorption process and a combined film and intraparticle mass transfer resistance.
)( *MMM
M qqSht
q−=
∂∂
(23)
With:
DQ
CgM
b=ρε
0
(24)
ShK L
MfM= 0
ν(25)
Page 25 of 47
John Wiley & Sons
2t-S-1Ed-D-P
123456789101112131415161718192021222324252627282930313233343536373839404142434445464748495051525354555657585960
For Peer Review
26
PeL
Dc
z= 0
ν(26)
Where:T is time [h], ρb is the packing density of dry biomass in the packed-bed [g.L-1], Q is the concentration of binding sites in the biosorbent [meq.g-1], C0 is the normality of the column feed [meq.L-1], ε is the column void fraction [-], L0 is the length of the column [cm], Ν is the interstitial fluid velocity [cm.min-1], DZ is the dispersion coefficient in the liquid phase [cm2.min-1], ShM is the rate constant for ion exchange [min-1], CM is the concentration of species M in the liquid phase [meq.L-1], qM is the uptake of species M by the biosorbent [meq.g-1].
The relationship for a metal species represented by equations (11) - (12) should be solved simultaneously. The specific initial and boundary conditions are specified in Kratochvil (186).In the case of a binary-component system, the set of 2 coupled partial differential equations was solved numerically by using FEMLAB multiphysics modeling computer program. For multi-component systems, the number of coupled equations to be solved increases with the number of components. Figure 23 illustrates results obtained when modeling.Correspondingly, the complexity of the computational solution of the set of equations is also increased. In Figure 23 (187), the concentration profiles calculated and predicted by the model are compared to the experimental breakthrough curves obtained for the following mixtures (Cu2+-Zn2+) and (Cu2+-Cd2+), respectively, fed into columns packed with Ca-preloaded biosorbent (Sargassum). The concentration of Cu2+ in the (Cu2+-Zn2+), and the (Cu2+-Cd2+) mixtures was 30 mg.L-1 (~ 0.5 mmol.L-1), while the concentrations of Zn and Cd in these mixtures were approximately 4 mg.L-1. The flow rate, the biomass packing density and the height of the packing were kept constant for all experiments.
The experimental breakthrough curves were compared to the results calculated after solving two systems of two partial differential equations. Figures 23a and 23b (modeling and experimental) show that for feeds containing Cu2+, the column effluent concentrations of heavy metals Zn2+ and Cd2+ tend to overshoot the normal maximum dimensionless value of 1.
As can be seen in Figure 23, the model not only confirmed the existence of the overshoot of Zn2+ for the (Cu2+-Zn2+) mixture and of Cd2+ for the (Cu2+-Cd2+) mixed system, both sorbing onto Ca-biomass, but it also yielded a very good estimate of the C/C0 maximum value. It may be concluded that this model, in conjunction with the FEMLAB solver software, could serve as a very useful tool for examining multi-metal biosorption in dynamic flow-through systems. The model breakthrough curves in Figures 23 yields important information from the process feasibility stand-point by providing the time intervals between the breakthroughs of the individual components, and the magnitude of the overshoots that inside the column translate as concentration extremes.
10. SORPTION PROCESS OPTIMIZATION CHALLENGESThe lack of design information on biosorption in columns is partly due to the fact that
the metal uptake by different biomaterials is still not fully understood and partly because most types of biomass have to be immobilized, granulated or otherwise processed before their use in a column so as to provide for good flow conditions and acceptable pressure drop across the bed. The column pressure drop has to eventually be balanced and optimized against the maximum sorption performance requirement as judged by:● the total amount of sorbate accumulated in the column (sorbent loading),● the length of service time,● the sorbent utilization: as compared to the theoretical potential at the given feed
concentration, reflecting thus the overall sorbent utilization inefficiency due to the
Page 26 of 47
John Wiley & Sons
2t-S-1Ed-D-P
123456789101112131415161718192021222324252627282930313233343536373839404142434445464748495051525354555657585960

For Peer Review
27
breakthrough curve shape and/or effluent concentration overshoots of secondary contaminants (sorbates).
In preparation for biosorption process design the sorption/desorption performance and characteristic properties (mass transfer, pressure and attrition resistance, chemical stability, etc.) of the biosorbent should be reasonably well known. While equilibrium sorption tests yield some basic information, the sorption system behavior is invariably examined eventually under continuous-flow conditions. Its performance assessment and prediction based on both equilibrium as well as dynamic studies eventually leads to sizing of the equipment. Advanced methodologies used for this purpose are based on sophisticated computer-based modeling and optimization of the (bio)sorption process.
Modeling the biosorption binding equilibrium and dynamics is a prerequisite for all further work involving batch kinetic studies and particularly for the continuous-flow sorption column applications which represent the most effective configuration of the sorption-based process.
11. REFERENCES
1. J.W. Moore and S. Ramamoorthy, Heavy metals in natural waters, Springer-Verlag, New York, 1984, pp. 28-57, 77-99 and 182-204.
2. C.T. Tien and C.P. Huang, "Formation of surface complexes between heavy metals and sludge particles," Heavy metals in the environment, J.P. Vernet (Editor), Elsevier, Amsterdam, The Netherlands, 1991, pp. 295-311.
3. W.A.P. Black and R.L. Mitchell, J. Marine Biol. Assoc. 30, 575-584 (1952).4. N. Kuyucak, "Feasibility of biosorbents application," Biosorption of heavy metals, B.
Volesky (Editor), CRC Press, Boca Raton, FL, 1990, pp. 371-378.5. UNEP, Environmental aspects of the metal finishing industry: A technical guide,
United Nations Environment Programme, Industry and Environment Office, Paris, 1989, pp. 19-39 and 53-57.
6. B. Volesky, Sorption and biosorption, BV Sorbex, Inc., Montreal, Canada, 2003, p. 316.
7. B. Volesky and Z.R. Holan, Biotechnol. Prog. 11, 235-250 (1995).8. A. Kapoor and T. Viraraghavan, Bioresource Technology 53, 195-206 (1995).9. H. Mann, "Biosorption of heavy metals by bacterial biomass," Biosorption of heavy
metals, B. Volesky (Editor), CRC Press, Boca Raton, FL, 1990, pp. 93-137.10. N. Kuyucak and B. Volesky, "Biosorption by algal biomass," Biosorption of heavy
metals, B. Volesky (Editor), CRC Press, Boca Raton, FL, 1990, pp. 173-198.11. Z.R. Holan and B. Volesky, Biotechnol. Bioeng. 43, 1001-1009 (1994).12. J. Ferguson and B. Bubela, Chem. Geol. 13, 163-186 (1974).13. Y.S. Ho, D.A.J. Wase and C.F. Forster, Water Res. 29, 5, 1327-1332 (1995).14. X.H. Chen, T. Gosset and D.R. Thevenot, Water Res. 24, 1463-1471 (1990).15. A.V. Pethkar, S.K. Kulkarni and K.M. Paknikar, Bioresour. Technol. 80, 3, 211-215
(2001).16. C.H. Niu, B. Volesky and D. Cleiman, Water Res. 41, 11, 2473-2478 (2007).17. H.K. Hansen, A. Ribeiro and E. Mateus, Miner. Eng. 19, 5, 486-490 (2006).18. S. Ishikawa, K. Suyama, K. Arihara and M. Itoh, Bioresour. Technol. 81, 3, 201-206
(2002).19. M.E. Romero-Gonzalez, C.J. Williams, P.H.E. Gardiner, S.J. Gurman and S. Habesh,
Environ. Sci. Technol. 37, 18, 4163-4169 (2003).20. H. Niu and B. Volesky, Hydrometallurgy 71, 1-2, 209-215 (2003).21. J.L. Gardea-Torresdey, K.J. Tiemann, G. Gamez, K. Dokken, I. Cano-Aguilera, L.R.
Furenlid and M.W. Renner, Environ. Sci. Technol. 34, 20, 4392-4396 (2000).
Page 27 of 47
John Wiley & Sons
2t-S-1Ed-D-P
123456789101112131415161718192021222324252627282930313233343536373839404142434445464748495051525354555657585960
For Peer Review
28
22. M.L. Arrascue, H.M. Garcia, O. Horna and E. Guibal, Hydrometallurgy 71, 1-2, 191-200 (2003).
23. T. Ogata and Y. Nakano, Water Res. 39, 18, 4281-4286 (2005).24. L. Norton, K. Baskaran and T. McKenzie, Adv. Environ. Res. 8, 3-4, 629-635 (2004).25. G. Uslu, A.Y. Dursun, H.I. Ekiz and Z. Aksu, Process Biochem. 39, 1, 105-110 (2003).26. T.A. Davis, F.E. Ali, E. Giannitti, B. Volesky and A. Mucci, Water Qual. Res. J.
Canada 39, 3, 183-189 (2004).27. Z. Aksu, F. Gonen and Z. Demircan, Process Biochem. 38, 2, 175-186 (2002).28. G.C. Donmez, Z. Aksu, A. Ozturk and T. Kutsal, Process Biochem. 34, 9, 885-892
(1999).29. Y.S. Yun, D. Park, J.M. Park and B. Volesky, Environ. Sci. Technol. 35, 21, 4353-4358
(2001).30. T.A. Davis, B. Volesky and R.H.S.F. Vieira, Water Res. 34, 17, 4270-4278 (2000).31. M. Iqbal and R.G.J. Edyvean, Miner. Eng. 17, 2, 217-223 (2004).32. S. Tunali, A. Cabuk and T. Akar, Chem. Eng. J. 115, 3, 203-211 (2006).33. A. Ates, A. Yildiz, N. Yildiz and A. Calimli, Ann. Chim. 97, 5-6, 385-393 (2007).34. V. Diniz and B. Volesky, Water Res. 39, 1, 239-247 (2005).35. A.C. Texier, Y. Andres and P. Le Cloirec, Environ. Sci. Technol. 33, 3, 489-495
(1999).36. M.C. Palmieri, B. Volesky and O. Garcia, Hydrometallurgy 67, 1-3, 31-36 (2002).37. P.X. Sheng, Y.P. Ting, J.P. Chen and L. Hong, J. Colloid Interface Sci. 275, 1, 131-141
(2004).38. C.E. Rodriguez, A. Quesada and E. Rodriguez, Braz. J. Microbiol. 37, 4, 465-467
(2006).39. T. Bahadir, G. Bakan, L. Altas and H. Buyukgungor, Enzyme Microb. Technol. 41, 1-2,
98-102 (2007).40. M. Ruiz, A.M. Sastre and E. Guibal, React. Funct. Polym. 45, 3, 155-173 (2000).41. E. Guibal, N.V. Sweeney, T. Vincent and J.M. Tobin, React. Funct. Polym. 50, 2, 149-
163 (2002).42. H.W. Ma, X.P. Liao, X. Liu and B. Shi, J. Membr. Sci. 278, 1-2, 373-380 (2006).43. E. Guibal, A. Larkin, T. Vincent and J.M. Tobin, Ind. Eng. Chem. Res. 38, 10, 4011-
4022 (1999).44. Y.P. Kumar, P. King and V. Prasad, Chem. Eng. J. 129, 1-3, 161-166 (2007).45. M. Guiry, www.Seaweed.ie, 2007.46. C.X. Chan, C.L. Ho and S.M. Phang, Trends Plant Sci. 11, 4, 165-166 (2006).47. H.C. Bold and M.J. Wynne, "Introduction to the algae: Structure and reproduction,"
Prentice-Hall, Englewood Cliffs, NJ, 1985, p. 516.48. T.F. Lee, "The seaweed handbook," Dover Publications Inc., New York, 1986, pp. 43-
210.49. T.A. Davis, A. Mucci and B. Volesky, Water Res. 37, 18, 4311-4330 (2003).50. B. Volesky, Hydrometallurgy 59, 2-3, 203-216 (2001).51. C.S. Lobban and P.J. Harrison, "Pollution," Seaweed ecology and physiology,
Cambridge University Press, Cambridge, UK, 1997, pp. 255-281.52. R. Cornelis, J. Caruso, H. Crews and K. Heumann, "Handbook of elemental
speciation," John Wiley & Sons Ltd., Chichester, 2005, pp. 1-6.53. M.A. Hashim and K.H. Chu, Chem. Eng. J. 97, 2-3, 249-255 (2004).54. H. Bradl, "Sources and origins of heavy metals," Heavy metals in the environment:
Origin, interaction and remediation, Elsevier Academic Press, Amsterdam, 2005, pp. 1-11.
55. J.H. Duffus, Chem. Internation. 23, 6, 161-167 (2001).
Page 28 of 47
John Wiley & Sons
2t-S-1Ed-D-P
123456789101112131415161718192021222324252627282930313233343536373839404142434445464748495051525354555657585960
For Peer Review
29
56. T.A. Scott and E.I. Mercer, "Concise encyclopedia biochemistry and molecular biology," H.D. Jakube (Editor), W. de Gruyter & Co., Berlin; New York, 1996, pp. 245-306.
57. G.M. Rand, P.G. Wells and S.L. McCarty, "Introduction to aquatic toxicology," Fundamentals of aquatic toxicology; effects, environmental fate and risk assessment, G.M. Rand (Editor), Taylor and Francis, Washington DC, 1995, pp. 449-492.
58. W.J. Lyman, "Transport and transformation processes," Fundamentals of aquatic toxicology; effects, environmental fate and risk assessment, G.M. Rand (Editor), Taylor and Francis, Washington DC, 1995, pp. 449-492.
59. T.R. Crompton, "Pollution of potable water," Toxicants in the aqueous ecosystem, John Wiley & Sons, Chichester, 1997, pp. 291-298.
60. B. Volesky, "Removal and recovery of heavy metals by biosorption," Biosorption of heavy metals, B. Volesky (Editor), CRC Press, Boca Raton, FL, 1990, pp. 7-43.
61. P.H.S. United States Department of Health & Human Services, Agency for toxic substances and disease registry (atsdr) toxicological profiles, http://www.Atsdr.Cdc.Gov/toxprofiles/, 1999.
62. S.S. Ahluwalia and D. Goyal, Bioresour. Technol. 98, 12, 2243-2257 (2007).63. P. Lodeiro, J.L. Barriada, R. Herrero and M.E.S. De Vicente, Environ. Pollut. 142, 2,
264-273 (2006).64. M. Nourbakhsh, Y. Sag, D. Ozer, Z. Aksu, T. Kutsal and A. Caglar, Process Biochem.
29, 1-5 (1994).65. A.K. Sengupta and D. Clifford, Ind. Eng. Chem. Fund. 25, 2, 249-258 (1986).66. V.K. Singh and P.N. Tiwari, J. Chem. Technol. Biotechnol. 69, 3, 376-382 (1997).67. R.E. Lee, "Phycology," Cambridge University Press, Cambridge, UK, 1980, pp. 3-66.68. A. Haug, B. Larsen and O. Smidsrod, Acta Chem. Scand. 21, 3, 691-& (1967).69. A. Haug, Acta Chem. Scand. 15, 1794-1795 (1961).70. R.G. Schweiger, J. Org. Chem. 27, 1789-1791 (1962).71. E. Percival and R.H. McDowell, Chemistry and enzymology of marine algal
polysaccharides, Academic Press, London, U.K., 1967, pp. 99-126.72. V.J. Chapman, Seaweeds and their uses, Chapman and Hall, London, UK, 1980, pp.
194-240.73. E. Fourest and B. Volesky, Environ. Sci. Technol. 30, 1, 277-282 (1996).74. W. Mackie and R.D. Preston, "Cell wall and intercellular region polysaccharides,"
Algal physiology and biochemistry, W.D.P. Stewart (Editor), Blackwell Scientific Publications, Oxford, UK, 1974, pp. 58-64.
75. A. Haug and O. Smidsrod, Acta Chem. Scand. 24, 843-854 (1970).76. C. Dawczynski, R. Schubert and G. Jahreis, Food Chem. 103, 3, 891-899 (2007).77. B.Z. Siegel and S.M. Siegel, Critical reviews in microbiology 3, 1, 1-26 (1973).78. J.C.C. Chan, P.C.K. Cheung and P.O. Ang, J. Agric. Food Chem. 45, 8, 3056-3059
(1997).79. S. Schiewer and M.H. Wong, Chemosphere 41, 271-282 (2000).80. D.W. Darnall, B. Greene, M.T. Henzl, J.M. Hosea, R.A. McPherson, J. Sneddon and
M.D. Alexander, Environ. Sci. Technol. 20, 206-208 (1986).81. B. Greene, R. McPherson and D.W. Darnall, "Algal sorbents for selective metal ion
recovery," Metals speciation, separation and recovery, J.W. Patterson and R. Pasino (Editors), Lewis, Chelsea, MI, 1987, pp. 315-338.
82. Z.R. Holan, B. Volesky and I. Prasetyo, Biotechnol. Bioeng. 41, 819-825 (1993).83. N. Kuyucak and B. Volesky, Biotechnol. Bioeng. 33, 7, 809-814 (1989).84. G.J. Ramelow, D. Fralick and Y. Zhao, Microbios 72, 81-93 (1992).85. M. Tsezos and B. Volesky, Biotechnol. Bioeng. 23, 583-604 (1981).
Page 29 of 47
John Wiley & Sons
2t-S-1Ed-D-P
123456789101112131415161718192021222324252627282930313233343536373839404142434445464748495051525354555657585960

For Peer Review
30
86. B. Greene, M. Hosea, R. McPherson, M. Henzl, M.D. Alexander and D.W. Darnall, Environ. Sci. Technol. 20, 6, 627-632 (1986).
87. B. Greene, M.T. Henzl, J.M. Hosea and D.W. Darnall, Biotechnol. Bioeng. 28, 764 (1986).
88. J.M. Tobin, D.G. Cooper and R.J. Neufeld, Appl. Envir. Microbiol. 47, 821-824 (1984).89. I. Aldor, E. Fourest and B. Volesky, Can. J. Chem. Eng. 73, 516-522 (1995).90. N. Kuyucak and B. Volesky, Biotechnol. Bioeng. 33, 7, 815-822 (1989).91. C.F.J. Baes and R.E. Mesmer, The hydrolysis of cations, Wiley-Interscience, John
Wiley & Sons, New York, 1976, pp. 397-419.92. F.M.M. Morel, Principles of aquatic chemistry, John Wiley & Sons, New York, 1983,
pp. 237-266.93. W. Stumm and J.J. Morgan, Aquatic chemistry, John Wiley & Sons, New York, 1970,
pp. 238-299.94. C.F.J. Baes and R.E. Mesmer, The hydrolysis of cations, Wiley-Interscience, John
Wiley & Sons, New York, 1976, pp. 1-7.95. G.K. Pagenkopf, Introduction to natural water chemistry, Marcel Dekker, New York,
1978, pp. 161-167, 214-216 and 220-230.96. Y.E. Collins and G. Stotzky, Appl. Environ. Microbiol. 58, 1592-1600 (1992).97. W. Stumm and J.J. Morgan, Aquatic chemistry, John Wiley & Sons, New York, 1970,
pp. 445-513.98. G. Naja, C. Mustin, B. Volesky and J. Berthelin, Water Res. 39, 4, 579-586 (2005).99. M. Tsezos, "Engineering aspects of metal binding by biomass," Microbial mineral
recovery, H.L. Ehrlich and C.L. Brierley (Editors), McGraw-Hill, New York, 1990, pp. 325-340.
100. J.M. Tobin, Cooper, D.G., Neufeld, R.J., Biotechnol. Bioeng. 31, 282-286 (1988).101. K.H. Chong and B. Volesky, Biotechnol. Bioeng. 47, 451-460 (1995).102. H. May, "Biosorption by industrial microbial biomass," McGill University, Montreal,
Canada, 1984.103. I. Prasetyo, "Removal of toxic metals from aqueous solutions by biosorption," McGill
University, Montreal, Canada, 1992.104. N. Kuyucak and B. Volesky, Biorecovery 1, 189-204 (1989).105. A. Leusch, Z.R. Holan and B. Volesky, J. Chem. Tech. Biotechnol. 62, 279-288 (1995).106. J.M. Smith, Chemical engineering kinetics, McGraw-Hill, New York, 1981, pp. 310-
322.107. P. Weppen and A. Hornburg, Thermochim. Acta 269/270, 393-404 (1995).108. B. Greene and D.W. Darnall, Biorecovery 1, 27-41 (1988).109. J.M. Tobin, D.G. Cooper and R.J. Neufeld, Biotechnol. Bioeng. 30, 882-886 (1987).110. V. Diniz and B. Volesky, Water Res. 39, 11, 2229-2236 (2005).111. J.A. Davis and J.O. Leckie, Environ. Sci. Technol. 12, 1309-1315 (1978).112. B. Nowack, J. Luetzenkirchen, P. Behra and L. Sigg, Environ. Sci. Technol. 30, 2397-
2405 (1996).113. M.A. Glaus, W. Hummel and L.R. Van Loon, Environ. Sci. Technol. 29, 2150-2153
(1995).114. I. Langmuir, J. Am. Chem. Soc. 40, 1361-1403 (1918).115. V.E. Bower and R.G. Bates, "Equilibrium constants for proton-transfer reactions,"
Handbook of analytical chemistry, L. Meites (Editor), McGraw-Hill, New York, 1963, pp. 1.20-21.27.
116. J. Buffle, Complexation reactions in aquatic systems: An analytical approach, Ellis Horwood Ltd., Chichester, U.K., 1988, pp. 323, 251.
117. R.H. Crist, K. Oberholser, J. McGarrity, D.R. Crist, J.K. Johnson and J.M. Brittsan, Environ. Sci. Technol. 26, 3, 496-502 (1992).
Page 30 of 47
John Wiley & Sons
2t-S-1Ed-D-P
123456789101112131415161718192021222324252627282930313233343536373839404142434445464748495051525354555657585960
For Peer Review
31
118. G. Naja, "Reactivite des associations organo-minerales dans une lagune d'eaux de mine; fixation du plomb par des matieres biologiques," Centre de Pedologie Biologique, Henri-Poincare-Nancy I, Nancy, 2001, p. 255.
119. D. Kratochvil and B. Volesky, Trends in Biotechnology 16, 291-300 (1998).120. H.S. Lee and B. Volesky, Water Res. 31, 3082-3088 (1997).121. S. Schiewer and B. Volesky, Environ. Sci. Technol. 29, 12, 3049-3058 (1995).122. A.C.A. da Costa, A.P.M. Tavares and F.P. de Franca, Electron. J. Biotechnol. 4, 3, 125-
129 (2001).123. J.P. Chen and L. Yang, Langmuir 22, 21, 8906-8914 (2006).124. J.L. Gardea-Torresdey, M.K. Becker-Hapak, J.M. Hosea and D.W. Darnall, Environ.
Sci. Technol. 24, 1372-1378 (1990).125. D. Kratochvil, B. Volesky and G. Demopoulos, Water Res. 31, 2327-2339 (1997).126. N. Kuyucak and B. Volesky, Biotechnol. Bioeng. 33, 7, 823-831 (1989).127. M.E. Treen-Sears, B. Volesky and R.J. Neufeld, Biotechnol. Bioeng. 26, 1323-1329
(1984).128. J.C. Westall, "Adsorption mechanisms in aquatic surface chemistry," Aquatic surface
chemistry, W. Stumm (Editor), John Wiley & Sons, New York, 1987, pp. 3-32.129. R.S. Cahn and O.L. Dermer, Introduction to chemical nomenclature, Butterworths,
London, UK, 1979, pp. 17-18.130. W.C. Fernelius, "Nomenclature of coordination compounds and its relation to general
inorganic nomenclature," Chemical nomenclature, American Chemical Society, Washington, DC, 1953, pp. 9-15.
131. A.J. Howard, "Aquatic environmental chemistry," Oxford University Press, Oxford, 1998, pp. 36-51.
132. W. Stumm and J.J. Morgan, "Aquatic chemistry," Wiley Interscience, New York, 1996, pp. 3-32.
133. Y. Marcus and A.S. Kertes, Ion exchange and solvent extraction of metal complexes, Wiley Interscience, John Wiley & Sons, New York, 1969, pp. 10-33.
134. A.D. Andrade, M.C.E. Rollemberg and J.A. Nobrega, Process Biochem. 40, 5, 1931-1936 (2005).
135. C.M.S. Botelho, R.A.R. Boaventura and M.L.S.S. Goncalves, Anal. Chim. Acta 462, 1, 73-85 (2002).
136. S.J. Allen and P.A. Brown, J. Chem. Technol. Biotechnol. 62, 1, 17-24 (1995).137. R.G. Pearson, J. Am. Chem. Soc. 85, 3533-3539 (1963).138. J. Buffle, Complexation reactions in aquatic systems: An analytical approach, Ellis
Horwood Ltd., Chichester, UK, 1988, pp. 59-65, 74, 284-286.139. E. Nieboer and D.H.S. Richardson, Environ. Poll. 1B, 11-13 (1980).140. C.F. Bell, "Properties of metals," Principles and applications of metal chelation,
Clarendon, Oxford, UK, 1977, pp. 30-50.141. G. Naja, C. Mustin, J. Berthelin and B. Volesky, J. Colloid Interface Sci. 292, 2, 537-
543 (2005).142. P. Udaybaskar, L. Iyengar and A.V.S. Prabhakara Rao, J. Appl. Polym. Sci. 39, 739-747
(1990).143. J. Marsden and L. House, Chemistry of gold extraction, Ellis Horwood, Hartnoll, UK,
1993, pp. 100-150.144. G.A.F. Roberts, Chitin chemistry, Macmillan, London, UK, 1992, pp. 55-58.145. D.C. Sharma and C.F. Forster, Water Res. 27, 7, 1201-1208 (1993).146. S. Bosinco, J. Roussy, E. Guibal and P. LeCloirec, Environ.Technol. 17, 55-62 (1996).147. D. Park, Y.S. Yun, J.H. Jo and J.M. Park, Water Res. 39, 4, 533-540 (2005).148. A. El-Sikaily, A. El-Nemr, A. Khaled and O. Abdelwehab, J. Hazard. Mater. In Press,
Corrected Proof, 113 (2007).
Page 31 of 47
John Wiley & Sons
2t-S-1Ed-D-P
123456789101112131415161718192021222324252627282930313233343536373839404142434445464748495051525354555657585960
For Peer Review
32
149. D. Park, Y.S. Yun, C.K. Ahn and J.M. Park, Chemosphere 66, 5, 939-946 (2007).150. R.H. Crist, K. Oberholser, D. Schwartz, J. Marzoff, D. Ryder and D.R. Crist, Environ.
Sci. Technol. 22, 755-760 (1988).151. M. Tsezos and A.A. Deutschmann, J. Chem. Tech. Biotechnol. 48, 29-39 (1990).152. H. Freundlich, Colloid and capillary chemistry, Methuen, London, U.K., 1926.153. W. Stumm, Chemistry of the solid-water interface, John Wiley & Sons, New York,
1992, pp. 87-97.154. W.J.J. Weber, "Adsorption theory, concepts and models," Adsorption technology: A
step by step approach to process evaluation and application, F.L. Slejko (Editor), Marcel Dekker, New York, 1985, pp. 9-17.
155. O. Raize, Y. Argaman and S. Yannai, Biotechnol. Bioeng. 87, 4, 451-458 (2004).156. L. Dambies, C. Guimon, S. Yiacoumi and E. Guibal, Colloid Surf. A-Physicochem.
Eng. Asp. 177, 2-3, 203-214 (2001).157. R.H. Crist, K. Oberholser, N. Shank and M. Nguyen, Environ. Sci. Technol. 15, 1212-
1217 (1981).158. D. Kaplan, D. Christiaen and S. Arad, Appl. Env. Microbiol. 53, 2953-2956 (1987).159. E. Fourest and B. Volesky, Appl. Biochem. Biotechnol. 67, 1, 33-44 (1997).160. G. Brunelot, P. Adrian, J. Rouiller, B. Guillet and F. Andreux, Chemosphere 19, 8-9,
1413-1419 (1989).161. R. Kucharkowski, W. Kluge, E. Kasper and A. Drescher, 4th Symposium on Ion-
Selective Electrodes, 533-538 (1984).162. G. Gran, Analyst 77, 661-671 (1952).163. J.C.M. de Wit, W.H. Van Riemsdijk and L.K. Koopal, Envir. Sci. Technol. 27, 2005-
2014 (1993).164. M.M.F. Figueira, B. Volesky, K. Azarian and V.S.T. Ciminelli, "Multimetal
biosorption in a column using sargassum biomass," Biohydrometallurgy and the environment toward the mining of the 21st century (part b): International biohydrometallurgy symposium - proceedings, R. Amils and A. Ballester (Editors), Elsevier Science, Amsterdam, The Netherlands, 1999, pp. 503-512.
165. L. Pereira, A. Sousa, H. Coelho, A.M. Amado and P.J.A. Ribeiro-Claro, Biomol. Eng.20, 4-6, 223-228 (2003).
166. L. Yang and J.P. Chen, Bioresour. Technol. In Press, Corrected Proof (2007).167. D.A. Skoog, F.J. Holler and T.A. Nieman, "Surface characterization by spectroscopy
and microscopy," Principles of instrumental analysis, Saunders College Publishing, 1992, pp. 535-566.
168. D. Briggs, "Applications of xps in polymer technology," Practical surface analysis, D. Briggs and M.P. Seah (Editors), 1990, pp. 436 -483.
169. S. Venkata Mohan, S.V. Ramanaiah, B. Rajkumar and P.N. Sarma, Bioresour. Technol.98, 5, 1006-1011 (2007).
170. B. Greene, J.L. Gardea-Torresday, J.M. Hosea, R.A. McPherson and D.W. Darnal, "Algal ion exchangers for waste metal reclamation," Chemical and biological detoxification of hazardous wastes, Lewis, Chelsea, MI, USA, 1990.
171. R.H. Crist, J.R. Martin, P.W. Guptill, J.M. Eslinger and D.R. Crist, Environ. Sci. Technol. 24, 337-342 (1990).
172. S. Schiewer and B. Volesky, Environ. Sci. Technol. 30, 10, 2921-2927 (1996).173. S. Schiewer and B. Volesky, Environ. Sci. Technol. 31, 2478-2485 (1997).174. L.K. Jang, D. Nguyen and G.G. Geesey, Water Res. 29, 307-313 (1995).175. E.M. Trujillo, T.H. Jeffers, C. Ferguson and H.Q. Stevenson, Environ. Sci. Technol. 25,
9, 1559-1565 (1991).176. M. Jansson-Charrier, E. Guibal, J. Roussy, R. Surjous and P. LeCloirec, Water Sci.
Technol. 34, 10, 169-177 (1996).
Page 32 of 47
John Wiley & Sons
2t-S-1Ed-D-P
123456789101112131415161718192021222324252627282930313233343536373839404142434445464748495051525354555657585960

For Peer Review
33
177. G.S. Bohart and E.Q. Adams, J. Am. Chem. Soc. 42, 523-544 (1920).178. E. Valdman and S.G.F. Leite, Bioprocess Eng. 22, 2, 171-173 (2000).179. S. Schiewer and B. Volesky, "Biosorption by marine algae," Remediation, J.J. Valdes
(Editor), Kluwer Academic Publishers, Dordrecht, The Netherlands, 2000, pp. 139-169.180. A. de Lucas, J.L. Valverde, M.C. Romero, J. Gomez and J.F. Rodriguez, J. Chem. Eng.
Data 46, 73-78 (2001).181. D. Schmitt, A. Müller, Z. Csögör, F.H. Frimmel and C. Posten, Water Res. 35, 3, 779-
785 (2001).182. V.K. Gupta, A.K. Shrivastava and N. Jain, Water Res. 35, 17, 4079-4085 (2001).183. T.R. Muraleedharan, Philip L., Iyengar L. and C. Venkobachar, Bioresour. Technol. 49,
179-186 (1994).184. H.K.S. Tan and I.H. Spinner, Can. J. Chem. Eng. 72, 330-341 (1994).185. G. Naja and B. Volesky, Envir. Sci. Technol. 40, 12, 3996-4003 (2006).186. D. Kratochvil and B. Volesky, Water Res. 34, 12, 3186-3196 (2000).187. G. Naja and B. Volesky, Colloid Surf. A-Physicochem. Eng. Asp. 281, 1-3, 194-201
(2006).188. L. Jossens, J.M. Prausnitz, W. Fritz, U. Schlunder and A.L. Myers, Chem. Eng. Sci. 33,
1097-1106 (1978).189. R. Sips, J. Chem. Phys. 16, 5, 490-495 (1948).190. B. Volesky, "Equilibrium biosorption performance," Sorption and biosorption, BV-
Sorbex, Inc., St.Lambert, Quebec, 2003, pp. 103-116.191. O. Smidsrod and K.I. Draget, Carbohydr. Eur. 14, 6-13 (1996).
Page 33 of 47
John Wiley & Sons
2t-S-1Ed-D-P
123456789101112131415161718192021222324252627282930313233343536373839404142434445464748495051525354555657585960

For Peer Review
Table 1. Comparison of various literature studies of cations and anions removal by biosorption.
Operating ConditionsMetal Biosorbent
Co
mmol L-1
pH T(°C)
Biomass concentration (g L-1)
Agitation rate (rpm)
Biosorption capacity qmg g-1
Ref
Ag Cladosporium
cladosporioides 1
0.9 n.a 25 2 120 44.5 (15)
Cladosporium
cladosporioides 1
0.9 n.a 25 2 120 15.2 (15)
As Ucides cordatus n.a. 2.5 25 2.0 200 83 (16)
Lessonia nigrescens 8.0 2.5 25 4 100 45.2 (17)
Lessonia nigrescens 8.0 4.5 25 4 100 33.2 (17)
Lessonia nigrescens 8.0 6.5 25 4 100 28.2 (17)
Au (I) Hen eggshell membrane
0.5-2.5 3 5 0.5-0.7 90 147 (18)
Au
(III)
Dealginated seaweed waste
0.05 3 25 10 n.a. 78.8 (19)
Ucides cordatus n.a. 3.4 25 2 n.a. 33.5 (20)
Hen eggshell membrane
0.5-2.5 3 65 0.5-0.7 90 618 (18)
Cladosporium
cladosporioides 1
0.5 4 25 2 120 96.6 (15)
Cladosporium
cladosporioides 2
0.5 4 25 2 120 105 (15)
Medicago sativa
alfalfa
0.3 2.0 25 0.3 n.a. 40 (21)
Chitosan
(glutaraldehyde-
crosslinked)
0.126 1.6 25 0.05 n.a. 571 (22)
Tannin gel particles 0.5 2.0 20 0.1 180 8,000 (23)
Cd Saccharomyces
cerevisiae
0.22 6.0 30 1 200 15.38 (24)
Rhizopus arrhizus 0.44 3.5 30 n.a. 150 11.17 (25)
Sargassum fluitans 0.25-5.9 4.5 22 2 180-300 106.7 (26)
Laminaria digitata 0.25-5.9 4.5 22 2 180-300 139.37 (26)
Sargassum thunbergii 0.25-5.9 4.5 22 2 180-300 77.5 (26)
Sargassum
oligocystum
0.25-5.9 4.5 22 2 180-300 120.2 (26)
Macrocystis pyrifera 0.25-5.9 4.5 22 2 180-300 129,2 (26)
Cr Ucides cordatus n.a. 2.0 25 2 n.a. 28.07 (20)
Activated sludge 1.92 1.0 25 0.5 150 61.00 (27)
Page 34 of 47
John Wiley & Sons
2t-S-1Ed-D-P
123456789101112131415161718192021222324252627282930313233343536373839404142434445464748495051525354555657585960

For Peer Review
Chlorella vulgaris 1.92 2.0 25 1 125 23.00 (28)
Synechocystis sp. 1.92 2.0 25 1 125 19.20 (28)
Ecklonia sp. 1.9 4.0 25 5 200 24.1 (29)
Sargassum sp. 0.09-4.0 4.5 22 2.0 25 Hz 101.1 (30)
Sargassum
filipendula
0.09-4.0 4.5 22 2.0 25 Hz 74.18 (30)
Cu Phanerochaete
chrysosporium
1.57 6.0 25 1 100 60.94 (31)
Rhizopus arrhizus 0.78 4.5 30 n.a. 150 7.32 (25)
Chlorella vulgaris 1.57 4.5 25 1 125 40.00 (28)
Synechocystis sp. 1.57 4.5 25 1 125 23.40 (28)
Bacillus sp. 3.14 5.0 25 2 125 16.25 (32)
Pseudevernia
furfuracea (L.) Zopf
n.a. 5-6 35 0.2 120 60.83 (33)
Pseudevernia
furfuracea (L.) Zopf
n.a. 5-6 25 0.2 120 24.79 (33)
Sargassum vulgare 0.16-3.9 4.5 22 2.0 25 Hz 59.1 (30)
Sargassum
filipendula
0.16-3.9 4.5 22 2.0 25 Hz 56.55 (30)
Sargassum fluitans 0.16-3.9 4.5 22 2.0 25 Hz 50.83 (30)
Eu Sargassum fluitans 0.4-7.2 5.0 25 2.0 n.a. 121.6-136.8 (34)
Pseudomonas
aeruginosa
1-7 5.0 20 40 500 44 (35)
La Sargassum fluitans 0.4-7.2 5.0 25 2.0 n.a. 111.1-125 (34)
Pseudomonas
aeruginosa
1-7 5.0 20 40 500 55.1 (35)
Sargassum fluitans n.a. 2.0 30 2.5 180 6.94 (36)
Sargassum fluitans n.a. 5.0 30 2.5 180 73.61 (36)
Ni Sargassum sp. 1.0 5.5 25 1.0 200 35.8 (37)
Panida sp. 1.0 5.5 25 1.0 200 36.98 (37)
Chlorella vulgaris 1.7 5.0 25 1.0 125 42.30 (28)
Synechocystis sp. 1.7 5.0 25 1.0 125 15.80 (28)
Pseudevernia
furfuracea (L.) Zopf
n.a. 4.0 35 0.2 120 49.87 (33)
Pseudevernia
furfuracea (L.) Zopf
n.a. 4.0 25 0.2 120 27.51 (33)
Acinetobacter
baumannii
0.017 4.5 25 0.05 80 8.8 (38)
Pseudomonas 0.017 4.5 25 0.05 80 5.7 (38)
Page 35 of 47
John Wiley & Sons
2t-S-1Ed-D-P
123456789101112131415161718192021222324252627282930313233343536373839404142434445464748495051525354555657585960

For Peer Review
aeruginosa
Pb Sargassum sp. 1.0 5.0 25 1 200 240 (37)
Panida sp. 1.0 5.0 25 1 200 259 (37)
Phanerochaete
chrysosporium
0.48 6.0 25 1 100 76.95 (31)
Saccharomyces
cerevisiae
0.12 5.0 30 1 200 15.59 (24)
Rhizopus arrhizus 0.24 4.0 25 n.a. 150 12.31 (25)
Bacillus sp. 1.2 3.0 25 2 125 92.27 (32)
Rhizopus arrhizus 0.013 4.5 30 1 120 2.64 (39)
Pd Chitosan
(glutaraldehyde
crosslinked)
0.37 2 20 0.3 n.a. 180 (40)
Chitosan (sulfur derivative)
0.46 2.2 20 n.a. 240 350-370 (41)
Bayberry tannin 0.46 4.0 30 0.1 n.a. 22.4 (42)
Pt Chitosan flakes ≈0.25 2.0 20 ≈0.08 n.a. 300 (43)
Bayberry tannin 0.22 3.0 30 0.1 n.a. 30.8 (42)
Se Ucides cordatus n.a. 3.0 25 2 n.a. 11.84 (20)
V Ucides cordatus n.a. 2.5 25 2 n.a. 40.24 (20)
Yb Sargassum fluitans 0.4-7.2 5.0 25 2.0 n.a. 121.1-155.7 (34)
Pseudomonas
aeruginosa
1-7 5.0 20 40 500 56.3 (35)
Zn Phanerochaete
chrysosporium
1.53 6.0 25 1 100 34.13 (31)
Ulva fasciata sp. 1.53 5.0 30 3.33 180 13.5 (44)
Page 36 of 47
John Wiley & Sons
2t-S-1Ed-D-P
123456789101112131415161718192021222324252627282930313233343536373839404142434445464748495051525354555657585960
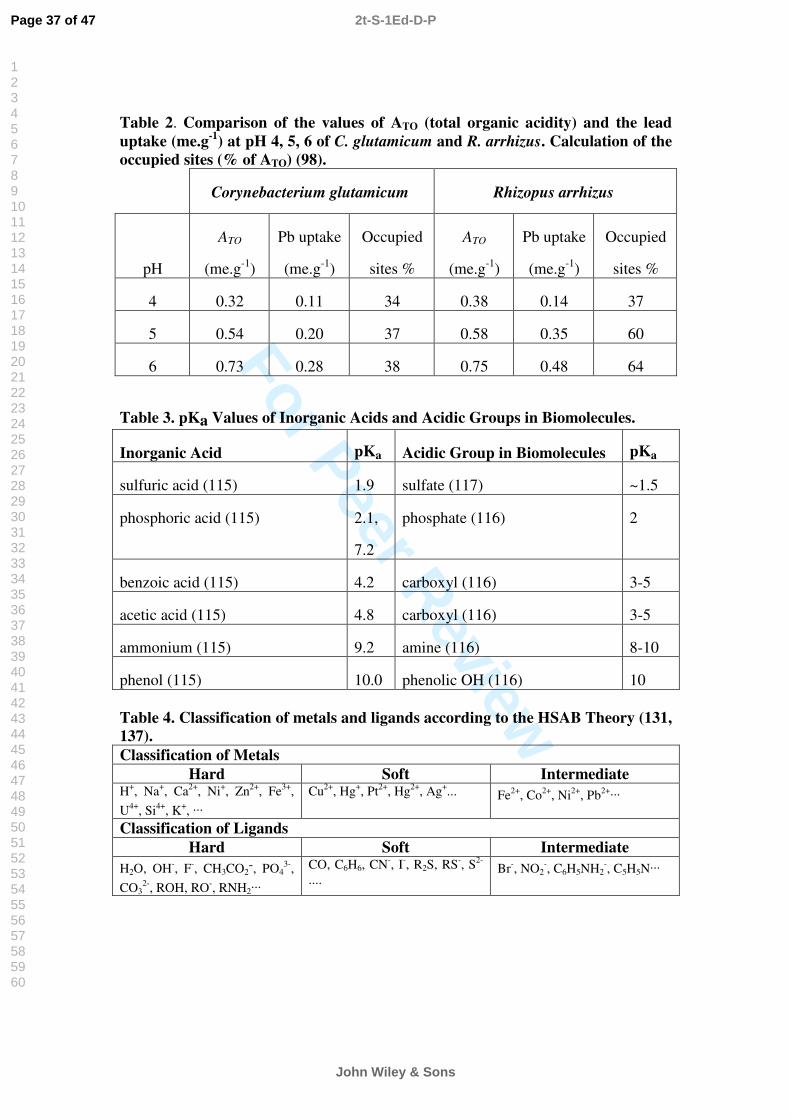
For Peer Review
Table 2. Comparison of the values of ATO (total organic acidity) and the lead uptake (me.g-1) at pH 4, 5, 6 of C. glutamicum and R. arrhizus. Calculation of the occupied sites (% of ATO) (98).
Corynebacterium glutamicum Rhizopus arrhizus
pH
ATO
(me.g-1)
Pb uptake
(me.g-1)
Occupied
sites %
ATO
(me.g-1)
Pb uptake
(me.g-1)
Occupied
sites %
4 0.32 0.11 34 0.38 0.14 37
5 0.54 0.20 37 0.58 0.35 60
6 0.73 0.28 38 0.75 0.48 64
Table 3. pKa Values of Inorganic Acids and Acidic Groups in Biomolecules.
Inorganic Acid pKa Acidic Group in Biomolecules pKa
sulfuric acid (115) 1.9 sulfate (117) ~1.5
phosphoric acid (115) 2.1,
7.2
phosphate (116) 2
benzoic acid (115) 4.2 carboxyl (116) 3-5
acetic acid (115) 4.8 carboxyl (116) 3-5
ammonium (115) 9.2 amine (116) 8-10
phenol (115) 10.0 phenolic OH (116) 10
Table 4. Classification of metals and ligands according to the HSAB Theory (131, 137).Classification of Metals
Hard Soft IntermediateH+, Na+, Ca2+, Ni+, Zn2+, Fe3+,
U4+, Si4+, K+, ...Cu2+, Hg+, Pt2+, Hg2+, Ag+... Fe2+, Co2+, Ni2+, Pb2+...
Classification of LigandsHard Soft Intermediate
H2O, OH-, F-, CH3CO2-, PO4
3-,
CO32-, ROH, RO-, RNH2
...
CO, C6H6, CN-, I-, R2S, RS-, S2-
....Br-, NO2
-, C6H5NH2-, C5H5N...
Page 37 of 47
John Wiley & Sons
2t-S-1Ed-D-P
123456789101112131415161718192021222324252627282930313233343536373839404142434445464748495051525354555657585960

For Peer Review
Brunauer-Emmett-Teller (BET) [1938]:
)]/)(1(1)[( sCfCBfCsCfBQC
q−+−
=
Cs is the saturation constant of the solute;B is a constant relating to the energy of interaction with the surface;Q is the number of moles of solute adsorbed per unit weight of adsorbent in forming a complete monolayer on the surface;
Dubinin-Radushkevich (DR) [1947]:lnq = lnqm - B E2
B is a constant related to the sorption energyE is Polanyi potential
E = RT ln(1+ 1/Cf )
Radke-Prausnitz [1972]:
β+=ff bCaCq
111
Reddlich-Peterson (188):
nf
f
bC
aCq
+=
1
Combination:
)/1(
)/1(
1 nf
nfm
bC
Cbqq
+=
(Langmuir-Freundlich) (189)
Table 5. Some sorption isotherm relationships (188, 189).
Table 6. Acidic group content in selected Sargassum species in comparison with maximum cadmium uptake (30).
Seaweed strong (mmol g-1)
weak(mmol g-1)
qmax Cd (II)(mmol g-1)
Sargassum vulgare 0.5 1.5 0.79Sargassum fluitans 0.3 1.5 0.71Sargassum filipendula 0.3 1.6 0.66
Page 38 of 47
John Wiley & Sons
2t-S-1Ed-D-P
123456789101112131415161718192021222324252627282930313233343536373839404142434445464748495051525354555657585960

For Peer Review
Figure 1. Metal classification for biosorption applications (6).
TOXIC METALSSTRATEGIC METALSPRECIOUS METALSRADIONUCLIDES
HEAVY METALS REMOVAL/RECOVERY
Cr, Cu, Zn, Ni ….Hg, Pb, Cd,
Mn, Ge, In, Ir …
Au, Pt, Rb, …
Sr, Ce, Ra, (U, Th) ...
BIOSORPTION APPLICATIONS
METALS OF INTEREST
Figure 2. Major target industrial sectors (6).
METAL PLATINGACID MINE DRAINAGECOAL-FIRED POWER GENERATIONMETAL PROCESSING
POINT SOURCE IMPORTANT !
Growth Industry !Often Dispersed
Waste Recovery
BIOSORPTION APPLICATIONS
TARGET INDUSTRIES
Figure 3. Cell wall structure in Phaeophyta (179).
Figure 4. Constituent acids of alginic acid, where (M) is β-D-Mannuronic Acid and (G) is α-L-Guluronic Acid (49).
OH
COOH
H
OH
H
HO
H
OHHO
H OCOOH OH
HOOHHO H
HH
H H(M) (G)
Page 39 of 47
John Wiley & Sons
2t-S-1Ed-D-P
123456789101112131415161718192021222324252627282930313233343536373839404142434445464748495051525354555657585960

For Peer Review
Figure 5. Possible cadmium binding sites on polyuronic acids (70).
OCOOH
OH
OH
OH
OH O
OH O
OH
OOH
O
COO
O
COO
O
COO
OH
CdO
COO
O OH
Cd
OH
Figure 6. Fucoidan: Branched polysaccharide sulphate ester with L-fucose building blocks as the major component with predominantly α (1→ 2)-linkages (49).
O
OH
HCH3
H
O3SO
H
OH
O
O
OH
HCH3
H
H
O3SO
H
O
H
O
OH
HCH3
H
H
H
HHO
O
OH
HCH3
H
H
O3SO
HH
H
O
O
O
HCH3
H
O3SO
H
O
HO3SO
H
Page 40 of 47
John Wiley & Sons
2t-S-1Ed-D-P
123456789101112131415161718192021222324252627282930313233343536373839404142434445464748495051525354555657585960
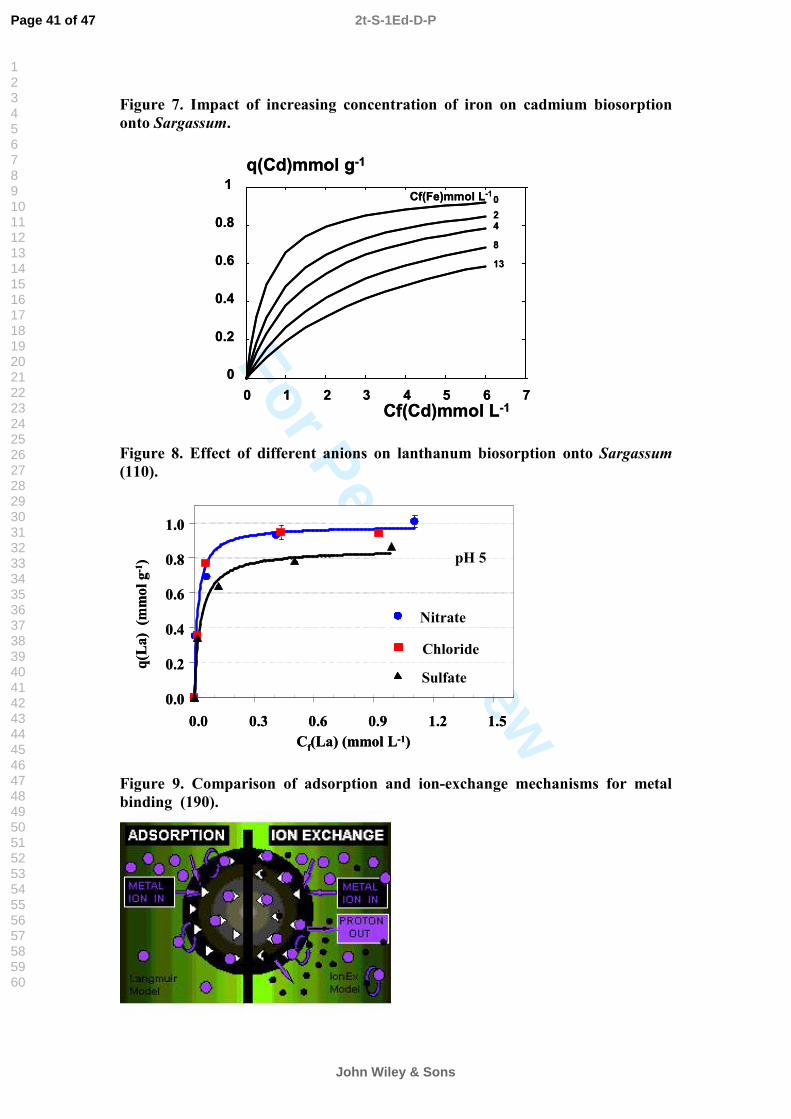
For Peer Review
Figure 7. Impact of increasing concentration of iron on cadmium biosorption onto Sargassum.
Figure 8. Effect of different anions on lanthanum biosorption onto Sargassum (110).
Figure 9. Comparison of adsorption and ion-exchange mechanisms for metal binding (190).
Cf(Cd)mmol L-1
q(Cd)mmol g-1
0
0.2
0.4
0.6
0.8
1
0 1 2 3 4 5 6 7
Cf(Fe)mmol L-1024
8
13
Cf(Cd)mmol L-1
q(Cd)mmol g-1
0
0.2
0.4
0.6
0.8
1
0 1 2 3 4 5 6 7
Cf(Fe)mmol L-1024
8
13
0.0
0.2
0.4
0.6
0.8
1.0
0.0 0.3 0.6 0.9 1.2 1.5Cf(La) (mmol L-1)
q(L
a)(m
mol
g-1)
Nitrate
Chloride
Sulfate
pH 5
0.0
0.2
0.4
0.6
0.8
1.0
0.0 0.3 0.6 0.9 1.2 1.5Cf(La) (mmol L-1)
q(L
a)(m
mol
g-1)
Nitrate
Chloride
Sulfate
pH 5
Page 41 of 47
John Wiley & Sons
2t-S-1Ed-D-P
123456789101112131415161718192021222324252627282930313233343536373839404142434445464748495051525354555657585960
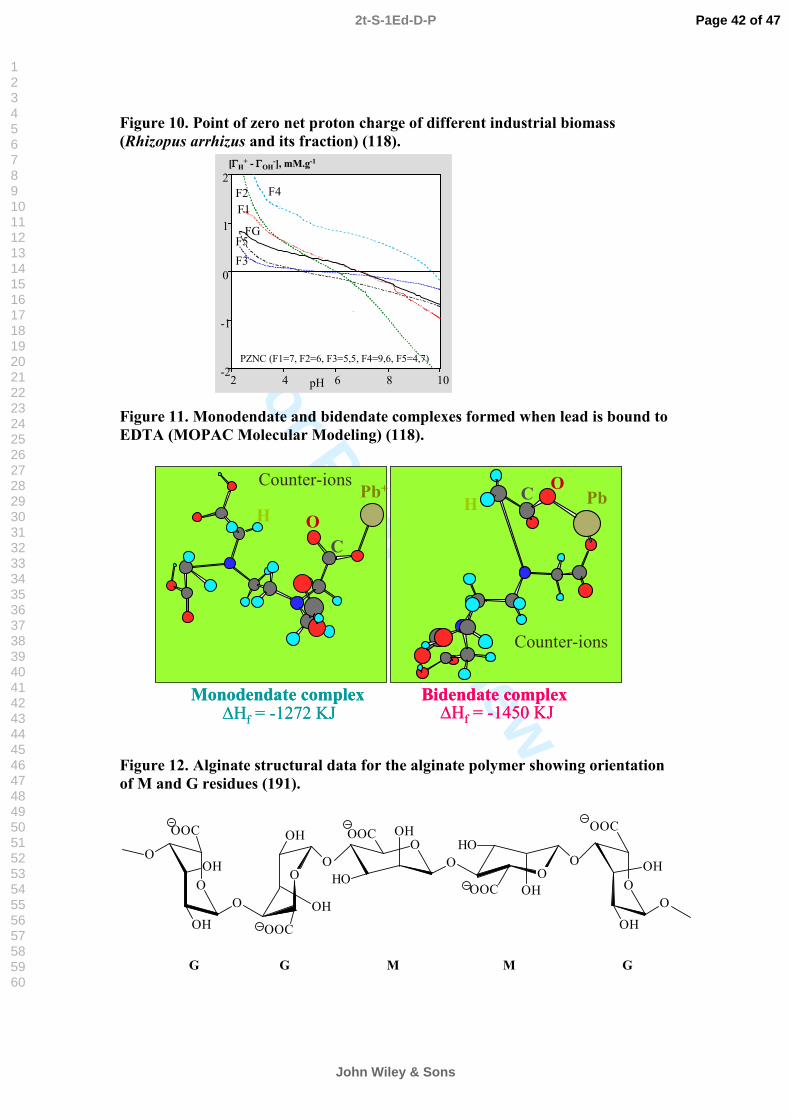
For Peer Review
Figure 10. Point of zero net proton charge of different industrial biomass (Rhizopus arrhizus and its fraction) (118).
Figure 11. Monodendate and bidendate complexes formed when lead is bound to EDTA (MOPAC Molecular Modeling) (118).
Figure 12. Alginate structural data for the alginate polymer showing orientation of M and G residues (191).
O
OOC
OH
O
O
OOC
O
OHO
OHO
OOC
OHO O
OOH
OH
OH
OH
OHHO
OO
G G M M G
OOC
OOC
2 4 6 8 10pH-2
-1
0
1
2
FG
F4
F3
F2F1
F5
[[ΓΓHH++ -- ΓΓOHOH
--], mM.g], mM.g--11
PZNC (F1=7, F2=6, F3=5,5, F4=9,6, F5=4,7)
Pb+ PbO
O
C
CH H
Monodendate complex Bidendate complex
Counter-ions
Counter-ions
∆Hf = -1272 KJ ∆Hf = -1450 KJ
Pb+ PbO
O
C
CH H
Monodendate complex Bidendate complex
Counter-ions
Counter-ions
∆Hf = -1272 KJ ∆Hf = -1450 KJ
Page 42 of 47
John Wiley & Sons
2t-S-1Ed-D-P
123456789101112131415161718192021222324252627282930313233343536373839404142434445464748495051525354555657585960
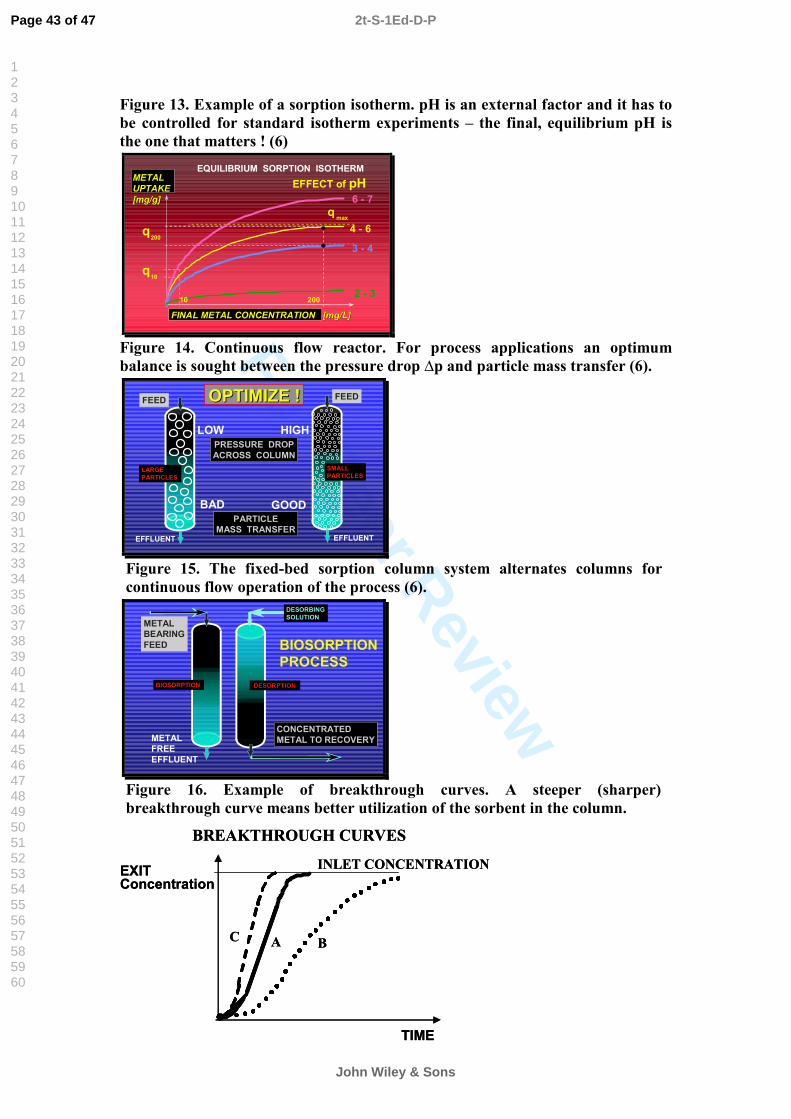
For Peer Review
Figure 13. Example of a sorption isotherm. pH is an external factor and it has to be controlled for standard isotherm experiments – the final, equilibrium pH is the one that matters ! (6)
METALMETALUPTAKEUPTAKE[mg/g][mg/g]
FINAL METAL CONCENTRATION [mg/L]FINAL METAL CONCENTRATION [mg/L]
q
q
200
200
10
EQUILIBRIUM SORPTION ISOTHERM
q
EFFECT of pH6 - 7
4 - 6
3 - 4
2 - 3
max
10
Figure 14. Continuous flow reactor. For process applications an optimum balance is sought between the pressure drop ∆p and particle mass transfer (6).
OPTIMIZE !OPTIMIZE !OPTIMIZE !
PARTICLEMASS TRANSFER
FEED
LARGEPARTICLES
EFFLUENT
FEED
SMALLPARTICLES
PRESSURE DROPACROSS COLUMN
GOODBAD
LOW HIGH
EFFLUENT
Figure 15. The fixed-bed sorption column system alternates columns for continuous flow operation of the process (6).
BIOSORPTIONPROCESS
CONCENTRATEDMETAL TO RECOVERY
DESORPTION
METALBEARINGFEED
BIOSORPTION
METALFREE EFFLUENT
DESORBING SOLUTION
Figure 16. Example of breakthrough curves. A steeper (sharper) breakthrough curve means better utilization of the sorbent in the column.
INLET CONCENTRATION
TIME
EXITConcentration
BREAKTHROUGH CURVES
AC B
INLET CONCENTRATION
TIME
EXITConcentration
BREAKTHROUGH CURVES
AC B
Page 43 of 47
John Wiley & Sons
2t-S-1Ed-D-P
123456789101112131415161718192021222324252627282930313233343536373839404142434445464748495051525354555657585960
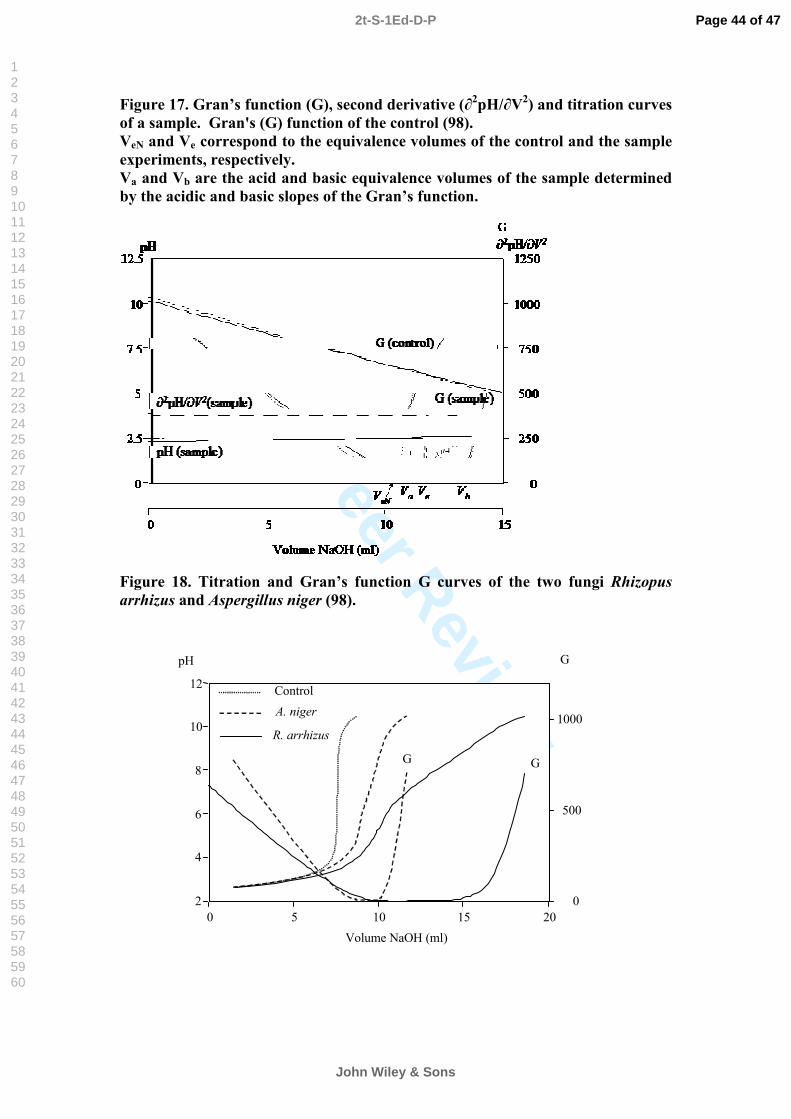
For Peer Review
Figure 17. Gran’s function (G), second derivative (∂2pH/∂V2) and titration curves of a sample. Gran's (G) function of the control (98). VeN and Ve correspond to the equivalence volumes of the control and the sample experiments, respectively. Va and Vb are the acid and basic equivalence volumes of the sample determined by the acidic and basic slopes of the Gran’s function.
Figure 18. Titration and Gran’s function G curves of the two fungi Rhizopus arrhizus and Aspergillus niger (98).
0
500
1000
G
2
4
6
8
10
12
pH
0 5 10 15 20Volume NaOH (ml)
A. niger
R. arrhizus
Control
G G
Page 44 of 47
John Wiley & Sons
2t-S-1Ed-D-P
123456789101112131415161718192021222324252627282930313233343536373839404142434445464748495051525354555657585960

For Peer Review
Figure 19. Potentiometric and conductimetric titration curves of three Sargassum species. Potentiometric titration: (•) S. fluitans, ( ) S. filipendula I, (▪)S. vulgare. Conductimetric titration: (○) S. fluitans, (∆) S. filipendula I, (□) S. vulgare (30).
Figure 20. Typical FTIR spectra obtained for raw and metal loaded Cystoseira baccata (63).
Page 45 of 47
John Wiley & Sons
2t-S-1Ed-D-P
123456789101112131415161718192021222324252627282930313233343536373839404142434445464748495051525354555657585960

For Peer Review
Figure 21. SEM Micrographs of (a) Raw (b) Cr (VI) loaded Sargassum sp. (Leaf). Magnification 2000X. Scale bar correspond to 20 µm (166).
Figure 22. Carbon 1s (a1 and a2) and oxygen 1s (b1 and b2) XPS binding profiles of raw and Cu (II)-loaded Sargassum sp. (123) where, a1 and b1 refer to the raw seaweed and a2 and b2 refer to the Cu (II)-loaded seaweed.
(a) (b)
(a1)
(a2)
(b1)
(b2)
Page 46 of 47
John Wiley & Sons
2t-S-1Ed-D-P
123456789101112131415161718192021222324252627282930313233343536373839404142434445464748495051525354555657585960
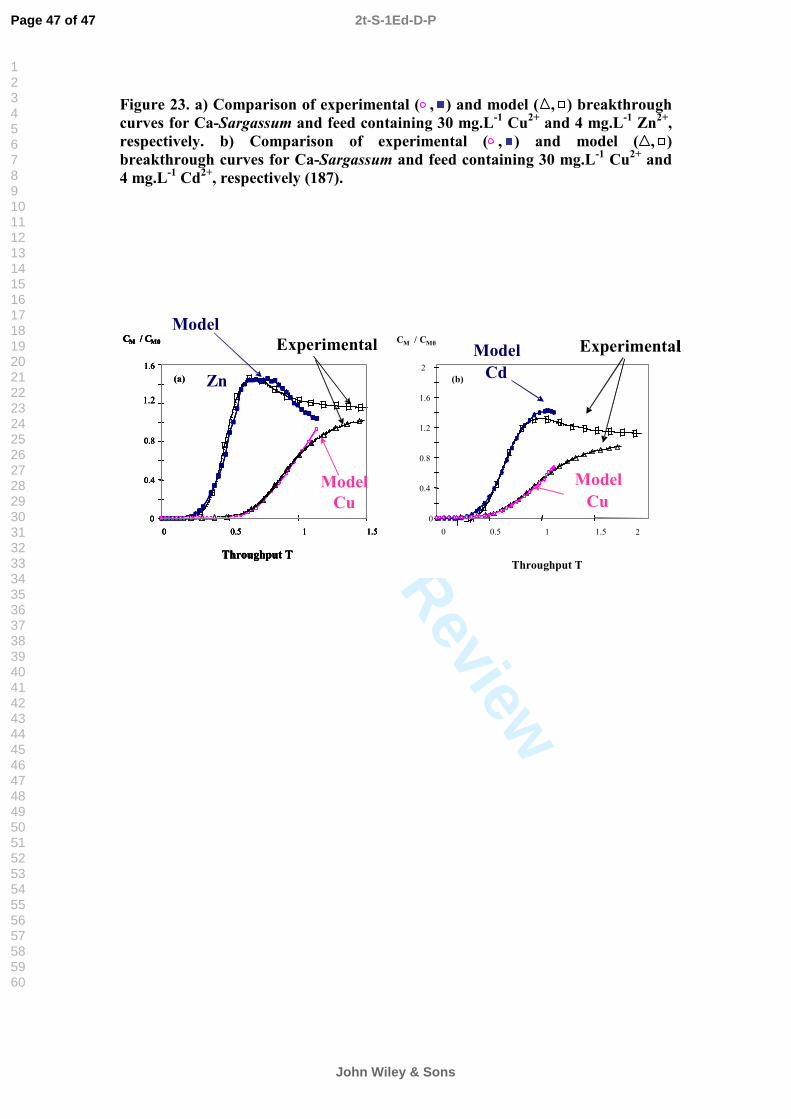
For Peer Review
Figure 23. a) Comparison of experimental ( , ) and model ( , ) breakthrough curves for Ca-Sargassum and feed containing 30 mg.L-1 Cu2+ and 4 mg.L-1 Zn2+,respectively. b) Comparison of experimental ( , ) and model ( , ) breakthrough curves for Ca-Sargassum and feed containing 30 mg.L-1 Cu2+ and 4 mg.L-1 Cd2+, respectively (187).
0
0.4
0.8
1.2
1.6
2
0 0.5 1 1.5
Throughput T
CM / CM0
2
(3)
ModelCu
ModelCd
Experimental
0
0.4
0.8
1.2
1.6
2
0 0.5 1 1.5
Throughput T
CM / CM0
2
(b)
ModelCu
ModelCd
Experimental
0
0.4
0.8
1.2
1.6
2
0 0.5 1 1.5
Throughput T
C
0
0.4
0.8
1.2
1.6
2
0 0.5 1 1.5
Throughput T
CM / CM0
2
(3)
ModelCu
ModelCd
ExperimentalM / CM0
2
(3)
ModelCu
ModelCd
Experimental
0
0.4
0.8
1.2
1.6
2
0 0.5 1 1.5
Throughput T
CM / CM0
2
(b)
ModelCu
ModelCd
Experimental
0
0.4
0.8
1.6
0 0.5 1 1.5
Throughput T
CM / CM0
1.2
(a)
0
0.4
0.8
1.6
0 0.5 1 1.5
Throughput T
CM / CM0
1.2
Model
Zn
Experimental
ModelCu
0
0.4
0.8
1.6
0 0.5 1 1.5
Throughput T
CM / CM0
0
0.4
0.8
1.6
0 0.5 1 1.5
Throughput T
CM / CM0
1.2
(a)
1.2
(a)
0
0.4
0.8
1.6
0 0.5 1 1.5
Throughput T
CM / CM0
0
0.4
0.8
1.6
0 0.5 1 1.5
Throughput T
CM / CM0
1.2
Model
Zn
Experimental
ModelCu
Page 47 of 47
John Wiley & Sons
2t-S-1Ed-D-P
123456789101112131415161718192021222324252627282930313233343536373839404142434445464748495051525354555657585960

![Pomelo Peel: Agricultural Waste for Biosorption of …€¦ · · 2017-05-05controlling parameter in the biosorption process [19]. Most research conducted on heavy metal biosorption](https://img.pdfslide.net/doc/110x75/5b06dd247f8b9a79538d0e79/pomelo-peel-agricultural-waste-for-biosorption-of-parameter-in-the-biosorption.jpg)