Embed Size (px)
Citation preview
GrainCorp Limited
Level 26, 175 Liverpool Street
Sydney NSW 2000
PO Box A268
Sydney South NSW 1235
T 02 9325 9100
F 02 9325 9180
ABN 60 057 186 035 graincorp.com.au
14 November 2013
The Manager Company Announcements Office
ASX Limited 20 Bridge Street SYDNEY NSW 2000
GRAINCORP LIMITED: GNC
INVESTOR PRESENTATION FOR THE
FINANCIAL YEAR ENDED 30 SEPTEMBER 2013
Please find attached the Investor Presentation relating to the financial year ended 30 September 2013.
Yours sincerely,
ANDREW HORNE
Company Secretary
For
per
sona
l use
onl
y

14 November 2013
FY13 Results and Strategy UpdateF
or p
erso
nal u
se o
nly
Disclaimer
This presentation includes both information that is historical in character and information that consists of forward looking statements. Forward looking statements are not based on historical facts, but are based on current expectations of future results or events. The forward looking statements are subject to risks, stakeholder engagement, uncertainties and assumptions which could cause actual results, timing, or events to differ materially from the expectations described in such forward looking statements. Those risks and uncertainties include factors and risks specific to the industry in which GrainCorp operates, any applicable legal requirements, as well as matters such as general economic conditions.
While GrainCorp believes that the expectations reflected in the forward looking statements in this presentation are reasonable, neither GrainCorp nor its directors or any other person named in the presentation can assure you that such expectations will prove to be correct or that implied results will be achieved. These forward looking statements do not constitute any representation as to future performance and should not be relied upon as financial advice of any nature. Any forward looking statement contained in this document is qualified by this cautionary statement.
2
For
per
sona
l use
onl
y
Agenda
3
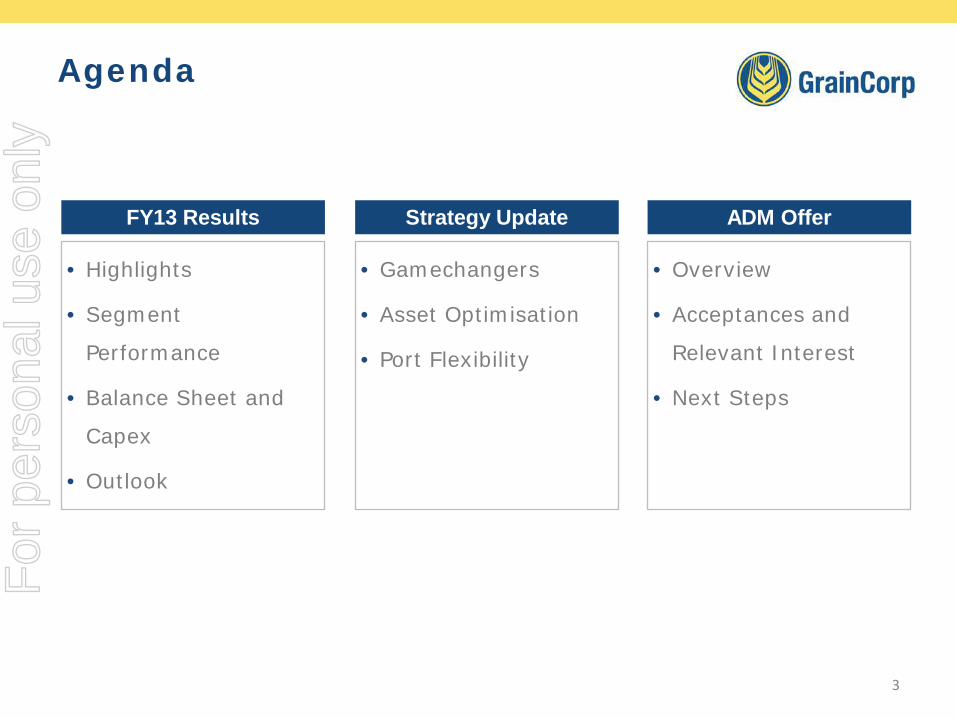
FY13 Results
• Highlights
• Segment
Performance
• Balance Sheet and
Capex
• Outlook
• Gamechangers
• Asset Optimisation
• Port Flexibility
• Overview
• Acceptances and
Relevant Interest
• Next Steps
Strategy Update ADM Offer
For
per
sona
l use
onl
y

Strong earnings due to strong grain volumes and diversification• Earnings of $395M EBITDA(1) (down 4%) and $175M NPAT(2) (down 15%) from strong grain
volumes and successful diversification.
• Statutory NPAT of $141M after significant items(3).
• Storage & Logistics – strong performance from significant grain export program and above
average carry-in.
• Marketing – sustained performance from international presence with sales reflecting eastern
Australian grain production.
• Malt – consistent levels of high capacity utilisation with margins in line with expectations.
• Oils – performing ahead of expectations including integration milestones and FY13 synergy target
achieved.
• $110M strategic growth initiatives – on track to deliver Gamechangers and Asset Optimisation
initiatives by the end of FY16. Long term agreements introduced for ports, limited progress on
Ports Code of Conduct.
• Fully franked final dividend totalling $0.20 per share(4).
1. EBITDA is a non IFRS measure representing earnings before interest, tax, depreciation and amortisation, before significant items.2. Net profit after tax and before significant items. 3. Significant items of $34M (after tax) includes costs relating to acquisitions (eg stamp duty), Oils integration and ADM’s proposed
takeover. See appendix for further detail.4. The final dividend totalling $0.20 is included in the Permitted Dividends totalling $1.00 under the ADM Offer. The balance of the
Permitted Dividends is $0.55. 4
For
per
sona
l use
onl
y

82 112173
235 22779100
177
179 168
0
100
200
300
400
500
FY09 FY10 FY11 FY12 FY13
Fiscal 1H Fiscal 2H
3253
88122 10931
28
84
8366
0
50
100
150
200
250
FY09 FY10 FY11 FY12 FY13
Fiscal 1H Fiscal 2H
Earnings profile delivering on corporate objectives
• Improving shareholder returns Delivered an average return on equity of 12.5% over the last three years(2)
• Managing variability creation and development of GrainCorp Malt and GrainCorp Oils • Delivering growth growth across all segments organically and acquisitively
EBITDA 160 212 350 414 395 NPAT 63 80 172 205 175
EBITDA(1) NPAT(1)
5
$M $M
1. Before significant items. EBITDA and NPAT reflect inclusion of Malt from FY10 and Oils from FY13. 2. To 30 September 2013.
For
per
sona
l use
onl
y
7
25 30 35 40
5
25
30
5
0
20
40
60
80
FY09 FY10 FY11 FY12 FY13
Ordinary DPS Special DPS
$1.00
$0.55
$0.25
$0.20
$0.00
$0.25
$0.50
$0.75
$1.00
Permitted Dividends (Total)
HY13 Dividend FY13 Dividend Permitted Dividends (Balance)
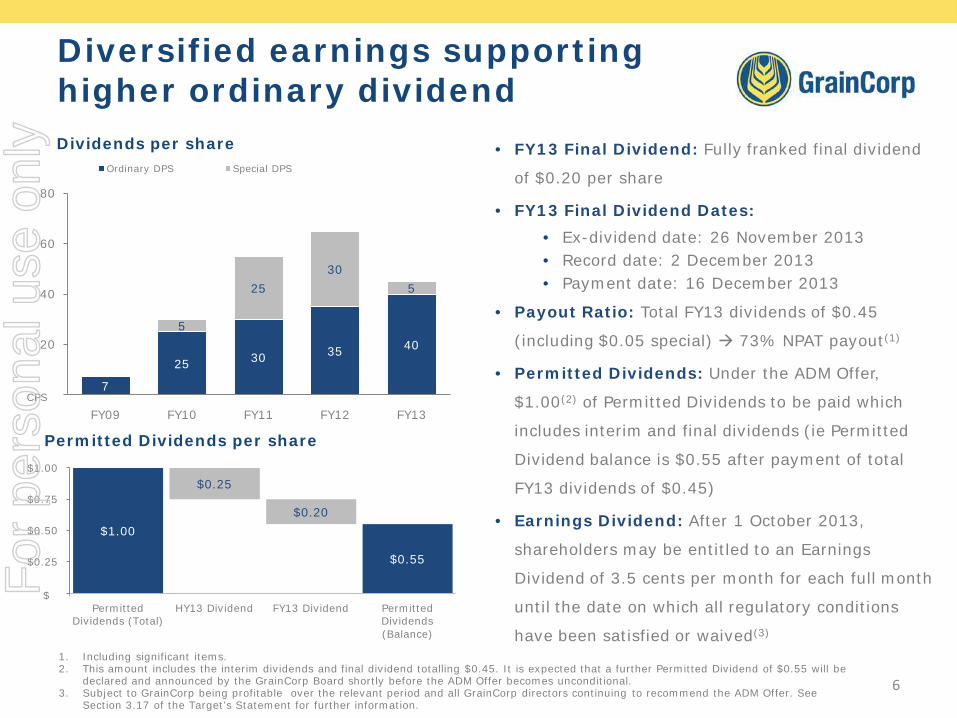
Diversified earnings supporting higher ordinary dividend
• FY13 Final Dividend: Fully franked final dividend
of $0.20 per share
• FY13 Final Dividend Dates:
• Ex-dividend date: 26 November 2013• Record date: 2 December 2013• Payment date: 16 December 2013
• Payout Ratio: Total FY13 dividends of $0.45
(including $0.05 special) 73% NPAT payout(1)
• Permitted Dividends: Under the ADM Offer,
$1.00(2) of Permitted Dividends to be paid which
includes interim and final dividends (ie Permitted
Dividend balance is $0.55 after payment of total
FY13 dividends of $0.45)
• Earnings Dividend: After 1 October 2013,
shareholders may be entitled to an Earnings
Dividend of 3.5 cents per month for each full month
until the date on which all regulatory conditions
have been satisfied or waived(3)
1. Including significant items. 2. This amount includes the interim dividends and final dividend totalling $0.45. It is expected that a further Permitted Dividend of $0.55 will be
declared and announced by the GrainCorp Board shortly before the ADM Offer becomes unconditional. 3. Subject to GrainCorp being profitable over the relevant period and all GrainCorp directors continuing to recommend the ADM Offer. See
Section 3.17 of the Target’s Statement for further information.
Dividends per share
6
CPS
$
Permitted Dividends per share
For
per
sona
l use
onl
y

205
175
71
9
16
1
28
875
2
25
FY12 NPATStorage & LogisticsMarketing Malt Oils Allied … Corporate & … D&A Net Interest Tax FY13 NPAT
Diversified business and more ‘normal’ receivals
FY12 NPAT
($M)
Storage & Logistics
Marketing Malt(2) Oils Allied Mills(3)
Corporate D&A Net Interest
Tax FY13NPAT
FY13 179 54 101 75 12 (26) (119) (39) (62) 175
FY12 250 63 117 - 10 (26) (91) (31) (87) 205
FY12 to FY13 Earnings Bridge(1) - $M
EBITDA
Lower receivals, significant
grain export program and
above average carry-in
Strong capacity
utilisation, lower barley procurement
gains
Oils inclusion and recent
capex program
7
1. Before significant items – see appendix for further information.2. Includes Port of Vancouver compensation receipts of $4.1M in FY13 ($4.8M in FY12).3. 60% share of NPAT.
Higher debt post Oils
acquisition
More diversified
business with inclusion of
Oils
Sustained performance,
sales reflecting
lower grain production
levels
Lower earnings
Benefit of strategic
acquisitions
For
per
sona
l use
onl
y

Safety & Health, Environment & People
81. Lost Time Injury Frequency Rate calculated as the number of Lost Time Injuries per million hours worked.
Safety & Health
• Achieved a 10.2% reduction in
lost time injury frequency
rate(1), moving from 11.9 to
10.7
• Increased investment in plant
and equipment including
rectification of fixed and mobile
equipment and ladders, dust
prevention and changes to
prevent trips and falls
• Enhanced systems through
commitment to invest in a
Health & Safety Quality
incident and Reporting system
• Reduced hexane emissions in
vent air from the Numurkah
solvent extraction plant
through improvements in the
solvent recovery system,
decreasing overall hexane
usage
• Reduction of LPG usage due to
improvements in the process
steam system at the Millicent
oilseed crushing plant
• Sustained engagement across
the business at 60%
• Continued high engagement
score for the GrainCorp
Leadership Group
• A continued investment in the
development of senior leaders
and talent
• Implemented a global
“Emerging Leaders” program
• Over $400,000 donated to
community projects through
GrainCorp Community Fund
Environment People
2013
Ach
ieve
men
ts
For
per
sona
l use
onl
y
Segment PerformanceF
or p
erso
nal u
se o
nly

Portfolio of grain businesses capture value along the grain chain
$MRevenue EBITDA(1)
FY13 FY12 FY13 FY12
Storage & Logistics 655 805 179 250
Marketing(2) 2,169 1,891 54 63
Malt(3) 977 945 101 117
Oils(4) 962 - 75 -
Allied Mills(5) - - 12 10
Corporate Costs - - (26) (26)
Eliminations and other (301) (312) - -
Total 4,462 3,329 395 414
1. Before significant items – see appendix for further detail.2. Marketing EBITDA.3. EBITDA includes Port of Vancouver compensation receipts of $4.1M in FY13 ($4.8M in FY12).4. Oils FY12 Revenue of $1,115M and EBITDA of $63M.5. Allied Mills 60% share of NPAT. 10
For
per
sona
l use
onl
y

13.9
24.1
28.5
23.8
0
5
10
15
20
25
30
FY10 FY11 FY12 FY13
Storage & Logistics Throughput(4)
Storage & Logistics – strong earnings with significant exports and carry-in
$M FY13 FY12
Revenue 655 805
EBITDA 179 250
EBIT 128 197
Capital Expenditure 60 64
• Strong earnings from significant grain export
program and higher than average carry-in:
• Carry-in: higher than average at 4.3mmt(1)
(6.0mmt in prior year)
• Country receivals: 10.4mmt (including 0.7mmt
summer crop); ~55% share of production(2)
• Exports: above normal grain exports(3) of 8.3mmt
(10.6mmt in prior year) and non-grain exports of
1.9mmt (1.8mmt in prior year)
• Throughput: 17% lower at 23.8mmt which
compares to 17%(2) lower grain production in
eastern Australia
• Operational benefit from Gamechanger initiatives
and improved customer service (stackers, active
stock management and rail optimisation)
• 3.8mmt of export capacity booked under 3 year
long term agreements (FY14 – FY16), including
1.9mmt from third party exporters
1. mmt = million metric tonnes. 2. Eastern Australia’s wheat, barley and canola and sorghum production estimates, using the average of Australian Crop Forecasters’
November 2013 report of 18.2mmt and ABARES’ September 2013 report of 18.4mmt. 3. Grain exports includes bulk and containers. 4. Average of country grain inload (carry-in + receivals) and outload (carry-in + receivals – carry-out) + ports grain and non-grain.
exports handled. See appendix for further detail.
11
mmtFor
per
sona
l use
onl
y

2.1 2.22.8 2.5
2.0
1.5 1.1
2.74.4
4.1
0
1
2
3
4
5
6
7
FY09 FY10 FY11 FY12 FY13
Marketing Volumes(1)
Domestic sales mmt (LHS)
International sales mmt (LHS)
Marketing – sustained performance
$M FY13 FY12
Revenue 2,169 1,891
EBITDA 54 63
Interest expense(2) (17) (22)
PBTDA(2) 37 41
Marketing inventory 151 312
1. Delivered tonnes including bulk and container sales, Pools and UK’s Saxon Agriculture.2. Marketing’s grain inventory predominantly funded via separate short-term debt facilities. Interest expense treated as part of cost of goods
sold. Marketing’s performance measured as PBTDA .
• Earnings reflective of 17% lower
eastern Australian grain production
volumes
• 6.1mmt delivered sales(1)
• 2.0mmt domestic, 4.1mmt export and
international
• ~50% of marketed grain acquired from
growers and ~85% sold to end users
• Increasing presence in Western
Australia and South Australia
• Marketing inventory of $151M(2)
• Global trading and risk management
platform successfully deployed in
Australia in August with Germany and
Canada on track for 1H14
12
mmt
3.6
6.1
6.9
5.5
3.3
For
per
sona
l use
onl
y

1.07 1.09
1.32 1.28
0.00
0.20
0.40
0.60
0.80
1.00
1.20
1.40
FY10 FY11 FY12 FY13
Malt Sales
Malt – continued high capacity utilisation
$M FY13 FY12
Revenue 977 945
EBITDA(1) 101 117
EBIT(1) 62 81
Capital Expenditure 43 38
1. Includes Port of Vancouver compensation receipts of $4.1M in FY13 ($4.8M in FY12).
• Sales of 1.28mmt
• Earnings reflective of continued high
capacity utilisation above 90% with
margins in line with expectations
• Effective margin management but lower
barley procurement gains than FY12
• Continued growth from malt portfolio
position (eg distillers, craft)
• Launch of Brewers Select in UK access
to growing UK craft beer market
• Progress on a number of operational
excellence initiatives with sustainability
benefits
13
mmtFor
per
sona
l use
onl
y

0.50 0.52 0.500.54 0.55
0.20
0.25
0.30
0.35
0.40
0.45
0.50
0.55
0.60
FY09 FY10 FY11 FY12 FY13
Crushing & Refining Sales(2)
Oils – strong earnings across crushing, refining and terminals
$M FY13 FY12(1)
Revenue 962 1,115
EBITDA 75 63
EBIT 50 42
Capital Expenditure 25 19
1. FY12 figures for Gardner Smith and Integro under different ownership. 2. Includes sales volumes for Riverland (oil and meal) for each 12 months ended 31 March and Integro for each 12 months ended
30 June. FY13 volumes for Riverland and Integro for year ended 30 September 2013.
• Crushing & Refining: consistent
sales of 0.55mmt
• Liquid Terminals: continued high
capacity utilisation of ~230K m3 of
storage and progress on asset
optimisation initiatives
• Complementary businesses:
performing in line with expectations
and a strong performance in
commodity management
• Integration : Achieved FY13
synergies target of ~$4.0M (pre-tax),
on track to deliver $7.0M of synergies
p.a. ongoing
14
mmt
For
per
sona
l use
onl
y

Allied Mills – improved earnings and capacity replacement on track
$M (60%) JV Share FY13 FY12
EBITDA 27 25
Equity profit(1) 12 10
Shareholder loan interest received 1.0 1.3
Net Asset Value(2) 170 159
1. Allied Mills 60% share of NPAT. Excludes shareholder loan interest received. FY12 equity profit before significant items.2. FY13 includes 60% of Shareholders Equity ($151M) and Shareholder Loan ($19M).
• Improved earnings from value add
product initiatives (eg frozen bakery
products)
• Completed new Tennyson mill
expansion in Queensland in mid-2013
• Acquired Tullamarine bakery facility in
Melbourne to support value add
product strategy
• Acquired Tamworth starch / food
ingredients facility in New South
Wales
15
$M
129 136 144159 170
50
100
150
200
FY09 FY10 FY11 FY12 FY13
60% Net Asset Value
For
per
sona
l use
onl
y

Balance Sheet and CapexF
or p
erso
nal u
se o
nly

Strong and flexible balance sheet
1. Core Debt = Total Debt less Cash less Marketing and Oils grain and oilseed inventory. 2. Core Gearing = Core Debt / (Core Debt plus Equity).3. FY12 Pro forma Core Debt / EBITDA includes Oils acquisition debt and FY12 EBITDA as detailed in the ASX Announcement dated 28 August 2012.4. HY13 EBITDA based on last twelve months (“LTM”) as at Mar-13. Includes Oils LTM. 17
278 342 340
565 558 595
132
79 71
(312) (256) (350)
(254) (222) (255)
• FY13 Core Debt(1) of $411M
• Flexible balance sheet → FY13 Core
Gearing of 19% (in line with
strategic target of <25%), debt
facilities matching with asset life
• Working capital levels ~$50M higher
due to higher barley price increasing
Malt working capital requirements
and timing of shipping program
FY11 HY12 FY12FY12Pro
forma(3)HY13(4) FY13
9 218 16 320 415 411 Core Debt(1)
1% 13% 1% 16% 20% 19% Core Gearing(2)
0.05x 0.53x 0.04x 0.67x 0.99x 1.04x Core Debt / EBITDA
Core Debt – $M
Schill Malz acquisition
26
9
43
Creation of GrainCorp Oils
Short-termdebt less Marketing and Oils inventories
Long-term debt
Cash
For
per
sona
l use
onl
y

Commodities inventory funded with specific commodity inventory facilities
1. Commodities inventory excludes Malt barley and malt inventory held for processing activities. Variance between commodities inventory and short-term debt reconciles with “Short-term debt less Marketing and Oils inventories” on prior slide. 18
Commodities inventory(1) – $MMarketing and Oilseed funding strategy
• Marketing’s grain trading activities and
Oil’s oilseed and tallow positions are
predominantly funded with specific short
term commodity inventory debt facilities:
• Match debt with asset life
• Fluctuates with seasonal grain
purchases and underlying soft
commodity prices
Treatment
• Marketing’s performance measured as
PBTDA → interest treated as part of cost
of goods sold
• Commodity inventory funding recognised
as Operating Cash Flow → match funding
purpose
Supplemented short term debt with cash
85
180 188
528
322
387
312
498
168
89
218
56
572
365
519
338
577
238
FY09 HY10 FY10 HY11 FY11 HY12 FY12 HY13 FY13
Commodities inventory Short-term debt
For
per
sona
l use
onl
y

4056 61
73
952
1617
18
24
FY09 FY10 FY11 FY12 FY13
Depreciation
Amortisation
29
53 5949
703
5363
63
71
FY09 FY10 FY11 FY12 FY13
Stay-in-business
Growth
Capex supporting safety, network efficiencies and strategic initiatives
• Stay-in-business capex has increased from FY12 due to inclusion of Oils
• Growth capex reflective of investment to progress growth initiatives
• Depreciation & amortisation higher in FY13 due to inclusion of Oils and
recent capex program
19
32
106
122112
141
42
7278
91
119
Capex(1) – $M Depreciation & Amortisation – $M
1. Excluding acquisitions.
For
per
sona
l use
onl
y

FY14 OutlookF
or p
erso
nal u
se o
nly

Grains outlook – lower volumes, lower margins
1. Eastern Australia’s wheat, barley, canola and sorghum production estimates, using the Australian Crop Forecasters’ November 2013 report (data as at 9 October 2013). Updated production estimates expected to be issued in December by Australian Crop Forecasters and ABARES.
2. Eastern Australia’s wheat, barley, canola and sorghum production estimates, based on average of Australian Crop Forecasters’ November 2013 report of 18.2mmt and ABARES’ September 2013 Crop Report of 18.4mmt.
3. YTD reflects Year-To-Date as at end 12 November 2013.4. Wheat, barley, canola and sorghum exported as at end 12 November 2013.5. Wheat, barley, canola and sorghum shipping stem bookings as at 12 November. Reflects Year-To-Go bookings to 30 September 2014.
21
Market fundamentals
• Most recent Eastern Australian crop production estimate of 17.4mmt(1) (18.3mmt(2) in prior year)
• Crop profile weighted to southern NSW and Victoria given unfavourable weather conditions during winter and spring in Queensland and northern NSW
• Since the most recent estimate, unfavourable spring frosts in NSW and parts of Victoria
• Queensland and northern NSW sorghum crop dependent on summer rains
• Strong domestic demand with minimal exports in northern regions contrasting to likely exportable surplus in southern regions
• Lower than average carry-in of 2.3mmt (4.3mmt in FY13; 6.0mmt FY12)
• Given lower production and carry-in, country receivals and exports likely to be below average
• 2.6mmt country receivals YTD(3)
• 0.1mmt bulk grain elevations YTD(4)
• 5.4mmt booked on the shipping stem(5)
including 3.8mmt under LTAs predominantly in Port Kembla and Victorian zones
• Margin impact likely to be exacerbated given crop skew to geographies where margins are lower and competition greater (ie southern NSW and Victoria)
GrainCorp FY14 outlook
Sto
rag
e &
Lo
gis
tics
Mark
eti
ng • Continuing strong international grain demand
• Lower eastern Australia production volumes
• Increasing international presence
• Volumes likely to reflect lower than average eastern Australian crop
• Domestic and export sale opportunities targeted in each core international regionF
or p
erso
nal u
se o
nly
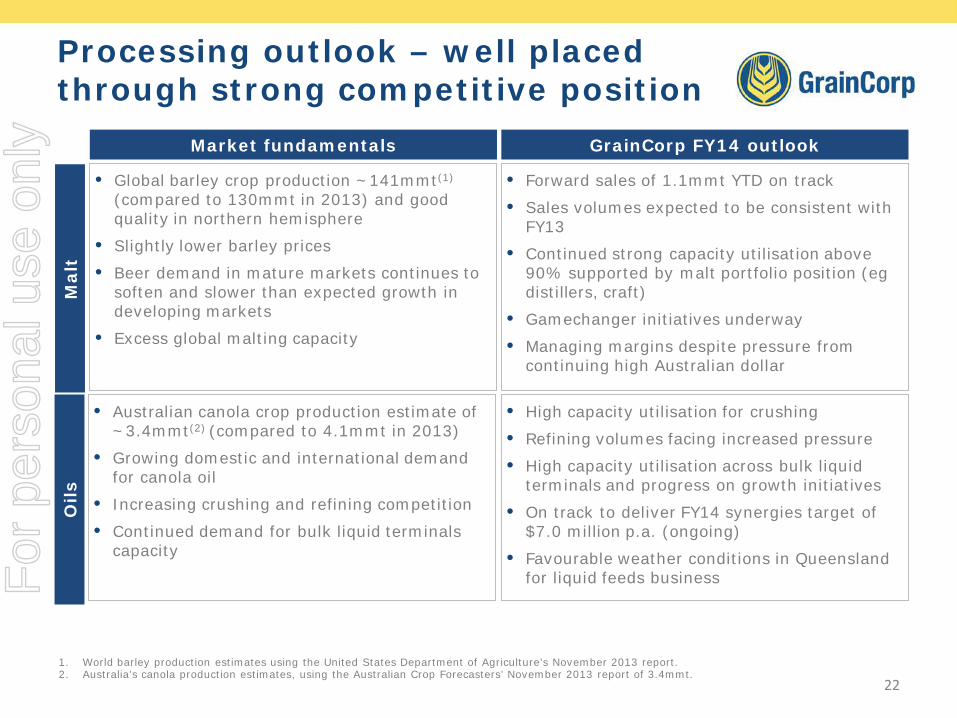
Processing outlook – well placed through strong competitive position
1. World barley production estimates using the United States Department of Agriculture’s November 2013 report. 2. Australia’s canola production estimates, using the Australian Crop Forecasters’ November 2013 report of 3.4mmt.
22
Market fundamentals
• Global barley crop production ~141mmt(1)
(compared to 130mmt in 2013) and good quality in northern hemisphere
• Slightly lower barley prices
• Beer demand in mature markets continues to soften and slower than expected growth in developing markets
• Excess global malting capacity
• Forward sales of 1.1mmt YTD on track
• Sales volumes expected to be consistent with FY13
• Continued strong capacity utilisation above 90% supported by malt portfolio position (egdistillers, craft)
• Gamechanger initiatives underway
• Managing margins despite pressure from continuing high Australian dollar
GrainCorp FY14 outlook
Malt
Oils
• Australian canola crop production estimate of ~3.4mmt(2) (compared to 4.1mmt in 2013)
• Growing domestic and international demand for canola oil
• Increasing crushing and refining competition
• Continued demand for bulk liquid terminals capacity
• High capacity utilisation for crushing
• Refining volumes facing increased pressure
• High capacity utilisation across bulk liquid terminals and progress on growth initiatives
• On track to deliver FY14 synergies target of $7.0 million p.a. (ongoing)
• Favourable weather conditions in Queensland for liquid feeds businessF
or p
erso
nal u
se o
nly
Strategy UpdateF
or p
erso
nal u
se o
nly

Earnings growth initiatives targeting ~$110M EBITDA by FY16
Gamechangers Asset Optimisation
~$45M EBITDA~$70M capex(1)
~$45M EBITDA~$180M capex
~$20M EBITDAminimal capex
Storage & Logistics
Marketing
Malt
Oils Synergies & Optimisation
Ports & Terminals Growth & Efficiencies
3 Year Port Protocol
Ports Code of Conduct
Port Flexibility
Continuous Improvement
Strong industry fundamentals will drive additional earnings growth
1. Excludes ~$20M capex spent in FY12 on Gamechangers.24
FY13 Progress
~$12M EBITDA~$40M capex
For
per
sona
l use
onl
y

Earnings growth initiatives and capex requirements
Asset Optimisation
Port Flexibility
~25 ~15 ~30 ~70(1) ~115 ~65 - ~250(1)
TotalGamechangers(1)
Storage &Logistics
Marketing Malt TotalGame-
changers
Oilsoptimisation
Port & Countryoptimisation
Portflexibility
CumulativeTotal
Growth capex
Oils
Malt
Marketing(2)
1. Excludes ~$20M capex spent in FY12 on Gamechangers.2. Marketing represents profit before tax, depreciation and amortisation.
Storage & Logistics
25
110
Incremental underlying EBITDA by FY16 and Capex from FY13 to FY16 ($M)
20
20
25
4514
12
20
For
per
sona
l use
onl
y
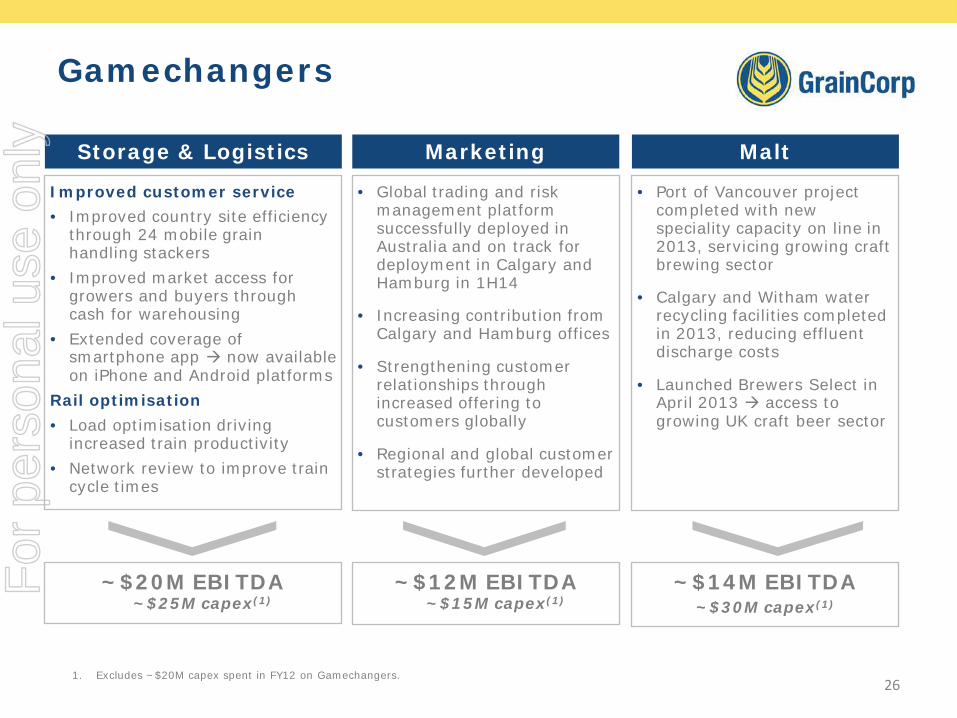
Gamechangers
1. Excludes ~$20M capex spent in FY12 on Gamechangers.26
Storage & Logistics
Improved customer service
• Improved country site efficiency through 24 mobile grain handling stackers
• Improved market access for growers and buyers through cash for warehousing
• Extended coverage of smartphone app now available on iPhone and Android platforms
Rail optimisation
• Load optimisation driving increased train productivity
• Network review to improve train cycle times
MaltMarketing
• Global trading and risk management platform successfully deployed in Australia and on track for deployment in Calgary and Hamburg in 1H14
• Increasing contribution from Calgary and Hamburg offices
• Strengthening customer relationships through increased offering to customers globally
• Regional and global customer strategies further developed
• Port of Vancouver project completed with new speciality capacity on line in 2013, servicing growing craft brewing sector
• Calgary and Witham water recycling facilities completed in 2013, reducing effluent discharge costs
• Launched Brewers Select in April 2013 access to growing UK craft beer sector
~$20M EBITDA~$25M capex(1)
~$12M EBITDA~$15M capex(1)
~$14M EBITDA~$30M capex(1)
For
per
sona
l use
onl
y

Asset Optimisation & Port Flexibility
27
Oils
Capture Synergies
• Achieved FY13 synergies target of $4.0 million
• On track to deliver synergies of $7M in p.a. (ongoing) in FY14
• FY13 integration milestones achieved including corporate office co-location and IT and systems changeover
Strengthen and optimise capability
• Progressing optimisation of GrainCorp Oils’ capacity
Port FlexibilityPorts & Country
Bulk liquid terminals opportunities
• Capacity expansion at Fremantle development underway
• Imported fuels opportunity at Pinkenba development approval submitted
• Investigating collaboration opportunities between S&L and Liquid Terminals
Continuous improvement
• Rollout of process improvement plan in grain port terminals
• Process improvements in Country & Logistics under assessment
3 Year Port Protocol
• New port protocol for bulk export grain agreed in November 2012
• 3 year long term agreements for grain exporters introduced in 2013
• 3.8mmt p.a. under LTAs confirmed from FY14 to FY16
Ports Code of Conduct
• Industry in consultation with Federal Government
• Limited progress to date
~$25M EBITDA~$115M capex
~$20M EBITDA~$65M capex
~$20M EBITDAminimal capex
For
per
sona
l use
onl
y

Recommended OfferF
or p
erso
nal u
se o
nly
Recommended offer
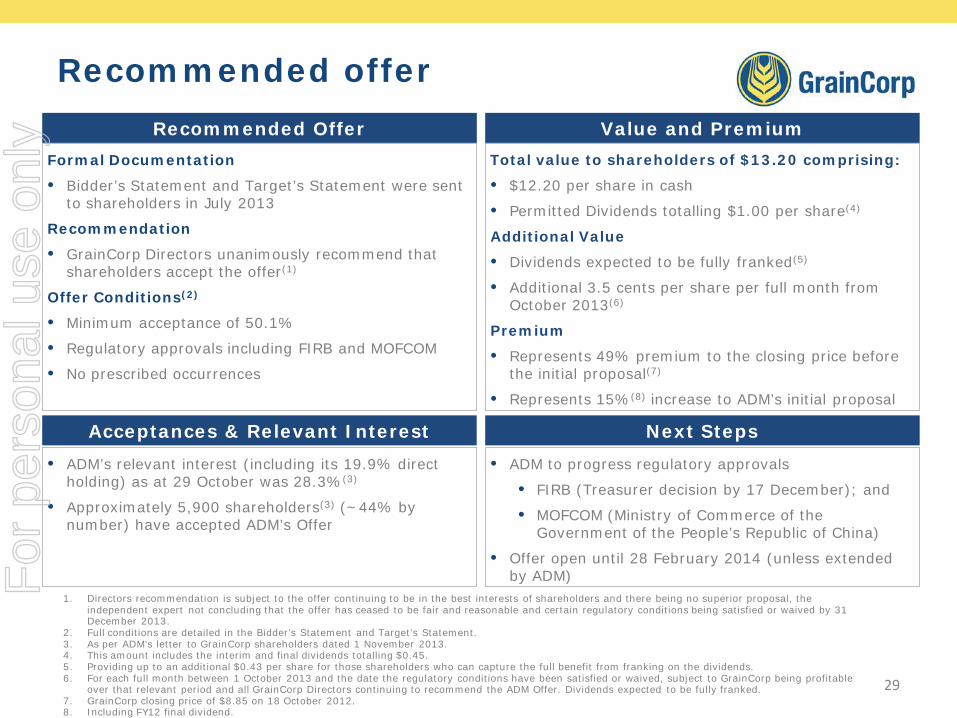
1. Directors recommendation is subject to the offer continuing to be in the best interests of shareholders and there being no superior proposal, the independent expert not concluding that the offer has ceased to be fair and reasonable and certain regulatory conditions being satisfied or waived by 31 December 2013.
2. Full conditions are detailed in the Bidder’s Statement and Target’s Statement.3. As per ADM’s letter to GrainCorp shareholders dated 1 November 2013.4. This amount includes the interim and final dividends totalling $0.45.5. Providing up to an additional $0.43 per share for those shareholders who can capture the full benefit from franking on the dividends.6. For each full month between 1 October 2013 and the date the regulatory conditions have been satisfied or waived, subject to GrainCorp being profitable
over that relevant period and all GrainCorp Directors continuing to recommend the ADM Offer. Dividends expected to be fully franked. 7. GrainCorp closing price of $8.85 on 18 October 2012. 8. Including FY12 final dividend.
29
Recommended Offer
Formal Documentation
• Bidder’s Statement and Target’s Statement were sent to shareholders in July 2013
Recommendation
• GrainCorp Directors unanimously recommend that shareholders accept the offer(1)
Offer Conditions(2)
• Minimum acceptance of 50.1%
• Regulatory approvals including FIRB and MOFCOM
• No prescribed occurrences
Next Steps
• ADM to progress regulatory approvals
• FIRB (Treasurer decision by 17 December); and
• MOFCOM (Ministry of Commerce of the Government of the People’s Republic of China)
• Offer open until 28 February 2014 (unless extended by ADM)
Total value to shareholders of $13.20 comprising:
• $12.20 per share in cash
• Permitted Dividends totalling $1.00 per share(4)
Additional Value
• Dividends expected to be fully franked(5)
• Additional 3.5 cents per share per full month from October 2013(6)
Premium
• Represents 49% premium to the closing price before the initial proposal(7)
• Represents 15%(8) increase to ADM’s initial proposal
Value and Premium
Acceptances & Relevant Interest
• ADM’s relevant interest (including its 19.9% direct holding) as at 29 October was 28.3%(3)
• Approximately 5,900 shareholders(3) (~44% by number) have accepted ADM’s Offer
For
per
sona
l use
onl
y

QuestionsF
or p
erso
nal u
se o
nly

AppendixF
or p
erso
nal u
se o
nly
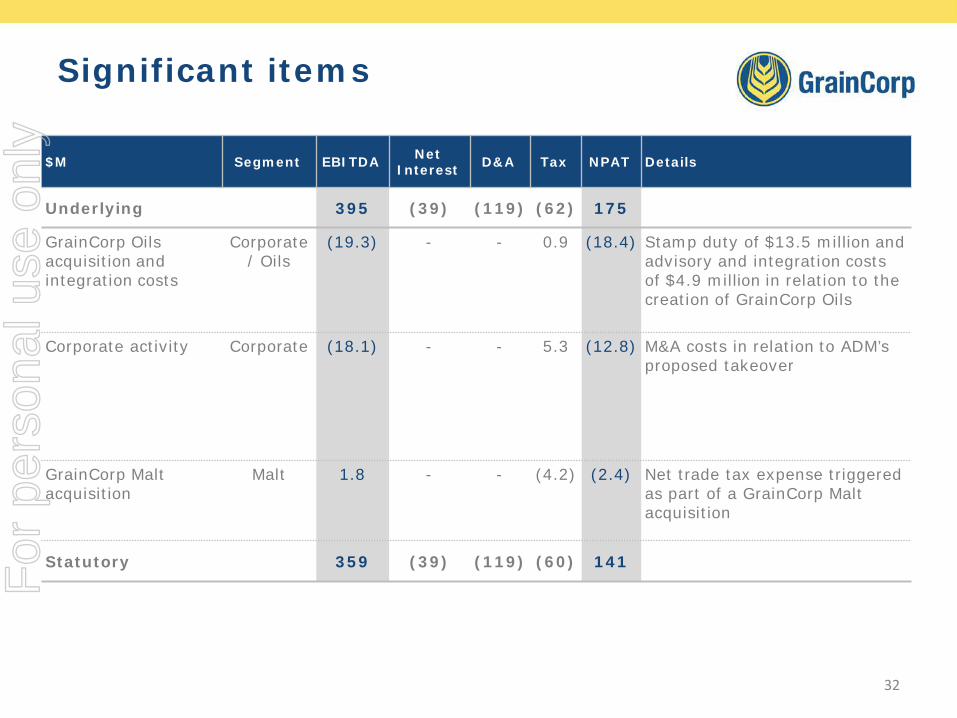
Significant items
32
$M Segment EBITDA Net Interest D&A Tax NPAT Details
Underlying 395 (39) (119) (62) 175
GrainCorp Oils acquisition and integration costs
Corporate / Oils
(19.3) - - 0.9 (18.4) Stamp duty of $13.5 million and advisory and integration costs of $4.9 million in relation to the creation of GrainCorp Oils
Corporate activity Corporate (18.1) - - 5.3 (12.8) M&A costs in relation to ADM’s proposed takeover
GrainCorp Malt acquisition
Malt 1.8 - - (4.2) (2.4) Net trade tax expense triggered as part of a GrainCorp Malt acquisition
Statutory 359 (39) (119) (60) 141For
per
sona
l use
onl
y

Grain volumes
Volume driver (mmt) FY13 FY12 Comments
Grain carry-in (1-Oct) 4.3 6.0 • Grain stored at start of period• FY13 carry-in above average of 3mmt• Higher FY12 carry-in due to larger FY11 crop
Country network receivals 10.4 12.2 • ~55% share of crop production(1)
• Lower receivals versus prior year due to smaller crop
Grain exports handled 8.3 10.6 • Including bulk and containers• Higher than average exports reflecting strong demand
Non-grain exports and imports 1.9 1.8 • Includes woodchips, cottonseed, orange juice, meals, mineral sands and fertiliser. 1.9mmt of exports (FY12: 1.8mmt) and 0.4mmt of imports (FY12: 0.5mmt)
Grain carry-out (30-Sep) 2.3 4.3 • Grain stored at period end• FY13 carry-out below average of 3mmt
Throughput(2) 23.8 28.5 • Average of country sites in and out, and ports grain and non-grain exports handled
Domestic grain outload 6.3 6.3 • Higher share of supply to domestic grain market
Grain received at port 2.2 3.0 • Grain received direct at port ex-farm and other bulk handlers
33
1. Eastern Australia’s wheat, barley, canola and sorghum production estimates, based on average of Australian Crop Forecasters’ November 2013 report of 18.2mmt and ABARES’ September 2013 Crop Report of 18.4mmt.
2. Average country grain inload (carry-in + receivals) and outload (carry-in + receivals – carry-out) + ports grain and non-grain exports handled.
For
per
sona
l use
onl
y

GrainCorp Oils key drivers
Crushing
Pacific Terminals
• Capacity utilisation
• Storage rate
• Storage cost
• Capacity utilisation
• Gross margin and commodity management
• Crush process cost
Refining
• Capacity utilisation
• Gross margin and commodity management
• Refining process cost
• Product mix
Complementary businesses
• Tallow and vegetable oils marketing
• Liquid stock feeds (Australia & NZ) and blended feeds (NZ)
• Used edible oil collection and recycling
Combined sales volumes (crude oil, meal, refined products)
34
~One third of GrainCorp Oils EBITDA Included in Crushing & Refining
For
per
sona
l use
onl
y

GrainCorp is Australia’s leading agribusiness
Integrated Business Model with an international “end-to-end” grain supply chain connecting consumers to growersUnique portfolio of local storage and logistics assets and local and international downstream processing assets linked by a global Marketing platform
Track record delivering corporate objectives and strategy execution
Global exposure to attractive grain industry fundamentals with strong demand growth for grain and processed grain coupled with origination advantages
Confident in delivering growth from identified strategic initiatives targeting ~$110M incremental underlying EBITDA(1) by end FY16
1. Earnings before interest, tax, depreciation and amortisation.
35
For
per
sona
l use
onl
y


![Gnc suda[1]](https://img.pdfslide.net/doc/110x75/55bef06cbb61eb32538b45bf/gnc-suda1.jpg)