Embed Size (px)
Citation preview

ABN 60 057 186 035
GrainCorp Limited
Level 28, 175 Liverpool Street
Sydney NSW 2000 Australia
PO Box A268
Sydney South NSW 1235
T +61 2 9325 9100
F +61 2 9325 9180
graincorp.com.au
15 November 2018
The Manager
Company Announcements Office
ASX Limited
20 Bridge Street
SYDNEY NSW 2000
GRAINCORP LIMITED: GNC
APPENDIX 4E AND ANNUAL REPORT
FINANCIAL YEAR ENDED 30 SEPTEMBER 2018
Please find attached the Appendix 4E and Annual Report relating to the financial year ended 30 September 2018.
For those Shareholders that elect to receive a hard copy of the Annual Report, this document will be mailed to
Shareholders commencing the week of 3 December 2018.
Annual General Meeting
GrainCorp’s Annual General Meeting will be held in Sydney on Wednesday 20 February 2019, commencing at 10:00am
(AEDT). Further detail confirming the location and resolutions to the considered at the AGM will be outlined in the Notice
of Meeting and Explanatory Memorandum, which will be sent to Shareholders in January 2019.
Yours faithfully,
GrainCorp Limited
Amanda Luhrmann
Group General Counsel & Company Secretary
For
per
sona
l use
onl
y

ABN 60 057 186 035
GrainCorp Limited
Level 28, 175 Liverpool Street Sydney NSW 2000 Australia
PO Box A268 Sydney South NSW 1235
T +61 2 9325 9100 F +61 2 9325 9180
graincorp.com.au
GRAINCORP LIMITED
APPENDIX 4E
FOR THE YEAR ENDED 30 SEPTEMBER 2018
Results for Announcement to the Market
Up /
Down %
Movement 2018
$ M
Revenue from ordinary activities Down 7.1% to 4,253.1
Profit from ordinary activities after tax attributable to owners of GrainCorp Limited
Down 43.7% to 70.5
Net profit for the period attributable to owners of GrainCorp Limited Down 43.7% to 70.5
Dividend Information Amount per security Franked amount per security at 30% tax
Interim dividend per share (paid 16 July 2018) 8.0 cents 8.0 cents
Final dividend per share 8.0 cents 8.0 cents
Record date for determining entitlements to the final dividend 29 November 2018
Payment date for final dividend 13 December 2018
Additional Information
Net Tangible Assets per share: $6.46 (2017: $6.16)
Additional Appendix 4E disclosure requirements can be found in the attached Annual Report.
This report is based on the consolidated financial statements and notes which have been audited by PricewaterhouseCoopers.
Further information regarding the company and its business activities can be obtained by visiting the company’s website at www.graincorp.com.au.
For
per
sona
l use
onl
y

GrainCorp Limited
Annual Report 2018
For
per
sona
l use
onl
y

GrainCorp Overview 2
Chairman’s Statement 4
MD & CEO’s Statement 6
Board of Directors 10
Executive Leadership Team 14
Directors’ Report 16
Directors’ Report - Remuneration Report 30
Auditor’s Independence Declaration 43
2018 Financial Report 44
Notes to the Financial Statements 50
Directors’ Declaration 93
Independent Auditor’s Report 94 to the members of GrainCorp
Shareholder Information 101
Corporate Directory IBC
Contents
Annual General Meeting 20 February 2019, 10:00am Hilton Hotel, Sydney
GrainCorp provides a diverse range of
products and services across the food and
beverage supply chain to customers in
over 30 countries.
For
per
sona
l use
onl
y

2018 Annual Report 1
For
per
sona
l use
onl
y

GrainCorp OverviewOur International Operations
North America
United KingdomGrains• Saxon Agriculture
Malt• Bairds Malt• Scotgrain• Brewers Select
Australia & New ZealandGrainsOilsMalt• Barrett Burston Malting• Cryer Malt
SingaporeGrains
ChinaGrainsOils
GermanyGrains
UkraineGrains
Grains• GrainsConnect Canada
Malt• Canada Malting Company• Great Western Malting• Country Malt Group• Brewcraft USA
Grains marketing o�ceHead o�ceMalt/Oils facilitiesGrains operations
2 2018 Annual Report
For
per
sona
l use
onl
y

GrainCorp has operations in Australia, New Zealand, Asia, North America, Europe and the United Kingdom. These markets collectively represent over 50% of the international export trade in wheat, barley and canola.
GrainCorp has three reporting segments:› GrainCorp Grains› GrainCorp Malt› GrainCorp Oils
Our Vision To be a leading international agribusiness as our customers’ preferred partner.
Our Integrated Supply Chain Accumulation – Largest regional accumulation network in Australia.
Storage – Over 20 million metric tonnes (mmt) of country storage and handling capacity.
Marketing – Marketing to local and global markets.
Road & Rail – Full freight connectivity for rapid turnaround.
Ports – Seven bulk grain ports with 15mmt elevation capacity and 14 bulk liquid terminals.
Processing – A key end producer of malt and oils.
Our ValuesOur values help define our organisational culture by providing a common understanding of how we do things at GrainCorp and how we should behave towards each other, our customers and other stakeholders.
› Commit to SAFETY› Deliver for our CUSTOMERS› LEAD the way› OWN the result
GrainCorp is a leading international food ingredients and agribusiness company with an integrated business model across three main grain activities: supply chain, origination and processing.
North America
United KingdomGrains• Saxon Agriculture
Malt• Bairds Malt• Scotgrain• Brewers Select
Australia & New ZealandGrainsOilsMalt• Barrett Burston Malting• Cryer Malt
SingaporeGrains
ChinaGrainsOils
GermanyGrains
UkraineGrains
Grains• GrainsConnect Canada
Malt• Canada Malting Company• Great Western Malting• Country Malt Group• Brewcraft USA
Grains marketing o�ceHead o�ceMalt/Oils facilitiesGrains operations
2018 Annual Report 3
For
per
sona
l use
onl
y

Chairman’s Statement
Dividends Per Share (DPS) (¢)
FY18 EBITDA by business unit1
FY14 FY15 FY16 FY17 FY18
Ordinary DPS
Malt Oils Grains
23%
57%
20%
1Reflects business unit proportions of EBITDA (excludes corporate costs).
Group underlying Net Profit after Tax less interest expense (after tax) associated with core debt / Average net debt (excluding commodity inventory funding) + average total equity
10 11
30
20
16
Return on invested capital (ROIC)
FY14 FY15 FY16 FY17 FY18
2.5% 2.7%
6.3%
5 .0%
3.5%
4 2018 Annual Report
For
per
sona
l use
onl
y

Our priority for 2019 is to improve GrainCorp’s return on invested capital, with a focus on strengthening our core businesses.
After a strong year in 2017, fiscal year 2018 was more challenging for GrainCorp and for the grain industry, with below average grain production across the eastern seaboard of Australia.
Despite these challenges, our Grains business made good progress in expanding its international origination capability and improving supply chain efficiencies – both of which will improve our future earnings in more normal seasons. Our FY2018 results also demonstrated solid improvements in returns from our two processing businesses, Malt and Oils.
For the year ended 30 September 2018, our earnings before interest, tax, depreciation and amortisation (EBITDA) was $269 million ($390 million in FY2017) and underlying net profit after tax (NPAT) was $71 million ($142 million in FY2017).
The Board declared a final dividend of 8 cents per share for the period to 30 September 2018, taking the total dividends for the year to 16 cents per share. This payout ratio of 52%, is in line with our policy of paying out 40-60% of full-year underlying NPAT through the cycle.
Strategic directionOur priority for 2019 is to improve GrainCorp’s return on invested capital, with a focus on strengthening our core businesses. We have invested in recent years to support this objective by increasing our malt and oilseed processing capacity and improving supply chain efficiencies across the Group. Most of these investments have now been completed and we are starting to see the benefits.
The formation of our Grains business unit in August 2017 was a fundamental change to our operating structure. A combined Grains business will create a more efficient supply chain in eastern Australia.
This has benefits for our grower customers, for the buyers using our network and for GrainCorp’s competitive offering.
OutlookUnfortunately, growing conditions have deteriorated further since 30 September 2018, with year-to-date rainfall amongst the lowest recorded in the past century and most of eastern Australia in drought. This will further challenge us to improve our cost-efficiency and streamline our operations in Grains. We will also strive to continue the improvements in Malt and Oils, building on our recent investments.
SustainabilityOur success over the longer term depends on having a strong culture of concern for health and safety, environment, community relations and workforce engagement.
We progressed several initiatives in these areas during the year, including commissioning expert research into the potential effect of long-term climate change on wheat yields in eastern Australia. An encouraging conclusion from this research was that, under most probable future scenarios, eastern Australia will continue to be a productive wheat growing region to 2050 and beyond. See our 2018 Sustainability Report for more details.
SummaryOn behalf of my fellow Board members, I want to thank the GrainCorp team for their dedicated performance in 2018. I look forward to speaking with many of our investors at our forthcoming AGM on 20 February 2019.
Thank you for your continued support.
Graham Bradley AM Chairman
2018 Annual Report 5
For
per
sona
l use
onl
y
2018 was a challenging year with prolonged dry conditions in eastern Australia leading to below-average grain production and a substantial drop in grain exports. As an owner and operator of country and port assets, grain throughput and asset utilisation are important for GrainCorp and with lower volumes in eastern Australia, our Grains earnings were negatively impacted.
The benefits of our diversified business model, however, were evident with a strong Malt result and improved performance from Oils. The two businesses contributed a combined 77% of Group EBITDA.
SafetyThe health and safety of our people will always be a key priority for the Group. Our Recordable Injury Frequency Rate (RIFR) was 12.2 in FY18, compared to 11.5 in FY17. We are not satisfied with this increase and are targeting year-on-year improvement to this metric. Our Group Safety, Health and Environment Strategy Towards 2020 continues to guide our progress and the initiatives we pursue in this area.
Managing Director and CEO’s Statement
6 2018 Annual Report
For
per
sona
l use
onl
y

Business unit performanceMalt’s $170 million EBITDA was an 8% increase on last year, with a solid second half that included a full contribution from the expanded malting capacity in Pocatello, Idaho. The business continued to operate at high utilisation, servicing a broad mix of brewing and distilling customers globally.
Oils delivered $61 million EBITDA, a 5% increase on last year. Liquid Terminals and Feeds performed strongly, however Oilseeds was down year-on-year due to reduced Australian canola supply and quality issues, both of which impacted the crush margin. The Foods business made steady progress with improved operational efficiencies at West Footscray.
Grains contributed $68 million EBITDA, a 67% reduction on last year. This primarily reflects the sharp drop in grain production in eastern Australia to 16.6mmt (FY17: 28.2mmt)2 and lower grain exports. The result was also negatively impacted by GrainCorp’s ‘take-or-pay’ rail commitments, due to the lower volumes. These rail commitments expire at the end of FY19, with the new rail contracts coming into effect in FY20 and providing greater flexibility to manage transportation costs through the crop cycle.
Despite the tightness in grain supply, GrainCorp has benefited from the integration of its storage, handling and trading businesses by achieving a higher share of domestic grain trade. We continued to rationalise our country network, with Grains operating approximately 145 sites during harvest, down from 160 last year.
3RIFR calculated as number of injuries per million hours worked. Includes permanent and casual employees and GrainCorp controlled contractors. Includes lost time injuries, medical and restricted work injuries.
4Underlying EBITDA and underlying NPAT are non-IFRS measures and exclude significant items.
Recordable Injury Frequency Rate (RIFR)3
The benefits of our diversified business model were evident in FY18.
Mark Palmquist Managing Director & CEO
38.8
21.6
13.911.3 11.5 12.2
FY13 FY14 FY15 FY16 FY17 FY18
Underlying EBITDA ($m)4
395
293
235256
390
269
FY13 FY14 FY15 FY16 FY17 FY18
Underlying NPAT ($m)4
175
95
4553
142
71
FY13 FY14 FY15 FY16 FY17 FY18
2Average of ABARE’s and ACF’s eastern Australian grain production estimates: wheat, barley, canola, chickpeas and sorghum.
2018 Annual Report 7
For
per
sona
l use
onl
y

Strategic prioritiesOur objective is to create sustainable shareholder value by increasing the Group’s return on invested capital. Our three strategic priorities are aligned to support this objective and during the year we made the following progress:
1 Strengthen core businesses:
GrainCorp Malt• Great Western Malting Co’s plant at Pocatello,
Idaho, (total 220,000mt capacity) operated at full production in the second half. The existing plant was upgraded in the first quarter to improve productivity and energy efficiency.
• In October 2018, Bairds Malt announced a £51 million ($AUD94 million) investment to expand its malting capacity in Scotland by 79,000 tonnes. The project will involve upgrading Bairds Malt’s existing Arbroath facility and building a new malting plant at its Inverness site. The expansion will support growth in distilling production in Scotland.
GrainCorp Oils• Completed expansion of oilseed crushing
plant at Numurkah, Victoria in September 2018, increasing the site’s crush capacity by 40% to 1,000 tonnes per day. Total crush capacity for GrainCorp Oils is now 390,000mt/p.a.
• Further cost reduction and improved productivity at GrainCorp Oils’ Foods business at West Footscray, Victoria.
GrainCorp Grains• Expanded Grains’ origination footprint,
commissioning the second of four GrainsConnect Canada sites and opening a Black Sea office in Kyiv, Ukraine, both in June 2018. First grain shipment from Ukraine in October 2018.
• Under newly formed Grains structure, achieved improvement in customer engagement and higher share of domestic grain trade.
2 Disciplined approach to capital management: GrainCorp remained in a strong financial position
at 30 September 2018, despite the challenge of a small crop in eastern Australia and its negative impact on cash flow. Net debt gearing was 38%5, below our target of 45%, and core debt gearing was 21%.
We continued to be disciplined with capital management during the year with stay-in-business capex declining to $55 million (FY17: $78 million) and growth capex declining to $87 million (FY17: $184 million).
This discipline will continue in FY19 as we face the prospect of a further substantial decline in grain production in eastern Australia.
3 Growth and portfolio optimisation: Portfolio optimisation is a key component of
GrainCorp’s objective to improve return on capital and involves an ongoing assessment of our assets’ performance – i.e. consideration of strategic fit and ability to generate adequate returns.
Crop outlookIn FY19, we expect a considerable decline in grain production in eastern Australia due to the severe drought that has affected much of the region. It is anticipated that production will again be skewed to Victoria and southern New South Wales, with deficits in northern New South Wales and Queensland.
In response to the outlook, we are adapting GrainCorp’s country network to better match the size and location of the crop and keeping a strong focus on cost control, asset utilisation and capex allocation.
With expectations of minimal exportable surplus in eastern Australia, we anticipate grain to continue flowing from Western Australia and South Australia via vessel to ports in eastern Australia. We have adapted several GrainCorp ports to handle the reverse supply chain and the in-loading requirements.
Managing Director and CEO’s Statement
It is an extremely challenging time for our grower customers and for many of our own people who live and farm in these communities.
Mark Palmquist Managing Director & CEO
5Quartely rolling average.
8 2018 Annual Report
For
per
sona
l use
onl
y

CommunityIt is an extremely challenging time for our grower customers and for many of our own people who live and farm in these communities.
We have implemented a series of initiatives to support both the communities in which we operate and our customers, including the acceleration of faster payment terms, improved processes to withdraw grain stored in our system, and a workplace-giving partnership with Rural Aid.
GrainCorp is currently reviewing its community sponsorship program to ensure we are contributing to our communities in a relevant and sustainable manner. We will share further information on our approach in the coming year.
ConclusionOur business fundamentals remain strong, with growing demand globally for dry grains and oilseeds, and consumption trends that match GrainCorp’s offerings; such as an increasing focus on food & beverage quality, safety and provenance.
Whilst drought conditions present a challenge in FY19, I am confident we will continue to adapt and emerge as a stronger, more agile business.
We continue to strengthen our core businesses and are starting to see the benefits from the capital investments we’ve made in recent years. These will provide the foundation for sustainable value creation over time.
I would like to thank our employees for their dedication during the year and our shareholders and customers for their continued support.
GrainsConnect Canada site Maymont, Saskatchewan, Canada
2018 Annual Report 9
For
per
sona
l use
onl
y

Board of Directors
Graham J Bradley AMBA, LLB (Hons I, Sydney), LLM (Harvard), FAICD Chairman and Non-executive Director
Graham Bradley joined the GrainCorp Board on 1 March 2017 and assumed the role of Chairman on 1 May 2017. Mr Bradley is currently Non-executive Chairman of HSBC Bank Australia Limited (since 2004), EnergyAustralia Holdings Limited (since 2012), Virgin Australia International Holdings Limited (since 2012), and Infrastructure NSW (since 2013). He is also a Director of The Hongkong & Shanghai Banking Corporation Limited (since 2012). He was previously a Director of GI Dynamics Inc until November 2017, Chairman of Po Valley Energy Limited until April 2016, and Chairman of Stockland Corporation Limited until October 2016. Mr Bradley has had a distinguished career in business, including eight years as Managing Director of Perpetual Limited and senior roles at Blake Dawson and McKinsey & Company. He was President of the Business Council of Australia from 2009-2011 and the former Deputy President of the Takeovers Panel. Mr Bradley was made a member of the Order of Australia in 2009 in recognition of his contribution to business, medical research and the arts.
Mark L PalmquistBBus, GAICD Managing Director & Chief Executive Officer
Mark Palmquist joined the GrainCorp Board as Managing Director & CEO in October 2014. He was previously Executive Vice President and Chief Operating Officer, Ag Business, for CHS Inc., a leading global agribusiness diversified in energy, grains and food. He has held a variety of leadership roles for a broad range of CHS agricultural inputs and marketing areas, retail businesses and grain-based food and food ingredients operations. Mr Palmquist was previously a Director of Rahr Malting, a leading US maltster, and a Non-executive Director of Allied Mills Australia Pty Ltd until his resignation in March 2017.
Rebecca P Dee-Bradbury BBus, GAICD Non-executive Director
Rebecca Dee-Bradbury joined the GrainCorp Board in September 2014. Ms Dee-Bradbury is Chair of the People Remuneration and Nominations Committee and a member of the Board Audit Committee. She was previously Chief Executive Officer/President Developed Markets Asia Pacific and ANZ for Mondelez from 2010 to 2014. Ms Dee-Bradbury is a Non-executive Director of BlueScope Steel Limited (since 2014) and a Non-executive Director of EnergyAustralia Holdings Limited (since April 2017). Ms Dee-Bradbury was previously a Non-executive Director of Tower Limited until her resignation in 2016. Ms Dee-Bradbury is an inaugural member of the Business Advisory Board at Monash Business School, and a member of Chief Executive Women (CEW) and the Foundation for Women Company Directors (WCD). She brings to the Board significant experience in strategic brand marketing, business integration and transformation, customer relationship management and innovation.
10 2018 Annual Report
For
per
sona
l use
onl
y

Barbara J Gibson BSc, MAICD, FTSE Non-executive Director
Barbara Gibson joined the GrainCorp Board in March 2011. Ms Gibson is Chairman of the Safety Health Environment and Governance Committee and is a member of the Business Risk Committee. Ms Gibson is an experienced executive having spent 20 years with Orica Limited, and is a member of the Institute of Company Directors. She is also a fellow of The Australian Academy of Technology and Engineering, and Chairman of Warakirri Asset Management Pty Limited (since 2005). In 2003, Ms Gibson was awarded a Centenary of Federation Medal for services to Australian Society in Medical Technology. Ms Gibson was previously a Non-executive Director of Nuplex Industries Limited until her resignation in September 2016.
Daniel J MangelsdorfBAgEc(Hons), FAICD Non-executive Director
Dan Mangelsdorf has served as an independent Director of GrainCorp since February 2009, having first been appointed as a major shareholder representative Director in 2005. Mr Mangelsdorf is Chairman of the Business Risk Committee and a member of the Board Audit Committee. Mr Mangelsdorf owns and operates farming interests in NSW, and is an experienced public company director with agricultural, supply chain, international trade and risk management expertise. He is also the Non-executive Chairman of Warakirri Agricultural Trusts, and a Non-executive Director of Warakirri Asset Management Pty Ltd (since 2017) and Warakirri Holdings Pty Ltd (since 2017).
Peter J HousdenBCom, FCPA, FAICD Non-executive Director
Peter Housden joined the GrainCorp Board in October 2008. Mr Housden is Chairman of the Board Audit Committee and a member of the Business Risk Committee. He is a Director of Alliance Aviation Services Limited (since 2011). He was previously the Chairman of Royal Wolf Holdings Limited until his resignation in September 2017, a Director of Seeing Machines Limited until his resignation in July 2017, a Director of Lincor Limited until his resignation in December 2016 and a Director of Calibre Group Limited until his retirement in December 2015. Mr Housden was appointed Chairman of the Audit and Risk Committee for NSW Trains in November 2018, and retired as Chairman of the Audit and Risk Committee for Sydney Trains concurrently. He has extensive experience acting on public company boards.
2018 Annual Report 11
For
per
sona
l use
onl
y
Board of Directors
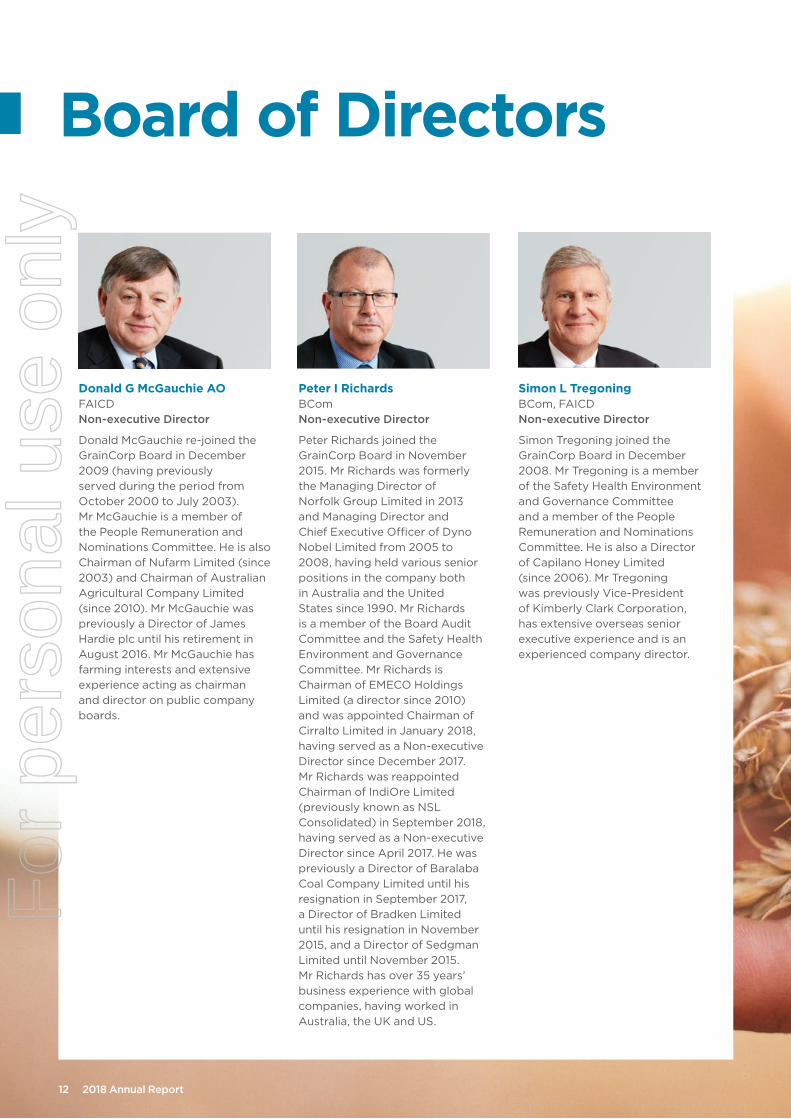
Donald G McGauchie AO FAICD Non-executive Director
Donald McGauchie re-joined the GrainCorp Board in December 2009 (having previously served during the period from October 2000 to July 2003). Mr McGauchie is a member of the People Remuneration and Nominations Committee. He is also Chairman of Nufarm Limited (since 2003) and Chairman of Australian Agricultural Company Limited (since 2010). Mr McGauchie was previously a Director of James Hardie plc until his retirement in August 2016. Mr McGauchie has farming interests and extensive experience acting as chairman and director on public company boards.
Peter I RichardsBCom Non-executive Director
Peter Richards joined the GrainCorp Board in November 2015. Mr Richards was formerly the Managing Director of Norfolk Group Limited in 2013 and Managing Director and Chief Executive Officer of Dyno Nobel Limited from 2005 to 2008, having held various senior positions in the company both in Australia and the United States since 1990. Mr Richards is a member of the Board Audit Committee and the Safety Health Environment and Governance Committee. Mr Richards is Chairman of EMECO Holdings Limited (a director since 2010) and was appointed Chairman of Cirralto Limited in January 2018, having served as a Non-executive Director since December 2017. Mr Richards was reappointed Chairman of IndiOre Limited (previously known as NSL Consolidated) in September 2018, having served as a Non-executive Director since April 2017. He was previously a Director of Baralaba Coal Company Limited until his resignation in September 2017, a Director of Bradken Limited until his resignation in November 2015, and a Director of Sedgman Limited until November 2015. Mr Richards has over 35 years’ business experience with global companies, having worked in Australia, the UK and US.
Simon L TregoningBCom, FAICD Non-executive Director
Simon Tregoning joined the GrainCorp Board in December 2008. Mr Tregoning is a member of the Safety Health Environment and Governance Committee and a member of the People Remuneration and Nominations Committee. He is also a Director of Capilano Honey Limited (since 2006). Mr Tregoning was previously Vice-President of Kimberly Clark Corporation, has extensive overseas senior executive experience and is an experienced company director.
12 2018 Annual Report
For
per
sona
l use
onl
y

2018 Annual Report 13
For
per
sona
l use
onl
y

Andrew BakerChief Information Officer
Andrew Baker was appointed Chief Information Officer in July 2015. Mr Baker has experience across a variety of industries including resources, industrial and fast-moving consumer products. He has held several IT leadership roles in Accenture, Mars Corporation and was previously the Chief Information Officer at BlueScope Steel.
Alistair BellGroup Chief Financial Officer
Alistair Bell was appointed Group CFO in November 2010. Mr Bell leads the international finance, treasury, investor relations and shared services teams. Mr Bell is a Director of GrainCorp subsidiary companies and Director of Grains Connect Canada, a 50/50 joint venture between GrainCorp and Japanese agricultural cooperative Zen-Noh Grain Corporation. He was previously a Director of Allied Mills, Australia’s largest manufacturer and distributor of flour and bakery products, and a Director of Alzheimer’s Australia NSW, a member of its Investment Committee and Chairman of its Audit & Risk Committee until it was dissolved to form Dementia Australia. Prior to joining GrainCorp, Mr Bell held various CFO, COO and strategy positions with public, private equity and multinational companies spanning various industries.
Phil CarisGroup General Manager Human Resources and Safety, Health & Environment (SHE)
Phil Caris was appointed Group General Manager Human Resources in September 2015. Mr Caris leads GrainCorp’s global people and culture strategy and is responsible for leadership, talent, engagement, employee relations, performance, reward and diversity & inclusion. In 2016, his portfolio was extended to include Group Safety, Health and Environment responsibilities. Prior to joining GrainCorp, Mr Caris was EGM of Human Resources and Safety at Coates Hire and has held several other senior human resource leadership roles with companies including BHP, Coca-Cola and TNT both in Australia and overseas. Mr Caris is currently on parental leave until March 2019.
Greg FribergPresident and CEO GrainCorp Malt
Greg Friberg was appointed President and CEO GrainCorp Malt in July 2013. He joined United Malt Holdings (acquired by GrainCorp in 2009) in 1999 and has held several senior management and commercial roles across the Group. Mr Friberg has extensive experience across the grains and malting industries having previously worked for ConAgra Grain Company and Columbia Grain Inc. Mr Friberg has announced he will retire from GrainCorp on 31 December 2018 and will be succeeded by GrainCorp Malt’s current Chief Operations Officer, Darren Smith.
Cate HathawayInterim Group General Manager Human Resources and SHE
Cate Hathaway joined GrainCorp in July 2018 as Interim Group General Manager, Human Resources & SHE, to cover for Phil Caris while he is on parental leave. Ms Hathaway is a highly experienced HR and SHE practitioner with over 20 years’ experience with companies including Boral, Westpac and Equifax. She is a Fellow of the Australian Human Resources Institute and member of its Inclusion and Diversity Advisory Panel. Ms Hathaway is also a member of the School of Business, External Advisory Committee at Western Sydney University and a Director of the Board of the Environmental Defenders Office (EDO) NSW.
Marcus KennedyChief Development Officer
Marcus Kennedy was appointed Chief Development Officer in August 2015. Mr Kennedy is responsible for corporate strategy development, implementation and governance and corporate affairs and communications. He is also responsible for AgTech investments as part of GrainCorp’s innovation portfolio. He joined GrainCorp in 2012 as General Manager Strategy & Business Improvement for GrainCorp Oils and was responsible for leading the integration. Mr Kennedy has held several senior commercial and strategy leadership roles across a variety of industries including financial services, insurance, resources and agriculture.
Executive Leadership Team
14 2018 Annual Report
For
per
sona
l use
onl
y

Amanda LuhrmannGroup General Counsel & Company Secretary
Amanda Luhrmann was appointed Group General Counsel and Company Secretary in February 2017 and leads GrainCorp’s global governance, risk, insurance and legal services. Ms Luhrmann has held corporate counsel and executive management positions across a diverse range of industries and businesses with international operations, having previously specialised at a top tier firm in corporate advisory and mergers & acquisitions acting for clients in manufacturing, energy, media, telecommunications, rail and aviation. Ms Luhrmann is admitted as a Solicitor of the Supreme Court of New South Wales, a Member of AICD and a Fellow of the Governance Institute of Australia and the Institute of Chartered Secretaries and Administrators.
Klaus PammingerGroup General Manager Grains
Klaus Pamminger was appointed Group General Manager Grains in August 2017 and is responsible for the Grains Operations and Trading businesses in Australia, Singapore, China, Europe and Canada. He was previously Group General Manager, GrainCorp Marketing. Mr Pamminger joined GrainCorp in 2007 and prior to this he worked for several companies in Australia and the US. Mr Pamminger is the Chairman of GrainsConnect Canada, a Director of GrainCorp subsidiary companies and a Member of AICD.
Sam TainshGroup General Manager GrainCorp Oils
Sam Tainsh was appointed Group General Manager GrainCorp Oils in August 2012, and is responsible for the edible oils crushing, refining, food ingredients, feeds, liquid terminals and used oils businesses. Mr Tainsh joined GrainCorp in July 2001 and was previously Group General Manager GrainCorp Marketing. Before joining GrainCorp, he worked as a commodity trader at Louis Dreyfus Corporation in Australia and the US. Mr Tainsh is also a Director of GrainCorp subsidiary companies.
2018 Annual Report 15
For
per
sona
l use
onl
y

Directors’ Report GrainCorp Limited
16 2018 Annual Report
GrainCorp Limited Directors’ Report
Page 16 of 103
Directors’ Report Introduction
The following individuals were Directors of GrainCorp during the financial year 2018 and up to the date of this report:
› G J Bradley AM (Chairman)
› M L Palmquist (Managing Director & CEO)
› R P Dee-Bradbury
› B J Gibson
› P J Housden
› D J Mangelsdorf
› D G McGauchie AO
› P I Richards
› S L Tregoning
Directors have been in office since the start of the financial year to the date of this report unless otherwise stated. Details of the current members of the Board of Directors, including their experience, qualifications, special responsibilities and term of office are included on pages 10 to 12 of the Annual Report.
Details of Directors’ interests in shares and options of GrainCorp are set out in Section 8 of the Remuneration Report.
Group Company Secretary Amanda Luhrmann BSc, LLB (Hons), FCIS, FGIA, MAICD
Amanda Luhrmann was appointed Group General Counsel on 1 February 2017 and Company Secretary on 23 February 2017 and leads the Group’s global governance, risk, insurance and legal services function. Ms Luhrmann has held corporate counsel and executive management positions across a diverse range of industries and businesses with international operations, having previously specialised at a top tier firm in corporate advisory and mergers & acquisitions acting for clients in manufacturing, energy, media, telecommunications, rail and aviation. Ms Luhrmann is admitted as a Solicitor of the Supreme Court of New South Wales, a Member of AICD and a Fellow of the Governance Institute of Australia and the Institute of Chartered Secretaries and Administrators.
Gregory Greer BCom, MPA, GIA(Cert)
Gregory Greer joined GrainCorp in 2004 and was appointed by the Board as Group Company Secretary on 23 June 2014. Mr Greer is responsible for the Group’s company secretarial, risk and insurance functions. Mr Greer has held a number of corporate positions in the Company during his tenure.
For
per
sona
l use
onl
y

GrainCorp Limited Directors’ Report
2018 Annual Report 17
GrainCorp Limited Directors’ Report
Page 17 of 103
Meetings of Directors The following table sets out the number of meetings of GrainCorp’s Directors (including meetings of Committees of Directors) held during the 12 months to 30 September 2018, and the number of meetings attended by each Director.
Director
Board Board Audit Committee
People Remuneration & Nominations
Committee Business Risk
Committee
Safety Health Environment &
Governance Committee
A B A B A B A B A B
G J Bradley 9 9 ~ 4# 5 5 ~ 3# ~ 3# M L Palmquist 9 9 ~ 4# ~ 5# ~ 4# ~ 4# R P Dee-Bradbury 9 8 4 4 5 4 ~ 1# ~ ~ B J Gibson 9 9 ~ ~ ~ ~ 4 4 4 4 P J Housden 9 9 4 4 ~ ~ 4 4 ~ ~ D J Mangelsdorf 9 9 4 4 ~ ~ 4 4 ~ ~ D G McGauchie 9 9 ~ ~ 5 5 ~ ~ ~ ~ P I Richards 9 9 4 4 ~ ~ ~ 1# 4 4 S L Tregoning 9 9 ~ ~ 5 5 ~ ~ 4 3
A Number held during period in office B Number attended by members of the Committee and other Directors ~ Not a member of the relevant Committee # Attended by invitation
For
per
sona
l use
onl
y

Directors’ Report GrainCorp Limited
18 2018 Annual Report
GrainCorp Limited Directors’ Report
Page 18 of 103
Operating and Financial Review About GrainCorp Overview
GrainCorp is a leading Australian agribusiness with an integrated business model across three grain activities: supply chain, origination and processing. GrainCorp focuses its activities on the core grains of wheat, barley, canola and sorghum where the Company has comparative advantages through grain origination, proximity to growth markets and technical expertise. GrainCorp has operations in Australasia, North America and Europe (including the United Kingdom).
GrainCorp has three operating segments:
› Grains
› Malt
› Oils
Our Corporate Objectives
We aim to:
› Manage earnings variability by participating in multiple grain chains and geographies;
› Deliver growth by realising opportunities and competing in the global grain market; and
› Improve shareholder returns by creating and capturing value along the grain supply chain.
We have made significant achievements in meeting these corporate objectives through:
› Dividends to shareholders representing a five-year average of 49% of underlying NPAT, in line with our dividend policy of paying 40-60% of NPAT through the business cycle.
› Reducing earnings volatility by growing earnings from business units with more stable earnings.
› Organic and acquisitive growth, enabled by a strong and flexible balance sheet.
› Creation of GrainCorp Malt and GrainCorp Oils processing businesses.
Our Business Model
We operate a business model based on:
› Our core grains – wheat, barley, canola and sorghum. We focus on the ‘drier climate’ grains where we have comparative advantages of grain origination, proximity to growth markets and technical expertise.
› Our operating geographies – Australasia, North America and Europe. These regions collectively service over 50% of the global trade in our core grains; our operations provide market insight, price risk management and multi-origin capability.
› Our integrated activities – supply chain, origination and processing. We create and capture value in our core grains along the grain chain, with insight into consumer requirements in these grains.
Our Strategy
We operate in a global grain market that offers considerable growth prospects in the demand for grain and processed grains such as malt and edible oils.
Population growth and rising affluence are projected to drive large increases in both global grain demand and global grain trade.
Our strategy is to apply our comparative advantages in the supply of grain, malt and edible oils to participate in this growth opportunity, serving customers in Australia and internationally.
For
per
sona
l use
onl
y

GrainCorp Limited Directors’ Report
2018 Annual Report 19
GrainCorp Limited Directors’ Report
Page 19 of 103
Creating Value
We create and capture value for consumers, growers and shareholders from the following competitive advantages:
› Strategic assets – our unique ‘end-to-end’ infrastructure network at all stages of the grain chain in our core grains.
› Geographic location – proximity to the world’s growth markets for grain in Asia, the Middle East and Africa.
› Grain origination – access to grain with strong quality advantages to satisfy a diversified range of consumer products.
Our History
GrainCorp started in 1916 under the Grain Elevator Act and was administered as a branch of the New South Wales Government’s Department of Agriculture. The Company led the development of Australia’s first bulk grain handling system with the construction of 200 country elevators linked by rail to shipping terminals at Sydney and Newcastle. By October 1989, the Company had gone through several changes and was known as the Grain Handling Authority of NSW (‘GHA’). At this time, the GHA was corporatised and became the NSW Grain Corporation. The NSW Grain Corporation was privatised in April 1992 and sold to the grain grower owned Prime Wheat Association that became GrainCorp. GrainCorp listed on the Australian Stock Exchange in 1998.
GrainCorp has grown through acquisition and organic growth. GrainCorp acquired Victorian based Vicgrain in 2000, Queensland based Grainco in 2003, an international portfolio of malt businesses from United Malt Holdings in 2009, edible oils businesses Gardner Smith and Integro Foods in October 2012 and Cryer Malt, an Australasian distributor of craft brewing ingredients, in 2017. In 1996, GrainCorp was the first Australian bulk handler to trade grain in the Australian domestic market, and in 2008 commenced exporting wheat to international markets following the removal of the export single wheat desk.
For
per
sona
l use
onl
y

Directors’ Report GrainCorp Limited
20 2018 Annual Report
GrainCorp Limited Directors’ Report
Page 20 of 103
Group Financial Summary
Key Results ($ M) 2014 2015 2016 2017 2018 Revenue 4,094.1 4,085.5 4,158.3 4,575.7 4,253.1 Underlying EBITDA6 293.3 235.4 255.5 390.1 269.0 Underlying EBIT7 166.8 99.1 112.9 243.7 115.8 Net profit after tax 50.3 32.1 30.9 125.2 70.5 Dividend (cents per share)8 20.0 10.0 11.0 30.0 16.0 Financial Position Total assets $ M 3,333.2 3,673.7 3,575.8 3,598.4 3,974.7 Total equity $ M 1,744.5 1,821.8 1,742.0 1,860.4 1,942.2 Net assets per ordinary share $ 7.62 7.97 7.61 8.13 8.49 Net debt to net debt and equity9 % 29.8 29.0 33.4 27.2 32.4 Core debt to core debt and equity10 % 21.5 23.4 29.3 19.5 20.9 Shareholder Returns Basic earnings per ordinary share cents 22.0 14.0 13.5 54.7 30.8 Return on equity % 5.4 2.5 3.0 7.8 3.7 Return on invested capital (ROIC)11 % 5.0 2.5 2.7 6.3 3.5 Dividend per ordinary share8 cents 20.0 10.0 11.0 30.0 16.0 Dividend yield per ordinary share12 % 2.3 1.1 1.4 3.7 3.6 Business Drivers (million metric tonnes) Grains Total ECA grain receivals (country + direct-to-port) 9.7 8.8 8.8 15.0 7.2 ECA grain exports handled 4.4 3.5 3.0 7.2 2.7 ECA non-grain handled 1.9 2.5 3.0 2.8 2.9 Total grain sales 6.2 6.0 6.7 8.3 6.9
6 Underlying EBITDA is a non-IFRS measure representing earnings before interest, tax, depreciation and amortisation, excluding significant items which are detailed in
note 1.5 of the Financial Report. 7 Underlying EBIT is a non-IFRS measure representing earnings before interest and tax, excluding significant items which are detailed in note 1.5 of the Financial Report. 8 All dividends were fully franked. 9 Net debt is total debt less cash. 10 Core debt is net debt less commodity inventory. 11 ROIC = Group underlying Net Profit after Tax less interest expense (after tax) associated with core debt / Average net debt (excluding commodity inventory funding) +
average total equity. ROIC is a non-IFRS measure. 12 Using closing price immediately prior to or on 30 September divided by dividends per year.
For
per
sona
l use
onl
y

GrainCorp Limited Directors’ Report
2018 Annual Report 21
GrainCorp Limited Directors’ Report
Page 21 of 103
Segment Results ($ M) 2017 Revenue
2017 Underlying EBITDA13 2018 Revenue
2018 Underlying EBITDA13
Grains 2,621.9 205.9 2,241.9 68.4
Malt 1,105.5 158.4 1,152.4 170.3
Oils 945.5 58.0 969.1 61.1
Corporate and eliminations (97.2) (32.2) (110.3) (30.8)
Total 4,575.7 390.1 4,253.1 269.0
Group Financial Analysis and Commentary The Group reported underlying net profit after tax (‘NPAT’) of $71 million, down $71 million, or 50%, on the prior year. Underlying earnings before interest, tax, depreciation and amortisation (‘EBITDA’) decreased by $121 million, or 31%, to $269 million. Revenue from continuing operations decreased 7% to $4,253 million (2017: $4,576 million).
Malt Business Unit Overview
GrainCorp Malt offers deep grain expertise and tailored relationships with brewing and distilling customers around the world.
GrainCorp Malt is the world’s fourth largest commercial maltster, with 13 malting houses in Australia, Canada, the United States and United Kingdom. GrainCorp Malt supplies malt and other brewing ingredients/products to global brewers, craft brewers and distillers.
FY18 Performance
› Continued to operate at high utilisation.
› Full second half contribution from expanded malt plant at Pocatello, Idaho (total capacity 220,000mt).
› Strong demand for malt and brewing ingredients/products from craft beer and distilling customers.
› Continued growth in US craft beer market; 5% growth in US craft beer sales volumes in 201714.
› Result includes increased energy costs in Australia (~$4 million).
› Burnley, Victoria malt plant (capacity 23,000mt) decommissioned and sold in Q4 FY18.
› In October 2018, announced a GBP51 million investment to expand malting capacity in Scotland by 79,000 tonnes to service the growing distilling sector.
Oils Business Unit Overview
GrainCorp Oils is a leading producer of edible oils in Australasia. Locally grown and processed, our oil is used in the production of a wide range of food and animal feed products.
GrainCorp Oils' ownership and management of key assets in the oilseed supply chain, along with GrainCorp Oils’ size and quality assurance, enables us to produce high quality products at competitive prices.
› Operations include crushing, refining, packaging, storage and recycling.
› Leading Australian manufacturer and supplier of animal liquid feeds.
› Australia's largest integrated edible oils business.
› 14 bulk liquid terminals in Australia, New Zealand and China.
› Production of approximately 500,000 tonnes of animal feed in Australia and New Zealand.
13 Underlying EBITDA is a non-IFRS measure representing earnings before interest, tax, depreciation and amortisation, excluding significant items set out in note 1.5 of
the Financial Report. 14 Brewers Association
For
per
sona
l use
onl
y

Directors’ Report GrainCorp Limited
22 2018 Annual Report
GrainCorp Limited Directors’ Report
Page 22 of 103
FY18 Performance
› Liquid Terminals: high utilisation, driven by consistent customer demand across a range of product segments.
› Oilseeds: lower crush contribution, due to reduced canola supply and quality, resulting from East Coast Australia (ECA) drought.
› Completed oilseed crush expansion at Numurkah, Victoria in September 2018, increasing capacity by ~40% to 1,000 tonnes per day.
› Foods: reduction in costs, continued operational efficiency improvements achieved. Demand for specialty oils for infant formula hastapered.
› Feeds: improved performance due to strong demand for supplementary animal feed both in Australia (due to ECA drought) and NZ.
› Result includes increased energy costs in Australia (~$4.5 million) and restructuring costs (~$2 million).
Grains Business Unit Overview
GrainCorp Grains is an integrated grain storage, handling and trading business, comprising storage facilities, rail and road operations and bulk grain ports in eastern Australia and origination and marketing teams positioned across four continents.
Ownership of key supply chain assets in eastern Australia allows GrainCorp to source, handle, store and transport grain efficiently and securely, providing vital grain quality assurance to its customers. With global marketing capabilities, Grains partners with customers to analyse markets, manage price risk and create additional value at each stage of the supply chain.
Grains is expanding its international origination capability through a joint venture with Zen-Noh Grain Corporation, GrainsConnect Canada, building a state-of-the-art supply chain to connect growers in Alberta and Saskatchewan to global markets. Grains has also recently opened an office in Ukraine, to participate in this growing origination market.
In November 2018 GrainCorp announced a simplification of Grains’ ECA operating structure, to reduce costs and enable more focused and relevant customer services. Grains continues to work with its customers to deliver improvements to its service model, responding to the respective priorities of its different customer segments.
› Approximately 145 country receival sites with over 20 million metric tonnes (‘mmt’) of storage capacity.
› Seven port terminals with 15 mmt of elevation capacity - ECA.
› Up to 4 mmt of rail freight capacity - ECA.
› Servicing over 100 domestic and international grain buyers.
› One of the leading sellers of grain into the domestic Australian market.
› Sells and delivers around 8 mmt annually to 30+ countries.
FY18 Performance
› Total grain sales 6.9mmt (FY17: 8.3mmt).
› Total ECA grain receivals (up-country + direct-to-port) 7.2mmt (FY17: 15.0mmt).
› ECA grain exports 2.7mmt (FY17: 7.2mmt). ECA non-grain handled 2.9mmt (FY17: 2.8mmt).
› ECA grain transhipments (through GrainCorp ports) 0.5mmt (FY17: 0). Export supply chain has been reversed to meet strong domesticdemand.
› Decline in earnings due to lower ECA grain availability and lower exportable surplus.
› ~145 silos operated during harvest (FY17: ~160 sites). Continued to focus on flexing the network and managing cost base.
› Benefited from integration of storage & handling and trading businesses; achieving higher share of domestic grain trade.
› Take-or-pay rail contracts have been a challenge with lower volumes. Contracts expire end of FY19.
› Result includes ~$3 million in integration costs.
› International growth strategy progressing well:
• Second (of four) GrainsConnect Canada sites commissioned in June 2018, two under construction;• Asset-light Ukraine presence established in June 2018; first grain shipment October 2018.
For
per
sona
l use
onl
y

GrainCorp Limited Directors’ Report
2018 Annual Report 23
GrainCorp Limited Directors’ Report
Page 23 of 103
Outlook The 2019 financial year will be extremely challenging for GrainCorp with expectations of a substantially smaller ECA crop due to the current drought. In response to the constrained grain availability, the Grains business is focusing on network rationalisation, cost reduction and domestic transshipments (i.e. ECA grain imports from Western Australia and South Australia).
We expect continued solid performance from Malt, with high utilisation and good demand from craft beer and distilling customers. Within the Oils business, it is expected Bulk Liquid Terminals will continue to operate at high utilisation; Foods’ focus will remain on generating operational efficiencies at West Footscray; Oilseed crush margins will again be challenged with reduced canola supply in ECA resulting from the drought.
Sustainability GrainCorp is committed to sustainable value creation. Our long-term objectives in sustainability go hand in hand with value creation for our shareholders. GrainCorp has published a 2018 Sustainability Report which can be accessed via the GrainCorp website. Below is a summary of the report’s key sections and GrainCorp’s performance for 2018.
Safety
The health and safety of our people will always be a key priority for GrainCorp. In FY18 our Recordable Injury Frequency Rate (RIFR) increased to 12.2 (FY17: 11.5) and our Lost Time Injury Frequency Rate (LTIFR) increased to 4.1 (FY17: 3.0).
GrainCorp’s Group Safety, Health and Environment Strategy Towards 2020 - a framework based on the pillars of Safety, Environment & Sustainability, Leadership & Culture, Health & Wellbeing and Risk Management - continues to guide our progress and the initiatives we pursue in this area.
During FY18 the following three areas were identified as health & safety priorities, with four-year strategies/implementation plans established for each one:
› Critical risk management
› Injury reduction
› Process safety management
Other health and safety initiatives included the following:
› Continued to roll out ‘5S’, a framework for workplace efficiency, effectiveness and safety. This program reduces the likelihood of injurydue to poorly organised workplaces.
› Piloted a program of safety conversations and leadership site visits at Grains sites in Victoria, to encourage more visible safetyleadership. This successful pilot is now being implemented in all relevant areas of the business to reinforce safe work processes.
› A review of critical safety risks is currently underway, with the first stage identifying 12 critical risks across the business. The secondstage will verify the effectiveness of risk controls to enable improvement projects to be undertaken.
› Project to identify high-potential hazard operations – i.e. those which involve processing or handling significant inventories of flammableor otherwise hazardous materials. Sites will be benchmarked against Process Safety Management best-practice standards, so that areasof weakness can be identified, and necessary improvements made to ensure loss of containment incidents are prevented.
› Mental Health First Response training was recently rolled out across all Grains regions and ports. The program is designed to educateemployees on how to better recognise the often-subtle signs of sub-optimal mental health and how to effectively assist somebody whomay be suffering.
› Safety Health Environment and Governance (SHEG) Committee member site visits commenced in FY18, with more planned forFY19, focusing on SHE risk management and initiatives.
People
GrainCorp believes that creating an optimal working environment is fundamental to our business success. This requires us to focus on building an engaged and diverse workforce, attracting and retaining talented employees, while also nurturing leadership. Activities during the year included:
› Conducted employee engagement survey, with 83% participation rate and an overall employee engagement score of 58% (down from62% last year). Initiatives are being rolled out to address concerns raised, including streamlining inefficient processes and buildingleadership capability to manage change initiatives.
For
per
sona
l use
onl
y
Directors’ Report GrainCorp Limited
24 2018 Annual Report
GrainCorp Limited Directors’ Report
Page 24 of 103
› Conducted a series of leadership courses under GrainCorp’s LEAD program (Launch, Elevate, Accelerate, Discover), with a focus onAccelerate, the component designed for senior leaders. Accelerate centres on developing customer capability and includes modules oncreating high performance teams, innovation & disruption and design thinking to promote a resilient and agile workforce.
› A new Human Capital Management System (HCMS) is being developed for rollout in 2019, replacing multiple non-integrated systemsand helping to improve people-related processes, such as including cross-sharing of talent across the organisation.
› Achieved target to fill 40% of turnover, within the top two tiers of management below the CEO, with females, in both FY17 and FY18.GrainCorp’s overall female gender workforce participation rate has increased from 21% in 2013 to 24% in 2018.
› Anti-Bullying and Harassment Training workshops were rolled out across GrainCorp to ensure employees are aware of whatconstitutes bullying and harassment and the mechanisms in place to support anyone who feels they are in a compromised position.
› iCARE, GrainCorp’s indigenous inclusion working group, ran the fifth annual Indigenous Art Auction which auctions off artwork created bystudents from participating schools in inner Sydney, Australia. Over AUD10,000 was raised, with the funds being used to supportIndigenous programs at these schools.
› Supported the Clontarf Foundation, an organisation that assists young Aboriginal and Torres Strait Islander men in gaining entry to theworkforce, with AUD30,000 in funding, as well as employment forums, pre-employment workshops and school-based traineeships. Someof the participants go on to become full-time GrainCorp employees.
› Supported Indspire, a Canadian organisation that provides scholarships to First Nation, Inuit and Metis post-secondary students, withCAD25,000 in funding. The amount was matched by the Canadian Government. Scholarship recipients are offered placements atGrainCorp facilities between semesters and are given the opportunity to become part of the Canada Malting Company’s (CMC) MaltsterTraining Program upon graduation.
Environment
Environment & Sustainability forms a key pillar of the Group Safety, Health & Environment Strategy – Towards 2020. Our overarching goal is to reduce GrainCorp’s environmental impact. To achieve this, several key priorities have been established with a focus on improvement in the areas of energy and emissions, water and waste.
Energy and emissions:
GrainCorp is committed to optimising its energy usage and reducing the carbon intensity of its operations both for environmental and economic reasons. Last year, we established a cross-business unit Energy Task Force which has been instrumental in identifying opportunities to improve energy efficiencies across the Group. Initiatives in this area include:
› Solar panels were installed at the Grains site in Wagga Wagga, NSW, in late 2017; panels are currently being installed at sites in Moreeand Junee, NSW.
› GrainCorp Oils’ Bulk Liquid Terminals site at Largs Bay in South Australia has also recently installed solar panels. The energy capturedwill result in significant electricity savings at the site, with excess energy being returned to the grid.
› The Energy Task Force is actively investigating options for renewable power purchase agreements (PPA), both direct from PPA providersand using existing network infrastructure.
› GrainCorp Oils’ West Footscray plant identified an opportunity to increase the level of heat recovery in its edible oil refinery through areconfiguration of the system. It was awarded a AUD50,000 grant for this project as part of a government program to promote energyefficiency.
› Over the last three years, GrainCorp Malt in Vancouver, Washington has taken a phased approach to improving the efficiency of itsmalting process. In 2018, the cooling process of the kilning stage was improved with the installation of more efficient dampers, resulting ina 10% reduction in electrical consumption at the site.
Water
GrainCorp Malt in Vancouver, Washington, has worked diligently in recent years to reduce the amount of water it uses in its malting process. In 2018, the team utilised new technology to upgrade its barley cleaning process, enabling a further, significant reduction in water consumption. The site has generated total water savings of more than 200 million litres/p.a. (60 million gallons/p.a.). In recognition of these efforts, Great Western Malting will be awarded the Association of Washington Business’ 2018 Manufacturing Excellence Award for Green Manufacturing.
For
per
sona
l use
onl
y

GrainCorp Limited Directors’ Report
2018 Annual Report 25
GrainCorp Limited Directors’ Report
Page 25 of 103
Waste
GrainCorp Oils’ Auscol business was the first company in Australia to specialise in the recycling of cooking oils and fats that would otherwise ultimately contribute to the pollution of our waterways. As a licensed recycler, Auscol converts cooking oil into stock feeds and bio-diesel, reducing potential damage to the environment by providing an alternative to traditional fossil fuels. In 2018, Auscol achieved International Sustainability and Carbon Certification (ISCC) accreditation, which is the highest global standard relating to environmental, social and economically sustainable supply chains.
Climate change
During the year, GrainCorp commissioned research into 23 wheat cropping districts in eastern Australia, under likely climate scenarios to 2030 and 2050, to help inform the Group’s climate change impact assessment. The initial findings suggest that, despite a predicted increase in weather volatility and occurrence of extreme weather events, eastern Australia will continue to be a productive wheat-producing region, capable of sustaining or perhaps even increasing current crop volumes and qualities. Further detail on the research is included in the Sustainability Report.
Environmental regulation
› GrainCorp is committed to compliance with all applicable environmental laws and regulations and is subject to various licences relevant to its operations. We take active measures to monitor our compliance on an operational level (periodically and on an ad hoc basis), which assists our businesses to minimise non-compliances. At Group level our environmental performance is overseen by our Safety Health Environment and Governance Committee, and we publicly report performance metrics as required.
› From time to time non-compliances are identified, notified to relevant regulatory authorities and addressed as part of routine management action. GrainCorp has not incurred any significant liabilities under Australian environmental regulation this year.
› More information on GrainCorp’s performance in relation to the environment is available at http://www.graincorp.com.au/about-graincorp/sustainability-and-environment.
Community
GrainCorp is committed to playing an active and positive role in the communities in which we live and work. Community connectedness is important both for the wellbeing of our employees and for other stakeholders in our communities.
We seek to contribute in a meaningful way through our corporate donations, silo art installations, sponsorships, fundraising and volunteering activities. Following are some of the contributions and initiatives undertaken in 2018:
› GrainCorp recently embarked on a workplace giving partnership with Rural Aid. Rural Aid delivers vital support services throughout ruraland regional communities, ranging from mobile mental health and welfare counselling, to the distribution of goods such as diesel, water,groceries and stock feed. Australian-based employees were invited to make a pre-tax donation from their pay, and GrainCorp matchedthe amount donated. A total of AUD28,000 was raised.
› Since 2015, GrainCorp has supported silo art projects with the aim of reinvigorating some of Australia’s regional towns. In addition toallowing our sites to be transformed into works of art, GrainCorp also provides media, safety, operational and legal support on theprojects. This year in Devenish, Victoria, an image of a WWI nurse was painted alongside a modern-day combat medic. The artwork is inrecognition of the changing role of women in the military and paid tribute to the town’s past community members.
› Members of the GrainCorp Malt team in Vancouver, Washington came together to support the Oregon Food Bank, a charity thatprovides food to those in need with a focus on nutrition and garden education programs.
GrainCorp Community Fund
The GrainCorp Community Fund provides financial support to organisations and projects that contribute to local community development in our operating regions around the world. During the year, key donations included:
› CAD15,000 donation to the Thunder Bay Regional Health Sciences Foundation to support its cardiovascular surgery program whereGrainCorp Malt’s Thunder Bay, Ontario site is located.
› AUD10,000 donation to the Bribbaree Show Society to install electricity. The centre is located near GrainCorp’s Temora site in NSW andserves as a recovery centre in times of disaster.
› USD13,350 donation to Fort Vancouver High School toward the purchase of protective equipment for the school’s wrestling club. Theschool is located near GrainCorp Malt’s Vancouver, Washington plant.
› AUD12,000 donation to the Portland Swimming Club, local to GrainCorp’s Portland export terminal in Victoria, toward necessary poolequipment.
For
per
sona
l use
onl
y

Directors’ Report GrainCorp Limited
26 2018 Annual Report
GrainCorp Limited Directors’ Report
Page 26 of 103
Risk
There are various risks associated with owning shares in GrainCorp. Some of these risks are specific to GrainCorp and its business while others are risks of a more general nature that apply to any stock market investment. The list of risks set out below is not exhaustive and does not consider the personal circumstances of shareholders. Shareholders should seek professional advice if they are in any doubt about the risks associated with holding shares in GrainCorp.
Risks affecting GrainCorp’s business
› Weather conditions - Weather conditions can cause variability in grain production, which may impact GrainCorp’s operating results in several ways; including variability in the volume of grain that GrainCorp stores, handles, transports, trades, exports and uses in its business, as well as by affecting the credit worthiness of agricultural producers who transact with GrainCorp. An integral aspect of GrainCorp’s strategy has been to reduce the impact on earnings of cyclical weather conditions, especially the impacts of drought. Over the past eight years the Company has been managing this exposure, diversifying its operations into downstream value adding businesses in Australia and overseas. During FY18, GrainCorp commissioned expert environmental research to better assess the potential long-term impact of predicted climate change on grain production in 23 key wheat cropping districts in eastern Australia. Further information on the climate change impact assessment can be found in GrainCorp’s 2018 Sustainability Report, available on the Company’s website.
› Other external factors - GrainCorp’s business and financial performance are subject to external factors, including farmer sowing decisions, levels of on-farm storage, domestic and international government farm support programs and policies, demand for biofuels, commodity price volatility, the outbreak of plant disease or pest and the occurrence of and resistance of pests to pesticides used to protect grain in storage.
› Regulation - GrainCorp’s business is regulated by a range of laws and regulations in countries where GrainCorp operates. GrainCorp may be subject to costs, investigations, penalties, liabilities, loss of reputation and other adverse effects as a result of failure to comply with these laws and regulations. Further, the introduction of new laws and regulations could materially adversely impact GrainCorp’s business and financial performance, for example by necessitating increased levels of expenditure on compliance, monitoring, controls, access regimes and arrangements and land use restrictions.
› Transportation - GrainCorp’s operations rely on rail and road transportation to move grain from farms into country storage sites, and from these sites to port terminals and domestic consumers. A disruption or delay in rail transportation service provision, for instance as a result of temporary or permanent rail track closures, may adversely impact GrainCorp’s operations and operating results. GrainCorp also charters vessels in and to international jurisdictions to transport products to consumers. A disruption in international shipping activities, for instance ship diversion, port blockages or acts of piracy, may adversely impact GrainCorp.
› Operational risks - GrainCorp’s business is subject to various operational risks, including claims and disputes in relation to grain or finished product inventory, machinery breakdown, supply issues, loss of long-term agreements for supply or for premises, regulatory requirements, workplace disputes and impacts of environmental obligations.
› Market demand - During times of reduced market demand for grain, GrainCorp may suspend or reduce operations and production at some of its facilities. The extent to which GrainCorp efficiently manages available capacity at its facilities will affect its profitability.
› Commodity prices - GrainCorp’s business may be adversely affected by changes in the price of commodities, additional raw materials, the cost of energy and other utility costs caused by market fluctuations beyond GrainCorp’s control, which have in the past, and could in the future, adversely affect margins.
› Hedging risk - GrainCorp engages in hedging transactions to manage risks associated with fluctuations in the price of commodities, transportation costs, energy and utility prices, interest rates and foreign currency exchange rates. However, GrainCorp’s hedging strategies may not be successful in minimising its exposure to these fluctuations. Further, it is possible that GrainCorp’s risk management policies may not successfully prevent GrainCorp’s traders from entering into unauthorised transactions that have the potential to alter or impair GrainCorp’s financial position.
› Food and feed industry risks - GrainCorp is subject to food and stockfeed industry risks such as spoilage, contamination, fumigation or treatment applications which do not meet destination requirements, incorrect grade classification, tampering or other adulteration of products, product recalls, government regulation, destination or industry standards, shifting customer and consumer preferences and concerns and potential product liability claims. These matters could adversely affect GrainCorp’s business and operating results.
› Capital requirements - GrainCorp requires significant amounts of capital to operate its business and fund capital expenditure. If GrainCorp is unable to generate sufficient cash flows or raise sufficient external financing on acceptable terms to fund these activities, GrainCorp
For
per
sona
l use
onl
y

GrainCorp Limited Directors’ Report
2018 Annual Report 27
GrainCorp Limited Directors’ Report
Page 27 of 103
may be forced to limit its operations and growth plans, which may adversely impact efficiency, productivity, competitiveness and financial results.
› Debt obligations - GrainCorp’s debt obligations are subject to certain operating, financial and other covenants. If GrainCorp fails to meet these covenants, GrainCorp may be forced to repay those debt obligations on demand. GrainCorp may also not be able to put in place new debt facilities on acceptable terms by the time existing debt facilities expire.
› Global and regional economic conditions - The level of demand for GrainCorp’s services and products is affected by global and regional demographic and macroeconomic factors, including population growth rates and changes in standards of living. A significant downturn in global economic growth, or recessionary conditions in major geographic regions, may lead to a change in consumer preferences impacting demand for grain and agricultural commodities, such as malt and flour, which could have a materially adverse effect on GrainCorp’s business and financial performance.
› Customers and suppliers - Weak global economic conditions and tight credit markets may adversely affect the financial viability of some of GrainCorp’s customers, suppliers and other counterparties, which in turn may negatively impact GrainCorp’s operations and financial performance.
› Cyber security - GrainCorp may be adversely affected by cyber security risk due to the increasing reliance on information technology systems and increased frequency and magnitude of global cyber events.
General risks
› Economic risks - General economic conditions, fluctuations in interest and inflation rates, commodity prices, currency exchange rates, energy costs, changes in governments, changes in fiscal, monetary and regulatory policies, the development of new technologies and other changes to general market conditions may have an adverse effect on GrainCorp, its future business activities and the value of GrainCorp shares.
› Market conditions - Share market conditions may affect the value of shares regardless of GrainCorp’s financial or operating performance. Share market conditions can be unpredictable and are affected by many factors including changes in investor sentiment toward particular market sectors (in particular agriculture and food supply) and the domestic and international economic outlook.
› Significant events - Significant events may occur in Australia or internationally that could impact the market for commodities relevant to GrainCorp, GrainCorp’s operations, the price of shares and the economy generally. These events include war, terrorism, civil disturbance, political actions and natural events such as earthquakes and floods.
For
per
sona
l use
onl
y

Directors’ Report GrainCorp Limited
28 2018 Annual Report
GrainCorp Limited Directors’ Report
Page 28 of 103
Additional Disclosures Earnings per share (‘EPS’) Basic EPS from continuing operations decreased 44% to 30.8 cents (2017: 54.7 cents).
Dividends Since year end the Directors have approved the payment of a fully franked final dividend totalling $18.3 million. This represents the equivalent of a final dividend of 8 cents per share on issue at the record date of 29 November 2018. The dividend will be paid on 13 December 2018.
Dividend Date Paid
Fully Franked Dividend
per Share
Total Dividend
($ M)
Final dividend for the year ended 30 September 2018 13 December 2018 8.0 cents 18.3
The following dividends on issued ordinary shares of GrainCorp have been paid since the end of the financial year 2016:
Dividend Date Paid
Fully Franked Dividend
per Share
Total Dividend
($ M)
Final dividend for the year ended 30 September 2017 14 December 2017 15.0 cents 34.3
Interim dividend for the half-year ended 31 March 2018 16 July 2018 8.0 cents 18.3
Matters subsequent to the end of the financial year No matters or circumstances have arisen since 30 September 2018 which have significantly affected or may significantly affect:
a) The Group's operations in future financial years; or b) The results of those operations in future financial years; or c) The Group’s state of affairs in future financial years.
For
per
sona
l use
onl
y

GrainCorp Limited Directors’ Report
2018 Annual Report 29
GrainCorp Limited Directors’ Report
Page 29 of 103
Indemnities and insurance Under the Company’s Constitution each Director and Company Secretary of GrainCorp Limited is, to the maximum extent permitted by law, indemnified against any liability incurred by that person as an officer of GrainCorp Limited. The Directors and the Company Secretaries listed on page 16 and individuals who formerly held any of these positions have the benefit of the indemnity. Members of GrainCorp’s Executive Team and certain former members of the Executive Team also have the benefit of an indemnity to the fullest extent permitted by law.
During the financial year, the Group has paid, or agreed to pay, premiums to insure persons who are, or have been, an officer of the Company or a related entity, or any past, present or future Director or officer of the Company, or any of its subsidiaries or related entities. The contracts prohibit disclosure of the amount of the premium paid. The liabilities insured include costs and expenses that may be incurred in defending civil or criminal proceedings that may be brought against the officers in their capacity as officers of entities in the Group.
Proceedings on behalf of the Company No proceedings have been brought or intervened in on behalf of the Company with leave of the Court under section 237 of the Corporations Act 2001.
Audit services Audit services during the year have been provided by PricewaterhouseCoopers (PwC), led by partners Kristin Stubbins and David Ronald. Details of the amounts paid to PwC for audit services are set out in note 5.1 of the Financial Report.
Non-audit services The Company may decide to employ the external auditor on assignments additional to its statutory audit duties where the auditor’s expertise and experience with the Company and/or the Group are important. Details of the amounts paid to the external auditor PwC for non-audit services provided during the year are set out in note 5.1 of the Financial Report.
In accordance with the advice received from the Board Audit Committee (‘BAC’), the Board is satisfied that the provision of non-audit services is compatible with the general standard of independence for auditors imposed by the Corporations Act 2001. The Directors are satisfied that the provision of non-audit services by the auditor did not compromise the auditor independence requirements of the Corporations Act 2001 for the following reasons:
› All non-audit services have been reviewed by the BAC to ensure they do not impact the integrity and objectivity of the auditor.
› None of the services undermine the general principles relating to auditor independence as set out in APES 110 Code of Ethics for Professional Accountants.
A copy of the external auditor’s independence declaration as required under section 307C of the Corporations Act 2001 is set out on page 43 and forms part of this report.
Corporate governance statement During the year ended 30 September 2018, the Company’s corporate governance framework was consistent with the third edition of the Corporate Governance Principles and Recommendations released by the ASX Corporate Governance Council. GrainCorp’s Corporate Governance Statement can be viewed at:
http://www.graincorp.com.au/investors-and-media/investor-information/corporate-governance
For
per
sona
l use
onl
y

Remuneration Report GrainCorp Limited
30 2018 Annual Report
GrainCorp Limited Remuneration Report
Page 30 of 103
Remuneration Report 1. Introduction Our remuneration framework aims to engage and retain key talent whilst motivating them to deliver our business strategy and key performance targets that create value for our shareholders. Importantly, we seek to ensure that remuneration is structured in a manner that also encourages the right behaviours.
In 2017, in response to stakeholder feedback, we reviewed our approach to Short-term incentives (‘STI’) to better align the interests of employees and shareholders. The volatility inherent in the agribusiness sector makes this difficult, but we believe that we have achieved this objective over the last two years.
In FY19, in order to better align remuneration with our strategy and shareholder returns, we plan to change our Long-term incentive (‘LTI’) plan to one based on two hurdles: Absolute Total Shareholder Return (‘aTSR’) and Return on Invested Capital (‘ROIC’), both measured over a three-year performance cycle. We believe that this change will result in fairer and more impactful outcomes for our people and shareholders alike. Further details of these changes have been outlined in Section 2.
The People Remuneration and Nominations Committee of the Board (‘PRNC’) regularly reviews Key Management Personnel (‘KMP’) remuneration to ensure it remains competitive with market practice. The role of the PRNC is outlined in Section 6.
2. Executive remuneration principles GrainCorp’s remuneration approach is based on the following key principles and is aimed at attracting, retaining and motivating our employees:
› Remuneration is one component of the overall value proposition GrainCorp offers to employees and complements non-cash benefits, work / life flexibility, personal skills and career development.
› Remuneration includes fixed and variable components. Remuneration outcomes are aligned to company and individual performance taking into account market benchmarks and business capacity to pay.
› GrainCorp periodically reviews market data to ensure that our remuneration structure is informed by market best practice with the following aims:
• Attract and retain high calibre employees.
• Align fixed remuneration to policy median market rates adjusted for individual capability, skill, experience, qualifications, performance, responsibilities, accountabilities and criticality of role to the business.
• Set variable remuneration and non-financial benefits to incentivise superior performance.
› Remuneration policies and pay outcomes are monitored to ensure that they are gender neutral, non-discriminatory and free from bias.
Executive KMP remuneration framework
GrainCorp’s remuneration strategy rewards Executive KMP for the delivery of the Group’s business strategy.
The diagram below provides an overview of our approach.
Rew ard for superior long-term performance, encourage retention
and alignment to shareholder interest
Remuneration components
Base salary, superannuation and benefits Annual cash
Deferred rights and cash Performance rights
Purpose Rew ard for role size/complexity, responsibility and competence
Rew ard for contribution tow ards
annual business goals
Promote retention and alignment to
shareholder interests
Remuneration structure
Total Fixed Remuneration ('TFR')
"At-risk" remuneration
Short-term incentive ('STI') Long-term incentive ('LTI')
Objective
Attract and retain executive talent
Motivate and reward outstanding performance Align to shareholder returns
For
per
sona
l use
onl
y
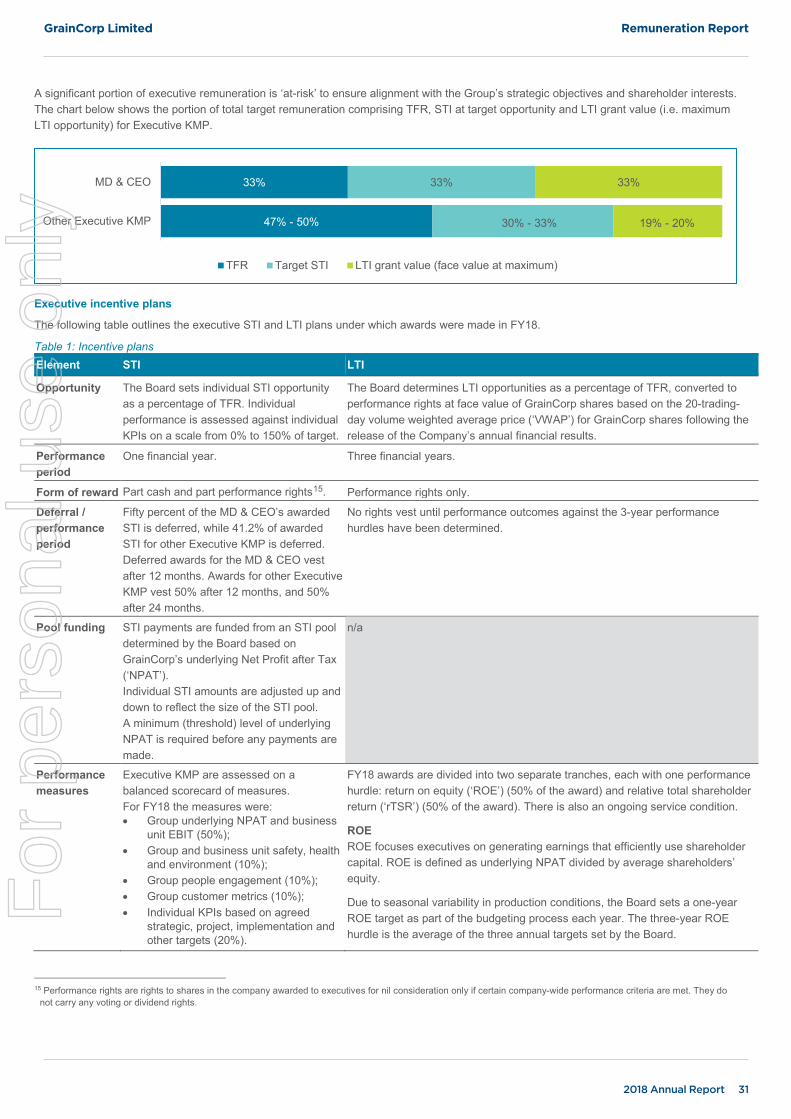
GrainCorp Limited Remuneration Report
2018 Annual Report 31
GrainCorp Limited Remuneration Report
Page 31 of 103
A significant portion of executive remuneration is ‘at-risk’ to ensure alignment with the Group’s strategic objectives and shareholder interests. The chart below shows the portion of total target remuneration comprising TFR, STI at target opportunity and LTI grant value (i.e. maximum LTI opportunity) for Executive KMP.
Executive incentive plans
The following table outlines the executive STI and LTI plans under which awards were made in FY18.
Table 1: Incentive plans Element STI LTI
Opportunity The Board sets individual STI opportunity as a percentage of TFR. Individual performance is assessed against individual KPIs on a scale from 0% to 150% of target.
The Board determines LTI opportunities as a percentage of TFR, converted to performance rights at face value of GrainCorp shares based on the 20-trading-day volume weighted average price (‘VWAP’) for GrainCorp shares following the release of the Company’s annual financial results.
Performance period
One financial year. Three financial years.
Form of reward Part cash and part performance rights15. Performance rights only.
Deferral / performance period
Fifty percent of the MD & CEO’s awarded STI is deferred, while 41.2% of awarded STI for other Executive KMP is deferred. Deferred awards for the MD & CEO vest after 12 months. Awards for other Executive KMP vest 50% after 12 months, and 50% after 24 months.
No rights vest until performance outcomes against the 3-year performance hurdles have been determined.
Pool funding STI payments are funded from an STI pool determined by the Board based on GrainCorp’s underlying Net Profit after Tax (‘NPAT’). Individual STI amounts are adjusted up and down to reflect the size of the STI pool. A minimum (threshold) level of underlying NPAT is required before any payments are made.
n/a
Performance measures
Executive KMP are assessed on a balanced scorecard of measures. For FY18 the measures were: • Group underlying NPAT and business
unit EBIT (50%); • Group and business unit safety, health
and environment (10%); • Group people engagement (10%); • Group customer metrics (10%); • Individual KPIs based on agreed
strategic, project, implementation and other targets (20%).
FY18 awards are divided into two separate tranches, each with one performance hurdle: return on equity (‘ROE’) (50% of the award) and relative total shareholder return (‘rTSR’) (50% of the award). There is also an ongoing service condition.
ROE ROE focuses executives on generating earnings that efficiently use shareholder capital. ROE is defined as underlying NPAT divided by average shareholders’ equity.
Due to seasonal variability in production conditions, the Board sets a one-year ROE target as part of the budgeting process each year. The three-year ROE hurdle is the average of the three annual targets set by the Board.
15 Performance rights are rights to shares in the company awarded to executives for nil consideration only if certain company-wide performance criteria are met. They do
not carry any voting or dividend rights.
33% 33% 33%MD & CEO
Other Executive KMP
TFR Target STI LTI grant value (face value at maximum)
47% - 50% 30% - 33% 19% - 20%
For
per
sona
l use
onl
y

Remuneration Report GrainCorp Limited
32 2018 Annual Report
GrainCorp Limited Remuneration Report
Page 33 of 103
Future changes to LTI Plan
In FY18, the Board reviewed the effectiveness of our STI and LTI schemes to ensure ongoing alignment with our strategic objectives. While the STI plan remains fit for purpose, the review found that more appropriate LTI hurdles would provide greater alignment to our business strategy and shareholder outcomes and give better line of sight for participants.
While the performance / vesting periods will not change, commencing in FY19 the performance hurdles for the LTI plan will be as follows:
› Absolute TSR (‘aTSR’) - (50%) of grant: defined as the compound annual growth rate (‘CAGR’) of the Company’s TSR over the three-year vesting period.
• This measure focuses directly on delivering a positive shareholder return and growth in value to our shareholders, regardless of broader market and other company market movements. Absolute TSR is simpler than rTSR and provides greater clarity to participants and is transparent to shareholders. Unlike rTSR, aTSR awards will not vest unless positive shareholder value has been created over the performance period. In addition, moving to aTSR removes the problem of identifying a relevant peer group for GrainCorp, given its unique business mix.
› Return on Invested Capital (‘ROIC’) – (50%) of grant: defined as earnings divided by invested capital16. An average of the three financial year ROIC outcomes is calculated to determine the ROIC over the three-year vesting period.
• This is a key metric in our strategic plan, is forward focussed and measured and reported regularly. It can be benchmarked against global peers.
The current ROE gateway will be removed.
In determining the recommended performance vesting ranges several perspectives were considered:
› Internal - annual business plans / budgets, long range or strategic plan, GrainCorp’s historic performance and management / board opinion on the key factors impacting the selected performance measures.
› External - peer group market practice and historical performance, the broader industry / market historical performance and investor expectations using analyst forecasts.
Absolute TSR
An aTSR tranche for the FY19 grant will vest as outlined in the following table.
Absolute TSR (percentile ranking) Percentage of aTSR-tested rights to vest
At or below the 6% percentile Nil
6%-9% Straight line between 50% and 100%
9% 100%
A range of 6-9% for aTSR is considered appropriate as it is:
› A significant improvement on GrainCorp’s average historic TSR performance;
› In line with the All Ordinaries Accumulation Index17; and
› A stretch on analyst forecasts of Earnings Per Share (‘EPS’) (as a proxy for aTSR).
16 ROIC earnings are Group underlying Net Profit After Tax less interest expense (after tax) associated with Core Debt. ROIC invested capital is the sum of average net
debt (excluding commodity inventory funding) and average total equity. ROIC is a non-IFRS measure. 17 Based on analysis to early 2018.
GrainCorp Limited Remuneration Report
Page 32 of 103
Element STI LTI
Performance measures, continued
Assessment of STI measures occurs following the end of the financial year, by the Board in relation to the MD & CEO, by the CEO (and approved by the PRNC) in relation to other Executive KMP. The scorecard measures, description, weighting and the Board’s assessment of performance in FY18 are provided in Table 4. The performance measures are reviewed annually to recognise that the business must respond to the changing business priorities and the significant variability in market conditions. For FY19 the measures are: • Group underlying NPAT and business
unit, EBIT (35%); • Group and business unit safety, health
and environment (15%); • Group customer metrics (15%); • Individual KPIs based on agreed
strategic project implementation and other targets (35%).
Annual ROE targets are set in November each year and disclosed in the remuneration report following the end of the performance period. One-year targets allow the Company to account for the variability in the agribusiness industry and for near-term capital management objectives. The following factors are considered by the Board in the target-setting process: • Expected earnings for each business area, overlaid with estimated
production and market conditions for the forthcoming year (i.e. harvest volumes, receivals, export demand, malt contract sales, local and government trading environments and industry and climactic conditions);
• External market forecasts (e.g. from the Australian Bureau of Agricultural Resource Economics and Sciences and Australian Crop Forecasters);
• Capital investment strategy for the forthcoming year; and • Historical ROE performance.
The proportion of rights that may vest for ROE performance will be determined by the Board, based on the following vesting schedule. Three-year average ROE performance
Percentage of ROE-tested rights to vest
Below threshold Nil
Target* 50%
Maximum 100%
*Straight line between target and maximum. Minimum ROE threshold ROE performance must exceed a minimum threshold before any of the ROE tranche may vest. The minimum ROE threshold is GrainCorp’s average ROE for the 10 years prior to the start of the relevant performance period.
Relative TSR (‘rTSR’) Relative TSR measures the percentage change in a company’s share price plus the value of dividends received during the period relative to a peer group of 100 ASX-listed companies (i.e. 50 companies above and 50 companies below GrainCorp’s market capitalisation ranking). The peer group is defined at the start of the performance period.
The proportion of rights that may vest based on TSR performance is determined by the Board, based on the following vesting schedule. Relative TSR (percentile ranking) Percentage of TSR-tested rights to
vest
At or below the 50th percentile Nil
Above the 50th and below the 75th percentile
Straight line between 50% and 100%
At or above the 75th percentile 100%
No re-testing is allowed in relation to LTI awards. Vesting of all LTI awards is subject to Board discretion.
Clawback The Board in its discretion may determine that some, or all, of an employee’s deferred STI or LTI should be forfeited for gross misconduct, material misstatement or fraud.
Cessation of employment
Subject to Board discretion incentives may: • Be forfeited for resignation or termination for cause, or • Be paid in full at their normal payment date for cessation of employment due to redundancy disability, death or retirement.
Change of control
All short and long-term deferred incentives will be paid in full on change of control, unless the Board determines otherwise.
Rights vest in full on change of control, unless the Board determine otherwise. Rights that do not vest on change of control will lapse.
For
per
sona
l use
onl
y

GrainCorp Limited Remuneration Report
2018 Annual Report 33
GrainCorp Limited Remuneration Report
Page 33 of 103
Future changes to LTI Plan
In FY18, the Board reviewed the effectiveness of our STI and LTI schemes to ensure ongoing alignment with our strategic objectives. While the STI plan remains fit for purpose, the review found that more appropriate LTI hurdles would provide greater alignment to our business strategy and shareholder outcomes and give better line of sight for participants.
While the performance / vesting periods will not change, commencing in FY19 the performance hurdles for the LTI plan will be as follows:
› Absolute TSR (‘aTSR’) - (50%) of grant: defined as the compound annual growth rate (‘CAGR’) of the Company’s TSR over the three-year vesting period.
• This measure focuses directly on delivering a positive shareholder return and growth in value to our shareholders, regardless of broader market and other company market movements. Absolute TSR is simpler than rTSR and provides greater clarity to participants and is transparent to shareholders. Unlike rTSR, aTSR awards will not vest unless positive shareholder value has been created over the performance period. In addition, moving to aTSR removes the problem of identifying a relevant peer group for GrainCorp, given its unique business mix.
› Return on Invested Capital (‘ROIC’) – (50%) of grant: defined as earnings divided by invested capital16. An average of the three financial year ROIC outcomes is calculated to determine the ROIC over the three-year vesting period.
• This is a key metric in our strategic plan, is forward focussed and measured and reported regularly. It can be benchmarked against global peers.
The current ROE gateway will be removed.
In determining the recommended performance vesting ranges several perspectives were considered:
› Internal - annual business plans / budgets, long range or strategic plan, GrainCorp’s historic performance and management / board opinion on the key factors impacting the selected performance measures.
› External - peer group market practice and historical performance, the broader industry / market historical performance and investor expectations using analyst forecasts.
Absolute TSR
An aTSR tranche for the FY19 grant will vest as outlined in the following table.
Absolute TSR (percentile ranking) Percentage of aTSR-tested rights to vest
At or below the 6% percentile Nil
6%-9% Straight line between 50% and 100%
9% 100%
A range of 6-9% for aTSR is considered appropriate as it is:
› A significant improvement on GrainCorp’s average historic TSR performance;
› In line with the All Ordinaries Accumulation Index17; and
› A stretch on analyst forecasts of Earnings Per Share (‘EPS’) (as a proxy for aTSR).
16 ROIC earnings are Group underlying Net Profit After Tax less interest expense (after tax) associated with Core Debt. ROIC invested capital is the sum of average net
debt (excluding commodity inventory funding) and average total equity. ROIC is a non-IFRS measure. 17 Based on analysis to early 2018.
For
per
sona
l use
onl
y

Remuneration Report GrainCorp Limited
34 2018 Annual Report
GrainCorp Limited Remuneration Report
Page 34 of 103
ROIC
A ROIC vesting schedule for the FY19 grants is outlined in the following table. It is important to note that the ROIC performance hurdle and relevant vesting schedule is intended to reward achievement linked to improving the Company’s ROIC performance over time.
ROIC performance Percentage of ROIC-tested rights to vest
Below minimum of performance range Nil
Minimum performance (6%) 50%
Between 6% and 8% Straight line between 50% and 100%
A range of 6% to 8% is considered appropriate as it is:
› A significant improvement on GrainCorp’s historic ROIC performance;
› Aligned to internal targets used for capital allocation purposes; and
› In line with international benchmarks.
We have back tested both these hurdles against prior grants from 2011 to 2016 and found that there would have been no material change to the vesting outcomes. The Board will keep under review the hurdles for future grants. Clawback provisions and Board discretion will be maintained.
Hedging of unvested equity awards
Executives cannot sell, transfer or otherwise deal with their rights (e.g. by using them as security for a loan). Executives may sell, transfer or deal with any shares received on vesting of their rights subject to compliance with GrainCorp’s Share Trading Policy.
Employment terms
GrainCorp’s Executive KMP are employed under common law contracts with no fixed term. Contracts may be terminated at any time, if the notice period is given. The table below outlines a summary of key employment terms for Executive KMP.
Table 2: Employment terms MD & CEO Other Executive KMP
Notice period Six months Three to six months
Termination entitlements Six months’ severance Not in excess of 52 weeks’ base salary
3. KMP In FY18, KMP comprised the non-executive directors (‘NED’), the MD & CEO and Group Executives who reported to the CEO, led significant parts of the business, and were responsible for key business decisions, as consistent with the Australian Accounting Standards Board 124 Related Party Disclosures (‘AASB 124’) definition.
All incumbents were employed in their respective positions for the duration of the financial year.
This report incorporates the disclosure requirements of AASB 124, as well as those prescribed by the Corporations Act 2001. Details of equity holdings, loans and other transactions with respect to KMP are disclosed in Section 8 of this report.
There have been no changes to the KMP after the reporting date and before the date of signing this report18.
18 Note that the President and CEO, GrainCorp Malt will be retiring effective 31 December 2018.
For
per
sona
l use
onl
y

GrainCorp Limited Remuneration Report
2018 Annual Report 35
GrainCorp Limited Remuneration Report
Page 35 of 103
4. Executive KMP remuneration outcomes This section details the FY18 KMP remuneration outcomes.
TFR adjustments
At the start of FY18, the Board reviewed the TFR of each of the Executive KMP. As a result, each Executive KMP received a fixed remuneration increase between 0% and 3%, and the MD & CEO did not receive a fixed remuneration increase.
STI outcomes
Following changes to the STI Plan from FY17, STI outcomes were better aligned with Group underlying NPAT and business unit results delivered (see Table 9). Executive KMP STI outcomes ranged from 59% to 75% of target STI. More details on the STI outcomes has been outlined in Section 5. The current STI structure is outlined in Section 2.
LTI LTI awards relating to the 2016 financial year (‘FY16’) lapsed, with no vesting occurring for the relative TSR performance hurdle measured over the three-year performance period to 30 September 2018. Although the 3-year average ROE performance was above the target range, the 10-year average minimum ROE threshold was not met, therefore none of the FY16 LTI grant vested. Further information on the performance against the LTI hurdles can be seen in Section 5.
For
per
sona
l use
onl
y

Remuneration Report GrainCorp Limited
36 2018 Annual Report
GrainCorp Limited Remuneration Report
Page 36 of 103
Remuneration outcomes for FY18 Remuneration for Executive KMP for FY18 and FY17 is shown in the table below.
Table 3: Statutory executive KMP remuneration disclosures
Year
Short-term benefits Post-employment Other long-term benefits19 Additional Information B
ase
sala
ry a
nd
fees
Non
-mon
etar
y be
nefit
s20
STI c
ash21
Supe
rann
uatio
n be
nefit
s
Term
inat
ion
bene
fits
STI d
efer
ral
LTI a
war
ds
Long
ser
vice
le
ave
Tota
l
Less
: cu
rren
t yea
r ac
crua
ls22
Add
: pre
viou
sly
accr
ued
amou
nts
vest
ed in
cur
rent
ye
ar23
Act
ual
rem
uner
atio
n rece
ived
in F
Y18
$'000 $'000 $'000 $'000 $'000 $'000 $'000 $'000 $'000 $'000 $'000 $'000
Current Executive KMP
M L Palmquist
2018 1,319 126 410 - - 557 521 21 2,954 (1,099) 828 2,683
2017 1,288 116 817 - - 716 464 21 3,422 (1,201) 521 2,742
A G Bell
2018 612 - 146 21 - 135 102 11 1,027 (248) 161 940
2017 616 - 283 20 - 174 90 10 1,193 (274) 156 1,075
G A Friberg24
2018 656 18 206 10 - 196 107 - 1,193 (303) 242 1,132
2017 632 18 358 8 - 266 93 - 1,375 (359) 256 1,272
K Pamminger
2018 688 - 171 26 - 292 104 18 1,299 (414) 170 1,055
2017 548 - 342 29 - 308 87 10 1,324 (405) 215 1,134
S J Tainsh
2018 593 - 149 25 - 127 105 4 1,003 (236) 144 911
2017 593 - 266 32 - 157 91 (8) 1,131 (240) 141 1,032
Former Executive KMP
A N Johns25
2018 - - - - - - - - - - - -
2017 488 - 304 26 - 183 74 22 1,097 (279) 188 1,006
Total 2018 3,868 144 1,082 82 - 1,307 939 54 7,476 (2,300) 1,545 6,721
2017 4,165 134 2,370 115 - 1,804 899 55 9,542 (2,758) 1,477 8,261
19 The value of STI deferral and LTI awards represents the accounting value, rather than the cash value to participants. It includes the value of equity grants for LTI Plan and Deferred Equity Plans (DEP).
20 Non-monetary benefits provided include the gross value of items such as airline flights, accommodation, health insurance, and tax advice. 21 The accounting value of short-term incentive deferred share rights / deferred cash is reflected in the ‘STI deferral’ column. 22 The value of current year accruals represents the accounting value for share based payments, deferred cash and long service leave. 23 The value of previously accrued amounts vested in current year represents long service leave and deferred incentives vested during the year. 24 Mr Friberg’s remuneration has been converted from USD to AUD based on a rate of $0.7607 (average rate from 1 October 2017 to 30 September 2018) except for STI
amounts, which have been converted based on rate of $0.7223 (spot rate on 28 September 2018). 25 Mr Johns’ 2017 remuneration in this table is prorated to reflect his time as a KMP which ceased on 31 August 2017.
For
per
sona
l use
onl
y

GrainCorp Limited Remuneration Report
2018 Annual Report 37
GrainCorp Limited Remuneration Report
Page 37 of 103
5. Company performance and remuneration outcomes STI awarded in FY18
The table below outlines Executive KMP performance against scorecard measures in FY18.
Table 4: FY18 STI performance ratings
Executive KMP
Financial measures weighting (%) and
performance
Safety, health and environment
weighting (%) and performance
Customer weighting (%) and performance
People weighting (%) and
performance
Non-financial weighting (%)
and performance.
Agreed objectives
include talent management,
project completion
Name Position Title
Group Underlying
NPAT
Business Unit
EBIT/PBT
Group Safety RIFR
Business Unit Safety
RIFR/ Environment
Group Customer
NPS
Business Unit
Customer NPS/
Detractor Conversion
Group People
Engagement
Business Unit/Function
People Engagement
Current Executive KMP
M L Palmquist MD & CEO
(50%) - (10%) - (5%) (5%) (10%) - (20%)
A G Bell CFO
(50%) - (10%) - (5%) (5%) (3%) (7%) (20%)
G A Friberg President and CEO GrainCorp Malt
(30%) (20%) (3%) (5%) (2%)
(3%) (3.5%) (3.5%)
(3%) (7%) (20%)
K Pamminger GGM Grains
(30%) (20%) (3%) (5%) (2%)
(3%) (3.5%) (3.5%)
(3%) (7%) (20%)
S J Tainsh GGM GrainCorp Oils
(30%) (20%) (3%) (5%) (2%)
(3%) (3.5%) (3.5%)
(3%) (7%) (20%)
Minimum performance threshold not achieved
Threshold performance achieved
Target performance achieved Stretch performance achieved
FY18 STI outcomes
The table below outlines FY18 STI outcomes.
Table 5: FY18 STI outcomes
STI award as % of fixed
remuneration STI award as %
of target STI award ($’000s)
Cash payment ($’000s)
Deferred amount ($’000s)26
STI forfeited as
% of target STI
Executive KMP M L Palmquist 65 65 821 410 411 35
A G Bell 39 66 248 146 102 34
G A Friberg27 52 75 351 206 145 25
K Pamminger 41 59 290 171 119 41
S J Tainsh 41 59 253 149 104 41 26 The STI deferred amount represents the portion earned in FY18 that is to be deferred into performance rights for all Executive KMP. The amounts presented differ from
the statutory disclosures that are prepared in accordance with the accounting standards in Section 4 of this report. 27 Converted from USD to AUD based on a rate of $0.7223 (spot rate on 28 September 2018).
For
per
sona
l use
onl
y

Remuneration Report GrainCorp Limited
38 2018 Annual Report
GrainCorp Limited Remuneration Report
Page 38 of 103
FY18 LTI vesting
Performance against the relative TSR and ROE performance hurdles are outlined in the tables below.
Each of the performance hurdles, TSR and ROE, are weighted equally at 50:50.
Table 6: FY16 LTI TSR performance measure results TSR percentile ranking Percentage of grant vesting
13th percentile 0%
Table 7: FY16 LTI ROE performance results
Financial year Minimum of ROE
target range Maximum of ROE
target range Actual ROE
performance Percentage of grant vesting
2016 2.7% 3.0% 3.0% -
2017 5.3% 5.8% 7.8% -
2018 2.3% 2.5% 3.7% -
3-year average 3.4% 3.8% 4.8% -
10-year average minimum ROE threshold 7.8% 4.8% 0%
Table 8: FY16 LTI remuneration outcomes
Amount granted (number of rights) % of grant that vested % of grant that was forfeited
Current Executive KMP
M L Palmquist 151,291 - 100%
A G Bell 29,520 - 100%
G A Friberg 30,698 - 100%
K Pamminger 25,913 - 100%
S J Tainsh 27,450 - 100%
Five-year financial performance GrainCorp’s performance on key metrics of sustainable value creation for the past five financial years is summarised below.
Table 9: Historical company financial performance 2018 2017 2016 2015 2014
Underlying NPAT $M 71 142 53 45 95
Statutory NPAT $M 71 125 31 32 50
Basic EPS cents 30.8 54.7 13.5 14.0 22.0
Total dividends per share cents 16 30 11 10 20
Closing share price (30 September) $ 7.90 8.16 7.85 9.05 8.55
6. Executive remuneration governance
Role of the PRNC
The PRNC assists the Board to ensure GrainCorp’s remuneration approach aligns with business strategy and the interests of our shareholders. The PRNC reviews proposals made by management and makes recommendations to the Board on individual remuneration arrangements, target-setting, performance assessment, and succession planning. The PRNC’s role, responsibilities and membership are set out in the PRNC Charter on the GrainCorp website.
External advice
To ensure that the Board’s remuneration decisions are fully informed, the PRNC receives input and advice from an external remuneration advisor, Ernst & Young (‘EY’), other external sources and from management. EY’s engagement terms include protocols to maintain its independence.
During the year, EY provided the PRNC and Board with general advice on various remuneration matters. None of the advice provided by EY during the year included a remuneration recommendation as defined in the Corporations Amendment (Improving Accountability on Directors and Executive Remuneration) Act 2011.
For
per
sona
l use
onl
y
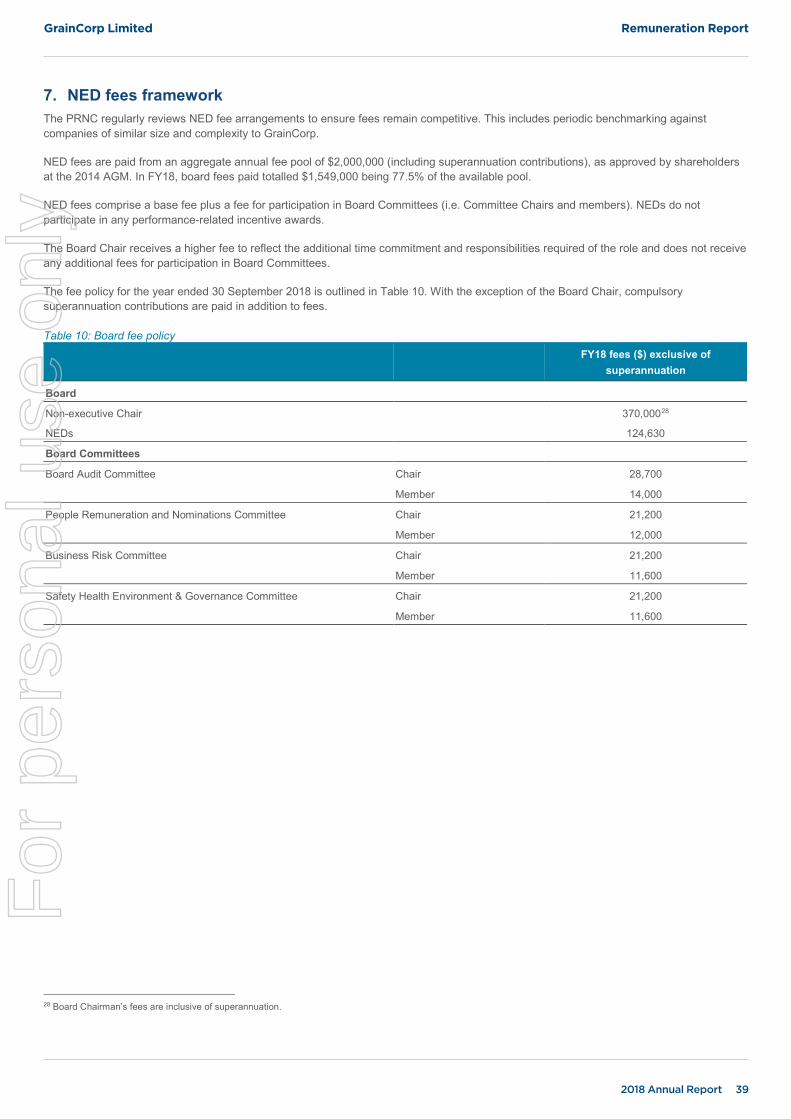
GrainCorp Limited Remuneration Report
2018 Annual Report 39
GrainCorp Limited Remuneration Report
Page 39 of 103
7. NED fees framework The PRNC regularly reviews NED fee arrangements to ensure fees remain competitive. This includes periodic benchmarking against companies of similar size and complexity to GrainCorp.
NED fees are paid from an aggregate annual fee pool of $2,000,000 (including superannuation contributions), as approved by shareholders at the 2014 AGM. In FY18, board fees paid totalled $1,549,000 being 77.5% of the available pool.
NED fees comprise a base fee plus a fee for participation in Board Committees (i.e. Committee Chairs and members). NEDs do not participate in any performance-related incentive awards.
The Board Chair receives a higher fee to reflect the additional time commitment and responsibilities required of the role and does not receive any additional fees for participation in Board Committees.
The fee policy for the year ended 30 September 2018 is outlined in Table 10. With the exception of the Board Chair, compulsory superannuation contributions are paid in addition to fees.
Table 10: Board fee policy
FY18 fees ($) exclusive of
superannuation
Board
Non-executive Chair 370,00028
NEDs 124,630
Board Committees
Board Audit Committee Chair 28,700
Member 14,000
People Remuneration and Nominations Committee Chair 21,200
Member 12,000
Business Risk Committee Chair 21,200
Member 11,600
Safety Health Environment & Governance Committee Chair 21,200
Member 11,600
28 Board Chairman’s fees are inclusive of superannuation.
For
per
sona
l use
onl
y

Remuneration Report GrainCorp Limited
40 2018 Annual Report
GrainCorp Limited Remuneration Report
Page 40 of 103
Remuneration for Non-Executive KMP for FY18 and FY17 is shown in the table below.
Table 11: Statutory NED remuneration disclosures
Year Base salary and fees
$'000 Superannuation
benefits $'000 Other Benefits
$'000 Total $'000
Non-executive Directors
G J Bradley 2018 350 20 - 370
201729 165 10 - 175
R P Dee-Bradbury 2018 160 15 - 175
2017 154 15 - 169
B J Gibson 2018 157 15 - 172
2017 154 15 - 169
P J Housden 2018 165 16 - 181
2017 154 15 - 169
D J Mangelsdorf 2018 160 15 - 175
2017 154 15 - 169
D G McGauchie 2018 137 13 - 150
2017 133 13 - 146
P I Richards 2018 150 14 - 164
2017 144 14 - 158
S L Tregoning 2018 148 14 - 162
2017 144 14 - 158
Former KMP
D C Taylor 2018 - - - -
2017 197 18 22930 444
Total 2018 1,427 122 - 1,549
2017 1,399 129 229 1,757
8. Shareholdings and other mandatory disclosures Movement of rights held during the reporting period Details of the movement in performance rights in the Company, during the reporting period are detailed in the table below.
Table 12: Movement of performance rights during FY18
Balance at the start of
the year
Granted during the year as
compensation Exercised during
the year
Forfeited or lapsed during
the year
Balance at the end of
the year
Vested and exercisable
at the end of the year
Current Executive KMP
M L Palmquist 361,037 267,189 63,841 151,291 413,094 104,802
A G Bell 84,527 57,820 19,074 29,520 93,753 20,429
G Friberg 106,256 65,957 31,372 30,698 110,143 30,660
K Pamminger 73,747 66,713 13,167 25,913 101,380 21,563
S J Tainsh 80,803 57,150 17,261 27,450 93,242 18,222
29 Part year only. 30 Other benefits provided to Mr Taylor include annual leave accrued from his time as Interim CEO (2 December 2013 to 22 December 2014) and a legacy retirement
benefit, both paid on termination.
For
per
sona
l use
onl
y

GrainCorp Limited Remuneration Report
2018 Annual Report 41
GrainCorp Limited Remuneration Report
Page 41 of 103
Number and value of rights granted, vested and forfeited under the deferred STI and LTI awards Details of the rights granted as remuneration and held, and vesting profile as at 30 September 2018 for each Executive KMP is presented in the table below. Rights are granted for nil consideration (i.e. zero exercise price) and automatically vest following performance testing (i.e. do not need to be exercised).
No performance rights vest if the conditions are not satisfied, hence minimum value yet to vest is nil. The maximum value of the grants yet to vest has been determined as the amount of the grant date fair value that is yet to be expensed.
Table 13: Number of rights granted, vested and forfeited during FY18
Equity granted Vested in FY18
Plan31,32 Number of
rights Grant date
Fair value at
grant $'000
Financial year in which rights may
vest
Maximum fair value
yet to vest $'000
Vested in the year
(%)
Forfeited in the year
(%)
Number of
ordinary shares
Current Executive KMP
M L Palmquist LTI 2018 162,387 22-Feb-18 709 2020 568 - - -
DEP 2017 104,802 31-Jan-18 760 2018 - 100% - 104,802
LTI 2017 145,905 2-Mar-17 918 2019 306 - - -
LTI 2016 151,291 18-Dec-15 787 2018 - - 100% -
A G Bell LTI 2018 32,359 22-Feb-18 141 2020 113 - - -
DEP 2017 25,461 31-Jan-18 182 2018 and 2019 30 50% - 12,731
LTI 2017 28,235 2-Mar-17 178 2019 59 - - -
DEP 2016 15,397 24-Jan-17 141 2018 - 50% - 7,698
LTI 2016 29,520 18-Dec-15 154 2018 - - 100% -
G A Friberg LTI 2018 32,697 22-Feb-18 143 2020 114 - - -
DEP 2017 33,260 31-Jan-18 237 2018 and 2019 40 50% - 16,630
LTI 2017 30,156 2-Mar-17 190 2019 63 - - -
DEP 2016 28,061 24-Jan-17 257 2018 - 50% - 14,030
LTI 2016 30,698 18-Dec-15 160 2018 - - 100% -
K Pamminger LTI 2018 35,943 22-Feb-18 157 2020 126 - - -
DEP 2017 30,770 31-Jan-18 220 2018 and 2019 37 50% - 15,385
LTI 2017 28,489 2-Mar-17 179 2019 60 - - -
DEP 2016 12,357 24-Jan-17 113 2018 - 50% - 6,178
LTI 2016 25,913 18-Dec-15 135 2018 - - 100% -
S J Tainsh LTI 2018 33,211 22-Feb-18 145 2020 116 - - -
DEP 2017 23,939 31-Jan-18 171 2018 and 2019 28 50% - 11,970
LTI 2017 29,840 2-Mar-17 188 2019 63 - - -
DEP 2016 12,505 24-Jan-17 114 2018 - 50% - 6,252
LTI 2016 27,450 18-Dec-15 143 2018 - - 100% -
31 LTI refers to Long-term incentive plan. DEP refers to Deferred Equity Plan. 32 DEP 2018 for Executive KMP will be granted following the 20-trading-day VWAP period after the announcement of results and will therefore be reported in the FY19
report.
For
per
sona
l use
onl
y

Remuneration Report GrainCorp Limited
42 2018 Annual Report
GrainCorp Limited Remuneration Report
Page 42 of 103
Shares held by KMP KMP have a relevant interest in the following number of shares in the Company as at the date of this report.
Table 14: Number of shares held by KMP
Name Balance at the start of
the year
Received during the year on exercise of
rights Other changes during
the year Balance at the end of
the year
Non-executive Directors
G J Bradley 5,000 - 28,500 33,500
R P Dee-Bradbury 4,100 - 10,000 14,100
B J Gibson 7,000 - - 7,000
P J Housden 8,083 - - 8,083
D J Mangelsdorf 15,528 - - 15,528
D G McGauchie 88,957 - - 88,957
P I Richards 5,000 - 5,000 10,000
S L Tregoning 14,465 - 15,535 30,000
Executive KMP M L Palmquist 19,679 63,841 40,000 123,520
Other Executive KMP A G Bell 41,543 19,074 - 60,617
G Friberg 23,775 31,372 (43,970) 11,177
K Pamminger 2,368 13,167 (15,533) 2
S J Tainsh 19,247 17,261 - 36,508
Loans to KMP and their related parties No loans were provided to KMP or their related parties as at the date of this report.
G J Bradley AM Chairman
Sydney 15 November 2018
For
per
sona
l use
onl
y

Auditor’s Independence Declaration GrainCorp Limited
2018 Annual Report 43
PricewaterhouseCoopers, ABN 52 780 433 757 One International Towers Sydney, Watermans Quay, Barangaroo NSW 2000, GPO BOX 2650 Sydney NSW 2001 T: +61 2 8266 0000, F: +61 2 8266 9999, www.pwc.com.au Level 11, 1PSQ, 169 Macquarie Street, Parramatta NSW 2150, PO Box 1155 Parramatta NSW 2124 T: +61 2 9659 2476, F: +61 2 8266 9999, www.pwc.com.au Liability limited by a scheme approved under Professional Standards Legislation.
Auditor’s Independence Declaration As lead auditor for the audit of GrainCorp Limited for the year ended 30 September 2018, I declare that to the best of my knowledge and belief, there have been:
(a) no contraventions of the auditor independence requirements of the Corporations Act 2001 in relation to the audit; and
(b) no contraventions of any applicable code of professional conduct in relation to the audit.
This declaration is in respect of GrainCorp Limited and the entities it controlled during the period.
Kristin Stubbins Partner Sydney PricewaterhouseCoopers 15 November 2018
For
per
sona
l use
onl
y

2018 Financial Report GrainCorp Limited
44 2018 Annual Report
GrainCorp Limited 2018 Financial Report
Page 44 of 103
2018 Financial Report 2018 Financial Report 44 Consolidated Income Statement 45 Consolidated Statement of Comprehensive Income 46 Consolidated Statement of Financial Position 47 Consolidated Statement of Changes in Equity 48 Consolidated Statement of Cash Flows 49
Notes to the Financial Statements 50 About this Report 50 1 Group Performance 52 1.1 Segment information 52 1.2 Revenue 54 1.3 Other income 54 1.4 Other expenses 55 1.5 Significant items 55 1.6 Taxation 56 1.7 Earnings per share 58 2 Capital and Financial Risk Management 59 2.1 Borrowings 59 2.2 Cash and cash equivalents 61 2.3 Contributed equity 62 2.4 Dividends 62 2.5 Commitments and guarantees 63 2.6 Derivative financial instruments and risk management 64 3 Operating Assets and Liabilities 72 3.1 Trade and other receivables 72 3.2 Inventories 73 3.3 Property, plant and equipment 74 3.4 Intangible assets 76 3.5 Trade and other payables 77 3.6 Provisions 78 3.7 Retirement benefit obligations 79 4 Group Structure 82 4.1 Subsidiaries 82 4.2 Deed of cross guarantee 84 4.3 Parent entity financial information 86 4.4 Investments accounted for using the equity method 87 4.5 Related party transactions 88 5 Other 90 5.1 Remuneration of auditor 90
5.2 Share-based payments 90
5.3 Events subsequent to reporting date 92
5.4 Impact of new and revised accounting standards 92
For
per
sona
l use
onl
y

GrainCorp Limited 2018 Financial Report
2018 Annual Report 45
GrainCorp Limited 2018 Financial Report
Page 45 of 103
Consolidated Income Statement For the year ended 30 September 2018
Note 2018 $ M
2017 $ M
Revenue 1.2 4,253.1 4,575.7 Other income 1.3 60.7 93.0 Goods purchased for resale (2,407.4) (2,466.1) Raw materials and consumables used (1,060.9) (1,150.2) Employee benefits expense 1.4 (345.6) (395.3) Finance costs (45.7) (41.7) Depreciation and amortisation 3.3,3.4 (153.2) (145.8) Operating leases (64.4) (79.0) Repairs and maintenance (32.4) (50.4) Other expenses 1.4 (129.3) (155.3) Share of results of investments accounted for using the equity method 4.4 (1.3) (0.2) Profit before income tax 73.6 184.7 Income tax expense 1.6 (3.1) (59.5) Profit for the year 70.5 125.2 Profit for the year attributable to: Equity holders of the parent entity Non-controlling interest (NCI)
70.5
-
125.2
- 70.5 125.2
Note Cents Cents
Earnings per share Basic earnings per share 1.7 30.8 54.7 Diluted earnings per share 1.7 30.6 54.5 The above consolidated income statement should be read in conjunction with the accompanying notes.
For
per
sona
l use
onl
y

2018 Financial Report GrainCorp Limited
46 2018 Annual Report
GrainCorp Limited 2018 Financial Report
Page 46 of 103
Consolidated Statement of Comprehensive Income For the year ended 30 September 2018
Note 2018 $ M
2017 $ M
Profit for the year 70.5 125.2 Other comprehensive income Items that will not be reclassified to profit and loss: Remeasurements of retirement benefit obligations 3.7 15.5 12.7 Income tax relating to these items 1.6 (2.9) (2.9) Items that may be reclassified to profit and loss: Changes in fair value of cash flow hedges (8.0) 28.6 Income tax relating to these items 1.6 3.1 (6.8) Exchange differences on translation of foreign operations 56.5 2.1 Other comprehensive income for the year, net of tax 64.2 33.7 Total comprehensive income for the year attributable to owners of GrainCorp Limited 134.7 158.9 Total comprehensive income for the year attributable to: Equity holders of the parent entity Non-controlling interest (NCI)
134.7
-
158.9
- 134.7 158.9 The above consolidated statement of comprehensive income should be read in conjunction with the accompanying notes.
For
per
sona
l use
onl
y

GrainCorp Limited 2018 Financial Report
2018 Annual Report 47
GrainCorp Limited 2018 Financial Report
Page 47 of 103
Consolidated Statement of Financial Position As at 30 September 2018
Note 2018 $ M
2017 $ M
Current assets Cash and cash equivalents 2.2 370.9 388.9 Trade and other receivables 3.1 528.1 466.2 Inventories 3.2 824.5 579.1 Derivative financial instruments 2.6 128.5 56.6 Assets classified as held for sale 3.3 14.7 12.1 Current tax assets 9.7 16.0 Total current assets 1,876.4 1,518.9 Non-current assets Trade and other receivables 3.1 2.3 1.1 Derivative financial instruments 2.6 7.2 8.2 Investments in other entities 5.8 3.9 Deferred tax assets 1.6 29.7 37.6 Property, plant and equipment 3.3 1,514.3 1,500.5 Intangible assets 3.4 502.9 494.5 Retirement benefit asset 3.7 5.2 2.6 Investments accounted for using the equity method 4.4 30.9 31.1 Total non-current assets 2,098.3 2,079.5 Total assets 3,974.7 3,598.4 Current liabilities Trade and other payables 3.5 408.8 357.8 Borrowings 2.1 537.9 336.6 Derivative financial instruments 2.6 121.2 53.8 Current tax liabilities 1.5 1.7 Provisions 3.6 58.5 60.3 Total current liabilities 1,127.9 810.2 Non-current liabilities Trade and other payables 3.5 44.5 48.9 Borrowings 2.1 762.9 748.4 Derivative financial instruments 2.6 6.9 8.7 Deferred tax liabilities 1.6 68.5 80.6 Provisions 3.6 10.0 11.8 Retirement benefit obligations 3.7 11.8 29.4 Total non-current liabilities 904.6 927.8 Total liabilities 2,032.5 1,738.0 Net assets 1,942.2 1,860.4 Equity Contributed equity 2.3 1,344.5 1,343.8 Reserves 117.6 64.3 Retained earnings 480.1 450.8 Equity attributable to equity holders of the parent entity 1,942.2 1,858.9 Non-controlling interest (NCI) - 1.5 Total equity 1,942.2 1,860.4 The above consolidated statement of financial position should be read in conjunction with the accompanying notes.
For
per
sona
l use
onl
y

2018 Financial Report GrainCorp Limited
48 2018 Annual Report
GrainCorp Limited 2018 Financial Report
Page 48 of 103
Consolidated Statement of Changes in Equity For the year ended 30 September 2018
Hedging reserve
$ M
Capital reserve
$ M
Share option
reserve $ M
Translation reserve
$ M
Total reserves
$ M
Contributed equity
$ M
Retained earnings
$ M NCI $ M
Total equity
$ M
As at 30 September 2016 (15.6) 8.3 4.2 40.9 37.8 1,346.1 358.1 - 1,742.0 Profit for the year - - - - - - 125.2 - 125.2 Other comprehensive income: Exchange difference on translation of foreign operations
0.3 - - 1.8 2.1 - - - 2.1
Changes in fair value of cash flow hedges 28.6 - - - 28.6 - - - 28.6 Remeasurements of retirement benefit obligations
- - - - - - 12.7 - 12.7
Deferred tax expense (6.8) - - - (6.8) - (2.9) - (9.7) Total other comprehensive income 22.1 - - 1.8 23.9 - 9.8 - 33.7 Total comprehensive income 22.1 - - 1.8 23.9 - 135.0 - 158.9 Transactions with owners: Dividends paid (note 2.4) - - - - - - (42.3) - (42.3) Share-based payments (note 5.2) - - 4.4 - 4.4 - - - 4.4 Less: Treasury shares vested to employees - - (1.8) - (1.8) 1.8 - - - Treasury shares purchased - - - - - (4.1) - - (4.1) Total transactions with owners - - 2.6 - 2.6 (2.3) (42.3) - (42.0) Transactions with non-controlling interest (NCI):
Change in ownership interest - - - - - - - 1.5 1.5 As at 30 September 2017 6.5 8.3 6.8 42.7 64.3 1,343.8 450.8 1.5 1,860.4 Profit for the year - - - - - - 70.5 - 70.5 Other comprehensive income: Exchange difference on translation of foreign operations
0.1 - - 57.6 57.7 - (1.2) - 56.5
Changes in fair value of cash flow hedges (8.0) - - - (8.0) - - - (8.0) Remeasurements of retirement benefit obligations
- - - - - - 15.5 - 15.5
Deferred tax credit / (expense) 3.1 - - - 3.1 - (2.9) - 0.2 Total other comprehensive income (4.8) - - 57.6 52.8 - 11.4 - 64.2 Total comprehensive income (4.8) - - 57.6 52.8 - 81.9 - 134.7 Transactions with owners: Dividends paid (note 2.4) - - - - - - (52.6) - (52.6) Share-based payments (note 5.2) - - 3.9 - 3.9 - - - 3.9 Less: Treasury shares vested to employees - - (3.4) - (3.4) 3.4 - - - Treasury shares purchased - - - - - (2.7) - - (2.7) Total transactions with owners - - 0.5 - 0.5 0.7 (52.6) - (51.4) Transactions with non-controlling interest (NCI):
Change in ownership interest - - - - - - - (1.5) (1.5) As at 30 September 2018 1.7 8.3 7.3 100.3 117.6 1,344.5 480.1 - 1,942.2
The above consolidated statement of changes in equity should be read in conjunction with the accompanying notes.
For
per
sona
l use
onl
y

GrainCorp Limited 2018 Financial Report
2018 Annual Report 49
GrainCorp Limited 2018 Financial Report
Page 49 of 103
Consolidated Statement of Cash Flows For the year ended 30 September 2018
Note 2018 $ M
2017 $ M
Cash flows from operating activities
Receipts from customers 4,630.5 4,824.1
Payments to suppliers and employees (4,626.0) (4,505.3)
4.5 318.8
Proceeds from bank loans – inventory funding 223.6 42.2
Interest received 2.9 2.4
Interest paid (45.3) (41.9)
Income taxes paid (2.4) (21.0)
Net inflow from operating activities 2.2 183.3 300.5
Cash flows from investing activities
Payments for property, plant and equipment (123.2) (199.7)
Payments for computer software (18.7) (26.5)
Proceeds from sale of property, plant and equipment 17.2 34.8
Proceeds from sale of investments / business - 106.6
Payments for investment / business (net of cash acquired) (1.9) (35.6)
Dividends received - 83.2
Net outflow from investing activities (126.6) (37.2)
Cash flows from financing activities
Proceeds from borrowings 686.0 941.0
Repayment of borrowings (715.5) (1,080.7)
Dividends paid 2.4 (52.6) (42.3)
Non-controlling interest (NCI) - 1.5
Treasury shares purchased (2.7) (4.1)
Net outflow from financing activities (84.8) (184.6)
Net (decrease) / increase in cash and cash equivalents (28.1) 78.7
Cash and cash equivalents at the beginning of the year 388.9 307.6
Effects of exchange rate changes on cash and cash equivalents 10.1 2.6
Cash and cash equivalents at the end of the year 2.2 370.9 388.9 The above consolidated statement of cash flows should be read in conjunction with the accompanying notes.
For
per
sona
l use
onl
y

Notes to the Financial Statements GrainCorp Limited
50 2018 Annual Report
GrainCorp Limited Notes to the Financial Statements
Page 50 of 103
Notes to the Financial Statements For the year ended 30 September 2018
About this Report The financial report includes consolidated financial statements for GrainCorp Limited (‘GrainCorp’ or the ‘Company’) and its controlled entities (collectively the ‘Group’). GrainCorp Limited is a company incorporated and domiciled in Australia, limited by shares which are publicly traded on the Australian Securities Exchange.
The financial report of GrainCorp Limited for the period ended 30 September 2018 was authorised for issue in accordance with a resolution of the Directors on 15 November 2018. The Directors have the power to amend and reissue the financial report.
a) Basis of preparation
This general purpose financial report:
i. has been prepared in accordance with the requirements of the Corporation Act 2001, Australian Accounting Standards (AASB) and other authoritative pronouncements of AASB and International Financial Reporting Standards (IFRS) as issued by the International Accounting Standards Board;
ii. is presented in Australian dollars, with all values rounded off to the nearest 10th of a million dollars unless otherwise indicated, in accordance with ASIC Corporations (Rounding in Financial/Director’s Report) Instrument 2016/191;
iii. is presented under the historical cost basis apart from derivative financial instruments and commodity inventories which are measured at fair value;
iv. presents reclassified comparative information where necessary to conform to changes in the current year; and
v. does not early adopt any Australian Accounting Standards and Interpretations that have been issued or amended but are not yet effective.
b) Key judgements and estimates
In applying the Group’s accounting policies, management has made a number of judgements and applied estimates of future events. Judgement and estimations which are material to the financial report relate to the following areas:
Note
Taxation
Derivative financial instruments
Intangible assets
Provisions
Retirement benefit obligations
1.6
2.6
3.4
3.6
3.7
For
per
sona
l use
onl
y

GrainCorp Limited Notes to the Financial Statements
2018 Annual Report 51
GrainCorp Limited Notes to the Financial Statements
Page 51 of 103
c) Significant accounting policies Accounting policies are selected and applied in a manner that ensures that the resulting financial information satisfies the concepts of relevance and reliability, thereby ensuring that the substance of the underlying transactions or other events is reported. Other significant accounting policies are disclosed in the notes to the financial report to which they relate.
i. Foreign currency
Transactions, assets and liabilities denominated in foreign currencies are translated into Australian dollars at reporting date using the following applicable exchange rates:
Foreign currency amount Applicable exchange rate
Transactions
Monetary assets and liabilities
Non-monetary assets and liabilities carried at fair value
Date of transaction
Reporting date
Date fair value is determined
Foreign exchange gains and losses resulting from translation are recognised in the consolidated statement of comprehensive income, except for qualifying cash flow hedges which are deferred to equity.
On consolidation, the assets, liabilities, income and expenses of foreign operations are translated into Australian dollars using the following applicable exchange rates:
Foreign currency amount Applicable exchange rate
Income and expenses
Assets and liabilities
Equity
Reserves
Average exchange rate
Reporting date
Historical date
Reporting date
Foreign exchange differences resulting from translation are initially recognised in the foreign currency translation reserve and subsequently transferred to profit or loss on disposal of the foreign operation.
ii. Goods and Services Tax (GST)
Revenue, expenses and capital assets are recognised net of GST, except where the GST incurred is not recoverable from the taxation authority, in which case the GST is recognised as part of the expense or cost of the asset.
Receivables and payables are stated with the amount of GST included. The net amounts of GST recoverable from or payable to the taxation authorities are included as a current asset or liability in the consolidated statement of financial position.
Cash flows are included in the consolidated statement of cash flows on a gross basis. The GST components of cash flows arising from investing and financing activities which are recoverable from or payable to taxation authorities are classified as operating cash flows.
d) Tax Governance
GrainCorp is committed to embedding risk management practices to support the achievement of compliance objectives and fulfilment of corporate governance obligations. Tax risk management is governed by both the GrainCorp Corporate Governance Statement and the GrainCorp Group Tax Risk Management Policy, ensuring corporate governance obligations with respect to tax risks are met.
GrainCorp applies professional diligence and care in the management of all risks associated with tax matters and ensure governance and assurance procedures are appropriate while fostering a constructive, professional and transparent relations with tax authorities, based on the concepts of integrity, collaboration and mutual trust. F
or p
erso
nal u
se o
nly

Group Performance GrainCorp Limited
52 2018 Annual Report
GrainCorp Limited Group Performance
Page 52 of 103
1 Group Performance
This section of the Financial Report focuses on disclosures most relevant to understanding the financial performance of the Group during the year. Segment reporting provides a breakdown of profit and revenue by operational activity. The key line items of the consolidated income statement along with their components provide detail behind the reported balances. Group performance also impacts earnings per share.
1.1 Segment information
a) Description of segments
The Group is organised into three segments that are based on the operational activity of each segment. These segments are consistent with internal reports that are reviewed and used by the Group’s chief operating decision maker, the Managing Director & Chief Executive Officer, in assessing performance and determining the allocation of resources.
In August 2017, GrainCorp’s Storage & Logistics and Marketing businesses were combined into a single ‘Grains’ business unit. For the majority of the 2017 financial year, Grains operated as two separate business units – Storage & Logistics and Marketing. From 1 October 2017, the Group now reports Storage & Logistics and the Marketing business as Grains to reflect the nature of operations and the review of the Managing Director & Chief Executive Officer. The comparative period has been restated to be in line with the current period reporting.
The three operating segments are as follows:
Operating segment Products and services
Grains Grain receivals, transport, testing, storage of grains and export / import of grain and other bulk commodities. Marketing of grain and agricultural products, and the operation of grain pools.
Malt Production of malt products, provision of brewing inputs and other malting services to brewers and distillers, sale of farm inputs, and export of malt.
Oils Processing and crushing of oilseeds, supplying edible oils and feeds, operating bulk liquid port terminals, storage, packaging, transport and logistics operations.
Corporate includes the share of profit from equity accounted investments and unallocated corporate costs such as group financing and income taxes. Segment performance is based on a measure of underlying EBITDA33.
b) Performance of segments
33 Underlying EBITDA is a non-IFRS measure representing earnings before net interest, tax, depreciation and amortisation, and excluding significant items, which are
detailed in note 1.5.
2018 Grains
$ M Malt $ M
Oils $M
Reportable segments
$ M Corporate
$ M Eliminations
$ M Total
$ M
Reportable segment revenue External revenue 2,131.6 1,152.4 969.1 4,253.1 - - 4,253.1 Inter-segment revenue 110.3 - - 110.3 - (110.3) - Total reportable segment revenue 2,241.9 1,152.4 969.1 4,363.4 - (110.3) 4,253.1 Reportable segment result 69.1 170.3 61.8 301.2 (30.9) - 270.3 Share of results of joint ventures (0.7) - (0.7) (1.4) 0.1 - (1.3) Underlying EBITDA33 269.0 Net interest (12.2) - (1.2) (13.4) (28.8) - (42.2) Depreciation and amortisation (63.4) (55.5) (32.7) (151.6) (1.6) - (153.2) Profit before income tax from continuing operations
(7.2) 114.8 27.2 134.8 (61.2) - 73.6
Other segment information Capital expenditure 46.1 45.7 45.6 137.4 4.5 - 141.9 Reportable segment assets 1,184.9 1,537.0 845.4 3,567.3 407.4 - 3,974.7 Reportable segment liabilities (578.2) (722.8) (200.3) (1,501.3) (531.2) - (2,032.5)
For
per
sona
l use
onl
y

GrainCorp Limited Group Performance
2018 Annual Report 53
GrainCorp Limited Group Performance
Page 53 of 103
1.1 Segment information (continued)
2017 Grains
$ M Malt $ M
Oils $M
Reportable segments
$ M Corporate
$ M Eliminations
$ M Total
$ M
Reportable segment revenue External revenue 2,524.7 1,105.5 945.5 4,575.7 - - 4,575.7 Inter-segment revenue 97.2 - - 97.2 - (97.2) - Total reportable segment revenue 2,621.9 1,105.5 945.5 4,672.9 - (97.2) 4,575.7 Reportable segment result 206.4 158.4 58.0 422.8 (32.5) - 390.3 Share of results of joint ventures (0.5) - - (0.5) 0.3 - (0.2) Underlying EBITDA34 390.1 Net interest (9.3) - (1.6) (10.9) (28.1) - (39.0) Depreciation and amortisation35 (61.4) (50.1) (33.7) (145.2) (1.2) - (146.4) Significant items (note 1.5) - (15.7) (3.4) (19.1) (0.9) - (20.0) Profit before income tax from continuing operations
135.2 92.6 19.3 247.1 (62.4) - 184.7
Other segment information Capital expenditure 122.0 92.0 46.6 260.6 1.2 - 261.8 Reportable segment assets 954.5 1,421.3 794.2 3,170.0 428.4 - 3,598.4 Reportable segment liabilities (369.1) (705.6) (122.1) (1,196.8) (541.2) - (1,738.0)
c) Geographical information
Geographical information 2018 $ M
2017 $ M
Sales revenue from external customers based on the location of the customer: Australasia 1,966.6 1,765.5 Asia 892.8 1,162.0 North America 772.3 744.0 Europe 446.8 679.1 Middle East and North Africa 65.1 193.7 Other 109.5 31.4 4,253.1 4,575.7 Non-current assets based on geographical location of assets:36 Australasia 1,273.3 1,302.9 North America 622.2 577.4 Europe 157.9 147.9 Middle East and North Africa 2.1 2.1 Asia 0.7 0.8 2,056.2 2,031.1
34 Underlying EBITDA is a non-IFRS measure representing earnings before net interest, tax, depreciation and amortisation, and excluding significant items, which are
detailed in note 1.5. 35 Depreciation and amortisation does not include amounts recognised as significant items detailed in note 1.5. 36 Excludes derivative financial instruments, retirement benefit assets and deferred tax assets.
For
per
sona
l use
onl
y

Group Performance GrainCorp Limited
54 2018 Annual Report
GrainCorp Limited Group Performance
Page 54 of 103
1.2 Revenue
2018 $ M
2017 $ M
Sale of goods 4,026.9 4,208.3 Service 213.7 355.2 Rental income 12.5 12.2 Total revenue 4,253.1 4,575.7
1.3 Other income
2018 $ M
2017 $ M
Net gain / (loss) on fair value remeasurements: Net realised gain on financial derivatives 3.0 22.5 Net realised (loss) / gain on foreign currency derivatives (31.5) 30.6 Net realised (loss) / gain on fair value remeasurements (28.5) 53.1 Net unrealised (loss) / gain on financial derivatives (6.0) 6.5 Net unrealised gain / (loss) on commodity contracts (forward purchases and sales) 27.2 (23.0) Net unrealised (loss) on foreign currency derivatives (3.5) (10.5) Net unrealised gain on commodity inventories at fair value less costs to sell 44.4 32.8 Net unrealised gain on fair value remeasurements 62.1 5.8 Net gain on fair value remeasurements 33.6 58.9 Interest income 3.5 2.7 Sundry income 23.6 31.4 Total other income 60.7 93.0 Unrealised gains/losses on commodity contracts (forward purchases and sales) and commodity inventories will be recognised through revenue and goods purchased for resale respectively when the contract is executed.
ACCOUNTING POLICY
The Group generates its main revenue from the following two streams:
› Sale of goods revenue is generated from the sale of grain, production and sale of malt, processing and crushing of oilseeds and the supply of edible oils and feeds. Revenue is earned when the goods are provided to the customer, which means when delivered for domestic sales and in accordance with shipping terms for export sales.
› Service revenue is earned from the receival, storage and handling of grain. Revenue for receival and handling is recognised as the service is performed, and for storage over the storage period.
Amounts disclosed as revenue are net of returns, trade allowances, duties and taxes paid.
ACCOUNTING POLICY
› Net gains / losses on fair value remeasurements are recognised in accordance with the policies stated in note 2.6. Income is recognised as realised gain / loss when the underlying sales contract is closed and unrealised when the contract is open as at 30 September.
› Interest income is recognised as it accrues using the effective interest method.
› Sundry income is comprised of one off items not in the course of normal operations such as proceeds from asset sales and government grants.
For
per
sona
l use
onl
y

GrainCorp Limited Group Performance
2018 Annual Report 55
GrainCorp Limited Group Performance
Page 55 of 103
1.4 Other expenses
2018 $ M
2017 $ M
Employee benefits expense Defined contribution superannuation 11.2 10.8 Other employee benefits 334.4 384.5 Total employee benefits expense 345.6 395.3 Other expenses Insurance 7.6 7.2 Motor vehicle 12.4 12.1 Travel 10.8 13.8 Software maintenance 15.0 15.2 Consulting 12.5 19.8 Communication 4.6 5.1 Impairment expense 3.2 20.8 Other 63.2 61.3 Total other expenses 129.3 155.3
1.5 Significant items
Net profit after tax include significant items whose disclosure is relevant in explaining the financial performance of the Group. The Group defines significant items as those items not in the ordinary course of business, non-recurring and material in nature and amount.
30 September 2018
There are no significant items for the 30 September 2018 financial year.
30 September 2017
Business Unit Profit before tax
$ M Tax $ M
NPAT $ M
Significant items for 2017 comprise: Restructuring costs Oils (3.4) 1.0 (2.4) Impairment of assets Malt, Corporate (20.8) 6.5 (14.3) Gain / (loss) on sale of assets Malt, Corporate 4.2 (3.9) 0.3 Net significant items (20.0) 3.6 (16.4)
ACCOUNTING POLICY
› Employee benefits expense includes salaries and wages, superannuation contributions, share-based payments and other entitlements. The Group’s accounting policy for liabilities associated with employee benefits is contained in note 3.6, and the policy for retirement benefit obligation plans and share-based payments is set out in note 3.7 and 5.2 respectively.
› Other expenses are miscellaneous and are recognised as incurred.
For
per
sona
l use
onl
y

Group Performance GrainCorp Limited
56 2018 Annual Report
GrainCorp Limited Group Performance
Page 56 of 103
1.6 Taxation
a) Income tax expense
Note 2018 $ M
2017 $ M
Income tax expense recognised in the consolidated income statement Current tax 13.2 9.6 Deferred tax (12.4) 50.8 Under / (over) provision in prior years 2.3 (0.9) 3.1 59.5 Reconciliation to effective tax rate Profit from continuing operations before income tax expense 73.6 184.7 Less: equity accounted loss not subject to taxation 4.4 1.3 0.2 Profit subject to tax 74.9 184.9 Income tax expense calculated at 30% (2017: 30%) 22.5 55.5 Tax effect of amounts which are not deductible / (taxable) in calculating taxable income Non-deductible / non-assessable items (1.3) 3.2 Change in US tax rate37 (18.7) - Under / (over) provision in prior years 2.3 (0.9) Difference in overseas tax rates (1.7) 1.7 Income tax expense 3.1 59.5 Effective tax rate38 4.1% 32.2% Tax (credit) / expense relating to items of other comprehensive income Change in fair value of cash flow hedges (3.1) 6.8 Remeasurement of retirement benefit obligations 2.9 2.9 (0.2) 9.7 Tax losses Unused tax losses for which no deferred tax asset has been recognised 43.7 39.1
b) Deferred tax assets and liabilities
Deferred tax assets 2018 $ M
2017 $ M
The balance comprises temporary differences attributable to: Retirement benefit obligation 0.9 4.9 Provisions and accruals 28.6 33.9 Tax losses recognised 37.9 16.2 Deferred revenue 3.9 3.8 Other 5.0 7.4 Set-off deferred tax liabilities pursuant to set-off provision (46.6) (28.6) Net deferred tax assets 29.7 37.6 Movements: Opening balance at 1 October 37.6 71.2 Recognised in the income statement (7.6) (27.7) Recognised in other comprehensive income (0.3) (5.9) Closing balance at 30 September 29.7 37.6
37 On 22 December 2017, US tax reform legislation was enacted which reduced the US Federal Corporate Tax rate from 35% to 21%. The initial impact of this change was
to adjust the carrying value of the Group’s US deferred tax balances which resulted in a deferred tax credit of $18.7m. 38 Effective tax rate is calculated as the income tax expense divided by profit subject to tax (excluding equity accounted profits/loss).
For
per
sona
l use
onl
y

GrainCorp Limited Group Performance
2018 Annual Report 57
GrainCorp Limited Group Performance
Page 57 of 103
1.6 Taxation (continued)
Deferred tax liabilities 2018 $ M
2017 $ M
The balance comprises temporary differences attributable to: Property, plant and equipment 89.3 92.1 Intangible assets 0.1 5.9 Unrealised gains on derivative contracts 20.6 4.4 Other 5.1 6.8 Set-off deferred tax liabilities pursuant to set-off provision (46.6) (28.6) Net deferred tax liabilities 68.5 80.6 Movements: Opening balance 1 October 80.6 60.7 Recognised in the income statement (20.0) 23.1 Recognised in other comprehensive income (0.1) 3.8 Exchange differences 8.0 (7.0) Closing balance 30 September 68.5 80.6
ACCOUNTING POLICY
› Income taxes
Income tax expense is calculated at the applicable income tax rate for each jurisdiction and recognised in profit for the year, unless it relates to other comprehensive income or transactions recognised directly in equity.
The tax expense comprises both current and deferred tax. Broadly, current tax represents the tax expense paid or payable for the current year, using applicable tax rates at the balance sheet date in each jurisdiction. Deferred tax accounts for tax on temporary differences. Temporary differences generally occur when there is a timing difference in recognition between income and expenses are recognised by tax authorities and accounted for in different periods.
Deferred tax assets, including those arising from tax losses, are recognised to the extent it is probable that sufficient taxable profits will be available to utilise the related tax assets in the foreseeable future. Deferred tax is not recognised on the following:
› The initial recognition of goodwill;
› The initial recognition of assets or liabilities that affect neither accounting nor taxable profits; and
› Differences relating to investments in subsidiaries to the extent that they are likely to reverse in the foreseeable future.
As the Group is subject to income taxes in Australia and jurisdictions where it has foreign operations, management consider the estimation of the worldwide tax provision and recognition of deferred tax balances in the consolidated statement of financial position to be an area of judgement and estimation. Changes in circumstances will alter expectations, which may impact the amount of provision for income taxes and deferred tax balances recognised.
› Tax consolidation
GrainCorp Limited is the head entity of the tax consolidated group. The entities in the tax consolidated group have entered a tax sharing agreement which, in the opinion of the Directors, limits the joint and several liability of the wholly owned entities in the case of a default by the head entity. The entities in the tax consolidated group have also entered into a tax funding agreement to fully compensate or be compensated by GrainCorp Limited for current tax balances and the deferred tax assets for unused tax losses and credits transferred.
For
per
sona
l use
onl
y
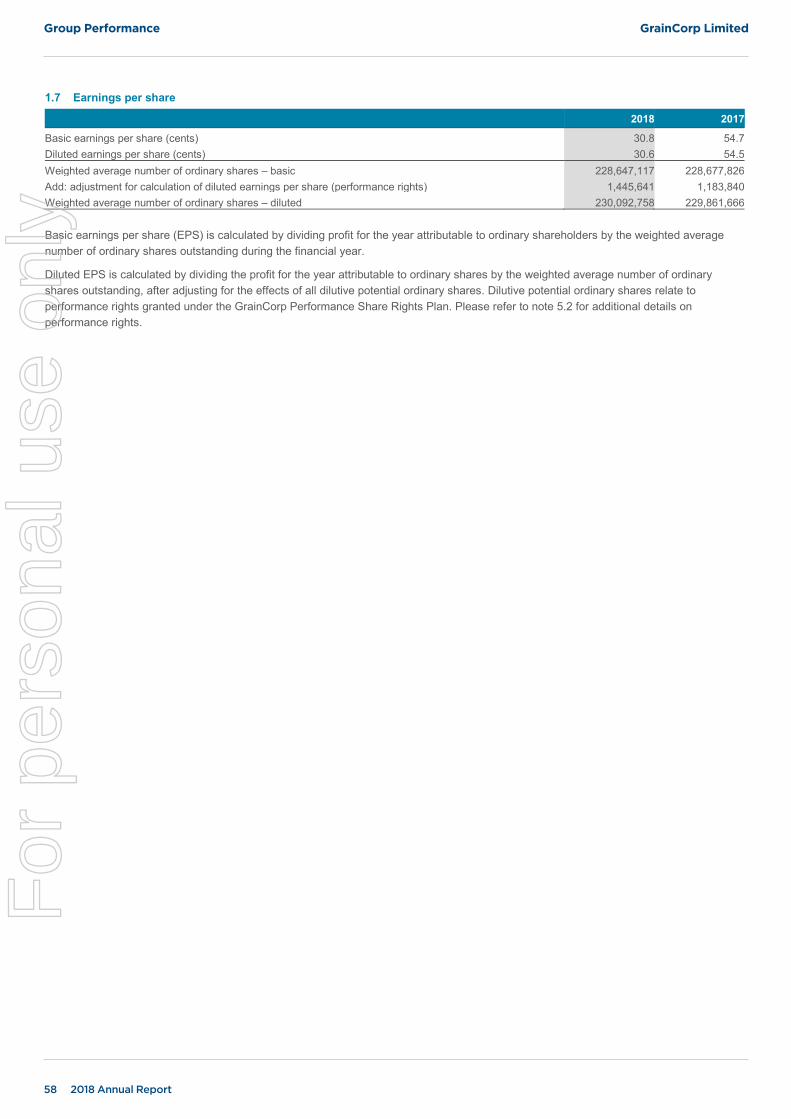
Group Performance GrainCorp Limited
58 2018 Annual Report
GrainCorp Limited Group Performance
Page 58 of 103
1.7 Earnings per share
2018 2017
Basic earnings per share (cents) 30.8 54.7 Diluted earnings per share (cents) 30.6 54.5 Weighted average number of ordinary shares – basic 228,647,117 228,677,826 Add: adjustment for calculation of diluted earnings per share (performance rights) 1,445,641 1,183,840 Weighted average number of ordinary shares – diluted 230,092,758 229,861,666 Basic earnings per share (EPS) is calculated by dividing profit for the year attributable to ordinary shareholders by the weighted average number of ordinary shares outstanding during the financial year.
Diluted EPS is calculated by dividing the profit for the year attributable to ordinary shares by the weighted average number of ordinary shares outstanding, after adjusting for the effects of all dilutive potential ordinary shares. Dilutive potential ordinary shares relate to performance rights granted under the GrainCorp Performance Share Rights Plan. Please refer to note 5.2 for additional details on performance rights.
For
per
sona
l use
onl
y

GrainCorp Limited Capital and Financial Risk Management
2018 Annual Report 59
GrainCorp Limited Capital and Financial Risk Management
Page 59 of 103
2 Capital and Financial Risk Management
The Group manages its capital to safeguard its ability to maintain an optimal capital structure so that it can continue to provide returns for shareholders and benefits for other stakeholders.
The Group’s capital consists of core debt and equity. Core debt is calculated as borrowings, net of cash assets and commodity inventory.
The Group’s capital structure is monitored using the core debt gearing ratio. The ratio is calculated as core debt divided by core debt plus equity. The Group maintains a core debt gearing ratio of less than 30%, though this may change as the earnings base continues to diversify.
The capital structure of the Group is continuously monitored and can be changed by adjusting the amount of dividends paid to shareholders, returning capital to shareholders or issuing new shares. The core debt gearing ratio is as follows:
2018 $ M
2017 $ M
Total borrowings (note 2.1) 1,300.8 1,085.0 Cash and cash equivalents (note 2.2) (370.9) (388.9) Net debt 929.9 696.1 Commodity inventory39 (415.7) (245.9) Core debt 514.2 450.2 Total equity excluding non-controlling interest (NCI) 1,942.2 1,858.9 Core debt gearing ratio 21% 20%
2.1 Borrowings
2018 $ M
2017 $ M
Current Working capital – unsecured
26.2
54.2
Commodity inventory funding facilities – secured 511.5 282.2 Leases liabilities – secured 0.2 0.2 Total current borrowings 537.9 336.6 Non-current Term debt facilities – unsecured 754.3 739.6 Lease liabilities – secured 8.6 8.8 Total non-current borrowings 762.9 748.4
a) Assets pledged as security
The carrying amounts of assets pledged as security for current and non-current borrowings are as follows:
2018 $ M
2017 $ M
Leased assets 11.2 11.2 Inventory40 475.8 264.0 Total assets pledged as security 487.0 275.2
39 Grains trading and Oils grain and oilseed inventories. 40 The Group’s secured inventory balance is GST exclusive on Australian facilities.
ACCOUNTING POLICY
Borrowings are initially recognised at fair value, net of transaction costs incurred. Borrowings are subsequently measured at amortised cost using the effective interest method.
For
per
sona
l use
onl
y

Capital and Financial Risk Management GrainCorp Limited
60 2018 Annual Report
GrainCorp Limited Capital and Financial Risk Management
Page 60 of 103
2.1 Borrowings (continued)
Lease liabilities are effectively secured as rights to the leased assets recognised in the financial statements and revert to the lessor in the event of default.
Inventory funding facilities are secured against the related inventory.
Loans under term and working capital funding facilities are secured by a negative pledge and these facilities provide the related entities in the Group that are party to the pledge the flexibility in funding their respective liquidity requirements as needed. The facilities impose certain financial covenants on the Group. All covenant ratios have been complied with during the financial year.
b) Financing arrangements
Borrowings under the following Group debt facilities as at the date of this report and amounts drawn at year end:
2018 Maturity date41 Principal facility amount $ M41 Amount utilised $ M42
Term debt November 2019 385.0 280.5 Term debt April 2020 225.0 225.0 Term debt April 2022 248.8 248.8 Commodity inventory funding43 November 2019 1,256.6 511.5 Working capital44 November 2019 265.0 26.2 Total financing arrangements 2,380.4 1,292.0
2017 Maturity date45 Principal facility amount $ M45 Amount utilised $ M46
Term debt November 2019 385.0 280.5 Term debt April 2020 225.0 225.0 Term debt April 2022 234.1 234.1 Commodity inventory funding47 November 2018 1,123.5 282.2 Working capital48 November 2018 390.0 54.2 Total financing arrangements 2,357.6 1,076.0
41 As at 9 November 2018. 42 As at 30 September 2018. 43 The maturity date and principal facility amount for the inventory funding facility is as at 9 November 2018. Subsequent to balance date, the maturity date was extended
from November 2018 to November 2019 and the principal facility amount changed from $720.3 million to $1,256.6 million. This facility is renewed subsequent to balance date each year to align with the seasonal requirements of the Group.
44 The maturity date and principal facility amount for the working capital facility is as at 9 November 2018. Subsequent to balance date, the maturity date was extended from November 2018 to November 2019 and the principal facility amount changed from $390 million to $265 million.
45 As at 12 November 2017. 46 As at 30 September 2017. 47 The maturity date and principal facility amount for the inventory funding facility is as at 12 November 2017. Subsequent to balance date, the maturity date was extended
from November 2017 to November 2018 and the principal facility amount changed from $1,153.2 million to $1,123.5 million. This facility is renewed subsequent to balance date each year to align with the seasonal requirements of the Group.
48 The maturity date and principal facility amount for the working capital facility is as at 12 November 2017. Subsequent to balance date, the maturity date was extended from November 2017 to November 2018. The principal facility remained at $390.0 million.
For
per
sona
l use
onl
y

GrainCorp Limited Capital and Financial Risk Management
2018 Annual Report 61
GrainCorp Limited Capital and Financial Risk Management
Page 61 of 103
2.2 Cash and cash equivalents
2018 $ M
2017 $ M
Cash at bank and on hand 281.2 359.3 Deposits at call 89.7 29.6 Total cash and cash equivalents 370.9 388.9
a) Reconciliation of profit after income tax to net cash flow from operating activities
Note
2018 $ M
2017 $ M
Profit for the year 70.5 125.2 Net profit on sale of non-current assets (9.2) (6.3) Non-cash employee benefits expense – share-based payments 5.2 3.9 4.4 Share of results of joint ventures not received as dividends 4.4 1.3 0.2 Depreciation and amortisation 153.2 145.8 Impairment expense 3.2 20.8 222.9 290.1 Changes in operating assets and liabilities (net of acquired entities): (Increase) in inventories (21.7) (34.7) (Increase) / decrease in deferred tax (4.0) 43.9 (Increase) / decrease in derivatives (13.3) 23.0 (Increase) in receivables (63.2) (5.9) Increase in trade payables 51.0 3.7 Increase in other liabilities 13.8 6.4 Increase / (decrease) in provision for income tax 6.0 (15.8) (Decrease) in defined benefit pension plan liability (4.6) (4.6) (Decrease) in provisions (3.6) (5.6) Net cash provided by operating activities 183.3 300.5
b) Net debt reconciliation
Operating activities Liabilities from financing activities
Cash and cash equivalents
$M
Inventory funding
facilities $M
Short-term facilities
$ M
Lease liabilities
$ M
Term funding facilities
$M Total
$M
Net debt as at 1 October 2016 (307.6) 239.7 147.9 9.1 782.6 871.7 Cash flows (78.7) 42.2 (97.1) (0.1) (42.5) (176.2) Foreign exchange movements (2.6) 0.3 3.4 - (0.5) 0.6 Net debt as at 30 September 2017 (388.9) 282.2 54.2 9.0 739.6 696.1 Cash flows 28.1 223.6 (29.4) (0.2) - 222.1 Foreign exchange movements (10.1) 5.7 1.4 - 14.7 11.7 Net debt as at 30 September 2018 (370.9) 511.5 26.2 8.8 754.3 929.9
ACCOUNTING POLICY
Cash and cash equivalents includes cash on hand, deposits held at call with banks and short-term investments with maturities of three months or less.
For
per
sona
l use
onl
y
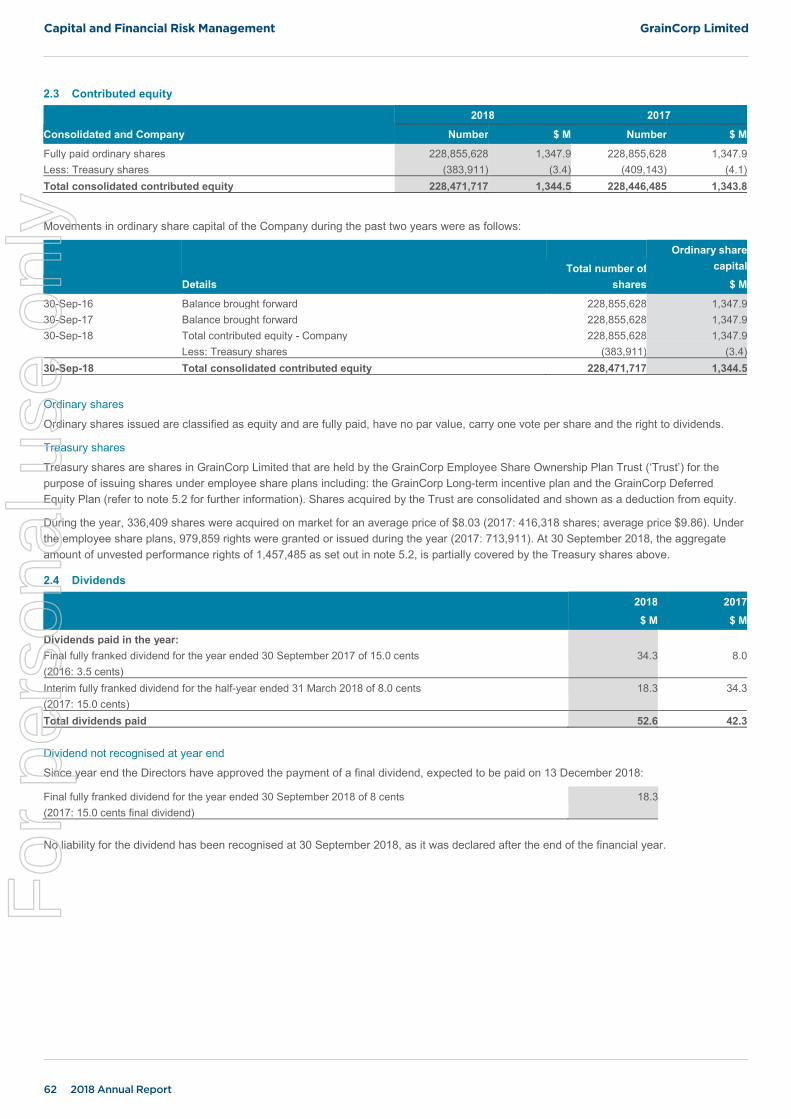
Capital and Financial Risk Management GrainCorp Limited
62 2018 Annual Report
GrainCorp Limited Capital and Financial Risk Management
Page 62 of 103
2.3 Contributed equity
Consolidated and Company
2018 2017
Number $ M Number $ M
Fully paid ordinary shares 228,855,628 1,347.9 228,855,628 1,347.9 Less: Treasury shares (383,911) (3.4) (409,143) (4.1) Total consolidated contributed equity 228,471,717 1,344.5 228,446,485 1,343.8
Movements in ordinary share capital of the Company during the past two years were as follows:
Details Total number of
shares
Ordinary share capital
$ M
30-Sep-16 Balance brought forward 228,855,628 1,347.9 30-Sep-17 Balance brought forward 228,855,628 1,347.9 30-Sep-18 Total contributed equity - Company 228,855,628 1,347.9 Less: Treasury shares (383,911) (3.4) 30-Sep-18 Total consolidated contributed equity 228,471,717 1,344.5 Ordinary shares
Ordinary shares issued are classified as equity and are fully paid, have no par value, carry one vote per share and the right to dividends.
Treasury shares
Treasury shares are shares in GrainCorp Limited that are held by the GrainCorp Employee Share Ownership Plan Trust (‘Trust’) for the purpose of issuing shares under employee share plans including: the GrainCorp Long-term incentive plan and the GrainCorp Deferred Equity Plan (refer to note 5.2 for further information). Shares acquired by the Trust are consolidated and shown as a deduction from equity.
During the year, 336,409 shares were acquired on market for an average price of $8.03 (2017: 416,318 shares; average price $9.86). Under the employee share plans, 979,859 rights were granted or issued during the year (2017: 713,911). At 30 September 2018, the aggregate amount of unvested performance rights of 1,457,485 as set out in note 5.2, is partially covered by the Treasury shares above.
2.4 Dividends
2018 $ M
2017 $ M
Dividends paid in the year: Final fully franked dividend for the year ended 30 September 2017 of 15.0 cents (2016: 3.5 cents)
34.3 8.0
Interim fully franked dividend for the half-year ended 31 March 2018 of 8.0 cents (2017: 15.0 cents)
18.3 34.3
Total dividends paid 52.6 42.3
Dividend not recognised at year end
Since year end the Directors have approved the payment of a final dividend, expected to be paid on 13 December 2018:
Final fully franked dividend for the year ended 30 September 2018 of 8 cents (2017: 15.0 cents final dividend)
18.3
No liability for the dividend has been recognised at 30 September 2018, as it was declared after the end of the financial year.
For
per
sona
l use
onl
y

GrainCorp Limited Capital and Financial Risk Management
2018 Annual Report 63
GrainCorp Limited Capital and Financial Risk Management
Page 63 of 103
2.4 Dividends (continued) Franking credits available
2018 $ M
2017 $ M
Franking credits available for the subsequent financial year 22.6 45.3 The above amounts represent the balance of the franking account as at the end of the financial year, adjusted for:
i. Franking debits that will arise from the receipts of the current tax liability;
ii. Franking debits that will arise from the payment of dividends recognised as a liability at the reporting date;
iii. Franking credits that will arise from the receipt of dividends recognised as receivables at the reporting date; and
iv. Franking credits that may be prevented from being distributed in subsequent financial years.
The impact on the franking account of the dividend approved by the Directors since year end, but not recognised as a liability at year end, will be a reduction in the franking account of $7.8 million (2017: $14.7 million).
2.5 Commitments and guarantees
a) Financial commitments
2018 $ M
2017 $ M
Capital expenditure commitments Total capital expenditure contracted for at the reporting date but not provided for in payables: - Not later than one year 9.8 38.5 Total capital expenditure commitments 9.8 38.5 Operating lease commitments Total non-cancellable operating leases contracted for at the reporting date but not recognised as liabilities: - Not later than one year 48.9 52.8 - Later than one year and not later than five years 59.9 53.6 - Later than five years 154.2 141.8 Total non-cancellable operating lease commitments 263.0 248.2 Finance leases Commitments in relation to finance leases are payable as follows: - Not later than one year 0.8 0.8 - Later than one year but not later than five years 4.2 4.2 - Later than five years 12.1 13.0 Minimum lease payments 17.1 18.0 Future finance charges (8.3) (9.0) Total finance lease liabilities (note 2.1) 8.8 9.0
b) Financial guarantees
Financial guarantees are provided by Group entities as follows:
i. GrainCorp Operations Limited was a self-insurer for workers’ compensation in NSW up to 29 June 2006. As required by the NSW workers’ compensation self-insurance licensing requirements, a bank guarantee in favour of the WorkCover Authority NSW for $0.8 million (2017: $0.6 million) is in place, representing an actuarial assessment of the contingent liability arising from past self-insurance for periods prior to 29 June 2006.
ii. The Group enters into guarantees as part of the normal course of business. At 30 September 2018, these guarantees amounted to $17.2 million (2017: $12.6 million). The Directors do not believe any claims will arise in respect of these guarantees.
No liability was recognised by the Group in relation to these guarantees as the fair value of the guarantees is immaterial.
For
per
sona
l use
onl
y

Capital and Financial Risk Management GrainCorp Limited
64 2018 Annual Report
GrainCorp Limited Capital and Financial Risk Management
Page 64 of 103
2.6 Derivative financial instruments and risk management
The Group’s Treasury function is responsible for managing the liquidity requirements of the Group and mitigating any financial risks relating to the Group’s operations through continuous monitoring and evaluation. These financial risks include:
› Market risk (refer to note 2.6.b))
› Liquidity risk (refer to note 2.6.c))
› Credit risk (refer to note 2.6.d))
The Group adheres to a set of policies approved by the Board of Directors which provides written principles on interest rate risk, liquidity risk, counter party credit risk, foreign currency risk and commodity trading risk including the setting of limits for derivatives trading. The Group Treasury function reports on its compliance with the policy on a regular basis to the Board of Directors and such compliance is reviewed periodically by its internal auditors.
The Group’s financial instruments comprise cash, short term deposits, receivables, loans, payables, finance leases and derivative financial instruments. The Group uses derivative financial instruments to manage its exposure to financial risks arising from operating, financing and investing activities.
a) Fair value measurement
The following table presents the Group’s financial assets and liabilities measured and recognised at fair value:
30 September 2018 Level 1 $ M
Level 2 $ M
Level 3 $ M
Total $ M
Current assets Derivative financial instruments – fair value through profit and loss Commodity futures and options
11.5
1.4
-
12.9
Commodity contracts (forward purchases and sales) - 1.0 96.8 97.8 Foreign currency derivatives - 15.0 - 15.0 Derivative financial instruments – cash flow hedge Foreign currency derivatives
-
2.8
-
2.8
Total current derivative financial instrument assets 11.5 20.2 96.8 128.5 Commodity inventory at fair value less costs to sell (note 3.2) - 9.2 317.5 326.7 Total current financial assets 11.5 29.4 414.3 455.2 Non-current assets Derivative financial instruments – fair value through profit and loss
Commodity futures and options 0.6 - - 0.6 Commodity contracts (forward purchases and sales) - - 2.6 2.6 Foreign currency derivatives - 0.4 - 0.4 Derivative financial instruments – cash flow hedge Foreign currency derivatives
- 1.2
- 1.2
Interest rate swap contracts - 2.4 - 2.4
Total non-current financial assets 0.6 4.0 2.6 7.2 Current liabilities Derivative financial instruments – fair value through profit and loss Commodity futures and options
11.9
0.4
-
12.3
Commodity contracts (forward purchases and sales) - 0.2 85.2 85.4 Foreign currency derivatives - 21.6 - 21.6 Derivative financial instruments – cash flow hedge Foreign currency derivatives
-
1.9
-
1.9
Total current financial liabilities 11.9 24.1 85.2 121.2 Non-current liabilities Derivative financial instruments – fair value through profit and loss Commodity contracts (forward purchases and sales) - - 2.3 2.3 Foreign currency derivatives - 0.7 - 0.7 Derivative financial instruments – cash flow hedge Foreign currency derivatives
-
0.7
-
0.7
Interest rate swap contracts - 3.2 - 3.2
Total non-current financial liabilities - 4.6 2.3 6.9
For
per
sona
l use
onl
y
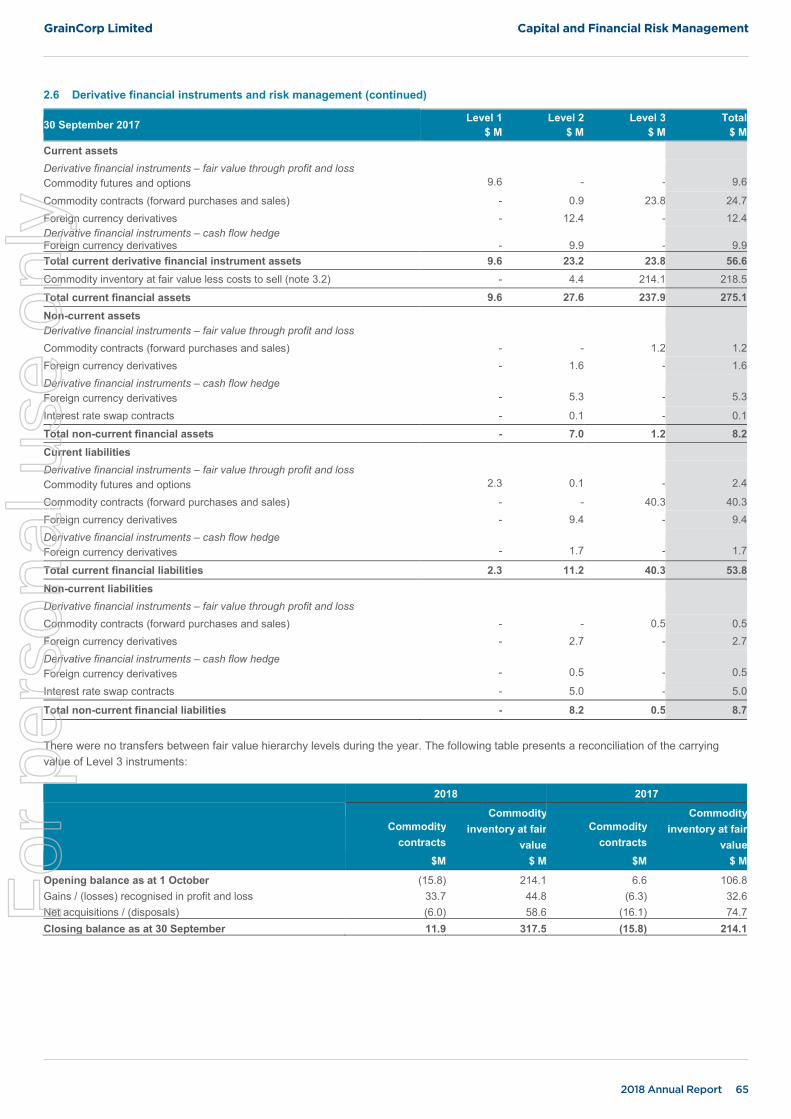
GrainCorp Limited Capital and Financial Risk Management
2018 Annual Report 65
GrainCorp Limited Capital and Financial Risk Management
Page 65 of 103
2.6 Derivative financial instruments and risk management (continued)
30 September 2017 Level 1 $ M
Level 2 $ M
Level 3 $ M
Total $ M
Current assets Derivative financial instruments – fair value through profit and loss Commodity futures and options
9.6
-
-
9.6
Commodity contracts (forward purchases and sales) - 0.9 23.8 24.7 Foreign currency derivatives - 12.4 - 12.4 Derivative financial instruments – cash flow hedge Foreign currency derivatives
-
9.9
-
9.9
Total current derivative financial instrument assets 9.6 23.2 23.8 56.6 Commodity inventory at fair value less costs to sell (note 3.2) - 4.4 214.1 218.5
Total current financial assets 9.6 27.6 237.9 275.1 Non-current assets Derivative financial instruments – fair value through profit and loss
Commodity contracts (forward purchases and sales) - - 1.2 1.2 Foreign currency derivatives - 1.6 - 1.6 Derivative financial instruments – cash flow hedge Foreign currency derivatives
-
5.3
-
5.3
Interest rate swap contracts - 0.1 - 0.1 Total non-current financial assets - 7.0 1.2 8.2 Current liabilities Derivative financial instruments – fair value through profit and loss Commodity futures and options
2.3
0.1
-
2.4
Commodity contracts (forward purchases and sales) - - 40.3 40.3 Foreign currency derivatives - 9.4 - 9.4 Derivative financial instruments – cash flow hedge Foreign currency derivatives
-
1.7
-
1.7
Total current financial liabilities 2.3 11.2 40.3 53.8 Non-current liabilities Derivative financial instruments – fair value through profit and loss Commodity contracts (forward purchases and sales) - - 0.5 0.5 Foreign currency derivatives - 2.7 - 2.7 Derivative financial instruments – cash flow hedge Foreign currency derivatives
-
0.5
-
0.5
Interest rate swap contracts - 5.0 - 5.0
Total non-current financial liabilities - 8.2 0.5 8.7
There were no transfers between fair value hierarchy levels during the year. The following table presents a reconciliation of the carrying value of Level 3 instruments:
2018 2017
Commodity contracts
$M
Commodity inventory at fair
value $ M
Commodity contracts
$M
Commodity inventory at fair
value $ M
Opening balance as at 1 October (15.8) 214.1 6.6 106.8 Gains / (losses) recognised in profit and loss 33.7 44.8 (6.3) 32.6 Net acquisitions / (disposals) (6.0) 58.6 (16.1) 74.7 Closing balance as at 30 September 11.9 317.5 (15.8) 214.1
For
per
sona
l use
onl
y
Capital and Financial Risk Management GrainCorp Limited
66 2018 Annual Report
GrainCorp Limited Capital and Financial Risk Management
Page 66 of 103
2.6 Derivative financial instruments and risk management (continued)
b) Market risk
The Group’s activities expose it to the financial risks of changes in (i) commodity prices, (ii) foreign currency and (iii) interest rates.
Commodity price risk – commodity trading
Commodity price risk arises due to grain and edible oil price fluctuations impacting on the value of commodity forward purchase and sales contracts written by the Group as part of its grain, meal and edible oil marketing activities. The Group’s policy is to lock in favourable margins between the purchase and sale price of commodities, but differences in the timing of entering into these contracts create an exposure to commodity price risk.
To manage exposure to this risk, the Group enters into various exchange traded commodity derivative contracts (futures and options) as well as OTC contracts with terms between two and 24 months. These contracts are predominantly in Australia, New Zealand, US, Canada and Europe based financial markets and denominated in the currencies of those jurisdictions.
ACCOUNTING POLICY
Derivative financial instruments are initially recognised at fair value on the date a derivative contract is entered. Subsequently, at each reporting date, the gain or loss on remeasurement to fair value is recognised immediately in the consolidated income statement, unless they qualify for hedge accounting as outlined in AASB 139 Financial Instruments: Recognition and Measurement.
The Group enters into certain cash flow hedges to hedge exposure to variability in cash flows that are attributable to a risk associated with a recognised asset or liability. The Group’s cash flow hedges include:
- Interest rate swap contracts - Forward foreign exchange contracts
When a derivative financial instrument is designated as a cash flow hedge, the effective part of any gain or loss on the derivative financial instrument is recognised in other comprehensive income and accumulated in a separate hedge reserve within equity.
Amounts accumulated in equity are reclassified to the consolidated income statement in the periods when the hedged item affects profit or loss.
When a hedging instrument expires, or is sold, terminated or exercised, but the hedged forecast transaction is still expected to occur, the cumulative gain or loss at that point remains in equity and is recognised in accordance with the above policy when the transaction occurs. If the hedged transaction is no longer expected to take place, the cumulative unrealised gain or loss accumulated in equity is reclassified immediately into the consolidated income statement.
The Group’s derivative instruments are measured at fair value at the end of each reporting period. Derivative instruments are grouped into Levels 1 to 3 based on the degree to which fair value measurement inputs are observable. The fair value of derivative instruments has been determined as follows;
› Level 1 derivative financial instruments held by the Group are instruments which are traded on an active market. The fair value of these financial instruments is the quoted market settlement price on the reporting date.
› Level 2 derivative financial instruments held by the Group are financial instruments that are not traded on an active market. The fair value is determined using valuation techniques which maximise observable market data and rely as little as possible on entity-specific estimates.
› Level 3 derivative financial instruments do not have quoted market prices available. The fair values are calculated by amending market price values obtained from traders and brokers for location and grade differentials. Management considers the valuation of these financial instruments to be an area of judgement and estimation.
For
per
sona
l use
onl
y

GrainCorp Limited Capital and Financial Risk Management
2018 Annual Report 67
GrainCorp Limited Capital and Financial Risk Management
Page 67 of 103
2.6 Derivative financial instruments and risk management (continued)
Sensitivity analysis
This sensitivity analysis shows the impact on post tax profit if commodity prices changed by 20%. The 20% movement is calculated over the market value amount of the net exposure of the commodity physical and derivative contracts.
Fair value of derivatives and physical inventory
$ M
Net effect of a 20% appreciation in price on
post-tax profit or loss $ M
Net effect of a 20% depreciation in price on
post-tax profit or loss $ M
2018 340.7 17.9 (17.9) 2017 210.8 15.5 (15.5)
Commodity price risk – malt and oils production
The Group enters into forward physical purchase and sales contracts along with commodity derivative contracts to manage the underlying price risks in the purchase of raw materials for malt and oils production and the subsequent sale of malt and oils products. These contracts are entered into and continue to be held for the purpose of delivery of raw materials and subsequent sale of processed malt and oils and are therefore classified as non-derivative and not fair valued.
Foreign currency risk
The Group has exposure to movement in exchange rates through:
› Commodity futures denominated in foreign currency;
› Export contracts for the sale of grain, edible oils and meal denominated in foreign currency;
› Sale or purchase of malt, edible oils and raw materials in foreign currency; and
› Translation of net investments in foreign subsidiaries denominated in foreign currencies.
To manage exposure to this risk, the Group enters into forward exchange contracts, foreign currency options and swap contracts, with the contracted time to mature when the relevant underlying contracts expire.
Expressed in Australian Dollars, the table below indicates exposure and sensitivity to movements in exchange rates on the profit or loss and equity of the Group, based on the global currency exposures at 30 September. The tables are based upon the Group’s financial asset and liability profile at 30 September, which fluctuates over the course of normal operations.
2018
Exposure at reporting date
$M Impact on profit / (loss) after tax
$ M
Impacts on other components of equity
$ M
Movement in exchange rate +10% -10% +10% -10% US Dollar Canadian Dollar UK Pound Sterling New Zealand Dollar Euro Yen
(121.2) 185.9
2.8 (5.1)
6.9 (28.4)
(11.7) 9.8
(4.1) (0.4)
0.5 (2.0)
11.7 (9.8)
4.1 0.4
(0.5) 2.0
3.2 3.2 4.3
- - -
(3.2) (3.2) (4.3)
- - -
Total 40.9 (7.9) 7.9 10.7 (10.7)
2017
Exposure at reporting date
$M Impact on profit / (loss) after tax
$ M
Impacts on other components of equity
$ M
Movement in exchange rate +10% -10% +10% -10% US Dollar Canadian Dollar UK Pound Sterling New Zealand Dollar Euro Yen
69.5 159.9
0.1 5.5
13.5 (35.0)
1.9 8.1
(4.1) 0.3 0.9
(2.5)
(1.9) (8.1)
4.1 (0.3) (0.9)
2.5
3.0 3.1 4.1 0.1
- -
(3.0) (3.1) (4.1) (0.1)
- -
Total 213.5 4.6 (4.6) 10.3 (10.3)
For
per
sona
l use
onl
y

Capital and Financial Risk Management GrainCorp Limited
68 2018 Annual Report
GrainCorp Limited Capital and Financial Risk Management
Page 68 of 103
2.6 Derivative financial instruments and risk management (continued)
Interest rate risk
The Group has exposure to interest rate risk as it borrows funds at both fixed and floating interest rates. The risk is managed by maintaining between 40% and 75% of long-term borrowings at fixed rates through the use of interest rate swap contracts.
Under interest rate swap contracts, the Group is entitled to receive interest at variable rates and is obliged to pay interest at fixed rates. The contracts require settlement of net interest receivable or payable at each reset period. The settlement dates coincide with the dates on which interest is payable on the underlying debt.
At 30 September 2018, after taking into account the effect of interest rate swap contracts, approximately 47% ($355 million) of the Group's long-term borrowings are at a fixed rate of interest (2017: 47%, $348 million).
The Group continuously monitors its interest rate exposure with consideration given to cash flows impacting on rollovers and repayments of debt, alternative hedging instruments and the mix of fixed and variable interest rates.
At balance date, the Group had the following mix of financial liabilities with interest at fixed and variable rates:
2018 2017
Weighted average
interest rate % Balance
$ M
Weighted average
interest rate %
Balance
$ M
Current instruments Working capital facilities 2.50% (26.2) 1.83% (54.2) Commodity inventory facilities 2.53% (511.5) 2.18% (282.2) Non-current instruments Term debt facilities 2.84% (754.3) 2.38% (739.6) Interest rate swaps (notional principal amount) 2.04% 355.0 1.53% 347.7 Net exposure to cash flow interest rate risk 2.66% (937.0) 2.26% (728.3)
Interest rate sensitivity analysis
At balance date, if interest rates had moved as illustrated in the table below, with all other variables held constant, profit and equity would have been affected as follows:
2018 2017
Profit / (loss)
Increase / (decrease) in
equity Profit / (loss)
Increase / (decrease) in
equity $ M $ M $ M $ M
+ 100 basis points (5.7) 3.5 (3.5) 3.5
– 100 basis points 5.7 (3.5) 3.5 (3.5)
For
per
sona
l use
onl
y

GrainCorp Limited Capital and Financial Risk Management
2018 Annual Report 69
GrainCorp Limited Capital and Financial Risk Management
Page 69 of 103
2.6 Derivative financial instruments and risk management (continued)
c) Liquidity risk
The Group's objective is to maintain a balance between continuity of funding and flexibility through the use of bank overdrafts, bank loans, finance leases and committed available credit facilities. The Group manages liquidity risk by regularly monitoring actual and forecast cash flows and matching the maturity profiles of financial assets and liabilities.
Group Treasury aims at maintaining flexibility in funding by keeping committed credit lines available with a variety of counterparties. At balance date, the Group had approximately $677.4million (2017: $455.4 million) of unused credit facilities available for immediate use.
The tables below show the contractual maturities of financial liabilities, including estimated interest payments. The amounts disclosed in the table are the contractual undiscounted cash flows.
As at 30 September 2018
Carrying Value
$M Total
$M
Less than 1 year $ M
Between 1 and 2 years
$ M
Between 2 and 5 years
$ M Over 5 years
$ M
Non-derivatives: Borrowings49 (1,292.0) (1,313.6) (537.8) (519.8) (256.0) - Trade and other payables (392.0) (392.0) (388.0) (1.5) (2.5) - Finance leases (8.8) (17.1) (0.8) (1.7) (2.5) (12.1) Derivatives: Interest rate swap contracts (3.2) (3.2) - (2.3) (0.9) - Foreign currency derivatives (Outflow) (24.9) (1,252.6) (1,163.6) (63.4) (25.6) - Inflow 1,227.7 1,140.1 62.3 25.3 - Commodity futures and options: (Outflow) (12.3) (12.4) (12.4) - - - Inflow 0.1 0.1 - - - Commodity contracts (forward purchases and sales): (Outflow) (87.7) (837.9) (765.3) (72.6) - - Inflow 750.2 679.9 70.3 - -
As at 30 September 2017
Carrying Value
$M Total
$M
Less than 1 year $ M
Between 1 and 2 years
$ M
Between 2 and 5 years
$ M Over 5 years
$ M
Non-derivatives Borrowings49 (1,076.0) (1,093.8) (336.5) - (757.3) - Trade and other payables (341.0) (341.0) (336.2) (1.5) (3.3) - Finance leases (9.0) (18.0) (0.8) (1.7) (2.5) (13.0) Derivatives Interest rate swap contracts (5.0) (5.0) - - (5.0) - Foreign currency derivatives (Outflow) (14.3) (564.8) (516.7) (45.6) (2.5) - Inflow 550.5 505.5 42.8 2.2 - Commodity futures and options: (Outflow) (2.4) (6.6) (6.6) - - - Inflow 4.2 4.2 - - - Commodity contracts (forward purchases and sales): (Outflow) (40.8) (431.7) (423.4) (8.3) - - Inflow 390.9 383.1 7.8 - -
49 The Group’s bank borrowings facilities and maturity dates are set out in note 2.1. Cash outflows associated with bank borrowings are inclusive of principal and interest.
For
per
sona
l use
onl
y
Capital and Financial Risk Management GrainCorp Limited
70 2018 Annual Report
GrainCorp Limited Capital and Financial Risk Management
Page 70 of 103
2.6 Derivative financial instruments and risk management (continued)
d) Credit risk
Credit risk is the risk that a counterparty will default on its contractual obligations, resulting in financial loss to the Group. The Group is exposed to credit risk from its operating activities and financing activities.
Trade receivables
The Group minimises credit risk associated with trade and other receivables by performing a credit assessment for all customers that wish to trade on credit terms. Credit limits are determined for each individual customer based on their credit assessment. These limits are approved under the credit policy that is approved by the Board. At 30 September, 95% (2017: 96%) of trade receivables are due within 30 days and the Group does not have any significant credit risk exposure to a single customer or group of customers.
Financial instruments and cash deposits
To minimise the credit exposure to financial institutions that are counterparties to derivative contracts and cash, the Group has a panel of authorised counterparties who are principally large banks and recognised financial intermediaries with acceptable credit ratings determined by a rating agency. The Group’s net exposure and credit assessment of its counterparties are continuously monitored to ensure any risk is minimised.
The Group may also be subject to credit risk for transactions that are not included in the consolidated statement of financial position, such as when a guarantee is provided for another party.
The Group’s maximum exposure for credit risk is the carrying amount of all trade and other receivables, receivables from joint ventures, derivative asset balances, margin deposits and cash assets as set out in the consolidated statement of financial position.
For
per
sona
l use
onl
y

GrainCorp Limited Capital and Financial Risk Management
2018 Annual Report 71
GrainCorp Limited Capital and Financial Risk Management
Page 71 of 103
2.6 Derivative financial instruments and risk management (continued)
e) Offsetting financial assets and liabilities
Agreements with derivative counterparties are based on an International Swaps and Derivatives Association (ISDA) Master Netting Agreement. Under the terms of these agreements, only where certain credit events occur (such as default), the net position owing/receivable to a single counterparty in the same currency will be taken as owing and all the relevant arrangements terminated.
The ISDA agreements do not meet the criteria for offsetting in the statement of financial position. This is because the Group does not have any legally enforceable right to offset recognised amounts, because the right to offset is enforceable only on the occurrence of future events such as default on the bank loans or other credit events.
The following table presents the recognised financial instruments that are offset, or subject to offsetting arrangements mentioned above:
30 September 2018 Gross amounts
Gross amount offset
Net amount in statement of
financial position Amounts that are
not offset Net amount $ M $ M $ M $ M $ M
Financial assets
Cash and cash equivalents 370.9 - 370.9 - 370.9
Trade and other receivables 535.6 (5.2) 530.4 - 530.4
Derivative financial instruments 141.4 (5.7) 135.7 (32.7) 103.0
Total assets 1,047.9 (10.9) 1,037.0 (32.7) 1,004.3
Financial liabilities
Trade and other payables 397.2 (5.2) 392.0 - 392.0
Derivative financial instruments 133.8 (5.7) 128.1 (32.7) 95.4
Total liabilities 531.0 (10.9) 520.1 (32.7) 487.4
30 September 2017 Gross amounts
Gross amount offset
Net amount in statement of
financial position Amounts that are
not offset Net amount $ M $ M $ M $ M $ M
Financial assets
Cash and cash equivalents 388.9 - 388.9 - 388.9
Trade and other receivables 476.1 (8.8) 467.3 - 467.3
Derivative financial instruments 76.0 (11.2) 64.8 (10.4) 54.4
Total assets 941.0 (20.0) 921.0 (10.4) 910.6
Financial liabilities
Trade and other payables 349.8 (8.8) 341.0 - 341.0
Derivative financial instruments 73.7 (11.2) 62.5 (10.4) 52.1
Total liabilities 423.5 (20.0) 403.5 (10.4) 393.1
For
per
sona
l use
onl
y

Operating Assets and Liabilities GrainCorp Limited
72 2018 Annual Report
GrainCorp Limited Operating Assets and Liabilities
Page 72 of 103
3 Operating Assets and Liabilities This section shows the assets used to generate the Group’s trading performance and liabilities incurred as a result. Liabilities relating to the Group’s financing activities are addressed in Section 2. Capital and Financial Risk Management.
3.1 Trade and other receivables
Current 2018 $ M
2017 $ M
Trade receivables 425.3 363.3 Provision for impairment of trade receivables (2.0) (1.7) 423.3 361.6 Prepayments 34.2 45.9 Margin deposits 13.5 4.7 Other receivables 57.1 54.0 Total current trade and other receivables 528.1 466.2
Non-current 2018 $ M
2017 $ M
Loan to joint venture (note 4.5) 0.2 0.2 Other receivables 2.1 0.9 Total non-current trade and other receivables 2.3 1.1
ACCOUNTING POLICY
Trade receivables are initially recognised at fair value and subsequently measured at amortised cost using the effective interest method, less an allowance for impairment. Trade receivables are generally due for settlement within 30 days.
A provision for impairment is recognised when there is objective evidence that the Group will not be able to collect all amounts due. The amount of the provision is the difference between the asset’s carrying amount and its fair value, which is estimated as the present value of future cash flows.
For
per
sona
l use
onl
y

GrainCorp Limited Operating Assets and Liabilities
2018 Annual Report 73
GrainCorp Limited Operating Assets and Liabilities
Page 73 of 103
3.2 Inventories
2018 $ M
2017 $ M
Raw materials 296.3 190.8 Work in progress 16.9 17.2 Finished goods 159.3 129.9 Trading stock at net realisable value 25.3 22.7 Commodity inventory at fair value less cost to sell 326.7 218.5 Total inventories 824.5 579.1
Inventory expense Write-downs of inventories to net realisable value recognised as an expense during the year ended 30 September 2018 amounted to $2.4 million (2017: $2.9 million). The expense is included in other expenses in the consolidated income statement.
ACCOUNTING POLICY
Inventories are valued at lower of cost and net realisable value unless stated otherwise. Net realisable value is the estimated selling price less variable selling expenses. The method used to determine costs for inventory categories are:
› Raw materials: Purchase price of the goods. › Finished goods and work in progress: Purchase price of raw materials, direct labour, other direct costs and
production overheads. › Trading stock: Purchase price of direct materials and a portion of variable overhead assigned on a weighted
average basis. › Commodity inventory: Grain inventory acquired with the purpose of selling in the near future and generating a
profit from fluctuation in price or broker-traders’ margin, is measured at fair value less costs to sell, with changes in fair value recognised in the consolidated income statement.
For
per
sona
l use
onl
y

Operating Assets and Liabilities GrainCorp Limited
74 2018 Annual Report
GrainCorp Limited Operating Assets and Liabilities
Page 74 of 103
3.3 Property, plant and equipment
Land
$ M
Buildings & structures
$ M
Leasehold improvements
$ M
Plant and equipment
$ M
Capital works in progress
$ M Total
$ M
As at 30 September 2016 Cost 120.7 339.0 41.0 1,715.9 261.6 2,478.2 Accumulated depreciation and impairment
(4.3) (167.2) (18.7) (829.6) (2.1) (1,021.9)
Net book value 116.4 171.8 22.3 886.3 259.5 1,456.3 Movement Transfer between asset categories (note 3.4)
0.4 16.9 1.5 132.0 (164.2) (13.4)
Additions 0.6 15.5 0.4 37.0 164.3 217.8 Disposals (2.5) (7.0) (0.1) (16.3) (1.7) (27.6) Depreciation - (20.7) (1.9) (94.1) - (116.7) Impairment - - - (11.2) - (11.2) Exchange differences 0.4 0.8 - (2.2) (3.7) (4.7) Closing net book value 115.3 177.3 22.2 931.5 254.2 1,500.5 As at 30 September 2017 Cost 116.4 356.7 42.5 1,814.9 254.2 2,584.7 Accumulated depreciation and impairment
(1.1) (179.4) (20.3) (883.4) - (1,084.2)
Net book value 115.3 177.3 22.2 931.5 254.2 1,500.5 Movement Transfer between asset categories (note 3.4)
2.5 99.9 1.2 116.2 (227.2) (7.4)
Additions 2.0 4.4 0.1 40.1 78.0 124.6 Disposals (7.0) (0.2) (0.1) (0.6) (2.6) (10.5) Depreciation - (25.9) (2.0) (96.3) - (124.2) Impairment - - - - - - Exchange differences 1.6 7.3 0.3 17.4 4.7 31.3 Closing net book value 114.4 262.8 21.7 1,008.3 107.1 1,514.3 As at 30 September 2018 Cost 115.4 467.1 43.9 1,960.9 107.1 2,694.4 Accumulated depreciation and impairment
(1.0) (204.3) (22.2) (952.6) - (1,180.1)
Net book value 114.4 262.8 21.7 1,008.3 107.1 1,514.3 Assets held for sale
From time to time, the Directors of GrainCorp resolve to sell certain sites that have been closed to operations based on their historic and expected receivals and production utilisation. As at 30 September 2018, one site measured at $14.7 million (2017: two sites measured at $12.1 million, including inventory) is actively marketed for sale.
Treatment of inactive sites
From time to time, the Group decides to close or suspend operations at certain sites based on consideration of market and other relevant factors. These sites can become operational in future periods. The Group conducts an impairment assessment for these inactive sites by comparing the carrying value of the assets with the recoverable value calculated at the higher of fair value less cost to sell or value in use. The total value of such sites as at 30 September 2018 amounts to $10.1 million (2017: $12.2 million).
For
per
sona
l use
onl
y

GrainCorp Limited Operating Assets and Liabilities
2018 Annual Report 75
GrainCorp Limited Operating Assets and Liabilities
Page 75 of 103
3.3 Property, plant, and equipment (continued)
ACCOUNTING POLICY
› Carrying value
Property, plant and equipment is measured at cost less accumulated depreciation and impairment losses. Subsequent costs are capitalised when it is probable that future economic benefits associated with the expenditure will flow to the Group.
Borrowing costs incurred for the construction of any qualifying asset are capitalised during the period of time that it is required to complete and prepare the asset for its intended use or sale. Other borrowing costs are expensed.
› Depreciation
Property, plant and equipment assets, other than freehold land, are depreciated on a straight-line basis over the useful lives of the assets. Useful lives are reviewed on an annual basis and have been assessed as follows:
• Freehold buildings: 3-50 years • Leasehold improvements: Term of lease • Plant & equipment: 1-50 years
› Assets held for sale
Assets held for sale are measured at the lower of their carrying amount and fair value less costs to sell. Assets are classified as held for sale if their carrying amounts will be recovered through a sale transaction rather than through continuing use.
Assets held for sale are presented separately from other assets in the consolidated statement of financial position. Property, plant and equipment and intangible assets are not depreciated or amortised once classified as held for sale.
› Impairment
Tests for impairment on items of property, plant and equipment are conducted in accordance with the policy for impairment of non-financial assets. Property, plant and equipment are reviewed for impairment whenever events or changes in circumstances indicate that the carrying amount may not be recoverable. An impairment loss is recognised for the amount by which the asset’s carrying amount exceeds its recoverable amount. The recoverable amount is the higher of an asset’s fair value less costs to sell and value in use. For the purposes of assessing impairment, assets are grouped at the lowest levels for which there are separately identifiable cash flows.
For
per
sona
l use
onl
y

Operating Assets and Liabilities GrainCorp Limited
76 2018 Annual Report
GrainCorp Limited Operating Assets and Liabilities
Page 76 of 103
3.4 Intangible assets
Computer software
$ M Trade name
$ M
Customer relationship
$ M Goodwill
$ M
Capital works in progress
$M Total
$ M
As at 30 September 2016 Cost or fair value 106.0 5.2 117.9 415.1 0.3 644.5 Accumulated amortisation and impairment
(60.2) (2.5) (90.5) - - (153.2)
Net book value 45.8 2.7 27.4 415.1 0.3 491.3 Movement Transfer between asset categories (note 3.3)
12.2 - - - 1.2 13.4
Additions 2.2 - - - 3.3 5.5 Acquisitions through business combinations
- 1.1 - 11.8 - 12.9
Disposals (0.3) (0.3) - - - (0.6) Amortisation charge (17.7) (0.1) (11.3) - - (29.1) Exchange differences 0.5 - 0.4 0.3 (0.1) 1.1 Closing net book value 42.7 3.4 16.5 427.2 4.7 494.5 As at 30 September 2017 Cost or fair value 117.6 4.7 115.6 427.2 4.7 669.8 Accumulated amortisation and impairment
(74.9) (1.3) (99.1) - - (175.3)
Net book value 42.7 3.4 16.5 427.2 4.7 494.5 Movement Transfer between asset categories (note 3.3)
10.0 - - - (2.6) 7.4
Additions 6.5 - - - 4.9 11.4 Amortisation charge (18.2) (0.1) (10.7) - - (29.0) Exchange differences 0.6 - 0.1 17.5 0.4 18.6 Closing net book value 41.6 3.3 5.9 444.7 7.4 502.9 As at 30 September 2018 Cost or fair value 135.4 4.7 119.2 444.7 7.4 711.4 Accumulated amortisation and impairment
(93.8) (1.4) (113.3) - - (208.5)
Net book value 41.6 3.3 5.9 444.7 7.4 502.9 Impairment test for goodwill
For purposes of impairment testing, goodwill acquired through business combination is allocated to cash-generating units (CGUs) as below:
2018 $ M
2017 $ M
Grains 19.1 19.0 Malt 323.4 306.1 Oils 102.2 102.1 Total goodwill 444.7 427.2
For
per
sona
l use
onl
y
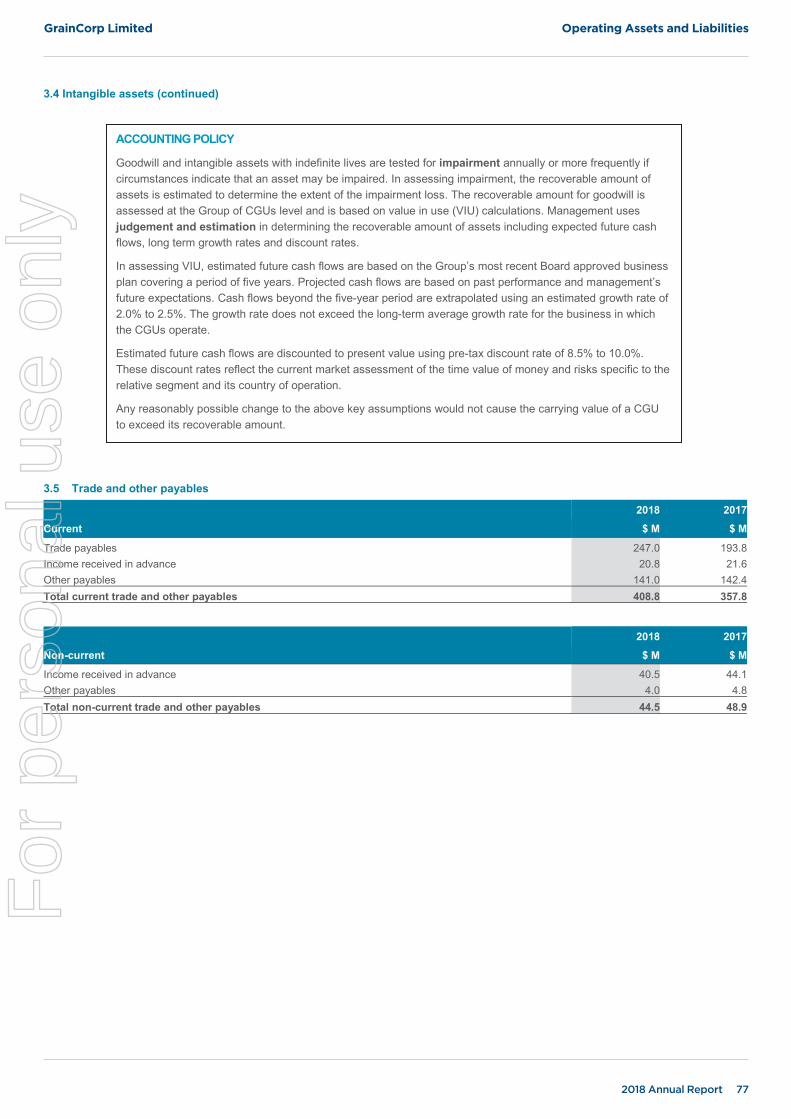
GrainCorp Limited Operating Assets and Liabilities
2018 Annual Report 77
GrainCorp Limited Operating Assets and Liabilities
Page 77 of 103
3.4 Intangible assets (continued)
3.5 Trade and other payables
Current 2018 $ M
2017 $ M
Trade payables 247.0 193.8 Income received in advance 20.8 21.6 Other payables 141.0 142.4 Total current trade and other payables 408.8 357.8
Non-current 2018 $ M
2017 $ M
Income received in advance 40.5 44.1 Other payables 4.0 4.8 Total non-current trade and other payables 44.5 48.9
ACCOUNTING POLICY
Goodwill and intangible assets with indefinite lives are tested for impairment annually or more frequently if circumstances indicate that an asset may be impaired. In assessing impairment, the recoverable amount of assets is estimated to determine the extent of the impairment loss. The recoverable amount for goodwill is assessed at the Group of CGUs level and is based on value in use (VIU) calculations. Management uses judgement and estimation in determining the recoverable amount of assets including expected future cash flows, long term growth rates and discount rates.
In assessing VIU, estimated future cash flows are based on the Group’s most recent Board approved business plan covering a period of five years. Projected cash flows are based on past performance and management’s future expectations. Cash flows beyond the five-year period are extrapolated using an estimated growth rate of 2.0% to 2.5%. The growth rate does not exceed the long-term average growth rate for the business in which the CGUs operate.
Estimated future cash flows are discounted to present value using pre-tax discount rate of 8.5% to 10.0%. These discount rates reflect the current market assessment of the time value of money and risks specific to the relative segment and its country of operation.
Any reasonably possible change to the above key assumptions would not cause the carrying value of a CGU to exceed its recoverable amount.
For
per
sona
l use
onl
y

Operating Assets and Liabilities GrainCorp Limited
78 2018 Annual Report
GrainCorp Limited Operating Assets and Liabilities
Page 78 of 103
3.6 Provisions
2018 Customer claims
$ M Onerous contracts
$ M Employee benefits
$ M Other
$ M Total provisions
$ M
Balance at 1 October 2017 5.0 3.1 52.7 11.3 72.1 Additional provisions 1.8 5.0 37.9 2.7 47.4 Amounts used (0.9) (0.7) (37.0) (6.5) (45.1) Unused amounts reversed - - (6.1) (0.7) (6.8) Exchange difference - - 0.6 0.3 0.9 Balance 30 September 2018 5.9 7.4 48.1 7.1 68.5 Current 5.9 5.6 43.1 3.9 58.5 Non-current - 1.8 5.0 3.2 10.0
Customer claims
Customer claims can arise under contractual terms if the quantity or quality of grain owned by a customer is not available at a specific location. A provision is made for customer claims in relation to grain losses or damages in the normal course of operations. The provision is based on the estimated cost of customer claims, with reference to past experience, the level of historical claims paid, and the current location, grade profile and quantity of physical grain in the network relative to customer ownership as at 30 September 2018. Management considers the estimation of the provision to be an area of judgement and estimation.
Onerous contracts
A provision is made for the unavoidable costs of meeting contractual obligations where the costs of meeting those obligations exceed the economic benefits expected to be received from the contract. The unavoidable costs under the contract reflect the least net cost of exiting from the contract, which is the lower of the cost of fulfilling it and any compensation or penalties arising from failure to fulfil it. The amount recognised is the best estimate of the consideration required to settle the present obligation at the reporting dates, taking into account the risks and uncertainties surrounding the obligation. Management considers the estimation of the provision to be an area of judgement and estimation.
Employee benefits
The provision for employee benefits represents sick leave, annual leave and long service leave (LSL) entitlements. It is measured as the present value of expected future payments for the services provided by employees up to the point of reporting date. For provisions that are expected to be settled 12 months after year end, the Group uses corporate bond rates with maturities aligned to the estimated timing of future cash flows to discount expected future payments. In calculating the LSL provision, management judgement is required to estimate future wages and salaries, on cost rates and employee service period.
The Group’s current provision for employee benefits includes $43.1 million (2017: $46.9 million) in respect to accrued annual leave, vesting sick leave and a portion of long service leave, where employees have completed the required period of service. As the Group does not have an unconditional right to defer settlement, the entire obligation is categorised as a current liability.
Based on past experience, the Group does not expect all employees to take the full amount of accrued long service leave or require payment within the next 12 months. Group long service leave obligations expected to be settled within the next 12 months amount to $1.2 million (2017: $0.8 million).
Other provisions
Other is made up of restructuring, restoration and worker’s compensation provisions.
ACCOUNTING POLICY
Provisions are recognised when:
› The Group has a present obligation as a result of past events;
› It is highly likely an outflow of resources will be required to settle the obligation; and
› A reliable estimate can be made of the amount of the obligation.
If the effect of the time value of money is material, provisions are determined by discounting the expected future cash flows at a pre-tax rate that reflects current markets assessment of the time value of money and the risks specific to the liability.
For
per
sona
l use
onl
y

GrainCorp Limited Operating Assets and Liabilities
2018 Annual Report 79
GrainCorp Limited Operating Assets and Liabilities
Page 79 of 103
3.7 Retirement benefit obligations
Defined contribution plan
The majority of employees in Australia and New Zealand are part of a defined superannuation scheme and received fixed contributions from the Group in accordance with statutory requirements.
Defined benefit plan
The Group operates pension plans for some employees of its Malt business in US, Canada, UK and Australia. The plan is funded through contributions to the defined benefit plan as determined by annual actuarial valuations. A defined benefit plan is a pension plan that defines the amount of pension benefit an employee will receive on retirement, usually dependent on one or more factors such as age, years of service and compensation.
a) Retirement benefit liability recognised in the consolidated statement of financial position
2018 $ M
2017 $ M
Present value of the defined benefit obligations 178.7 193.9 Fair value of defined benefit plans assets (172.1) (167.1) Net defined benefit obligation 6.6 26.8 Recognised in the consolidated statement of financial position as: Retirement benefit asset Retirement benefit obligation
5.2
(11.8)
2.6
(29.4) Net defined benefit obligation (6.6) (26.8)
b) Categories of plan assets
2018
% 2017
%
The major categories of plan assets are as follows: Cash 1% - Equity instruments 44% 50% Debt instruments 54% 49% Other assets 1% 1% Total 100% 100%
c) Reconciliations
2018 $ M
2017 $ M
Reconciliation of the present value of the defined benefit obligations: Balance at the beginning of the year 193.9 210.4 Current service cost 1.2 1.7 Interest cost 5.8 5.1 Scheme participants contributions 0.1 0.1 Remeasurements (15.4) (14.8) Benefits paid (17.0) (8.9) Past service cost - (1.6) Exchange difference 10.1 1.9 Balance as at 30 September 178.7 193.9 Reconciliation of fair value of plan assets: Balance at the beginning of the year 167.1 166.3 Interest income 5.1 4.0 Remeasurements 0.1 (2.1) Contributions by Group companies 8.0 5.9 Scheme participants contributions 0.1 0.1 Actual plan administration expense (0.3) (0.5) Benefits paid (17.0) (8.9) Exchange difference 9.0 2.3 Balance as at 30 September 172.1 167.1
For
per
sona
l use
onl
y

Operating Assets and Liabilities GrainCorp Limited
80 2018 Annual Report
GrainCorp Limited Operating Assets and Liabilities
Page 80 of 103
3.7 Retirement benefit obligations (continued)
d) Amounts recognised in the consolidated income statement
2018 $ M
2017 $ M
The amounts recognised in the income statement are as follows: Current service cost 1.2 1.7 Net interest expense 0.7 1.1 Past service cost - (1.6) Total expense included in employee benefits expense 1.9 1.2 e) Amounts recognised in other comprehensive income
2018 $ M
2017 $ M
Remeasurements of retirement benefit obligations 15.5 12.7 Cumulative remeasurements recognised (16.2) (31.7)
f) Principal actuarial assumptions
2018 North
America UK Australia
Principal actuarial assumptions used (expressed as weighted averages): Discount rate 3.87% 2.90% 3.90% Future salary increases 2.00% 3.30% 3.00%
2017 North
America UK Australia
Principal actuarial assumptions used (expressed as weighted averages): Discount rate 3.74% 2.70% 3.10% Future salary increases 2.00% 3.20% 3.00%
g) Sensitivity analysis
Changes in the following principal actuarial assumptions would have the following effect on the defined benefit pension obligation:
2018 $ M
Increase/(decrease)
2017 $ M
Increase/(decrease)
Discount rate: 0.25% increase (6.6) (7.8) 0.25% decrease 6.9 7.8
Inflation: 0.25% increase 2.5 3.8 0.25% decrease (2.4) (3.7)
The sensitivity information has been derived for all plans using projected cash flows valued using the relevant assumptions and membership profiles as at 30 September 2018. Extrapolation of these results beyond the sensitivity figures shown may not be appropriate.
Employer contributions
Based on the recommendations of the plan’s actuaries, total employer contributions expected to be paid by the Group for the year ended 30 September 2019 are $7.3 million (2018: $6.5 million).
For
per
sona
l use
onl
y

GrainCorp Limited Operating Assets and Liabilities
2018 Annual Report 81
GrainCorp Limited Operating Assets and Liabilities
Page 81 of 103
3.7 Retirement benefit obligations (continued)
ACCOUNTING POLICY
Defined contribution plan
Payments to defined contribution retirement benefit plans are recognised as an expense when employees have rendered services entitling them to the contributions.
Defined benefit plan
The asset or liability recognised in the consolidated statement of financial position in respect of defined plan benefits is the present value of the defined benefit obligation at the balance sheet date minus the fair value of plan assets. The present value of the pension liability is determined by discounting the estimated future cash flows using interest rates of high quality corporate or government bonds that:
› Are denominated in the currency in which the benefits will be paid; and
› Have terms to maturity approximating the terms of the related pension liability.
The defined benefit obligation is calculated at least annually by independent actuaries using the projected unit credit method, which in simple terms proportions the benefit based on years of service provided. Management consider the valuation of defined benefit plans to be an area of judgement and estimation as a number of key assumptions must be adopted to determine the fair value.
Actuarial gains and losses arise when there is a difference between previous estimates and actual experience, or a change to assumptions in relation to demographic and financial trends. Gains and losses are recognised in the period in which they occur, directly in other comprehensive income as remeasurements.
The Group determines the net interest expense (income) on the net defined benefit liability for the period by applying the discount rate at the beginning of the period to the net defined benefit liability, considering any changes during the period because of contributions and benefit payments. Net interest expense (income), service cost and other expenses related to defined benefit plans are recognised in the consolidated income statement.
For
per
sona
l use
onl
y
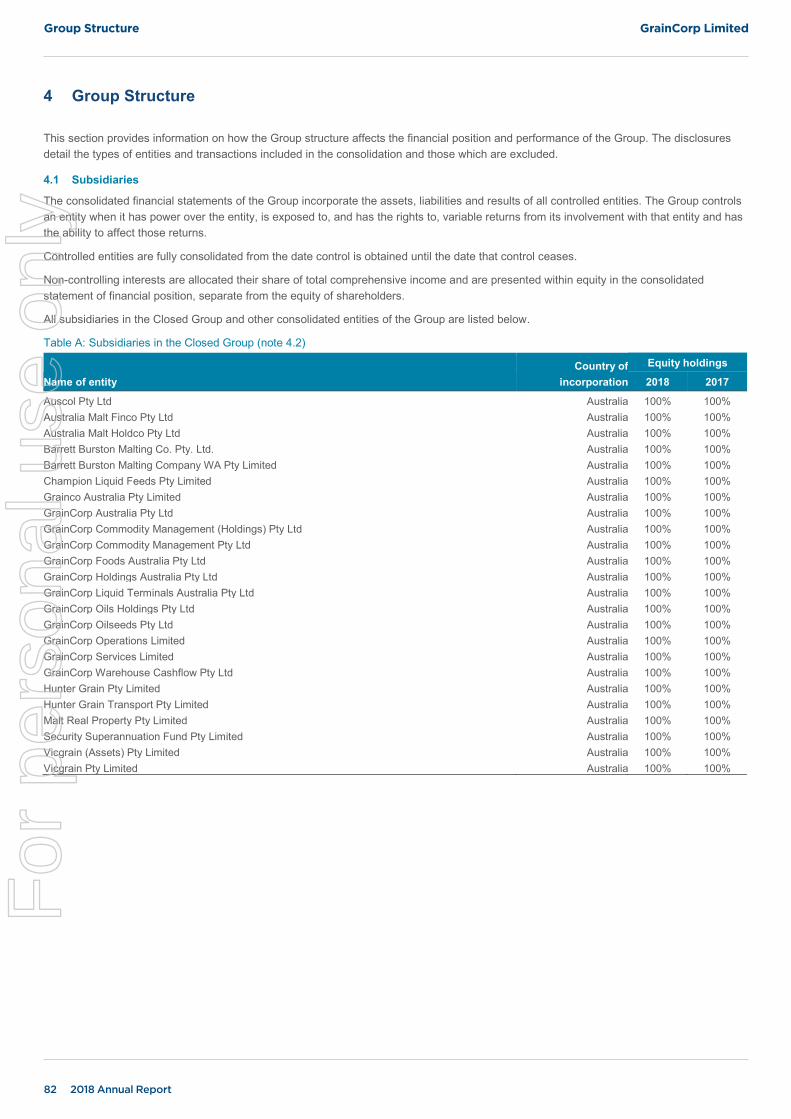
Group Structure GrainCorp Limited
82 2018 Annual Report
GrainCorp Limited Group Structure
Page 82 of 103
4 Group Structure
This section provides information on how the Group structure affects the financial position and performance of the Group. The disclosures detail the types of entities and transactions included in the consolidation and those which are excluded.
4.1 Subsidiaries
The consolidated financial statements of the Group incorporate the assets, liabilities and results of all controlled entities. The Group controls an entity when it has power over the entity, is exposed to, and has the rights to, variable returns from its involvement with that entity and has the ability to affect those returns.
Controlled entities are fully consolidated from the date control is obtained until the date that control ceases.
Non-controlling interests are allocated their share of total comprehensive income and are presented within equity in the consolidated statement of financial position, separate from the equity of shareholders.
All subsidiaries in the Closed Group and other consolidated entities of the Group are listed below.
Table A: Subsidiaries in the Closed Group (note 4.2)
Name of entity Country of
incorporation
Equity holdings
2018 2017
Auscol Pty Ltd Australia 100% 100% Australia Malt Finco Pty Ltd Australia 100% 100% Australia Malt Holdco Pty Ltd Australia 100% 100% Barrett Burston Malting Co. Pty. Ltd. Australia 100% 100% Barrett Burston Malting Company WA Pty Limited Australia 100% 100% Champion Liquid Feeds Pty Limited Australia 100% 100% Grainco Australia Pty Limited Australia 100% 100% GrainCorp Australia Pty Ltd Australia 100% 100% GrainCorp Commodity Management (Holdings) Pty Ltd Australia 100% 100% GrainCorp Commodity Management Pty Ltd Australia 100% 100% GrainCorp Foods Australia Pty Ltd Australia 100% 100% GrainCorp Holdings Australia Pty Ltd Australia 100% 100% GrainCorp Liquid Terminals Australia Pty Ltd Australia 100% 100% GrainCorp Oils Holdings Pty Ltd Australia 100% 100% GrainCorp Oilseeds Pty Ltd Australia 100% 100% GrainCorp Operations Limited Australia 100% 100% GrainCorp Services Limited Australia 100% 100% GrainCorp Warehouse Cashflow Pty Ltd Australia 100% 100% Hunter Grain Pty Limited Australia 100% 100% Hunter Grain Transport Pty Limited Australia 100% 100% Malt Real Property Pty Limited Australia 100% 100% Security Superannuation Fund Pty Limited Australia 100% 100% Vicgrain (Assets) Pty Limited Australia 100% 100% Vicgrain Pty Limited Australia 100% 100%
For
per
sona
l use
onl
y

GrainCorp Limited Group Structure
2018 Annual Report 83
GrainCorp Limited Group Structure
Page 83 of 103
4.1 Subsidiaries (continued)
Table B: Other subsidiaries
Name of entity Country of
incorporation
Equity holdings
2018 2017
ABN 36 073 105 656 Pty Ltd50 Australia 100% 100% Australian Grain Handlers Pty Ltd Australia 80% 80% GSEST Pty Ltd50 Australia 100% 100% Canada Malting Co. Limited Canada 100% 100% GrainCorp Canada Inc. Canada 100% 100% GrainCorp Operations Canada Inc. Canada 100% 100% Gardner Smith Commodities Trading (Shanghai) Co. Ltd China 100% 100% Shanghai Grand Port Liquid Storage Terminals Co. Ltd China 100% 100% GrainCorp Europe GmbH & Co. KG Germany 100% 100% GrainCorp Europe Management GmbH Germany 100% 100% Schill Malz GmbH Co. KG51 Germany 100% 100% Schill Malz Verwaltungs-GmbH51 Germany 100% 100% Barrett Burston Malting Co (NZ) Limited New Zealand 100% 100% GrainCorp Commodity Management (NZ) Limited New Zealand 100% 100% GrainCorp Feeds Limited New Zealand 100% 100% GrainCorp Foods NZ Limited New Zealand 100% 100% GrainCorp Liquid Terminals NZ Limited New Zealand 100% 100% GrainCorp Operations Asia Pte Ltd Singapore 100% 100% Gardner Smith Africa Pty Ltd52 South Africa 100% 100% Bairds Malt Limited UK 100% 100% Bairds Malt (Pension Trustees) Limited UK 100% 100% Brewers Select Limited UK 100% 100% GrainCorp (Canada) Holdings UK Limited UK 100% 100% GrainCorp Europe (UK) Ltd UK 100% 100% GrainCorp UK Limited UK 100% 100% Malt UK Holdco Limited UK 100% 100% Maltco 3 Limited UK 100% 100% Mark Lawrence (Grain) Limited UK 100% 100% Moray Firth Maltings Limited UK 100% 100% Norton Organic Grain Limited UK 100% 100% Saxon Agriculture Limited UK 100% 100% Scotgrain Agriculture Limited UK 100% 100% Ulgrave Limited UK 100% 100% GrainCorp (Black Sea) Holdings UK Limited53 UK 100% - GrainCorp Holdings USA USA 100% 100% GrainCorp USA USA 100% 100% Great Western Malting Co USA 100% 100% Malt US Holdco Inc USA 100% 100% GrainCorp Ukraine LLC53 Ukraine 100% -
50 Subject to member’s voluntary liquidation or deregistration. 51 Subject to voluntary liquidation. 52 De-registered. Subject to completion of winding-up. 53 GrainCorp (Black Sea) Holdings UK Limited and GrainCorp Ukraine LLC were registered on 3 April 2018 and 14 May 2018 respectively.
For
per
sona
l use
onl
y

Group Structure GrainCorp Limited
84 2018 Annual Report
GrainCorp Limited Group Structure
Page 84 of 103
4.2 Deed of cross guarantee
The Group and subsidiaries included in Table A of note 4.1 have entered a Deed of Cross Guarantee under which each of the companies guarantees the debts of the other and are relieved from the requirement to prepare financial statements under ASIC Class Order No. 2016/785. These are collectively known as the Closed Group.
Set out below is the consolidated income statement, a summary of movements in consolidated retained earnings and a consolidated statement of financial position for the Closed Group for the year ended 30 September 2018.
Consolidated income statement 2018
$ M 2017
$ M
Revenue 3,187.0 3,377.3 Other income 67.5 84.3 Goods purchased for resale (2,235.4) (2,302.9) Raw materials and consumables used (465.9) (399.9) Employee benefits expense (238.8) (289.3) Depreciation and amortisation (108.6) (106.8) Finance costs (35.9) (33.1) Operating leases Repairs and maintenance
(53.8) (30.8)
(69.2) (49.1)
Other expenses (100.4) (111.3) Share of results from investments accounted for using the equity method (0.6) 0.6 (Loss) / profit before income tax (15.7) 100.6 Income tax benefit / (expense) 6.3 (33.6) (Loss) / profit for the year (9.4) 67.0 Other comprehensive income: Changes in the fair value of cash flow hedges (2.6) 5.7 Remeasurements of retirement benefit obligations (0.1) (0.2) Income tax benefit / (expense) relating to components of other comprehensive income 0.8 (1.6) Other comprehensive income / (loss) for the year, net of tax (1.9) 3.9 Total comprehensive income / (loss) for the year (11.3) 70.9 Summary of movements in consolidated retained earnings Retained earnings at the beginning of the financial year 158.8 134.3 (Loss) / profit for the year Dividends paid
(9.4) (52.6)
67.0 (42.3)
Remeasurements of retirement benefit obligations (0.1) (0.2) Retained earnings at the end of the financial year 96.7 158.8
For
per
sona
l use
onl
y

GrainCorp Limited Group Structure
2018 Annual Report 85
GrainCorp Limited Group Structure
Page 85 of 103
4.2 Deed of cross guarantee (continued)
Set out below is the consolidated statement of financial position of the Closed Group as at 30 September.
Consolidated statement of financial position 2018 $ M
2017 $ M
Current assets Cash and cash equivalents 90.4 150.7 Trade and other receivables 324.6 282.0 Inventories 481.0 311.9 Derivative financial instruments 119.2 43.4 Assets classified as held for sale 14.7 12.1 Current tax assets 2.6 14.8 Total current assets 1,032.5 814.9 Non-current assets Trade and other receivables 117.8 140.2 Investment in subsidiaries 477.1 451.8 Investments accounted for using the equity method 1.1 2.1 Investments in other entities 3.1 7.1 Property, plant and equipment 1,024.0 1,039.3 Deferred tax assets 13.8 11.5 Intangible assets 95.6 108.4 Derivative financial instruments 3.5 2.0 Total non-current assets 1,736.0 1,762.4 Total assets 2,768.5 2,577.3 Current liabilities Trade and other payables 219.4 211.0 Borrowings 378.7 207.9 Derivative financial instruments 117.8 49.1 Provisions 49.2 50.1 Total current liabilities 765.1 518.1 Non-current liabilities Trade and other payables 25.3 16.7 Borrowings 514.1 514.3 Derivative financial instruments 5.1 4.1 Provisions 7.1 9.5 Retirement benefit obligations - 0.1 Total non-current liabilities 551.6 544.7 Total liabilities 1,316.7 1,062.8 Net assets 1,451.8 1,514.5 Equity Contributed equity 1,344.5 1,343.8 Reserves 10.6 11.9 Retained earnings 96.7 158.8 Total equity 1,451.8 1,514.5
For
per
sona
l use
onl
y

Group Structure GrainCorp Limited
86 2018 Annual Report
GrainCorp Limited Group Structure
Page 86 of 103
4.3 Parent entity financial information The financial information of the parent entity is prepared on the same basis as the consolidated financial statements, except as follows:
i. Investments in subsidiaries and associates are carried at cost; and
ii. Dividends received from associates are recognised in the profit and loss.
Statement of financial position 2018
$ M 2017
$ M
Current assets 0.5 0.4 Total assets 1,795.5 1,815.1 Current liabilities 0.1 0.4 Total liabilities 0.2 7.3 Shareholders’ equity Contributed equity 1,344.5 1,343.8 Share option reserve 7.3 6.7 Capital reserve 8.3 8.3 Retained earnings 435.2 449.0 Total shareholders’ equity 1,795.3 1,807.8 Profit for the year 38.8 32.1 Total comprehensive income 38.8 32.1
The parent entity is party to the Deed of Cross Guarantee and is subject to the terms of the deed as described in note 4.2. At 30 September 2018, the parent entity did not provide any other guarantees (2017: nil), contingent liabilities (2017: nil) or capital commitments (2017: nil).
For
per
sona
l use
onl
y

GrainCorp Limited Group Structure
2018 Annual Report 87
GrainCorp Limited Group Structure
Page 87 of 103
4.4 Investments accounted for using the equity method
a) Carrying amounts
All the joint ventures below are incorporated in Australia, except for GrainsConnect Canada which is incorporated in Canada.
Ownership interest Carrying amount
Company Principal activity 2018 2017 2018
$ M 2017
$ M
GrainsConnect Canada Operations Inc Grain elevation and storage 50% 50% 29.8 29.1 National Grower Register Pty Ltd Register management 50% 50% 1.1 0.9 Flex Biofuels Pty Ltd (in liquidation) Sales and purchases of biofuels 50% 50% - 0.4 PumpFree Pty Ltd Liquid oil transportation 23% 23% - 0.7 30.9 31.1
b) Movements in carrying amounts
i. Group share of commitments and contingent liabilities in respect of joint ventures
Group’s share of joint venture’s expenditure commitments:
2018
$ M 2017
$ M
Capital commitments 23.4 2.2 Lease commitments 4.7 1.4 28.1 3.6
ii. Summarised financial information of joint ventures
The tables below provide summarised financial information for joint ventures that are material to the Group. The information disclosed reflects the amounts presented in the financial statements of the relevant joint venture and not the Group’s share of those amounts.
GrainsConnect Canada Operations Inc54
Summarised statement of financial position 2018 $ M
2017 $ M
Current assets 38.7 21.6 Non-current assets 125.6 67.2 Total assets 164.3 88.8 Current liabilities 38.3 10.2 Non-current liabilities 66.4 20.4 Total liabilities 104.7 30.6 Net assets 59.6 58.2 Reconciliation of carrying amounts: Balance at beginning of year 58.2 7.8 Loss for the period (1.5) (0.9) Capital contributions - 51.0 Exchange difference in translation of opening balances 2.9 0.3 Closing net assets 59.6 58.2 Group’s share of net assets 29.8 29.1
54 GrainsConnect Canada’s current assets includes $10.8m cash and cash equivalents (2017: $20.8m).
GrainsConnect Canada’s liabilities includes $7.5m current borrowings (2017: nil) and $66.4m non-current borrowings (2017: $20.4m).
For
per
sona
l use
onl
y

Group Structure GrainCorp Limited
88 2018 Annual Report
GrainCorp Limited Group Structure
Page 88 of 103
4.4 Investments accounted for using the equity method (continued)
GrainsConnect Canada Operations Inc
Summarised statement of comprehensive income 2018 $ M
2017 $ M
Revenue 115.2 0.4 Operating profit (after tax) (1.5) (0.9) Other comprehensive (loss) - - Total comprehensive income (1.5) (0.9) Group’s share of comprehensive income (0.7) (0.4)
iii. Individually immaterial joint ventures
In addition to interest in joint ventures disclosed above, the Group also has an interest in several individually immaterial joint ventures that are accounted for using the equity accounting method.
2018 $ M
2017 $ M
Reconciliation of carrying amounts: Balance at beginning of year 2.0 1.8 Share of profit/(loss) after income tax (0.6) 0.2 Dividends received (0.2) - Return of capital (0.1) - Aggregated carrying amount of individually immaterial joint ventures 1.1 2.0
4.5 Related party transactions
a) Transactions with related parties
Interests held in joint ventures by the Group are set out in note 4.4. Revenue earned by the Group during the year as a result of transactions with joint ventures and other investments the Group holds is as follows:
Consolidated
2018 $’000
2017 $’000
Freight income from Allied Mills Australia Pty Ltd (‘Allied Mills’)55 - 4,024 Sales income from Allied Mills - 50,265 Purchases from Allied Mills - 698 Storage income from Allied Mills55 - 3,629 Sales income from GrainsConnect Canada 1 - Purchases from GrainsConnect Canada 3,735 - Interest income from National Grower Register Pty Ltd (‘NGR’) 9 10
55 Transactions with Allied Mills are shown for the period 1 October 2016 until 31 March 2017, when the Group disposed of its interest in the joint venture and ceased to be
a related party.
ACCOUNTING POLICY
Investments in joint ventures are accounted for using the equity method, whereby the share of profit recognised is the Group’s share of the investment’s profit or loss based on ownership interest held. A joint venture is an arrangement where the Group has joint control over the activities and joint rights to the net assets.
For
per
sona
l use
onl
y

GrainCorp Limited Group Structure
2018 Annual Report 89
GrainCorp Limited Group Structure
Page 89 of 103
4.5 Related party transactions (continued)
b) Outstanding balances in relation to transactions with related parties
Interest held in joint ventures by the Group are set out in note 4.4. Balances outstanding at the end of the financial year are as follows;
Consolidated
2018 $’000
2017 $’000
Loan to NGR (note 3.1) 175 175 Current receivable from GrainsConnect Canada 11,606 -
c) KMP compensation
The remuneration disclosures are provided in Section 1 to 8 of the Remuneration Report.
2018
$’000 2017
$’000
Short-term employee benefits 6,521 8,068 Post-employment benefits 204 244 Long-term benefits 54 55 Share-based payments 2,246 2,703 Termination payments - 229 Total KMP compensation 9,025 11,299
d) Other transactions with KMP
Transactions for storage, handling, transport, testing, seed sales and purchase of grain, fertiliser and other agricultural products from Directors or Director related entities took place during both financial years covered by this report and occurred within a normal customer relationship on terms no more favourable than those available on similar transactions to other customers. Below are aggregate amounts due, from and to Directors, any other KMP and their Director related and KMP related entities at balance date. These balances are the result of transactions conducted under normal trading terms and conditions.
Directors and other KMP who transacted business with the Group were G J Bradley, D J Mangelsdorf, P J Housden, D G McGauchie, B J Gibson, R P Dee-Bradbury, A G Bell, K Pamminger and G A Friberg. (2017: G J Bradley, D J Mangelsdorf, M L Palmquist, P J Housden, D G McGauchie, B J Gibson, R P Dee-Bradbury, A G Bell, K Pamminger and G A Friberg).
Director related and KMP related entities
Consolidated
2018 $’000
2017 $’000
Current receivables 13,355 1,668 Current payables 153 377 2018: Current receivables include $11,606,000 from GrainsConnect Canada, an entity of which A G Bell and K Pamminger are directors, $1,741,000 from Australian Agricultural Company Ltd, an
entity related to D G McGauchie, and $8,000 from Warakirri 2 Pty Ltd, an entity related to B J Gibson and D J Mangelsdorf. Current payables include $2,000 payable to Energy Australia Limited, an entity related to R P Dee-Bradbury and G B Bradley, $1,000 to BlueScope Steel Limited, an entity related to R P Dee-Bradbury, $94,000 relating to Warakirri 2 Pty Ltd, an entity related to B J Gibson and D J Mangelsdorf, and $56,000 relating to Daybreak Cropping, an entity related to D J Mangelsdorf.
2017: Current receivables include $1,668,000 receivable from Australian Agricultural Company Ltd, an entity related to D G McGauchie. Current payables include $2,000 payable to EnergyAustralia
Limited, an entity related to R P Dee-Bradbury and G J Bradley, and $375,000 relating to Warakirri 2 Pty Ltd of which D J Mangelsdorf and B J Gibson are directors.
For
per
sona
l use
onl
y

Other GrainCorp Limited
90 2018 Annual Report
GrainCorp Limited Other
Page 90 of 103
5 Other 5.1 Remuneration of auditor
2018
$’000 2017
$’000
PwC Australia Audit and review of financial reports and other work under the Corporations Act 2001 1,081 946 Other services56 26 30 Total remuneration of PwC Australia 1,107 976 Overseas practices of PwC Australia Audit and review of financial reports 1,119 977 Other services56 23 45 Total remuneration of related practices of PwC Australia 1,142 1,022 Total auditors’ remuneration 2,249 1,998
5.2 Share-based payments The Group operates Long-term incentive and Short-term incentive plans. Fully paid ordinary shares issued under these plans rank equally with all other existing fully paid ordinary shares.
a) Long-term incentive plan (LTIP)
Under the Group’s LTIP, senior executives have the opportunity to be rewarded with fully paid ordinary shares, provided the LTIP meets minimum pre-determined hurdles for Total Shareholder Return (‘TSR’) and Return on Equity (‘ROE’) covering a three-year period, as set by the People Remuneration and Nominations Committee. These shares are purchased on market or issued to the trustee once the LTIP vests.
Full details of the LTIP plan are included in Sections 1 to 8 of the Remuneration Report on pages 30-42.
The fair value of performance rights are determined using an option pricing model with the following inputs:
Grant date 18 December 2015 2 March 2017 22 February 2018
Fair value at grant date (TSR) $2.93 $4.52 $1.66 Fair value at grant date (ROE) $7.48 $8.07 $7.07 Estimated vesting date 30 September 2018 30 September 2019 30 September 2020 Share price at grant date $8.05 $8.79 $7.70 Volatility 20% 20% 20% Risk free interest rate 2.05% 1.92% 2.09% Dividend yield 2.5% 3.1% 3.1% Set out in the table below is a summary of the number of rights granted under the LTIP. The exercise price on outstanding options is zero.
Grant date Expiry date Balance at
start of year Granted
during year Exercised
during the year Forfeited
during year Expired
during year Balance at end
of year Exercisable at
end of year
18 Dec 2015 30 Sep 2018 355,977 - - (7,130) (348,847) - - 02 Mar 2017 30 Sep 2019 368,528 - - (15,721) - 352,807 - 22 Feb 2018 30 Sep 2020 - 387,389 - - - 387,389 - 724,505 387,389 - (22,851) (348,847) 740,196 -
56 Other services include company secretarial services and specified agreed upon procedures.
For
per
sona
l use
onl
y

GrainCorp Limited Other
2018 Annual Report 91
GrainCorp Limited Other
Page 91 of 103
5.2 Share-based payments (continued) b) Deferred Equity Plan (‘DEP’)
All senior executives are required to have a portion of their short-term incentives deferred and paid subject to executives remaining with the Company for subsequent periods.
For the Managing Director & CEO the 50% deferred component of STI is paid 12 months following the initial STI awards as rights. For other Executives, the deferred component is paid over two years as rights i.e. 50% deferred component at the end of year one and 50% of deferred component at the end of year 2.
The fair value of rights are determined using an option pricing model with the following inputs:
Grant date 22 Dec 2015 24 Jan 2017 24 Jan 2017 31 Jan 2018 31 Jan 2018 27 Feb 2018 27 Feb 2018
Fair value at grant date $7.77 $9.29 $9.01 $7.25 $7.03 $7.77 $7.54 Estimated vesting date 30 Sep 2017 30 Sep 2017 30 Sep 2018 30 Sep 2018 30 Sep 2019 30 Sep 2018 30 Sept 19 Share price at grant date $8.11 $9.48 $9.48 $7.40 $7.40 $7.91 $7.91 Dividend yield 2.5% 3.1% 3.1% 3.1% 3.1% 3.1% 3.1% Set out below is a summary of the number of rights granted under the DEP:
Grant date Expiry date Balance at
start of year Granted
during year
Exercised during the
year Forfeited
during year Expired
during year Balance at
end of year Exercisable at
end of year
22 Dec 2015 30 Sep 2016 & 30 Sep 2017
157,934 - (156,966) (968) - - -
24 Jan 2017 30 Sep 2017 & 30 Sep 2018
338,775 - (201,322) (4,234) - 133,219 133,219
31 Jan 2018 30 Sep 2018 & 30 Sep 2019
- 562,633 - (8,400) - 554,233 329,535
27 Feb 2018 30 Sep 2018 & 30 Sep 2019
- 29,837 - - - 29,837 14,919
496,709 592,470 (358,288) (13,602) - 717,289 477,673
c) Expenses arising from share-based payment transactions Total expenses arising from share-based payment transactions recognised during the period as part of employee benefit expenses in the consolidated income statement were as follows:
2018 $ M
2017 $ M
Share-based payments expense 3.9 4.4
ACCOUNTING POLICY
The grant date fair value of equity-settled share-based payments is recognised as an expense proportionally over the vesting period, with a corresponding increase in equity.
The fair value of instruments with market-based performance conditions (e.g. TSR) is calculated at the date of grant using the Monte Carlo simulation model which is a commonly used valuation technique. The probability of achieving market-based performance conditions is incorporated into the determination of the fair value per instrument.
The fair value of instruments with non-market-based performance conditions (e.g. ROE), service conditions and retention rights is calculated using the Black-Scholes option pricing model.
The amount recognised as an expense over the vesting period is adjusted to reflect the actual number of instruments that vest. The expense is recognised in full if the awards do not vest due to market condition not being met.
For
per
sona
l use
onl
y

Other GrainCorp Limited
92 2018 Annual Report
GrainCorp Limited Other
Page 92 of 103
5.3 Events subsequent to reporting date No significant events subsequent to the balance have occurred.
5.4 Impact of new and revised accounting standards
Certain new accounting standards and interpretations have been published that are not mandatory for 30 September 2018 reporting periods and have not been early adopted by the Group. The Group’s assessment of the impact of these standards is set out below.
AASB 9 Financial Instruments
AASB 9 is applicable to GrainCorp from 1 October 2018. AASB 9 includes a model for classification, measurement and derecognition of financial assets and liabilities, an expected credit loss impairment model and introduces new requirements for hedge accounting which have been amended to more closely align hedge accounting with risk management.
Following a detailed assessment of the requirements of the standard, GrainCorp does not expect AASB 9 to have a material impact on the classification, measurement and derecognition of financial assets and liabilities, nor is it expected to have a material impact of GrainCorp’s hedging relationships. Under AASB 9, expected credit losses on financial assets are to be recorded either on a 12-month or lifetime basis and takes into consideration forward-looking information. GrainCorp will apply the simplified approach and record lifetime expected credit losses on all eligible trade and other receivables. The expected impact of the revised methodology is not considered to be material due to the historically low level of bad debt in the Group and taking into account appropriate forward-looking information.
The new standard also introduces expanded disclosure requirements and changes in presentation. These are expected to change the nature and extent of the Group’s disclosures about its financial instruments particularly in the year of the adoption of the new standard.
AASB 15 Revenue from Contracts with Customers
AASB 15 is applicable to GrainCorp from 1 October 2018. AASB 15 is based on the principle that revenue is recognised when control of a good or service transfers to a customer. The new standard replaces the principle under the current standard of recognising revenue when risks and rewards transfer to the customer.
The Group has reviewed the revenue streams across the business including assessment of the significant revenue contracts. GrainCorp has performed a detailed impact assessment of AASB 15 including identification of the significant performance obligations, timing of transfer of control of goods or services performed and the associated revenue recognition. Based on this assessment, AASB 15 is not expected to have a material impact on the consolidated income statement. The Group will adopt the new standard under the full retrospective approach whereby the comparative period is restated and the cumulative effect on initial application is adjusted through opening retained earnings at 1 October 2018. The implementation project is ongoing and therefore all impacts are currently estimates which are subject to finalisation.
The adoption of AASB 15 will result in increased disclosure requirements, which are in the process of being assessed. AASB 15 required changes to the presentation and classification of items in the statement of financial position and income statement, including presentation of a contract asset or contract liability at the contract level and appropriate current and non-current split of all relevant balance sheet line items. AASB 15 also requires disclosure of disaggregated revenue.
AASB 16 Leases
AASB 16 is applicable to GrainCorp from 1 October 2019. AASB 16 requires a lessee to recognise a lease liability representing its obligation to make future lease payments and a right-of-use asset representing its right to use the underlying asset for the lease term. The accounting for lessors will not significantly change.
The lease liability is initially measured at the present value of future lease payments for the lease term. The right-of-use asset includes the lease liability, initial direct costs, restoration costs and any lease payments made before the commencement date of the lease. Lessees are required to recognise right-of-use assets and lease liabilities for all leases, with the exception of short-term and low value leases. Lessees will be required to separately recognise interest expense on the lease liability and depreciation on the right-of-use asset rather than recognising an operating lease expense.
Upon application of AASB 16, key balance sheet metrics such as gearing ratios, and profit or loss metrics such as earnings before interest, taxes, depreciation and amortisation (EBITDA) will be impacted. The cash flow statement will also be impacted as payments for the principal portion of the lease liability will be presented within financing activities. The standard permits either a full retrospective or a modified retrospective approach on transition.
The Group is compiling all lease contracts impacted by AASB 16 and is in the process of computing the estimated lease liability and right-of-use assets to be recognised on transition (including modelling the impact of the two transition methods), as well as reviewing system requirements. This process will be finalised by 30 September 2019, followed by consideration of broader business impacts, ready for implementation from 1 October 2019.
The adoption of AASB 16 will result in increased disclosure requirements, which are in the process of being assessed.
For
per
sona
l use
onl
y

GrainCorp Limited Directors’ Declaration
2018 Annual Report 93
GrainCorp Limited Directors’ Declaration
Page 93 of 103
Directors’ Declaration In the Directors’ opinion:
a) The financial statements and notes set out on pages 44 to 92 are in accordance with the Corporations Act 2001, including:
i. Complying with Accounting Standards, the Corporations Regulations 2001 and other mandatory professional reporting requirements; and
ii. Giving a true and fair view of the consolidated entity’s financial position as at 30 September 2018 and of its performance for the financial year ended on that date; and
b) There are reasonable grounds to believe that the Company will be able to pay its debts as and when they become due and payable; and
c) At the date of this declaration, there are reasonable grounds to believe that the members of the Closed Group identified in note 4.2 will be able to meet any obligation or liabilities to which they are, or may become, subject to by virtue of a deed of cross guarantee described in note 4.2.
The Basis of Preparation note as disclosed on page 50 confirms that the financial statements also comply with International Financial Reporting Standards as issued by the International Accounting Standards Board.
The Directors have been given the declarations by the Chief Executive Officer and Chief Financial Officer required by section 295A of the Corporations Act 2001.
This declaration is made in accordance with a resolution of the Directors.
G J Bradley AM Chairman
Sydney 15 November 2018
For
per
sona
l use
onl
y

Independent Auditor’s Report GrainCorp Limited
94 2018 Annual Report
PricewaterhouseCoopers, ABN 52 780 433 757One International Towers Sydney, Watermans Quay, Barangaroo, GPO BOX 2650, SYDNEY NSW 2001 T: +61 2 8266 0000, F: +61 2 8266 9999, www.pwc.com.au Level 11, 1PSQ, 169 Macquarie Street, Parramatta NSW 2150, PO Box 1155 Parramatta NSW 2124 T: +61 2 9659 2476, F: +61 2 8266 9999, www.pwc.com.au
Liability limited by a scheme approved under Professional Standards Legislation.
Independentauditor’sreportTo the members of GrainCorp Limited
Report on the audit of the financial report
Our opinion In our opinion:
The accompanying financial report of GrainCorp Limited (the Company) and its controlled entities (together the Group) is in accordance with the Corporations Act 2001, including:
(a) giving a true and fair view of the Group's financial position as at 30 September 2018 and of its financial performance for the year then ended
(b) complying with Australian Accounting Standards and the Corporations Regulations 2001.
What we have audited The Group financial report comprises:
the consolidated statement of financial position as at 30 September 2018 the consolidated statement of comprehensive income for the year then ended the consolidated statement of changes in equity for the year then ended the consolidated statement of cash flows for the year then ended the consolidated income statement for the year then ended the notes to the consolidated financial statements, which include a summary of significant accounting policies the directors’ declaration.
Basis for opinion We conducted our audit in accordance with Australian Auditing Standards. Our responsibilities under those standards are further described in the Auditor’s responsibilities for the audit of the financial report section of our report.
We believe that the audit evidence we have obtained is sufficient and appropriate to provide a basis for our opinion.
Independence We are independent of the Group in accordance with the auditor independence requirements of the Corporations Act 2001 and the ethical requirements of the Accounting Professional and Ethical Standards Board’s APES 110 Code of Ethics for Professional Accountants (the Code) that are relevant to our audit of the financial report in Australia. We have also fulfilled our other ethical responsibilities in accordance with the Code.
For
per
sona
l use
onl
y

GrainCorp Limited Independent Auditor’s Report
2018 Annual Report 95
Our audit approach An audit is designed to provide reasonable assurance about whether the financial report is free from material misstatement. Misstatements may arise due to fraud or error. They are considered material if individually or in aggregate, they could reasonably be expected to influence the economic decisions of users taken on the basis of the financial report.
We tailored the scope of our audit to ensure that we performed enough work to be able to give an opinion on the financial reportas a whole, taking into account the geographic and management structure of the Group, its accounting processes and controls and the industry in which it operates.
A total of seven components were identified across the Group’s three segments and the corporate head office.
Materiality
For the purpose of our audit we used overall Group materiality of $4.85 million, which represents approximately 5% of the Group’s adjusted weighted average profit before tax.
We applied this threshold, together with qualitative considerations, to determine the scope of our audit and the nature, timing and extent of our audit procedures and to evaluate the effect of misstatements on the financial report as a whole.
This benchmark was considered appropriate, because, in our view, profit/loss before tax is the metric against which the performance of the Group is most commonly measured. A weighted average of the current and four previous years was used due to the fluctuations in profit/loss from year to year driven by the cyclical nature of the business (weather conditions and crop quality). We adjusted for significant items as they were infrequently occurring or unusual items impacting profit.
We selected a 5% threshold based on our professional judgement, noting it is within the range of commonly acceptable thresholds.
Overall Group materiality is allocated to the identified components based on their relative contribution to the consolidated Group results. For each component we decided which balances should be tested based on their relative significance to the financial report and the allocated component materiality.
Audit Scope
Our audit focused on where the Group made subjective judgements; for example, significant accounting estimates involving assumptions and inherently uncertain future events.
Local component auditors in the United States and the United Kingdom assisted in the audit work performed, acting under instruction from the group audit team.
Each year the engagement leaders of the group audit team visit each significant overseas component to assist with the assessment of whether the audit procedures have been performed consistently with the audit instructions provided. On these visits the engagement leaders meet with local management and the overseas component audit team and perform a detailed review of the audit procedures for all significant audit risks identified. F
or p
erso
nal u
se o
nly

Independent Auditor’s Report GrainCorp Limited
96 2018 Annual Report
Key audit matters Key audit matters are those matters that, in our professional judgement, were of most significance in our audit of the financialreport for the current period. The key audit matters were addressed in the context of our audit of the financial report as a whole,and in forming our opinion thereon, and we do not provide a separate opinion on these matters. Further, any commentary on the outcomes of a particular audit procedure is made in that context. We communicated the key audit matters to the Board Audit Committee.
Key audit matter How our audit addressed the key audit matter
Sufficiency of the provision for customer claims Refer to note 3.6 $5.9 million
The Group’s Grains division receives, stores, transports and exports grain on behalf of its customers. Under contractual terms, customer claims can arise for damages or losses of grain, or due to the required grain quality/grade not being available at a specified location. Due to the nature of grain handling activities, claims can occur from time to time.
The Group maintains a provision for customer claims that reflects the liability for claims in relation to customer stock quantity, quality or freight for out of position stock. This was a key audit matter as there is significant judgement in the Group estimating the provision.
In determining the sufficiency of the provision for customer claims the Group considers a number of key assumptions including:
The estimation of potential future purchases of grain which may be required to settle claims.
Additional costs (e.g. transport costs) that would be incurred to satisfy customer obligations.
The current location of grain relative to customer ownership across the network; and
The grade profile of grain in the network relative to customer ownership.
We performed a number of procedures including the following:
Evaluated the volume and location of the physical and customer ownership balances used in the provision calculations through the comparison of the Group’s calculations to supporting documentation and by attending a sample of physical stock counts.
Evaluated the expected costs in the provision calculations by comparing costs to third party information.
Evaluated the grade profile of grain in the network relative to customer ownership.
Evaluated the Group’s historical ability to forecast customer claims by comparing last year’s provision to subsequent actual claims.
For
per
sona
l use
onl
y

GrainCorp Limited Independent Auditor’s Report
2018 Annual Report 97
Key audit matter How our audit addressed the key audit matter
Goodwill impairment assessment Refer to note 3.4 $444.7 million
This was a key audit matter due to the financial size of the goodwill balance and because the assessment of potential impairment involves significant judgement by the Group, including the following key assumptions:
Future cash flows for 2019–2023
Discount rate
Terminal growth rate
The Group performed an impairment assessment over the goodwill balance by:
Determining the group of cash generating units (Group of CGUs) and the amount of goodwill attributed from business combinations.
Calculating the value in use for each Group of CGUs using discounted cash flow models (the models). The models estimated cash flows for each Group of CGUs for 5 years, with a terminal growth rate applied to the 5th year. These cash flows were then discounted to net present value using the Group’s discount rates, taking into account the specific countries in which the Group of CGUs operates.
Comparing the calculated value in use of each Group of CGUs to their respective carrying amounts.
Goodwill is formally tested by the Group annually regardless of whether there is an indicator of impairment, a requirement under Australian Accounting Standards. The majority of the balance, acquired through business combinations, is allocated to the Malt and Oils Groups of CGUs.
We performed a number of procedures including the following:
Assessed whether the Group of CGUs were consistent with our understanding of the Group’s operations and internal Group reporting.
Considered whether the methodology applied in the models was consistent with the basis required by Australian Accounting Standards.
Compared the cash flow forecasts for 2019 in the models to those in the latest Board approved budgets.
Evaluated the Group’s ability to forecast future results for impairment models by comparing budgets with reported actual results for the previous year.
Compared the Group’s key assumptions for growth rates in the model forecasts to historical results and economic and industry forecasts.
Evaluated the discount rates in the models, with the assistance of PwC experts by assessing the reasonableness of the relevant inputs in the calculation against available market data and industry research.
Evaluated the appropriateness of the terminal growth rate in the models by comparison to the long term average growth rates of the countries that the Group operates in.
For
per
sona
l use
onl
y

Independent Auditor’s Report GrainCorp Limited
98 2018 Annual Report
Key audit matter How our audit addressed the key audit matter
Valuation of financial instruments held at fair valueRefer to note 2.6 Total derivative financial instrument assets: $135.7 million; Total derivative financial instrument liabilities: $128.1 million
At 30 September 2018 a valuation process was performed by the Group to determine the fair value of its financial instruments.
The valuation of financial instruments was a key audit matter given the significant level of estimation by the Group in calculating fair value of the derivative financial instruments.
Commodity contracts
The Group held significant commodity trading assets and liabilities subject to commodity risk, arising predominantly in the Grains, Oils and Malt segments. To manage this risk the Group entered into a number of financial instruments, primarily commodity derivative contracts. These arrangements aim to provide increased certainty as to the expected margin to be delivered by GrainCorp sales and purchases through the use of futures, options and over-the-counter contracts.
Foreign currency derivatives
The Group was exposed to transactional currency risk in instances where Group entities entered into transactions not denominated in their functional currency, as is typical in this market. To manage this risk the Group entered into forward exchange contracts and foreign currency options.
We performed a number of procedures including the following:
Tested key year-end reconciliations between underlying source systems and spreadsheets used.
Obtained confirmation of the Group’s financial instruments directly from the counterparties and tested that all confirmed arrangements had been recorded by the Group.
Tested the calculation of fair value movements on a sample of derivatives during the period to check these movements were recognised in the consolidated income statement or deferred in accordance with the Group’s accounting policy detailed in note 2.6.
Commodity contracts
Where possible, the valuation of derivatives were agreed to independent third party prices. These included the recalculation on a sample basis of the fair value of forward contracts, futures and options.
Assessed the adjustments made to third party prices to take account of specific locations or contractual conditions. This included re-performing a sample of calculations using independent third party prices (from other commodity brokers) as well as testing the mathematical accuracy of the Group’s analysis.
Assessed the valuation of a sample of option and futures derivatives, assisted by PwC valuation experts by evaluating the Group’s key assumptions and valuation inputs and reperforming the valuation.
Foreign currency derivatives
Assessed the valuation of a sample of option and futures derivatives, assisted by PwC valuation experts by evaluating the Group’s key assumptions and valuation inputs and reperforming the valuation.
For
per
sona
l use
onl
y

GrainCorp Limited Independent Auditor’s Report
2018 Annual Report 99
Key audit matter How our audit addressed the key audit matter
Taxation Refer to note 1.6 Income tax expense: $3.1m; Current tax assets: $9.7m; Current tax liabilities: $1.5m; Deferred tax assets: $29.7m; Deferred tax liabilities: $68.5m Income tax and deferred tax balances were a key audit matter because the Group operates across multiple jurisdictions with different laws, regulations and authorities. Judgement is also involved in the tax calculations, including the assessment of the recoverability of recorded tax losses.
Current and deferred tax balances and income tax expense are both significant in the context of the overall statement of financial position and the statement of comprehensive income of the Group.
We performed a number of procedures including the following:
Tested the Group's current and deferred tax calculations, including the rationale on which current and deferred tax balances are recognised and the mathematical accuracy of the Group’s calculations.
Developed an understanding and evaluated the key drivers of the effective tax rate including risks relating to being part of a multinational group.
Engaged PwC tax specialists and read a sample of external advice obtained by the Group to assess the provisions for tax under Australian Accounting Standards.
Assessed the appropriateness of the Group’s disclosure in relation to these matters in the financial report.
Other information The directors are responsible for the other information. The other information comprises the information included in the annualreport for the year ended 30 September 2018, including the Chairman's Statement, Managing Director & CEO's Statement, Board of Directors and Executives, Directors' Report, Operating and Financial Review, Additional Disclosures, Shareholder Information and Corporate Directory, but does not include the financial report and our auditor’s report thereon.
Our opinion on the financial report does not cover the other information and accordingly we do not express any form of assurance conclusion thereon.
In connection with our audit of the financial report, our responsibility is to read the other information identified above and, in doing so, consider whether the other information is materially inconsistent with the financial report or our knowledge obtainedin the audit, or otherwise appears to be materially misstated.
If, based on the work we have performed, we conclude that there is a material misstatement of this other information, we are required to report that fact. We have nothing to report in this regard.
Responsibilities of the directors for the financial report The directors of the Company are responsible for the preparation of the financial report that gives a true and fair view in accordance with Australian Accounting Standards and the Corporations Act 2001 and for such internal control as the directors determine is necessary to enable the preparation of the financial report that gives a true and fair view and is free from materialmisstatement, whether due to fraud or error.
In preparing the financial report, the directors are responsible for assessing the ability of the Group to continue as a going concern, disclosing, as applicable, matters related to going concern and using the going concern basis of accounting unless thedirectors either intend to liquidate the Group or to cease operations, or have no realistic alternative but to do so.
For
per
sona
l use
onl
y
Independent Auditor’s Report GrainCorp Limited
100 2018 Annual Report
Auditor’s responsibilities for the audit of the financial report Our objectives are to obtain reasonable assurance about whether the financial report as a whole is free from material misstatement, whether due to fraud or error, and to issue an auditor’s report that includes our opinion. Reasonable assurance isa high level of assurance, but is not a guarantee that an audit conducted in accordance with the Australian Auditing Standards will always detect a material misstatement when it exists. Misstatements can arise from fraud or error and are considered material if, individually or in the aggregate, they could reasonably be expected to influence the economic decisions of users taken on the basis of the financial report.
A further description of our responsibilities for the audit of the financial report is located at the Auditing and Assurance Standards Board website at: http://www.auasb.gov.au/auditors_responsibilities/ar1.pdf. This description forms part of our auditor's report.
Report on the remuneration report
Our opinion on the remuneration report We have audited the remuneration report included in pages 30 to 42 of the directors’ report for the year ended 30 September 2018.
In our opinion, the remuneration report of GrainCorp Limited for the year ended 30 September 2018 complies with section 300A of the Corporations Act 2001.
Responsibilities The directors of the Company are responsible for the preparation and presentation of the remuneration report in accordance with section 300A of the Corporations Act 2001. Our responsibility is to express an opinion on the remuneration report, based on our audit conducted in accordance with Australian Auditing Standards.
PricewaterhouseCoopers
Kristin Stubbins SydneyPartner 15 November 2018
David Ronald SydneyPartner 15 November 2018
For
per
sona
l use
onl
y

GrainCorp Limited Shareholder Information
2018 Annual Report 101
GrainCorp Limited Shareholder Information
Page 101 of 103
Shareholder Information Holdings distribution as at 31 October 2018 Range Securities % No. Of Holders %
100,001 and Over 196,737,004 86.0 48 0.4 50,001 to 100,000 2,047,531 0.9 29 0.2 10,001 to 50,000 9,234,596 4.0 506 3.7 5,001 to 10,000 7,222,190 3.2 1,020 7.5 1,001 to 5,000 10,770,044 4.7 4,614 34.0 1 to 1,000 2,844,263 1.2 7,360 54.2 Total 228,855,628 100.0 13,577 100.0 Unmarketable parcels 10,766 0.0 753 5.6 Twenty largest shareholders as at 31 October 2018 Rank Name Shares held Issued Capital
1 HSBC Custody Nominees (Australia) Limited 74,984,124 32.8% 2 J P Morgan Nominees Australia Limited 45,429,374 19.9% 3 Citicorp Nominees Pty Limited 36,326,402 15.9% 4 National Nominees Limited 18,238,026 8.0% 5 BNP Paribas Nominees Pty Ltd 7,236,159 3.2% 6 UBS Nominees Pty Limited 4,222,632 1.9% 7 BNP Paribas Nominees Pty Ltd 3,655,207 1.6% 8 Jarjums Holdings Pty Limited 1,790,000 0.8% 9 CS Third Nominees Pty Limited 1,487,446 0.7% 10 Tamorer Pty Limited 1,280,000 0.6% 11 Mrs Ingrid Kaiser 1,133,976 0.5% 12 Warbont Nominees Pty Limited 1,023,690 0.5% 13 Pacific Custodians Pty Limited 383,093 0.2% 14 Neweconomy Com Au Nominees Pty Limited 363,475 0.2% 15 Pacific Custodians Pty Limited 357,518 0.2% 16 Ecapital Nominees Pty Limited 298,897 0.1% 17 GNC Directors’ Holdings 276,280 0.1% 18 AMP Life Limited 261,411 0.1% 19 Brispot Nominees Pty Ltd 260,913 0.1% 20 Navigator Australia Ltd 246,440 0.1% Total 199,255,063 87.1% Balance of register 29,600,565 12.9% Grand total 228,855,628 100.0% Substantial shareholders The following organisations disclosed a substantial shareholding notice in GrainCorp Limited by 12 November 2018:
Name Notice Date Shares held Issued Capital
Ellerston Capital 23 May 2018 38,276,043 16.7% Perpetual Limited 30 April 2018 29,583,306 12.9% Norges Bank 5 September 2018 14,408,690 6.3% Dimensional Entities 21 August 2017 13,742,579 6.0% H.E.S.T. Australia Limited 16 April 2018 11,790,753 5.2% Voting rights On a show of hands, every member present in person or by proxy shall have one vote, and upon each poll, each share shall have one vote.
For
per
sona
l use
onl
y

GrainCorp Limited
102 2018 Annual Report
This page has been left intentionally blank
For
per
sona
l use
onl
y

GrainCorp Limited Corporate Directory
2018 Annual Report 103
GrainCorp Limited Corporate Directory
Page 102 of 103
Corporate Directory Board of Directors Graham J Bradley AM (Chairman)
Mark L Palmquist (Managing Director & CEO)
Rebecca P Dee-Bradbury (Non-executive Director)
Barbara J Gibson (Non-executive Director)
Peter J Housden (Non-executive Director)
Donald G McGauchie AO (Non-executive Director)
Daniel J Mangelsdorf (Non-executive Director)
Peter I Richards (Non-executive Director)
Simon L Tregoning (Non-executive Director)
Company Secretary Amanda Luhrmann
Gregory Greer
Registered Office Level 28 175 Liverpool Street Sydney NSW 2000 AUSTRALIA
Tel: + 61 2 9325 9100 Fax: + 61 2 9325 9180
Company website www.graincorp.com.au
Share Registry Link Market Services Limited Locked Bag A14 Sydney South NSW 1235
Tel: +61 2 8280 7111
For
per
sona
l use
onl
y

Level 28, 175 Liverpool Street Sydney NSW 2000, Australia
graincorp.com.au
For
per
sona
l use
onl
y