Embed Size (px)
Citation preview

Alumina Limited GPO Box 5411, Melbourne Victoria 3001 Australia ABN 85 004 820 419 aluminalimited.com
Level 12, IBM Centre 60 City Road, Southbank Victoria 3006 Australia tel +61 (0)3 8699 2600 fax +61 (0)3 8699 2699
ASX Announcement 28 March 2018
Alumina Limited 2017 Annual Report
Attached, is a copy of Alumina Limited’s Annual Report 2017.
Stephen Foster Company Secretary 28 March 2018 F
or p
erso
nal u
se o
nly

ANNUAL REPORT 2017
AWAC, one of the world's largest bauxite and
alumina producers.
For
per
sona
l use
onl
y

The quality of Alumina Limited's assets and improved markets delivered outstanding returns for shareholders in 2017.
For
per
sona
l use
onl
y

Structural reforms within China signal a new phase for global bauxite and alumina markets.
¬1 Alumina Limited Annual Report 2017
CONTENTS
02 At a Glance
06 Chairman and CEO Report
12 Sustainability
14 Director's Report
20 Operating and Financial Review
36 Letter by Chair of the Compensation Committee
38 Remuneration Report
62 Financial Report
98 Shareholder Information
100 Financial History
For
per
sona
l use
onl
y

2¬
For
per
sona
l use
onl
y

¬3 Alumina Limited Annual Report 2017
Alumina Limited is a leading Australian company listed on the Australian Securities Exchange (ASX).
Alumina Limited is the 40 per cent partner in the Alcoa World Alumina and Chemicals (AWAC) joint venture whose assets comprise globally leading bauxite mines and alumina refineries in Australia, Brazil, Spain, Saudi Arabia and Guinea. AWAC also has a 55 per cent interest in the Portland aluminium smelter in Victoria, Australia.
AWAC’s joint partner and operator is Alcoa Corporation. The AWAC joint venture was formed in 1994 and our relationship with Alcoa dates back to the early 1960's when Western Mining Corporation (now Alumina Limited) began to explore bauxite deposits and other resources in the Darling Ranges of Western Australia. Alcoa Inc. was invited to join the project to provide technology, aluminium expertise and finance.
Over the following years the venture grew to include refineries and smelter interests as the partners sought to take opportunities to expand the business. By 1990, WMC Limited’s interests in Alcoa of Australia had grown through acquiring the interests of other minority participants, other than Alcoa.
Alumina Limited provides a unique opportunity for a pure investment in AWAC, one of the world's largest bauxite and alumina producers.
WMC Limited (now Alumina Limited) and Alcoa Inc. combined their respective bauxite, alumina and alumina-based chemicals businesses and investments and some selected smelting operations to create Alcoa World Alumina and Chemicals (AWAC in January 1995.
About Alumina Limited
For
per
sona
l use
onl
y

4¬
At a Glance
In 2017 Alumina Limited recorded a profit after tax of $339.8 million compared to a net loss of $30.2 million in 2016.
Improvements in realised alumina prices resulted in significantly improved operating performance by Alcoa World Alumina and Chemicals (AWAC).
Index pricing for alumina quickly translated more favourable market outcomes to Alumina Limited's bottom line.
AWAC’s financial performance reflected the underlying strengths of its tier one assets, improvements in the quality of its asset portfolio and a new phase of policy-making in China.
$58.4mNET DEBT US$58.4 MILLION
(2016: US$83.8 MILLION)
$343.1mCASH RECEIPTS OF US$343.1 MILLION
(2016: CASH US$232.8 MILLION)
$339.8mNET PROFIT AFTER TAX US$339.8 MILLION
(2016: NET LOSS AFTER TAX: US$(30.2) MILLION)
13.5 US cents per share2017 DIVIDENDS OF US13.5 CENTS PER SHARE
(2016: DIVIDEND: US6.0 CENTS PER SHARE)
ALUMINA LIMITED RESULTS (AAS)
For
per
sona
l use
onl
y

¬5 Alumina Limited Annual Report 2017
AWAC - a Global Business
In 2017 AWAC recorded a net profit after tax of $901.3 million compared to a net profit after tax of $49.0 million in 2016. AWAC’s results were impacted by alumina price fundamentals. Also, the sea borne bauxite market saw third party bauxite sales increase to 6.6 million bone dry tonnes (BDT). AWAC’s EBITDA, excluding significant items rose to $1,685.3 million compared to $757.2 million in 2016.
Cash from operations spurred by the higher alumina sales price increased to $1,102.4 million up from negative $26.2 million. The 2017 average realised alumina price was $335 per tonne, a year on year improvement of $93 per tonne (38%). With approximately 85% of shipments priced on spot or an index basis, AWAC was well positioned to capitalise on the steep upward price movement.
$1,102.4mAWAC CASH FROM OPERATIONS US$1,102.4 MILLION
(2016: US$(26.2) MILLION)
US$335/tonne
REALISED ALUMINA PRICE OF US$335 PER TONNE
(2016: US$242 PER TONNE)
$901.3mAWAC NET PROFIT AFTER TAX US$901.3 MILLION
(2016 NET PROFIT AFTER TAX: US$49.0 MILLION)
US$1,685.3mAWAC EBITDA EXCLUDING SIGNIFICANT ITEMS US$1,685.3 MILLION
(2016: US$757.2MILLION)
AWAC RESULTS (US GAAP)
For
per
sona
l use
onl
y

¬7 6¬ Alumina Limited Annual Report 2017
2017 was an outstanding year for Alumina Limited. AWAC’s tier one assets can withstand the low points of the cycle and generate excellent returns when markets are favourable.
In 2017, the alumina industry experienced potentially far reaching changes. New Chinese Government pollution reduction and efficiency policies and improved global market fundamentals saw a 38 per cent increase in alumina prices compared with the 2016 average price. Better prices, together with improvements in the AWAC asset portfolio resulted in the Company’s net profit increasing to $340 million. Dividends to shareholders more than doubled to US13.5 cents per share.
CHANGING MARKETS
In 2017, the Chinese Central and Regional Governments introduced policies to reduce pollution by mandating significant curtailments including alumina, aluminium and carbon production in selected cities during the 2017/18 winter. These policies required the curtailment of 30 percent of China’s alumina and aluminium production in the selected cities. There have also been a number of Chinese Government environmental audits in 2017 which have led to a reduction in bauxite and alumina production.
The Central Government also introduced supply side reforms in 2017 to reduce inefficient or obsolete capacity in aluminium and other industries. This has led initially to the curtailment of a significant volume of smelting capacity built without authorisation. A scheme has been introduced which allows companies to obtain replacement quotas authorising additional capacity. This is expected to add to Chinese smelting capacity coming online during 2018 and to restrict smelting growth beyond 2018–2019.
The alumina supply/demand balance outside China also tightened in the second half of 2017. Increased costs in producing alumina, improved aluminium prices and strong demand for alumina
(including from Atlantic smelters), all contributed to a steep rise in alumina prices.
The alumina spot price increased from an average of $318 per tonne for the first half of 2017, reaching a 2017 high of $484 and averaging $390 for the second half. Alumina prices have continued to trade strongly in early 2018.
OPERATIONAL HIGHLIGHTS
AWAC produced its best cash returns since 2007. AWAC’s full year net profit after tax was US$901 million. AWAC's realised alumina prices averaged $335 per tonne in 2017 and it's position in the lowest quartile on the cost curve produced alumina margins of $137 per tonne in 2017, compared with $51 per tonne in 2016.
AWAC’s high quality refineries at Pinjarra and Wagerup in Australia and Alumar, Brazil achieved production records in 2017. Total AWAC alumina production was 12.5 million mtpa in 2017.
AWAC’s bauxite mines in Australia and Brazil also achieved production records for 2017.
AWAC’s cost of alumina production increased to $198 per tonne in 2017, a 3.7 percent increase year on year mainly driven by an increase in caustic soda prices – a key production input.
The ramping up of Ma'aden's Saudi Arabian bauxite mine and alumina refinery (in which AWAC holds a 25.1 per cent interest) continued during 2017. The Ma’aden refinery has recently operated at its full production capacity of 1.8 million mtpa. At full production it is expected to operate within the lowest quartile on a cash cost basis.
Chairman and CEO Report
For
per
sona
l use
onl
y

¬7 6¬ Alumina Limited Annual Report 2017
MR G JOHN PIZZEY
MR MIKE FERRAROFor
per
sona
l use
onl
y

¬9 8¬ Alumina Limited Annual Report 2017
With higher alumina prices and margins in 2017, AWAC’s cash from operations increased from $26 million to $1,102.4 million. Alumina Limited received a higher level of cash distributions of $343m from AWAC. The changes to the AWAC Agreements on distributions agreed in September 2016 ensured that the benefits of strong cash flow were quickly distributed to Alumina Limited. This enabled payment of a final dividend of US9.3 cents per share, bringing the total declared dividend for the year to US13.5 cents per share. This is a substantial increase on the US6.0 cents per share for 2016.
ALUMINA LIMITED STRATEGY
The AWAC joint venture has existed for over 55 years, when Alumina Limited (then known as Western Mining Corporation) explored in the Darling Ranges in Western Australia and sought partners to develop bauxite. The business and its partners have seen many changes over that time. Alumina Limited and its majority joint venture partner Alcoa re-negotiated the terms of the AWAC agreements in 2016 resulting in significantly better alignment on achieving the best outcomes for AWAC. Alcoa and Alumina are deeply focussed on achieving the best outcomes for AWAC.
New Chinese Government pollution reduction and efficiency policies and improved global market fundamentals saw a 38 per cent increase in alumina prices compared with the 2016 average price.
Alumina Limited’s objective is to manage its joint venture interest to enhance the joint venture’s value, whilst also protecting its shareholders' interests. The Company’s strategy is to invest in long-life, low-cost bauxite mining and alumina refining operations through its 40 percent ownership of AWAC, one of the world’s largest alumina and bauxite producers.
The expansion by China to constitute nearly 55 per cent of the world alumina industry has challenged the rest of the world industry and their returns.
AWAC’s strategy in response has been to actively manage its asset portfolio, drive down its cost position, and achieve alumina pricing based on alumina market fundamentals. AWAC’s long life and low cost bauxite mines and refineries in Western Australia, and joint venture investment in the Saudi Arabia refinery are clearly tier one assets. The quality of AWAC's assets has enabled it to withstand challenging industry conditions.
The capacity expansion within China over the last decade and resulting cost pressures on the existing industry nonetheless required AWAC to close, mothball or sell the least robust of its assets. The outcome was a substantial increase of the quality of the portfolio as a whole. The higher cost Kwinana and San Ciprian refineries were restructured and significantly improved.
The changes to the alumina and aluminium markets, particularly within China over the last 12 months are highly significant. They represent the first evidence of the impact from China reducing excess capacity and imposing stricter pollution controls. The permanence of these changes and impacts are still to be seen. However, AWAC is very well positioned, as a large, low cost producer, to benefit from these market changes.
AWAC’s long life and low cost bauxite mines and refineries in Western Australia, and joint venture investment in the Saudi Arabia refinery are clearly tier one assets.
GROWING AWAC
AWAC’s bauxite mining business unit consolidated its position during 2017. AWAC supplied 6.6 million bone dry tonnes (BDT) to the third party bauxite market in 2017. The Juruti mine in Brazil has undergone two separate expansions from 2016, which will increase production capacity to 5.7 million mtpa during 2018. These expansions have been made at a very low capital investment by utilising existing infrastructure.
AWAC is also supplying bauxite from its Huntly mine in Western Australia to China. This is an important step forward in leveraging the existing resource and infrastructure of the Western Australian bauxite operations. AWAC has committed to a capital project to provide increased bauxite export capability through Western Australia. The project includes bauxite unloading facilities, a new rail loop and a train unloading facility.
For
per
sona
l use
onl
y

¬9 8¬ Alumina Limited Annual Report 2017
PORTLAND'S FUTURE
In 2017, Alcoa of Australia entered into a new 4 year power supply agreement, and arrangements with the Victorian and Australian Governments for the restart of the Portland smelter. Power prices paid by the smelter are very high compared to its Western World competitors.
Portland’s future is secured only for the medium term. The supply of affordable energy in Eastern Australia is of significant national interest. AWAC is exploring long term, reliable and competitively-priced energy solutions for the Portland smelter. However, Eastern Australia’s energy competitiveness has deteriorated significantly in recent years. There is an enormous challenge for energy intensive users such as Portland to plan and operate competitively in that environment.
Portland’s future is secured only for the medium term.
CAPITAL MANAGEMENT/SHAREHOLDER RETURNS
Alumina’s dividend policy is that the Board intends on an annual basis to distribute cash from operations after debt servicing and corporate costs and capital commitments have been met. The Board will also consider the capital structure of Alumina Limited, the capital requirements for the AWAC business and market conditions.
Corporate costs for Alumina Limited in 2017 were lower at US$13.6 million compared with 2016 when expenses were incurred to reach agreement on the Alcoa Inc Separation.
Alumina’s debt is currently at low levels and gearing is 2.5 per cent. The Company’s low debt levels enabled distributions from AWAC to be readily made to shareholders.
SUSTAINABILITY
The impact of AWAC operations extends beyond economic and financial outcomes and includes social and environmental matters relevant to the community. AWAC continues to be successful in developing strategies and utilising innovative new technologies to minimise environmental impacts. Strategic goals have been set for a variety of environmental impacts including emissions, energy, water, land and waste management.
A recent success has been the introduction of pressure filtration technology at the Kwinana alumina refinery in Western Australia that uses very large filters to extract water from bauxite residue. The water obtained via the process is recycled back into the refinery process. Application of this technology has deferred the need to construct another 30-hectare residue storage area for
at least 20 years compared to every five years previously. This technology reduces freshwater use by 1.2 gigalitres per annum and, importantly, contributes to directly reducing the footprint of the residue storage areas, reduces dust emission, returns process material immediately back to the refinery for use and reduces capital investment and operating costs. This technology will now be applied at the Pinjarra refinery.
GOVERNANCE
The Remuneration Report reviews the Company’s remuneration strategy, policy and outcomes. The Company’s 2017 Remuneration Report provides full details of the personal and corporate objectives of senior executives and an assessment of performance against those objectives.
The Company reports its governance practices consistent with the 3rd Edition of the Corporate Governance Principles and Recommendations of the ASX Corporate Governance Council. Alumina’s compliance with the Corporate Governance Principles and Recommendations is defined in the Appendix 4G lodged with the ASX.
For Non-Executive Directors, fees had been unchanged since 1 January 2011 until 2017. In 2017, while base Non-Executive Director fees remain at $150,000, fees for chairing Board Committees were increased in 2017 and the Chairman’s fee was increased by 9 percent.
BOARD AND MANAGEMENT
In November 2017, John Pizzey announced his decision to retire as Non-Executive Director and Chairman of Alumina Limited on 31 March 2018. He has been a Director of the Company since 2007 and Chairman since December 2011. Mr Pizzey exercised his considerable industry experience and drive to lead the Company through a major transformation. We acknowledge and thank Mr Pizzey for his outstanding contribution to the Company.
The Board appointed Peter Day to succeed Mr Pizzey as Chairman of the Company. Mr Day has been a Non-Executive Director with the Company since January 2014.
Alumina Limited has continued its process of succession planning in 2017. Mr John Bevan and Ms Deborah O’Toole joined as directors and a new CEO was appointed. Mr Bevan was previously Chief Executive Officer of Alumina Limited from 2008 to 2013. Mr Bevan will bring a valuable understanding of the markets and the joint venture in which the Company operates. Ms O’Toole is a former Chief Financial Officer of MIM and Aurizon and brings extensive financial knowledge and expertise.
Particular thanks goes to Peter Wasow who retired as Chief Executive Officer in May 2017 after three and a half years in the role. Mr Wasow’s leadership of the Company was integral to the substantive changes to the AWAC joint venture in 2016.
For
per
sona
l use
onl
y

10¬
Bauxite demand is expected to grow along with alumina demand. However, there is an ample current global supply of bauxite. Increases in production from Guinea are expected to continue and further supply from Indonesia and Malaysia is likely in 2018. This will ensure that bauxite remains well-supplied and prices are likely to remain flat in 2018. Guinea is expected to be the marginal supplier of bauxite to China in the near to mid-term at least. However, the Government’s environmental focus in China is having an impact on bauxite production and the location of new refining capacity. This is likely to accelerate the increased demand for imported bauxite into China from the step-change expected around 2021 as Chinese domestic bauxite quality depletes.
CONCLUSION
The benefit of AWAC’s tier one assets is not only can they withstand low points of the cycle, they generate excellent returns when markets are strong. This is precisely what we have seen this year. Following difficult years that required a succession of hard decisions, AWAC’s portfolio is now even more concentrated on the most competitive assets in the global market. China has recognised some of the social costs of expansion. Its efforts to contain these costs have resulted in curtailments of supply, signalling a new and potentially more positive phase for bauxite, alumina and aluminium markets worldwide.
The Board thanks the employees of Alumina Limited for their work in 2017.
Mike Ferraro Chief Executive Officer —
GJ Pizzey Chairman —
Mike Ferraro, who has been a Non-Executive Director of Alumina Limited since 2014, began as Chief Executive Officer on 1 June 2017. Mr Ferraro brings extensive skills and experience as a partner of Herbert Smith Freehills, a member of its global management committee and through his previous senior role in the resources industry with BHP Billiton.
AWAC's portfolio is now even more concentrated on the most competitive assets in the global market.
OUTLOOK
Demand for alumina is expected to continue to grow in 2018, with smelter grade alumina production forecast to reach over 129 million tonnes globally, an annual increase of over 4%. Restoration of disrupted production and new smelting production is expected in China, India, USA, Oman, Australia and Bahrain. The Atlantic market alumina supply remains tight. However, extra alumina supply is coming online in Jamaica from a previously curtailed refinery and first alumina is expected from a new refinery in the UAE in the first half of 2019. The ABI Bécancour smelter in Canada has been partly curtailed related to industrial action and its annualised production may drop for some time, decreasing alumina demand in the Atlantic. The world's largest refinery in Brazil, Alunorte, may produce less alumina following an incident in February 2018. The announced imposition of tariffs on the import of primary aluminium into the USA, may lead to a greater likelihood of more restarts of curtailed US smelters which would increase demand for alumina in the USA. These matters may cause some fluctuations in 2018 in the alumina price. Otherwise alumina supply/demand is expected to remain reasonably balanced.
The full extent of the Chinese alumina and aluminium curtailments to combat pollution in heavily-populated areas in China will not be known until after the end of the Chinese winter heating season in March 2018. However, the cuts have been significant and because they appear to have had a positive impact on pollution they may be repeated, at least in the winter of 2018/19. Furthermore, environmental audits of bauxite mines, alumina refineries and aluminium smelters are continuing in China and have led to recent curtailments due to non-compliance. Also, the environmental imperative to consume more gas than coal where possible has led to natural gas shortages in parts of China. This has impacted China's alumina production.F
or p
erso
nal u
se o
nly

¬11 Alumina Limited Annual Report 2017
For
per
sona
l use
onl
y

¬13 12¬ Alumina Limited Annual Report 2017
Sustainability
“Future positive” well describes Alumina Limited's outlook for 2018. Our confidence extends from positive financial results for shareholders to our view on the impacts of AWAC’s operations on the environment and on its protection for future generations. AWAC's focus on continuous improvement has resulted in better sustainability outcomes.
AWAC is a modern business in the sense that it is accountable to both its shareholders and to the broader society to which the business is a positive contributor. Alumina is acutely aware that because the AWAC business operates as part of the community, its operating procedures and impacts must be responsible and acceptable. Alumina understands that AWAC’s environmental impacts are critical and that the community expects that the company will find an appropriate balance for its financial imperatives and its obligations to future generations through the sustainability of its activities.
AWAC’s desired sustainability outcomes are incorporated into the heart of its business strategy, planning and processes. Targeted outcomes are derived from an assessment of how key material aspects of the business impact both the social and physical environment of its operations.
For the AWAC business the key material aspects cover:
• Energy
• Emissions
• Water management
• Waste management
• Land management
• Health and Safety
• Local communities
• Economic considerations.
AWAC takes into account what key stakeholders say about the key material aspects of its operations. One of the most important themes stakeholders raise is the need for AWAC to constantly improve the management of its processing residues. Managing bauxite residues and waste is a key environmental issue for AWAC and its local communities and it comes with significant financial impact. The company is pleased to report that process and storage improvements in residue management introduced in the year are indeed future positive.
AWAC takes into account what key stakeholders say about the key material aspects of its operations.
At AWAC's Western Australian refineries, bauxite residue is produced at a rate of approximately two dry tonnes per tonne of alumina. The residue consists of coarse red sand (approximately 40%) and a fine silt fraction often referred to as red mud (approximately 60%). Bauxite residue has raised alkalinity due to the addition of caustic soda and lime in the refining process. It requires substantial storage areas. Typical storage areas consist of raised impoundments into which a thickened residue slurry is pumped progressively in layers to allow for solar drying. Successive layers are applied over the footprint of the storage area. An ongoing issue is the control of dust that is generated off surface residues. Management to minimise dust generation includes turning over the red mud, using sprinklers and water carts, spraying exposed banks with a dust suppressant, planting grasses or other vegetation and applying wood mulch.F
or p
erso
nal u
se o
nly

¬13 12¬ Alumina Limited Annual Report 2017
Residue management impacts.
• Site land management – particularly the utilisation of land to store the residue
• Water management – water consumed, alkaline recovery, process water management and dust suppression activities
• External environment – managing and containing alkaline material
• Local communities – mitigating dust impacts.
This year AWAC introduced an innovative pressure filtration system at the Kwinana refinery which produces a residue cake (70% solids) that can be stacked and does not require the construction of an impoundment. A similar system is being constructed at the Pinjarra refinery.
The application of this residue treatment technology at Pinjarra is expected to deliver multiple benefits including:
• Eliminating the need for new greenfield residue storage areas (RSAs) for at least 30 years
• Reduced environmental footprint for residue management and reduced sustaining capital investment compared to the current dry stacking process
• Significantly reducing the need to draw additional water to meet the processing requirements of the refinery by approximately 2 gigalitres per annum
• Significant reduction in capital expenditure.
• These are positive outcomes that see financial and sustainability benefits go hand in hand.
For a more comprehensive review of Alumina Limited’s and AWAC’s sustainability objectives, governance, processes and results, view the Sustainability Update on the Company web site at www.aluminalimited.com/sustainability-update-2016.
Above: Kwinana alumina refinery – pressure filtration facility.
For
per
sona
l use
onl
y

¬15 14¬ Alumina Limited Annual Report 2017
Director’s Report
The Directors present their report on the consolidated entity consisting of Alumina Limited (the Company) and the entities it controlled at the end of, or during, the year ended 31 December 2017 (together the Group).
BOARD OF DIRECTORS
The Company’s Directors in office as at 31 December 2017 were:
— MR G JOHN PIZZEY B.E (CHEM), DIP. MGT., FTSE, FAICD
Independent Non-Executive Director and Chairman
Mr Pizzey was elected a Director of the Company on 8 June 2007. He is a Non-Executive Director of Orora Limited (appointed December 2013), Non-Executive Director and Chairman of Kidman Resources Limited (appointed January 2018) and former Non-Executive Director and Chairman of Iluka Resources Ltd (appointed November 2005 and resigned December 2013) and a former Non-Executive director of Amcor Limited (appointed September 2003 and resigned December 2013).
Unless otherwise indicated, the following persons were Directors of the Company during the whole of the financial year and up to the date of this report:
G J Pizzey (Chairman)
P C Wasow (Managing Director and Chief Executive Officer) (part year – retired 31 May 2017)
E R Stein
C Zeng
W P Day
D O’Toole (part year – appointed 1 December 2017)
M P Ferraro (Non-Executive Director until 31 May 2017; appointed Managing Director and Chief Executive Officer 1 June 2017)
J A Bevan was appointed a Non-Executive Director on 1 January 2018.
DIRECTORSMr Pizzey is a life governor of Ivanhoe Grammar School and a former chairman and director of the London Metal Exchange. He is a member of the Audit and Risk Management Committee and of the Nomination and Compensation Committees and was Chair of the then Audit Committee to 30 November 2011. Mr Pizzey has extensive business experience including 33 years as an executive in the alumina and aluminium industries.
— MS EMMA R STEIN BSC (PHYSICS) HONS, MBA, FAICD, HON FELLOW WSU
Independent Non-Executive Director
Ms Stein was elected as a Director of the Company on 3 February 2011.
Ms Stein is currently a Non-Executive Director of Cleanaway Waste Management Limited (formerly known as Transpacific Industries Group Ltd (appointed August 2011)) and Infigen Energy Limited (appointed September 2017). She is a former Non-Executive Director of Programmed Maintenance Services Ltd (appointed June 2010 and resigned October 2017), Diversified Utilities Energy Trust (appointed June 2004 and resigned May 2017) and Clough Limited (appointed July 2008 and resigned December 2013). Formerly the UK Managing Director for French utility Gaz de France’s energy retailing operations, Ms Stein moved to Australia in 2003. Before joining Gaz de France, she was UK Divisional Managing Director for British Fuels.
Ms Stein is Chair of the Compensation Committee (since 1 January 2014), current member and former Chair of the Audit and Risk Management Committee (Chair from 28 November 2013 to 31 December 2013) and current member and Chair of the Nomination Committee. As a senior executive, she gained considerable international experience in management and leadership, strategy development and implementation in global industrial, energy and utilities markets. She has over a decade of experience as a listed Non-Executive director and board committee chair for capital intensive companies spanning resources, oil and gas and related sectors.
For
per
sona
l use
onl
y

¬15 14¬ Alumina Limited Annual Report 2017
— MR CHEN ZENG MIF
Non-Executive Director
Mr Zeng was appointed as a Director of the Company on 15 March 2013. He is a member of the Nomination, Compensation and Audit and Risk Management Committees (appointed 7 August 2014). Mr Zeng is also currently a director of CITIC Pacific Limited, Chief Executive Officer of CITIC Pacific Mining and Chief Executive Officer of CITIC Mining International, the holding company of CITIC Pacific Mining. He is a former director of CITIC Limited (listed on the Hong Kong Exchange), CITIC Dameng (listed on the Hong Kong Exchange), Macarthur Coal Limited (2007 to 2011) and Marathon Resources Limited (resigned 31 January 2014). Mr Zeng also served as a director on the Board of CITIC Group between 2010 and 2011.
Before joining CITIC Pacific Mining, Mr Zeng was the Vice Chairman and CEO of CITIC Resources, a CITIC Group controlled Hong Kong listed company focused on crude oil production, metal mining and refining, and commodity trading. Mr Zeng is also the Chairman of CITIC Australia. Mr Zeng has over 27 years of experience in project development, management, and a proven record in leading cross-cultural professionals in the resources sector. He has been working in Australia since 1994 and has extensive experience in various industries including aluminium smelting and coal mining.
— MR W PETER DAY LLB (HONS), MBA, FCA, FCPA, FAICD
Independent Non-Executive Director
Mr Day was appointed as a Director of the Company on 1 January 2014, and was appointed Deputy Chairman of the Board on 21 August 2017. He is a member of the Nomination and Compensation Committees and is Chair of the Audit and Risk Management Committee. Mr Day is also currently a Non-Executive Director of Ansell (appointed August 2007), Non-Executive Chairman of Australian Unity Office Fund (appointed September 2015), and a former director of: Boart Longyear (February 2014–September 2017), Federation Centres (October 2009–February 2014), Orbital Corporation (August 2007–February 2014) and SAI Global (August 2008–December 2016).
Mr Day brings extensive experience in the resource, finance and manufacturing sectors, having held a number of senior positions with Bonlac Foods, Rio Tinto, CRA, Comalco and the Australian Securities and Investments Commission. He is a former CFO of Amcor Limited. He also supports initiatives in disability services and mentoring.
— MS DEBORAH O’TOOLE LLB, MAICD
Independent Non Executive Director
Ms O’Toole was appointed as a director on 1 December 2017. She has been appointed as a member of the Audit and Risk Management Committee, the Nomination Committee and the Compensation Committee. Ms O’Toole is a Non-Executive Director of Sims Metal Management Limited (appointed November 2014), the Asciano Rail Group of Companies operating as Pacific National Rail (appointed October 2016), Credit Union Australia Ltd (appointed March 2014) and the Wesley Research Institute (appointed March 2013). She is a former Non-Executive Director of Boart Longyear Limited (appointed 1 October 2014 and resigned September 2017), CSIRO, Norfolk Group, various companies in the MIM and Aurizon Groups and Government and private sector advisory boards. She has acted as Chairperson of the Audit Committees of CSIRO, Norfolk Group and Pacific Aluminium.
Ms O’Toole has extensive executive experience across a number of sectors including over 20 years in the mining industry and, more recently, in transport and logistics which included managerial, operational and financial roles. She has been Chief Financial Officer of three ASX listed companies: MIM Holdings Limited, Queensland Cotton Holdings Limited and, most recently, Aurizon Holdings Limited.
—
MR JOHN A BEVAN BCom
Independent Non-Executive Director
Mr Bevan was appointed Non-Executive Director on 1 January 2018. He has been appointed a member of the Audit and Risk Management Committee, the Compensation Committee and the Nomination Committee. Mr Bevan is currently a director and Chairman of BlueScope Steel Limited (appointed March 2014), a director and Deputy Chairman of Ansell (appointed August 2012) and a former director of Nuplex Industries Limited (September 2015–September 2016).
Mr Bevan was formerly the Chief Executive Officer and Executive Director of Alumina Limited (2008–2013). Prior to his 2008 appointment to Alumina Limited, he spent 29 years in the BOC Group Plc where he was a member of the Board of Directors and held a variety of senior management positions in Australia, Korea, Thailand, Singapore and the United Kingdom. Mr Bevan brings to the Board extensive commercial and operational experience gained through operating joint ventures in many parts of the world, particularly Asia.
For
per
sona
l use
onl
y

¬17 16¬ Alumina Limited Annual Report 2017
—
MR MIKE FERRARO LLB (HONS)
Managing Director and Chief Executive Officer
Prior to his appointment as CEO and Managing Director Mr Ferraro was a Non-Executive Director of Alumina Limited from 5 February 2014 to 31 May 2017 and Partner, Client Development-Asia Pacific at Herbert Smith Freehills, a global law firm. He was also formerly head of the firm’s Corporate Group and a member of its executive management team. Mr Ferraro is also currently a Non-Executive Director of Helloworld Travel Limited (appointed January 2017).
Between 2008 and 2010 Mr Ferraro was Chief Legal Counsel at BHP Billiton Ltd. Mr Ferraro has considerable experience in the resources sector and has over 35 years of experience in joint ventures, mergers and acquisitions, fund raising and regulatory issues across a wide range of sectors and countries. He also has considerable experience in the commercial and financing aspects of large transactions gained from a number of years in investment banking as a corporate adviser.
—
COMPANY SECRETARY
MR STEPHEN FOSTER BCOM LLB (HONS) GDIPAPPFIN (SEC INST) GRADDIP CSP, ACIS
General Counsel/ Company Secretary
Mr Foster is responsible for legal, company secretarial, shareholder services, insurance and human resources. He has a wide range of legal and commercial experience gained over 30 years, more recently at Village Roadshow and WMC Limited, after working with the legal firm of Arthur Robinson & Hedderwicks (now Allens). The appointment of the Company Secretary/General Counsel is ratified by the Board. As defined in the Board Charter, the Company Secretary is accountable directly to the Board, through the Chair, on all matters to do with the proper functioning of the Board.
The role of Company Secretary/General Counsel for Alumina Limited includes:
• Providing legal advice to the Board and management as required
• Advising the Board on corporate governance principles
• Generally attending all Board meetings and preparing the minutes
• Monitoring that the Board and Committee policies and procedures are followed
• Facilitating the induction of Directors
• Managing compliance with regulatory requirements.
MEETINGS OF DIRECTORS
Particulars of the number of meetings of the Company’s Directors (including meetings of committees of Directors) during the financial year, and the number of those meetings attended by each Director (as applicable), are detailed in the table on page 17.
INTERESTS OF DIRECTORS
Particulars of relevant interests in shares in the Company, or in any related body corporate held by the Directors as at the date of this report are set out in the Remuneration Report on page 61 of this report. Particulars of rights or options over shares in the Company, or in any related body corporate, held by the Directors as at the date of this report are set out in the Remuneration Report on page 61 of this report.
INSURANCE OF OFFICERS
During or since the end of the financial year, the Group has paid the premiums in respect of a contract to insure Directors and other officers of the Group against liabilities incurred in the performance of their duties on behalf of the Group. The officers of the Group covered by the insurance policy include any natural person acting in the course of duties for the Group who is or was a Director, secretary or executive officer as well as senior and executive staff. The Company is prohibited, under the terms of the insurance contract, from disclosing details of the nature of liability insured against and the amount of the premium.
INDEMNITY OF OFFICERS
Rule 75 of the Company’s Constitution requires the Company to indemnify each officer of the Company (and, if the Board of the Company considers it appropriate, any officer of a wholly owned subsidiary of the Company) out of the assets of the Company against any liability incurred by the officer in or arising out of the conduct of the business of the Company or the relevant wholly-owned subsidiary or in or arising out of the discharge of the duties of the officer, where that liability is owed to a person other than the Company or a related body corporate of the Company. This requirement does not apply to the extent that the liability arises out of conduct on the part of the officer which involved a lack of good faith, or to the extent that the Company is otherwise precluded
For
per
sona
l use
onl
y

¬17 16¬ Alumina Limited Annual Report 2017
by law from providing an indemnity. It also does not apply to the extent and for the amount that the officer is not otherwise entitled to be indemnified and is not actually indemnified by another person (such as an insurer under any insurance policy). ‘Officer’ in this context means: a director, secretary, senior manager or employee; or a person appointed as a trustee by, or acting as a trustee at the request of, the Company or a wholly owned subsidiary of the Company, and includes a former officer. The Constitution also permits the Company, where the Board considers it appropriate, to enter into documentary indemnities in favour of such officers. The Company has entered into such Deeds of Indemnity with each of the Directors, which indemnify them consistently with rule 75 of the Constitution.
DIVIDENDS
Details of the dividends paid to members of the Company during the financial year are referred to in Note 6 of the Consolidated Financial Statements found on page 79.
PRINCIPAL ACTIVITIES
The principal activities of the Group relate to its 40 per cent interest in the series of operating entities forming Alcoa World Alumina and Chemicals (AWAC). AWAC has interests in bauxite mining, alumina refining and aluminium smelting. There have been no significant changes in the nature of the principal activities of the Group during the financial year.
REVIEW OF OPERATIONS AND RESULTS
The financial results for the Group include the 12 month results of AWAC and associated corporate activities. The Group’s net profit after tax for the 2017 financial year attributable to members of the Company was US$339.8 million profit (2016: US$30.2 million net loss). Excluding significant items, there would have been a net profit after tax of US$363.1 million (2016: US$88.3 million). For further information on the operations of the Group during the financial year and the results of these operations refer to the Operating and Financial Review on pages 20 to 35 of this report.
MATTERS SUBSEQUENT TO THE END OF THE FINANCIAL YEAR
Other than as reported in Note 15 of the Consolidated Financial Statements (refer to page 88), there are no significant matters, circumstances or events that have arisen since the end of the financial year that have significantly affected, or may significantly affect, the Group’s operations, the results of those operations, or the Group’s state of affairs, in the financial years subsequent to the financial year ended 31 December 2017.
LIKELY DEVELOPMENTS
In the opinion of the Directors, it would prejudice the interests of the Group to provide additional information, except as reported in this Directors’ Report, relating to likely developments in the operations of the Group and the expected results of those operations in the financial years subsequent to the financial year ended 31 December 2017
ALUMINA LIMITED DIRECTORS’ ATTENDANCE AT MEETINGS JANUARY TO DECEMBER 2017
Board Meeting
Board Committee
meetings
Audit and Risk Management
Committee meetings
Compensation Committee
meetings
Nominations Committee
meetings
Directors Eligible to attend Attended Eligible
to attend Attended Eligible to attend Attended Eligible
to attend Attended Eligible to attend Attended
G J Pizzey 9 9 0 0 7 7 6 6 5 5
E R Stein 9 9 0 0 7 7 6 6 5 5
C Zeng1 9 9 0 0 7 7 6 5 5 5
P Day2 9 9 0 0 7 7 6 5 5 5
M Ferraro3 9 9 0 0 3 3 3 2 3 3
P Wasow4 4 4 0 0 na na na na na na
D O’Toole5 1 1 0 0 1 1 1 1 1 1
Notes: 1 Mr Zeng was an apology for one meeting of the Compensation Committee2 Mr Day was an apology for one meeting of the Compensation Committee3 Mr Ferraro was appointed Managing Director and CEO effective 1 June 2017 and therefore ceased to attend Committees in the capacity of a
member/Non-Executive Director of the Board. Mr Ferraro was granted Leave of Absence for a meeting of the Compensation Committee4 Mr Wasow retired as Managing Director and CEO effective 31 May 20175 Ms O’Toole was appointed a Non-Executive Director effective 1 December 2017
For
per
sona
l use
onl
y

18¬
ROUNDING OF AMOUNTS
The Company is of a kind referred to in the Australian Securities and Investments Commission Corporations (Rounding in Financial/Directors’ Reports) Instrument 2016/191. Amounts shown in the Financial Report and this Directors’ Report have been rounded off to the nearest hundred thousand dollars, except where otherwise required, in accordance with that legislative instrument.
SIGNIFICANT CHANGE IN THE STATE OF AFFAIRS
There have been no significant changes in the state of affairs of the Group during the financial year.
AUDITOR
PricewaterhouseCoopers continues in office, in accordance with the Corporations Act 2001 (Cth) (Corporations Act). A copy of the Auditor’s Independence Declaration as required under section 307C of the Corporations Act is set out on this page of this report.
NON-AUDIT SERVICES
The Group may decide to employ the auditor on assignments additional to their statutory audit duties where the auditor’s expertise and experience with the Company and/or the Group are important. Details of the amounts paid or payable to the auditor (PricewaterhouseCoopers) for audit and non-audit services provided by (or on behalf of) the auditor and its related practices are disclosed in Note 13 of the Notes to the Consolidated Statements in the Financial Report on page 87.
The Board of Directors has considered the position and,in accordance with advice received from the Audit and Risk Management Committee, is satisfied that the provision of non-audit services during the financial year by (or on behalf of) the auditor and its related practices, is compatible with the general standard of independence for auditors imposed by the Corporations Act. The Directors are satisfied that the provision of those non-audit services did not compromise the auditor independence requirements of the Corporations Act for the following reasons:
• All non-audit services have been reviewed by the Audit and Risk Management Committee to ensure they do not impact the impartiality and objectivity of the auditor
• None of the services undermine the general principles relating to auditor independence as set out in APES 110 Code of Ethics for Professional Accountants. The fees paid or payable during the financial year for services provided by (or on behalf of) the auditor of the parent entity are disclosed in Note 13 of the Notes to the Consolidated Statements in the Financial Report on page 87.
CORPORATE GOVERNANCE STATEMENT
The Company has, for the 2017 reporting year, elected to disclose the Corporate Governance Statement only on the Company web site. The Corporate Governance Statement can be found at www.aluminalimited.com/governance/.
AUDITOR’S INDEPENDENCE DECLARATION
As lead auditor for the audit of Alumina Limited for the year ended 31 December 2017, I declare that to the best of my knowledge and belief, there have been:
a) no contraventions of the auditor independence requirements of the Corporations Act 2001 in relation to the audit; and
b) no contraventions of any applicable code of professional conduct in relation to the audit.
This declaration is in respect of Alumina Limited and the entities it controlled during the period.
John O’Donoghue Partner PricewaterhouseCoopers Melbourne 22 March 2018
—
PricewaterhouseCoopers, ABN 52 780 433 757
2 Riverside Quay, SOUTHBANK VIC 3006, GPO Box 1331, MELBOURNE VIC 3001
T: 61 3 8603 1000, F: 61 3 8603 1999, www.pwc.com.au
Liability limited by a scheme approved under Professional Standards Legislation.For
per
sona
l use
onl
y

¬19 Alumina Limited Annual Report 2017
For
per
sona
l use
onl
y

¬21 20¬ Alumina Limited Annual Report 2017 ¬21 20¬ Alumina Limited Annual Report 201720¬
NOTE REGARDING NON-IFRS FINANCIAL INFORMATION
The Operating and Financial Review contains certain non-IFRS financial information. This information is presented to assist in making appropriate comparisons with prior year periods and to assess the operating performance of the business.
Alcoa World Alumina & Chemicals (AWAC) financial information, except as stated below, is extracted from audited financial statements prepared in conformity with accounting principles generally accepted in the United States of America.
CONTENTS
1. STRATEGY AND BUSINESS MODEL 21
2. PRINCIPAL RISKS 23
3. REVIEW OF AWAC OPERATIONS 25
4. AWAC FINANCIAL REVIEW 29
5. ALUMINA LIMITED FINANCIAL REVIEW 32
6. MARKET OUTLOOK AND GUIDANCE 34
Operating and Financial Review
For
per
sona
l use
onl
y

¬21 20¬ Alumina Limited Annual Report 2017 ¬21 20¬ Alumina Limited Annual Report 2017 ¬21 Alumina Limited Annual Report 2017
1. STRATEGY AND BUSINESS MODEL
BUSINESS MODEL
Alumina Limited represents a unique investment in globally leading bauxite mines and alumina refineries through its 40% investment in Alcoa World Alumina and Chemicals (AWAC). AWAC also has a 55% interest in the Portland smelter in Victoria, Australia.
The Company provides the cleanest look-through to AWAC’s underlying performance. This is possible because the financial policies of both Alumina Limited and AWAC ensure there is modest leverage in both the Company and AWAC, the Company’s own costs are minimal and the distribution policies of Alumina Limited and AWAC require free cash flows to be paid to their respective shareholders.
Alumina Limited’s net profit/(loss) is principally comprised of a return on its equity investment, and revenues are limited to small amounts of interest income and occasional one-off revenues.
AWAC was formed on 1 January 1995 by Alumina Limited and Alcoa Inc combining their respective global bauxite, alumina and alumina-based chemicals business and investments and their respective aluminium smelting operations in Australia. Following the separation of Alcoa Inc. into Alcoa Corporation and Arconic Inc. on 1 November 2016, Alcoa Corporation (Alcoa) replaced Alcoa Inc as Alumina Limited’s partner in the AWAC joint venture. Alcoa owns the 60% interest in the joint venture and manages the day-to-day operations.
Bauxite mine
Bauxite mine
Refinery
Refinery
Smelter Location
Kwinana
Huntly
Pinjarra
Willowdale
Wagerup
AWAC operations
Equity interest
Portland
JurutiAlumar
MRN
AfobakaRas Al Khair
Al Ba’itha
San Ciprian
CBG
Point Comfort
Energy
For
per
sona
l use
onl
y

¬23 22¬ Alumina Limited Annual Report 2017
The Strategic Council is the principal forum for Alcoa and Alumina Limited to provide direction and counsel to the AWAC entities in respect of strategic and policy matters. The Alcoa and Alumina Limited representatives on the boards of the AWAC entities are required, subject to their general fiduciary duties, to carry out the directions and the decisions of the Strategic Council. The Strategic Council has five members, three appointed by Alcoa (of which one is Chairman) and two by Alumina Limited (of which one is the Deputy Chairman). Decisions are made by majority vote except for matters which require a “super-majority” vote, which is a vote of at least 80% of the members appointed to the Strategic Council.
The following matters require a super-majority vote:
• change of the scope of AWAC
• change in the dividend policy
• equity calls on behalf of AWAC totalling, in any one year, in excess of $1 billion
• acquisitions, divestitures, expansions and curtailments exceeding 2 million tonnes per annum of bauxite or 0.5 million tonnes per annum of alumina or which have a sale price, acquisition price, or project total capital cost of US$50 million or greater
• implementation of related party transactions in excess of US$50 million
• implementation of financial derivatives, hedges and other commodity price or interest rate protection mechanisms
• decision to file for insolvency in respect of any AWAC company.
Under the general direction of the Strategic Council, Alcoa is the “industrial leader” and provides the operating management of AWAC and of all affiliated operating entities within AWAC.
Alumina Limited is entitled to representation in proportion to its ownership interest on the board of each entity in the AWAC structure and is currently represented on the boards of Alcoa of Australia Ltd (AofA), Alcoa World Alumina Brazil Ltda (AWA Brazil) and Alcoa World Alumina LLC (AWA LLC). In addition to the Strategic Council meetings, Alumina Limited’s Management and Board visit and review AWAC’s operations regularly.
Subject to the exclusivity provisions of the AWAC agreements, AWAC is the exclusive vehicle for the pursuit of Alumina Limited’s and Alcoa’s (and their related corporations as defined) interests in the bauxite, alumina and inorganic industrial chemicals businesses, and neither party can compete with AWAC so long as they maintain an ownership interest in AWAC. In addition, Alumina Limited may not compete with the businesses of the integrated operations of AWAC (being the primary aluminium smelting and fabricating facilities and certain ancillary facilities that existed at the formation of AWAC). The exclusivity provisions would terminate immediately on and from a change in control of either Alumina Limited or Alcoa.
Also effective immediately on and from a change of control of Alcoa or Alumina Limited there is an increased opportunity for development projects and expansions, whereby if either Alumina Limited or Alcoa Corporation wishes to expand an existing AWAC operation, develop a new project on AWAC tenements or pursue a project outside of AWAC, it is entitled to do so on a sole basis after providing 180 days for the other party to explore joint participation in the proposed project. A partner that avails itself of such an opportunity would pay for all costs related to the project, including for AWAC resources and shared facilities used, and would be entitled to all of the project’s resulting off-take.
If there is a change of control of Alumina then, from a date nominated by Alumina:
• Future alumina off-take rights, whereby from a date nominated by Alumina Limited or its acquirer will be entitled to buy, subject to its 40% ownership cap:
– its net short position (calculated as total consumption less total owned production per annum) of alumina at market price for its internal consumption; plus
– up to 1 million tonnes per annum alumina off-take, at market prices, which it may market and sell as it sees fit;
– in all cases subject to AWAC third party customer contracts being satisfied;
• Future bauxite off-take rights, whereby from a date nominated by Alumina Limited or its acquirer will be entitled to buy, at market prices, up to its net short position of bauxite for internal consumption, subject to its 40% ownership cap.
STRATEGY ANALYSIS
AWAC is primarily focused on bauxite and alumina assets, and this is the key investment concern of Alumina Limited. That is, to invest in long-life, low cost bauxite and alumina assets through AWAC.
Alumina Limited and Alcoa are different companies with different shareholders and different governance requirements. While AWAC is governed by constitutional documents, in a practical sense, the reconciliation of the differing interests requires challenge, debate and negotiation. To do this well, Alumina Limited needs to have (and has) an independent understanding of the bauxite, alumina and aluminium market and views on the impact of changes in the market, in particular around capacity investment, pricing and the development of the Chinese industry. Through the role of Alumina Limited representatives on the Strategic Council and AWAC entity boards and working with Alcoa, Alumina Limited contributes to the strategic and high-level commercial actions of AWAC.
For
per
sona
l use
onl
y
¬23 22¬ Alumina Limited Annual Report 2017
2. PRINCIPAL RISKS
The risk management processes are summarised in the Corporate Governance Statement located on the Company web site at www.aluminalimited.com/governance/.
Alumina Limited’s risk management framework provides for the production of a Group risk matrix, which sets out Alumina Limited’s most significant risks and the steps taken to mitigate those risks. These risks are rated on the basis of their potential impact on the current operations and profitability and/or the long term value of the Group. Set out below are some of the key risks faced by Alumina Limited. However, there are other risks not listed below associated with an investment in Alumina Limited.
Movements in the market prices of bauxite, alumina and aluminium – AWAC’s, and hence Alumina Limited’s, performance is predominantly affected by the market price of alumina, and to some extent the market prices of bauxite and aluminium. Market prices are affected by numerous factors outside of Alumina Limited’s control. These include the overall performance of world economies, the related cyclicality of industries that are significant consumers of aluminium and movement in production disproportionate to demand (whether as a result of changes to production levels at existing facilities or the development of new facilities). A fall in the market prices of bauxite, alumina and aluminium can adversely affect Alumina Limited’s financial performance. AWAC seeks to identify ways in which to lower costs of production and thus achieving a low position on the cost curve. Achieving a low position on the cost curve allows AWAC to remain competitive in the event of unfavourable market movements. AWAC and Alumina Limited generally do not undertake hedging to manage this risk.
Fluctuations in exchange rates – while a significant proportion of AWAC’s costs are incurred in Australian dollars, its sales are denominated in US dollars. Accordingly, AWAC and Alumina’s Limited’s future profitability can be adversely affected by a strengthening of the Australian dollar against the US dollar and a strengthening against the US dollar of other currencies in which operating or capital costs are incurred by AWAC outside Australia, including the Brazilian Real. Also, given that China is a significant part of the world alumina and aluminium markets, fluctuations in the Chinese Renminbi against the US dollar could have some impact on other parts of the industry. AWAC and Alumina Limited generally do not undertake hedging activities to manage this risk.
Increases in AWAC’s production costs or a decrease in production – AWAC’s operations are subject to conditions beyond its control that may increase its costs or decrease its production, including increases in the cost of key inputs (including energy, raw materials, labour, caustic and freight), the non-availability of key inputs (including secure energy), weather and natural disasters, fires or explosions at facilities, unexpected maintenance or technical problems, key equipment failures, disruptions to or other problems with infrastructure and supply. In addition, industrial disruptions, work stoppages, refurbishments and accidents at operations may adversely affect profitability. Some cost inputs are subject to long term contracts to increase the certainty of input pricing. AWAC’s operating and maintenance systems and business continuity planning seek to minimise the impact of non-availability of key inputs. AWAC’s portfolio restructuring and repositioning continues to ensure that operations as a whole remain competitive. AWAC also invests in capital expenditure projects that will reduce cash costs over the long term. Planned development and capital expenditure projects may not result in anticipated construction costs or production rates being achieved.
AWAC structure – Alumina Limited does not hold a majority interest in AWAC, and decisions made by majority vote may not be in the best interests of Alumina Limited. There is also a risk that Alumina Limited and Alcoa may have differing priorities. During 2016, the joint venture agreements were modified to ensure that certain key decisions require Alumina Limited’s consent by a super-majority vote.
Greenhouse gas emission regulation – energy, specifically electricity, is a significant input in a number of AWAC’s operations, making AWAC an emitter of greenhouse gases. The introduction of regulatory change by governments in response to greenhouse gas emissions may represent an increased cost to AWAC and may affect Alumina Limited’s profitability. AWAC and Alumina Limited monitor regulatory changes, and understand their effect on AWAC.
Political, legal and regulatory impacts – AWAC and Alumina Limited operate across a broad range of legal, regulatory or political systems. The profitability of those operations may be adversely impacted by changes in the regulatory regimes. AWAC and Alumina Limited’s financial results could be affected by new or increasingly stringent laws, regulatory requirements or interpretations, or outcomes of significant legal proceedings or investigations adverse to AWAC or Alumina Limited.
For
per
sona
l use
onl
y

¬25 24¬ Alumina Limited Annual Report 2017
This may include a change in effective tax rates or becoming subject to unexpected or rising costs associated with business operations or provision of health or welfare benefits to employees, regulations or policies.
AWAC is also subject to a variety of legal compliance risks. These risks include, among other things, potential claims relating to product liability, health and safety, environmental matters,
intellectual property rights, government contracts, taxes and compliance with US and foreign export laws, anti-bribery laws, competition laws and sales and trading practices. Failure to comply with the laws regulating AWAC’s businesses may result in sanctions, such as fines or orders requiring positive action by AWAC, which may involve capital expenditure or the removal of licenses and/or the curtailment of operations. This relates particularly to environmental regulations. Alumina Limited and AWAC undertake a variety of compliance training and governance functions to mitigate these risks. Furthermore, AWAC maintains a spread of assets and customers across a portfolio of countries and regions to minimise disruption and concentration risk.
Closure/impairment of assets – Alumina Limited may be required to record impairment charges as a result of adverse developments in the recoverable values of its assets. To the extent that the carrying value of an asset is impaired, such impairment may negatively impact Alumina Limited’s profitability during the relevant period. Closure, curtailment or sale of AWAC’s operations may result in a change in the timing of required remediation activities and/or an impairment being incurred as a result of the carrying value of an asset exceeding its recoverable value, but may be necessary to ensure the ongoing competitiveness of AWAC operations.
Customer risks – AWAC’s relationships with key customers for the supply of alumina (including Alcoa) are important to AWAC’s financial performance. The loss of key customers or changes to sales agreements could adversely affect AWAC’s and Alumina Limited’s financial performance. AWAC mitigates customer risk by having a broad customer base across many countries and regions.
Debt refinancing – Alumina Limited’s ability to refinance its debt on favourable terms as it becomes due or to repay its debt, its ability to raise further finance on favourable terms, and its borrowing costs, will depend upon a number of factors, including AWAC’s operating performance, general economic conditions, political, capital and credit market conditions, external credit ratings and the reputation, performance and financial strength of Alumina Limited’s business. If a number of the risks outlined in this section eventuate (including the cyclicality of the alumina industry and adverse movements in the market prices of aluminium and alumina) and Alumina Limited’s operating performance, external credit rating or profitability is negatively impacted as a result of these risks, there is a risk that Alumina Limited may not be able to refinance expiring debt facilities or the costs of refinancing its debt may increase substantially.
Other risks include:
• an alumina and/or aluminium market in supply surplus may lead to downward price pressure;
• Chinese growth slowing and affecting aluminium consumption and hence aluminium and alumina demand;
• Greater Chinese aluminium production at lower cost, combined with lower demand in China, may lead to a greater level of Chinese primary aluminium and semi-finished product exports, depressing the world prices of aluminium;
• Alcoa and its subsidiaries have a variety of obligations to Alumina Limited and AWAC, the fulfilment of which depends on their financial position. Adverse changes to the financial position of Alcoa and its subsidiaries could result in such obligations not being met;
• a greater outflow of aluminium stocks from warehouses’ inventories could impact the world alumina market;
• a sustained increase in the supply of cheap bauxite from Asia to China, could lower Chinese alumina production costs;
• a technology breakthrough could lower Chinese alumina production costs.
• Emerging competitors entering the alumina market may cause overcapacity in the industry which may result in AWAC losing sales. F
or p
erso
nal u
se o
nly

¬25 24¬ Alumina Limited Annual Report 2017
3. REVIEW OF AWAC OPERATIONS
Since the beginning of this decade, AWAC has undergone business improvement and transformation, which have significantly improved the competitiveness of its portfolio of assets in a global market. Industry fundamentals now also look to be improving through measures such as the China supply-side reforms. AWAC will continue to look for further opportunities of portfolio optimisation with emphasis on growth opportunities.
The current refining portfolio is comprised mostly of tier one assets that allows AWAC to generate returns during the highs and lows of the commodity cycle.
The significant improvement in AWAC’s 2017 earnings and cash generation was mainly due to higher realised prices for alumina.
In addition to consumption within its own refineries, AWAC’s bauxite resources in Australia, Brazil and Guinea are also able to cater for third party customers in both the Pacific and the Atlantic regions. A continuing focus on third party bauxite sales provides AWAC with an additional earnings stream that is expected to grow.
TH
IRD
PA
RT
Y B
AU
XIT
E SA
LES
13.9
% O
F T
HE
TO
TAL
BDT
3 SH
IPPE
D
2.4%
16.4%
76.9%
46.8%
97.6%
83.6%
23.1%
53.2%
MINING1
Huntly &Willowdale
Juruti
PinjarraWagerupKwinana
SanCiprian
Alumar
MRN2
CBG2
REFINING1
PORTLAND & ALCOA SMELTERS
30.2%
THIRD PARTY ALUMINA SALES
69.8%
MINING HIGHLIGHTS:• Third party sales from all AWAC operated mines
• Near completion of Juruti’s expansion to 5.7 million BDT
• WA infrastructure expansion underway
• CBG’s Phase 1 expansion underway
ALUMINA HIGHLIGHTS:• Production records at three largest refineries: Pinjarra, Wagerup & Alumar
• Second best annual production result at San Ciprian
• Phase 1 debottlenecking project completed at Alumar
• Pinjarra press filtration project underway
1Excludes Al Ba’itha mine and Ras Khair refinery 2AWAC equity share3Bone dry tonnes (BDT)
AWAC operated asset Non-AWAC operated asset
For
per
sona
l use
onl
y

¬27 26¬ Alumina Limited Annual Report 2017
MINING
AWAC’s mining operations made significant progress in 2017 with third party bauxite sales from all mines for the first time and the near completion of Juruti’s capacity increase to 5.7 million BDT.
31 DEC 2017 31 DEC 2016 CHANGE CHANGE (%)
AWAC operated mines
Production (million BDT) 38.8 37.5 1.3 3.5
Cash cost ($/BDT of bauxite produced) 11.1 9.8 1.3 13.3
Non-AWAC operated mines
AWAC equity share of production (million BDT)1 4.6 5.2 (0.6) (11.5)
Third party sales
Shipments to third parties (million BDT) 6.6 6.3 0.3 4.8
Total third party revenue, inclusive of freight ($ million) 334.0 315.8 18.2 5.8
1 Based on the terms of its bauxite supply contracts, AWAC bauxite purchases from Mineração Rio do Norte S.A. (“MRN”) and Compagnie des Bauxites de Guinée (CBG) differ from their proportional equity in those mines.
Bauxite production: change by mine (million BDT)
* Other includes: maintenance, contracted services, supplies, royalties and other
2016
37.5
0.9
2017Huntly& Willowdale
0.4
Juruti
38.8
During 2018, AWAC’s mining operations are expected to complete a further capacity increase of the Juruti mine to 6.5 million BDT per annum, and to continue to invest in infrastructure development to facilitate further exports from Western Australia.
Cash cost per BDT of bauxite produced
2016
$9.8
Energy
–
* Other includes: maintenance, contracted services, supplies, royalties and other
Labor
$0.1
Fuel
$0.2
Other*
$1.0
2017
$11.1
AWAC OPERATED MINES
AWAC operated mines increased production for the year by 3.5%. The growth in production was facilitated by creep at the Huntly and Willowdale mines in Western Australia and the near completed capacity increase of the Juruti mine to 5.7 million BDT. All AWAC operated mines achieved record production in 2017.
Whilst production increased at Juruti, operations were affected by heavy rainfall in Brazil during the first half of 2017 and particularly by drought during the second half. Insufficient water levels in the tailings dam during the drought reduced the effectiveness of the beneficiation process (washing of bauxite to remove organic material), thus reducing bauxite quality for some shipments to the downstream Alumar refinery.
AWAC’s cash cost per BDT of bauxite produced increased by 13.3% to $11.1 per BDT. Contributors to this increase included higher royalty costs at Australian mines, a weaker US dollar against the Australian dollar and Brazilian real, fleet overhaul costs and higher maintenance to address Juruti’s tailings dam and washing plant issues.
The 2017 EBITDA margin for AWAC’s bauxite unit, which includes intersegment sales but excludes freight, was 38.2% (2016: 38.0%).
For
per
sona
l use
onl
y

¬27 26¬ Alumina Limited Annual Report 2017
Non-AWAC Operated Mines
AWAC’s share of production at the CBG mine in Guinea and the MRN mine in Brazil decreased by 11.5% compared to 2016.
The CBG mine’s production was affected by civil unrest which caused disruptions to ancillary infrastructure supporting CBG. CBG continues with its expansion project which is expected to increase AWAC’s equity share of production by approximately 1.1 million BDT per annum.
The MRN mine was also exposed to weather events, experiencing similar issues as Juruti.
The equity income derived from CBG and MRN was $23.1 million (2016: $34.1 million),
Third Party Bauxite Sales
AWAC’s shipments to third party customers increased by 4.8% to 6.6 million BDT in 2017. All AWAC mines (including CBG and MRN) shipped bauxite to third parties during 2017.
The geographical location of AWAC’s mines allows AWAC to service customers in the Atlantic and the Pacific regions.
AWAC continues to develop infrastructure in order to support export of bauxite from Western Australia to third party customers. In 2018 AWAC is expected to export up to 1.4 million BDT from Western Australia (2017: 0.8 million BDT).
Total third party bauxite sales are expected to decline to 6.3 million BDT in 2018 due to the expansion works at CBG which will be partially offset by increases from the Western Australian mines and Juruti.
31 DEC 2017 31 DEC 2016 CHANGE CHANGE (%)
AWAC operated refineries
Shipments (million tonnes) 13.1 13.3 (0.2) (1.5)
Production (million tonnes) 12.5 12.6 (0.1) (0.8)
Average realised alumina price ($/tonne) 335 242 93 38
Platts FOB Australia - one month lag ($/tonne) 349 242 107 44
Cash cost per tonne of alumina produced 198 191 7 3.7
Margin1 ($/tonne) 137 51 86 169
Smelter Grade Alumina (“SGA”) shipments on spot or index basis (%)
85 84 1 1.2
Ma’aden joint venture
Production (million tonnes) 1.5 1.4 0.1 7.1
AWAC’s share of production (million tonnes) 0.4 0.4 - -
1 Calculated as average realised price less cash cost of production.
REFINING
The refining operations achieved a significant increase in revenue and earnings through higher prices and a concentrated effort on operational excellence, which more than offset increases in input costs, the weaker US dollar, lower shipments and the operational issues at the Juruti mine.
For
per
sona
l use
onl
y

¬29 28¬ Alumina Limited Annual Report 2017
AWAC OPERATED REFINERIES
Production from AWAC operated refineries was 12.5 million tonnes, down 0.1 million tonnes compared to 2016. This was largely due to the curtailment of the Point Comfort refinery in 2016.
Alumina shipments for 2017 were 13.1 million tonnes (2016: 13.3 million tonnes). The reduction in shipments is mainly attributable to the curtailment of the Point Comfort refinery.
Shipments during December 2017 were also affected by operating inefficiencies at the ship loading facilities at the Bunbury and San Ciprian ports, resulting in some shipments being deferred to 2018.
Alumina production: change by refinery (KT)
* Other includes: maintenance, contracted services, supplies, royalties and other
2016 Point Comfort
PinjarraWagerupKwinana
Alumar SanCiprian
2017
12,644
12,453
(211)
16 (4) 8
The 2017 average realised alumina price was $335 per tonne, a year on year improvement of $93 per tonne (38%). With approximately 85% of shipments priced on spot or an index basis, AWAC was well positioned to capitalise on the steep upward price movement.
By comparison, the cash cost per tonne of alumina produced increased by only 3.7% to $198 per tonne. Whilst the curtailment of Point Comfort improved the overall cash cost of production by $4 per tonne, there were unfavourable variances attributable to caustic soda, energy and other costs.
Cash cost per tonne of Alumina produced
* Conversion includes: employee costs, indirect costs and other raw material costs
2016 PointComfort
Energy Bauxite Conversion* 2017Caustic
$191 ($4)
$2
$8
$1 $198
Approximately 83% of the total caustic cost increase related to price. The rest of the cost increase is mainly attributable to the severe weather conditions in Brazil that affected the quality of the bauxite delivered to the Alumar refinery requiring more caustic usage.
The rise in the price of caustic has been driven by supply and demand forces affecting the chlor-alkali industry. Due to its low reactive silica bauxite, AWAC is in a better position than many competitors to weather the rise in caustic prices.
The rise in energy costs was mainly due to the increase in the underlying oil reference price for the San Ciprian and Alumar refineries. This was partially offset by record low energy intensity achieved across the refining system.
Conversion costs rose because of increased maintenance at all refineries and the weaker US dollar.
Ma’aden Joint Venture
During 2017, the Ma’aden refinery produced 1.5 million tonnes of alumina (AWAC’s share of production was 0.4 million tonnes), representing a 7.1% improvement compared to 2016. In December, the Ma’aden refinery’s annualised run rate reached nameplate capacity (1.8 million tonnes per annum). In 2018, the Ma’aden refinery is expected to operate around its nameplate capacity, which should exceed the alumina needs of the adjoining smelter (1.5 million tonnes per annum), which is not an AWAC asset. The expected excess tonnes will be sold to third parties.
Equity losses relating to the Ma’aden joint venture reduced to $5 million (2016: $42.6 million). The improvement in performance is mainly attributable to higher alumina prices.
For
per
sona
l use
onl
y

¬29 28¬ Alumina Limited Annual Report 2017
PORTLAND
The Portland smelter is AWAC’s only smelting operation.
31 DEC 2017 31 DEC 2016 CHANGE CHANGE (%)
AWAC’s 55% Equity Share
Production (thousand tonnes) 112 154 (42) (27)
LME aluminium cash - 15 day lag ($/tonne) 1,950 1,596 354 22
EBITDA ($ million) (25.6) 5.5 (31.1) (565)
Aluminium production decreased by 27% due to a power outage in December 2016.
In January 2017, Alcoa of Australia Limited signed agreements with the State and Federal governments to provide assistance for the purposes of restarting the Portland operations and maintaining production at the smelter over the next four years.
The smelter gradually rebuilt capacity throughout the year, reaching pre-outage production levels of approximately 167 thousand tonnes per year (AWAC’s equity share) in October 2017.
4. AWAC FINANCIAL REVIEW
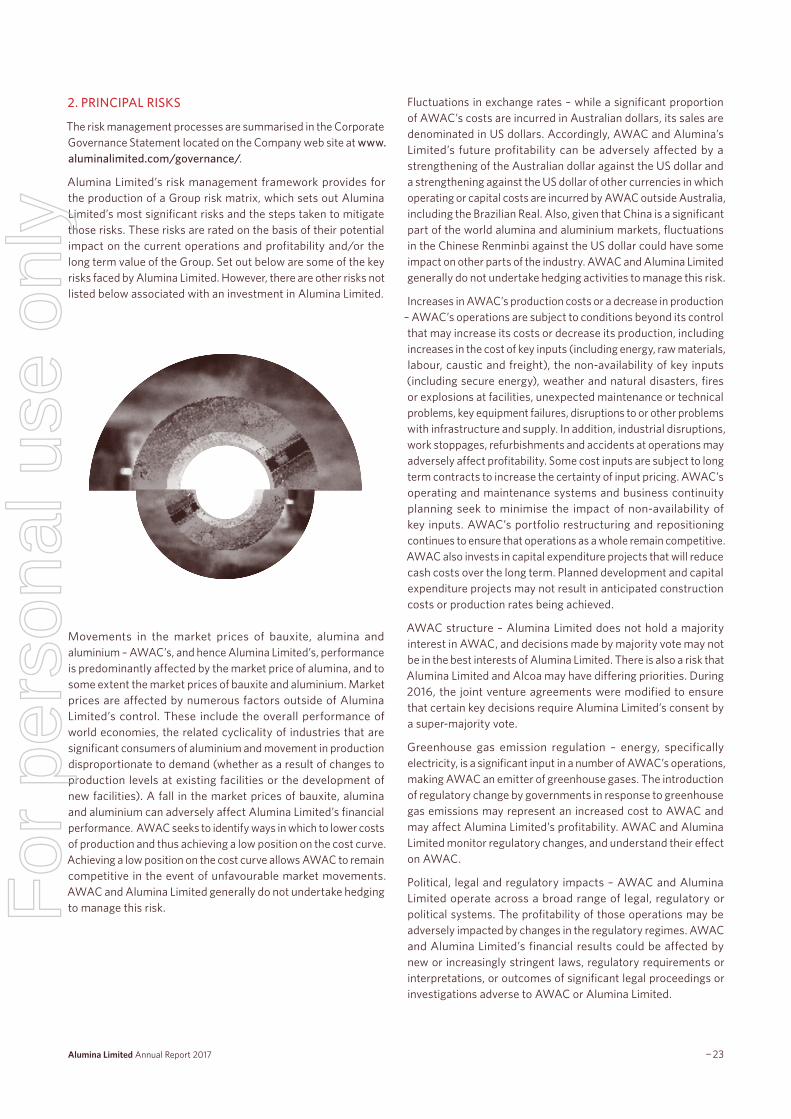
The improvement in AWAC’s net profit was largely due to higher realised alumina prices during 2017 which more than offset higher input costs and the weaker US dollar. Lower charges for significant items further assisted the results.
The increases in income tax charges were driven by higher taxable income, particularly in AWAC’s Australian operations.
AWAC PROFIT AND LOSS (US GAAP) US$ MILLION
YEAR ENDED31 DEC 2017
YEAR ENDED31 DEC 2016
Net profit after tax 901.3 49.0
Add back: Income tax charge 443.7 72.3
Add back: Depreciation and amortisation 274.5 271.8
Add back: Net interest (2.6) 0.4
EBITDA 1,616.9 393.5
Add back: Significant items (pre-tax) 68.4 363.7
EBITDA excluding significant items 1,685.3 757.2
For
per
sona
l use
onl
y
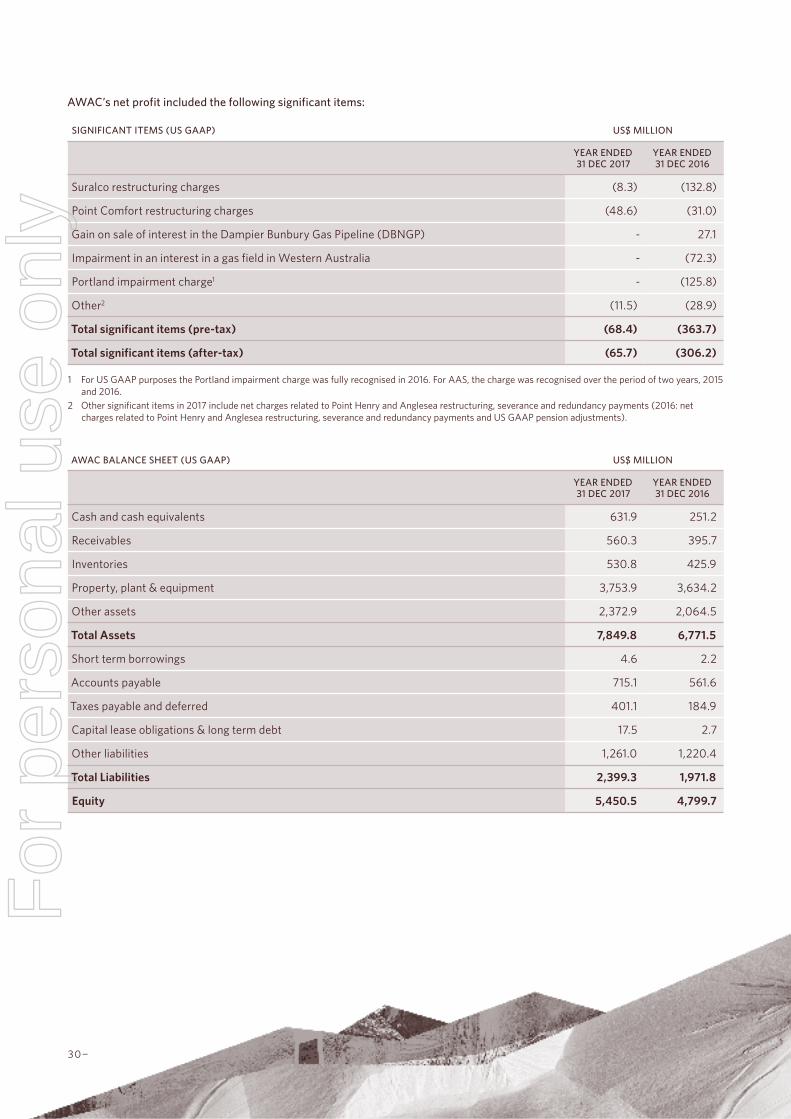
¬31 30¬ Alumina Limited Annual Report 2017
AWAC’s net profit included the following significant items:
SIGNIFICANT ITEMS (US GAAP) US$ MILLION
YEAR ENDED31 DEC 2017
YEAR ENDED31 DEC 2016
Suralco restructuring charges (8.3) (132.8)
Point Comfort restructuring charges (48.6) (31.0)
Gain on sale of interest in the Dampier Bunbury Gas Pipeline (DBNGP) - 27.1
Impairment in an interest in a gas field in Western Australia - (72.3)
Portland impairment charge1 - (125.8)
Other2 (11.5) (28.9)
Total significant items (pre-tax) (68.4) (363.7)
Total significant items (after-tax) (65.7) (306.2)
1 For US GAAP purposes the Portland impairment charge was fully recognised in 2016. For AAS, the charge was recognised over the period of two years, 2015 and 2016.
2 Other significant items in 2017 include net charges related to Point Henry and Anglesea restructuring, severance and redundancy payments (2016: net charges related to Point Henry and Anglesea restructuring, severance and redundancy payments and US GAAP pension adjustments).
AWAC BALANCE SHEET (US GAAP) US$ MILLION
YEAR ENDED31 DEC 2017
YEAR ENDED31 DEC 2016
Cash and cash equivalents 631.9 251.2
Receivables 560.3 395.7
Inventories 530.8 425.9
Property, plant & equipment 3,753.9 3,634.2
Other assets 2,372.9 2,064.5
Total Assets 7,849.8 6,771.5
Short term borrowings 4.6 2.2
Accounts payable 715.1 561.6
Taxes payable and deferred 401.1 184.9
Capital lease obligations & long term debt 17.5 2.7
Other liabilities 1,261.0 1,220.4
Total Liabilities 2,399.3 1,971.8
Equity 5,450.5 4,799.7
For
per
sona
l use
onl
y
¬31 30¬ Alumina Limited Annual Report 2017
The increase in the value of assets and liabilities includes the effect of the weaker US dollar against the Australian dollar at year-end.
The spike in alumina prices in the fourth quarter of 2017 resulted in higher cash and cash equivalents and receivables as at year-end.
The increase in inventory includes the effect of the higher input costs (particularly caustic soda) and the delayed alumina shipments in December.
The increase in property, plant and equipment was mainly due to foreign currency rate movement and growth projects such as the Juruti mine capacity increase.
Other assets increased mainly due to changes in the fair value of derivative assets associated with Portland’s hedging arrangements.
The rise in taxes payable and deferred is mainly attributable to an increase in the taxable income for Australian operations and an increase in the deferred taxes associated with the Portland hedging arrangements.
AWAC CASH FLOW (US GAAP) US$ MILLION
YEAR ENDED31 DEC 2017
YEAR ENDED31 DEC 2016
Cash from operations 1,102.4 (26.2)
Capital contributions arising from the allocation agreement1 74.0 74.0
Capital contributions from partners 200.0 120.0
Net movement in borrowings 17.4 (8.0)
Capital expenditure (191.6) (129.9)
Proceeds from sale of 20% interest in the DBNGP - 145.0
Other financing and investing activities2 7.9 123.3
Effects of exchange rate changes on cash and cash equivalents 27.7 6.8
Cash flow before distributions 1,237.8 305.0
Distributions paid to partners (857.1) (585.6)
Net change in cash and cash equivalents 380.7 (280.6)
1 Contributions by Alcoa in accordance with the allocation agreement whereby Alcoa assumes an additional 25% equity share relating to the Alba settlement payment and costs.
2 Made up of changes to capital lease obligations, related party notes receivable and other.
Cash from operations in 2017 increased primarily due to higher average realised alumina prices. The 2016 cash from operations included the final instalment of $200 million paid for the 12-year Western Australia gas supply agreement.
Consequently, distributions paid to partners increased to $857.1 million. In the first two months of 2018, and in accordance with the distribution policy, AWAC has distributed a further $527 million.
In 2017, sustaining capital expenditure was $146.0 million (2016: $121.1 million). The most significant expenditure was for the Pinjarra refinery where press filtration is currently being implemented.
Growth capital expenditure was $45.6 million. The largest growth project related to the expansion of the Juruti mine.
For
per
sona
l use
onl
y

¬33 32¬ Alumina Limited Annual Report 2017
5. ALUMINA LIMITED FINANCIAL REVIEW
ALUMINA LIMITED PROFIT AND LOSS US$ MILLION
YEAR ENDED31 DEC 2017
YEAR ENDED31 DEC 2016
Share of net profit of associates accounted for using the equity method 360.4 18.1
General and administrative expenses (13.6) (25.7)
Finance costs (8.3) (9.1)
Foreign exchange losses, tax and other 1.3 (13.5)
Profit/(loss) for the year after tax 339.8 (30.2)
Total significant items after tax (23.3) (114.9)
Net profit after tax excluding significant items 363.1 84.7
SIGNIFICANT ITEMS (IFRS, POST-TAX) US$ MILLION
YEAR ENDED31 DEC 2017
YEAR ENDED31 DEC 2016
Suralco restructuring charges and deferred tax assets adjustment (2.2) (57.5)
Point Comfort restructuring charges (19.5) (12.4)
Portland impairment charge1 - (24.7)
Impairment in an interest in a gas field in Western Australia - (20.2)
Gain on sale of interest in the DBNGP - 2.5
Other (includes severance and redundancy charges) (1.6) (2.6)
Total significant items (23.3) (114.9)
1 For US GAAP purposes the Portland impairment charge was fully recognised in 2016. For AAS, the charge was recognised over the period of two years 2016 and 2015.
Alumina Limited recorded a net profit after tax of $339.8 million compared to a loss of $30.2 million in 2016.
The increase in net profit was largely due to AWAC’s higher average realised alumina price and lower net charges for significant items which were partially offset by AWAC’s higher production costs and an unfavourable movement in the US dollar against the Brazilian real and the Australian dollar.
Excluding significant items, net profit would have been $363.1 million (2016: $84.7 million).
General and administrative expenses in 2017 includes $1.0 million associated with the previous CEO’s retirement on 31 May 2017 and $0.4 million of costs from the Company’s actions in relation to Alcoa’s corporate separation (2016: $14.0 million). Excluding these costs, 2017 general and administrative expenses were marginally higher than 2016.
The Company’s finance costs in 2017 included $1.1 million of charges related to the renegotiation of the syndicated bank facility. In 2016, finance costs included an interest expense adjustment of $2.6 million related to the step up in the fixed interest rate note’s coupon from 5.5% to 7.25% per annum that was triggered by a change in credit rating for Alumina Limited. Excluding the above costs, the 2017 finance costs were marginally higher than 2016, reflecting higher interest rates and higher use of facilities throughout the year.
For
per
sona
l use
onl
y

¬33 32¬ Alumina Limited Annual Report 2017
ALUMINA LIMITED BALANCE SHEET US$ MILLION
YEAR ENDED31 DEC 2017
YEAR ENDED31 DEC 2016
Cash and cash equivalents 40.0 8.6
Investment in associates 2,301.0 2,106.0
Other assets 1.9 3.2
Total assets 2,342.9 2,117.8
Payables 1.3 1.3
Interest bearing liabilities – non-current 98.4 92.4
Other liabilities 9.2 17.2
Total Liabilities 108.9 110.9
Net Assets 2,234.0 2,006.9
The rise in investments in associates was due to AWAC’s improved operating performance and foreign currency balance sheet revaluations, partially offset by AWAC’s increased distributions.
Alumina Limited’s net debt as at 31 December 2017 was $58.4 million.
Alumina Limited has $250 million of committed bank facilities which expire as follows:
• $150 million in July 2020 (no amounts drawn under these facilities as at 31 December 2017).
• $100 million in October 2022 (no amounts drawn under these facilities as at 31 December 2017).
In addition to the bank facilities, Alumina Limited has an A$125 million face value fixed rate note on issue which matures on 19 November 2019.
ALUMINA LIMITED CASH FLOW US$ MILLION
YEAR ENDED31 DEC 2017
YEAR ENDED31 DEC 2016
Dividends received 278.1 150.2
Distributions received 1.2 0.7
Net finance costs paid (8.6) (5.7)
Payments to suppliers and employees (12.1) (26.3)
GST refund & other 0.9 1.1
Cash from operations 259.5 120.0
Net (payments)/receipts – investments in associates (16.2) 33.9
Free cash flow1 243.3 153.9
1 Free cash flow calculated as cash from operations less net investments in associates.
For
per
sona
l use
onl
y
¬35 34¬ Alumina Limited Annual Report 2017
Alumina Limited’s free cash flow is comprised of the net capital, dividends and income distributions received from AWAC entities offset by the Company’s general, administrative and finance costs.
Alumina Limited’s total receipts from AWAC during 2017 were $343.1 million compared to $232.8 million in 2016.
Alumina Limited’s cash contributions to AWAC during 2017 were $80.0 million (2016: $48.0 million).
Contributions invested in 2017 were mainly to support one AWAC entity’s purchases of alumina on a spot basis from other AWAC entities in order to meet its long term customer supply commitments which are on different pricing mechanisms.
Higher cash finance costs reflect the note’s increased coupon rate following the changes in the Company’s credit rating.
As a result, free cash flow was $89.4 million higher in 2017 compared to 2016.
Alumina Limited’s dividend policy is based on distributing the free cash up until the date of declaration by the Directors of the Company. Since 31 December 2017, the Company’s net receipts from AWAC were $198 million which are included in the 9.3 cents per share 2017 final dividend paid on 15 March 2018.
6. MARKET OUTLOOK AND GUIDANCE
ALUMINA
Global demand for alumina increased by 7% in 2017. China’s aluminium production growth is forecast to be lower in 2018 due to curtailments and closures of smelting capacity as a result of environmental and supply-side reform policies. Nevertheless, demand for metallurgical alumina is expected to grow by over 4% globally with a significant increase in aluminium production outside China, particularly in India and the Middle East. Increases in demand for metallurgical alumina outstripped growth in supply which was largely restricted to China. Modest increases in alumina production occurred mainly in Indonesia, Vietnam and Saudi Arabia.
In 2018, further alumina will be produced from the Ma’aden/AWAC Ras Al Khair refinery in Saudi Arabia which is ramping up and has recently operated at its full 1.8 million tonne nameplate capacity. This refinery is expected to operate in the lowest cash cost quartile.
Also, extra alumina production is expected from the re-started Alpart refinery in Jamaica. Towards the end of 2018, EGA’s Shaheen refinery in the UAE is forecast to start producing alumina. There are other potential greenfields and brownfields refinery projects around the world, some of which may proceed to meet the expected increase in demand in the Americas, India and the Middle East.
In 2017, the Chinese Central and Regional governments implemented policies to reduce pollution by mandating significant curtailments in alumina, aluminium and carbon production in selected cities during the 2017/18 winter heating season. The curtailments started around November 2017 and continue until March 2018. These policies required the curtailment of 30 percent
of China’s alumina and aluminium production in the selected cities. There have also been a number of Chinese Government environmental audits in 2017 which have led to reduction in bauxite and alumina production. Some provinces cut production at different rates and the final cuts, which will be measured in low pollution days in winter, are yet to be ascertained.
However, the reduction in aluminium production in Shandong was less than initially expected, as cuts to unauthorised smelting capacity were able to be treated as winter curtailments. It is expected that the central Government will repeat the winter cuts policy at the end of 2018 and could either strengthen or relax the required curtailments, depending on the overall air quality improvement achieved over the 2017/2018 winter.
The Government also introduced supply-side reforms in 2017 to consolidate and reduce inefficient or obsolete capacity in the aluminium and other industries. This has led initially to the curtailment of a significant volume of smelting capacity built without authorisation. A scheme has been introduced which allows companies to obtain replacement quotas authorising additional capacity. This is expected to add a limited volume of Chinese smelting capacity coming online during 2018 and 2019.
Alumina supply and demand is expected to continue to grow and remain reasonably balanced over the next 5 years, and should underpin price support.
BAUXITE
China imported over 67 million tonnes of bauxite in 2017, including a record high estimated at approximately 7 million tonnes in December. The majority of imports came from Guinea and Australia, two countries in which AWAC has strong bauxite interests. Other countries supplying China included Malaysia, Indonesia, India and Brazil. The Pahang Government in Malaysia has extended its mining ban into 2018. Indonesia has relaxed its bauxite export ban and modest export volumes have commenced. Guinea and Australia are expected to continue solid supply to China.
Third party bauxite prices increased particularly in the last quarter of 2017 due to supply disruptions inside and outside China. Further bauxite supply is expected to be added in 2018 and the third party market is expected to be well supplied in 2018. However, the Chinese Government’s recent environmental focus in China is restricting bauxite production. Also, environmental constraints in China are expected to cause refiners to locate new capacity on the coast in relatively decentralised provinces and use imported bauxite. These factors are expected, in the short to medium term, to accelerate the increase in demand for imported bauxite into China, which had been seen as a likely step-change expected around 2021, as Chinese domestic bauxite quality depletes.
Bauxite is expected to remain in ample supply during 2018.For
per
sona
l use
onl
y
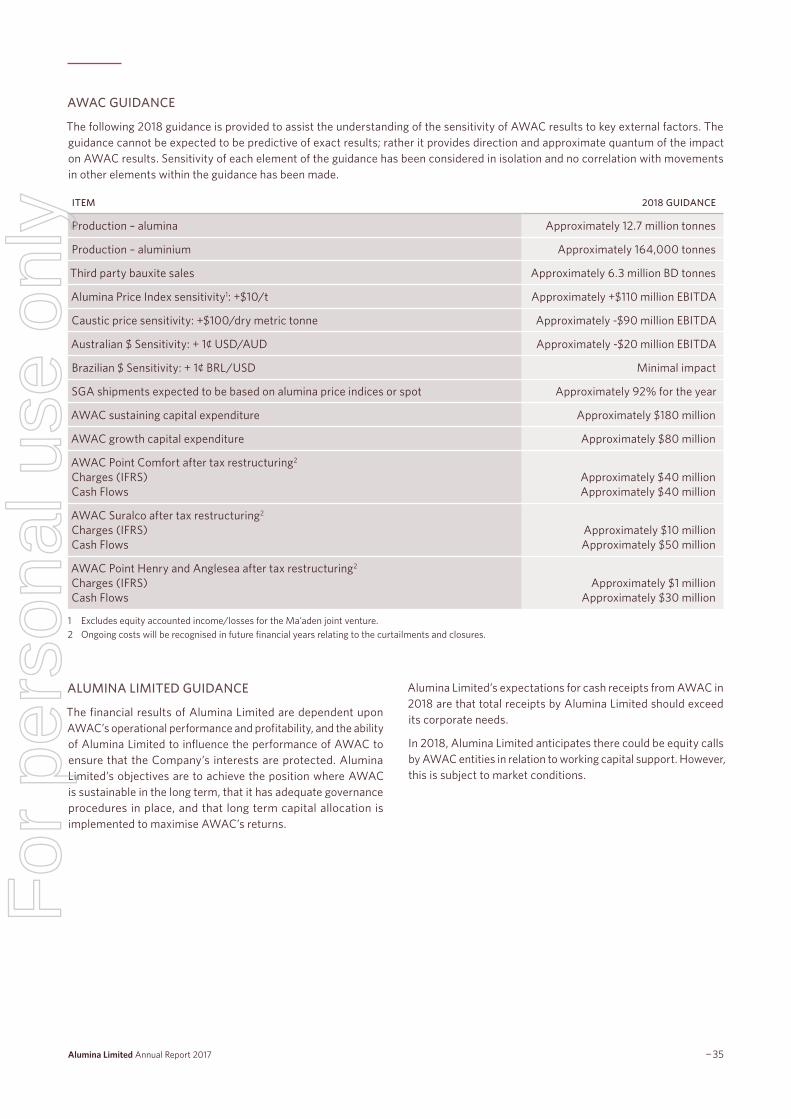
¬35 34¬ Alumina Limited Annual Report 2017
AWAC GUIDANCE
The following 2018 guidance is provided to assist the understanding of the sensitivity of AWAC results to key external factors. The guidance cannot be expected to be predictive of exact results; rather it provides direction and approximate quantum of the impact on AWAC results. Sensitivity of each element of the guidance has been considered in isolation and no correlation with movements in other elements within the guidance has been made.
ITEM 2018 GUIDANCE
Production – alumina Approximately 12.7 million tonnes
Production – aluminium Approximately 164,000 tonnes
Third party bauxite sales Approximately 6.3 million BD tonnes
Alumina Price Index sensitivity1: +$10/t Approximately +$110 million EBITDA
Caustic price sensitivity: +$100/dry metric tonne Approximately -$90 million EBITDA
Australian $ Sensitivity: + 1¢ USD/AUD Approximately -$20 million EBITDA
Brazilian $ Sensitivity: + 1¢ BRL/USD Minimal impact
SGA shipments expected to be based on alumina price indices or spot Approximately 92% for the year
AWAC sustaining capital expenditure Approximately $180 million
AWAC growth capital expenditure Approximately $80 million
AWAC Point Comfort after tax restructuring2
Charges (IFRS)Cash Flows
Approximately $40 millionApproximately $40 million
AWAC Suralco after tax restructuring2
Charges (IFRS)Cash Flows
Approximately $10 millionApproximately $50 million
AWAC Point Henry and Anglesea after tax restructuring2
Charges (IFRS)Cash Flows
Approximately $1 millionApproximately $30 million
1 Excludes equity accounted income/losses for the Ma’aden joint venture.2 Ongoing costs will be recognised in future financial years relating to the curtailments and closures.
ALUMINA LIMITED GUIDANCE
The financial results of Alumina Limited are dependent upon AWAC’s operational performance and profitability, and the ability of Alumina Limited to influence the performance of AWAC to ensure that the Company’s interests are protected. Alumina Limited’s objectives are to achieve the position where AWAC is sustainable in the long term, that it has adequate governance procedures in place, and that long term capital allocation is implemented to maximise AWAC’s returns.
Alumina Limited’s expectations for cash receipts from AWAC in 2018 are that total receipts by Alumina Limited should exceed its corporate needs.
In 2018, Alumina Limited anticipates there could be equity calls by AWAC entities in relation to working capital support. However, this is subject to market conditions.
For
per
sona
l use
onl
y

¬37 36¬ Alumina Limited Annual Report 2017
Dear Shareholders,
It gives me pleasure to write to you on Alumina's 2017 remuneration report and decisions in the context of the company’s performance, achievements and developments.
2017 COMPANY PERFORMANCE
Alumina Limited (Alumina) performed strongly in 2017 recording a net profit of $340 million. Alumina’s financial performance reflected the underlying strengths of AWAC’s Tier 1 assets and improved commodity prices. Continued work by Alcoa and Alumina, including difficult decisions made in recent years during the commodity cycle, have improved the asset portfolio. Following the changes to the AWAC joint venture secured in 2016, Alumina senior executives continue to work on additional strategies to optimise shareholder outcomes.
2017 REMUNERATION OUTCOMES
BASE PAY
After consideration of market and sector trends, company performance and the broader trading environment, Key Management Personnel (KMP) base salaries were increased by 2.5 per cent in line with the increase applicable to all staff (2016 nil).
STI OUTCOMES
In line with this strong company performance, I am pleased to report overall performance against the corporate and personal scorecards of each executive was measured at an average scorecard performance of 90 percent of target. This yielded STIs in the range of 70 per cent of maximum delivering a total value of $924,653 to executives*.
The Board applies a rigorous approach to assessing final STI awards and consideration was given to the revised AWAC agreements impact on distributions and debt financing that were given effect in 2017 and a variety of strategic initiatives and joint venture matters that were progressed.
LTI OUTCOMES
It was satisfying to see the Company’s share price performed well versus other major Australian and international industry peers, resulting in vesting through our LTI Plan. The Company’s total shareholder return was 41.9 per cent in 2017 and 51.19 per cent over the previous three years. The amount of dividends distributed to Alumina shareholders increased from US6 cents per share in
2016 to US13.5 cents per share in 2017. Approximately 420,000 shares worth $1.012 million were vested to the senior team in 2017 under the LTI Plan.**
Further detail on company performance and remuneration outcomes is set out in 43 of the report.
NEW CEO REMUNERATION STRUCTURE
In 2017, Alumina appointed a new CEO, Mike Ferraro, to succeed Peter Wasow who led the successful joint venture renegotiation. Mike Ferraro brings an extensive range of relevant skills and commercial experience to help deliver on Alumina’s strategic objectives.
The CEO succession presented the Board with the timely opportunity to reassess the incoming CEO’s remuneration structure in the context of the company’s present circumstance.
The Board reconsidered the structure of the CEO’s remuneration given the unique nature of the Company, the cyclicality of the industry, the requirements of this critical leadership role in creating long term shareholder value, and the skills and experience necessary for the role. As a result, the Board decided to evolve further the structure of the CEO’s remuneration - specifically to increase the proportion of equity based pay by increasing the quantum of conditional rights, to cease the annual STI scorecard based award and, to maintain the LTI. At the same time, the Board considered and maintained its discipline of setting overall level of remuneration at modest levels (lowest quartile) together with a structure that ensures an upswing in the commodity cycle does not generate excessive rewards.
Further detail on the CEO’s new remuneration structure is set out on page 42.
* 2017’s STI payments were down by approximately $985,000 compared with 2016 (in which two executives received enhanced payments to reflect their considerable achievements in the JV transformation and renegotiation). 2017 STI (and 2016) payments included the former CEO & other Key Management Personnel (KMP).
** Alumina Limited’s LTI plan uses share value at vesting date.
Letter by Chair of the Compensation Committee
For
per
sona
l use
onl
y

¬37 36¬ Alumina Limited Annual Report 2017
OTHER REMUNERATION CHANGES IN 2017
NON-EXECUTIVE DIRECTOR FEES
As foreshadowed in the 2016 remuneration report, the Compensation Committee had an independent review undertaken of Non-Executive director fees during the year. As a result of the review:
• NED base fees remain unchanged (since 2011) as they are considered competitive to attract appropriately qualified and skilled NEDs to the Alumina Board,
• The review revealed that Chairman and Audit & Risk and Compensation Committee Chairs’ fees had fallen below market, and did not reflect current workloads with the changes to the joint venture and resultant new relationships. The Board, therefore, resolved to increase fees for the Chairman and the fees for chairing these two committees. Further detail is set out on page 60 of the report.
In closing, I am pleased that the 2017 work of the Compensation Committee supported the important task of CEO succession, evolving remuneration structures and making sound remuneration decisions aligned with Alumina’s investment proposition and experience of shareholders, Alumina’s role in the AWAC joint venture and the governance principles established by the Board.
We appreciate the dialogue we have on this remuneration report and continue to welcome feedback.
Emma Stein Chair —F
or p
erso
nal u
se o
nly

38¬
This Remuneration Report outlines the Director and executive remuneration arrangements of Alumina Limited. The information provided is given in accordance with the requirements of the Corporations Act and has been audited. This report forms part of the Directors’ Report for the year ended 31 December 2017.
All contracts for key management personnel (KMP) are denominated in Australian dollars and accordingly all figures in the Remuneration Report are in Australian dollars unless otherwise shown. References to Senior Executives exclude the Chief Executive Officer (CEO).
CONTENTS
The Remuneration Report is presented in the following sections:
1 REMUNERATION POLICY & FRAMEWORK 39
1.1 Persons covered by this report 39
1.2 Remuneration framework 39
1.2.1 Remuneration in business context 39
1.2.2 Remuneration Components 40
1.2.3 CEO and Senior Executives remuneration mix and comparables 42
2 COMPANY PERFORMANCE & EXECUTIVE REMUNERATION OUTCOMES 43
2.1 Remuneration decisions and outcomes for 2017 45
2.1.1 Performance under the STI 46
2.1.2 Performance under the LTI Plan 48
2.1.3 Alumina Limited’s Remuneration Governance Framework 48
2.1.4 Other Remuneration matters 49
2.2 Senior Executive remuneration 50
2.3 Executive KMP remuneration and equity granted in 2017 52
2.3.1 Executives’ Service Agreements 59
3 NON-EXECUTIVE DIRECTORS’ REMUNERATION 60
3.1 Remuneration outcomes 60
3.2 Non–Executive Director share holdings 61
Remuneration Report
For
per
sona
l use
onl
y

¬39 Alumina Limited Annual Report 2017
1. REMUNERATION POLICY & FRAMEWORK
1.1 PERSONS COVERED BY THIS REPORT
This report covers remuneration arrangements and outcomes for the following key management personnel of Alumina Limited:
NAME ROLE
Non-Executive Directors
John Pizzey Non-Executive Chairman Appointed Chairman 1 December 2011 (director since 8 June 2007)
Emma Stein Non-Executive Director Appointed 3 February 2011
Chen Zeng Non-Executive Director Appointed 15 March 2013
Peter Day Non-Executive Director Appointed 1 January 2014
Deborah O'Toole Non-Executive Director Appointed 1 December 2017
Mike Ferraro Non-Executive Director Appointed 5 February 2014 to 31 May 2017
Executive Director
Peter Wasow Chief Executive Officer (CEO) CEO from 1 January 2014 to 31 May 2017
Mike Ferraro Chief Executive Officer (CEO) Appointed CEO from 1 June 2017
Other KMP
Chris Thiris Chief Financial Officer (CFO) Appointed 13 December 2011
Stephen Foster General Counsel/Company Secretary Appointed 4 December 2002
Andrew Wood Group Executive Strategy & Development
Employed 1 September 2008
1.2 REMUNERATION FRAMEWORK
1.2.1 REMUNERATION IN BUSINESS CONTEXT
Alumina Limited’s remuneration strategy and policy has been developed in recognition of the unique nature of the Company, the complexities of managing a significant but non-controlling interest in a global joint venture and the significance of external factors’ influence on the sector and the Company’s performance.
Alumina Limited owns a 40 per cent interest in the multi-billion dollar global enterprise, AWAC, one of the world’s largest bauxite and alumina producers. AWAC is a large capital-intensive business operating in a number of jurisdictions and some in remote locations. Alumina Limited’s executives are responsible for protecting and advancing the interests of its 49,000 shareholders in the management of AWAC. Consistent with the governing joint venture Agreements, Alumina executives are responsible for providing strategic input and advice into the joint venture. To do so, they are required to have a deep understanding of the complex trends and drivers of the global bauxite, aluminium and volatile alumina industry.
At the Board’s direction, the CEO and Senior Executives are required to maintain Alumina Limited’s financial metrics consistent with an investment grade rating, maximize cash flow from AWAC and support the joint venture in its efforts to improve its relative cost position and strategic options.
The latter responsibilities rest with a small team of four key executive officers. Alumina Limited requires and must retain, high calibre people with strong skills sets and commercial experience to ensure the Company and its investment are managed well. They are charged with:-
• Shaping AWAC’s strategy, competitive position and options
• Maximizing cash flow from AWAC and metrics in a highly cyclical industry
• Managing Alumina Limited’s investment as a tier one largely pure play global bauxite and alumina producer
• Building effective working relationships with Alcoa, our joint venture partner and asset operator.
For
per
sona
l use
onl
y

¬41 40¬ Alumina Limited Annual Report 2017
To support the delivery of the business strategy, Alumina Limited's remuneration strategy has been designed to attract and retain executives who are highly commercial, strategic and have tactical experience. Hence, Alumina Limited's remuneration needs to be competitive, valued and relevant. The Board aims to:-
• Aid alignment between Company, executive and board and stakeholder interests – as discussed below, the CEO’s remuneration is equity exposed (through the Conditional Rights component and his incentive through the LTI scheme which requires relative outperformance). Other Executive KMPs (excluding Mr Wood) are required to reinvest half of any short term incentive payments into equity and Alumina Limited has a minimum shareholding policy for Non-Executive Directors.
• Ensure remuneration structures are relevant to roles – At Alumina Limited, executives’ performance is directed towards delivery of strategic, corporate and commercial objectives and initiatives with longer term outcomes. When compared with peers, financial metrics have less prominence in short term incentives to ensure that executive rewards do not peak merely because commodities are at the ‘top of cycle’.
• Appropriately positioned and structured – For the CEO, the quantum of his overall remuneration, Conditional Rights and LTI have all been set to produce outcomes with less upside compared with operating company peers but with, none the less, “skin in the game” and upside from longer term value creation.
More detail on the ‘at risk’ and equity remuneration components and their link to company performance is included in section 2 of this report.
1.2.2 REMUNERATION COMPONENTS
The following table sets out the different components of remuneration for the CEO and Senior Executives, the performance measures used to determine the amount of remuneration executives will receive and how the performance measures drive achievement of Alumina Limited’s strategic objectives.
For
per
sona
l use
onl
y

¬41 40¬ Alumina Limited Annual Report 2017
TABLE 1 – COMPONENTS OF EXECUTIVE REMUNERATION
COMPONENT DELIVERED VIA: PERFORMANCE MEASURE STRATEGIC OBJECTIVE
Fixed Remuneration (FAR) Cash
Considerations:
• Individual’s role and responsibilities• Depth of knowledge and skill set• Level of expertise and effectiveness• Market benchmarking
Secure, retain and motivate a highly skilled and experienced executive team.
Equity based award (CEO only)
Conditional Rights
Conditional on length and continuity of service and value linked directly to the performance of the Company's share price
• Align the CEO’s remuneration with the experience of shareholders
Short Term Incentive (STI), Executive KMP other than the CEO
A mix of cash and equity (shares) for the CFO and General Counsel) and cash for Mr Wood.
Corporate Scorecard (50% of STI Award)
Minimum Performance Threshold
To trigger payment under the Corporate Scorecard, a minimum threshold of performance is required being:
• The achievement of a profit before significant items; and
• declare dividends which provide a minimum yield of three per cent based on annual VWAP
This reinforces discipline in financial management and goal setting also providing determinable outcomes that are linked to the Company’s performance.
Financial objectives based on controllable metrics:
• Free Cash flow• Consistent with investment rating
• Cash flow from AWAC is fundamental to Alumina Limited’s capacity to pay dividends and to meet the terms of external financing.
• A sound balance sheet with key banking relationships is critical to the Company’s strength, stability and future success.
Strategic and individual objectives
• Aligned to strategic and growth objectives.• Improve long-term cost curve positioning
and strategic options to develop the business.
• Protect Alumina Limited’s interests through increased clarity on AWAC governance.
• Ensuring Alcoa treats AWAC transactions at arm’s length and Alumina Limited’s shareholders’ interests are protected in short and long term.
Personal Scorecard (50% of STI Award)
Implementation of business initiatives for which individual executives have defined accountabilities.
• Delivery on commercial and financial projects that aid AWAC’s and Alumina Limited’s performance and attribute costs fairly to the equity owners
Long-term Incentive Plan (LTI), All Executive KMP
Equity in the form of performance rights
Relative TSRs, Three year Company TSR performance equal to or outperforming 50 per cent of the two comparator groups results (half of the LTI is attributable to each group).
• A result below 50 per cent for a group will not result in an award of equity to the Company participants for that half of the LTI.
• Emphasises the importance for management to strive to maintain the share price through the volatility involved in a capital intensive business heavily impacted by external factors.
• Linked to long-term business strategy and focuses executives on key performance drivers for sustainable growth.
• Links rewards of participants in the LTI plan to the experience of the shareholders.
For
per
sona
l use
onl
y

¬43 42¬ Alumina Limited Annual Report 2017
1.2.3 CEO AND SENIOR EXECUTIVES REMUNERATION MIX AND COMPARABLES
Remuneration Mix Overview
The intent of the CEO and Senior Executives remuneration arrangements is shared, that is to remunerate fairly and to attract and retain appropriately skilled and experienced staff and also provide incentive to individuals to drive shareholder wealth in their various roles. However, there are differences in the structures and relativities.
In setting the CEO and Senior Executive remuneration quantum and mix, the Board takes into account a number of factors including:
• The scope of the individual’s role
• Their skills and experience
• Role-critical factors
• Company performance
• External market practice.
CEO Remuneration structure
As previously mentioned, the Board instituted changes to remuneration components of the CEO’s 2017 remuneration package which is structured differently to the profile of the previous CEO. However, in terms of overall potential quantum, there is little change.
The Board reconsidered which remuneration elements most aligned with the role of the CEO at Alumina Limited and the skills and experience of the individual who was appointed. The aspects considered most important centred on strategic influence, long term value creation, joint-venture and industry relationships, identification of portfolio opportunities and leadership skills. An annual award based on a scorecard assessment was thought to be less meaningful at CEO level but a greater proportion of equity exposure within overall remuneration was thought to be more meaningful and reflective of the CEO performance. As well the Board wished to maintain positioning in the lowest quartile and ensure upswings in the cycle don’t generate excessive remuneration rewards. The decision to remove the STI also aligns with Alumina Limited’s remuneration strategy, in particular to have lower levels of maximum short term incentives when compared with peers.
The Board continues to set specific objectives for the CEO including for example strategic initiatives, asset portfolio enhancements, and other leadership matters. Typically some of these objectives relate to the year ahead, whereas others may take longer to achieve with specific milestones sought in the year ahead. Progress is reviewed formally quarterly and at the end of the year. This process provides the Board with a basis to assess and discuss CEO performance in the short term. Also, and importantly, it provides a basis to ensure that the Board and CEO are aligned on priorities that will underpin long term shareholder value creation. While the CEO does not have any STI remuneration linked to the achievement of annual performance objectives, it ensures the Board has a formal transparent mechanism to measure, and hold the CEO accountable, for performance.
Alumina Limited resolved to structure the CEO’s remuneration components as follows:
A fixed cash remuneration component of $1,275,000 plus an:
• Equity component that is variable in value contingent on the share price performance of Alumina Limited and delivered via conditional rights valued at $400,000 at the time of the grant. This component of the CEO’s pay has a three year trading restriction imposed and is therefore at risk to share price fluctuations, in line with the experience of shareholders.
• Equity component contingent on the Company’s TSR performance against comparator group companies and is delivered in performance rights valued at $450,000 at the time of the grant, with a 3 year performance period. This reinforces the remuneration policy that the CEO acts in the longer term interests of the Company and its shareholders
The restructuring of the CEO’s remuneration to include conditional rights, coupled with the LTI opportunity results in a total of 40 per cent of the CEO’s total opportunity remuneration being variable to share price fluctuations.
The Board is satisfied that the CEO’s target remuneration is appropriate to attract, retain and motivate a high calibre, and with appropriate skill-set CEO. The revised CEO remuneration package was validated through external benchmarking.
A market comparison was conducted against the CEO remuneration of the ASX51-100, the Company’s preferred comparator group that comprises companies with a market capitalisation of approximately 70% to 150% of Alumina Limited. Relative to this comparator group, the CEO’s total reward opportunity was a modest 4th percentile. Compared to the ASX51-75 comparator group the CEO’s total reward ranked as the lowest.
The CEO’s FAR quantum at $1,275,000 positions him at the 34th percentile of the ASX51-100 comparator group and at the 19th percentile of the ASX51-75 comparator group which the Board is satisfied reflects an appropriate quantum for the CEO of a non-operating entity such as Alumina Limited.
% of potential totalremunaration
Year 1
Equi
tyC
ash
Year 2 Year 3
CEOFAR 60%
Conditional Rights 19%
LTI Performance Rights 21%
Restriction period
For
per
sona
l use
onl
y
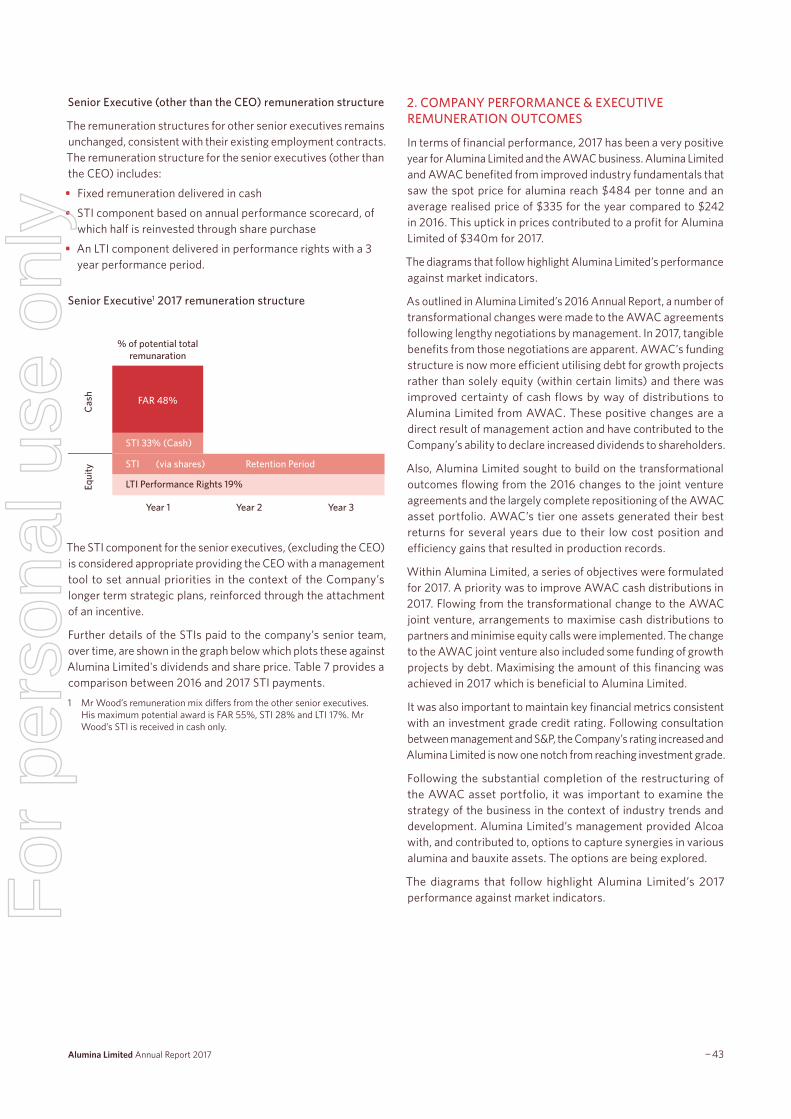
¬43 42¬ Alumina Limited Annual Report 2017
Senior Executive (other than the CEO) remuneration structure
The remuneration structures for other senior executives remains unchanged, consistent with their existing employment contracts. The remuneration structure for the senior executives (other than the CEO) includes:
• Fixed remuneration delivered in cash
• STI component based on annual performance scorecard, of which half is reinvested through share purchase
• An LTI component delivered in performance rights with a 3 year performance period.
Senior Executive1 2017 remuneration structure
The STI component for the senior executives, (excluding the CEO) is considered appropriate providing the CEO with a management tool to set annual priorities in the context of the Company’s longer term strategic plans, reinforced through the attachment of an incentive.
Further details of the STIs paid to the company’s senior team, over time, are shown in the graph below which plots these against Alumina Limited's dividends and share price. Table 7 provides a comparison between 2016 and 2017 STI payments.
1 Mr Wood’s remuneration mix differs from the other senior executives. His maximum potential award is FAR 55%, STI 28% and LTI 17%. Mr Wood’s STI is received in cash only.
% of potential totalremunaration
Year 1
Equi
tyC
ash
Year 2 Year 3
FAR 48%
STI (via shares) Retention Period
LTI Performance Rights 19%
STI 33% (Cash)
2. COMPANY PERFORMANCE & EXECUTIVE REMUNERATION OUTCOMES
In terms of financial performance, 2017 has been a very positive year for Alumina Limited and the AWAC business. Alumina Limited and AWAC benefited from improved industry fundamentals that saw the spot price for alumina reach $484 per tonne and an average realised price of $335 for the year compared to $242 in 2016. This uptick in prices contributed to a profit for Alumina Limited of $340m for 2017.
The diagrams that follow highlight Alumina Limited’s performance against market indicators.
As outlined in Alumina Limited’s 2016 Annual Report, a number of transformational changes were made to the AWAC agreements following lengthy negotiations by management. In 2017, tangible benefits from those negotiations are apparent. AWAC’s funding structure is now more efficient utilising debt for growth projects rather than solely equity (within certain limits) and there was improved certainty of cash flows by way of distributions to Alumina Limited from AWAC. These positive changes are a direct result of management action and have contributed to the Company’s ability to declare increased dividends to shareholders.
Also, Alumina Limited sought to build on the transformational outcomes flowing from the 2016 changes to the joint venture agreements and the largely complete repositioning of the AWAC asset portfolio. AWAC’s tier one assets generated their best returns for several years due to their low cost position and efficiency gains that resulted in production records.
Within Alumina Limited, a series of objectives were formulated for 2017. A priority was to improve AWAC cash distributions in 2017. Flowing from the transformational change to the AWAC joint venture, arrangements to maximise cash distributions to partners and minimise equity calls were implemented. The change to the AWAC joint venture also included some funding of growth projects by debt. Maximising the amount of this financing was achieved in 2017 which is beneficial to Alumina Limited.
It was also important to maintain key financial metrics consistent with an investment grade credit rating. Following consultation between management and S&P, the Company’s rating increased and Alumina Limited is now one notch from reaching investment grade.
Following the substantial completion of the restructuring of the AWAC asset portfolio, it was important to examine the strategy of the business in the context of industry trends and development. Alumina Limited’s management provided Alcoa with, and contributed to, options to capture synergies in various alumina and bauxite assets. The options are being explored.
The diagrams that follow highlight Alumina Limited’s 2017 performance against market indicators.F
or p
erso
nal u
se o
nly

44¬
80
90
100
110
120
130
140
150
Jan Feb Mar Apr May Jun Jul Aug Sep Oct Nov Dec
Alumina Ltd. TSR (incl. franking credits)
ASX100 Accumulation Index
ASX200 Materials Accumulation Index
Alumina Limited 2017 TSR compared to ASX indices1
PERC
ENTA
GE
CH
AN
GE
024
68
101214
0
30
60
90
120
150180
Dividend
% Target STI
Percentage awarded compared to potential
5 year dividend and percentage STI award history
US
CEN
TS/S
HA
RE
PERC
ENTA
GE
2013 2014 2015 2016 2017
Share Price
% LTI
0
0.5
1
1.5
2
2.5
3
0
20
40
60
80
100
120
5 year share price and percentage LTI award history
AU
$/SH
ARE
PERC
ENTA
GE
2013 2014 2015 2016 2017
80
90
100
110
120
130
140
Jan Feb Mar Apr May Jun Jul Aug Sep Oct Nov Dec
Alumina Ltd.
All Ordinaries Index
ASX300 Metals and Mining Index
ASX100 Index
ASX200 Materials Index
Alumina Limited 2017 share price performance compared to ASX indices2
PERC
ENTA
GE
CH
AN
GE
1 Accumulation indices were used to take into account dividends and both growth and dividend income.2 Non accumulation indices do not take dividends into account and measure price growth only.
REMUNERATION INDICATORS
REMUNERATION INDICATORS 20173 2016 2015 2014 2013
Per cent increase in fixed remuneration1 2.50% Nil 3.50% 3.00% 3.80%
Per cent short-term incentive2 33% 64% 38% 40% 22%
Per cent long-term incentive2 32% 23% 23% 10% 8%
1 Percentage is calculated by reference to FAR as at 31 December in the stated financial year relative to FAR as at 31 December in the immediately preceding financial year.
2 Represents the percent of total 'at risk' incentive component compared to the total FAR applicable to Senior Executives and the CEO.3 In 2017, the calculation excludes FAR of Mr Ferraro for whom no STI is applicable and the termination payment for Mr Wasow.
For
per
sona
l use
onl
y

¬45 Alumina Limited Annual Report 2017
2.1 REMUNERATION DECISIONS AND OUTCOMES FOR 2017
FIXED REMUNERATION
2017 OUTCOMES The fixed remuneration for the Senior Executives (excluding the CEO) increased in 2017 by 2.5%. This was the lower end of the forecast increase for the resources sector.
The CEO's fixed remuneration was reviewed on appointment and details are set out in section 1.2.3.
SHORT TERM INCENTIVE
2017 OUTCOMES 50 percent of the STI is assessed against a Corporate Scorecard of objectives and 50 per cent against a Personal Scorecard of objectives.
Executives achieved on average 70 per cent of maximum STI. The total percentage paid against the target STI varied between 89–91% of the target level.
For a detailed performance against the Corporate and Personal Scorecard see pages 46 and 47.
LONG TERM INCENTIVE
2017 OUTCOME Rights granted In 2015 Performance Rights were tested in 2017 (testing period December 2014 to December 2017).
As a result of Alumina Limited's percentile performance against the ASX Comparator group, 52.38 per cent of the potential entitlement vested. In relation to the International Comparator Group, Alumina Limited's performance resulted in 96.58 per cent of the potential entitlement vesting. Table 8 indicates the number of shares that vested under the LTI.
For
per
sona
l use
onl
y

46¬
2.1.1 PERFORMANCE UNDER THE STI PLAN
Tables 3 and 4 below provide a summary assessment of performance against STI performance measures for 2017.
TABLE 3 – CORPORATE SCORECARD – 50% OF POTENTIAL STI AWARD
PERFORMANCE MEASURES PERFORMANCE RESULT AND ASSESSMENT
Financial objective – Maximising cash flow under the joint venture agreements (20% weighting)
At target Distributions of US$343.1 million received during 2017.
Financial objective – Maintain key financial metrics consistent with investment grade credit rating:(i) Funds from operations/debt >5%(ii) Debt / EBITDA<2 times(10% weighting)
At target Credit rating increased to 2 notches above Alcoa. Funds from operations/total debt 214%. Net debt/EBITDA is [0.5 times],
Strategic objective – Strategic review to progress alternative corporate strategies (15% weighting)
Below target Continuing to develop alternative corporate strategies
Strategic objective – Prepare corporate development plan and strategy (20% Weighting)
At target Plans developed and implemented
Strategic objective – Work with Alcoa on AWAC asset and business synergies and strategies (20% weighting)
Below target Recommendations developed and communicated to Alcoa and synergies being reviewed
Strategic objective – Progress a strategy on strategic decisions relating to Brazilian assets with Alcoa (15% weighting)
Below target Positive response and action taken. However, still in progress.
Strategic objective – Develop a bauxite pricing and investment strategy (10% weighting)
Below target Bauxite pricing strategies well developed and initiatives introduced
For
per
sona
l use
onl
y

¬47 Alumina Limited Annual Report 2017
TABLE 4 – PERSONAL OBJECTIVES – 50% OF POTENTIAL STI AWARD (THE APPLICATION OF PERSONAL OBJECTIVES VARY FOR EACH EXECUTIVE)
PERFORMANCE MEASURES PERFORMANCE RESULT ASSESSMENT
Resolve the treatment of certain Alcoa Brazilian alumina tonnage
(15% weighting)
Below target
Ongoing
Hold Alumina Limited costs flat to 2016
(10% weighting)
At target
Achieved, excluding extraordinary expenses directly related in activities to finalise the joint venture restructure
Implement process and information gathering in relation to treatment of pre-existing liabilities at the Point Comfort refinery
(15% weighting)
At target
Progressing but not finalised.
Protect Alumina Limited’s rights in Suriname closure and that pre-existing liabilities are correctly allocated.
(15% weighting)
Below target
Company position determined, outcome yet to be resolved
Agree with Alcoa and execute AWAC debt financing.
(15% weighting)
At target
Achieved
Review with Alcoa indirect risk management priorities.
(10% weighting)
At target
Achieved
Verify intercompany charges for AWAC and related party transactions with Alcoa and isolate separation costs.
At target
Relevant cost allocations appropriate
Develop financing strategies
(5% weighting)
At target
Achieved
TABLE 5 – 2017 STI OUTCOMES
The following table indicates the actual value of STI paid to the CEO and Senior Executives and the percentage of total potential STI paid and forfeited by each executive.
EXECUTIVE KMP YEAR STI PAID PERCENTAGE PAID
PERCENTAGE FORFEITED
Michael Ferraro (CEO) 2017 – – –
Peter Wasow ( Previous CEO)1 2017
2016
185,653
725,000
75%
175%
25%
–
Chris Thiris (CFO) 2017
2016
355,000
485,000
72%
100%
28%
–
Stephen Foster (General Counsel/Company Secretary) 2017
2016
265,000
500,000
71%
138%
29%
–
Andrew Wood (Group Executive Strategy and Development) 2017
2016
119,000
200,000
64%
110%
36%
–
Total Executive Remuneration 2017
2016
924,653
1,910,000
71%
132%
29%
–
1 Mr Wasow retired and ceased employment with Alumina Limited on 31 July 2017. His STI payment was pro-rated for his time of service.
For
per
sona
l use
onl
y

¬49 48¬ Alumina Limited Annual Report 2017
NET (LOSS)/PROFIT AFTER TAX EXCLUDING SIGNIFICANT ITEMS
The Board had considered the following factors in deciding whether it is appropriate to use adjusted earnings within the STI scheme;
• the rationale and circumstances causing the adjustment, or simply put, was it the right thing to do?
• the impact on shareholders.
• was the matter caused by error or poor judgement.
• was the matter within management’s control (for example, was it a legacy matter).
• the Audit and Risk Committee’s review of these matters.
2.1.2 PERFORMANCE UNDER THE LTI PLAN
The testing of the LTI Performance Rights granted in 2015 resulted in partial vesting of those due to the Company’s performance outcome exceeding the minimum vesting criteria for both comparator groups. Performance Rights not allocated lapse. Retesting does not apply.
TSR PERFORMANCE RESULTS FOR THE YEARS 2013 TO 2017
2017 2016 2015 2014 2013
Percentile ranking of TSR against ASX Comparator Group 511 76 35 46 18
85 48
Percentile ranking of TSR against International Comparator Group3 732 100 67 38 30
84 74
Percentage of total remuneration relating to vested LTI4 20% 37% 15% 2% 8%
1 TSR percentile ranking of approximately 51 is applicable to Performance Rights granted in 2015 under the ESP against the ASX Comparator Group, performance period 12 December 2014 to 11 December 2017, calculated on the average closing share price over the 20 trading days up to and including the start of the performance period, and on the average closing share price over the 20 trading days up to and including the end of the performance period.
2 TSR percentile ranking of approximately 73 is applicable to Performance Rights granted in 2015 under of the ESP against the International Comparator Group, performance period 12 December 2014 to 11 December 2017, calculated on the average closing share price over the 20 trading days up to and including the start of the performance period, and on the average closing share price over the 20 trading days up to and including the end of the performance period.
3 For the testing of the tranche in December 2017, the comparison was made against the performance of eight companies in the alumina or aluminium industry. The Board considers the reasonableness of the International Comparator Group each year and due to the limited number of relevant companies against which to test on a like basis Alumina Limited’s performance. For the grant in 2017, it was decided to include United Company Rusal that increased the comparator group to nine companies, a number the Board considers is appropriate.
4 Represents the average applicable to senior executives.
2.1.3 ALUMINA LIMITED’S REMUNERATION GOVERNANCE FRAMEWORK
THE BOARD OF DIRECTORS
Reviews and approves the Charter of the Compensation Committee. The Board approves the remuneration philosophy, policies and practices.
COMPENSATION COMMITTEE
Delegated authority to:
• Take advice from management and where relevant, independent advisers.
• Devise a remuneration framework, strategy, policies and practices.
• Oversee the implementation of the remuneration strategy and policy.
• Establish appropriate performance objectives and measures.
• Monitor performance against objectives and recommend incentive awards.
• Approve remuneration outcomes.
EXTERNAL CONSULTANTS
• Provide independent advice on remuneration trends and practices.
• Provide benchmarking data and analysis.
• Support the Compensation Committee in relation to changes to remuneration policy, employment contracts, structures and practices etc.
• Provide governance and legal advice on remuneration related matters.
MANAGEMENT
• Provides the Compensation Committee with information to assist in its remuneration decisions including remuneration recommendations.
The Compensation Committee is solely formed of Non-Executive Directors and is chaired by Ms Emma Stein.
The duties and responsibilities delegated to the Compensation Committee by the Board are set out in the Compensation Committee’s Charter, which is available on the Company’s website at www.aluminalimited.com/compensation-committee.
For
per
sona
l use
onl
y

¬49 48¬ Alumina Limited Annual Report 2017
Remuneration Consultants
The Compensation Committee has the authority to seek advice from independent remuneration consultants on matters relating to remuneration including developing and implementing executive remuneration strategies, associated statutory obligations and the quantum of remuneration.
Alumina Limited has established protocols for the engagement of remuneration consultants and the processes to be followed regarding recommendations.
In seeking remuneration advice from consultants, the Compensation Committee ensures that the advice is free from undue influence by:
• selecting the consultant
• briefing the consultant
• receiving the report directly from the consultant rather than via Company executives
• the consultant declaring that a remuneration recommendation is free from undue influence by the Key Management Personnel to whom it relates.
In 2017, no remuneration recommendation, as defined in the Corporations Act, was received.
2.1.4 OTHER REMUNERATION MATTERS CLAWBACK POLICY
Alumina Limited has a Clawback Policy that provides scope for the Board to recoup incentive remuneration paid to the CEO and senior executives where:
• material misrepresentation or material restatement of Alumina Limited’s financial statements occurred as a result of fraud or misconduct by the CEO or any senior executives; and
• the CEO or senior executives received incentive remuneration in excess of that which should have been received if the Alumina Limited financial statements had been correctly reported.
The Board also may seek to recover gains from the sale or disposition of vested shares and determine to cancel unvested equity awards.
CHANGE OF CONTROL
In the event of a change in control, the Board may bring forward the testing date for the LTI performance conditions, or waive those conditions, and/or (in the case of Performance Rights granted from 2016) shorten the exercise period for Performance Rights that have already vested or that vest subsequently. The Board may also, in its discretion, determine that cash settlement amounts will be paid in respect of any vested Performance Rights.
CESSATION OF EMPLOYMENT
On cessation of employment, prior to Performance Rights vesting, except to the extent that the Board otherwise determines in its absolute discretion within 20 business days after employment ceasing, a pro rata number of unvested Performance Rights will lapse. The number of unvested Performance Rights that lapse will be proportional to the amount of the testing period that has not yet elapsed at the time of employment ceasing. In these circumstances, the Board also has discretion under the LTI plan rules to determine, within two months of employment ceasing, that any of the remaining unvested Performance Rights are forfeited.
In relation to any remaining unvested Performance Rights that do not lapse and are not forfeited, they will continue on foot under the LTI plan rules and be tested for vesting in the normal way unless the exercise period is shortened or the Board in its discretion determines that any or all performance conditions in respect of all or some of the Performance Rights will be tested at a date determined by the Board or waived, and/or cash settlement amounts will be paid in respect of Performance Rights that vest and are exercised.
Mr Peter Wasow retired and ceased employment with Alumina Limited on 31 July 2017. As per the terms of his contract, Mr Wasow was paid;
• FAR proportionally calculated in lieu of notice (notice period 31 July 2017 to 1 June 2018)
• STI pro rata payment for 1 January to 31 July 2017 based on delivery of specific pre-retirement outcomes and his role in handover to his successor
• LTI unvested Performance Rights were lapsed proportional to the amount of the testing period that had not yet elapsed at the time of ceasing employment.
As a result, Mr Wasow has two further tranches due for testing in December 2018 and December 2019. In total Mr Wasow had 851,600 Performance Rights prior to his retirement. After applying pro rata allocation, Mr Wasow lapsed 387,134 rights with 464,466 retained subject to performance testing.F
or p
erso
nal u
se o
nly

¬51 50¬ Alumina Limited Annual Report 2017
SHARE TRADING AND HEDGING PROHIBITIONS
Performance Rights granted under Alumina Limited’s LTI plan must remain at risk until fully vested. This is consistent with Alumina Limited’s Share Trading Policy that prohibits Directors and employees from engaging in:
• short-term trading of any Alumina Limited securities
• buying or selling Alumina Limited securities if they possess unpublished, price-sensitive information; or
• trading in derivative products over the Company’s securities, or entering into transactions in products that limit the economic risk of their security holdings in the Company.
2.2 SENIOR EXECUTIVE REMUNERATION
This section outlines the STI and LTI components of executive remuneration.
2017 KEY FEATURES OF THE STI PLAN KEY FEATURES OF THE LTI PLAN
Description The Board sets financial and non-financial performance objectives at the start of each year, and company and executive performance is then assessed against each objective at the end of each year to determine whether executives receive payment under the STI plan.
The LTI is delivered in the form of Performance Rights that are tested over a three year performance period. Each Performance Right that vests delivers to the holder an ordinary share in Alumina Limited upon vesting (for Performance Rights granted prior to 2016) or upon vesting and exercise (for Performance Rights granted from 2016).
Performance Period
Financial Year Three years
Performance levels
Level of Performance Percentage of FAR
Below expectations 0% received
At Target Mr Thiris 56% Mr Foster 56% Mr Wood 35%
Maximum Mr Thiris 70% Mr Foster 70% Mr Wood 50%
• The CEO Performance Right entitlement is approximately 35 per cent of FAR.
• For Mr Thiris and Mr Foster the maximum is 40 per cent of FAR and 30 per cent for Mr Wood.1
Performance hurdles
• Based on a scorecard comprising of corporate (50 per cent weighting) and personal (50 per cent weighting) objectives focused on key financial outcomes for the year ahead together with critical initiatives, issues and projects (which could be at the asset, joint venture or industry level).
• Alumina Limited’s performance is tested using relative TSR compared against two comparator groups.
• Relative TSR was chosen as a performance measure as an appropriate means of measuring Company performance as it incorporates both capital growth and dividends. The two comparator groups against which Alumina Limited’s performance is tested are:
• (Test 1 – ASX Comparator Group) S&P ASX 100 Index companies which are alternative investments for the Company's shareholders, excluding the Company, the top 20 companies by market capitalisation and property trusts.
• (Test 2 – International Comparator Group) reflecting the Company's direct competitors in the market comprising eight selected companies in the alumina and/or aluminium industries that are listed in Australia or overseas, excluding the Company. F
or p
erso
nal u
se o
nly

¬51 50¬ Alumina Limited Annual Report 2017
2017 KEY FEATURES OF THE STI PLAN KEY FEATURES OF THE LTI PLAN
Performance assessment
The Compensation Committee reviews individual performance against the scorecard at year end. It takes into account actual performance outcomes and internal and external factors that may have contributed to the results based on a comprehensive report provided by the CEO.
In determining its recommendations to the board on the level of STI payments, the Compensation Committee decides and, through discussion, tests:
• weightings.
• whether each individual element was achieved and surpassed
• if an element was not achieved, whether and for what reason a positive rating is given, otherwise likely to be zero.
Given the nature of the building blocks to the Alumina Limited STI scheme, a simple distinction between threshold, at target and stretch performance is not always apparent, especially at the beginning of the year. But in making its assessments as described above, the Compensation Committee is focused on a scheme which is sufficiently demanding and rewards hard-won achievements by executives.
Performance hurdles are independently measured by Mercer Consulting (Australia) at the conclusion of the relevant performance period. Alumina Limited’s TSR is ranked against the TSR of companies in each of the comparator groups.
Percentile ranking (in the relevant comparator group)
Percentage of annual vesting of Performance Rights in the relevant half of the LTI award
Below 50th percentile 0% vesting
Equal to 50th percentile
50% vesting
Between 50th & 75th percentile (ASX Comparator Group)1
An additional 2% of awards for each percentile increase
Equal to or greater than 75th percentile
100% vesting
Following testing, any Performance Rights that have not vested will lapse.
Entitlements • The participant is only entitled to proportionally receive dividends and other distributions, bonus issues or other benefits if the performance conditions applicable to Performance Rights are satisfied (or waived) and the Performance Rights vest and are exercised.
• Shares relating to Performance Rights, are not automatically allocated upon vesting. Instead, participants are entitled to exercise each relevant Performance Right at any time during the applicable exercise period (Exercise Period) after vesting. The Exercise Period will generally end seven years after vesting of the relevant Performance Rights. However, the Exercise Period may be shortened in certain circumstances such as cessation of employment or a change of control event. Performance Rights that do not vest as at the end of the vesting period will lapse.
1 The annual dollar value of the LTI grant is divided by the average Company share price over the 20 trading days leading up to the time that the Board determined to make offers of Performance Rights to Senior Executives under the LTI plan for the relevant year, in order to determine the number of Performance Rights to be offered.
2 If the Company's TSR performance is equal to that of any entity (or security) between the 50th percentile and the 75th percentile of the International Comparator Group ranked by TSR performance, the number of Performance Rights in the relevant half of the LTI award that vest will be equal to the vesting percentage assigned by the Board to that entity (or security). If the Company's TSR performance is between that of any two such entities (or securities) in the International Comparator Group, the number of Performance Rights in the relevant half of the LTI award that vest will be determined on a pro rata basis relative to the vesting percentages assigned by the Board to those entities (or securities).
For
per
sona
l use
onl
y

¬53 52¬ Alumina Limited Annual Report 2017
2.3 EXECUTIVE KMP REMUNERATION AND EQUITY GRANTED IN 2017
The following tables contain the components that form the total statutory remuneration paid in 2017 to the Company’s CEO and Senior Executives. Remuneration outcomes presented in Table 6 are prepared in accordance with relevant accounting standards.
TABLE 6 - CHIEF EXECUTIVE OFFICER’S AND SENIOR EXECUTIVES REMUNERATION FOR THE YEAR ENDED 31 DECEMBER 2017
EXECUTIVE KMP YEAR
SHORT-TERM BENEFITSPOST EMPLOYMENT
BENEFITS SHARE BASED PAYMENTS
TOTAL REMUNERATIONFAR1 STI2
NON- MONETARY3 OTHER4 TOTAL
SUPERANNUATION AND TERMINATION5
CONDITIONAL RIGHTS6
PERFORMANCE RIGHTS7 TOTAL
Michael Ferraro (CEO)
2017 731,502 – 18,543 – 750,045 12,248 136,111 59,265 195,376 957,669
Peter Wasow (Retired CEO)
2017 899,473 185,653 – 4,065 1,089,191 1,034,356 292,675 175,436 468,111 2,591,658
2016 1,170,838 725,000 29,676 21,997 1,947,511 19,462 207,000 310,856 517,856 2,484,829
Chris Thiris (CFO)
2017 678,712 355,000 26,371 7,798 1,067,881 29,988 – 181,694 181,694 1,279,563
2016 656,458 485,000 23,278 5,484 1,170,220 34,942 – 207,649 207,649 1,412,811
Stephen Foster (General Counsel/Company Secretary)
2017 499,600 265,000 24,213 – 788,813 29,900 – 135,995 135,995 954,708
2016 483,500 500,000 18,917 15,966 1,018,383 33,000 – 155,368 155,368 1,206,751
Andrew Wood (Group Executive Strategy and Development)
2017 353,768 119,000 11,204 – 483,972 19,832 – 71,842 71,842 575,646
2016 345,038 200,000 9,087 11,780 565,905 19,462 – 71,052 71,052 656,419
Total
Executive remuneration
2017 3,163,055 924,653 80,331 11,863 4,179,902 1,126,324 428,786 624,232 1,053,018 6,359,244
2016 2,655,834 1,910,000 80,958 55,227 4,702,019 106,866 207,000 744,925 951,925 5,760,810
1 Short-Term FAR is the total cash cost of salary, exclusive of superannuation.2 Short-term incentive payments reflect the cash value paid for the years ended 31 December 2017 and 31 December 2016.3 Non-monetary benefits represent accrued long service leave and value of the car park and a travel entitlement for Mr Ferraro.4 Other short-term benefits include personal financial advice allowance and travel allowance.
5 Superannuation contributions reflect the SGC payment and termination (payment in lieu) payment for the previous CEO.6 In 2017, Mr Ferraro was granted a conditional rights share based payment that is amortised over 12 month (conditional) period. In 2017, Mr Ferraro received
122,164 conditional rights calculated by dividing the aggregate grant value of $233,333 (pro-rated for his $400,000 full entitlement) by an independently determined Volume Weighted Average Price (VWAP) of $1.91 per right. The grant date was 9 June 2017 with release date of 8 June 2020. The rights vest immediately after the 12 month (conditional) period and only then is Mr Ferraro entitled to any benefits or entitlements attaching to the shares. While Mr Ferraro is employed by the Company, and unless the Board otherwise determines, he may not dispose of or otherwise deal or purport to deal with any shares transferred to him upon vesting of the award, until (and including) the release date. In 2017, FAR for Mr Wasow included a conditional rights share based payment that is amortised over a 12 month (conditional) period. In 2017, Mr Wasow received 116,580 conditional rights calculated by dividing the aggregate grant value of $212,175 by an independently determined VWAP of $1.82 per right. The grant date was 9 January 2017 with a vesting date of 9 July 2017. The 2017 rights vest immediately after the 6 month (conditional) period and only then is Mr Wasow entitled to any benefits or entitlements attaching to the shares. In 2016, Mr Wasow was the recipient of 177,988 share rights at a VWAP of $1.163. The grant date was on 7 January 2016 with share rights vesting on 7 July 2017. In 2016, Mr Foster elected to increase his superannuation contribution (reflected in the superannuation column) which caused a reduction in his recorded 2016 FAR by the same amount.
7 In accordance with AASB 2, the value attributed to Performance Rights represents the amortisation for the reporting period of the value at grant date of all previously granted Performance Rights that have neither vested nor lapsed. The value at grant date is amortised over a three year period.
For
per
sona
l use
onl
y
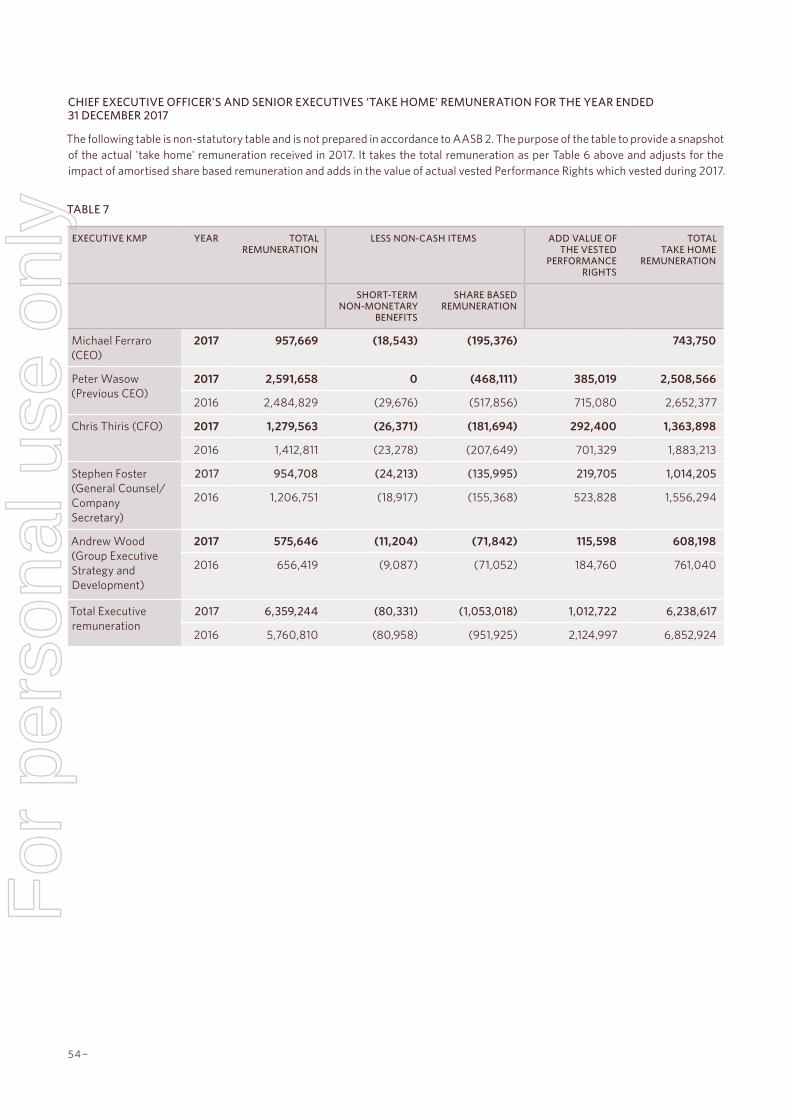
54¬
CHIEF EXECUTIVE OFFICER’S AND SENIOR EXECUTIVES ‘TAKE HOME’ REMUNERATION FOR THE YEAR ENDED 31 DECEMBER 2017
The following table is non-statutory table and is not prepared in accordance to AASB 2. The purpose of the table to provide a snapshot of the actual 'take home' remuneration received in 2017. It takes the total remuneration as per Table 6 above and adjusts for the impact of amortised share based remuneration and adds in the value of actual vested Performance Rights which vested during 2017.
TABLE 7
EXECUTIVE KMP YEAR TOTAL REMUNERATION
LESS NON-CASH ITEMS ADD VALUE OF THE VESTED
PERFORMANCE RIGHTS
TOTAL TAKE HOME
REMUNERATION
SHORT-TERM NON-MONETARY
BENEFITS
SHARE BASED REMUNERATION
Michael Ferraro (CEO)
2017 957,669 (18,543) (195,376) 743,750
Peter Wasow (Previous CEO)
2017 2,591,658 0 (468,111) 385,019 2,508,566
2016 2,484,829 (29,676) (517,856) 715,080 2,652,377
Chris Thiris (CFO) 2017 1,279,563 (26,371) (181,694) 292,400 1,363,898
2016 1,412,811 (23,278) (207,649) 701,329 1,883,213
Stephen Foster (General Counsel/Company Secretary)
2017 954,708 (24,213) (135,995) 219,705 1,014,205
2016 1,206,751 (18,917) (155,368) 523,828 1,556,294
Andrew Wood (Group Executive Strategy and Development)
2017 575,646 (11,204) (71,842) 115,598 608,198
2016 656,419 (9,087) (71,052) 184,760 761,040
Total Executive remuneration
2017 6,359,244 (80,331) (1,053,018) 1,012,722 6,238,617
2016 5,760,810 (80,958) (951,925) 2,124,997 6,852,924
For
per
sona
l use
onl
y

¬55 Alumina Limited Annual Report 2017
For
per
sona
l use
onl
y

¬57 56¬ Alumina Limited Annual Report 2017
1 For Performance Rights granted on 20 January 2017, Performance Rights vest on satisfaction of the performance criteria on 6 December 2019. The eligible participant then enters an exercise period that concludes at 5:00pm (Melbourne time) on the date that is seven years after vesting. Vested ESP entitlements that are not exercised by the end of the Exercise Period will lapse (and consequently no Shares will be allocated, and no Cash Settlement Amounts will be paid, in respect of those vested ESP entitlements). However, if any of an eligible participants vested ESP entitlements would otherwise lapse at the end of the Exercise Period because of this rule, and they have not previously notified Alumina Limited that they do not wish those vested ESP entitlements to be exercised, then they will be deemed to be exercised by the eligible participant. For Performance Rights granted on 19 February 2016, if at the end date for testing on 7 December 2018, less than 100 percent of the ESP entitlements vest on the basis of the performance tests, those that do not vest will lapse.
2 Includes the number of Performance Rights granted that were subject to testing in 2017.3 Performance Rights granted on 20 January 2017 (2016: 19 February 2016) for the three year performance test period concluding 6 December 2019 (2016: 7 December
2018). The value of 2017 Performance Right at grant date was $1.03 (2016: $0.79).Value per Performance Right is independently calculated by Mercer Consulting (Australia) using the assumptions underlying the Black-Scholes methodology to produce a Monte Carlo simulation model which allows the incorporation of the hurdles that must be met before the Performance Rights vest.
The terms and conditions of each grant of Performance Rights affecting remuneration in the previous, current or future reporting periods are as follows:
TABLE 8 – PERFORMANCE RIGHTS GRANTED AS REMUNERATION FOR THE YEARS ENDED 31 DECEMBER 2017 AND 31 DECEMBER 2016
YEAR1 NUMBER OF PERFORMANCE
RIGHTS AS AT 1 JANUARY2
NUMBER GRANTED DURING THE YEAR
AS REMUNERATION3
VALUE OF PERFORMANCE
RIGHTS AT GRANT DATE4
NUMBER VESTED DURING
YEAR5
VALUE VESTED DURING
YEAR6
NUMBER LAPSED
DURING YEAR7
VALUE LAPSED
DURING YEAR
VALUE AS PROPORTION OF
REMUNERATION %8
NUMBER OF PERFORMANCE
RIGHTS AS AT 31 DECEMBER9
MINIMUM VALUE OF GRANTS YET
TO VEST
MAXIMUM VALUE OF GRANTS
YET TO VEST10
CEO
Michael Ferraro 2017 - 141,900 $262,515 - - - - 27.41% 141,900 - $262,500
Previous CEO
Peter Wasow 2017 599,900 251,700 $259,251 (159,759) $385,019 (441,873) ($425,033) 8.46% 249,968 - $210,537
2016 647,900 356,000 $281,240 (404,000) $715,080 - - 40.10% 599,900 - $556,847
Senior Executives
Chris Thiris 2017 400,700 168,100 $173,143 (121,328) $292,400 (41,572) ($46,976) 32.71% 405,900 - $361,005
2016 581,076 237,800 $187,862 (418,176) $701,329 - - 62.94% 400,700 - $371,939
Stephen Foster 2017 300,000 125,600 $129,368 (91,164) $219,705 (31,236) ($35,297) 32.87% 303,200 - $269,672
2016 434,737 177,600 $140,304 (312,337) $523,828 - - 55.03% 300,000 - $278,616
Andrew Wood 2017 158,400 66,500 $68,495 (47,966) $115,598 (16,434) ($18,570) 28.75% 160,500 - $142,755
2016 174,566 94,000 $74,260 (110,166) $184,760 - - 39.46% 158,400 - $147,032
TABLE 8.1 CONDITIONAL RIGHTS GRANTED TO THE CEO FOR THE YEARS ENDED 31 DECEMBER 2017 AND 31 DECEMBER 2016
YEAR NUMBER OF CONDITIONAL RIGHTS
AS AT 1 JANUARY
NUMBER GRANTED DURING THE YEAR AS
REMUNERATION1
VALUE OF CONDITIONAL RIGHTS
AT GRANT DATE2
NUMBER VESTED DURING YEAR3
VALUE VESTED DURING YEAR4
NUMBER LAPSED DURING YEAR5
VALUE LAPSED DURING YEAR6
VALUE AS PROPORTION OF
REMUNERATION %7
NUMBER OF CONDITIONAL RIGHTS
AS AT 31 DECEMBER8
MAXIMUM VALUE OF GRANTS YET
TO VEST9
CEO
Michael Ferraro 2017 - 122,164 $233,333 - - - - 24.36% 122,164 -
Previous CEO
Peter Wasow 2017 177,988 116,580 $212,175 (294,568) $597,973 - - 31.26% - -
2016 114,930 177,988 $207,000 (114,930) $151,708 - - 14.44% 177,988 -
1 Mr Ferraro receives annually, Conditional Rights, an equity based component of his remuneration. In 2017 the number of Conditional Rights was equal to the value of $400,000 which was pro-rated and equated to $233,333. The number of Conditional Rights was determined by an independently calculated Volume Weighted Average Price (VWAP) which for 2017 was $1.91 (122,164 shares). The previous CEO, Mr Wasow, received annually, Conditional Rights as an equity component of his FAR. In 2017 the number of Conditional Rights was equal to the set value of $212,175 divided by an independently determined VWAP which, for 2017 was $1.82 (116,580 shares).
2 Mr Wasow's FAR increased in 2017 therefore the total value of the initial grant of Conditional Rights was $212,175.3 The number of Conditional Rights vested is the number granted in the prior year following the completion of the service conditions.4 Value vested is equal to the number of Conditional Rights that have satisfied the service condition multiplied by the share price at the time of vesting. In 2017 it was
294,568 Conditional Rights by the share price of $2.03 on 7 July 2017 (2016: 114,930 Conditional Rights by the share price of $1.32 on 16 September 2016).
For
per
sona
l use
onl
y
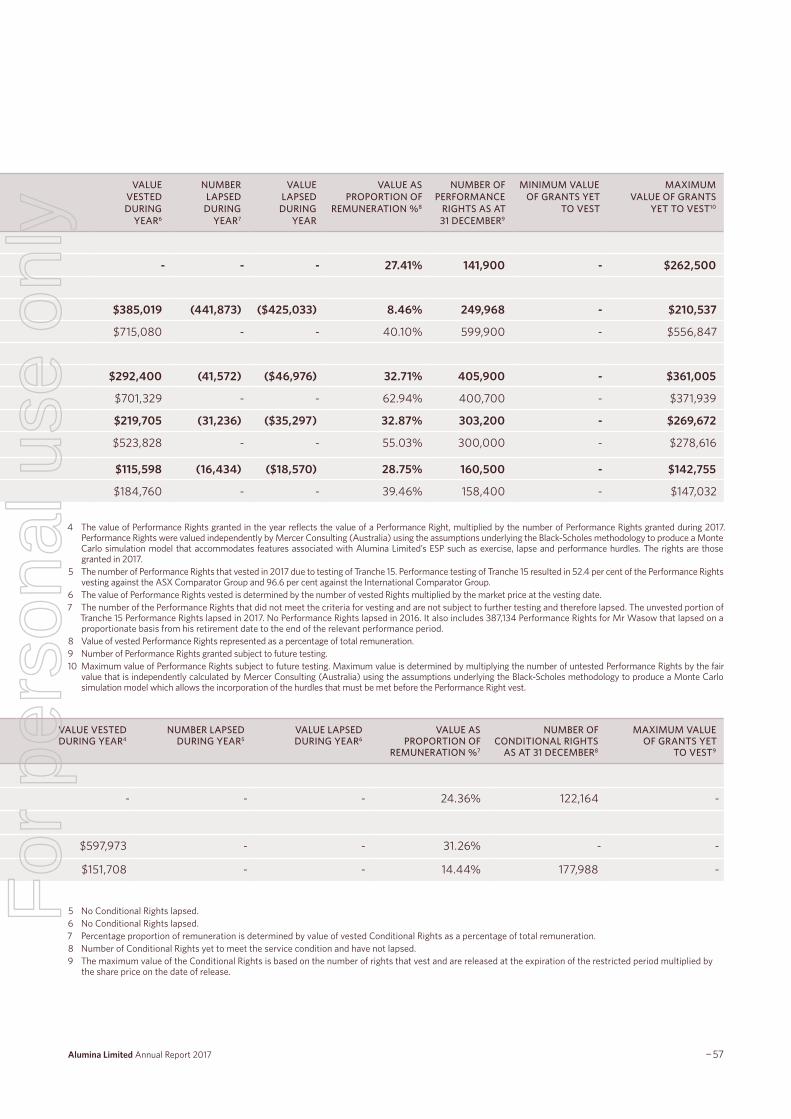
¬57 56¬ Alumina Limited Annual Report 2017
The terms and conditions of each grant of Performance Rights affecting remuneration in the previous, current or future reporting periods are as follows:
TABLE 8 – PERFORMANCE RIGHTS GRANTED AS REMUNERATION FOR THE YEARS ENDED 31 DECEMBER 2017 AND 31 DECEMBER 2016
YEAR1 NUMBER OF PERFORMANCE
RIGHTS AS AT 1 JANUARY2
NUMBER GRANTED DURING THE YEAR
AS REMUNERATION3
VALUE OF PERFORMANCE
RIGHTS AT GRANT DATE4
NUMBER VESTED DURING
YEAR5
VALUE VESTED DURING
YEAR6
NUMBER LAPSED
DURING YEAR7
VALUE LAPSED
DURING YEAR
VALUE AS PROPORTION OF
REMUNERATION %8
NUMBER OF PERFORMANCE
RIGHTS AS AT 31 DECEMBER9
MINIMUM VALUE OF GRANTS YET
TO VEST
MAXIMUM VALUE OF GRANTS
YET TO VEST10
CEO
Michael Ferraro 2017 - 141,900 $262,515 - - - - 27.41% 141,900 - $262,500
Previous CEO
Peter Wasow 2017 599,900 251,700 $259,251 (159,759) $385,019 (441,873) ($425,033) 8.46% 249,968 - $210,537
2016 647,900 356,000 $281,240 (404,000) $715,080 - - 40.10% 599,900 - $556,847
Senior Executives
Chris Thiris 2017 400,700 168,100 $173,143 (121,328) $292,400 (41,572) ($46,976) 32.71% 405,900 - $361,005
2016 581,076 237,800 $187,862 (418,176) $701,329 - - 62.94% 400,700 - $371,939
Stephen Foster 2017 300,000 125,600 $129,368 (91,164) $219,705 (31,236) ($35,297) 32.87% 303,200 - $269,672
2016 434,737 177,600 $140,304 (312,337) $523,828 - - 55.03% 300,000 - $278,616
Andrew Wood 2017 158,400 66,500 $68,495 (47,966) $115,598 (16,434) ($18,570) 28.75% 160,500 - $142,755
2016 174,566 94,000 $74,260 (110,166) $184,760 - - 39.46% 158,400 - $147,032
4 The value of Performance Rights granted in the year reflects the value of a Performance Right, multiplied by the number of Performance Rights granted during 2017. Performance Rights were valued independently by Mercer Consulting (Australia) using the assumptions underlying the Black-Scholes methodology to produce a Monte Carlo simulation model that accommodates features associated with Alumina Limited’s ESP such as exercise, lapse and performance hurdles. The rights are those granted in 2017.
5 The number of Performance Rights that vested in 2017 due to testing of Tranche 15. Performance testing of Tranche 15 resulted in 52.4 per cent of the Performance Rights vesting against the ASX Comparator Group and 96.6 per cent against the International Comparator Group.
6 The value of Performance Rights vested is determined by the number of vested Rights multiplied by the market price at the vesting date. 7 The number of the Performance Rights that did not meet the criteria for vesting and are not subject to further testing and therefore lapsed. The unvested portion of
Tranche 15 Performance Rights lapsed in 2017. No Performance Rights lapsed in 2016. It also includes 387,134 Performance Rights for Mr Wasow that lapsed on a proportionate basis from his retirement date to the end of the relevant performance period.
8 Value of vested Performance Rights represented as a percentage of total remuneration.9 Number of Performance Rights granted subject to future testing.10 Maximum value of Performance Rights subject to future testing. Maximum value is determined by multiplying the number of untested Performance Rights by the fair
value that is independently calculated by Mercer Consulting (Australia) using the assumptions underlying the Black-Scholes methodology to produce a Monte Carlo simulation model which allows the incorporation of the hurdles that must be met before the Performance Right vest.
TABLE 8.1 CONDITIONAL RIGHTS GRANTED TO THE CEO FOR THE YEARS ENDED 31 DECEMBER 2017 AND 31 DECEMBER 2016
YEAR NUMBER OF CONDITIONAL RIGHTS
AS AT 1 JANUARY
NUMBER GRANTED DURING THE YEAR AS
REMUNERATION1
VALUE OF CONDITIONAL RIGHTS
AT GRANT DATE2
NUMBER VESTED DURING YEAR3
VALUE VESTED DURING YEAR4
NUMBER LAPSED DURING YEAR5
VALUE LAPSED DURING YEAR6
VALUE AS PROPORTION OF
REMUNERATION %7
NUMBER OF CONDITIONAL RIGHTS
AS AT 31 DECEMBER8
MAXIMUM VALUE OF GRANTS YET
TO VEST9
CEO
Michael Ferraro 2017 - 122,164 $233,333 - - - - 24.36% 122,164 -
Previous CEO
Peter Wasow 2017 177,988 116,580 $212,175 (294,568) $597,973 - - 31.26% - -
2016 114,930 177,988 $207,000 (114,930) $151,708 - - 14.44% 177,988 -
5 No Conditional Rights lapsed.6 No Conditional Rights lapsed.7 Percentage proportion of remuneration is determined by value of vested Conditional Rights as a percentage of total remuneration.8 Number of Conditional Rights yet to meet the service condition and have not lapsed.9 The maximum value of the Conditional Rights is based on the number of rights that vest and are released at the expiration of the restricted period multiplied by
the share price on the date of release.
For
per
sona
l use
onl
y

58¬
SENIOR EXECUTIVE SHAREHOLDING
TABLE 9 – SENIOR EXECUTIVE SHAREHOLDINGS FOR THE YEARS ENDED 31 DECEMBER 2017 AND 31 DECEMBER 2016
BALANCE OF SHARES AS AT 1
JANUARY1
SHARES ACQUIRED DURING THE YEAR UNDER EMPLOYEE
SHARE PLAN2
OTHER SHARES ACQUIRED DURING THE YEAR
SHARES SOLD DURING THE YEAR
BALANCE OF SHARES
HELD AT 31 DECEMBER
Michael Ferraro3 2017 68,000 – – – 68,000
Peter Wasow 2017 455,838 159,759 294,568 (910,165) –
2016 214,908 404,000 114,930 (278,000) 455,838
Chris Thiris 2017 814,000 121,328 38,100 (73,428) 900,000
2016 263,224 418,176 132,600 – 814,000
Stephen Foster 2017 739,717 91,164 28,867 (94,000) 765,748
2016 511,842 312,337 125,538 (210,000) 739,717
Andrew Wood 2017 150,000 47,966 – – 197,966
2016 111,010 110,166 – (71,176) 150,000
1 Balance of shares held at 1 January and 31 December of the respective years include directly held, and nominally held shares, and shares held by personally related entities.
2 Includes vested 2015 Performance Rights that were tested in December 2017.3 Mr Ferraro was appointed Chief Executive Officer on the 1 June 2017. Prior to this he was a Non-Executive Director. His shareholdings in 2016 are disclosed in Table 11.
For
per
sona
l use
onl
y

¬59 Alumina Limited Annual Report 2017
2.3.1 EXECUTIVES’ SERVICE AGREEMENTS
Remuneration and other terms of employment for executives are formalised in service agreements.
Major provisions of the agreements relating to remuneration are set out below.
Termination benefits are within the limits set by the Corporations Act 2001 (Cth) such that they do not require shareholder approval.
TERM OF AGREEMENT AND NOTICE PERIOD
TERMINATION PAYMENTS1
Mike Ferraro
No fixed term
12 month written notice from either party. Mr Ferraro’s employment may be terminated immediately for any conduct that would justify summary dismissal.
• Alumina Limited may, at its discretion, make a payment in lieu of some or all of the notice period.
• Any payment to be made to Mr Ferraro in lieu of notice shall be calculated based on his Fixed Annual Reward. He would also receive any statutory entitlements.
• Number of shares equal to the granted conditional rights that would have vested during notice period.
• In addition to the above, Mr Ferraro may terminate his employment by giving notice to Alumina Limited (effectively immediately or up to six months later) in the event of a Significant Change. In that case Mr Ferraro will be entitled to receive a payment equal to 12 months’ Fixed Annual Reward less the amount received during any period of notice served. He will also be entitled to payment in lieu of accrued annual and long service leave entitlements.
Chris Thiris and Stephen Foster
No fixed term
Six month notice from the Company, three month notice from Mr Thiris and Mr Foster
• An additional payment which is the greater of:
– A payment equivalent to six months Base Remuneration; or
– A payment comprising:
– Notice payment (the greater of 12 weeks or notice provided within employment contract).
– severance payment of 2.5 weeks per complete year of service, pro-rated for completed months of service; and
– nine weeks ex gratia payment.
Andrew Wood
No fixed term
Four month notice from the Company, two month notice from Mr Wood
• An additional payment which is the greater of:
– A payment equivalent to six months Base Remuneration; or
– A payment comprising:
– Notice payment (the greater of 12 weeks or notice provided within employment contract).
– severance payment of 2.5 weeks per complete year of service, pro-rated
– for completed months of service; and
– six weeks ex gratia payment
1 Payable upon termination with notice and without the cause (eg for reasons other than unsatisfactory performance) and suitable alternative employment is not offered or if they do not accept other employment or in the event of a significant change (which is defined to be if Alumina Limited ceases to be listed on the ASX or if there is a significant change to the executives status and/or responsibilities that is detrimental to the executive). Calculated according to the “Base Remuneration”, which is defined as FAR for Mr Ferraro; and FAR + STI at target for Mr Thiris, Mr Foster and Mr Wood. The above termination entitlements are subject to any restrictions imposed by the Corporations Act.
2 If Mr Ferraro’s employment ceases within 3 years from the grant date of any conditional rights that have been granted to him in accordance with the annual grant of conditional rights, and the Board determines that his status is not that of a good leaver, the Board may decide that shares received in respect of relevant conditional rights and all outstanding conditional rights are subject to immediate forfeiture. The treatment of any unvested Performance Rights upon termination of employment will be determined in accordance with the LTI Plan and the relevant terms of grant. Upon the occurrence of a change in control event all unvested Performance Rights shall immediately vest. Similarly any restricted Annual Grant of Share Rights will be freed from holding locks.F
or p
erso
nal u
se o
nly

¬61 60¬ Alumina Limited Annual Report 2017
3. NON-EXECUTIVE DIRECTORS REMUNERATION
The maximum remuneration for Non-Executive Directors is determined by resolution of shareholders. At the 2016 AGM, shareholders approved a maximum aggregate remuneration of $1,500,000 per annum for Non-Executive Directors. A total of $1,117,670 was paid in Non-Executive Director fees in 2017.
As foreshadowed in the 2016 Remuneration Report, an independent review of Non-Executive Director fees, relevant to the market, was undertaken. Also, the workload of Board Committees had increased over a period of years, especially for the Chairman and Chair of the Committees. The review identified that the Chairman’s and Committee Chair’s remuneration had lagged compared to the market. The outcome of the review was considered in light of Non-Executive Director’s base fees remaining
unchanged from the fee level set in 2011 and no recent changes to the Chairman and Committee Chair fees. The Board determined that in the context of business conditions that there would be no increase to the base fee for the 2017 year (except for a nine per cent increase to the Chairman’s base fee). However, the fee for Chair of the Audit and Risk Management and Compensation committees were increased from $15,000 to $30,000 per annum to reflect changes in market practice, align with the workload of those roles and ensure Alumina Limited remained competitive to the market to attract and retain high calibre Non-Executive Directors.
In addition to the base fee, Non-Executive Directors receive fees for participation on the Board Committees and Superannuation Guarantee Contributions.
Committee Member $10,000 (aggregate)
Compensation Committee Chair $30,000
Audit & Risk Committee Chair $30,000
Nomination Committee Chair $10,000
Non-Executive Directors participation on Board Committees is set out on page 17. Non-Executive Directors do not receive any other retirement benefits or performance based incentives, rights or options.
3.1 REMUNERATION OUTCOMES
Non-Executive Directors’ remuneration details are set out below in Table 10.
TABLE 10
SHORT-TERM BENEFITS POST EMPLOYMENT TOTAL REMUNERATION
FEES – CASH NON-MONETARY BENEFITS
SUPERANNUATION GUARANTEE1
John Pizzey 2017 390,168 – 19,832 410,000
2016 357,008 – 19,462 376,470
Emma Stein 2017 189,953 – 18,055 208,008
2016 174,193 – 16,557 190,750
Chen Zeng 2017 159,262 – 15,138 174,400
2016 159,262 – 15,138 174,400
Peter Day 2017 184,147 – 17,503 201,650
2016 174,193 – 16,557 190,750
Mike Ferraro2 2017 70,507 – 6,702 77,209
2016 169,216 – 16,084 185,300
Deborah O'Toole3 2017 13,333 – 1,267 14,600
Total 2017 1,007,370 – 78,497 1,085,867
2016 1,033,872 – 83,798 1,117,670
1 Non-Executive Directors receive, in addition to their fees, a SGC. The applicable rate for 2017 and 2016 was 9.5 per cent. Non-Executive Directors do not receive any other retirement benefits.
2 Mr Ferraro resigned as a Non-Executive Director on the 31 May 2017 and was appointed to the position of Chief Executive Officer and Managing Director on 1 June 2017. His remuneration following his appointment is shown in Table 6.
3 Ms O'Toole was appointed a Non-Executive Director on 1 December 2017.
For
per
sona
l use
onl
y

¬61 60¬ Alumina Limited Annual Report 2017
3.2 NON–EXECUTIVE DIRECTOR SHARE HOLDINGS
Each Non-Executive Director is required to hold shares in the Company having a value at least equal to 50 per cent of their annual fees at the expiry of five years from appointment as a director. The requirement is satisfied when shares are acquired or by the expiry of the five year term.
TABLE 11 NON–EXECUTIVE DIRECTOR SHAREHOLDINGS FOR THE YEARS ENDED 31 DECEMBER 2017 AND 31 DECEMBER 2016
BALANCE OF SHARES AS AT 1 JANUARY1
OTHER SHARES ACQUIRED DURING
THE YEAR
BALANCE OF SHARES HELD AT 31 DECEMBER
John Pizzey 2017 82,111 8,500 90,611
2016 82,111 – 82,111
Emma Stein 2017 75,808 8,986 84,794
2016 75,808 – 75,808
Chen Zeng2 2017 4,804 – 4,804
2016 4,804 – 4,804
Peter Day 2017 75,720 – 75,720
2016 75,720 – 75,720
Mike Ferraro3 2016 25,000 43,0004 68,000
Deborah O'Toole5 2017 – – –
1 Balance of shares held at 1 January and 31 December of the respective years include directly held shares, nominally held shares, and shares held by personally related entities.
2 Mr Zeng is a nominee of CITIC and CITIC holds 548,959,208 ordinary fully paid shares in Alumina Limited.3 Mr Ferraro resigned as a Non-Executive Director on the 31 May 2017 and was appointed to the position of Chief Executive Officer and Managing Director
on 1 June 2017. His shareholdings for 2017 are shown in Table 9.4 Mr Ferraro purchased 43,000 shares indirectly via the trustee company of the Ferraro Super Fund, of which Mr Ferraro is a beneficiary.5 Ms O'Toole was appointed a Non-Executive Director on 1 December 2017.
This report is made in accordance with a resolution of the Directors.
GJ Pizzey Chairman —
22 March 2018
For
per
sona
l use
onl
y

¬63 62¬ Alumina Limited Annual Report 2017
Key Numbers
7. Expenses
8. Income Tax Expense
9. Equity
10. Cash Flow Information
Other Information
11. Related Party Transactions
12. Share-Based Payments
13. Remuneration Of Auditors
14. Commitments And Contingencies
15. Events Occurring After The Reporting Period
16. Parent Entity Financial Information
17. Deed Of Cross Guarantee
18. New Accounting Standards And Interpretations
Not Yet Adopted
SIGNED REPORTS
Directors’ Declaration
Independent Auditor’s Review Report
to the Members of Alumina Limited
CONTENTS
CONSOLIDATED FINANCIAL STATEMENTS
Consolidated Statement of Profit or Loss
and Other Comprehensive Income
Consolidated Balance Sheet
Consolidated Statement of Changes in Equity
Consolidated Statement of Cash Flows
NOTES TO THE CONSOLIDATED FINANCIAL STATEMENTS FOR THE YEAR ENDED 31 DECEMBER 2017
About This Report
Group structure and AWAC performance
1. Segment Information
2. Investments In Associates
3. Investments In Controlled Entities
Financial and Capital Risk
4. Financial Assets And Liabilities
5. Financial Risk Management
6. Capital Management
63
64
65
66
67
68
68
69
72
73
75
79
80
81
83
84
86
86
87
88
88
88
89
91
91
92
The financial report covers the consolidated entity consisting of Alumina Limited (the Company or parent entity) and its subsidiaries (together the Group). The financial report is presented in US dollars.
Financial Report
Alumina Limited is a Company limited by shares, incorporated and domiciled in Australia. Its registered office and principal place of business is: Alumina Limited, Level 12, IBM Centre, 60 City Road, Southbank Victoria 3006.
A description of the nature of the consolidated entity’s operations and its principal activities is included in the operating and financial review on pages 20–35 of the annual report. The operating and financial review is not part of this financial report.
The financial report was authorised for issue by the Directors on 22 March 2018.
Through the use of the internet, we have ensured that our corporate reporting is timely and complete. All press releases, financial reports and other information are available at our Investor Centre on our website: www.aluminalimited.com.
For
per
sona
l use
onl
y

¬63 62¬ Alumina Limited Annual Report 2017
CONSOLIDATED STATEMENT OF PROFIT OR LOSS AND OTHER COMPREHENSIVE INCOME
NOTES US$ MILLION
2017 2016
Revenue from continuing operations 0.6 0.6
Share of net profit of associates accounted for using the equity method 2(c) 360.4 18.1
General and administrative expenses 7(a) (13.6) (25.7)
Change in fair value of derivatives/foreign exchange losses 0.7 (14.1)
Finance costs 7(b) (8.3) (9.1)
Profit/(loss) before income tax 339.8 (30.2)
Income tax expense 8 – –
Profit/(loss) for the year attributable to the owners of Alumina Limited 339.8 (30.2)
Other comprehensive income/(loss) Items that may be reclassified to profit or loss
Share of reserve movements accounted for using the equity method 2.9 4.4
Foreign exchange translation difference 9(b) 88.0 178.5
Items that will not be reclassified to profit or loss
Re-measurements of retirement benefit obligations accounted for using the equity method 7.8 7.5
Other comprehensive income for the year, net of tax 98.7 190.4
Total comprehensive income for the year attributable to the owners of Alumina Limited
438.5 160.2
Earnings per share for profit/(loss) from continuing operations attributable to the ordinary equity holders of the Company:
Basic earnings per share 9(a) 11.8¢ (1.0¢)
Diluted earnings per share 9(a) 11.8¢ (1.0¢)
The above consolidated statement of profit or loss and other comprehensive income should be read in conjunction with the accompanying notes.
Alumina Limited Year Ended 31 December 2017F
or p
erso
nal u
se o
nly

¬65 64¬ Alumina Limited Annual Report 2017
CONSOLIDATED BALANCE SHEET
NOTES US$ MILLION
2017 2016
CURRENT ASSETS
Cash and cash equivalents 4(a) 40.0 8.6
Receivables – 0.1
Other assets 1.8 3.0
Total current assets 41.8 11.7
NON-CURRENT ASSETS
Investment in associates 2(c) 2,301.0 2,106.0
Property, plant and equipment 0.1 0.1
Total non-current assets 2,301.1 2,106.1
TOTAL ASSETS 2,342.9 2,117.8
CURRENT LIABILITIES
Payables 1.3 1.3
Provisions 0.3 0.3
Other liabilities 0.1 0.1
Total current liabilities 1.7 1.7
NON-CURRENT LIABILITIES
Borrowings 4(b) 98.4 92.4
Derivative financial instruments 4(c) 8.3 16.2
Provisions 0.5 0.6
Total non-current liabilities 107.2 109.2
TOTAL LIABILITIES 108.9 110.9
NET ASSETS 2,234.0 2,006.9
EQUITY
Contributed equity 9(a) 2,682.9 2,682.9
Treasury shares 9(a) (0.9) –
Reserves (1,034.7) (1,125.3)
Retained earnings 586.7 449.3
TOTAL EQUITY 2,234.0 2,006.9
The above consolidated balance sheet should be read in conjunction with the accompanying notes.For
per
sona
l use
onl
y

¬65 64¬ Alumina Limited Annual Report 2017
CONSOLIDATED STATEMENT OF CHANGES IN EQUITY
NOTES US$ MILLION
CONTRIBUTED EQUITY1 RESERVES RETAINED
EARNINGS TOTAL
Balance as at 1 January 2016 2,681.5 (1,305.9) 607.3 1,982.9
Loss for the year – – (30.2) (30.2)
Other comprehensive income/(loss) for the year – 182.9 7.5 190.4
Transactions with owners in their capacity as owners:
Dividends paid – – (135.3) (135.3)
Movement in treasury shares 9(a) 1.4 – – 1.4
Movement in share based payments reserve – (2.3) – (2.3)
Balance as at 31 December 2016 2,682.9 (1,125.3) 449.3 2,006.9
Balance as at 1 January 2017 2,682.9 (1,125.3) 449.3 2,006.9
Profit for the year – – 339.8 339.8
Other comprehensive income for the year – 90.9 7.8 98.7
Transactions with owners in their capacity as owners:
Dividends paid – – (210.2) (210.2)
Movement in treasury shares 9(a) (0.9) – – (0.9)
Movement in share based payments reserve – (0.3) – (0.3)
Balance as at 31 December 2017 2,682.0 (1,034.7) 586.7 2,234.0
1 Treasury shares have been deducted from contributed equity.The above consolidated statement of changes in equity should be read in conjunction with the accompanying notes.
Alumina Limited Year Ended 31 December 2017F
or p
erso
nal u
se o
nly

CONSOLIDATED STATEMENT OF CASH FLOWS
NOTES US$ MILLION
2017 2016
Cash flows from operating activities
Payments to suppliers and employees (inclusive of goods and services tax) (12.1) (26.3)
GST refund received 0.5 0.9
Dividends received from associates 278.1 150.2
Distributions received from associates 1.2 0.7
Finance costs paid (9.8) (7.2)
Interest paid under cross currency interest rate swap (5.4) (3.5)
Interest received under cross currency interest rate swap 6.6 5.0
Other 0.4 0.2
Net cash inflow from operating activities 10(a) 259.5 120.0
Cash flows from investing activities
Payments for investments in associates (80.0) (48.0)
Proceeds from return of invested capital 63.8 81.9
Net cash (outflow)/inflow from investing activities 2(c) (16.2) 33.9
Cash flows from financing activities
Proceeds from borrowings 105.0 30.0
Repayment of borrowings (105.0) (50.0)
Payments for shares acquired by the Alumina Employee Share Plan (2.0) (1.6)
Dividends paid (210.2) (135.3)
Net cash outflow from financing activities (212.2) (156.9)
Net increase/(decrease) in cash and cash equivalents 31.1 (3.0)
Cash and cash equivalents at the beginning of the financial year 8.6 9.3
Effects of exchange rate changes on cash and cash equivalents 0.3 2.3
Cash and cash equivalents at the end of the financial year 4(a) 40.0 8.6
The above consolidated statement of cash flows should be read in conjunction with the accompanying notes.
¬67 66¬ Alumina Limited Annual Report 2017
For
per
sona
l use
onl
y

ABOUT THIS REPORT
Alumina Limited is a for profit company limited by shares incorporated and domiciled in Australia whose shares are publicly traded on the Australian Securities Exchange. The consolidated financial report of the Group for the year ended 31 December 2017 was authorised for issue in accordance with a resolution of the Directors on 22 March 2018.
The consolidated financial report is a general purpose financial report which:
• incorporates assets, liabilities and results of operations of all Alumina Limited’s subsidiaries and equity accounts its associates. For the list of the Company’s associates and subsidiaries refer Notes 2(a) and 3 respectively.
• has been prepared in accordance with the requirements of the Corporations Act 2001, Australian Accounting Standards (AAS) and Interpretations issued by the Australian Accounting Standards Board (AASB). Alumina Limited is a for profit entity for the purpose of preparing the financial statements.
• complies with International Financial Reporting Standards (IFRS) as issued by the International Accounting Standards Board.
• has been prepared under historical cost convention, as modified by the revaluation of certain financial assets and liabilities (including derivative instruments) at fair value through profit or loss.
• the Company is of a kind referred to in the Australian Securities and Investments Commission Corporations Instrument 2016/191, relating to the “rounding off” of amounts in the financial report. Amounts in the financial report have been rounded off in accordance with that Legislative Instrument to the nearest hundred thousand dollars, and presented in US dollars, except where otherwise required.
• adopts all new and amended Accounting Standards and Interpretations issued by the AASB that are effective for the annual reporting beginning 1 January 2017.
• does not early adopt Accounting Standards and Interpretations that have been issued or amended but are not yet effective.
• presents reclassified comparative information where required for consistency with the current year’s presentation.
THE NOTES TO THE FINANCIAL STATEMENTS
The notes include information, which is required to understand the financial statements and is material and relevant to the operations, financial position and performance of the Group. Information is considered material and relevant if, for example:
• the amount in question is significant because of its size or nature.
• it is important for the understanding of the results of the Group.
• it relates to an aspect of the Group’s operations that is important to its future performance.
The notes are organised into the following sections:
• Group structure and AWAC performance: explains the group structure and information about AWAC’s financial position and performance and its impact on the Group.
• Financial and capital risk: provides information about the Group’s financial assets and liabilities and discusses the Group’s exposure to various financial risks and explains how these affect the Group’s financial position and performance and what the Group does to manage these risks. It also describes capital management objectives and practices of the Group.
• Key numbers: provides a breakdown of individual line items in the financial statements that the Directors consider most relevant and summarises the accounting policies, judgements and estimates relevant to understanding these line items.
• Other Information: provides information on items, which require disclosure to comply with Australian Accounting Standards and other regulatory pronouncements. However, they are not considered critical in understanding the financial performance of the Group and are not immediately related to the individual line items in the financial statements.
ACCOUNTING POLICIES
Significant and other accounting policies that summarise the measurement basis used and are relevant to the understanding of the financial statements are provided throughout the notes to the financial statements.
NOTES TO THE CONSOLIDATED FINANCIAL STATEMENTS FOR THE YEAR ENDED 31 DECEMBER 2017
¬67 66¬ Alumina Limited Annual Report 2017
For
per
sona
l use
onl
y

¬69 68¬ Alumina Limited Annual Report 2017
YEAR ENDED 31 DECEMBER 2017 US$ MILLION
AUSTRALIA BRAZIL OTHER TOTAL
Investments in Associates 1,187.8 747.9 365.3 2,301.0
Assets 32.2 9.3 0.4 41.9
Liabilities (108.9) – – (108.9)
Consolidated net assets 1,111.1 757.2 365.7 2,234.0
YEAR ENDED 31 DECEMBER 2016 US$ MILLION
AUSTRALIA BRAZIL OTHER TOTAL
Investments in Associates 1,043.1 761.2 301.7 2,106.0
Assets 6.4 5.1 0.3 11.8
Liabilities (110.9) – – (110.9)
Consolidated net assets 938.6 766.3 302.0 2,006.9
GROUP STRUCTURE AND AWAC PERFORMANCE
1. SEGMENT INFORMATION
Alumina Limited’s sole business undertaking is in the global bauxite, alumina and aluminium industry, which it conducts primarily through bauxite mining and alumina refining. All of those business activities are conducted through its 40% investments in AWAC. Alumina Limited’s equity interest in AWAC form one reportable segment. A full description of Alumina Limited’s business model is included in the Operating and Financial Review on pages 20–35 of the annual report.
The equity interest in AWAC is represented by investments in a number of entities in different geographical locations.
ABOUT THIS REPORT (CONTINUED)
FOREIGN CURRENCY TRANSLATION
The consolidated financial statements are presented in US dollars, which is Alumina Limited’s presentation and functional currency.
Foreign currency transactions are translated into the functional currency using the exchange rates prevailing at the dates of these transactions. Foreign exchange gains and losses resulting from the settlement of such transactions and from the translation at year-end exchange rates of monetary assets and liabilities denominated in foreign currencies are recognised in the profit or loss, except when they are deferred in other equity as qualifying cash flow hedges and qualifying net investment hedges or are attributable to part of the net investment in a foreign operation.
The results and financial position of the Group entities and associates that have a functional currency different from the presentation currency are translated into the presentation currency as follows:
• assets and liabilities for each balance sheet presented are translated at the closing rate at the date of that balance sheet.
• income and expenses are translated at average exchange rates (unless this is not a reasonable approximation of the cumulative effect of the rates prevailing on the transaction dates, in which case income and expenses are translated at the dates of the transactions).
• all resulting exchange differences are recognised in other comprehensive income.
• on consolidation, exchange differences arising from the translation of any net investment in foreign entities, and of borrowings and other financial instruments designated as hedges of such investments, are recognised in other comprehensive income. When a foreign operation is sold, its proportionate share of such exchange differences are reclassified to the profit or loss, as part of the gain or loss on sale.
Notes to the consolidated financial statements for the year ended 31 December 2017
¬69 68¬ Alumina Limited Annual Report 2017
For
per
sona
l use
onl
y

Notes to the consolidated financial statements for the year ended 31 December 2017
¬69 68¬ Alumina Limited Annual Report 2017
NAME PRINCIPAL ACTIVITIES COUNTRY OF INCORPORATION
PERCENTAGE OWNERSHIP
2017 2016
Alcoa of Australia Limited Bauxite, alumina & aluminium production Australia 40 40
Alcoa World Alumina LLC Bauxite and alumina trading & production USA 40 40
Alumina Espanola S.A. Alumina production Spain 40 40
Alcoa World Alumina Brasil Ltda. Bauxite and alumina production Brazil 40 40
AWA Saudi Ltda. Bauxite and alumina production Hong Kong 40 40
Enterprise Partnership Finance lender Australia 40 40
The audited combined financial statements of the entities forming AWAC are prepared in accordance with Accounting Principles Generally Accepted in the United States of America (US GAAP). Alcoa of Australia Limited and Enterprise Partnership (AWAC entities) further issue audited financial statements prepared in accordance with the requirements of the Corporations Act 2001, Australian Accounting Standards and interpretations issued by Australian Accounting Standards Board.
For the remaining AWAC entities, adjustments are made to convert the accounting policies under US GAAP to Australian Accounting Standards. The principal adjustments are to the valuation of inventories from last-in-first-out basis to a basis equivalent to weighted average cost, to create an additional asset retirement obligation for dismantling, removal and restoration of certain refineries, differences in the recognition of actuarial gains and losses on certain defined pension plans and the reversal of certain fixed asset uplifts included in Alcoa World Alumina Brasil Ltda.
In arriving at the value of these GAAP adjustments, Management is required to use accounting estimates and exercise judgement in applying the Group’s accounting policies. The note below provides an overview of the areas that involved a higher degree of judgement or complexity.
(B) CRITICAL ACCOUNTING ESTIMATES AND JUDGEMENTS
Estimates and judgements are continually evaluated and are based on historical experience and other factors, including expectations of future events that may have a financial impact on the Group and that are believed to be reasonable under the circumstances. The resulting accounting estimates will by definition, seldom equal the related actual results. The estimates and judgements that have a significant risk of causing a material adjustment to the carrying amounts of assets and liabilities within the next financial year are disclosed below.
Retirement benefit obligations
The Group recognised a net liability for retirement benefit obligations under the defined benefit superannuation arrangements through
2. INVESTMENTS IN ASSOCIATES
(A) ALCOA WORLD ALUMINA AND CHEMICALS
Alumina Limited has an interest in the following entities forming AWAC:
its investment in AWAC. All plans are valued in accordance with AASB 119 Employee Benefits.
These valuations require actuarial assumptions to be made. All re-measurements are recognised in other comprehensive income.
Asset retirement obligations
The amount of asset retirement obligations recognised under US GAAP by AWAC is adjusted to be in compliance with AAS. This requires judgemental assumptions regarding the timing of reclamation activities, plant and site closure and discount rates to determine the present value of these cash flows.
Carrying value of investments in associates
The Group assesses at each reporting period whether there is objective evidence that the investment in associates is impaired by:
• Performing an impairment indicators' assessment to consider whether indicators of impairment exist;
• If indicators of impairment exist, calculating the value in use of the investment in AWAC using a discounted cash flow model (“DCF model”); and
• Comparing the resulting value to the book value.
The key assumptions used in the DCF model to estimate future cash flows are those relating to future alumina and aluminium prices, energy prices and exchange rates. Key assumptions are determined with reference to industry participants and brokers’ forecasts, commodity and currency forward curves and industry consultant views.
These cash flows are then discounted to net present value using the weighted average cost of capital (WACC) of 9.5%.
Furthermore, the following sensitivity analyses (stress testing) are performed over the value in use calculation:
• Commodities, including aluminium, alumina, caustic, coal, oil and gas price fluctuations (plus or minus 10%). AWAC’s future cash flows are most sensitive to alumina price fluctuations.
• Currency rate fluctuation (plus or minus 10%).
• Increased WACC.
¬69 68¬ Alumina Limited Annual Report 2017
For
per
sona
l use
onl
y

Notes to the consolidated financial statements for the year ended 31 December 2017
2. INVESTMENTS IN ASSOCIATES (CONTINUED)
As a final check, the book value of the investment in associates is compared to Alumina Limited’s market capitalisation and to major analysts’ valuations.
An impairment loss is recognised for the amount by which the asset’s carrying amount exceeds its recoverable amount. The recoverable amount is the higher of an asset’s fair value less costs to sell and value in use.
No indicators of impairment were identified and no impairment loss was recognised in the years ended 31 December 2017 and 31 December 2016.
(C) SUMMARISED FINANCIAL INFORMATION FOR AWAC
The information disclosed in the tables below reflects the amounts presented in the AWAC financial statements amended to reflect adjustments made by Alumina Limited when using the equity method, including adjustments for differences in accounting policies.
SUMMARISED BALANCE SHEET US$ MILLION
2017 2016
Current assets 1,798.8 1,180.4
Non-current assets 6,171.9 5,726.7
Current liabilities (1,514.9) (1,127.1)
Non-current liabilities (1,393.3) (1,282.7)
Net assets 5,062.5 4,497.3
Group Share as a percentage 40% 40%
Group Share in dollars 2,025.0 1,799.0
Goodwill 175.8 175.8
Net value of mineral rights and bauxite assets 104.9 107.0
Deferred tax liability (DTL) on mineral rights and bauxite assets (34.3) (34.9)
Allocation of Alba settlement 29.6 59.1
Carrying value 2,301.0 2,106.0
Reconciliation of carrying amount:
Opening carrying value 1 January 2,106.0 2,098.0
Net additional funding/(return) in AWAC entities 16.2 (33.9)
Profit for the year 360.4 18.1
Other comprehensive income for the year 97.7 174.7
Dividends and distributions paid (279.3) (150.9)
Closing net assets 2,301.0 2,106.0
¬71 70¬ Alumina Limited Annual Report 2017
For
per
sona
l use
onl
y

Notes to the consolidated financial statements for the year ended 31 December 2017
2. INVESTMENTS IN ASSOCIATES (CONTINUED)
SUMMARISED STATEMENT OF PROFIT OR LOSS AND OTHER COMPREHENSIVE INCOME US$ MILLION
2017 2016
Revenues 5,274.0 4,057.1
Profit from continuing operations 904.8 48.9
Profit for the year 904.8 48.9
Other comprehensive income for the year 244.3 436.8
Total comprehensive income for the year 1,149.1 485.7
Group Share of profit for the year as a percentage 40% 40%
Group Share of profit for the year in dollars 361.9 19.6
Mineral rights and bauxite amortisation (2.1) (2.1)
Movement in deferred tax liability on mineral rights and bauxite assets 0.6 0.6
Share of profit from associate accounted for using equity method 360.4 18.1
Dividends and distributions received from AWAC 279.3 150.9
(D) COMMITMENTS AND CONTINGENT LIABILITIES IN RESPECT OF AWAC
St Croix proceedings
Lockheed Martin Corporation (“Lockheed”) filed a complaint (the “Lockheed Action”) against Virgin Islands Aluminium Company (“Vialco”) and its parent Glencore Xstrata Plc (“Glencore”) in the United States District Court, Southern District of New York following Lockheed’s settlement of environmental lawsuits previously brought by the Government of the US Virgin Islands against Lockheed and Vialco in connection with the past ownership and operation of the alumina refinery.
Glencore demanded that St Croix Alumina LLC (“SCA”) and Alcoa World Alumina LLC (“AWA”), AWAC entities, indemnify Glencore from any losses incurred as a result of the Lockheed Action under the 19 July 1995 Acquisition Agreement (the “1995 Agreement”) between Vialco and AWA pursuant to which SCA purchased the refinery from Vialco. AWA denied that it owed Glencore any such obligation of indemnity and filed a declaratory judgement action in Delaware seeking clarification of its rights and obligations under the 1995 Agreement.
By order dated 8 February 2016, the court granted AWA’s motion and denied Glencore’s motion, resulting in AWA not being liable to indemnify Glencore for the Lockheed action. On 17 February 2016, Glencore filed notice of its application for interlocutory appeal of the 8 February ruling. AWA and SCA filed an opposition to that application on 29 February 2016. On 10 March 2016, the court denied Glencore’s motion for interlocutory appeal and on the same day entered judgment on claims other than Glencore’s claims for costs and fees it incurred in defending and settling the earlier Superfund action brought against Glencore by the Government of the Virgin Islands.
On 29 March 2016, Glencore filed a withdrawal of its notice of interlocutory appeal and on 6 April 2016, Glencore filed an appeal of the court’s 10 March 2016 judgement to the Delaware Supreme Court which set the appeal for argument for 2 November 2016. On 4 November 2016, the Delaware Supreme Court affirmed the judgement of the Delaware Superior Court. Remaining in the case were Glencore’s claims for costs and fees it incurred related to the previously described Superfund action.
On 7 March 2017, AWA and Glencore agreed in principle to settle these claims and on 17 March 2017 requested and were granted an adjournment of the court’s scheduled 21 March 2017 conference. On 5 April 2017, AWA and Glencore entered into a settlement agreement to resolve these remaining claims. Accordingly, on 24 April 2017, the court dismissed the case at the request of the parties. The amount of the settlement was not material. This matter is now closed.
Other claims
There are potential obligations that may result in a future obligation due to the various lawsuits and claims and proceedings which have been, or may be, instituted or asserted against entities within AWAC, including those pertaining to environmental, product liability, safety and health and tax matters. While the amounts claimed may be substantial, the ultimate liability cannot now be determined because of the considerable uncertainties that existed at balance date. Also, not every plaintiff has specified the amount of damages sought in their complaint. Therefore, it is possible that results of operations or liquidity in a particular period could be materially affected by certain contingencies. Pursuant to the terms of the AWAC Formation Agreement, Arconic Inc, Alcoa Corporation and Alumina Limited have agreed to remain liable for Extraordinary Liabilities (as defined in the agreement) as well as for certain other pre-formation liabilities, such as environmental conditions, to the extent of their pre-formation ownership of the AWAC’s entity or asset with which the liability is associated.
¬71 70¬ Alumina Limited Annual Report 2017
For
per
sona
l use
onl
y

Notes to the consolidated financial statements for the year ended 31 December 2017
NAME NOTES PLACE OF INCORPORATION PERCENTAGE OWNERSHIP
2017 2016
Alumina Employee Share Plan Pty Ltd A VIC, Australia 100 100
Alumina Finance Pty Ltd. A VIC, Australia 100 100
Alumina Holdings (USA) Inc. B Delaware, USA 100 100
Alumina International Holdings Pty. Ltd. C VIC, Australia 100 100
Alumina Brazil Holdings Pty Ltd A VIC, Australia 100 100
Alumina Limited Do Brasil SA D Brazil 100 100
Alumina (U.S.A.) Inc. B Delaware, USA 100 100
Butia Participaçoes SA D Brazil 100 100
Westminer Acquisition (U.K.) Limited D UK 100 100
A. A small proprietary company, which is not required to prepare a financial report.
B. A company that has not prepared audited accounts because its a non-operating company or its is not required in its country of incorporation. Appropriate books and records are maintained for the company.
C. The company has been granted a relief from the necessity to prepare accounts pursuant to Australian Securities and Investment Commission (ASIC) Class Order 2016/785. For further information refer Note 17.
D. A company that prepares separate audited accounts in the country of incorporation.
3. INVESTMENTS IN CONTROLLED ENTITIES
The consolidated financial statements incorporate the assets and liabilities of all subsidiaries of Alumina Limited as at 31 December 2017 and the results of their operations for the year then ended.
The Group has formed a trust to administer the Group’s employee share scheme. This trust is consolidated, as the substance of the relationship is that the trust is controlled by the Group. Shares held by the Alumina Employee Share Plan Trust are disclosed as treasury shares and deducted from contributed equity.
The Group’s subsidiaries at 31 December 2017 are set out below.
¬73 72¬ Alumina Limited Annual Report 2017
For
per
sona
l use
onl
y

Notes to the consolidated financial statements for the year ended 31 December 2017
FINANCIAL AND CAPITAL RISK
4. FINANCIAL ASSETS AND LIABILITIES
This note provides information about the Group’s financial instruments, including:
• an overview of all financial instruments held by the Group.
• specific information about each type of financial instrument.
• accounting policies.
• information about determining the fair value of the instruments.
US$ MILLION
2017 AT FAIR VALUE THROUGH PROFIT OR LOS
AT AMORTISED COSTS TOTAL
Cash and cash equivalents – Note 4(a) – 40.0 40.0
Receivables – – –
Total financial assets – 40.0 40.0
Payables – 1.3 1.3
Borrowings – Note 4(b) – 98.4 98.4
Derivative financial instruments – Note 4(c) 8.3 – 8.3
Total financial liabilities 8.3 99.7 108.0
Net financial liabilities 8.3 59.7 68.0
US$ MILLION
AT FAIR VALUE THROUGH PROFIT OR LOS
AT AMORTISED COSTS TOTAL
Cash and cash equivalents – Note 4(a) – 8.6 8.6
Receivables – 0.1 0.1
Total financial assets – 8.7 8.7
Payables – 1.3 1.3
Borrowings – Note 4(b) – 92.4 92.4
Derivative financial instruments – Note 4(c) 16.2 – 16.2
Total financial liabilities 16.2 93.7 109.9
Net financial liabilities 16.2 85.0 101.2
The Group’s exposure to various risks associated with the financial instruments is disclosed in Note 5. The maximum exposure to credit risk at the end of the reporting period is the carrying amount of each class of financial assets mentioned above. The carrying amounts of financial assets and liabilities, other than derivative financial instruments, approximate their fair values. Derivative financial instruments are measured at fair value through profit or loss.
¬73 72¬ Alumina Limited Annual Report 2017
For
per
sona
l use
onl
y

Notes to the consolidated financial statements for the year ended 31 December 2017
4. FINANCIAL ASSETS AND LIABILITIES (CONTINUED)
(A) CASH AND CASH EQUIVALENTS
Cash and cash equivalents comprise cash on hand, deposits held at call with financial institutions, other short-term highly liquid investments with original maturities of three months or less that are readily convertible to known amounts of cash and which are subject to an insignificant risk of changes in value, and bank overdrafts.
US$ MILLION
2017 2016
Cash on hand and at bank 13.1 5.3
Money market deposits 26.9 3.3
Total cash and cash equivalents as per the Statement of Cash Flows 40.0 8.6
(B) BORROWINGS
Borrowings are initially recognised at fair value, net of transaction costs incurred. Borrowings are subsequently measured at amortised cost. Any difference between the proceeds (net of transaction costs) and the redemption amount is recognised in profit or loss over the period of the borrowings using the effective interest method.
Fees paid on establishment of loan facilities are recognised as transaction costs to the extent that it is probable that some or all of a facility will be drawn down. In this case, the fee is deferred until the draw down occurs. To the extent there is no evidence that it is probable that some or all of a facility will be drawn down, the fee is capitalised as a prepayment for the liquidity services and amortised over the period of the facility to which it relates.
Borrowings are classified as current liabilities unless the Group has an unconditional right to defer settlement of the liability for at least 12 months after the balance sheet date.
US$ MILLION
2017 2016
Bank loans – –
Fixed rate note 98.4 92.4
Total borrowings 98.4 92.4
Bank loans
During the second half of 2017 Alumina Limited rolled over and reduced a tranche of the bank facility that was due to mature in December 2017.
Following this renegotiation, Alumina Limited now has a US$250 million syndicated bank facility with two tranches maturing in July 2020 (US$150 million) and October 2022 (US$100 million). As at 31 December 2017 there were no amounts drawn against the syndicated facility so the undrawn available facility amount as at 31 December 2017 was $250 million.
Fixed rate note
On 12 November 2014, Alumina Limited issued an A$125 million face value 5.5% fixed rate note at a discount of A$0.7 million. A change in the credit rating of Alumina Limited triggered a 1.75% step up in coupon from 5.5% to 7.25%, which was effective 20 November 2016. A subsequent change in the credit rating triggered a 0.50% step down in the coupon from 7.25% to 6.75%, effective 19 May 2017. The note matures on 19 November 2019. The fixed rate note has been converted to US dollar equivalents at year-end exchange rates.
¬75 74¬ Alumina Limited Annual Report 2017
For
per
sona
l use
onl
y

Notes to the consolidated financial statements for the year ended 31 December 2017
4. FINANCIAL ASSETS AND LIABILITIES (CONTINUED)
(C) DERIVATIVES
Derivatives are only used for economic hedging purposes and not as trading or speculative instruments. Derivatives are classified as held for trading and accounted for at fair value through profit or loss as they are not designated as hedges. They are presented as current assets or liabilities if they are expected to be settled within 12 months after the end of the reporting period.
To provide an indication about the reliability of the input used in determining the fair value, the Group has classified its financial instruments into three levels prescribed under the accounting standards. An explanation of each level follows underneath the table.
US$ MILLION
2017 LEVEL 1 LEVEL 2 LEVEL 3 TOTAL
Cross-currency interest rate swap (CCIRS AUD/USD) – 8.3 – 8.3
Total financial liabilities at fair value through profit or loss – 8.3 – 8.3
2016
Cross-currency interest rate swap (CCIRS AUD/USD) – 16.2 – 16.2
Total financial liabilities at fair value through profit or loss – 16.2 – 16.2
Level 1: Financial instruments traded in active markets (such as publicly traded derivatives, trading and available for sale securities) for which the fair value is based on quoted market prices at the end of the reporting period.
Level 2: Financial instruments that are not traded in an active market (for example, over the counter derivatives) for which the fair value is determined using valuation techniques which maximise the use of observable market data and rely as little as possible on entity specific estimates.
Level 3: If one or more of the significant inputs is not observable market data, the instrument is included in level 3.
5. FINANCIAL RISK MANAGEMENT
This note explains the Group’s exposure to financial risks and how these risks could affect the Group’s future financial performance.
RISK EXPOSURE ARISING FROM MEASUREMENT MANAGEMENT
Market risk: foreign currency Financial assets and liabilities denominated in currency other than US$
Cash flow forecasting & sensitivity analysis
Cross-currency interest rate swaps
Market risk: interest rate Long-term borrowings at fixed rates
Sensitivity analysis Cross-currency interest rate swaps
Credit risk Cash and cash equivalents, and derivative financial instruments
Credit ratings Credit limits, letters of credit, approved counterparties list
Liquidity risk Borrowings and other liabilities
Cash flow forecasting Availability of committed borrowing facilities
Financial risk management is carried out by the Treasury Committee which is responsible for developing and monitoring risk management policies. Risk management policies are established to identify and analyse the risks faced by the Group to set appropriate risk limits and controls, and to monitor risks and adherence to limits. Risk management policies and systems are reviewed regularly to reflect changes in market conditions and the Group’s activities.
¬75 74¬ Alumina Limited Annual Report 2017
For
per
sona
l use
onl
y

Notes to the consolidated financial statements for the year ended 31 December 2017
5. FINANCIAL RISK MANAGEMENT (CONTINUED)
(A) MARKET RISK
Foreign exchange risk
Foreign exchange risk for the Group arises when future commercial transactions and recognised assets and liabilities are denominated in a currency that is not the Group’s functional currency.
The fixed rate note is issued in Australian dollars. To mitigate the exposure to the AUD/USD exchange rate and Australian interest rates the Group entered into CCIRS for the full amount of the face value of the fixed rate note to swap the exposure back to US dollars.
Except as described above, the Group generally does not hedge its foreign currency exposures except through the near-term purchase of currency to meet operating requirements.
The Group’s exposure to foreign currency risk at the end of the reporting period, as expressed in US$, was as follows:
US$ MILLION
USD AUD OTHER TOTAL
Cash and cash equivalents 29.5 1.7 8.8 40.0
Receivables – – – –
Total non-derivative financial assets 29.5 1.7 8.8 40.0
Payables – 1.3 – 1.3
Borrowings – 98.4 – 98.4
Total non-derivative financial liabilities – 99.7 – 99.7
Net non-derivative financial (liabilities)/assets 29.5 (98.0) 8.8 (59.7)
Derivative financial instruments (notional principal) (108.4) 108.4 – –
Net financial assets/(liabilities) (78.9) 10.4 8.8 (59.7)
US$ MILLION
USD AUD OTHER TOTAL
Cash and cash equivalents 3.8 0.1 4.7 8.6
Receivables – 0.1 – 0.1
Total non-derivative financial assets 3.8 0.2 4.7 8.7
Payables – 1.3 – 1.3
Borrowings – 92.4 – 92.4
Total non-derivative financial liabilities – 93.7 – 93.7
Net non-derivative financial (liabilities)/assets 3.8 (93.5) 4.7 (85.0)
Derivative financial instruments (notional principal) (108.4) 108.4 – –
Net financial assets/(liabilities) (104.6) 14.9 4.7 (85.0)
¬77 76¬ Alumina Limited Annual Report 2017
For
per
sona
l use
onl
y

Notes to the consolidated financial statements for the year ended 31 December 2017
5. FINANCIAL RISK MANAGEMENT (CONTINUED)
Cash flow and fair value interest rate risk
The Group’s main interest rate risk arises from its borrowings.
Borrowings by the Group at variable rates expose it to cash flow interest rate risk. Borrowings at fixed rates would expose the Group to fair value interest rate risk. When managing interest rate risk the Group seeks to reduce the overall cost of funds. Group policy is to generally borrow at floating rates subject to availability of attractive fixed rate deals.
In 2017 and 2016, CCIRS for the whole face value of the fixed rate note were used to manage the exposure to Australian interest rates over the life of the note.
A change in credit rating for Alumina Limited triggered a 1.75% step up in coupon from 5.5% to 7.25%, which was effective 20 November 2016. To cover the increased interest rate exposure one of the original CCIRS was amended and an additional CCIRS was entered into. A subsequent change in credit rating triggered a 0.50% step down in the coupon from 7.25% to 6.75%, effective 19 May 2017. Existing CCIRS were amended to manage the changed interest rate exposure.
The consolidated entity’s exposure to interest rate risk and the effective weighted interest rate after the effect of derivative instruments is set out below:
US$ MILLION
FLOATING INTEREST
FIXED INTEREST
NON-INTEREST BEARING TOTAL
Cash and cash equivalents 40.0 – – 40.0
Receivables – – – –
Total non-derivative financial assets 40.0 – – 40.0
Payables – – 1.3 1.3
Borrowings – 98.4 – 98.4
Total non-derivative financial liabilities – 98.4 1.3 99.7
Net non-derivative financial (liabilities)/assets 40.0 (98.4) (1.3) (59.7)
Weighted average interest rate before derivatives 2.8% 6.9%
Weighted average interest rate after derivatives 2.8% 4.9%
US$ MILLION
FLOATING INTEREST
FIXED INTEREST
NON-INTEREST BEARING TOTAL
Cash and cash equivalents 8.6 – – 8.6
Receivables – – 0.1 0.1
Total non-derivative financial assets 8.6 – 0.1 8.7
Payables – – 1.3 1.3
Borrowings – 92.4 – 92.4
Total non-derivative financial liabilities – 92.4 1.3 93.7
Net non-derivative financial (liabilities)/assets 8.6 (92.4) (1.2) (85.0)
Weighted average interest rate before derivatives 1.6% 5.8%
Weighted average interest rate after derivatives 1.6% 3.4%
Had interest rates on floating rate debt during 2017 been one percentage point higher/lower than the average, with all other variables held constant, pre-tax profit for the year would have been US$0.7 million lower/higher (2016: US$0.6 million lower/higher).
¬77 76¬ Alumina Limited Annual Report 2017
For
per
sona
l use
onl
y

Notes to the consolidated financial statements for the year ended 31 December 2017
5. FINANCIAL RISK MANAGEMENT (CONTINUED)
(B) CREDIT RISK
Credit risk arises from cash and cash equivalents, derivative financial instruments and deposits with banks and financial institutions, as well as credit exposures to customers, including outstanding receivables and committed transactions. For banks and financial institutions, only independently rated parties with a minimum rating of ‘A-‘ are accepted, and exposure limits are assigned based on actual independent rating under Board approved guidelines.
Credit risk further arises in relation to cross guarantees given to wholly owned subsidiaries (see Note 17 for details). Such guarantees are only provided in exceptional circumstances and are subject to Board approval.
The carrying amount of financial assets recorded in the financial statements, net of any allowances for losses, represent the Group’s maximum exposure to credit risk.
(C) LIQUIDITY RISK
Prudent liquidity risk management requires maintaining sufficient cash and credit facilities to ensure the Group’s commitments and plans can be met. This is managed by maintaining committed undrawn credit facilities to cover reasonably expected forward cash requirements. Management monitors rolling forecasts of the Group’s liquidity, including undrawn borrowing facilities and cash and cash equivalents on the basis of expected cash flows.
The Group had the following undrawn borrowing facilities at the end of the reporting period: The Group had the following undrawn borrowing facilities at the end of the reporting period:
US$ MILLION
2017 2016
Expiring within one year – 150.0
Expiring beyond one year 250.0 150.0
Total undrawn borrowing facilities 250.0 300.0
The table below details the Group’s remaining contractual maturity for its financial liabilities.
US$ MILLION
2017 LESS THAN 6 MONTHS
6–12 MONTHS
1–2 YEARS
2–5 YEARS TOTAL
Trade payables 1.3 – – – 1.3
Borrowings – – 98.4 – 98.4
Total non-derivative financial liabilities 1.3 – 98.4 – 99.7
Derivative financial liabilities – - 8.3 – 8.3
2016
Trade payables 1.3 – – – 1.3
Borrowings – – – 92.4 92.4
Total non-derivative financial liabilities 1.3 – – 92.4 93.7
Derivative financial liabilities – – – 16.2 16.2
¬79 78¬ Alumina Limited Annual Report 2017
For
per
sona
l use
onl
y

Notes to the consolidated financial statements for the year ended 31 December 2017
6. CAPITAL MANAGEMENT
(A) RISK MANAGEMENT
The Group’s objective when managing capital is to safeguard the ability to continue as a going concern, so that it can continue to provide returns for shareholders and to maintain an optimal capital structure to reduce the cost of capital.
The Board’s policy is to maintain a strong capital base so as to maintain investor, creditor and market confidence and to sustain future development of the business. In order to maintain or adjust the capital structure, the Company may adjust the amount of dividends paid to shareholders, return capital to shareholders, issue new shares or sell assets to reduce debt.
The Group calculates the gearing ratio as net debt divided by total capital. Net debt is calculated as total borrowings less cash and cash equivalents. Total capital is calculated as ‘equity’ as shown in the balance sheet plus debt.
The gearing ratios at 31 December 2017 and 31 December 2016 were as follows:
US$ MILLION
2017 2016
Total borrowings 98.4 92.4
Less: cash and cash equivalents (40.0) (8.6)
Net debt 58.4 83.8
Total borrowings 98.4 92.4
Total equity 2,234.0 2,006.9
Total capital 2,332.4 2,099.3
Gearing ratio 2.5% 4.0%
(B) DIVIDENDS
US$ MILLION
2017 2016
Interim dividend of US4.2 cents fully franked at 30% per fully paid share declared 24 August 2017 and paid on 14 September 2017 (2016: US2.9 cents fully franked at 30% per fully paid share declared 24 August 2016 and paid on 15 September 2016)
120.9 83.5
Final dividend of US3.1 cents fully franked at 30% per fully paid share declared 23 February 2017 and paid on 22 March 2017 (2016: US1.8 cents fully franked at 30% per fully paid share declared 25 February 2016 and paid on 23 March 2016)
89.3 51.8
Total dividends 210.2 135.3
Since the year-end the Directors have recommended the payment of a final dividend of US9.3 cents per share (2016: US3.1 cents per share), fully franked based on the tax paid at 30%. The record date to determine entitlements to the dividend was 28 February 2018. The aggregate amount of the dividend paid on 15 March 2018 out of retained earnings at 31 December 2017, but not recognised as a liability at the year-end, was $267.8 million.
¬79 78¬ Alumina Limited Annual Report 2017
For
per
sona
l use
onl
y

Notes to the consolidated financial statements for the year ended 31 December 2017
6. CAPITAL MANAGEMENT (CONTINUED)
(C) FRANKED DIVIDENDS
A$ MILLION
2017 2016
Franking credits available for subsequent financial years, based on a tax rate of 30% (2016: 30%) 388.5 347.5
The above amounts are calculated from the balance of the franking credits as at the end of the reporting period, adjusted for franking credits and debits that will arise from the settlement of liabilities and receivables for income tax and dividends after the end of the year.
US$ MILLION
2017 2016
The fully franked dividends received from AWAC in the financial year were 278.1 150.2
KEY NUMBERS
7. EXPENSES
(A) EMPLOYEE BENEFITS EXPENSE
Liabilities for salaries and annual leave are recognised in current provisions (i.e. short-term employee benefits), and are measured as the amount unpaid at reporting date at expected pay rates in respect of employees’ services up to that date, including related on-costs.
The liability for long service leave is recognised in the provision for employee benefits and measured as the present value of expected future payments to be made in respect of services provided by employees up to the reporting date. Consideration is given to expected future wage and salary levels, experience of employee departures and periods of service. Expected future payments are discounted using market yields at the end of the reporting period of high-quality corporate bonds with terms to maturity and currency that match, as closely as possible, the estimated future cash flows.
All employees of Alumina Limited are entitled to benefits on retirement, disability or death from the Group’s superannuation plan. Alumina Limited’s employees are members of the Alumina Limited Super Plan managed by MLC MasterKey Super, except for employees who elected to contribute to an alternate fund. The plan is an accumulation category plan which offers a minimum Company contribution of 9.5 per cent of basic salary to each member’s account. Members also have the option to make voluntary contributions to their account. Employer contributions to these funds are recognised as an expense.
US$ MILLION
2017 2016
Profit/(loss) before income tax included the following specific expenses:
Defined contribution superannuation expense 0.2 0.2
Other employee benefits expense 6.5 5.8
Total employee benefits expense 6.7 6.0
¬81 80¬ Alumina Limited Annual Report 2017
For
per
sona
l use
onl
y

Notes to the consolidated financial statements for the year ended 31 December 2017
7. EXPENSES (CONTINUED)
(B) FINANCE COSTS
Finance costs comprise interest payable on borrowings using the effective interest rate method, commitment fees and amortisation of capitalised facility fees.
US$ MILLION
2017 2016
Finance costs:
Interest expense 4.7 6.5
Commitment and upfront fees 2.1 2.0
Amortisation of capitalised upfront fees 1.5 0.6
Total finance costs 8.3 9.1
8. INCOME TAX EXPENSE
(A) INCOME TAX EXPENSE AND DEFERRED TAXES
The income tax expense/benefit for the period is the tax payable/receivable on the current period’s taxable income based on the applicable income tax rate for each jurisdiction adjusted by charges in deferred tax assets and liabilities attributable to temporary differences and to unused tax losses.
The current income tax charge is calculated on the basis of the tax laws enacted or substantively enacted at the reporting period in the countries where the Company’s subsidiaries and associates operate and generate taxable income.
US$ MILLION
2017 2016
Current tax – –
Deferred tax – –
Aggregate income tax expense – –
Deferred income tax is provided in full, using the liability method, on temporary differences arising between the tax bases of assets and liabilities and their carrying amounts in the consolidated financial statements. Deferred income tax is determined using tax rates (and laws) that have been enacted or substantially enacted by the reporting date and are expected to apply when the related deferred income tax asset is realised or the deferred income tax liability is settled.
Deferred tax assets are recognised for deductible temporary differences and unused tax losses only if it is probable that future taxable amounts will be available to utilise those temporary differences and losses.
Deferred tax liabilities and assets are not recognised for temporary differences between the carrying amount and tax bases of investments in controlled entities where the parent entity is able to control the timing of the reversal of the temporary differences and it is probable that the differences will not reverse in the foreseeable future.
Deferred tax assets and liabilities are offset when there is a legally enforceable right to offset current tax assets and liabilities and when the deferred tax balances relate to the same taxation authority. Current tax assets and liabilities are offset where the entity has a legally enforceable right to offset and intends either to settle on a net basis, or to realise the asset and settle the liability simultaneously.
Alumina Limited and its wholly-owned Australian controlled entities have implemented the tax consolidation legislation. As a consequence, these entities are taxed as a single entity and the deferred tax assets and liabilities of these entities are set off in the consolidated financial statements.
¬81 80¬ Alumina Limited Annual Report 2017
For
per
sona
l use
onl
y

Notes to the consolidated financial statements for the year ended 31 December 2017
8. INCOME TAX EXPENSE (CONTINUED)
The Group’s deferred tax assets and liabilities are attributable to the following:
US$ MILLION
2017 2016
Deferred tax liabilities
Unrealised foreign exchange gains 2.8 4.6
Total deferred tax liabilities 2.8 4.6
Deferred tax assets
Employee benefits 0.2 0.3
Derivative financial instruments 2.5 0.4
Other 0.1 0.2
Total deferred tax assets other than tax losses 2.8 0.9
Net deferred tax (liabilities)/assets before tax losses – (3.7)
Deductible temporary differences and tax losses not recognised – 3.7
Net deferred tax (liabilities)/assets – –
Deferred tax assets are recognised only to the extent of deferred tax liabilities existing at reporting date. Remaining deferred tax assets are not recognised as it is not probable that future taxable amounts will be available to utilise those temporary differences and losses.
(B) NUMERICAL RECONCILIATION OF INCOME TAX EXPENSE TO PRIMA FACIE TAX PAYABLE
US$ MILLION
2017 2016
Profit/(loss) before income tax 339.8 (30.2)
Prima facie tax (expense)/benefit for the period at the rate of 30% (101.9) 9.1
The following items caused the total charge for income tax to vary from the above:
Share of equity accounted profit not assessable for tax (360.4) (18.1)
Foreign income subject to accruals tax 4.7 2.8
Share of Partnership income assessable for tax 0.8 3.0
Timing differences not recognised – –
Tax losses not recognised 11.2 26.3
Previously unrecognised tax losses now recouped to reduce current tax expense – (0.2)
Non-deductible expenses 3.9 16.4
Net movement (339.8) 30.2
Consequent decrease/(increase) in charge for income tax 101.9 (9.1)
Aggregate income tax expense – –
¬83 82¬ Alumina Limited Annual Report 2017
For
per
sona
l use
onl
y

Notes to the consolidated financial statements for the year ended 31 December 2017
8. INCOME TAX EXPENSE (CONTINUED)
(C) TAX EXPENSE RELATING TO ITEMS OF COMPREHENSIVE INCOME
Current and deferred tax balances attributable to amounts recognised directly in other comprehensive income and equity are also recognised directly in other comprehensive income and equity.
US$ MILLION
2017 2016
Cash flow hedges 10.6 2.4
Actuarial gains on retirement benefit obligations 3.5 2.3
Total tax expense relating to items of other comprehensive income 14.1 4.7
(D) TAX LOSSES
US$ MILLION
2017 2016
Tax losses – revenue 1,053.3 973.9
Tax losses – capital 951.5 951.5
Total unused tax losses 2,004.8 1,925.4
Potential tax benefit – revenue 345.6 319.1
Potential tax benefit – capital 285.4 285.4
Total potential tax benefit 631.0 604.5
9. EQUITY
(A) CONTRIBUTED EQUITY
Ordinary shares are classified as equity. Incremental costs directly attributable to the issue of new shares are shown in equity as a deduction, net of tax, from the proceeds.
MOVEMENT IN SHARE CAPITAL NUMBER OF SHARES US$ MILLION
2017 2016 2017 2016
Balance brought forward 2,879,843,498 2,879,843,498 2,682.9 2,682.9
Movement for the period – – – –
Total issued capital 2,879,843,498 2,879,843,498 2,682.9 2,682.9
Treasury shares
Treasury shares are Alumina Limited shares held by the Alumina Employee Share Plan Trust for the purpose of issuing shares under the Alumina Employee Share Plan.
MOVEMENT IN TREASURY SHARES NUMBER OF SHARES US$ MILLION
2017 2016 2017 2016
Balance brought forward 1,856 61,717 1,905 1,413,606
Shares acquired by Alumina Employee Share Plan Pty Ltd (average price: A$1.84 per share (2016: A$1.37 per share))
1,484,568 1,508,604 2,040,374 1,558,319
Employee performance rights vested (785,979) (1,568,465) (1,135,406) (2,970,020)
Total treasury shares 700,445 1,856 906,873 1,905
¬83 82¬ Alumina Limited Annual Report 2017
For
per
sona
l use
onl
y

Notes to the consolidated financial statements for the year ended 31 December 2017
9. EQUITY (CONTINUED)
The weighted average number of ordinary shares used as the denominator in the calculation of basic earnings per share is calculated as the weighted average number of ordinary shares outstanding during the financial year, adjusted for treasury shares issued.
NUMBER OF SHARES
2017 2016
Weighted average number of ordinary shares used as the denominator in the calculation of basic and diluted earnings per share
2,878,924,467 2,879,474,499
(B) OTHER RESERVES
Other Reserves include assets revaluation reserve, capital reserve, option premium on convertible bonds reserve, share-based payments reserve, cash-flow hedge reserve and foreign currency translation reserve.
Foreign currency translation reserve
The foreign currency translation reserve represents exchange differences arising on the translation of non-US dollar functional currency operations within the Group into US dollars.
US$ MILLION
2017 2016
Balance at the beginning of the financial year (1,192.2) (1,370.7)
Currency translation differences arising during the year 88.0 178.5
Balance at the end of the financial year (1,104.2) (1,192.2)
10. CASH FLOW INFORMATION
(A) RECONCILIATION OF PROFIT/(LOSS) AFTER INCOME TAX TO NET CASH (OUTFLOW)/INFLOW FROM OPERATING ACTIVITIES
US$ MILLION
2017 2016
Profit/(loss) from continuing operations after income tax 339.8 (30.2)
Share of net profit of associates accounted for using equity method (360.4) (18.1)
Dividends and distributions received from associates 279.3 150.9
Share based payments 0.9 0.9
Other non-cash items (depreciation, net exchange differences, other) (1.4) 16.7
Sub-total 258.2 120.2
Change in assets and liabilities
Decrease/(increase) in receivables 0.1 (0.1)
Decrease/(increase) in other assets 1.2 0.3
(Decrease)/increase in payables – (0.4)
(Decrease)/increase in current tax liability – –
Net cash inflow from operating activities 259.5 120.0
¬85 84¬ Alumina Limited Annual Report 2017
For
per
sona
l use
onl
y

Notes to the consolidated financial statements for the year ended 31 December 2017
10. CASH FLOW INFORMATION (CONTINUED)
(B) NON-CASH FINANCING AND INVESTING ACTIVITIES
There were no non-cash financing or investing activities in the years ended 31 December 2017 and 31 December 2016.
(C) NET DEBT RECONCILIATION
This section sets out an analysis of net debt and the movements in net debt for each of the periods presented.
US$ MILLION
2017 2016
Cash and cash equivalents 40.0 8.6
Borrowings – repayable after one year (98.4) (92.4)
Net debt (58.4) (83.8)
Cash and liquid investments 40.0 8.6
Gross debt – fixed interest rates (98.4) (92.4)
Net debt (58.4) (83.8)
US$ MILLION
CASH/BANK OVERDRAFT
BORROWINGS DUE WITHIN
1 YEAR
BORROWINGS DUE AFTER
1 YEARTOTAL
Net debt as at 1 January 2016 9.3 (20.0) (90.5) (101.2)
Net cash flows (3.0) 20.0 – 17.0
Foreign exchange adjustments 2.3 – 0.8 3.1
Other non-cash movements – – (2.7) (2.7)
Net debt as at 31 December 2016 8.6 – (92.4) (83.8)
Cash flows 31.1 – – 31.1
Foreign exchange adjustments 0.3 – (7.4) (7.1)
Other non-cash movement – – 1.4 1.4
Net debt as at 31 December 2017 40.0 – (98.4) (58.4)
¬85 84¬ Alumina Limited Annual Report 2017
For
per
sona
l use
onl
y

Notes to the consolidated financial statements for the year ended 31 December 2017
OTHER INFORMATION
11. RELATED PARTY TRANSACTIONS
The parent entity within the Group is Alumina Limited. Balances and transactions between the parent entity and its subsidiaries have been eliminated on consolidation and are not disclosed in this note.
(A) OWNERSHIP INTERESTS IN RELATED PARTIES
Interests held in the following classes of related parties are set out in the following notes:
• associates – Note 2.
• controlled entities – Note 3.
(B) COMPENSATION OF KEY MANAGEMENT PERSONNEL
Detailed remuneration disclosures for the key management personnel, defined as Group Directors, CEO and Senior Executives, are provided in the remuneration report on pages 38 to 61 of this annual report.
The remuneration report has been presented in Australian dollars, whilst the financial report has been presented in US dollars. The average exchange rate for 2017 of 0.7667 (2016: 0.7439) has been used for conversion.
(C) OTHER TRANSACTIONS AND BALANCES WITH RELATED PARTIES
There have been no other related party transactions made during the year or balances outstanding as at 31 December 2017, between the Group, its related parties, the Directors or key management personnel (2016: Nil).
12. SHARE-BASED PAYMENTS
The Group provides benefits to employees (including CEO and Senior Executives) through share based incentives. Employees are incentivised for their performance in part through participation in the grant of conditional entitlement to fully paid ordinary shares (a Performance Right) via the Alumina Limited Employee Share Plan (ESP).
For further details on key features of the ESP refer to the remuneration report on pages 59 to 61 of this annual report.
Set out below are summaries of performance rights granted under the ESP.
DIRECTORS AND SENIOR EXECUTIVES US$
2017 2016
Short-term employee benefits 3,977,082 4,242,211
Post-employment and termination benefits 923,735 141,834
Share based payments 807,349 708,137
Total 5,708,166 5,092,182
2017
Grant Date Vesting Date
Balance at start of the
year Number
Granted during the
year Number
Vested during the
year Number
Lapsed during the
year Number
Balance at end of the
year Number
5/1/2015 11/12/2017 689,866 – (491,411) (198,455) –
19/2/2016 7/12/2016 1,004,737 – – (165,073) 839,664
20/1/2017 11/12/2019 – 708,400 – (201,913) 506,487
1/6/2017 31/5/2020 – 141,900 – – 141,900
Total 1,694,603 850,300 (491,411) (565,441) 1,448,051
¬87 86¬ Alumina Limited Annual Report 2017
For
per
sona
l use
onl
y

Notes to the consolidated financial statements for the year ended 31 December 2017
2016
Grant Date Vesting Date
Balance at start of the
year Number
Granted during the
year Number
Vested during the
year Number
Lapsed during the
year Number
Balance at end of the
year Number
8/2/2013 7/12/2015 687,768 – (687,768) – –
10/2/2014 6/12/2018 1,110,770 – (1,109,102) (1,668) –
5/1/2015 11/12/2017 694,250 – – (4,384) 689,866
19/2/2016 7/12/2018 – 1,016,250 – (11,513) 1,004,737
Total 2,492,788 1,016,250 (1,796,870) (17,565) 1,694,603
The weighted average remaining contractual life of performance rights outstanding at the end of the period was 2.4 years (2016: 2.6 years).
In addition to the ESP, the CEO’s fixed remuneration includes an annual share right component. This share based component of the CEO’s fixed remuneration is conditional on a minimum of 12 months service and deferred for three years from the date of the grant.
For further details refer to the remuneration report on page 42 of this annual report.
Total expenses arising from share-based payment transactions recognised during the period as part of employee benefits expense were as follows:
US$ 000’s
2017 2016
Performance rights granted under the Alumina Employee Share Plan 556 645
CEO annual conditional share rights grant 104 –
Retired CEO annual conditional share rights grant 217 154
Total 877 799
It is the Group’s policy to employ PricewaterhouseCoopers on assignments additional to their statutory audit duties where PricewaterhouseCoopers’ expertise and experience with the Group are important provided such arrangements do not compromise audit independence. These assignments are principally tax advice or where PricewaterhouseCoopers is awarded assignments on a competitive basis.
13. REMUNERATION OF AUDITORS
During the period the following fees were paid or payable for services provided by the auditor of the parent entity, and its related practices and non-related audit firms:
US$ 000’s
2017 2016
PricewaterhouseCoopers Australia: Audit and review of the financial reports
395 383
Other assurance services 3 32
Related practices of PricewaterhouseCoopers Australia:
Overseas taxation services 8 8
Total 406 423
¬87 86¬ Alumina Limited Annual Report 2017
For
per
sona
l use
onl
y

Notes to the consolidated financial statements for the year ended 31 December 2017
14. COMMITMENTS AND CONTINGENCIES
Capital commitments
There are no contractual capital commitments at reporting date but there could be future equity calls by AWAC entities in relation to working capital support. However, this is subject to market conditions.
Contingent Liabilities
There are no contingent liabilities of the Group as at 31 December 2017 and 31 December 2016, other than as disclosed in Note 2(d) and Note 16.
15. EVENTS OCCURRING AFTER THE REPORTING PERIOD
Except as disclosed in the Director’s report or elsewhere in the Financial Statements, there have been no significant events occurring since 31 December 2017.
Please refer to Note 6(b) for the final dividend recommended by the Directors.
16. PARENT ENTITY FINANCIAL INFORMATION
The financial information for the parent entity has been prepared on the same basis as the consolidated financial statements, except as set out below.
Investments in subsidiaries, associates and joint venture entities.
Investments in subsidiaries, associates and joint venture entities are accounted for at cost in the financial statements of Alumina Limited. Dividends received from associates are recognised in the parent entity’s profit or loss, rather than being deducted from the carrying amount of these investments.
Where the parent entity has provided financial guarantees in relation to loans and payables of subsidiaries for no compensation, the fair values of these guarantees are accounted for as contributions and recognised as part of the cost of the investment.
Intercompany Loans
Loans granted by the parent entity to its subsidiaries are classified as non-current assets.
Tax consolidation legislation
Alumina Limited and its wholly-owned Australian controlled entities have implemented tax consolidation legislation. The head entity, Alumina Limited, and the controlled entities in the tax consolidated Group account for their own current and deferred tax amounts. These tax amounts are measured as if each entity in the tax consolidated Group continues to be a standalone taxpayer in its own right. In addition to its own current and deferred tax amounts, Alumina Limited also recognises the current tax liabilities (or assets) and the deferred tax assets arising from unused tax losses and unused tax credits assumed from controlled entities in the tax consolidated Group.
BALANCE SHEET US$ MILLION
2017 2016
Current assets 32.2 7.8
Total assets 3,861.5 3,815.1
Current liabilities 1.7 1.7
Total liabilities 114.5 116.3
SHAREHOLDERS’ EQUITY
Issued capital 2,682.9 2,682.9
Reserves 236.9 237.2
Retained earnings 827.2 778.7
TOTAL SHAREHOLDERS’ EQUITY 3,747.0 3,698.8
Profit for the year 258.7 101.8
Total comprehensive income for the year 258.7 101.8
(A) SUMMARISED FINANCIAL INFORMATION
The individual financial statements for the parent entity show the following aggregate amounts:
¬89 88¬ Alumina Limited Annual Report 2017
For
per
sona
l use
onl
y
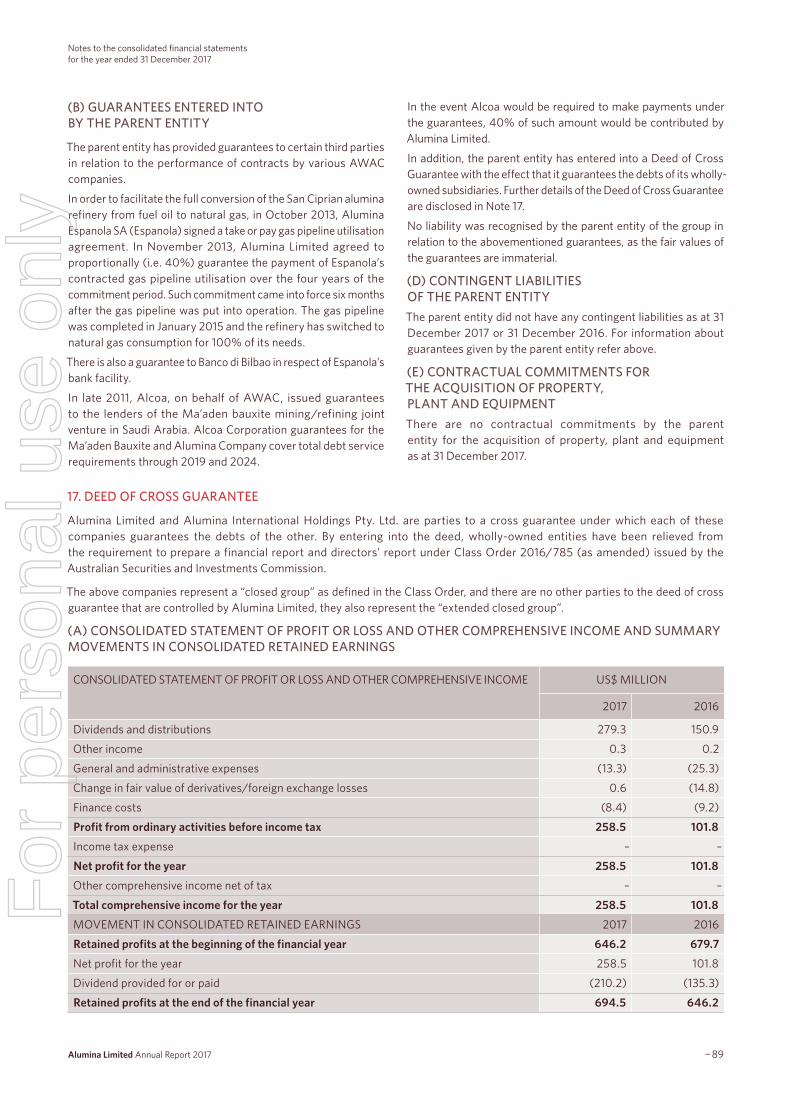
Notes to the consolidated financial statements for the year ended 31 December 2017
(B) GUARANTEES ENTERED INTO BY THE PARENT ENTITY
The parent entity has provided guarantees to certain third parties in relation to the performance of contracts by various AWAC companies.
In order to facilitate the full conversion of the San Ciprian alumina refinery from fuel oil to natural gas, in October 2013, Alumina Espanola SA (Espanola) signed a take or pay gas pipeline utilisation agreement. In November 2013, Alumina Limited agreed to proportionally (i.e. 40%) guarantee the payment of Espanola’s contracted gas pipeline utilisation over the four years of the commitment period. Such commitment came into force six months after the gas pipeline was put into operation. The gas pipeline was completed in January 2015 and the refinery has switched to natural gas consumption for 100% of its needs.
There is also a guarantee to Banco di Bilbao in respect of Espanola’s bank facility.
In late 2011, Alcoa, on behalf of AWAC, issued guarantees to the lenders of the Ma’aden bauxite mining/refining joint venture in Saudi Arabia. Alcoa Corporation guarantees for the Ma’aden Bauxite and Alumina Company cover total debt service requirements through 2019 and 2024.
In the event Alcoa would be required to make payments under the guarantees, 40% of such amount would be contributed by Alumina Limited.
In addition, the parent entity has entered into a Deed of Cross Guarantee with the effect that it guarantees the debts of its wholly-owned subsidiaries. Further details of the Deed of Cross Guarantee are disclosed in Note 17.
No liability was recognised by the parent entity of the group in relation to the abovementioned guarantees, as the fair values of the guarantees are immaterial.
(D) CONTINGENT LIABILITIES OF THE PARENT ENTITY
The parent entity did not have any contingent liabilities as at 31 December 2017 or 31 December 2016. For information about guarantees given by the parent entity refer above.
(E) CONTRACTUAL COMMITMENTS FOR THE ACQUISITION OF PROPERTY, PLANT AND EQUIPMENT
There are no contractual commitments by the parent entity for the acquisition of property, plant and equipment as at 31 December 2017.
17. DEED OF CROSS GUARANTEE
Alumina Limited and Alumina International Holdings Pty. Ltd. are parties to a cross guarantee under which each of these companies guarantees the debts of the other. By entering into the deed, wholly-owned entities have been relieved from the requirement to prepare a financial report and directors’ report under Class Order 2016/785 (as amended) issued by the Australian Securities and Investments Commission.
The above companies represent a “closed group” as defined in the Class Order, and there are no other parties to the deed of cross guarantee that are controlled by Alumina Limited, they also represent the “extended closed group”.
(A) CONSOLIDATED STATEMENT OF PROFIT OR LOSS AND OTHER COMPREHENSIVE INCOME AND SUMMARY MOVEMENTS IN CONSOLIDATED RETAINED EARNINGS
CONSOLIDATED STATEMENT OF PROFIT OR LOSS AND OTHER COMPREHENSIVE INCOME US$ MILLION
2017 2016
Dividends and distributions 279.3 150.9
Other income 0.3 0.2
General and administrative expenses (13.3) (25.3)
Change in fair value of derivatives/foreign exchange losses 0.6 (14.8)
Finance costs (8.4) (9.2)
Profit from ordinary activities before income tax 258.5 101.8
Income tax expense – –
Net profit for the year 258.5 101.8
Other comprehensive income net of tax – –
Total comprehensive income for the year 258.5 101.8
MOVEMENT IN CONSOLIDATED RETAINED EARNINGS 2017 2016
Retained profits at the beginning of the financial year 646.2 679.7
Net profit for the year 258.5 101.8
Dividend provided for or paid (210.2) (135.3)
Retained profits at the end of the financial year 694.5 646.2
¬89 88¬ Alumina Limited Annual Report 2017
For
per
sona
l use
onl
y
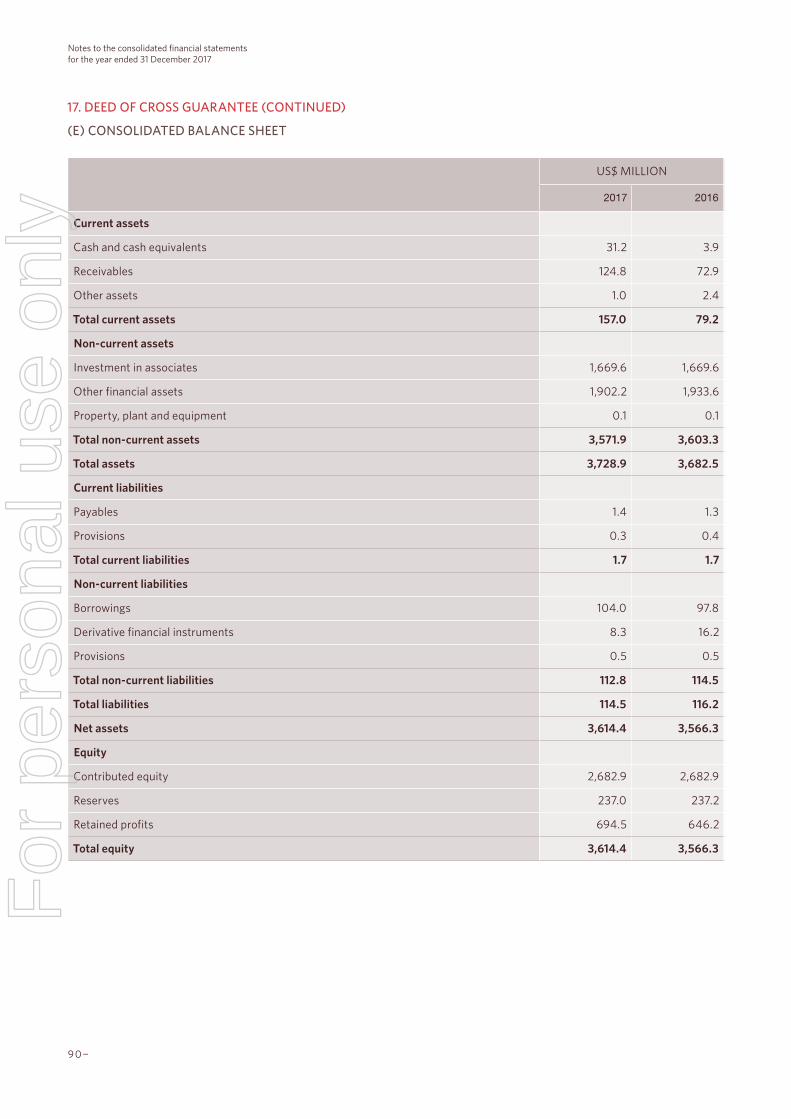
Notes to the consolidated financial statements for the year ended 31 December 2017
US$ MILLION
2017 2016
Current assets
Cash and cash equivalents 31.2 3.9
Receivables 124.8 72.9
Other assets 1.0 2.4
Total current assets 157.0 79.2
Non-current assets
Investment in associates 1,669.6 1,669.6
Other financial assets 1,902.2 1,933.6
Property, plant and equipment 0.1 0.1
Total non-current assets 3,571.9 3,603.3
Total assets 3,728.9 3,682.5
Current liabilities
Payables 1.4 1.3
Provisions 0.3 0.4
Total current liabilities 1.7 1.7
Non-current liabilities
Borrowings 104.0 97.8
Derivative financial instruments 8.3 16.2
Provisions 0.5 0.5
Total non-current liabilities 112.8 114.5
Total liabilities 114.5 116.2
Net assets 3,614.4 3,566.3
Equity
Contributed equity 2,682.9 2,682.9
Reserves 237.0 237.2
Retained profits 694.5 646.2
Total equity 3,614.4 3,566.3
17. DEED OF CROSS GUARANTEE (CONTINUED)
(E) CONSOLIDATED BALANCE SHEET
¬91 90¬ Alumina Limited Annual Report 2017
For
per
sona
l use
onl
y

Notes to the consolidated financial statements for the year ended 31 December 2017
18. NEW ACCOUNTING STANDARDS AND INTERPRETATIONS NOT YET ADOPTED
Certain new accounting standards and interpretations have been published that are not mandatory for the 31 December 2017 reporting period and have not been early adopted by the Group. The Group’s assessment of the impact of these new standards and interpretations is set out below:
AASB 15 REVENUE FROM CONTRACTS WITH CUSTOMERS (EFFECTIVE 1 JANUARY 2018)
The AASB has issued a new standard for the recognition of revenue. AASB 15 Revenue from Contracts with Customers replaces AASB 118 which covers contracts for goods and services and AASB 111 which covers construction contracts. The new standard is based on the principle that revenue is recognised when control of a good or a service transfers to a customer. Therefore, the notion of control replaces the existing notion of risks and rewards. The standard permits a modified retrospective approach for the adoption. Under this approach entities will recognise transitional adjustments to retained earnings on the date of initial application (e.g. 1 January 2017), i.e. without restating the comparative period. They will only need to apply the new rules to contracts that are not completed as of the date of initial application. The standard is not applicable until 1 January 2018 but is available for early adoption.
The Group does not expect a material impact from implementation of AASB 15.
AASB 16 LEASES (EFFECTIVE 1 JANUARY 2019)
The new standard will replace AASB 117 Leases. Once effective, the new requirements will apply to new and pre-existing lease arrangements. The key changes have been outlined below:
• Lessees will recognise a lease liability reflecting future lease payments and a ‘right-of-use asset’ for virtually all lease contracts (optional exemption available for certain short-term leases and leases of low-value assets).
• Lessees will have to present interest expense on the lease liability and depreciation on the right-of-use assets in their income statement.
• Lease payments that reflect interest on the lease liability can be presented as an operating cash flow. Cash payments for the principal portion of the lease liability should be classified within financing activities. Payments for short-term leases and for leases of low-value assets could be presented within operating activities.
The Group is in the process of assessing the impact of AASB 16.
DIRECTORS’ DECLARATION
In the Directors’ opinion:
a) the financial statements and notes set out on pages 60 to 91 are in accordance with the Corporations Act 2001, including: (i) complying with Accounting Standards, the Corporations Regulations 2001 and other mandatory professional reporting requirements; and (ii) giving a true and fair view of the consolidated entity’s financial position as at 31 December 2017 and of its performance for the financial year ended on that date; and
b) there are reasonable grounds to believe that the Company will be able to pay its debts as and when they become due and payable; and
c) at the date of this declaration, there are reasonable grounds to believe that the members of the Extended Closed Group identified in Note 3 will be able to meet any obligations or liabilities to which they are, or may become, subject by virtue of the deed of cross guarantee described in Note 17.
The financial statements also comply with International Financial Reporting Standards as issued by the International Accounting Standards Board.
The Directors have been given the declarations by the Chief Executive Officer and Chief Financial Officer required by section 295A of the Corporation Act 2001.
This declaration is made in accordance with a resolution of the Directors.
GJ PIZZEY Chairman 22 March 2018
¬91 90¬ Alumina Limited Annual Report 2017
For
per
sona
l use
onl
y

¬93 92¬ Alumina Limited Annual Report 2017
INDEPENDENT AUDITOR’S REPORT
To the members of Alumina Limited
REPORT ON THE AUDIT OF THE FINANCIAL REPORT
OUR OPINION
In our opinion: The accompanying financial report of Alumina Limited (the Company) and its controlled entities (together, the Group) is in accordance with the Corporations Act 2001, including:
a) giving a true and fair view of the Group’s financial position as at 31 December 2017 and of its financial performance for the year then ended
b) complying with Australian Accounting Standards and the Corporations Regulations 2001.
WHAT WE HAVE AUDITED
The Group financial report comprises:
• the consolidated balance sheet as at 31 December 2017
• the consolidated statement of profit or loss and other comprehensive income for the year then ended
• the consolidated statement of changes in equity for the year then ended
• the consolidated statement of cash flows for the year then ended
• the notes to the consolidated financial statements, which include a summary of significant accounting policies
• the Directors’ declaration.
BASIS FOR OPINION
We conducted our audit in accordance with Australian Auditing Standards. Our responsibilities under those standards are further described in the Auditor’s responsibilities for the audit of the financial report section of our report.
We believe that the audit evidence we have obtained is sufficient and appropriate to provide a basis for our opinion.
INDEPENDENCE
We are independent of the Group in accordance with the auditor independence requirements of the Corporations Act 2001 and the ethical requirements of the Accounting Professional and Ethical Standards Board’s APES 110 Code of Ethics for Professional Accountants (the Code) that are relevant to our audit of the financial report in Australia. We have also fulfilled our other ethical responsibilities in accordance with the Code.
PricewaterhouseCoopers, ABN 52 780 433 757
2 Riverside Quay, SOUTHBANK VIC 3006, GPO Box 1331, MELBOURNE VIC 3001
T: 61 3 8603 1000, F: 61 3 8603 1999, www.pwc.com.au
Liability limited by a scheme approved under Professional Standards Legislation.
¬93 92¬ Alumina Limited Annual Report 2017
For
per
sona
l use
onl
y

¬93 92¬ Alumina Limited Annual Report 2017
OUR AUDIT APPROACH
An audit is designed to provide reasonable assurance about whether the financial report is free from material misstatement. Misstatements may arise due to fraud or error. They are considered material if individually or in aggregate, they could reasonably be expected to influence the economic decisions of users taken on the basis of the financial report.
We tailored the scope of our audit to ensure that we performed enough work to be able to give an opinion on the financial report as a whole, taking into account the geographic and management structure of the Group, its accounting processes and controls and the industry in which it operates.
Alumina Limited’s (Alumina) sole business undertaking is investing globally in bauxite mining, alumina refining with some minor alumina-based chemical businesses and aluminium smelting operations. All of these business activities are conducted through Alumina’s 40% investment in several entities which collectively form Alcoa World Alumina and Chemicals (AWAC). Alcoa Corporation owns the remaining 60% of AWAC and is the manager of these business activities. Alumina participates in AWAC through the Strategic Council, which consists of three members appointed by Alcoa Corporation and two members appointed by Alumina. As Alumina does not control or operate the AWAC assets, its role involves strategic investment management on behalf of its shareholders. Accordingly, this investment has been determined to be an associate and is accounted for by the equity method.
Materiality
Audit Scope
Key audit matters
MATERIALITY AUDIT SCOPE KEY AUDIT MATTERS
• For the purpose of our audit we used an overall materiality of $22 million, which represents approximately 1% of the Group’s total assets.
• We applied this threshold, together with qualitative considerations, to determine the scope of our audit and the nature, timing and extent of our audit procedures and to evaluate the effect of misstatements on the financial report as a whole.
• We chose total assets as a benchmark primarily because of the nature of Alumina’s operations, noting that it is a generally accepted benchmark for investment management companies.
• We selected 1% based on our professional judgement, noting that it is within a range of commonly accepted thresholds.
• Component auditors assisted in performing audit work over the AWAC financial statements on behalf of the Group engagement team. Specific instructions were issued to the component audit teams, including risk analysis and materiality.
• We audited the equity accounting for Alumina’s 40% investment in AWAC. This process included auditing certain adjustments made by Alumina to convert the AWAC results (which were prepared under US GAAP), to comply with Australian Accounting Standards (AAS).
• We audited the remainder of Alumina’s financial report.
• Our audit also focused on where the Group made subjective judgements; for example, significant accounting estimates involving assumptions and inherently uncertain future events
• Amongst other relevant topics, we communicated the following key audit matters to the Audit and Risk Management Committee:
• Equity accounting for Alumina’s investment in AWAC
• Impairment indicator assessment for Alumina’s equity accounted investment in AWAC
• These are further described in the Key audit matters section of our report.
¬93 92¬ Alumina Limited Annual Report 2017
For
per
sona
l use
onl
y

¬95 94¬ Alumina Limited Annual Report 2017
KEY AUDIT MATTERS
Key audit matters are those matters that, in our professional judgement, were of most significance in our audit of the financial report for the current period. The key audit matters were addressed in the context of our audit of the financial report as a whole, and in forming our opinion thereon, and we do not provide a separate opinion on these matters. Further, any commentary on the outcomes of a particular audit procedure is made in that context.
KEY AUDIT MATTERHOW OUR AUDIT ADDRESSED
THE KEY AUDIT MATTER
Equity accounting for Alumina’s investment in AWAC
(Refer to note 2 in the financial report)
Alumina’s equity accounted investment in AWAC is carried at $2.3 billion and its share of the net profit of AWAC accounted for using the equity method is $360 million.
AWAC accounts are prepared under US Generally Accepted Accounting Principles (US GAAP). There are significant differences between US GAAP and AAS. For AWAC entities other than Alcoa of Australia Limited and Enterprise Partnership, which already prepare accounts under AAS, adjustments are required to convert amounts accounted for under US GAAP to comply with AAS.
We determined the equity accounting to be a key audit matter because of the magnitude of the Investment in associates balance and the complexity of the adjustments required by the Group to convert amounts accounted for under US GAAP to AAS.
Judgement is involved in determining the differences in the accounting for areas such as the valuation of inventory, asset retirement obligation provisions and defined benefit superannuation plans. In arriving at the value of these US GAAP to AAS adjustments, the Group is required to use accounting estimates and significant judgement.
To assess the equity accounting of Alumina’s 40% investment in AWAC, we performed the following procedures amongst others:
• Agreed the equity accounting schedule prepared by the Group to the financial statements of AWAC (as audited by component auditors under our instruction).
• Assessed the appropriateness and completeness of material US GAAP to AAS adjustments.
• Considered whether other transactions that had occurred during the year required a different treatment under AAS compared with US GAAP.
• Reconciled the opening equity accounted investment balance to the final position reflected in the financial report. To do this we:
• Recalculated the share of net profit and changes in reserves of AWAC by examining the audited AWAC financial statements and recalculating Alumina’s 40% share.
• Compared dividends, distributions and capital returns received from AWAC and additional investments made through cash calls to the relevant declaration documents and bank statements.
• We also evaluated the impairment indicator assessment performed by the Group in relation to the investment balance (refer to the following Key audit matter)
Impairment indicator assessment for Alumina’s equity accounted investment in AWAC
(Refer to note 2c in the financial report)
Alumina’s equity accounted investment in AWAC ($2.3 billion) is the most material balance sheet item in the consolidated financial report.
We therefore focused on the assessment which was performed by Alumina to determine whether there was any objective evidence that the equity accounted investment in AWAC could be impaired as at 31 December 2017.
The long term alumina price is the key assumption to which the valuation of AWAC is most sensitive.
Alumina’s conclusion was that there was no indicator for impairment for the year ended 31 December 2017
• To evaluate the Group’s impairment indicator assessment of the AWAC investment we performed the following procedures amongst others:
• Developed an understanding of the process by which the Group conducted the impairment indicator assessment.
• Compared the Group’s long term alumina price assumption to economic analyst and industry forecasts. We found that the long term alumina price assumption used by the Group was consistent with market data and industry research.
• Compared the Group’s market capitalisation to its net assets as at 31 December 2017, noting that market capitalisation exceeded net assets by approximately $3.2 billion.
• Evaluated the Group’s assessment of whether there were any other external or internal sources of information that could indicate that the investment may be impaired.
For
per
sona
l use
onl
y
¬95 94¬ Alumina Limited Annual Report 2017
OTHER INFORMATION
The Directors are responsible for the other information. The other information comprises the information included in the Group’s annual report for the year ended 31 December 2017, including:
• At a Glance
• Chairman and Chief Executive Officer’s Report
• Sustainability
• Board of Directors
• Director’s Report
• Operating and Financial Review
• Letter by Chair of the Compensation Committee
• Shareholder Information
• Financial History
but does not include the financial report and our auditor’s report thereon.
Our opinion on the financial report does not cover the other information and accordingly we do not express any form of assurance conclusion thereon.
In connection with our audit of the financial report, our responsibility is to read the other information identified above and, in doing so, consider whether the other information is materially inconsistent with the financial report or our knowledge obtained in the audit, or otherwise appears to be materially misstated.
AUDITOR’S RESPONSIBILITIES FOR THE AUDIT OF THE FINANCIAL REPORT
Our objectives are to obtain reasonable assurance about whether the financial report as a whole is free from material misstatement, whether due to fraud or error, and to issue an auditor’s report that includes our opinion. Reasonable assurance is a high level of assurance, but is not a guarantee that an audit conducted in accordance with the Australian Auditing Standards will always detect a material misstatement when it exists. Misstatements can arise from fraud or error and are considered material if, individually or in the aggregate, they could reasonably be expected to influence the economic decisions of users taken on the basis of the financial report.
A further description of our responsibilities for the audit of the financial report is located at the Auditing and Assurance Standards Board website at: http://www.auasb.gov.au/auditors_responsibilities/ar1.pdf. This description forms part of our audit report.
RESPONSIBILITIES OF THE DIRECTORS FOR THE FINANCIAL REPORT
The Directors of the Company are responsible for the preparation of the financial report that gives a true and fair view in accordance with Australian Accounting Standards and the Corporations Act 2001 and for such internal control as the Directors determine is necessary to enable the preparation of the financial report that gives a true and fair view and is free from material misstatement, whether due to fraud or error.
In preparing the financial report, the Directors are responsible for assessing the ability of the Group to continue as a going concern, disclosing, as applicable, matters related to going concern and using the going concern basis of accounting unless the Directors either intend to liquidate the Group or to cease operations, or have no realistic alternative but to do so.
If, based on the work we have performed, we conclude that there is a material misstatement of this other information, we are required to report that fact. We have nothing to report in this regard.
For
per
sona
l use
onl
y

¬97 96¬ Alumina Limited Annual Report 201796¬
REPORT ON THE REMUNERATION REPORT
OUR OPINION ON THE REMUNERATION REPORT
We have audited the remuneration report included in pages 38 to 61 of the Directors’ report for the year ended 31 December 2017.
In our opinion, the remuneration report of Alumina Limited for the year ended 31 December 2017 complies with section 300A of the Corporations Act 2001.
RESPONSIBILITIES
The Directors of the Company are responsible for the preparation and presentation of the remuneration report in accordance with section 300A of the Corporations Act 2001. Our responsibility is to express an opinion on the remuneration report, based on our audit conducted in accordance with Australian Auditing Standards.
JOHN O’DONOGHUE Partner Melbourne 22 MARCH 2018
PricewaterhouseCoopers
For
per
sona
l use
onl
y

¬97 96¬ Alumina Limited Annual Report 2017Alumina Limited Annual Report 2017
DETAILS OF SHAREHOLDINGS AND SHAREHOLDERS LISTED SECURITIES – 28 FEBRUARY 2018
Alumina Limited has 2,879,843,498 issued fully paid ordinary shares.
SIZE OF SHAREHOLDING AS AT 28 FEBRUARY 2018
Range Total Holders Units % of Issued Capital
1-1,000 18,000 8,496,227 0.30
1,001-5,000 18,783 46,357,743 1.61
5,001-10,000 5,884 43,662,082 1.52
10,001-100,000 6,070 151,139,024 5.25
100,001 Over 333 2,630,188,422 91.32
Total 49,697 2,879,843,498 100.00
Of these, 5,124 shareholders held less than a marketable parcel of $500 worth of shares (225) a total of 642,691 shares. In accordance with ASX Business Rules, the last sale price on the Company’s shares on the ASX on 28 February 2018 was used to determine the number of shares in a marketable parcel.
Rank Total Holders % Units
1 HSBC CUSTODY NOMINEES (AUST) 838,057,497 29.10
2 J P MORGAN NOMINEES AUSTRALIA LIMITED 486,989,648 16.91
3 CITICORP NOMINEES PTY LTD 274,617,688 9.54
4 CITIC RESOURCES AUSTRALIA PTY LTD 219,617,657 7.63
5 BESTBUY OVERSEAS CO LTD 154,114,590 5.35
6 NATIONAL NOMINEES 105,529,948 3.66
7 BNP PARIBAS NOMINEES PTY LTD <AGENCY LENDING DRP A/C> 76,296,076 2.65
8 BESTBUY OVERSEAS CO LTD 76,145,410 2.64
9 CITIC RESOURCES AUSTRALIA PTY LTD 59,282,343 2.06
10 CITIC AUSTRALIA PTY LTD 39,799,208 1.38
11 MORGAN STANLEY AUSTRALIA SECURITIES (NOMINEE) PTY LIMITED <NO 1 ACCOUNT> 33,257,475 1.15
12 BNP PARIBAS NOMS PTY LTD <DRP> 31,736,951 1.10
13 UBS NOMINEES PTY LTD 30,891,180 1.07
14 HSBC CUSTODY NOMINEES (AUSTRALIA) LIMITED <NT-COMNWLTH SUPER CORP A/C> 15,565,323 0.54
15 ARGO INVESTMENTS LIMITED 12,429,285 0.43
16 CITICORP NOMINEES PTY LIMITED <COLONIAL FIRST STATE INV A/C> 11,744,182 0.41
17 AMP LIFE 11,720,098 0.41
18 SHARE DIRECT NOMINEES PTY LTD <10026 A/C> 8,964,000 0.31
19 NATIONAL NOMINEES LIMITED <DB A/C> 7,308,737 0.25
20 AUSTRALIAN FOUNDATION 6,413,142 0.22
Totals: Top 20 holders of ORDINARY FULLY PAID SHARES (Total) 2,500,480,438 86.83
Total Remaining Holders Balance 379,363,060 13.17
¬97
For
per
sona
l use
onl
y
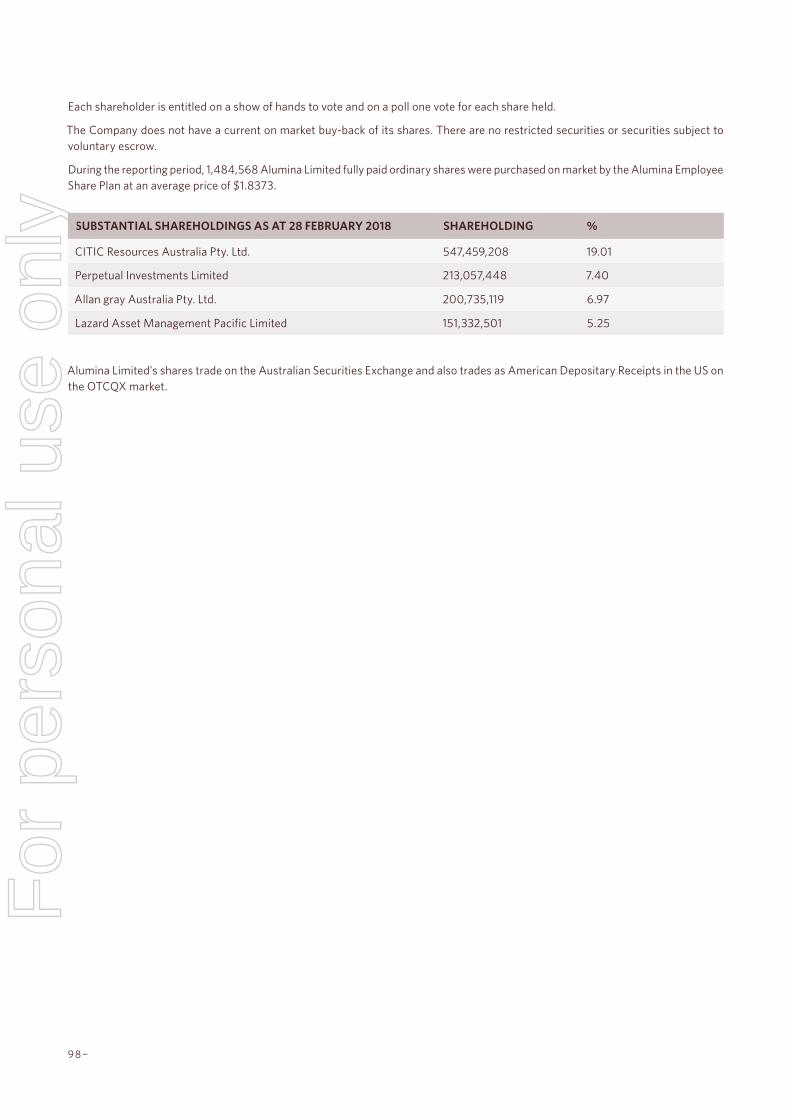
Each shareholder is entitled on a show of hands to vote and on a poll one vote for each share held.
The Company does not have a current on market buy-back of its shares. There are no restricted securities or securities subject to voluntary escrow.
During the reporting period, 1,484,568 Alumina Limited fully paid ordinary shares were purchased on market by the Alumina Employee Share Plan at an average price of $1.8373.
Alumina Limited's shares trade on the Australian Securities Exchange and also trades as American Depositary Receipts in the US on the OTCQX market.
SUBSTANTIAL SHAREHOLDINGS AS AT 28 FEBRUARY 2018 SHAREHOLDING %
CITIC Resources Australia Pty. Ltd. 547,459,208 19.01
Perpetual Investments Limited 213,057,448 7.40
Allan gray Australia Pty. Ltd. 200,735,119 6.97
Lazard Asset Management Pacific Limited 151,332,501 5.25
¬99 98¬ Alumina Limited Annual Report 2017
For
per
sona
l use
onl
y

Financial History
ALUMINA LIMITED AND CONTROLLED ENTITIES
AS AT 31 DECEMBER
2017
US$ MILLIONS
2016
US$ MILLIONS
2015
US$ MILLIONS
2014
US$ MILLIONS
2013
US$ MILLIONS
Revenue from continuing operations 0.6 0.6 0.1 0.1 0.3
Share of net profit/(loss) of associates accounted for using the equity method
360.4 18.1 109.9 (73.6) (97.4)
Other income – – – 1.5 137.1
General and administrative expenses (13.6) (25.7) (11.9) (13.5) (17.2)
Change in fair value of derivatives/foreign exchange losses 0.7 (14.1) (3.2) 1.6 3.0
Finance costs (8.3) (9.1) (6.6) (13.6) (25.3)
Income tax (expense)/benefit from continuing operations – – – (0.8) –
Net (loss)/profit attributable to owners of Alumina Limited 339.8 (30.2) 88.3 (98.3) 0.5
Total assets 2,342.9 2,117.8 2,110.7 2,543.2 2,964.0
Total liabilities 108.9 110.9 127.8 119.2 170.6
Net assets 2,234.0 2,006.9 1,982.9 2,424.0 2,793.4
Shareholders’ funds 2,234.0 2,006.9 1,982.9 2,424.0 2,793.4
Dividends paid 210.22 135.3 171.2 – –
Dividends received from AWAC 278.1 150.2 61.4 16.0 100.0
Statistics
Dividends declared per ordinary share US13.5c US6.0c US6.3c US1.6c –3
Dividend payout ratio 62% – 202% – –
Return on equity1 15.8% (1.5)% 3.9% (3.5)% 0.02%
Gearing (net debt to equity) 2.5% 4.0% 4.8% 3.45% 4.6%
Net tangible assets backing per share $0.69 $0.61 $0.60 $0.77 $0.91
1 Based on net (loss)/profit attributable to owners of Alumina Limited.2 Final dividend for the financial year ended 31 December 2016, declared and paid in 2017 and interim dividend for the year ended 31 December 2017, declared
and paid in 2017.3 No interim or final dividend declared for the year ended 31 December 2013.
¬99 98¬ Alumina Limited Annual Report 2017 ¬99
For
per
sona
l use
onl
y

100¬
—
ALUMINA LIMITED
ABN 85 004 820 419 Registered Corporate Head Office Level 12, IBM Centre 60 City Road Southbank Victoria 3006 Australia
GPO Box 5411 Melbourne Victoria 3001 Australia Telephone +61 (0)3 8699 2600 Facsimile +61 (0)3 8699 2699 Website www.aluminalimited.com Email [email protected]
—
AMERICAN DEPOSITARY RECEIPTS
BNY Mellon shareowner services telephone and internet correspondence: Toll free number (for callers within the USA) 1-888-BNY-ADRS (1-888-269-2377) Telephone (for non-US callers) +1 201-680-6825 Website: www.bnymellon.com/shareowner Email: [email protected]
Shareowner correspondence should be mailed to: BNY Mellon Shareowner Services P.O. Box 505000 Louisville, KY 40233-5000
Overnight Shareowner correspondence should be mailed to: 462 South 4th Street Suite 1600 Louisville, KY 40202 UNITED STATES
—
SHARE REGISTRY
Computershare Investor Services Pty Limited Yarra Falls 452 Johnston Street Abbotsford Victoria 3067 Australia
GPO Box 2975 Melbourne Victoria 3001 Australia Telephone +61(0)3 9415 4027 Or 1300 556 050 (for callers within Australia) Facsimile +61(0)3 9473 2500 Email [email protected]
FSC LOGO HERE
Neither Alumina Limited nor any other person warrants or guarantees the
future performance of Alumina Limited or any return on any investment made in
Alumina Limited securities. This document may contain certain forward-looking
statements, including forward-looking statements within the meaning of the US
Private Securities Litigation Reform Act of 1995. The words “anticipate”, “aim”,
“believe”, “expect”, “project”, “estimate”, “forecast”, “intend”, “likely”, “should”,
“could”, “will”, “may”, “target”, “plan” and other similar expressions (including
indications of “objectives”) are intended to identify forward-looking statements.
Indications of, and guidance on, future financial position and performance and
distributions, and statements regarding Alumina Limited’s future developments
and the market outlook, are also forward-looking statements.
Any forward-looking statements contained in this document are not guarantees
of future performance. Such forward-looking statements involve known and
unknown risks, uncertainties and other factors, many of which are beyond the
control of Alumina Limited and its directors, officers, employees and agents that
may cause actual results to differ materially from those expressed or implied in
such statements. Those risks, uncertainties and other factors include (without
limitation): (a) material adverse changes in global economic conditions, alumina
or aluminium industry conditions or the markets served by AWAC; (b) changes
in production or development costs, production levels or sales agreements; (c)
changes in laws, regulations or policies; (d) changes in alumina or aluminium
prices or currency exchange rates; (e) Alumina Limited does not hold a majority
interest in AWAC and decisions made by majority vote may not be in the best
interests of Alumina Limited; and (f) the other risk factors summarised in Alumina
Limited’s Annual Report 2017. Readers should not place undue reliance on
forward-looking statements. Except as required by law, Alumina Limited disclaims
any responsibility to update or revise any forward-looking statements to reflect
any new information or any change in the events, conditions or circumstances on
which a statement is based or to which it relates.
Design ERD.COM.AU Print BAMBRA PRESS
For
per
sona
l use
onl
y

For
per
sona
l use
onl
y

For
per
sona
l use
onl
y