Embed Size (px)
Citation preview

ANNUAL REPORT2019
For
per
sona
l use
onl
y

1
CORPORATE INFORMATION
ABN 43 122 911 399
Board of Directors and Senior Management
Name
Mr Charles Lew
Mr Jean Claude Steinmetz
Mr Neil Hackett
Mr Malcolm Randall
Mr Guy Robertson
Joint Company Secretaries
Mr Neil Hackett
Mr Guy Robertson
Registered office
Level 8, Westralia Plaza 167 St Georges Terrace Perth WA 6000 Telephone: +61 (8) 6117 6118
Principal place of business
Level 8, Westralia Plaza 167 St Georges Terrace Perth WA 6000 Australia
Share register
Security Transfer Registrars Pty Ltd 770 Canning Highway APPLECROSS WA 6153 Telephone: +61 (8) 9315 2333
Bankers
HSBC – Perth WA 6000 Australia Westpac - Sydney NSW 2000 Australia
Auditors
PricewaterhouseCoopers 125 St Georges Terrace PERTH WA 6000
Website
www.hastingstechmetals.com
Securities Exchange
Australian Securities Exchange
ASX Code: HAS
For
per
sona
l use
onl
y

2
Contents Page
Letter from the Chairman 3
Directors 5
Review of Operations 6
Annual Ore Reserves and Mineral Resources Statement 23
Directors’ Report 28
Corporate Governance Statement 42
Auditor’s Independence Declaration 43
Consolidated Statement of Profit or Loss and Other Comprehensive Income 44
Consolidated Statement of Financial Position 45
Consolidated Statement of Changes in Equity 46
Consolidated Statement of Cash Flows 47
Notes to the Financial Statements 48
Directors’ Declaration 80
Independent Auditor’s Report 81
Additional Shareholder Information 86
For
per
sona
l use
onl
y

3
LETTER FROM THE CHAIRMAN
Dear Shareholders,
In the last 12 months, we have continued to make steady progress in advancing the Yangibana Project with the
objective of bringing our mixed rare earth carbonate (MREC) containing high neodymium and praseodymium (NdPr) into
production. It is my pleasure to outline below the major milestones and activities that our Company, Hastings
Technology Metals Ltd (Hastings or the Company) has achieved this financial year.
Considerable amount of work over this period has been to define the geological resource and reserves, optimize the
process flow, carry out detailed design and engineering work required for the setting up of a process plant, negotiations
on equipment supply and no less important securing project finance. We were granted an early works permit which
allowed us to initiate infrastructure work and bring on site a 340 rooms accommodation camp ready for occupation when
we commence mine construction.
On geology, we reported in January this year a 34% increase in probable ore reserves to 10.35 million tonnes at 1.22%
TREO including 0.43%Nd2O3+Pr6O11, supporting an initial 11 years operational life for the project based on the JORC
certified resource of 21.7 million tonnes.
This was followed by a review of the capex which was revised upwards to A$427m from A$335m at the time of the DFS
published in November 2017. Your board decided that for reasons of bankability under its proposed Owners’ Team and
EPCM (Engineering, Procurement, Construction and Management) contracting strategy, it will only engage and procure
from global Tier 1 mining and process plant equipment suppliers with established capabilities to provide equipment
performance guarantees and field support and backup. Accordingly, major long lead time equipment supply contracts
were awarded to companies who are globally recognised suppliers of engineering, equipment and service solutions to
the mining industry i) FLSmidth, a Danish market-leading global supplier for the design and supply of an acid-bake
rotary kiln, ii) Total Air Pollution Control/Tialoc (an Australian and German joint venture) for the design and supply of the
kiln’s off gas scrubbing plant, and iii) Outotec (Finland) for SAG mill and thickeners.
The Project includes the development of five open pit mines, groundwater abstraction, on-site processing for the ore,
tailings storage facilities, access and haul roads, and supporting infrastructure including accommodation facilities,
administration buildings and extension to an existing air strip.
The Company is continually looking at optimising its process flow and applying new technologies which improves on ore
recovery and operational efficiencies. Accordingly, it undertook a second pilot plant beneficiation test which increased
recoveries from 70% (at the time of the DFS) to 80% providing further confirmation of the technical credibility and
commercial viability of the project. In addition, we conducted a test on ore sorting with encouraging results. The sorter
was able to reject 37% of the mass supplied, retaining 92.2% of the total rare earth oxides (TREO), with the best
improvement seeing an upgrade of 157% in the TREO grade. This result indicates potential for further optimisation not
captured in the current project scope.
Key to the timeline for project execution and commencement of construction are state and federal government approvals.
I am pleased that we passed another key milestone when we received environmental approval from the WA Minister for
Environment, the Honourable Stephen Dawson in August. This paved the way for the remaining permits, amongst which
is the also the approval from the Commonwealth Minister of Environment which is expected later this year.
In the last two years, I travelled repeatedly to China, Japan and Germany to explore and understand the market for our
carbonate product when we come into production. The results of those efforts saw the conclusion of an offtake
Memorandum Of Understanding (MOU) with Thyssenkrupp in February last year which led to our belief that we should
focus on serving the German market due to its strong global leadership in the automotive industry and the emerging
trend and future demand for Electric Vehicles (EV).
Hence, by July last year, after an Expression of Interest exercise to global tier 1 project finance banks, we mandated the
German state bank, KfW IPEX-Bank GmbH (KfW-Ipex) to assist us in the debt financing for our Yangibana project. The
high NdPr rare earth produced from our MREC is regarded to be a critical raw material for the manufacture of permanent
magnets which is used for EV motors. The German government operates an untied loan guarantee scheme (known as
UFK) which offers concessionary loan interest if the raw material supplied is considered strategic to German industry and
satisfies its eligibility criteria for UFK. In order to qualify for the UFK scheme, we are grateful to have the support of the
Schaeffler Group, (a leading global automotive, aerospace and industrial supplier committed to advanced and futuristic
e-mobility systems) in their application to Euler Hermes Aktiengesellschaft (the state agency responsible for
For
per
sona
l use
onl
y

4
administering the UFK scheme) for eligibility for UFK cover of a project finance loan of up to USD140 million
(approximately AUD200 million) being the major portion of debt financing. Eligibility was obtained in April and KfW-Ipex
would provide an additional loan of USD35 million (approximately AUD50 million) on commercial terms.
In June, as a result of the UFK eligibility, we concluded an offtake MOU with Schaeffler to supply a substantial volume of
our MREC over a period of 10 years. Schaeffler and Hastings will enter into a binding offtake contract in support of the
UFK loan.
In addition to the UFK loan, we were equally delighted that in March this year, the Australian government funded
Northern Australia Infrastructure Facility (NAIF) expressed their interest to further investigate the potential for NAIF to
provide debt finance with respect to the project’s infrastructure component, in particular where there are public benefits to
the Gascoyne region. As Hastings is the first mining company to mine in this area, we are pioneering a number of core
infrastructure services and with the support of NAIF, the spin offs from our project will benefit the traditional owners and
the local community for years to come. The granting of both loan facilities by UFK and NAIF are subject to due diligence
which currently are at an advanced stage.
NdPr demand is forecast to grow at a compound annual growth rate of about 9% per annum, particularly from 2021/22
onwards when automotive OEMs around the world has laid out plans to launch multiple new models of EV. This timing
coincides with Hastings targeted commencement date for production. Recent US-China trade tension has heightened the
need for global MNC customers to ensure security of supply of these critical minerals for EV and a range of other
sustainable and advanced technologies. Accordingly, apart from the Schaeffler and Thyssenkrupp offtake MOUs,
Hastings also signed an off-take contract with Sky Rock Baotou Rare Earth New Materials Co Ltd in November last year
to supply 2,500 tonnes per annum of MREC for 5 years.
Crucial to the execution of our project is the ongoing support of existing and new shareholders which has made it
possible for Hastings to advance the project. Approximately $38 million was raised this last financial year and a further
$3.5 million subsequent to financial year ended 30th June. Of these funds approximately $14 million was raised in a
placement at 21 cents per share in October last year resulting in the issue of approximately 66.5 million shares. We then
conducted another capital issue exercise that raised approximately $27 million which was done by way of a rights issue
and placement of approximately 159 million shares at 17 cents per share and 79.7 million options shares expiring 12
April 2022 at an exercise price of 25 cents. Since 2014, we have raised slightly more than $99m in equity capital with no
debt to date.
For our tenements in Brockman (in the Kimberley), the Company has made a decision to make an application for a
Mining Lease. The deposit has a resource of 41.4 million tonnes (JORC 2012) (comprising 32.3 million tonnes Indicated
Mineral Resources and 9.1 million tonnes Inferred Mineral Resources) at 0.21% TREO, including 0.18% HREO, plus
0.36% niobium oxides (Nb₂O₅) and 0.90% zirconium oxides (ZrO₂).
Since the first drill results in May 2014, we have not looked back. The Yangibana project has been blessed with a
unique ore body that is unrivalled. In the last 6 years, my focus has been to realise a dream which many of you have
shared with me. Over this period of time we have passed a number of significant milestones. Our achievements cannot
be possible without the support of our shareholders, equipment suppliers, traditional owners, people in the Upper
Gascoyne Shire and multiple other stakeholders including the many skilled consultants we engage to work on our
exciting project. I thank all of them for their efforts, dedication and cooperation in order to help us achieve our dream of
bringing the Yangibana project another step closer to production.
Finally, I thank my fellow directors, management and staff for their ongoing commitment and dedication in our aspiration
to produce a mixed rare earth carbonate from one of the world’s highest NrPr ore body.
One dream, one team.
Yours sincerely,
Charles Lew Executive Chairman 24 September 2019
For
per
sona
l use
onl
y

5
Directors
Charles Lew, Executive Chairman
Jean Claude Steinmetz, Non-Executive Director
Neil Hackett, Non-Executive Director
Malcolm Randall, Non-Executive Director
Guy Robertson, Executive Director
For
per
sona
l use
onl
y

6
REVIEW OF OPERATIONS
YANGIBANA PROJECT
OVERVIEW
In November 2017 the Group reported the successful completion of a Definitive Feasibility Study (DFS) for the Yangibana Project based on the production of Mixed Rare Earths Carbonate (MREC) rich in Neodymium (Nd) and Praseodymium (Pr), critical materials used in the manufacture of permanent magnets. In the twelve months following completion of the DFS, Hastings confirmed capital requirements, completed flotations pilot plant studies, and testing hydrometallurgical equipment for suitable duty capacity. Additional drilling in Bald Hill, Frasers and the Auer trend of deposits lead to increases in both the mineral resources and mining reserves. In November 2018, an updated JORC Mineral Resource estimation was completed by independent consultant Lynn Widenbar and Associates incorporating updated drilling results from Bald Hill, Fraser’s, Auer and Auer North deposits. Measured plus Indicated Resources increased by 6.7% to 13.38 million tonnes with Total Resources increasing to 21.67 million tonnes, containing >80,000 tonnes of neodymium and praseodymium oxide. Hastings then completed a 100kg/hr pilot processing circuit test, operating 24 hours per day continuously over 8 days at ALS Metallurgy in Balcatta, Western Australia. The flowsheet consisted of milling, rougher flotation, regrind and cleaner flotation stages. The flotation circuit selectively concentrated the rare earths-bearing mineral monazite into a final product whilst discarding 95% of the original rock waste mass. Flotation process design was reconfirmed, as the performance output of the pilot plant improved over the course of the 8 days. On the back of the updated resource a new mining reserve estimate was undertaken by a Mining Consultancy Group (Snowden) based on Measured and Indicated Mineral Resources at each of Bald Hill, Fraser’s, Auer, Auer North, Yangibana, Yangibana West and Yangibana North deposits. The updated reserve estimate remains surface mining focussed and involved whittle optimisations, pit designs and the development of new mine schedules. The bulk of the near surface mineralisation (at least to 100m vertical depth) is hosted by iron oxides and hydroxides termed ironstone, being the alteration products of the primary hosts ferro carbonatite and phoscorite intrusive veins. The main rare earths-bearing mineral is monazite which itself has locally undergone alteration at shallow depths (to 25m depth) to its hydrous equivalent rhabdophane and to rare earths-bearing Al-phosphates such as florencite. Ore Reserves tonnages from the new estimate increased by 34% to 10.35 million tonnes at 1.22%TREO including 0.43%Nd2O3+Pr6O11. The updated Ore Reserve extends mine life by 3 years, supporting a +10 year operational life for the Project. Since the DFS the project NPV has decreased by 4% to $447 million due to capital cost increases as a result of the board mandated decision to source, where possible, only Tier 1 process plant equipment suppliers with the capabilities to provide unrivalled equipment performance guarantees and field support and backup.
For
per
sona
l use
onl
y

7
Figure 1 – Beneficiation testwork in progress at ALS during 2019 2nd pilot plant program
MINERAL RESOURCES
The total resources as at October 2018 are as shown in Table 1. Note that in all resource tables rounding errors may appear. The resources are based on a 0.2%Nd2O3+Pr6O11 cut-off, with a minimum width of 1.0m. 0.5m of dilution at grade from both the hangingwall and the footwall is incorporated into the estimation.
Category Tonnes %TREO %Nd2O3+Pr6O11
Measured 4,727,000 1.17 0.42
Indicated 8,652,000 1.24 0.41
Inferred 8,294,000 1.09 0.36
TOTAL 21,673,000 1.17 0.39
Table 1 – Yangibana Project – Total JORC Mineral Resources October 2018
These figures represent a modest increase in total tonnes compared to the previous estimate from 20,996,000 (+3.2%), but a significant increase in Measured plus Indicated Resources (+6.7%), particularly in the Measured category that has increased by 21.1%.
Resources from the deposits that are planned for early development – Bald Hill and Fraser’s – are shown in Tables 2 and 3. Both deposits are within granted Mining Leases held 100% by Hastings.
Category Tonnes %TREO %Nd2O3+Pr6O11
Measured 3,345,000 0.99 0.40
Indicated 1,419,000 1.05 0.41
Inferred 1,487,000 0.90 0.34
TOTAL 6,251,000 0.98 0.39
Table 2 – Yangibana Project – Bald Hill JORC Mineral Resources October 2018
For
per
sona
l use
onl
y

8
Category Tonnes %TREO %Nd2O3+Pr6O11
Measured 398,000 1.55 0.66
Indicated 407,000 1.53 0.65
Inferred 670,000 0.71 0.30
TOTAL 1,475,000 1.17 0.49
Table 3 – Yangibana Project – Fraser’s JORC Mineral Resources October 2018
Drilling at Auer and Auer North (ASX Release titled “Successful Infill and Extension Drilling at Auer, Auer North” 5th October2018), the main increases in total resources are at these deposits as shown in Tables 4 and 5. Both deposits are within exploration licences held 100% by Hastings and the company will make applications for mining leases in the near future.
Category Tonnes %TREO %Nd2O3+Pr6O11
Indicated 1,004,000 1.09 0.39
Inferred 1,000,000 1.09 0.37
TOTAL 2,004,000 1.09 0.38
Table 4 – Yangibana Project – Auer JORC Mineral Resources October 2018
Category Tonnes %TREO %Nd2O3+Pr6O11
Indicated 462,000 1.09 0.37
Inferred 220,000 0.92 0.29
TOTAL 682,000 1.03 0.35
Table 5 – Yangibana Project – Auer North JORC Mineral Resources October 2018
Longitudinal sections of Auer and Auer North showing accumulation (metre % Nd2O3+Pr6O11) are shown in Figures 2 and 4 showing good potential for additional resources particularly at depth along the length of Auer and at Auer North Zone 1. Figures 3 and 5 show the resource categorisation for the two deposits.
Figure 2 – Yangibana Project – Auer m% longitudinal section October 2018
For
per
sona
l use
onl
y

9
Figure 3 – Yangibana Project – Auer Resource Categorisation October 2018
Figure 4 – Yangibana Project – Auer North m% longitudinal section October 2018
For
per
sona
l use
onl
y

10
Figure 5 – Yangibana Project – Auer North Resource Categorisation October 2018
JORC Mineral Resources for Yangibana, Yangibana West, and Yangibana North are shown in Tables 6, 7 and 8 respectively.
Category Tonnes %TREO %Nd2O3+Pr6O11
Indicated 1,318,000 0.86 0.41
Inferred 851,000 0.81 0.39
TOTAL 2,169,000 0.84 0.40
Table 6 – Yangibana Project – Yangibana JORC Mineral Resources October 2018
Of the total resources at Yangibana, 1,900,000 tonnes are within Mining Lease 09/165 held 100% by Hastings and 269,000 tonnes are within Mining Lease 09/163 in which Hastings holds a 70% interest.
Category Tonnes %TREO %Nd2O3+Pr6O11
Measured 114,000 1.58 0.45
Indicated 1,665,000 1.24 0.34
Inferred 758,000 1.34 0.35
TOTAL 2,536,000 1.29 0.35
Table 7 – Yangibana Project – Yangibana West JORC Mineral Resources October 2018
For
per
sona
l use
onl
y

11
Yangibana West lies within Mining Lease 09/160 held 100% by Hastings. The mineralisation is part of a continuous deposits that extends into Mining Lease 09/159, in which Hastings holds a 70% interest, as Yangibana North.
Category Tonnes %TREO %Nd2O3+Pr6O11
Measured 871,000 1.64 0.43
Indicated 1,924,000 1.84 0.47
Inferred 632,000 1.85 0.47
TOTAL 3,427,000 1.79 0.46
Table 8 – Yangibana Project – Yangibana North JORC Mineral Resources October 2018
JORC Mineral Resources at Simon’s Find are shown in Table 9. These resources are located within Mining Lease 09/158 and Exploration Licence 09/1943, both held 100% by Hastings. Additional drilling and metallurgical testwork will be undertaken prior to the application for a second Mining Lease.
Category Tonnes %TREO %Nd2O3+Pr6O11
Indicated 454,000 0.64 0.35
Inferred 855,000 0.67 0.35
TOTAL 1,309,000 0.66 0.35
Table 9 – Yangibana Project – Simon’s Find JORC Mineral Resources October 2018
JORC Inferred Mineral Resources at Gossan, Lion’s Ear, Hook and Kane’s Gossan are shown in Table 10. These deposits are all within Mining Lease 09/159 in which Hastings holds a 70% interest.
Inferred Tonnes %TREO %Nd2O3+Pr6O11
Gossan 289,000 1.52 0.33
Lion’s Ear 710,000 1.54 0.39
Hook 289,000 1.52 0.33
Kane’s Gossan 574,000 1.04 0.29
Table 10 – Yangibana Project – Gossan, Lion’s Ear, Hook and Kane’s Gossan JORC Inferred Resources October 2018
MINING ORE RESERVES
The 650 sq km Yangibana tenements are comprised of several ore deposits that have now been upgraded to Classified
status, plus numerous prospects that have received little evaluation to date and others that are yet to be tested. Of the
deposits with Ore Reserves, Bald Hill, Fraser’s, Auer, Auer North, Yangibana, and Yangibana West are within tenements
100% owned by Hastings, while Yangibana North and the eastern extremity of Yangibana are within tenements in which
Hastings holds a controlling 70% interest.
A Definitive Feasibility Study (DFS) completed in November 2017 detailed the Project, which will produce a Mixed Rare
Earth Carbonate (MREC) rich in Neodymium (Nd) and Praseodymium (Pr), critical materials used in the manufacture of
permanent magnets. The DFS produced a maiden Ore Reserve for the Bald Hill and Fraser’s deposits (both 100%
Hastings), which underpinned the first 5 years of mine life.
Ore Reserves from Auer, Auer North, Yangibana and Yangibana West (all 100% Hastings) were incorporated in July
2018 following completion of the required geotechnical investigations, mine design and mining cost estimates to a PFS
level or better.
For
per
sona
l use
onl
y

12
The January 2019 Ore Reserves have increased primarily on the improved results of the November 2018 updated
measured and indicated resource announcement and come from Auer and Auer North (Hastings 100% interest) plus
those from the Yangibana North deposit (Hastings 70% interest) which have been added to the Ore Reserve base.
The Project is designed to treat 1 million tonnes per annum (tpa) of ore with a processing plant that can produce up to
15,000t of MREC per annum. The current Ore Reserves of 10.35 million tonnes support a mine life of +10 years.
Since acquiring an interest in the Project in 2012, the Group has completed exploration programmes including:
• Mapping,
• Rock chip sampling,
• Hyperspectral survey and interpretation,
• Topographic and aerial photo surveys,
• Aeromagnetic and radiometric survey and interpretation, and
• RC and diamond drilling programs.
Eight phases of drilling including reverse circulation and diamond drilling have been completed by Hastings with more than 1,500 holes for 80,000m completed to date with coverage shown in Figure 6.
Figure 6 also shows the split between the Western and Eastern Belts. There is a significant difference in the mineralogy between these belts, with the Western Belt hosting higher Total Rare Earths Oxide (TREO) grades but with a lower proportional content of neodymium plus praseodymium compared to the Eastern Belt. Therefore, MREC produced from the Western Belt is of lower value than that produced from the Eastern Belt.
Each phase of drilling to date has steadily increased JORC resources of the various deposits and provided samples for metallurgical test work.
The Group has completed extensive DFS testwork to define the metallurgy for the Yangibana Project, culminating in pilot plant tests on a composite sample of material from Bald Hill and Fraser’s. This testwork has defined a process route entailing crushing, grinding, flotation, acid bake with water leach and precipitation of a Mixed Rare Earths Carbonate. Further PFS-level metallurgical testwork has established that the ore from each of Auer, Auer North, and Yangibana plus the shallower, low-siderite-bearing ore from Yangibana West and Yangibana North is compatible with this processing route.
Approximately 1 million tonnes per annum of ore will be brought to the Run of Mine (ROM) pad where the process flowsheet begins. Figure 6 provides a schematic of the overall Project layout including pits, roads and processing plant sites.
For
per
sona
l use
onl
y

13
Figure 6 - Yangibana Project Layout Plan
Early stages of the processing of the ore comprise comminution and beneficiation. The resulting beneficiated concentrate is upgraded approximately 20 times from the ROM ore, as demonstrated through the DFS, to a 25% TREO concentrate. This concentrate is further processed on site through a hydrometallurgical process that involves acid bake, water leaching, impurity removal and precipitation to produce up to 15,000 tpa of MREC. The MREC will contain 8,850 tpa Total Rare Earths Oxides, of which up to 3,400 tpa will be neodymium oxide (Nd2O3) + praseodymium oxide (Pr6O11).
The scope of work required for environmental approvals has been completed and the Project has progressed through a Public Environmental Review (PER) level of assessment by both the State and Commonwealth Governments. In June the Western Australia Environmental Protection Agency gave formal approval for the project to proceed to the final appeals period and Ministerial sign-off.
Cut-Off Parameters
A cut-off grade of 0.2% Nd2O3+Pr6O11 has been used to interpret the mineralisation of potential economic interest as neodymium (Nd) and praseodymium (Pr) are the most important sources of potential revenue from the project. The cut-off coincides generally with the visual geology of the deposits, with target minerals being hosted predominantly by ironstone, and to a much lesser extent by phoscorite or carbonate. A 0.5m “skin” of waste material on both the footwall
and hangingwall has been added to the interpreted mineralisation during the resource estimation process to account for dilution during the mining process. This dilution averages approximately 30% over the total resources.
The cut-off grade for the project was determined based on calculating revenue from recovered metal and selling and processing costs on a block-by-block (diluted) basis (parameters are below). Blocks with revenue greater than the sum of the processing and selling costs (approximately $90/t ore) were considered to be above the cut-off for processing.
For
per
sona
l use
onl
y

14
Mining Recovery and Dilution
The ironstone unit that hosts the bulk of the rare earths is visually distinct from the host rock providing good visual control for ore identification. RC grade control drilling will be carried out prior to mining to clearly delineate the mining boundaries of the blocks containing economic rare earths against blocks containing uneconomic waste material.
Blasting and mining near and in the ore zones is planned to minimise dilution and allow removal of the hanging-wall waste to expose and selectively mine the ore. Due to the high value of the ore, a high ore recovery is the focus of mining. As such, a 0.5m skin of waste material (dilution) was added to the ore zones on both the hangingwall and footwall sides to enable a 98% ore recovery assumption. This dilution was incorporated in the estimation of resources at each deposit.
Based on geotechnical studies pit optimisations incorporated a conservative 28o overall wall angle in the saprolite, and 35-40o to weathered and fresh granite. A 2% ore loss was also applied to each deposit.
Ground Water
Ground water at all deposits sits at approximately 45m below the natural surface level. Pits will be dewatered ahead of mining using bores or by in-pit pumping from sumps to dedicated temporary storage facilities at the pit edge. Stormwater will be managed in-pit using sumps pumped externally to the pit.
Waste Material
Waste from each pit is stored in adjacent waste dumps. Some of the Bald Hill pit is backfilled to minimise haulage distances. Ore is transferred either directly to the Run-Of-Mine (ROM) pad or to low-grade stockpiles by mining trucks. For pits remote from the plant the long hauls are achieved by road trains.
Optimisation Parameters
Pit optimisations were completed using the Whittle optimisation software to determine the economic mining limits for each deposit. Only Measured and Indicated Resources as reported in the ASX release titled “Increase In Measured and Indicated Resources at Yangibana Project” dated 22nd November 2018 were considered for processing.
Pits were then designed in stages to enable the required ore tonnages and grades and waste volumes to be optimised based on plant requirements.
Pit optimisation studies and designs have defined the total Probable Ore Reserves for the Yangibana Project as shown in Table 11. (Note that rounding discrepancies may appear in the following tables.)
Deposit Tonnes %TREO %Nd2O3+Pr6O11 Nd2O3+Pr6O11 as a % of TREO
Bald Hill 4,405,000 1.02 0.41 40
Fraser’s 638,000 1.61 0.68 42
Auer 728,000 1.12 0.41 37
Auer North 148,000 1.24 0.47 38
Yangibana 986,000 0.93 0.44 47
Yangibana West 1,478,000 1.23 0.34 28
Yangibana North 1,964,000 1.72 0.44 26
TOTAL 10,345,000 1.22 0.43 35
Table 11 - Yangibana Project - Probable Ore Reserves December 2018 For
per
sona
l use
onl
y

15
Probable Ore Reserves within tenements held 100% by Hastings are shown in Table 12 with those within tenements in which Hastings holds a 70% interest being shown in Table 13.
Deposit Tonnes %TREO %Nd2O3+Pr6O11 Nd2O3+Pr6O11 as a % of TREO
Bald Hill 4,405,000 1.02 0.41 40
Fraser’s 638,000 1.61 0.68 42
Auer 728,000 1.12 0.41 37
Auer North 148,000 1.24 0.47 38
Yangibana 876,000 0.97 0.46 47
Yangibana West 1,478,000 1.23 0.34 28
TOTAL 8,273,000 1.11 0.42
Table 12 - Yangibana Project - Probable Ore Reserves Within Tenements Held 100% by Hastings, December 2018
Deposit Tonnes %TREO %Nd2O3+Pr6O11 Nd2O3+Pr6O11 as a percent of TREO
Yangibana 110,000 0.60 0.28 47
Yangibana North 1,964,000 1.72 0.44 26
TOTAL 2,074,000 1.66 0.43
Table 13 - Yangibana Project - Probable Ore Reserves Within Tenements Held 70% by Hastings, December 2018
Table 12 represents the Eastern Belt Ore Reserves (Hastings 100%) and the grades of Nd2O3+Pr6O11 and TREO. The fraction of Nd2O3+Pr6O11 calculated as a percentage of TREO is also displayed. Table 13 represents the Western Belt Ore Reserves (Hastings 70%, JV 30%) and the grades of Nd2O3+Pr6O11 and TREO. The fraction of Nd2O3+Pr6O11
calculated as a percentage of TREO is also displayed.
Metallurgical Factors and Assumptions
The metallurgical flowsheet developed has been further refined on the basis for DFS-level assessments of the open pits. The metallurgical performance of samples from each satellite deposit has been assessed through standard bench-scale flowsheets and pilot plant studies, with the results of the testwork, as well as impacts on operating costs being used for the financial modelling and project economic assessments.
Process and Flowsheet
The metallurgical process comprises ore beneficiation followed by hydrometallurgical (hydromet) extraction to produce a valuable Mixed Rare Earths Carbonate (MREC) product. The beneficiation of ore includes crushing, grinding, rougher flotation, regrinding and cleaner flotation.
The hydromet processes include acid bake, water leach, impurity removal and MREC product precipitation.
The simple and effective metallurgical process flowsheet has been developed with the best-known available technology and industry experience by the Hastings Technical Team has been well tested in both laboratory scale and pilot scale during the Bald Hill and Fraser’s DFS. The unit processes selected for inclusion in the beneficiation and hydromet flowsheet are based on known technologies, both in rare earths (RE) industries and other mining applications.
Ore Feed Chemistry Tolerances
Assessment of satellite deposit mineralogy has shown the main RE-bearing mineral in the ore is monazite, which is consistent with the DFS ore sources. The main gangue minerals are iron oxides and hydroxides, biotite and apatite. Iron carbonate (siderite) has been identified at depth in Yangibana West and Yangibana North. The siderite boundary has been mapped and higher siderite-bearing ores have been excluded from the planned mill feed ore.
The ratio of RE elements contained in the monazite differs from that of Bald Hill and Fraser’s. This is reflected in the financial analysis but has no impact on the performance of the beneficiation flowsheet. Compared to DFS ore source
For
per
sona
l use
onl
y
16
concentrate, there may be some variation on concentrate mineralogy. This can be managed in the hydromet circuit through varying process conditions.
Testwork
Pilot plant campaigns for both the beneficiation flowsheet and the hydromet flowsheet have proved the circuits can be run on a continuous basis and that the selected unit processes are able to selectively concentrate the RE-bearing mineral monazite and remove or control the major product impurities of manganese, iron, thorium and uranium within acceptable product ranges. Over 50 kg of high-purity MREC produced from the pilot plant was sent to 11 customers for evaluation. The product quality is acceptable to separation plant operators.
Bench-scale testwork for the satellite deposits was mostly carried out in 2017 and 2018 at a number of commercial laboratories in Australia. Beneficiation testwork has been completed at KYSPY Met and ALS Metallurgy. Hydromet testwork has been completed at SGS Minerals Metallurgy and ANSTO.
Assessment of metallurgical processing performance of all satellite deposits was based on batch testwork, using the standard DFS comminution and flotation flowsheet, and comparison against the performance achieved with DFS ore sources. A standard acid bake and water leach test was completed for assessment of the hydromet performance. Liquor chemistry post-water leach was used to compare against DFS ore sources. A dedicated programme to understand the impact on the precipitation circuit performance from varying levels of Mn in the leach liquor was also undertaken.
Assessment of comminution requirements was undertaken on samples from each satellite deposit using a standard suite of comminution tests including SMC, Bond Ball Mill work index, Bond Crusher work index, and abrasion index. All results indicate that the satellite deposits are suitable for processing through the comminution circuit as designed in the DFS.
Detailed mineralogy and variability testwork has been carried out on multiple samples from each satellite deposit.
The metallurgical recovery for the additional production targets is 88.5% through the beneficiation circuit and 86.1% through the hydrometallurgy circuit, giving an overall metallurgical recovery of 76.2%.
Environmental Factors
Ongoing environmental studies include data from the 2014 Pre-Feasibility Study (PFS), but has been updated to reflect work carried out on the satellite deposits:
• Baseline flora and fauna: Flora and fauna surveys have been conducted over 55,650 ha of tenements. No
significant impact will occur to conservation significant terrestrial flora or fauna. Subterranean fauna sampling
has been completed at Yangibana West and is currently underway in the Auer, Auer North and Yangibana
areas.
• Baseline ground and surface water: A hydrology study has determined that mining and the majority of
infrastructure falls outside flood impact zones. Water from fractured rock aquifers will meet approximately 20%
of the project’s water demands. The remaining 80% of water demands will be sourced from the paleochannel
bore field. A pit dewatering assessment and post-closure pit lake modelling has been completed for Yangibana
West and is planned to be undertaken for Auer, Auer North and Yangibana pit areas.
• Baseline soil and radiation: Topsoil analysis was conducted and mapped over all but the Yangibana area, which
is planned. Baseline radiation surveys and radiation waste characterisation studies have determined that
naturally occurring radioactive materials (NORM) are associated with the orebody. Additional radiation surveys
are required over Auer, Auer North and Yangibana.
• Waste rock geochemical characterisation: Yangibana West pit lithologies have been characterised
geochemically and classify as benign and non-acid forming. The mineralogy of the project is not associated
with asbestiform minerals. Erodibility parameters were determined for waste rock and topsoil and inform the
waste rock landforms’ design for Yangibana West. Waste rock geochemical characterisation for Auer, Auer
North and Yangibana are initiated.
• Baseline air quality: A baseline air quality assessment and greenhouse gas emissions assessment have been
completed. A radiation impact assessment has determined that dust containing NORM will not pose a risk to
the surrounding environment.
• Cultural heritage: No impacts to known significant heritage sites will occur as a result of implementing the
project. Heritage surveys are currently underway for waste rock landform areas.
• Closure: A landform evolution study has identified landform design specifications that aim to ensure site
landforms will maintain their integrity for 1,000 years post-closure. A landform evolution study will be revised if
waste rock characterisation studies’ findings in Auer, Auer North and Yangibana differ from those of the DFS
ore sources.
For
per
sona
l use
onl
y

17
• The closure plan will be updated subject to outcomes of ongoing studies.
• Permits required and status of permits: A formal environmental impact assessment is currently set at a Public
Environmental Review (PER) level of assessment by both the State and Commonwealth Governments of the
DFS ore sources and Yangibana West. The PER documentation is currently being assessed. Referral for Auer,
Auer North and Yangibana will occur under the Environmental Protection Act (WA 1986).
Pre-Feasibility Study Parameters Parameter
Status of JORC Resources used for financial evaluation Measured and Indicated
Mining Method Open Pits
Mining Dilution – 0.5m skin on HW and FW incorporated in resource estimation
variable
Mining Recovery 98%
Processing Route Flotation, Acid Bake – Water Leach and MREC Precipitation
Overall Processing Recovery (TREO) – Ore to MREC 76.2%
Maximum Target Production Rate (Mixed Rare Earths Carbonate) 15,000 tpa
Maximum Target Contained Nd2O3+Pr6O11 3,400 tpa
Pre-Production Capital Costs $427 million
Sustaining Capital Costs $21.37 million
Operating Costs $17.71/kg TREO
Basket Value of MREC product (incl. separation costs) US$28.38/kg TREO
Exchange Rate US$:A$ 0.71
Discount Rate 8%
Table 14 - Yangibana Project – PFS Ore Reserve Parameters
This financial evaluation evaluates the production targets based on all deposits incorporated in the mine plan that established Probable Ore Reserve of 10.35 million tonnes.
A summary of the Mineral Resources of the deposits included in this evaluation and their utilisation as Probable Reserves in the financial evaluation is provided in Table 15.
Deposit Mineral Resources (t) Ore Reserves(t)
Measured Indicated Inferred Total Probable Ore Reserves
Bald Hill (100%) 3,345,000 1,419,000 1,487,000 6,251,000 4,405,000
Fraser’s (100%) 398,000 407,000 670,000 1,475,000 638,000
Auer (100%) 1,004,000 1,000,000 2,004,000 728,000
Auer North (100%) 462,000 220,000 682,000 148,000
Yangibana (100%) 1,318,000 851,000 12,169,000 876,000
Yangibana West (100%) 114,000 1,665,000 758,000 2,536,000 1,478,000
Yangibana North (70%) 871,000 1,924,000 632,000 3,427,000 1,964,000
Total 4,728,000 8,199,000 5,618,000 18,544,000 10,345,000
Table 15 - Yangibana Project – Current Resources to Ore Reserves
Resources shown in this table do not represent the total Mineral Resources and are inclusive of Ore Reserves. Deposits not used in the economic evaluation have been excluded from Mineral Resources in this table. Totals do not all add due to rounding.
For
per
sona
l use
onl
y

18
Revenue Factors
The DFS financial model assumes an average long-term US$:A$ exchange rate of 0.71 and uses Adamas Intelligence price forecasts for rare earths prices. Financial evaluation of the Probable Ore Reserves in the DFS results in the economic outcome shown in Table 16.
Operating Life 11 years
Net Present Value (NPV) $447 million
Internal Rate of Return (IRR) 28.0%
Payback Period 2.6 years
Table 16 - Yangibana Project – DFS Financial Evaluation Results
Production Targets
The current Ore Reserve Statement has ore reserve estimates resulting from the design of several open pits that will produce MREC over the current life of the project.
In this Ore Reserve Statement;
• Probable Ore Reserves are derived from Measured and Indicated Mineral Resources.
• No Inferred Mineral Resources are included in the Ore Reserves.
The Ore Reserves classifications are considered appropriate because;
• All the pits are well drilled and geologically understood.
• Extensive metallurgical test work and the results of two phases of pilot plant testwork support the estimation.
Capital and Operating costs are derived by independent third-party industry recognised specialists, with the current Capex budget at $427 million. Operating costs reflect the mining and infrastructure setup costs of all pits within the mining schedule. Processing operating costs have been modified since the DFS to reflect current market pricing, except for mining contractor costs, which remain unchanged from the previous 2017 DFS study. Additionally, over the life of the project a $17 million allowance has been made in the operating cost for miscellaneous mining items for all the open pits within the mining schedule, including;
• Clearing and grubbing;
• Topsoil to stockpiles;
• Haul Road formation;
• Haul Road earthworks cut and fill
• Culvert construction
• Construction of settling ponds; and
• Construction of drainage ponds.
For
per
sona
l use
onl
y

19
Figure 7 - Yangibana Project Annualised TREO Production Targets
Current production targets on an annualised basis are listed in Figure 7 above to produce up to 15,000 tpa of MREC. The MREC will contain up to 8,850 tpa Total Rare Earths Oxides, of which up to 3,400 tpa will be neodymium oxide (Nd2O3) + praseodymium oxide (Pr6O11).
Figure 8 - Yangibana Project Mining of Resource Categories
Figure 8 shows the various resource category tonnages to be mined on an annualised basis. Over the life of the project, it is anticipated that approximately 4.54Mt of the total Measured resources and 5.81Mt of the total Indicated resources listed in Table 15 will be mined. 100% of the Probable Ore Reserves are derived from Measured and Indicated Mineral Resources only.
For
per
sona
l use
onl
y

20
PROJECT CAPITAL COST INCREASE
Improvements to the mining schedule in bringing forward additional high-grade feed, higher consensus commodity prices arising from the rapid adoption of EV, and a lowering of the expected ramp-up period post construction have contributed to maintaining the NPV close to the DFS level.
Due to approval and simultaneous delivery and execution of newly approved large projects and expansions, pressure is being experienced within WA’s construction labour workforce and has led to competition for specialist construction personnel and major growth in wages within this sector. The impact for Hastings has resulted in increased salary costs of approximately $42 million dollars from the historically reported DFS position.
In February, Hastings announced substantial improvements in beneficiation recoveries to ~80% based on the second continuous flotation pilot plant test programme. In addition, through an operability assessment, the process plant layout has been redesigned and the footprint reduced mitigating further capital increases.
These project value improvements more than offset and justify the increase in capital costs.
Early contractor engagement started in H2 2018 with approval to commence early works and will continue through to H1 2021 with completion of construction, dependant on finalisation of project financing. Approximately 54% of pre-production capital costs is tied up in lump sum and fixed price procurement contracts either awarded or near finalisation with leading industry specialists and partners.
Subject to the final Environmental Protection Authority (EPA) approval, construction of the processing facility and other above ground infrastructure including the tailings storage facility is scheduled to commence in H2 2019.
Over the last few months Hastings has recruited a number of skilled and highly experienced individuals into key operational roles, to implement construction and commissioning works and further review the project’s value enhancements providing potential upside to capital and operating cost improvements.
Construction will progress in two phases. This approach assists to reduce on-site construction personnel thereby enabling a 25 per cent reduction in the size of the camp.
Phase one commenced in H2 2018 with early works approvals enabling some camp construction and access road clearing. The EPA permit process continues, and State and Federal Government departments are working to an agreed schedule, which should see the final Environmental Licenses granted by Q3 2019.
The second phase, subject to the EPA permit approval, is scheduled to commence in Q3 2019. This phase includes construction of the processing plant and other above ground infrastructure, construction of the tailing’s storage facility, power station and gas reticulation.
Net Present Value* ~$447 million
Internal Rate of Return* ~28%
Project Payback 2.6 years
Pre-Production Capital** ~$427 million
Average annual net cash flow ~ $137 million
Mining production*** ~ 1.0 Mtpa ore
Mine Life ~ 11 years
Annual MREC production capacity ~ 15,000t
Annual TREO production capacity ~ 8,500t
Annual Nd2O3+Pr6O11 capacity ~ 3,400t
Table 17 – Yangibana Project – Key Financial and Production Metrics
*Using Adamas Intelligence forward pricing, 8% real discount rate. Refer to Reserves Increase by 34% to 0.35Mt Covering 10 Years released on 29 January 2019.
**Including $32.2 million in contingency, excluding $11.1 million in sunk costs to March 1st, 2019.
*** The production targets referred to in this announcement are based on Probable Ore Reserves.
For
per
sona
l use
onl
y

21
Two Phased Construction Project
The two-phased work program is scheduled to occur in the following order;
• Installation of the accommodation camp
• Road access clearing
• Airstrip certification
• Finalising design work
• Ordering of long lead time items
• Offsite fabrication of plant
• Approval of the EPA permits (which will enable phase 2)
• Further near mine operational water drilling.
• Process plant
• Mining offices and workshop
• Camp to Plant Access Road
• Bore field drilling and water abstraction
• Communications network
• Gas power station and gas pipeline
Cost and Constructability Certainty
Cost certainty has increased with 54% of the total pre-production capital in lump sum and fixed price contracts near finalisation with experienced construction partners:
• FLSmidth - Kiln
• SAG/Regrind Mill – tier 1 supplier
• Flotation cells – tier 1 supplier
Other key work packages are:
• TAPC/Tialoc – Off gas Scrubber
• Fleetwood - purchase, transport and installation of the accommodation village
Improvements since DFS
Changes made since the DFS to improve economics and manage risk include:
• Reduced and optimised the plant footprint and layout, and added capacity for greater automation to improve productivity and lower costs;
• Replacing 2 x mobile crushers, with 1 fixed jaw crusher;
• Added a conveyor and live stockpile and refeed hopper giving up to 24 hours surge capacity, after crushing;
• Redesigned TSF to better handle and accommodate slurry material;
• Installed concentrate silos between beneficiation and hydromet area to give 3 days’ live surge capacity to concentrate production and kiln feed;
• Included allowance for Ore sorting technology;
• Gas pipeline and power station – Build Own Operate and Maintain agreement including installation of an additional transmission line and substation being negotiated
Phase 1
Enabling Infrastructure
Phase 2
Construction
For
per
sona
l use
onl
y
22
DFS v Updated FS costs
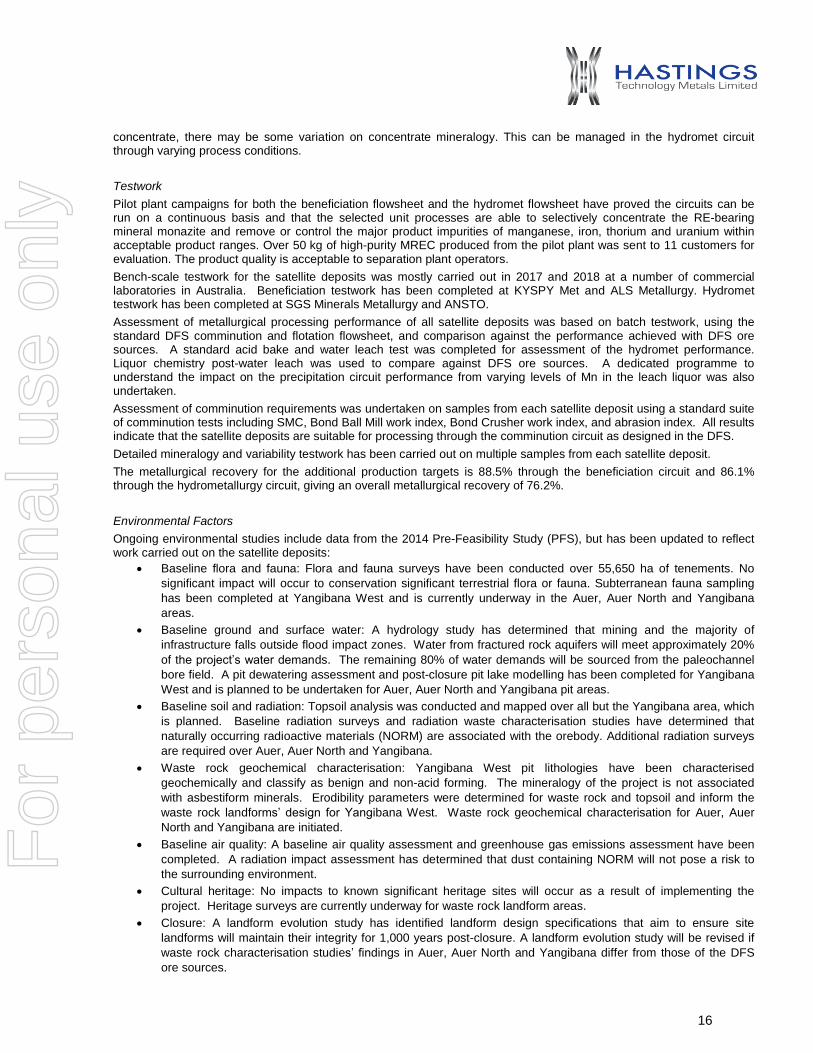
Since the DFS pre-production capital costs has increased by approximately $91 million primarily accounted for by:
$ million
• Process Equipment Upgrades
o Hydromet area 22.0 o Piping 6.0 o Flotation 6.0 o First fill reagents 3.0 o Ore sorting 3.0
• Tailings Storage Facility 3.0
Other major costs increase are:
• Camp size increased from 240 to 380 beds 3.0
• Increase in Mining pre-stripping 2.8
• Services (water/earthworks/plant control) 13.0
• Spares & First Fills 1.6
• Indirects (labour/consultants) 42.0
• Others 9.0
Costs savings:
• Airstrip/PowerStation/gas pipeline/other (23.4)
NATIVE TITLE AGREEMENT
In November 2017 the Group signed a Native Title Agreement (NTA) with the Thiin-Mah Warriyangka, Tharrkari and Jiwarli People (TMWTJ People) in respect of the Yangibana Project. To date, the Group has met all of its obligations with respect to its Native Title agreement.
BROCKMAN PROJECT
The Group continued the process of preparing documentation to support the application of a Mining Lease on the
Brockman Project.
Terminology used in this report
TREO is the sum of the oxides of the heavy rare earth elements (HREO) and the light rare earth elements (LREO).
HREO is the sum of the oxides of the heavy rare earth elements europium (Eu), gadolinium (Gd), terbium (Tb), dysprosium (Dy), holmium (Ho), erbium (Er), thulium (Tm), ytterbium (Yb), lutetium (Lu), and yttrium (Y).
CREO is the sum of the oxides of neodymium (Nd), europium (Eu), terbium (Tb), dysprosium (Dy), and yttrium (Y) that were classified by the US Department of Energy in 2011 to be in critical short supply in the foreseeable future.
LREO is the sum of the oxides of the light rare earth elements lanthanum (La), cerium (Ce), praseodymium (Pr), neodymium (Nd), and samarium (Sm).
Andrew Reid
Chief Operating Officer
24 September 2019
For
per
sona
l use
onl
y

23
Annual Ore Reserves and Mineral Resources Statement
Summary
This statement represents the Mineral Resources and Ore Reserves (MROR) for Hastings Technology Metals Limited (Hastings or the Group) as at 30 June 2019. This MROR statement has been compiled and reported in accordance with the guidelines of the 2012 Edition of the ‘Australasian Code for Reporting of Exploration Results, Mineral Resources and Ore Reserves’ (2012 JORC Code).
This statement is to be reviewed and updated annually in accordance with Section 15 of the 2012 JORC Code. The nominated annual review date for this MROR statement is 30 June.
The Group’s Mineral Resources increased at the Yangibana Project which were announced in November 2018 and remained unchanged at the Brockman Project (Halls Creek). The information in this statement has been extracted from the relevant reports as indicated below in each Ore Reserve or Mineral Resource table.
The quoted Yangibana Ore Reserves were first reported in November 2017 and were increased after the nominated date of this statement in July 2018 in accordance with the 2012 JORC Code. A subsequent reserve increase announcement was made in January 2019.
The Group is not aware of any new information or data that materially affects the information included in the relevant market releases for this estimate. The Group confirms that all material assumptions and technical parameters underpinning the estimate in the relevant market releases continue to apply and have not materially changed. The Group confirms that the form and context in which the Competent Person’s findings are presented here have not been materially modified. Reserves are reported from tenements in which Hastings holds a 100% interest as well as a 70% controlling interest through a joint venture arrangement. (Table 1).
The quoted Yangibana Mineral Resource estimate was first reported in November 2017 in accordance with the 2012 JORC Code. In November 2018 the Group announced a major mineral resource increase over the 2017 estimate. The Group is not aware of any new information or data that materially affects the information included in the relevant market releases for this estimate. The Group confirms that all material assumptions and technical parameters underpinning the estimate in the relevant market releases continue to apply and have not materially changed. The Group confirms that the form and context in which the Competent Person’s findings are presented here have not been materially modified. Resources are shown for the total project (Table 2); and this total then split into the 100% Hastings tenements (Table 3); and the joint venture ground in which Hastings holds a 70% interest (Table 4).
The Brockman Mineral Resource estimate was first reported in September 2011 in accordance with the guidelines of the 2004 Edition of the JORC Code and has not been updated to comply with the 2012 JORC Code. The mineral resource estimate for the Southern Extension was first reported in the Group’s December 2015 Quarterly Report. The Group is not aware of any new information or data that materially affects the information included in the relevant market releases for this estimate. The Group confirms that all material assumptions and technical parameters underpinning the estimate in the relevant market releases continue to apply and have not materially changed. The Group confirms that the form and context in which the Competent Person’s findings are presented here have not been materially modified. Resources are shown for the main Brockman Project (Table 5) and the Southern Extension (Table 6).
For
per
sona
l use
onl
y

24
Yangibana Project Ore Reserves
Deposit Tonnes %TREO %Nd2O3+Pr6O11
Bald Hill 4,405,000 1.02 0.41
Fraser’s 638,000 1.61 0.68
Yangibana West 1,478,000 1.23 0.34
Yangibana 986,000 0.93 0.44
Yangibana North 1,964,000 1.72 0.44
Auer 728,000 1.12 0.41
Auer North 148,000 1.24 0.47
TOTAL 10,345,000 1.22 0.43
The quoted Yangibana Ore Reserve was first reported in January 2019 in accordance with the 2012 JORC Code (refer to ASX Release dated 29 January 2019 titled “Reserves Increase by 34% to 10.35MT Covering 10 Years”, available to view at www.hastingstechmetals.com).
Yangibana Project Mineral Resources
Category Tonnes %TREO %Nd2O3+Pr6O11
Measured 4,727,000 1.17 0.42
Indicated 8,652,000 1.24 0.41
Inferred 8,294,000 1.09 0.36
TOTAL 21,673,000 1.17 0.39
Table 2: Yangibana Total Rare Earths Resources at a 0.2%Nd2O3+Pr6O11 cut-off, November 2017.
Table 3: Yangibana Rare Earths Resources within 100% Hastings tenements at a 0.2%Nd2O3+Pr6O11 cut-off, November 2018.
Total Resource in Tenements 100% held by Hastings
Category Tonnes %TREO %Nd2O3+Pr6O11
Measured 3,857,000 1.07 0.43
Indicated 6,595,000 1.08 0.40
Inferred 5,706,000 0.93 0.35
TOTAL 16,158,000 1.02 0.39 For
per
sona
l use
onl
y

25
Table 4: Yangibana Rare Earths Resources within Joint Venture tenements at a 0.2%Nd2O3+Pr6O11 cut-off, November 2018.
The updated Yangibana Mineral Resource was reported in November 2018 in accordance with the 2012 JORC Code (refer to ASX Release dated 28 November 2018 titled ‘Increase in Measured and Indicated Resources Yangibana”, available to view at www.hastingstechmetals.com).
Brockman Project Mineral Resources
Category Tonnes ppm Nb2O5
ppm Ta2O5
ppm ZrO2
ppm Ga2O5
ppm HfO2
ppm TREO
ppm HREO
ppm Dy2O3
ppm Y2O3
Indicated 27,100,000 3545 182 8913 110 318 2103 1803 186 1120
Inferred 9,100,000 3547 182 8914 110 318 2100 1802 186 1120
TOTAL 36,200.000 3546 182 8913 110 318 2102 1802 186 1120
Table 5: Brockman Rare Metals-Rare Earths Resource at a 1,500ppm Nb2O5 cut-off. September 2011.
Brockman Southern Extension Mineral Resources
Category Tonnes ppm Nb2O5
ppm ZrO2
ppm TREO
Indicated 5,200,000 3900 9500 2200
TOTAL 5,200,000 3900 9500 2200
Table 6: Brockman Rare Metals-Rare Earths Southern Extension Resource at a 0.2%TREO cut-off. December 2015.
The quoted Brockman Mineral Resource was first reported in the December 2015 Quarterly Report in accordance with the 2004 JORC Code (refer to ASX Release dated 29 January 2016 titled “Quarterly Report December 2017. There has been no resource adjustments made in the last 12 months, available to view at www.hastingstechmetals.com).
Material Changes and Resource Statement Comparison
The Group reviews and report its mineral resources at least annually and provides an Annual Mineral Resource Statement. The date of reporting is 30 June each year, to coincide with the Group’s end of financial year balance date. If there are any material changes to its mineral resources over the course of the year, the Group is required to promptly report these changes.
Total Resource in Tenements 70% held by Hastings
Category Tonnes %TREO %Nd2O3+Pr6O11
Measured 871,000 1.64 0.43
Indicated 2,058,000 1.76 0.20
Inferred 2,586,000 1.44 0.37
TOTAL 5,515,000 1.59 0.32
For
per
sona
l use
onl
y

26
Governance Arrangements and Internal Controls
Hastings has ensured that the ore reserves and mineral resources quoted are subject to good governance arrangements and internal controls. The ore reserves and mineral resources reported have been generated by independent external consultants who are experienced in best practices in modelling and estimation methods. The consultants have also undertaken reviews of the quality and suitability of the underlying information used to generate the resource estimation. In addition, Hastings’ management carries out regular reviews of internal processes and external contractors that have been engaged by the Group. All mineral resources reported here were compiled in accordance with the ‘Australasian Code for Reporting of Exploration Results, Mineral Resources and Ore Reserves’ (JORC Code) 2012 Edition.
Competent Persons’ Statement
The information that relates to the Ore Reserves at Bald Hill, Fraser’s, Yangibana, Auer and Auer North and Yangibana West is based on information reviewed or work undertaken by Mr Frank Blanchfield, FAusIMM, and an employee of Snowden Mining Industry Consultants. Mr Blanchfield has sufficient experience relevant to the style of mineralisation and type of deposit under consideration and to the preparation of mining studies to qualify as a Competent Person as defined by the JORC Code 2012. Mr Blanchfield consents to the inclusion in this announcement of the matters based on his information in the form and context in which it appears. The scientific and technical information that relates to process metallurgy is based on information reviewed by Ms. Narelle Marriott (Principal Engineer – Beneficiation) and Mr Zhaobing (Robin) Zhang (Process Engineering Manager) of Hastings Technology Metals Limited. Both Ms Marriott and Mr Zhang are members of AusIMM. Each has sufficient experience relevant to the style of mineralisation and type of deposit under consideration and to the activity being undertaken to qualify as a Competent Person as defined by the JORC Code 2012. Ms Marriott and Mr Zhang consent to the inclusion in this announcement of the matters based on their information in the form and context in which it appears.
The information that relates to Mineral Resources at the Yangibana Deposit is based on information compiled by Mr Lynn Widenbar of Widenbar and Associates Pty Ltd, and at Brockman by Mr Simon Coxhell of CoxsRocks Pty Ltd, both of whom are Members of the Australasian Institute of Mining and Metallurgy (AusIMM). Both are consultants to Hastings Technology Metals Limited and have sufficient experience that is relevant to the style of mineralisation and type of deposit under consideration and to the activity which they are undertaking to qualify as a Competent Person as defined in the 2004 and 2012 edition of the “Australasian Code for Reporting of Exploration Results, Mineral Resources and Ore Reserves”. Mr Widenbar and Mr Coxhell consent to the inclusion in this report of the matters based on their information in the form and context in which it appears.
The information that relates to Exploration Results is based on information compiled by Mr Andrew Reid. Mr Reid is an employee of the Group and is a Member of the Australian Institute of Mining and Metallurgy (AusIMM). Mr Reid has sufficient experience relevant to the styles of mineralisation and types of deposits which are covered in this presentation and to the activity which they are undertaking to qualify as a Competent Person as defined in the 2012 edition of the ‘Australasian Code for Reporting of Exploration Results, Mineral Resources and Ore Reserves’ (“JORC Code”). Mr Reid consents to the inclusion in this report of the matters based on his information in the form and context in which it appears.
For
per
sona
l use
onl
y

27
TENEMENT SCHEDULE
as at 30 June 2019 (All tenements are in Western Australia)
YANGIBANA PROJECT
BROCKMAN PROJECT
Gascoyne Metals Pty Limited (100% subsidiary)
Brockman Project Holdings Pty Limited (100%)
E09/2084 E09/2086 E09/2095 P09/482 P09/489 E09/1989 E09/2007 E09/2129 E09/2137 M09/157 M09/160 M09/164-165 G09/10 G09/14 L09/66-72 L09/74-75 L09/80-83 L09/85 L09/89
100% 100% 100% 100% 100% 100% 100% 100% 100% 100% 100% 100% 100% 100% 100% 100% 100% 100% 100%
P80/1626-1635 E80/5248 M80/636
100% (Application) (Application)
E09/2296 E09/2298 E09/2333-2334 L09/86-88
(Application) (Application) (Application) (Application)
E09/1043 E09/1049 E09/1703-1706 M09/159 M09/161 M09/163 G09/11 G09/13
70% 70% 70% 70% 70% 70% 70% 70%
Yangibana Pty Limited (100% subsidiary)
E09/1700 E09/1943-1944 E09/2018 M09/158 M09/162 G09/16-18 G09/20
100% 100% 100% 100% 100% 100% (Application)
For
per
sona
l use
onl
y

28
DIRECTORS’ REPORT
Your directors submit the annual financial report of the consolidated entity consisting of Hastings Technology Metals Ltd (the “Company”) and the entities it controlled during the period (the “Group”) for the financial year ended 30 June 2019. Pursuant to the provisions of the Corporations Act, the directors report as follows:
Directors
The names of directors who held office during or since the end of the year and to the date of this report are as follows. Directors were in office for this entire period unless otherwise stated.
Name Particulars
Mr Charles Lew Executive Chairman Mr Jean Claude Steinmetz Non-executive Director Mr Neil Hackett Non-executive Director (Appointed 30 November 2018) Mr Malcolm Randall Non-executive Director (Appointed 11 February 2019) Mr Guy Robertson Executive Director (Resigned 30 November 2018, reappointed 23 August
2019)
Names, qualifications, experience and special responsibilities Mr Charles Lew Executive Chairman
Qualifications: BA Hons Finance and Accounting, MSc Management Science
Mr Lew has more than 30 years of investment banking experience, including serving as Managing Director of ABN Amro’s investment banking business in Singapore from 1997 to 2000. He has been involved in a diverse range of investment banking activities, including IPOs, equity placements, corporate mergers and acquisitions, debt/equity restructuring, private equity investments and venture capital financing. After leaving ABN Amro in year 2000, Mr Lew started his own investment management company, Equator Capital, which manages a hedge fund that is primarily involved in trading global managed futures, US equities and options. In addition, the company has been a pre-IPO investor in growth companies in Singapore, Malaysia and China some of whom were subsequently listed on the Singapore Exchange. Mr Lew served as an Independent Non-Executive Director of one of Malaysia’s prominent banking group, RHB Bank from March 2004 until his retirement from the Group in May 2016. During this period, he was on the board of RHB Investment Bank (2004 to 2016), RHB Islamic Bank (2008 to 2016) and RHB Capital Berhad (2005 to 2007). He was an Independent Director on the board of Singapore Medical Group between 2007 and 2013. He is also Founder and Chairman of Muddy Murphy Holdings, an operator of traditional and concept pubs that was established in 1996. He holds a BA (Hons) in Finance and Accounting from the University of East London and a MSc in Management Science from Imperial College, University of London. Mr Lew has not held any other ASX directorships in the last three years. Mr Jean Claude Steinmetz Non-Executive Director Qualifications: BSc in Chemical Engineering, MSc in Industrial Management Mr Steinmetz has been involved in the specialty chemical industry for more than 25 years with a strong focus on the automotive industry leading breakthrough projects in body developments and major reductions programmes of carbon dioxide (CO2) in compliance with European and global legislation. Mr Steinmetz has also held management positions in Rhodia-Solvay, GE and Du Pont. He currently serves as Chairman of the Auto Plastic and Innovative Materials Committee of Sino-EU Chemical Manufacturers Association.
For
per
sona
l use
onl
y

29
DIRECTORS’ REPORT (continued)
Mr Steinmetz’s was previously Chief Operating Officer for the ASX listed rare earth company, Lynas Corporation where he had operational responsibility for the mining operations and concentration plant at Mount Weld in Western Australia and the Lynas Advanced Materials Plant (LAMP) in Malaysia. He also had oversight of the sales and marketing activities at Lynas and is fluent in English, Dutch, German and French. Mr Steinmetz has not held any other ASX directorships in the last three years. Mr Neil Hackett Non-Executive Director
Qualifications: BEcon UWA, GDAFI, GDFP, FFin, GAICD(Merit)
Mr Hackett is a professional ASX Director with 25 years practical experience with ASX200 resources entities, diversified
industrials, funds management, and ASIC. He is currently Non-Executive Chairman of Ardiden Ltd (ASX: ADV), Non-
Executive Director of Calima Energy Ltd (ASX:CE1), Chairman of WestCycle Inc, Council Member of John XXIII College and Company Secretary to Steel Blue Safety Boots. Mr Hackett's previous ASX resources experience includes Ampella Mining Ltd, Modun Resources Ltd and Sundance Resources Ltd. He holds a Bachelor of Economics from UWA, Graduate Diploma in Applied Finance & Investment, Graduate Diploma in
Financial Planning, is a Fellow of FINSIA, and a Graduate (Order of Merit) and Facilitator with the Australian Institute of
Company Directors. Mr Malcolm Randall Non-Executive Director
Qualifications: Dip Applied Chem, FAICD
Mr Randall holds a Bachelor of Applied Chemistry degree and has more than 45 years of experience in corporate, management and marketing in the resources sector, including more than 25 years with the Rio Tinto group of companies. His experience has covered a diverse range of commodities including iron ore, base metals, uranium, mineral sands and coal. Mr Randall has held the position of chairman and director of a number of ASX listed companies. Past directorships include Iron Ore Holdings Limited, United Minerals Corporation NL, and MZI Limited. Current directorships include Ora Gold Limited, Kalium Lakes Limited, Magnetite Mines Limited, and Argosy Minerals Limited. Mr Guy Robertson Executive Director
Qualifications: B.Com (Hons) CA
Mr Robertson has significant experience as a Director and Company Secretary of ASX listed and private companies in both Australia and Hong Kong.
Mr Robertson previously held senior roles in the Jardine Matheson group of companies over a period of sixteen years including Finance Director and Managing Director (NSW) for Jardine Lloyd Thompson Australia Insurance Brokers, Finance Director and Chief Operating Officer for Colliers International Property Services Asia Pacific and General Manager Finance of the Franklins Limited supermarket chain.
Mr Robertson is a non-executive director of Metal Bank Limited and was previously a director of Bellevue Gold Limited.
For
per
sona
l use
onl
y

30
DIRECTORS’ REPORT (continued)
Interests in the shares and options of the Company
The following relevant interests in shares and options of the Group or a related body corporate were held by the directors as at the date of this report.
Director
Number of fully paid ordinary shares
Number of options*
Number of Performance of Rights
Mr Charles Lew 103,289,155 2,941,177 10,000,000
Mr Jean Claude Steinmetz 720,890 100,000 2,500,000
Mr Malcolm Randall 115,074 32,537 -
Mr Neil Hackett - - -
Mr Guy Robertson 331,472 - -
*Listed options exercisable at 25 cents per share expiring on 12 April 2022.
Dividends
No dividends have been paid or declared since the start of the financial year and the directors do not recommend the payment of a dividend in respect of the financial year.
Principal Activities
The principal activities of the Group during the year were the exploration and evaluation of the Yangibana project and advancing funding applications with the Northern Australia Infrastructure Fund and the German United Loan Guarantee Scheme with KfW-IPEX Bank. For a review of operations, please refer to the section Review of Operations on pages 6 to 22.
Operating results for the year and financial review
The comprehensive loss of the consolidated entity for the financial period, after providing for income tax amounted to $5,143,029 (2018 - $2,891,278). The Group’s operating income decreased to $258,027 (2018 - $281,241) primarily due to a decrease in interest income given lower interest rates and funds on hand. Expenses increased to $5,421,465 (2018 - $3,172,519) due to an increase in personnel and administration costs as the Group moves to strengthen its support capabilites for the Yangibana Project. Capitalised exploration increased to $55,087,366 (2018 - $49,454,998) reflecting the costs associated with drilling on the Yangibana project to increase probable reserves, and heritage and environmental approvals. Plant and equipment increased to $31,375,526 (2018 - $5,070,943) reflecting preliminary construction works on the Yangibana project site and the ordering of long lead items. Net assets increased to $99,445,275 (2018 - $68,495,515) reflecting capital raisings during the year of $37.6 million (before costs) and the result for the year.
For
per
sona
l use
onl
y

31
DIRECTORS’ REPORT (continued)
Review of financial conditions
As at 30 June 2019 the consolidated entity had $18.5 million in cash. These funds will be used for the long lead items associated with the processing plant and working capital.
Going concern
Based on the Group’s cash flow forecast the Group will require additional funding in the next 12 months to enable the Group to continue its normal business activities and to ensure the realisation of assets in the ordinary course of business and extinguishment of liabilities as and when they fall due, including progression of its exploration and project evaluation and development activities. As a result of the above, there is a material uncertainty that may cast significant doubt on the entity’s ability to continue as a going concern and, therefore, that the entity may be unable to realise its assets and discharge its liabilities in the normal course of business. The Directors are satisfied, however that at the date of signing of the financial report, there are reasonable grounds to believe that the Group will be able to continue to meet its debts as and when they fall due and that it is appropriate for the financial statements to be prepared on a going concern basis. The directors have based this determination on the demonstrated historical ability of the Group to raise new capital, the intention to raise new capital in the short term via equity issues, and their assessment of the probability of executing project financing with KfW IPEX-Bank and Northern Australia Infrastructure Facility in 2019. For further information concerning the going concern, refer to Note 1(d).
Risk management and Corporate Governance
Details of the consolidated entity’s Risk Management and Corporate Governance policies are contained within the Corporate Governance Statement which follows this Directors’ Report. The Group has recently adopted a Diversity Policy and is committed to addressing the recommendations and guidance of the ASX Corporate Governance Council’s Corporate Governance principles and recommendations. The Group has 33 employees, 10 of which are women, with 3 in senior positions.
Significant changes in the state of affairs
The following summary of events were significant milestones in the state-of-affairs of the Group during the year:
• Increase in Yangibana JORC 2012 resources to 21 million tonnes
• Signing of the Design and Supply Contract for the Acid Bake Kiln with FLSmidth Pty Ltd
• Signing of off-take contract for the supply of mixed rare earths carbonate with Sky Rock Rare Earth New Materials Co Ltd
• Signing of second German off-take memorandum of understanding with Schaeffler AG
• Successful second pilot plant test increasing ore recoveries by 12% to 80% compared to maiden pilot plant testing
• The Yangibana Project’s development capital cost revised to $427 million
• Completing a total of $37.6 million in capital raisings (before costs) via placements and rights issues during the financial year
• Signing of Project Finance Mandate with KFW IPEX-Bank
• In principal eligibility for the German government UFK scheme confirmed for up to USD140 million from Euler Hermes
• Northern Australia Infrastructure Facility (NAIF) investigating the potential to provide debt financing
• Received Western Australian Environmental Protection Authority recommendation of environmental approval for the Yangibana Project, and subsequent to the year end, granted the environmental permit.
For
per
sona
l use
onl
y

32
DIRECTORS’ REPORT (continued)
Significant events after balance sheet date
Since 30 June 2019 the Group has issued 20,700,000 shares and 10,350,000 options as part of a take up of the May 2019 rights issue shortfall raising $3,519,000 (before costs). The options have an exercise price of 25 cents and an expiry date of 12 April 2022.
Other than as outlined above, there were no matters or circumstances that have arisen since the end of the financial period that have significantly affected or may significantly affect the operations of the consolidated entity, the results of
those operations, or state-of-affairs of the consolidated entity in future financial years.
Shares under option
At the date of this report there were 79,694,034 listed options on issue exercisable at 25 cents per share expiring on 12 April 2022. The Group has 19,533,333 performance rights on issue to directors and senior management, of which 5,200,000 were issued during the year to senior management.
Likely developments and expected results
During the coming year the Group plans to focus on the ongoing exploration and evaluation of the Yangibana rare earths project and the evaluation of the Brockman project. The material business risks faced by the Group that are likely to have an effect on the financial prospects of the Group, and how the Group manages these risks, are:
• Future capital needs – the Group does not currently generate cash from its operations. The Group will require further
funding in order to develop the Yangibana Rare Earths Project, meet its exploration activities on the Brockman
project and meet its corporate costs.
• Exploration and developments risks – The Brockman project has a substantial resource but needs to undergo further
exploration and studies before a determination is made as to its economic viability. The Group employs geologists
and other technical specialists and engages external consultants where appropriate to address this risk.
• Commodity price risk – as a Group which is focused on the exploration of rare earth oxides, notably neodymium,
praseodymium, dysprosium and europium, it is exposed to movements in the price of these commodities. The Group
monitors historical and forecast price information from a range of sources to support its planning and decision
making.
Environmental legislation
The consolidated entity is subject to significant environmental and monitoring requirements in respect of its natural resources’ exploration and development activities. The directors are not aware of any significant breaches of these requirements during the period.
For
per
sona
l use
onl
y

33
DIRECTORS’ REPORT (continued)
Indemnification and insurance of Directors and Officers
The consolidated entity has agreed to indemnify all the directors of the consolidated entity for any liabilities to another person (other than the consolidated entity or related body corporate) that may arise from their position as directors of the consolidated entity, except where the liability arises out of conduct involving a lack of good faith. During the financial year the consolidated entity paid a premium of $21,535 in respect of a contract insuring the directors and officers of the consolidated entity against any liability incurred in the course of their duties to the extent permitted by the Corporations Act 2001.
Indemnity of auditors
Hastings Technology Metals Limited has agreed to indemnify their auditors, PricewaterhouseCoopers, to the extent permitted by law, against any claim by a third party arising from Hastings Technology Metals Ltd’s breach of their agreement. The indemnity stipulates that Hastings Technology Metals Ltd will meet the full amount of any such liabilities including a reasonable amount of legal costs.
Proceedings on behalf of the Group
No person has applied to the Court under section 237 of the Corporations Act 2001 for leave to bring proceedings on behalf of the Group, or to intervene in any proceedings to which the Group is a party, for the purpose of taking responsibility on behalf of the Group for all or part of those proceedings. No proceedings have been brought or intervened in on behalf of the Group with leave of the Court under section 237 of the Corporations Act 2001.
Remuneration report (Audited)
This report outlines the remuneration arrangements in place for key management personnel of Hastings Technology
Metals Ltd for the financial year ended 30 June 2019.
The following persons acted as key management personnel during the financial year:
Name Particulars
Mr Charles Lew Executive Chairman
Mr Jean Claude Steinmetz Non-Executive Director
Mr Neil Hackett Non-Executive Director – Appointed 30 November 2018
Mr Malcolm Randall Non-Executive Director – Appointed 11 February 2019
Mr Andrew Reid Chief Operating Officer – Appointed 19 November 2018
Mr Guy Robertson Executive Director – Resigned 30 November 2018, reappointed 23 August 2019
Mr Hannes Zandberg Project Director – Resigned 31 October 2018
Mr Andrew Border General Manager Exploration – Resigned 26 April 2019
Remuneration philosophy
The performance of the Group depends upon the quality of the directors and executives. The philosophy of the Group in determining remuneration levels is to: - set competitive remuneration packages to attract and retain high calibre employees; - link executive rewards to shareholder value creation; and - establish appropriate, demanding performance hurdles for variable executive remuneration
For
per
sona
l use
onl
y

34
DIRECTORS’ REPORT (continued)
Remuneration report (Audited) (continued)
Remuneration Committee
The Remuneration Committee of the Board of Directors of the Group is responsible for determining and reviewing compensation arrangements for the directors and the senior management team. The Remuneration Committee assesses the appropriateness of the nature and amount of remuneration of directors and senior executives on a periodic basis by reference to relevant employment market conditions with an overall objective of ensuring maximum stakeholder benefit from the retention of a high-quality Board and executive team.
Remuneration structure
In accordance with best practice corporate governance, the structure of non-executive director and executive remuneration is separate and distinct.
Non-executive director remuneration
The Board seeks to set aggregate remuneration at a level that provides the Group with the ability to attract and retain directors of the highest calibre, whilst incurring a cost that is acceptable to shareholders. The ASX Listing Rules specify that the aggregate remuneration of non-executive directors shall be determined from time to time by a general meeting. The latest determination was at the Annual General Meeting held on 30 November 2010 when shareholders approved an aggregate remuneration of up to $250,000 per year. The amount of aggregate remuneration sought to be approved by shareholders and the manner in which it is apportioned amongst directors is reviewed annually. The Board considers advice from external shareholders as well as the fees paid to non-executive directors of comparable companies when undertaking the annual review process. Each director receives a fee for being a director of the Group. The remuneration of non-executive directors for the period ended 30 June 2019 is detailed in the remuneration of directors and named executives section of this report on page 35.
Senior manager and executive director remuneration
Remuneration consists of fixed remuneration and performance rights to shares (as determined from time to time). In addition to Group employees and directors, the Group may contract key consultants on a contractual basis. These contracts stipulate the remuneration to be paid to the consultants.
Fixed Remuneration
Fixed remuneration is reviewed annually by the Remuneration Committee. The process consists of a review of relevant comparative remuneration in the market and internally and, where appropriate, external advice on policies and practices. The Committee has access to external, independent advice where necessary. Fixed remuneration is paid in the form of cash payments. The fixed remuneration component of the key management personnel is detailed below.
For
per
sona
l use
onl
y

35
DIRECTORS’ REPORT (continued)
Remuneration report (Audited) (continued)
All Directors have a letter of appointment. Remuneration of non-executive directors is set at $60,000 per annum and the Executive Chairman at $525,000 per annum. Non-executive director fees over and above $60,000 per annum are for additional consulting services paid at agreed daily rates. Executive and non-executive contract details are as follows:
Name Position Directors Fee
$
Other Fees/Salary
$
Termination3
Mr Charles Lew Executive Chairman 120,000 405,000 12 months notice
Mr Jean Claude Steinmetz1
Non-Executive Director 60,000 - 3 months notice
Mr Neil Hackett2 Non-Executive Director 60,000 - 1 months notice
Mr Malcolm Randall Non-Executive Director 60,000 - -
Mr Guy Robertson2 Executive Director 60,000 - 1 months notice
Mr Andrew Reid Chief Operating Officer - 415,000 3 months notice
Mr Hannes Zandberg4 Project Director - 284,700 2 months notice
Mr Andrew Border5 General Manager Exploration
- 250,000 3 months notice
¹Mr Steinmetz’s agreement provides for consulting services at a rate of $1,000 per day
²Mr Hackett and Mr Robertson receive fees for company secretary earnings, which are included in the table below 3Termination periods refer to consulting agreements, 4Resigned 31 October 2018, 5Resigned 26 April 2019
Remuneration of key management and personnel
Table 1: Key management personnel remuneration for the year ended 30 June 2019
Short-term employee benefits
Annual leave
Post-employment
benefits Equity
Salary & Fees
$
and long service leave
$ Superannuation
$
Performance Rights¹
$ Total
$
% Performance
Related
Mr Charles Lew 461,502 - - 20,322 481,824 4.2 Mr Jean Claude Steinmetz 171,500 - - 5,080 176,580 2.9
Mr Neil Hackett² 97,421 - - - 97,421 -
Mr Malcolm Randall3 21,255 - 2,019 - 23,274 -
Mr Andrew Reid4 242,500 14,911 15,545 18,932 291,888 6.5
Mr Guy Robertson5 30,000 - - (8,800)6 21,200 (41.5)
Mr Hannes Zandberg7 9168,971 - 8,233 (3,391)6 173,813 (2.0)
Mr Andy Border8 193,616 - 18,173 1,386 213,175 0.7
Total 1,386,765 14,911 43,970 33,529 1,479,175 2.3
¹Performance rights have been granted and valued, however vesting is subject to performance hurdles with the exception of the following amounts which have vested: Mr Border $1,386
²Mr Hackett is paid through Corporate-Starboard Pty Ltd, a company in which he has a controlling interest. Mr Hackett commenced on 30 November 2018 3Commenced 11 February 2019, ⁴Commenced 19 November 2018
For
per
sona
l use
onl
y

36
DIRECTORS’ REPORT (continued)
Remuneration report (Audited) (continued)
⁵Mr Robertson is paid through Integrated CFO Solutions Pty Ltd, a company in which he has a controlling interest. Mr Robertson resigned as a Director 30 November 2018, was reappointed on 23 August 2019 and continued to act as company secretary of Group subsidiary companies throughout the period 6Performance rights forfeited on resignation, 7Resigned 31 October 2018, 8Resigned 26 April 2019 9Includes $65,000 in termination payments
Table 2: Key management personnel remuneration for the year ended 30 June 2018
Short-term employee benefits
Annual leave
Post-employment
benefits Equity
Salary & Fees
$
and long service leave
$
Superannuation $
Performance Rights¹
$ Total
$
% Performance
Related
Mr Charles Lew 324,000 - - 57,500 381,500 15.0 Mr Jean Claude Steinmetz 165,674 - - 14,375 180,049 8.0
Mr Guy Robertson² 107,000 - - 5,280 112,280 4.7
Mr Anthony Ho³ 39,667 - - 20,378 60,045 33.9
Mr Aris Stamoulis⁴ 133,500 - 9,975 2,160 145,635 1.4
Mr Hannes Zandberg⁵ 140,000 10,769 13,300 3,391 167,460 2.0
Mr Andy Border 228,311 33,743 21,690 7,200 290,944 2.5
Total 1,138,152 44,512 44,965 110,284 1,337,913 8.2
¹Performance rights have been granted and valued, however vesting is subject to performance hurdles with the exception of the following amounts which have vested: Mr Robertson $9,680, Mr Border $9,680 and Mr Stamoulis $2,640.
²Mr Robertson is paid through Integrated CFO Solutions Pty Ltd, a company in which he has a controlling interest.
³Resigned 29 November 2017,
⁴Resigned 15 March 2018,
⁵Commenced 14 December 2017
Shareholders at the 2016 Annual General Meeting approved the grant of 15,000,000 performance rights to Directors. The performance rights were valued based on the share price on grant date discounted for lack of marketability as follows: Tranche A: 3,750,000 at $0.026, Tranche B: 3,750,000 at $0.018, Tranche C: 7,500,000 at $0.0125. Of these performance rights 1,666,667 rights lapsed during the 2018 year on the resignation of a director. Vesting occurs at the end of the performance period ended 28 November 2019, if the following performance conditions are met:
Non-market based performance conditions:
• regulatory approval of Mining Proposal Plan with Mine Closure;
• achieving additional financing of debt and equity totalling $100 million; and
• award of the construction contract for the beneficiation plant.
Market-based performance conditions:
• 25% of the performance rights will vest when market capitalisation exceeds $75 million; and
• 50% of the performance rights will vest when market capitalisation exceeds $125 million; and
• 100% of the performance rights will vest when market capitalisation exceeds $175 million.
For
per
sona
l use
onl
y

37
DIRECTORS’ REPORT (continued)
Remuneration report (Audited) (continued)
Employee performance rights issued are as follows:
Date granted Balance 30 June 2018
Value per share
Performance period ended Issued Vested Lapsed
Balance 30 June 2019
29 June 2017 625,000 8.8 cents 20 June 2018 - (398,000) (227,000) -
26 June 2018 1,000,000 22.5 cents 31 August 2019 - - - 1,000,000
26 June 2018 500,000 22.5 cents 31 December 2019 - - (500,000) -
4 June 2019 - 17.0 cents 31 December 2019 1,950,000 - - 1,950,000
4 June 2019 - 17.0 cents 31 December 2020 1,350,000 - - 1,350,000
4 June 2019 - 17.0 cents 31 December 2021 1,900,000 - - 1,900,000
2,125,000 5,200,000 (398,000) (727,000) 6,200,000
Non-market based performance conditions comprise key objectives specific to each employee. Shareholdings of Key Management Personnel
¹Director appointed 30 November 2018 ²Director appointed 11 February 2019 3Chief Operating Officer appointed 19 November 2019 4Director resigned 30 November 2018, reappointed 23 August 2019 5Project Director resigned 31 October 2018 6General Manager Exploration resigned 26 April 2019
Balance at beginning of
period
Purchased
On Vesting of Performance
Rights
Other
Balance at end of period
30 June 2019 Ord Ord Ord Ord Ord
Mr Charles Lew 97,406,802 5,882,353 - - 103,289,155
Mr Jean Claude Steinmetz 520,890 200,000 - - 720,890
Mr Neil Hackett1 - - - - -
Mr Malcolm Randall2 - 115,074 - - 115,074
Mr Andrew Reid3 - 30,000 - - 30,000
Mr Guy Robertson4 1,001,299 - - (1,001,299) -
Mr Hannes Zandberg5 - - - - -
Mr Andy Border6 639,069 - 119,250 (758,319) -
Total 99,568,060 6,227,427 119,250 (1,759,618) 104,155,119
For
per
sona
l use
onl
y

38
DIRECTORS’ REPORT (continued)
Remuneration report (Audited) (continued)
Shareholdings of Key Management Personnel (continued)
¹Director appointed 31 July 2017 ²Director resigned 29 November 2017 ³Director resigned 15 March 2018
Option holdings of Key Management Personnel During the year ended 30 June 2019, the Group issued listed options exercisable at 25 cents per share expiring on 12 April 2022. The options were issued as free attaching options to a share placement on the basis of one option for every two new shares purchased.
No options existed or were issued during the year ended 30 June 2018.
Balance at beginning of
period
Purchased
On Vesting of Performance
Rights
Other
Balance at end of period
30 June 2018 Ord Ord Ord Ord Ord
Mr Charles Lew 91,496,893 5,909,909 - - 97,406,802
Mr Jean Claude Steinmetz - 520,890 - - 520,890
Mr Guy Robertson¹ 594,418 296,881 110,000 - 1,001,299
Mr Anthony Ho² 4,500,780 100,000 - (4,600,780) -
Mr Aristeidis Stamoulis³ 3,198,445 10,000 30,000 (3,238,445) -
Mr Hannes Zandberg - - - - -
Mr Andy Border 529,069 - 110,000 - 639,069
Total 100,319,605 6,837,680 250,000 (7,839,225) 99,568,060
Balance at beginning of
period
Purchased
On Vesting of Performance
Rights
Other
Balance at end of period
30 June 2019 Options Options Options Options Options
Mr Charles Lew - 2,941,177 - - 2,941,177
Mr Jean Claude Steinmetz - 100,000 - - 100,000
Mr Neil Hackett - - - - -
Mr Malcolm Randall - 32,537 - - 32,537
Mr Andrew Reid - 15,000 - - 15,000
Total - 3,088,714 - - 3,088,714
For
per
sona
l use
onl
y

39
DIRECTORS’ REPORT (continued)
Remuneration report (Audited) (continued)
Performance rights held by Directors and Key Management Personnel
The following performance rights are on issue and are subject to the Group achieving certain milestones as set out on page 36.
Number Performance period
Mr Charles Lew 10,000,000 28 November 2019
Mr Jean Claude Steinmetz 2,500,000 28 November 2019
Mr Andrew Reid 500,000 31 December 2019
Mr Andrew Reid 1,000,000 31 December 2020
Mr Andrew Reid 1,500,000 31 December 2021
Performance Rights
30 June 2019
Balance at beginning of period
Vested During Period
Granted as remuneration Lapsed
Balance at end of period
Mr Charles Lew 10,000,000 - - - 10,000,000
Mr Jean Claude Steinmetz 2,500,000 - - - 2,500,000
Mr Andrew Reid - - 3,000,000 - 3,000,000
Mr Guy Robertson 150,000 - - (150,000) -
Mr Hannes Zandberg 500,000 - - (500,000) -
Mr Andy Border 150,000 (119,250) - (30,750) -
Total 14,405,000 (119,250) 3,000,000 (680,750) 15,500,000
30 June 2018
Balance at beginning of period
Vested During Period
Granted as remuneration Lapsed
Balance at end of period
Mr Charles Lew 10,000,000 - - - 10,000,000
Mr Anthony Ho1 2,500,000 - - (1,666,667) 833,333
Mr Jean Claude Steinmetz 2,500,000 - - - 2,500,000
Mr Guy Robertson 300,000 (150,000) - - 150,000
Mr Hannes Zandberg - - 500,000 - 500,000
Mr Andy Border 300,000 (150,000) - - 150,000
Total 15,600,000 (300,000) 500,000 (1,666,667) 14,133,333
1 As at 30 June 2018 (and 2019) Mr Ho retains 833,333 in performance rights due to expire 28 November 2019. The performance rights were issued to Mr Ho whilst he was a director.
For
per
sona
l use
onl
y

40
DIRECTORS’ REPORT (continued)
Remuneration report (Audited) (continued)
Related Party Transactions
Office and administration costs¹ 88,180 83,224
Capital raising fees 215,5552 375,000 ¹Office and administration costs were paid to Equator Capital Pte Limited, a company in which Mr Charles Lew has an interest. Of this amount $7,416 (2018 - $5,000) remains payable at 30 June 2019.
2During the year ended 30 June 2019 the Group paid $50,000 in capital raising fees directly to Mr Charles Lew and $165,555 to Mr Jean Claude Steinmetz, based on an underwriting fee of 5% of any underwritten amount raised. Mr Lew raised $1,000,000 in May 2019’s placement, and Mr Steinmetz $3,311,100 in August 2018.
End of audited remuneration report.
2019
$ 2018
$
For
per
sona
l use
onl
y

41
DIRECTORS’ REPORT (continued)
Directors’ Meetings
The number of meetings of directors (including meetings of committees of directors) held during the year and the number of meetings attended by each director was as follows:
Director Meetings Audit Committee Remuneration Committee
Director Attended Eligible to
Attend Attended Eligible to Attend Attended
Eligible to Attend
Mr Charles Lew 10 10 1 1 1 1
Mr Jean Claude Steinmetz
10 10 1 1 1 1
Mr Neil Hackett 6 6 1 1 2 2
Mr Malcolm Randall 4 4 1 1 2 2
Mr Guy Robertson 4 4 - - 1 1
In addition, 3 circular resolutions were signed by the board during the period.
Auditor’s Independence and Non-Audit Services
Section 307C of the Corporations Act 2001 requires our auditors, PricewaterhouseCoopers, to provide the directors of the Group with an Independence Declaration in relation to the audit of the annual report. This Independence Declaration is set out on page 43 and forms part of this directors’ report for the year ended 30 June 2019.
Non-Audit Services
No non-audit services were provided by the Group’s auditor during the year. Signed in accordance with a resolution of the directors.
Charles Lew
Executive Chairman
24 September 2019
For
per
sona
l use
onl
y

42
CORPORATE GOVERNANCE STATEMENT
The Board of Directors of Hastings Technology Metals Ltd is responsible for the corporate governance of the Group.
Hastings Technology Metals Ltd (“Hastings”), through its board and executives, recognises the need to establish and maintain corporate governance policies and practices that reflect the requirements of the market regulators and participants, and the expectations of members and others who deal with Hastings. These policies and practices remain under constant review as the corporate governance environment and good practices evolve.
ASX Corporate Governance Principles and Recommendations
The third edition of ASX Corporate Governance Council Principles and Recommendations (the “Principles”) sets out recommended corporate governance practices for entities listed on the ASX. The Group has issued a Corporate Governance Statement which discloses the Group’s corporate governance practices and the extent to which the Group has followed the recommendations set out in the Principles. The Corporate Governance Statement was approved by the Board on 24 September 2019 and is available on the Group’s website: https://hastingstechmetals.com/about-us/governance/
For
per
sona
l use
onl
y

PricewaterhouseCoopers, ABN 52 780 433 757 Brookfield Place, 125 St Georges Terrace, PERTH WA 6000, GPO Box D198, PERTH WA 6840 T: +61 8 9238 3000, F: +61 8 9238 3999, www.pwc.com.au
Liability limited by a scheme approved under Professional Standards Legislation.
Auditor’s Independence Declaration As lead auditor for the audit of Hastings Technology Metals Limited for the year ended 30 June 2019, I declare that to the best of my knowledge and belief, there have been:
(a) no contraventions of the auditor independence requirements of the Corporations Act 2001 in relation to the audit; and
(b) no contraventions of any applicable code of professional conduct in relation to the audit.
This declaration is in respect of Hastings Technology Metals Limited and the entities it controlled during the period.
Helen Bathurst Perth Partner PricewaterhouseCoopers
24 September 2019
For
per
sona
l use
onl
y

44
CONSOLIDATED STATEMENT OF PROFIT OR LOSS AND OTHER COMPREHENSIVE INCOME FOR THE YEAR ENDED 30 JUNE 2019
Consolidated
2019
$
2018
$
Notes
Continuing operations
Other income 2 258,027 281,241
Administration expenses (492,098) (508,351)
Depreciation (96,713) (17,181)
Directors fees (783,697) (596,674)
Occupancy expenses (274,733) (148,498)
Employee benefits expense 3 (1,826,853) (823,894)
Legal fees (322,832) (84,514)
Consulting and professional fees (1,121,881) (179,865)
Travel expenses (303,926) (457,167)
Share based payments (198,732) (356,375)
Loss before income tax expense (5,163,438) (2,891,278)
Income tax benefit 4 - -
Net loss for the period (5,163,438) (2,891,278)
Other comprehensive income 20,409 -
Total comprehensive loss for the period (5,143,029) (2,891,278)
Basic and diluted loss per share (cents per share) 5 (0.65) (0.43)
The accompanying notes form part of these consolidated financial statements.
For
per
sona
l use
onl
y

45
CONSOLIDATED STATEMENT OF FINANCIAL POSITION AS AT 30 JUNE 2019
Consolidated
Notes 2019 2018
$ $
Assets
Current assets
Cash and cash equivalents 7 18,495,405 20,694,184
Trade and other receivables 9 1,271,478 643,738
Total current assets 19,766,883 21,337,922
Non-current assets
Plant and equipment 10 31,375,526 5,070,943
Deferred exploration and evaluation expenditure 11 55,087,366 49,454,998
Total non-current assets 86,462,892 54,525,941
Total assets 106,229,775 75,863,863
Liabilities
Current liabilities
Trade and other payables 12 6,583,704 7,246,942
Employee benefit obligations 13 136,738 74,332
Total current liabilities 6,720,443 7,321,274
Non-current liabilities
Employee benefit obligations 13 64,057 47,074
Total non-current liabilities 65,057 47,074
Total Liabilities 6,784,450 7,368,348
Net Assets 99,445,275 68,495,515
Equity
Issued capital 14 112,858,264 81,231,618
Reserves 14 4,642,039 411,424
Accumulated losses (18,055,028) (13,147,527)
Total Equity 99,445,275 68,495,515
The accompanying notes form part of these consolidated financial statements.
For
per
sona
l use
onl
y

46
CONSOLIDATED STATEMENT OF CHANGES IN EQUITY FOR THE YEAR ENDED 30 JUNE 2019
The accompanying notes form part of these consolidated financial statements
Consolidated
Issued Capital Accumulated
Losses
Option Revaluation
Reserve
Share Based Payment Reserve Total
Notes $ $ $ $ $
Balance at 1 July 2018 81,231,618 (13,147,527) - 411,424 68,495,515
Loss for the year - (5,163,438) - - (5,163,438)
Other comprehensive income - 20,409 - - 20,409
Total comprehensive loss for the year
- (5,143,029) - - (5,143,029)
Shares/options issued during the year
33,255,861 - 4,299,329 - 37,555,190
Transaction costs on share issue (1,661,133) - - - (1,661,133)
Share based payments - - - 198,732 198,732
Transfer from share based payments
31,918 235,528 - (267,446) -
Balance at 30 June 2019 112,858,264 (18,055,028) 4,299,329 342,710 99,445,275
Balance at 1 July 2017 48,811,141 (10,293,649) - 190,449 38,707,941
Loss for the year - (2,891,278) - - (2,891,278)
Other comprehensive income - - - - -
Total comprehensive loss for the year
- (2,891,278) - - (2,891,278)
Shares/options issued during the year
33,774,190 - - - 33,774,190
Transaction costs on share issue (1,451,713) - - - (1,451,713)
Share based payments - - - 356,375 356,375
Transfer from share based payments
98,000 37,400 - (135,400) -
Balance at 30 June 2018 81,231,618 (13,147,527) - 411,424 68,495,515
For
per
sona
l use
onl
y

47
CONSOLIDATED STATEMENT OF CASH FLOWS FOR THE YEAR ENDED 30 JUNE 2019
Consolidated
Note 2019
$ 2018
$
Inflows/(Outflows)
Cash flows from operating activities
Payments to suppliers and employees (4,706,243) (2,990,321)
Interest received 266,129 279,207
Net cash used in operating activities 8 (4,440,114) (2,711,114)
Cash flows from investing activities
Payments for exploration and evaluation expenditure (7,087,168) (11,630,119)
Payments for investments in term deposits - (12,500,000)
Receipts from redemption of investments in term deposits - 12,500,000
Payments for plant and equipment (26,589,317) (2,495,975)
Research and development tax offset in relation to exploration assets 343,361 1,663,409
Net cash used in investing activities (33,333,124) (12,462,685)
Cash flows from financing activities
Proceeds from issue of shares 36,871,426 33,024,190
Payments for share issue costs (1,296,967) (1,451,713)
Net cash provided by financing activities 35,574,459 31,572,477
Net (decrease)/increase in cash held (2,198,779) 16,398,678
Cash and cash equivalents at the beginning of the period 20,694,184 4,295,506
Cash and cash equivalents at the end of the period 7 18,495,405 20,694,184
The accompanying notes form part of these consolidated financial statements.
For
per
sona
l use
onl
y

48
NOTES TO THE CONSOLIDATED FINANCIAL STATEMENTS FOR THE YEAR ENDED 30 JUNE 2019
NOTE 1: STATEMENT OF SIGNIFICANT ACCOUNTING POLICIES
(a) Basis of Preparation
The financial report is a general purpose financial report, which has been prepared in accordance with the requirements of the Corporations Act 2001, Accounting Standards and Interpretations and complies with other requirements of the law.
The accounting policies detailed below have been consistently applied to all years presented unless otherwise stated. The consolidated financial statements are for the consolidated entity consisting of Hastings Technology Metals Ltd and its subsidiaries. Hastings Technology Metals Ltd is a for-profit entity for the purpose of preparing the consolidated financial statements.
The financial report has also been prepared on a historical cost basis. Cost is based on the fair values of the consideration given in exchange for assets.
The Group is a listed public company, incorporated and operating in Australia. The entity’s principal activity is exploration for and development of natural resources.
(b) Statement of Compliance
The financial report was authorised for issue by the Board on 24 September 2019. The Board has the power to amend the consolidated financial statements after their issue.
The financial report complies with Australian Accounting Standards, which include Australian equivalents to International Financial Reporting Standards (AIFRS). Compliance with AIFRS ensures that the financial report, comprising the consolidated financial statements and notes thereto, complies with International Financial Reporting Standards (IFRS).
(c) Effects of Changes in Accounting Policy
The Group has applied the following standards and amendments for the first time for their annual reporting period commencing 1 July 2018:
• AASB 9 Financial Instruments
• AASB 15 Revenue from Contracts with Customers
• AASB 2014-7 Amendments to Australian Accounting Standards arising from AASB 9 (December 2014)
AASB 15 Revenue from Contracts with Customers
The new standard AASB 15 addresses how the Group must account for revenue related to contracts with its customers, including new and amended requirements with respect to, but not limited to: i) whether revenue is recognised over-time or at a point-in-time; ii) the indicators to determine when revenue is to be recognised;
The adoption of AASB 15 has not resulted in a material change in the timing or amount of reported revenue and therefore the Group has adopted AASB 15 on a fully retrospective basis, with no change to prior period comparative figures.
For
per
sona
l use
onl
y

49
NOTES TO THE CONSOLIDATED FINANCIAL STATEMENTS FOR THE YEAR ENDED 30 JUNE 2019
NOTE 1: STATEMENT OF SIGNIFICANT ACCOUNTING POLICIES (continued)
Effects of Changes in Accounting Policy (continued)
AASB 9 Financial Instruments
New standard AASB 9 addresses: (i) the classification, measurement and de-recognition of financial assets and financial liabilities; (ii) impairment of financial assets; and (iii) hedge accounting.
Based on the nature of the Group’s financial asset and liability balances and non-application of hedge accounting, there has been no material impact to the financial statements upon transition.
The adoption of AASB 9 has not resulted in a material change with respect to classification and measurement (including impairment) requirements, therefore there is no change to prior period comparative figures.
New standards not yet effective
The following Standards and Interpretations listed below were on issue but not yet effective:
The Group has reviewed all leasing arrangements over the last year in light of the new lease accounting rules in
AASB16. The standard will affect primarily the accounting for the Group’s operating leases.
Standard/Interpretation
Effective for annual
reporting periods
beginning
on or after
Expected to be
initially applied in
the financial year
ending
AASB 16 Leases
AASB 16:
• Replaces AASB 117 Leases and some lease-related
Interpretations
• requires all leases to be accounted for ‘on-balance sheet’ by
lessees, other than short-term and low value asset leases
• provides new guidance on the application of the definition of lease
and on sale and lease back accounting
• largely retains the existing lessor accounting requirements in
AASB 117
• requires new and different disclosures about leases
1 January 2019
30 June 2020
For
per
sona
l use
onl
y

50
NOTES TO THE CONSOLIDATED FINANCIAL STATEMENTS FOR THE YEAR ENDED 30 JUNE 2019
NOTE 1: STATEMENT OF SIGNIFICANT ACCOUNTING POLICIES (continued)
Effects of Changes in Accounting Policy (continued)
Impact of AASB 16
As at the 30 June 2019, the Group had non-cancellable operating lease commitments of $540,813. Of these commitments, $117,922 relate to short-term or low-value leases which will be recognised on a straight-line basis as expenses in profit or loss.
For the balance of lease commitments of $422,891 the Group expects to approximately recognise right-of-use assets of $389,000 on 1 July 2019, lease liabilities of $398,000 and an adjustment to retained earnings of $9,000. The Group expects that net loss after tax will increase by approximately $8,000 for the year ended 30 June 2020 as a result of adopting the new rules.
Operating cash outflows will decrease and financing cash outflows will increase by approximately $199,000 as repayment of the principal portion of lease liabilities will be classified as cash flows from financing activities.
The Group intends to apply the simplified transition approach and will not restate comparative amounts for the year prior to first adoption. Right-of-use assets for property leases will be measured on transition as if the new rules had always been applied. All other right-of-use assets will be measured at the amount of the lease liability on adoption.
(d) Going concern
The consolidated financial statements have been prepared on a going concern basis which contemplates the realisation of assets and the settlement of liabilities in the normal course of business.
As disclosed in the consolidated financial statements, the Group incurred losses of $5,163,438, had net cash outflows from operating activities of $4,440,114, net cash outflows from investing activities of $33,333,124, and net cash inflows from financing activities of $35,574,459 for the year ended 30 June 2019. At 30 June 2019 the Group had outstanding commitments for construction contracts of $20,405,535 all due within 12 months.
Based on the Group’s cash flow forecast the Group will require additional funding in the next 12 months to enable the Group to continue its normal business activities and to ensure the realisation of assets in the ordinary course of business and extinguishment of liabilities as and when they fall due, including progression of its exploration and project development activities.
The Group has net working capital as at 30 June 2019 of approximately $13 million, and based on the factors outlined below the Directors believe that it is reasonably foreseeable that the Group will continue as a going concern and that it is appropriate to adopt the going concern basis in the preparation of the financial report:
• The Group has been successful in raising approximately $37.6 million in equity (before costs) during the year and a further $3.5 million in equity subsequent to year end;
• Hastings has signed an exclusive mandate with German KfW IPEX-bank to provide project finance loan advisory services in relation to securing approval from Euler Hermes Aktiengesellschaft (“Euler Hermes”) as mandated by the German Federal Government as administrators of the Untied Loan Guarantee scheme (UFK). Euler Hermes has confirmed in principle eligibility for the German government UFK scheme for up to USD140 million;
• The Northern Australia Infrastructure Facility (NAIF), an Australian Government implemented initiative, is currently undertaking a review of the Group for potential infrastructure debt financing;
For
per
sona
l use
onl
y
51
NOTES TO THE CONSOLIDATED FINANCIAL STATEMENTS FOR THE YEAR ENDED 30 JUNE 2019
NOTE 1: STATEMENT OF SIGNIFICANT ACCOUNTING POLICIES (continued)
Going concern (continued)
• The Directors are of the view that the Group will be able to raise further equity capital prior to the financial close of debt funding with KfW IPEX-bank and NAIF.
As a result of the above, there is a material uncertainty that may cast significant doubt on the entity’s ability to continue as a going concern and, therefore, that the entity may be unable to realise its assets and discharge its liabilities in the normal course of business.
However, the Directors believe that the Group will be able to continue as a going concern and that it is appropriate to adopt the going concern basis in the preparation of the financial report.
The financial report does not include any adjustments relating to the amounts or classifications of recorded assets and liabilities that might be necessary if the Group do not continue as a going concern.
(e) Basis of consolidation
The consolidated financial statements incorporate the assets and liabilities of Hastings Technology Metals Ltd (‘Company’ or ‘parent entity’) as at 30 June 2019 and the results of subsidiaries for the year then ended. Hastings Technology Metals Ltd and its subsidiaries are referred to in this financial report as the Group or the Consolidated Entity. The financial statements of the subsidiaries are prepared for the same reporting period as the parent entity, using consistent accounting policies. In preparing the consolidated financial statements, all intercompany balances and transactions, income and expenses and profit and losses resulting from intra-group transactions have been eliminated.
The group controls an entity when the group is exposed to, or has rights to, variable returns from its involvement with the entity and has the ability to affect those returns through its power to direct the activities of the entity. Subsidiaries are fully consolidated from the date on which control is transferred to the group. They are deconsolidated from the date that control ceases.
(f) Critical accounting judgements and key sources of estimation uncertainty
The application of accounting policies requires the use of judgements, estimates and assumptions about carrying values of assets and liabilities that are not readily apparent from other sources. The estimates and associated assumptions are based on historical experience and other factors that are considered to be relevant. Actual results may differ from these estimates.
The estimates and underlying assumptions are reviewed on an ongoing basis. Revisions are recognised in the period in which the estimate is revised if it affects only that period or in the period of the revision and future periods if the revision affects both current and future periods.
Deferred Exploration expenditure:
The Directors continually assess the Group’s exploration projects to determine the existence of any indications of impairment. Where any such indications are present, an impairment assessment is conducted under AASB 6 and any resulting impairment is expensed to profit and loss. During the current financial year, no impairment triggers were identified.
For
per
sona
l use
onl
y

52
NOTES TO THE CONSOLIDATED FINANCIAL STATEMENTS FOR THE YEAR ENDED 30 JUNE 2019
NOTE 1: STATEMENT OF SIGNIFICANT ACCOUNTING POLICIES (continued)
Critical accounting judgements and key sources of estimation uncertainty (continued)
Property, plant and equipment:
The Directors continually assess the Group’s property, plant and equipment to determine the existence of any indications of impairment. Where any such indications are present, an impairment assessment is conducted under AASB 136 and any resulting impairment is expensed to profit and loss. During the current financial year, no impairment triggers were identified.
Share-based payment transactions:
The Group measures the cost of equity-settled transactions by reference to the fair value of the services provided. Where the services provided cannot be reliably estimated fair value is measure by reference to the fair value of the equity instruments at the date at which they are granted. The fair value of share-based payments is determined using either a Black-Scholes model or external valuations, see Note 14.
Issued options:
The Group issued options in conjunction with a share placement and rights issue during the year ended 30 June 2019. The fair value of the options was determined using a Black-Scholes model, see Note 14.
(g) Other income recognition
Other income is recognised to the extent that it is probable that the economic benefits will flow to the Group and the can be reliably measured. The only current source of other income is interest income.
(h) Interest income
Interest income is recognised on a time proportionate basis that takes into account the effective yield on the financial asset.
(i) Cash and cash equivalents
Cash comprises cash at bank and in hand. Cash equivalents are short term, highly liquid investments that are readily convertible to known amounts of cash and which are subject to an insignificant risk of changes in value. Cash and cash equivalents exclude term deposits with banks which mature beyond three months.
(j) Trade and other receivables
Trade receivables are amounts due from customers for goods sold or services performed in the ordinary course of business. They are generally due for settlement within 30 days and therefore are all classified as current. Other receivables are amounts generally arising from transactions outside the usual operating activities of the Group.
Receivables are recognised initially at fair value and then subsequently measured at amortised cost, less provision for credit losses. As at 30 June the Group has determined that the expected provision for credit losses is not material. In determining the recoverability of a trade or other receivable using the expected credit loss model, the Group performs a risk analysis considering the type and age of the outstanding receivables, the creditworthiness of the counterparty, contract provisions, and timing of payments.
For
per
sona
l use
onl
y

53
NOTES TO THE CONSOLIDATED FINANCIAL STATEMENTS FOR THE YEAR ENDED 30 JUNE 2019
NOTE 1: STATEMENT OF SIGNIFICANT ACCOUNTING POLICIES (continued)
(k) Property, plant and equipment
Property, plant and equipment is stated at historical cost less depreciation and impairment losses. Historical cost includes expenditure that is directly attributable to the acquisition of the items. Cost may also include transfers from equity of any gains or losses on qualifying cash flow hedges of foreign currency purchases of property, plant and equipment. Subsequent costs are included in the asset’s carrying amount or recognised as a separate asset, as appropriate, only when it is probable that future economic benefits associated with the item will flow to the group and the cost of the item can be measured reliably. The carrying amount of any component accounted for as a separate asset is derecognised when replaced. All other repairs and maintenance are charged to profit or loss during the reporting period in which they are incurred.
The depreciable amount of all fixed assets is depreciated on a straight line basis over the asset’s useful life to the Group commencing from the time the asset is held ready for use. Plant and equipment is depreciated over a period ranging from 3 to 20 years and in the case of mining plant over the life-of-mine, currently projected to be 10 years. The accommodation village is currently under construction. Software is depreciated over a period of 5 years. The assets’ residual values and useful lives are reviewed, and adjusted if appropriate, at the end of each reporting period.
Gains and losses on disposals are determined by comparing proceeds with carrying amount. These are included in profit or loss.
(l) Exploration and evaluation
Exploration and evaluation expenditures in relation to each separate area of interest are recognised as an exploration and evaluation asset in the year in which they are incurred where the following conditions are satisfied:
(i) the rights to tenure of the area of interest are current; and
(ii) at least one of the following conditions is also met:
(a) the exploration and evaluation expenditures are expected to be recouped through successful development and exploration of the area of interest, or alternatively, by its sale; or
(b) exploration and evaluation activities in the area of interest have not at the reporting date reached a stage which permits a reasonable assessment of the existence or otherwise of economically recoverable reserves, and active and significant operations in, or in relation to, the area of interest are continuing.
Exploration and evaluation assets are initially measured at cost and include acquisition of rights to explore, studies, exploratory drilling, trenching and sampling and associated activities and an allocation of depreciation and amortised of assets used in exploration and evaluation activities. General and administrative costs are only included in the measurement of exploration and evaluation costs where they are related directly to operational activities in a particular area of interest.
For
per
sona
l use
onl
y

54
NOTES TO THE CONSOLIDATED FINANCIAL STATEMENTS FOR THE YEAR ENDED 30 JUNE 2019
NOTE 1: STATEMENT OF SIGNIFICANT ACCOUNTING POLICIES (continued)
Exploration and evaluation (continued)
Exploration and evaluation assets are assessed for impairment when facts and circumstances suggest that the carrying amount of an exploration and evaluation asset may exceed its recoverable amount. The recoverable amount of the exploration and evaluation asset (for the cash generating unit(s) to which it has been allocated being no larger than the relevant area of interest) is estimated to determine the extent of the impairment loss (if any). Where an impairment loss subsequently reverses, the carrying amount of the asset is increased to the revised estimate of its recoverable amount, but only to the extent that the increased carrying amount does not exceed the carrying amount that would have been determined had no impairment loss been recognised for the asset in previous years.
A decision to proceed with development in respect of a particular area of interest is determined with reference to when the commercial viability and technical feasibility are demonstrated. Once a decision to proceed has occurred, the relevant exploration and evaluation asset is tested for impairment and the balance is then reclassified to development.
Research and development tax offsets received are accounted for as a reduction of exploration costs.
(m) Income tax
Current tax assets and liabilities for the current and prior periods are measured at the amount expected to be recovered from or paid to the taxation authorities. The tax rates and tax laws used to compute the amount are those that are enacted or substantively enacted by the balance date.
Research and development tax offsets are recognised on receipt against deferred exploration expenditure.
Deferred income tax is provided on all temporary differences at the balance date between the tax bases of assets and liabilities and their carrying amounts for financial reporting purposes.
Deferred income tax liabilities are recognised for all taxable temporary differences except:
• when the deferred income tax liability arises from the initial recognition of goodwill or of an asset or liability in a transaction that is not a business combination and that, at the time of the transaction, affects neither the accounting profit nor taxable profit or loss; or
• when the taxable temporary difference is associated with investments in subsidiaries, associates or interests in joint ventures, and the timing of the reversal of the temporary difference can be controlled and it is probable that the temporary difference will not reverse in the foreseeable future.
For
per
sona
l use
onl
y

55
NOTES TO THE CONSOLIDATED FINANCIAL STATEMENTS FOR THE YEAR ENDED 30 JUNE 2019
NOTE 1: STATEMENT OF SIGNIFICANT ACCOUNTING POLICIES (continued)
Income tax (continued)
Deferred income tax assets are recognised for all deductible temporary differences, carry-forward of unused tax assets and unused tax losses, to the extent that it is probable that taxable profit will be available against which the deductible temporary differences and the carry-forward of unused tax credits and unused tax losses can be utilised, except:
• when the deferred income tax asset relating to the deductible temporary difference arises from the initial recognition of an asset or liability in a transaction that is not a business combination and, at the time of the transaction, affects neither the accounting profit nor taxable profit or loss; or
• when the deductible temporary difference is associated with investments in subsidiaries, associates or interests in joint ventures, in which case a deferred tax asset is only recognised to the extent that it is probable that the temporary difference will reverse in the foreseeable future and taxable profit will be available against which the temporary difference can be utilised.
The carrying amount of deferred income tax assets is reviewed at each balance date and reduced to the extent that it is no longer probable that sufficient taxable profit will be available to allow all or part of the deferred income tax asset to be utilised.
Unrecognised deferred income tax assets are reassessed at each balance date and are recognised to the extent that it has become probable that future taxable profit will allow the deferred tax asset to be recovered.
Deferred income tax assets and liabilities are measured at the tax rates that are expected to apply to the year when the asset is realised or the liability is settled, based on tax rates (and tax laws) that have been enacted or substantively enacted at the balance date.
Income taxes relating to items recognised directly in equity are recognised in equity and not in profit or loss.
Deferred tax assets and deferred tax liabilities are offset only if a legally enforceable right exists to set off current tax assets against current tax liabilities and the deferred tax assets and liabilities relate to the same taxable entity and the same taxation authority.
(n) Other taxes
Revenues, expenses and assets are recognised net of the amount of GST except:
• when the GST incurred on a purchase of goods and services is not recoverable from the taxation authority, in which case the GST is recognised as part of the cost of acquisition of the asset or as part of the expense item as applicable; and
• receivables and payables, which are stated with the amount of GST included.
The net amount of GST recoverable from, or payable to, the taxation authority is included as part of receivables or payables in the statement of financial position.
Cash flows are included in the statement of cash flows on a gross basis and the GST component of cash flows arising from investing and financing activities, which is recoverable from, or payable to, the taxation authority are classified as operating cash flows.
For
per
sona
l use
onl
y

56
NOTES TO THE CONSOLIDATED FINANCIAL STATEMENTS FOR THE YEAR ENDED 30 JUNE 2019
NOTE 1: STATEMENT OF SIGNIFICANT ACCOUNTING POLICIES (continued)
Other taxes (continued)
Commitments and contingencies are disclosed net of the amount of GST recoverable from, or payable to, the taxation authority.
(o) Impairment of assets
The Group assesses at each reporting date whether there is an indication that an asset may be impaired. If any such indication exists, or when annual impairment testing for an asset is required, the Group makes an estimate of the asset’s recoverable amount. An asset’s recoverable amount is the higher of its fair value less costs of disposal and its value in use and is determined for an individual asset, unless the asset does not generate cash inflows that are largely independent of those from other assets or groups of assets and the asset's value in use cannot be estimated to be close to its fair value. In such cases the asset is tested for impairment as part of the cash-generating unit to which it belongs. When the carrying amount of an asset or cash-generating unit exceeds its recoverable amount, the asset or cash-generating unit is considered impaired and is written down to its recoverable amount.
In assessing value in use, the estimated future cash flows are discounted to their present value using a pre-tax discount rate that reflects current market assessments of the time value of money and the risks specific to the asset. Impairment losses relating to continuing operations are recognised in those expense categories consistent with the function of the impaired asset unless the asset is carried at revalued amount (in which case the impairment loss is treated as a revaluation decrease).
An assessment is also made at each reporting date as to whether there is any indication that previously recognised impairment losses may no longer exist or may have decreased. If such indication exists, the recoverable amount is estimated. A previously recognised impairment loss is reversed only if there has been a change in the estimates used to determine the asset’s recoverable amount since the last impairment loss was recognised. If that is the case the carrying amount of the asset is increased to its recoverable amount. That increased amount cannot exceed the carrying amount that would have been determined, net of depreciation, had no impairment loss been recognised for the asset in prior years. Such reversal is recognised in profit or loss unless the asset is carried at revalued amount, in which case the reversal is treated as a revaluation increase.
After such a reversal the depreciation charge is adjusted in future periods to allocate the asset’s revised carrying amount, less any residual value, on a systematic basis over its remaining useful life.
(p) Trade and other payables
Trade payables and other payables are carried at amortised cost and represent liabilities for goods and services provided to the Group prior to the end of the reporting period that are unpaid and arise when the Group becomes obliged to make future payments in respect of the purchase of these goods and services.
For
per
sona
l use
onl
y

57
NOTES TO THE CONSOLIDATED FINANCIAL STATEMENTS FOR THE YEAR ENDED 30 JUNE 2019
NOTE 1: STATEMENT OF SIGNIFICANT ACCOUNTING POLICIES (continued)
(q) Provisions
Provisions are recognised when the Group has a present obligation (legal or constructive) as a result of a past event, it is probable that an outflow of resources embodying economic benefits will be required to settle the obligation and a reliable estimate can be made of the amount of the obligation.
When the Group expects some or all of a provision to be reimbursed, for example under an insurance contract, the reimbursement is recognised as a separate asset but only when the reimbursement is virtually certain. The expense relating to any provision is presented in profit or loss net of any reimbursement.
If the effect of the time value of money is material, provisions are discounted using a current pre-tax rate that reflects the risks specific to the liability.
When discounting is used, the increase in the provision due to the passage of time is recognised as a borrowing cost.
(r) Share-based payment transactions
The Group provides incentives to employees (including senior executives) of the Group in the form of share-based payments, whereby employees receive performance rights over shares which will vest in the event performance hurdles are met (equity-settled transactions).
The cost of these equity-settled transactions with employees is measured by reference to the fair value of the equity instruments at the date at which they are granted.
The cumulative expense recognised for equity-settled transactions at each reporting date until vesting date reflects (i) the extent to which the vesting period has expired and (ii) the Group’s best estimate of the number of equity instruments that will ultimately vest. No adjustment is made for the likelihood of market performance conditions being met as the effect of these conditions is included in the determination of fair value at grant date. The profit or loss charge or credit for a period represents the movement in cumulative expense recognised as at the beginning and end of that period.
No expense is recognised for awards that do not ultimately vest, except for awards where vesting is only conditional upon a market condition.
If the terms of an equity-settled award are modified, as a minimum an expense is recognised as if the terms had not been modified. In addition, an expense is recognised for any modification that increases the total fair value of the share-based payment arrangement, or is otherwise beneficial to the employee, as measured at the date of modification.
If an equity-settled award is cancelled due to market conditions, it is treated as if it had vested on the date of cancellation, and any expense not yet recognised for the award is recognised immediately. If an equity-settled award is cancelled due to non-market conditions, it is treated as if it had vested on the date of cancellation, and no further expense is recognised. Any vested balances recognised in the share-based payment reserve is transferred and offset against retained earnings. However, if a new award is substituted for a cancelled award and designated as a replacement award on the date that it is granted, the cancelled and new award are treated as if they were a modification of the original award, as described in the previous paragraph.
For
per
sona
l use
onl
y
58
NOTES TO THE CONSOLIDATED FINANCIAL STATEMENTS FOR THE YEAR ENDED 30 JUNE 2019
NOTE 1: STATEMENT OF SIGNIFICANT ACCOUNTING POLICIES (continued)
(s) Issued capital
Ordinary shares are classified as equity. Incremental costs directly attributable to the issue of new shares or options are shown in equity as a deduction, net of tax, from the proceeds.
(t) Earnings per share
Basic earnings per share is calculated as net profit/loss attributable to members of the parent, adjusted to exclude any costs of servicing equity (other than dividends) and preference share dividends, divided by the weighted average number of ordinary shares, adjusted for any bonus element.
Diluted earnings per share is calculated as net profit/loss attributable to members of the parent, adjusted for:
• costs of servicing equity (other than dividends) and preference share dividends;
• the after tax effect of dividends and interest associated with dilutive potential ordinary shares that have been recognised as expenses; and
• other non-discretionary changes in revenues or expenses during the period that would result from the dilution of potential ordinary shares; divided by the weighted average number of ordinary shares and dilutive potential ordinary shares, adjusted for any bonus element.
(u) Parent entity financial information
The financial information for the parent entity, Hastings Technology Metals Ltd, disclosed in Note 24 has been prepared on the same basis as the consolidated financial statements, except as set out below.
(i) Investments in subsidiaries, associates and joint venture entities
Investment in subsidiaries are accounted for at cost in the financial statements of Hastings Technology Metals Ltd.
(ii) Share-based payments
Where relevant, the granting by the Group of options or performance rights over its equity instruments to the employees of subsidiary undertakings in the group is treated as a capital contribution to that subsidiary undertaking. The fair value of employee services received, measured by reference to the grant date fair value, is recognised over the vesting period as an increase to investment in subsidiary undertakings, with a corresponding credit to equity.
(v) Interest in a joint operation
The Group has an interest in a joint venture that is a joint operation. A joint venture is a contractual arrangement whereby two or more parties undertake an economic activity that is subject to joint control. A joint operation involves use of assets and other resources of the venturers rather than establishment of a separate entity. The Group recognises its interest in the joint operation by recognising the assets that it controls and the liabilities that it incurs. The Group also recognises the expenses that it incurs and its share of the income that it earns from the sale of goods or services by the joint operation.
For
per
sona
l use
onl
y

59
NOTES TO THE CONSOLIDATED FINANCIAL STATEMENTS FOR THE YEAR ENDED 30 JUNE 2019
NOTE 1: STATEMENT OF SIGNIFICANT ACCOUNTING POLICIES (continued)
(w) Segment reporting
Operating segments are reported in a manner consistent with the internal reporting provided to the chief operating decision maker. The chief operating decision maker, who is responsible for allocating resources and assessing performance of the operating segments, has been identified as the Board of Directors of Hastings Technology Metals Ltd.
(x) Foreign currency translation
(i) Functional and presentation currency Items included in the financial statements of each of the group’s entities are measured using the currency of the primary economic environment in which the entity operates (‘the functional currency’). The consolidated financial statements are presented in Australian dollar ($), which is Hastings Technology Metals Ltd’s functional and presentation currency.
(ii) Transactions and balances Foreign currency transactions are translated into the functional currency using the exchange rates at the dates of the transactions. Foreign exchange gains and losses resulting from the settlement of such transactions and from the translation of monetary assets and liabilities denominated in foreign currencies at year end exchange rates are generally recognised in profit or loss.
Foreign exchange gains and losses that relate to borrowings are presented in the statement of profit or loss, within finance costs. All other foreign exchange gains and losses are presented in the statement of profit or loss on a net basis within other income or other expenses.
Non-monetary items that are measured at fair value in a foreign currency are translated using the exchange rates at the date when the fair value was determined. Translation differences on assets and liabilities carried at fair value are reported as part of the fair value gain or loss. For example, translation differences on non-monetary assets and liabilities such as equities held at fair value through profit or loss are recognised in profit or loss as part of the fair value gain or loss and translation differences on non-monetary assets such as equities classified as available-for-sale financial assets are recognised in other comprehensive income.
(iii) Group Companies
The results and financial position of foreign operations (none of which has the currency of a hyperinflationary economy) that have a functional currency different from the presentation currency are translated into the presentation currency as follows:
• assets and liabilities for each balance sheet presented are translated at the closing rate at the date of that balance sheet;
• income and expenses for each statement of profit or loss and statement of comprehensive income are translated at average exchange rates (unless this is not a reasonable approximation of the cumulative effect of the rates prevailing on the transaction dates, in which case income and expenses are translated at the dates of the transactions); and
• all resulting exchange differences are recognised in other comprehensive income.
On consolidation, exchange differences arising from the translation of any net investment in foreign entities, and of borrowings and other financial instruments designated as hedges of such investments, are recognised in other comprehensive income. When a foreign operation is sold or any borrowings forming part of the net investment are repaid, the associated exchange differences are reclassified to profit or loss, as part of the gain or loss on sale.
For
per
sona
l use
onl
y

60
NOTES TO THE CONSOLIDATED FINANCIAL STATEMENTS FOR THE YEAR ENDED 30 JUNE 2019
NOTE 1: STATEMENT OF SIGNIFICANT ACCOUNTING POLICIES (continued)
(y) Finance Costs
Finance costs principally represent interest expense, bank charges and the unwinding of discounts on lease liabilities. They are recognised in the statement of profit & loss except when directly attributable with the construction of qualifying assets, where they are added to the cost of the qualifying asset until such time as the assets are substantially ready for their intended use or sale. Where funds are used to finance a qualifying asset form part of general borrowings, the amount capitalised is calculated using a weighted average of rates applicable to relevant borrowings during the construction period.
Investment income earned on the temporary investment of specific borrowings pending their expenditure on qualifying assets is deducted from the borrowing costs eligible for capitalisation.
NOTE 2: OTHER INCOME Consolidated
2019
$ 2018
$ Other income Interest income 258,027 281,241
258,027 281,241
NOTE 3: EMPLOYEE BENEFITS EXPENSE Consolidated
2019
$ 2018
$ Employee benefits expense Wages and salaries 4,629,477 2,486,472 Superannuation 375,438 222,059 Payroll tax 246,723 75,339 Provision for annual and long service leave 79,390 25,965 Other employee expenses 342,862 49,110 Geologist and technical costs capitalised (3,847,037) (2,035,051)
1,826,853 823,894
For
per
sona
l use
onl
y

61
NOTES TO THE CONSOLIDATED FINANCIAL STATEMENTS FOR THE YEAR ENDED 30 JUNE 2019 NOTE 4: INCOME TAX Consolidated
2019 $
2018 $
(a) Income tax expense Current tax - - Deferred tax - -
- -
(b) Income tax recognised in the statement of profit or loss and other comprehensive income
Loss from ordinary activities before tax (5,163,438) (2,891,278)
Income tax using the Group’s domestic tax rate of 27.5% (1,419,945) (795,101)
Share based payments 54,651 98,003
Other non-deductible items 883 27,461
Tax benefit on tax losses not recognised 1,364,411 669,637
Income tax benefit reported in the consolidated statement of comprehensive income - -
(c) Deferred tax balances
Deferred tax assets comprise:
Tax losses carried forward 8,029,073 11,244,516
Accrued expenses 197,960 44,206
Share issue costs 641,721 558,979
8,868,754 11,847,701
Deferred tax liabilities comprise:
Accrued income - (29,123)
Capitalised exploration costs (8,868,754) (11,818,578)
(8,868,754) (11,847,701)
(d) Income tax expense not brought to account in equity during the year
Share issue costs (456,811) (399,221)
(e) Tax losses
The Group has total carried forward tax losses of $8,916,327 available for offset against future assessable income of the Group. The deferred tax asset in respect of these losses has been used to offset a deferred tax liability. The net deferred tax asset attributable to residual tax losses of $887,254 has not been brought to account.
The benefit of deferred tax assets not brought to account will only be brought to account if:
• Future assessable income is derived of a nature and of an amount sufficient to enable the benefit to be realised; and
• The conditions for deductibility imposed by the relevant tax legislation continue to be complied with and no changes in tax legislation adversely affect the Group in realising the benefit.
For
per
sona
l use
onl
y

62
NOTES TO THE CONSOLIDATED FINANCIAL STATEMENTS FOR THE YEAR ENDED 30 JUNE 2019
NOTE 4: INCOME TAX (continued)
(f) Tax consolidation
Hastings Technology Metals Ltd and its wholly-owned Australia subsidiaries formed a tax consolidated group as of 1 July 2017 and have applied the tax consolidation legislation which means that these entities are taxed as a single entity. As a result, the deferred tax assets and deferred tax liabilities of these entities have been offset in the consolidated financial statements.
NOTE 5: EARNINGS PER SHARE 2019 2018
Basic loss per share:
Continuing operations (cents per share) (0.65) (0.43)
Loss used in the calculation of total basic loss per share reconciles to net loss in the statement of profit or loss and other comprehensive income as follows:
$ $
Loss used in the calculation of basic loss per share (5,163,438) (2,891,278)
Loss used in the calculation of basic loss per share from continuing operations (5,163,438) (2,891,278)
Basic loss per share Number of shares The earnings and weighted average number of ordinary shares used in the calculation of basic loss per share is as follows: 798,396,114 667,118,626
The Group has 19,533,333 (2018 - 15,458,333) performance rights on issue and a further 69,344,034 listed options. The performance rights and options are not considered dilutive as the Group has a loss.
NOTE 6: SEGMENT REPORTING
Identification of reportable segments
The Group has identified its operating segments based on the internal reports that are reviewed and used by the Board in assessing performance and in determining the allocation of resources.
The operating segments are identified by the Board based on the nature of its interests and projects. Discrete financial information about each of these projects is reported to the executive management team on at least a monthly basis.
For
per
sona
l use
onl
y

63
NOTES TO THE CONSOLIDATED FINANCIAL STATEMENTS FOR THE YEAR ENDED 30 JUNE 2019
NOTE 6: SEGMENT REPORTING (continued)
Location of interests and nature of projects Yangibana Project
Hastings owns the Yangibana rare earths project in the Gascoyne region of Western Australia through the 100% ownership of twelve (12) tenements/exploration licences and six (6) mining leases and through a 70% held joint venture comprising seven (7) granted exploration licences and three (3) mining lease, in all covering an area of approximately 650 square kilometres
Brockman Project
Hastings is the owner of the Brockman heavy rare earths project, comprising of ten (10) wholly owned prospecting licenses, in the East Kimberley region of Western Australia. The project hosts significant JORC compliant resources of the rare metals zircon, niobium and tantalum, and the heavy rare earth yttrium.
Accounting policies and inter-segment transactions
The accounting policies used by the Group in reporting segments internally are the same as those contained in Note 1 to the accounts and in the prior period.
Project segments
Brockman
Project Yangibana Project
Unallocated Total
30 June 2019 $ $ $ $
Other income
Interest and other income - - 258,027 258,027
Total segment other income - - 258,027 258,027
Expenses
Administration - - (5,421,465) (5,421,465)
Total segment expenses - - (5,421,465) (5,421,465)
Income tax benefit - - - -
Other comprehensive income - - 20,409 20,409
Segment result - - (5,143,029) (5,143,029)
Cash flows from operating activities - - (4,440,115) (4,440,115)
Cash flows from investing activities (24,281) (32,792,047) (516,796) (33,333,124)
Cash flows from financing activities - - 35,574,459 35,574,459
Segment assets 15,196,026 71,435,136 19,598,613 106,229,775
Segment liabilities - 6,583,704 200,796 6,784,500
Acquisition of exploration assets 24,281 5,946,461 - 5,970,742
Acquisition of property, plant and equipment - 26,050,371 346,980 26,397,351
For
per
sona
l use
onl
y

64
NOTES TO THE CONSOLIDATED FINANCIAL STATEMENTS FOR THE YEAR ENDED 30 JUNE 2019
NOTE 6: SEGMENT REPORTING (continued)
Interest income of $258,027 was solely derived within Australia. $9,462 in non-current assets are located overseas.
Project segments
Brockman
Project Yangibana Project
Unallocated Total
$ $ $ $
30 June 2018
Other income
Interest and other income - - 281,241 281,241
Total segment other income - - 281,241 281,241
Expenses
Administration - - (3,172,519) (3,172,519)
Total segment expenses - - (3,172,519) (3,172,519)
Income tax benefit - - - -
Other comprehensive income - - - -
Segment result - - (2,891,278) (2,891,278)
Cash flows from operating activities - - (2,711,114) (2,711,114)
Cash flows from investing activities (52,949) (12,024,264) (385,473) (12,462,686)
Cash flows from financing activities - - 31,572,478 31,572,478
Segment assets 15,171,745 38,975,183 21,716,935 75,863,863
Segment liabilities - 4,782,850 2,585,498 7,368,348
Acquisition of exploration assets 52,949 13,778,076 - 13,831,025
Acquisition of property, plant and equipment - 4,692,445 385,473 5,077,918
Interest income of $281,241 was solely derived within Australia. All non-current assets are located in Australia.
NOTE 7: CASH AND CASH EQUIVALENTS 2019
$
2018
$
Cash at bank and on hand 2,433,791 2,694,184
Short-term deposits 16,061,614 18,000,000
18,495,405 20,694,184
Cash at bank earns interest at floating rates based on daily bank deposit rates.
For
per
sona
l use
onl
y

65
NOTES TO THE CONSOLIDATED FINANCIAL STATEMENTS FOR THE YEAR ENDED 30 JUNE 2019
Note 7 Cash and cash equivalents (continued)
Short-term deposits are made for varying periods of between one day and three months, depending on the immediate cash requirements of the Group, and earn interest at the respective short-term deposit rates.
Short term deposits maturing after three months are shown as investments.
The Group did not engage in non-cash financing activities for the year ended 30 June 2019, other than:
• The issue of 400,000 shares at 21 cents each in settlement of underwriter invoices of $84,000;
• The issue of 1,880,000 shares at 17 cents each in settlement of supplier invoices of $319,600; and
• The issue of 1,648,016 shares at 17 cents each in settlement of underwriter invoices of $280,163.
For the year ended 30 June 2018, 1,000,000 shares at 20 cents each were issued in settlement of a supplier invoice of $200,000.
The Group was not party to any borrowing facilities during the year ended 30 June 2019 (2018 - $Nil).
The cash and cash equivalents disclosed above and in the consolidated statement of cash flows include $258,598 held in term deposits supporting cash backed bank guarantees and amounts due to suppliers. These deposits are therefore not available for general use.
NOTE 8: CASH FLOW INFORMATION
(a) Reconciliation of loss for the year to net cash flows from operating activities
2019
$
2018
$
Loss for the year (5,163,438) (2,891,278)
Other non-cash items:
Share based payments expense 198,732 356,375
Depreciation 96,713 32,355
Loss on sale of assets 16,423 -
Supplier invoices settled in shares 319,600 -
Changes in working capital
Increase in trade and other receivables (525,941) (210,559)
Increase in trade and other payables 617,796 1,993
Net cash used in operating activities (4,440,115) (2,711,114)
For non-cash financing activities during the year see Note 7.
For
per
sona
l use
onl
y

66
NOTES TO THE CONSOLIDATED FINANCIAL STATEMENTS FOR THE YEAR ENDED 30 JUNE 2019
The Group applies the AASB 9 simplified approach to measuring expected credit losses which uses a lifetime expected loss allowance. No impairment losses were recognised against the prepayments, GST recoverable, or interest receivable.
NOTE 10: PLANT AND EQUIPMENT
Plant and Equipment
Software Construction in Progress
Total
Cost
Opening balance, 1 July 2017 41,397 - - 41,397
Additions 162,423 223,050 4,692,445 5,077,918
Closing balance, 30 June 2018 203,820 223,050 4,692,445 5,119,315
Opening balance, 1 July 2018 203,820 223,050 4,692,445 5,119,315
Foreign exchange 152 - - 152
Disposals (29,439) - - (29,439)
Additions 295,355 230,996 25,898,797 26,425,148
Closing balance, 30 June 2019 469,888 454,046 30,591,242 31,515,176
Depreciation
Opening balance, 1 July 2017 (16,017) - - (16,017)
Depreciation (30,205) (2,150) - (32,355)
Closing balance, 30 June 2018 (46,222) (2,150) - (48,372)
Opening balance, 1 July 2018 (46,222) (2,150) - (48,372)
Foreign exchange (780) - - (780)
Disposals 6,215 - - 6,215
Depreciation (77,287) (19,426) - (96,713)
Closing balance, 30 June 2019 (118,074) (21,576) - (139,650)
Book value 30 June 2018 157,598 220,900 4,692,445 5,070,943
Book value 30 June 2019 351,814 432,470 30,591,242 31,375,526
NOTE 9: TRADE AND OTHER RECEIVABLES
2019
$ 2018
$ Prepayments
923,612 164,035 GST recoverable
317,236 435,984 Interest receivable
30,630 43,719
Trade and other receivables 1,271,478 643,738
For
per
sona
l use
onl
y

67
NOTES TO THE CONSOLIDATED FINANCIAL STATEMENTS FOR THE YEAR ENDED 30 JUNE 2019
NOTE 11: DEFERRED EXPLORATION AND EVALUATION EXPENDITURE
2019
$ 2018
$
Costs carried forward in respect of areas of interest in the following phases:
Exploration and evaluation phase – at cost
Balance at beginning of year 49,454,998 37,287,382
Exploration expenditure 5,970,742 13,831,025
Less research and development tax offset (338,374) (1,663,409)
Total deferred exploration and evaluation expenditure 55,087,366 49,454,998
The recoupment of costs carried forward in relation to areas of interest in the exploration and evaluation phases is dependent on the successful development and commercial exploitation or sale of the respective areas.
(i)
NOTE 12: TRADE AND OTHER PAYABLES
2019
$ 2018
$
Trade payables 5,723,159 6,940,333
Accruals 860,545 306,609
Total trade and other payables 6,583,704 7,246,942
Trade payables are non-interest bearing and are normally settled on 45-day terms.
NOTE 13: EMPLOYEE BENEFIT OBLIGATIONS
2019 2018
Current
$
Non-current
$ Total
$ Current
$
Non-current
$ Total
$ Annual leave Opening balance 74,332 - 74,332 63,719 - 63,719 Additions 62,406 - 62,406 10,613 - 10,613
Closing Balance 136,738 - 136,738 74,332 - 74,332
Long Service Leave Opening balance - 47,074 47,074 - - - Additions - 16,983 16,983 - 47,074 47,074
Closing balance - 64,057 64,057 - 47,074 47,074
F
or p
erso
nal u
se o
nly

68
NOTES TO THE CONSOLIDATED FINANCIAL STATEMENTS
2019 2018
Movements in ordinary shares on issue No. No.
At 1 July 711,512,675 532,159,904
Movements during the period
Shares issued in lieu of supplier payment (note 7) - 1,000,000
Shares issued on vesting of performance rights 398,000 850,000
Shares issued – share purchase plan - 51,046,512
Shares issued – share placement 137,949,644 86,975,000
Shares issued – rights issue 67,301,357 39,481,259
At 30 June 917,161,676 711,512,675
Ordinary shares entitle the holder to participate in dividends and the proceeds on winding up the Company in proportion to the number of and amounts paid on the shares held. On a show of hands every holder of ordinary shares present at a meeting in person or by proxy is entitled to one vote, and upon a poll each share is entitled to one vote.
Ordinary shares have no par value and the Company does not have a limited amount of authorised capital.
FOR THE YEAR ENDED 30 JUNE 2019
NOTE 14: ISSUED CAPITAL
2019
$ 2018
$ Ordinary shares
At 1 July 81,231,618 48,811,141
Shares issued – share purchase plan - 4,390,000
Shares issued – placement 23,900,974 16,945,000
Shares issued – rights issue 9,354,887 12,239,190
Shares issued in lieu of supplier payment - 200,000
Shares issued on vesting of performance rights 31,917 98,000
Less share issue costs (1,661,132) (1,451,713)
At 30 June 112,858,264 81,231,618
For
per
sona
l use
onl
y

69
NOTES TO THE CONSOLIDATED FINANCIAL STATEMENTS FOR THE YEAR ENDED 30 JUNE 2019 Note 14 Issued capital (continued) Listed options Listed options carry no voting rights and carry no right to dividends:
The call options have been valued using the Black Scholes Option Pricing Model at $0.062 per option assuming a 64% volatility (based on the last 12 months of trading prior to being issued) and a Reserve Bank of Australia cash rate of 1.5%.
2019 2018
No. No. Movements in share options
At 1 July - -
Options issued – placement 35,693,318 -
Options issued – rights issue 33,650,716
At 30 June 69,334,034 -
The following table illustrates the number (No.) and weighted average exercise prices of and movements in share options during the year:
No. Weighted average
exercise price No. Weighted average exercise price
2019 2019 $
2018 2018 $
Outstanding at the beginning of the year - - - -
Issued during the year 69,344,026 $0.25 - -
Outstanding at the end of the year 69,344,026 $0.25 - -
Exercisable at the end of the year 69,344,026 $0.25 - -
The options have an expiry date of 12 April 2022.
2019
$ 2018
$ Options
At 1 July - -
Options issued – placement 2,212,986 -
Options issued – rights issue 2,086,343 -
At 30 June 4,299,329 -
For
per
sona
l use
onl
y

70
NOTES TO THE CONSOLIDATED FINANCIAL STATEMENTS FOR THE YEAR ENDED 30 JUNE 2019
Note 14 Issued capital (continued) Performance Rights
Share based payments reserve
2019 2018
Movements in share-based payments reserve were as follows: $ $
Balance 1 July 411,424 190,449
Performance rights vested – transferred to issued capital (31,916) (98,000)
Performance rights lapsed – transferred to accumulated losses (247,721) (37,400)
Value of performance rights issued during the year 210,923 356,375
Balance 30 June 342,710 411,424
The share-based payments reserve is used to record the value of equity benefits provided to employees and directors as part of remuneration.
2019 No.
2018 No.
Movements in performance rights
At 1 July 15,458,333 17,600,000
Performance rights issued during the year 5,200,000 1,500,000
Performance rights vested during the year (398,000) (850,000)
Performance rights lapsed during the year (727,000) (2,791,667)
At 30 June 19,533,333 15,458,333
Valuation of performance rights
Shareholders at the 2016 Annual General Meeting approved the grant of 15,000,000 performance rights to Directors. The
performance rights, which are subject to a three-year performance period, were valued based on the share price on grant
date discounted for lack of marketability as follows: Tranche A: 3,750,000 at $0.026, Tranche B: 3,750,000 at $0.018,
Tranche C: 7,500,000 at $0.0125.
Of these performance rights 1,666,667 rights lapsed during the year ended 30 June 2018 on the resignation of a director.
Vesting occurs at the end of the performance period ended 28 November 2019, if the following performance conditions are
met:
Non-market based performance conditions:
• regulatory approval of Mining Proposal Plan with Mine Closure;
• achieving additional financing of debt and equity totalling $100 million; and
• award of the construction contract for the beneficiation plant.
Market-based performance conditions:
• 25% of the performance rights will vest when market capitalisation exceeds $75 million; and
• 50% of the performance rights will vest when market capitalisation exceeds $125 million; and
• 100% of the performance rights will vest when market capitalisation exceeds $175 million.
An expense of $30,194 was recognised for the year ended 30 June 2019 (2018 - $173,333) in relation to these performance rights.
For
per
sona
l use
onl
y

71
NOTES TO THE CONSOLIDATED FINANCIAL STATEMENTS FOR THE YEAR ENDED 30 JUNE 2019
Note 14 Issued capital (continued)
i. The movement in employee performance rights during the year is as follows:
Date granted Balance 30 June 2018
Value per share
Performance period ended Issued Vested Lapsed
Balance 30 June 2019
29 June 2017 625,000 8.8 cents 20 June 2018 - (398,000) (227,000) -
26 June 2018 1,000,000 22.5 cents 31 August 2019 - - - 1,000,000
26 June 2018 500,000 22.5 cents 31 December 2019 - - (500,000) -
4 June 2019 - 17.0 cents 31 December 2019 1,950,000 - - 1,950,000
4 June 2019 - 17.0 cents 31 December 2020 1,350,000 - - 1,350,000
4 June 2019 - 17.0 cents 31 December 2021 1,900,000 - - 1,900,000
2,125,000 5,200,000 (398,000) (727,000) 6,200,000
Non-market based performance conditions comprise key objectives specific to each employee. The probability of employees achieving performance rights has a range of between 70% and 80%.
An expense of $180,729 (2018 - $183,042) was recognised during the year in relation to these performance rights.
NOTE 15: FINANCIAL ASSETS AND FINANCIAL LIABILITIES
2019 $
2018 $
Financial assets
Cash and cash equivalents 18,495,405 20,694,184
Receivables 1,271,478 643,738
19,766,883 21,337,922
Financial Liabilities
Trade and other payables 6,583,704 7,246,942
6,583,704 7,246,942
For
per
sona
l use
onl
y

72
NOTES TO THE CONSOLIDATED FINANCIAL STATEMENTS FOR THE YEAR ENDED 30 JUNE 2019 Financial assets and financial liabilities (continued)
The following table details the expected maturity for the Group’s non-derivative financial assets. These have been drawn up based on undiscounted contractual maturities of the financial assets including interest that will be earned on those assets except where the Group anticipates that the cash flow will occur in a different period.
Weighted average effective
interest rate
Less than 1 month
1 – 3 Months
3 months – 1 year 1 – 5 years
5+ years
% $ $ $ $ $
2019
Non-interest bearing - - - - -
Variable interest rate instruments
- 2,433,791 - - - -
Fixed interest rate instruments 2.3% 3,000,000 13,061,614 - - -
5,433,791 13,061,614 - - -
2018
Non-interest bearing - - - - -
Variable interest rate instruments
- 2,694,184 - - - -
Fixed interest rate instruments 2.1% 5,000,000 13,000,000 - - -
7,694,184 13,000,000 - - -
NOTE 16: FINANCIAL RISK MANAGEMENT OBJECTIVES AND POLICIES
The Group has exposure to the following risks from their use of financial instruments:
• Credit risk
• Liquidity risk
• Interest rate risk
• Market risk
This note presents the information about the Group’s exposure to each of the above risks, their objectives, policies and processes for measuring and managing risk, and the management of capital.
The Board has overall responsibility for the establishment and oversight of the risk management framework. The Board reviews and agrees policies for managing each of these risks as summarised below.
The Group’s principal financial instruments comprise cash and short-term deposits. The main purpose of the financial instruments is to earn the maximum amount of interest at a low risk to the Group. The Group also has other financial instruments such as trade debtors and creditors which arise directly from its operations.
The Directors consider that the carrying value of the financial assets and financial liabilities recognised in the consolidated financial statements approximate their fair values.
For
per
sona
l use
onl
y

73
NOTES TO THE CONSOLIDATED FINANCIAL STATEMENTS FOR THE YEAR ENDED 30 JUNE 2019
NOTE 16: FINANCIAL RISK MANAGEMENT OBJECTIVES AND POLICIES (continued)
(a) Credit risk management
Credit risk refers to the risk that a counter-party will default on its contractual obligations resulting in financial loss to the Group. The Group has adopted a policy of only dealing with creditworthy counterparties (rated AAA or AA) and obtaining sufficient collateral where appropriate, as a means of mitigating the risk of financial loss from defaults. The Group only transacts with entities that are rated the equivalent of investment grade and above. This information is supplied by independent rating agencies where available and, if not available, the Group uses publicly available financial information and its own trading record to rate its major customers. The Group’s exposure and the credit ratings of its counterparties are continuously monitored and the aggregate value of transactions concluded is spread amongst approved counterparties. Credit exposure is controlled by counterparty limits that are reviewed and approved by the risk management committee annually.
The credit risk on liquid funds is limited because the counterparties are banks with high credit ratings assigned by international credit rating agencies. The Group will only deposit funds with financial institutions rate AAA or AA.
The carrying amount of financial assets recorded in the consolidated financial statements, net of any allowance for losses, represents the Group’s maximum exposure to credit risk without taking account of the value of any collateral obtained.
(b) Liquidity risk management
Ultimate responsibility for liquidity risk management rests with the Board of Directors, who have built an appropriate liquidity risk management framework for the management of the Group’s short, medium and long-term funding and liquidity management requirements. The Group manages liquidity risk by maintaining adequate reserves, banking facilities and reserve borrowing facilities by continuously monitoring forecast and actual cash flows and matching the maturity profiles of financial assets and liabilities. The Group did not have any undrawn facilities at its disposal as at balance date.
The tables below reflect an undiscounted contractual maturity analysis for financial liabilities.
Consolidated Group
Within 1 year 1 to 5 years Over 5 years Total
2019
$
2018
$
2019
$
2018
$
2019
$
2018
$
2019
$
2018
$
Financial liabilities - due for payment:
Trade and other payables 6,583,704 7,246,942 - 74,332 - - 6,583,704 7,321,274
Total contractual outflows 6,583,704 7,246,942 - 74,332 - - 6,583,704 7,321,274
Management and the Board monitor the Group’s liquidity reserve on the basis of expected cash flow. The information that is prepared by senior management and reviewed by the Board includes:
(i) Annual cash flow budgets; (ii) Monthly rolling cash flow forecasts.
For
per
sona
l use
onl
y

74
NOTES TO THE CONSOLIDATED FINANCIAL STATEMENTS FOR THE YEAR ENDED 30 JUNE 2019
NOTE 16: FINANCIAL RISK MANAGEMENT OBJECTIVES AND POLICIES (continued)
(c) Interest rate risk management
The Group is exposed to interest rate risk as the Group deposits the bulk of the Group’s cash reserves in term deposits with Westpac and HSBC. The risk is managed by the Group by maintaining an appropriate mix of short-term deposits.
The following tables summarise the sensitivity of the Group’s financial assets and liabilities to interest rate risk. Had the relevant variables, as illustrated in the tables, moved, with all other variables held constant, post tax profit and equity would have been affected as shown. The analysis has been performed on the same basis for 2019 and 2018.
1Cash and cash equivalents are denominated in AUD include deposits at call at floating and short-term fixed interest rates.
(d) Market risk
Market risk is the risk that changes in market prices such as foreign exchange rates, interest rates and equity prices will affect the Group’s income or value of the holdings of financial instruments. The Group is exposed to movements in market interest rates on short-term deposit. The policy is to monitor the interest rate yield curve out to 120 days to ensure a balance is maintained between the liquidity of cash assets and the interest rate return. The Group does not have short or long-term debt, and therefore this risk is minimal.
Consolidated Interest Rate Risk Interest Rate Risk
30 June 2019 Carrying -1% +1%
Amount Profit Equity Profit Equity
$ $ $ $ $
Financial Assets Footnote
Cash and cash equivalents 1 18,495,405 (184,954) (184,954) 184,954 184,954
Consolidated Interest Rate Risk Interest Rate Risk
30 June 2018 Carrying -1% +1%
Amount Profit Equity Profit Equity
$ $ $ $ $
Financial Assets Footnote
Cash and cash equivalents 1 20,694,184 (206,942) (206,942) 206,942 206,942
For
per
sona
l use
onl
y

75
NOTES TO THE CONSOLIDATED FINANCIAL STATEMENTS FOR THE YEAR ENDED 30 JUNE 2019
NOTE 17: COMMITMENTS AND CONTINGENCIES
Remuneration Commitments
The Group has a contract with the Executive Chairman with annual remuneration of $405,000 (excluding directors fees of $120,000) which can be terminated by either party by giving 12 months’ notice. The Group has entered into employment contracts with termination periods of between one and three months. The Group also employs consultants who are contracted under standard consultancy rates. There were no other remuneration commitments made.
Guarantees
The Group has provided cash backed financial guarantees in respect of property leases amounting to $104,948 for the year ended 20 June 2019 (2018 - $Nil). No liability has been recognized in relation to these financial guarantees.
Western Australian Projects
The Group has minimum expenditure commitments on its beneficially owned Western Australian granted tenements.
The consolidated group currently has commitments for expenditure as at balance date on its Australian exploration tenements as follows:
2019
$
2018
$ Not later than 12 months 1,042,793 1,075,191 Between 12 months and 5 years 2,782,373 2,612,550 Greater than 5 years 6,079,003 7,030,792
9,904,169 10,535,792
The Company leases offices under non-cancellable operating leases expiring within three years. Commitments for minimum lease payments in relation to non-cancellable operating leases are payable as follows:
2019
$
2018
$ Not later than 12 months 176,842 210,261 Between 12 months and 5 years 222,549 339,391 Greater than 5 years - -
339,391 609,652
As at 30 June 2019, outstanding commitments for construction contracts amounted to $20,405,535 (2018 - $7,910,362), all due within 12 months. There were no commitments due later than 12 months.
For
per
sona
l use
onl
y

76
NOTES TO THE CONSOLIDATED FINANCIAL STATEMENTS FOR THE YEAR ENDED 30 JUNE 2019
NOTE 18: DIVIDENDS
The directors of the Group have not declared any dividend for the year ended 30 June 2019 (2018 - $Nil).
NOTE 19: CONTINGENT LIABILITIES
There are no contingent liabilities at year end.
NOTE 20: EVENTS SUBSEQUENT TO REPORTING DATE
Since 30 June 2019 the Group has issued 20,700,000 shares and 10,350,000 options as part of the May 2019 rights issue shortfall raising $3,519,000 (before costs). The options have an exercise price of 25 cents and an expiry date of 12 April 2022.
Other than as outlined above, there were no matters or circumstances that have arisen since the end of the financial period that have significantly affected or may significantly affect the operations of the consolidated entity, the results of those operations, or state-of-affairs of the consolidated entity in future financial years.
NOTE 21: AUDITOR’S REMUNERATION
The auditor of Hastings Technology Metals Ltd is PricewaterhouseCoopers (previously HLB Mann Judd).
2019
$
2018
$ Amounts received or due and receivable by PricewaterhouseCoopers for:
An audit or review of the financial reports 74,672 40,750
Amounts received or due and receivable by HLB Mann Judd for:
An audit or review of the financial reports - 15,000
Taxation compliance and advisory - 7,515
74,672 63,265
For the 2018 financial year the Group received approval from the Australian Securities and Investments Commission (ASIC) to change its auditors. PricewaterhouseCoopers (PwC) has been appointed by the Board as the Group's auditor, and in accordance with section 327C of the Corporations Act 2001, a resolution was passed at the 2018 Annual General Meeting ratifying the appointment.
For
per
sona
l use
onl
y

77
NOTES TO THE CONSOLIDATED FINANCIAL STATEMENTS FOR THE YEAR ENDED 30 JUNE 2019
NOTE 22: DIRECTORS AND EXECUTIVES DISCLOSURES
Key management personnel remuneration has been included in the Remuneration Report section of the Directors’ Report.
2019 $
2018 $
Short term benefits 1,401,676 1,182,664
Post-employment benefits 43,970 44,965
Performance rights 33,529 110,284
1,479,175 1,337,913
NOTE 23: RELATED PARTY DISCLOSURES
The consolidated financial statements include the financial statements of Hastings Technology Metals Ltd and the subsidiaries listed in the following table.
Country of Functional % Equity Interest Investment ($)
Name Incorporation Currency 2019 2018 2019 2018
Brockman Project Holdings Pty Ltd Australia A$ 100% 100% 4,000,000 4,000,000
Gascoyne Metals Pty Ltd Australia A$ 100% 100% 2,050,000 2,050,000
Yangibana Pty Ltd (Note 24) Australia A$ 100% 100% 85,000 85,000
Hastings Technology Metals (Asia) Limited Hong Kong HK$ 100% 100% 100 100
Hastings Technology Metals Pte Ltd Singapore S$ 100% 100% 99,602 99,602
Hastings Technology Metals Ltd is the ultimate Australian parent entity and ultimate parent of the Group.
Office rental and administration expenses¹ 88,180 83,224
Capital raising fees² 215,555
375,000
¹Office rental and administration expenses were paid to Equator Capital Pte Ltd, a company associated with the Executive Chairman, Mr Charles Lew. These fees are commensurate with those charged on an arm’s length basis.
²During the year ended 30 June 2019, the Group paid an underwriting fee of $50,000 to Mr Charles Lew. An amount of $165,555 was paid to Mr Jean Claude Steinmetz being fees relating to capital raising.. For the year ended 30 June 2018, the Group paid capital raising fees with respect to an underwritten rights issue of $375,000 to Equator Capital Management Limited, a company in which Mr Charles Lew has a minority interest.
Related party transactions with key management personnel 2019
$ 2018
$
For
per
sona
l use
onl
y

78
NOTES TO THE CONSOLIDATED FINANCIAL STATEMENTS FOR THE YEAR ENDED 30 JUNE 2019
NOTE 23: RELATED PARTY DISCLOSURES (continued)
Shares and options acquired via placements and rights issues with key management personnel
1 Options exercisable at 25 cents per share expiring on 12 April 2022
30 June 2019
Ordinary Shares
Purchased
Options Purchased1
$
Mr Charles Lew 5,882,353 2,941,177 1,000,000
Mr Jean Claude Steinmetz 200,000 100,000 34,000
Mr Malcolm Randall 65,074 32,537 11,063
Mr Andrew Reid 30,000 15,000 5,100
Total 6,177,427 3,088,714 1.050.163
30 June 2018
Ordinary Shares
Purchased
Options Purchased
$
Mr Charles Lew 5,909,909 - 777,072
Mr Jean Claude Steinmetz 370,890 - 64,906
Mr Guy Robertson 296,881 - 78,283
Mr Anthony Ho 125,000 - 25,000
Mr Aristeidis Stamoulis 10,000 - 3,100
Total 6,712,680 - 948,361
For
per
sona
l use
onl
y

79
NOTES TO THE CONSOLIDATED FINANCIAL STATEMENTS FOR THE YEAR ENDED 30 JUNE 2019 NOTE 24: PARENT ENTITY DISCLOSURES
Contingent liabilities of the parent entity
For details on contingent liabilities, see Note 19.
Commitments of the parent entity
The parent entity has:
• Tenement commitment obligations of $Nil (2018 - $Nil) as at 30 June 2019; and
• Leases offices under non-cancellable operating leases expiring within three years. Commitments for minimum lease payments in relation to non-cancellable operating leases are payable as follows:
2019
$
2018
$ Not later than 12 months 176,842 210,261 Between 12 months and 5 years 222,549 339,391 Greater than 5 years - -
339,391 609,652
NOTE 25: INTEREST IN JOINT OPERATION
The Group has a 70% interest in the Yangibana joint venture (2018 - 70%), which is involved in the exploration, development and exploitation of rare metal resources in the Gascoyne region of Western Australia. For joint venture tenements see Tenement Schedule (page 27). The Group is the manager of and is sole funding the joint venture up until a decision to commission a Bankable Feasibility Study. Refer to Note 17 for details on capital commitments and guarantees. There were no impairment triggers identified in the jointly controlled operation.
Company 2019 2018 $ $ Assets Current assets 19,649,957 21,279,177 Non-current assets 86,477,358 54,571,894
Total assets 106,127,315 75,851,071
Liabilities Current liabilities 6,704,975 7,357,672 Non-current liabilities 64,057 47,074
Total liabilities 6,769,032 7,404,746
Net Assets 99,358,283 68,446,325
Equity Issued capital 112,858,264 81,231,618 Reserves 4,642,039 411,424 Accumulated Losses (18,142,020) (13,196,717)
Total Equity 99,358,283 68,446,325
Financial performance Loss for the year (5,181,594) (2,888,751) Other comprehensive income - -
Total comprehensive loss (5,181,594) (2,888,751)
For
per
sona
l use
onl
y

80
DIRECTORS’ DECLARATION
1. In the opinion of the directors of Hastings Technology Metals Ltd (‘the Company or the Group’’):
a. The consolidated financial statements and notes thereto, as set out on pages 28 to 79, are in accordance with the Corporations Act 2001 including:
i. giving a true and fair view of the Group’s financial position as at 30 June 2019 and of the performance of the Group for the year then ended; and
ii. complying with Australian Accounting Standards (including the Australian Accounting Interpretations), the Corporations Regulations 2001, professional reporting requirements and other mandatory requirements.
b. Subject to the matters set out in Note 1(d) to the Financial Statements, there are reasonable grounds to believe that the Group will be able to pay its debts as and when they become due and payable.
c. The consolidated financial statements and notes thereto are in accordance with International Financial Reporting Standards issued by the International Accounting Standards Board.
2. This declaration has been made after receiving the declarations required to be made to the directors in accordance with Section 295A of the Corporations Act 2001 for the financial year ended 30 June 2019.
This declaration is signed in accordance with a resolution of the Board of Directors made pursuant to s.303(5) of the Corporations Act 2001.
Guy Robertson Executive Director
24 September 2019
For
per
sona
l use
onl
y

PricewaterhouseCoopers, ABN 52 780 433 757 Brookfield Place, 125 St Georges Terrace, PERTH WA 6000, GPO Box D198, PERTH WA 6840 T: +61 8 9238 3000, F: +61 8 9238 3999, www.pwc.com.au
Liability limited by a scheme approved under Professional Standards Legislation.
Independent auditor’s report To the members of Hastings Technology Metals Ltd
Report on the audit of the financial report
Our opinion
In our opinion:
The accompanying financial report of Hastings Technology Metals Ltd (the Company) and its controlled entities (together the Group) is in accordance with the Corporations Act 2001, including:
(a) giving a true and fair view of the Group's financial position as at 30 June 2019 and of its financial performance for the year then ended
(b) complying with Australian Accounting Standards and the Corporations Regulations 2001.
What we have audited The Group financial report comprises:
the consolidated statement of financial position as at 30 June 2019
the consolidated statement of changes in equity for the year then ended
the consolidated statement of cash flows for the year then ended
the consolidated statement of profit or loss and other comprehensive income for the year then ended
the notes to the consolidated financial statements, which include a summary of significant accounting policies
the directors’ declaration.
Basis for opinion
We conducted our audit in accordance with Australian Auditing Standards. Our responsibilities under those standards are further described in the Auditor’s responsibilities for the audit of the financial report section of our report.
We believe that the audit evidence we have obtained is sufficient and appropriate to provide a basis for our opinion.
Independence We are independent of the Group in accordance with the auditor independence requirements of the Corporations Act 2001 and the ethical requirements of the Accounting Professional and Ethical Standards Board’s APES 110 Code of Ethics for Professional Accountants (the Code) that are relevant to our audit of the financial report in Australia. We have also fulfilled our other ethical responsibilities in accordance with the Code.
For
per
sona
l use
onl
y

Material uncertainty related to going concern
We draw attention to Note 1(d) in the financial report, which indicates that the Group incurred a net loss after tax of $5,163,438 and a net cash outflow from operating activities of $4,440,114 and has outstanding commitments for construction contracts 0f $20,405,535 all due within 12 months. As a result, the Group is dependent on raising additional funding in the next 12 months to enable it to continue its normal business activities, including progression of its exploration and project development activities. These conditions, along with other matters set forth in Note 1(d), indicate that a material uncertainty exists that may cast significant doubt on the Group’s ability to continue as a going concern. Our conclusion is not modified in respect of this matter.
Our audit approach
An audit is designed to provide reasonable assurance about whether the financial report is free from material misstatement. Misstatements may arise due to fraud or error. They are considered material if individually or in aggregate, they could reasonably be expected to influence the economic decisions of users taken on the basis of the financial report.
We tailored the scope of our audit to ensure that we performed enough work to be able to give an opinion on the financial report as a whole, taking into account the geographic and management structure of the Group, its accounting processes and controls and the industry in which it operates.
Materiality Audit scope
For the purpose of our audit we used overall Group materiality of $1,060,000, which represents approximately 1% of the Group’s total assets.
We applied this threshold, together with qualitative considerations, to determine the scope of our audit and the nature, timing and extent of our audit procedures and to evaluate the effect of misstatements on the financial report as a whole.
We chose Group's total assets because, in our view, it is the benchmark against which the performance of the Group is most commonly measured whilst in the exploration and development phase.
We utilised a 1% threshold based on our professional judgement, noting it is within the range of commonly acceptable thresholds.
Our audit focused on where the Group made subjective judgements; for example, significant accounting estimates involving assumptions and inherently uncertain future events.
The Group’s operational and financial processes are managed by a corporate function in Perth, where substantially all of our audit procedures were performed.
For
per
sona
l use
onl
y

Key audit matters
Key audit matters are those matters that, in our professional judgement, were of most significance in our audit of the financial report for the current period. The key audit matters were addressed in the context of our audit of the financial report as a whole, and in forming our opinion thereon, and we do not provide a separate opinion on these matters. Further, any commentary on the outcomes of a particular audit procedure is made in that context. We communicated the key audit matters to the Audit Committee.
In addition to the matter described in the Material uncertainty related to going concern section, we have determined the matter described below to be the key audit matter to be communicated in our report.
Key audit matter How our audit addressed the key audit matter
Carrying amount of deferred exploration expenditure (refer to Note 11)
As at 30 June 2019 the Group recognised deferred exploration expenditure totalling $55,087,366 on the statement of financial position relating to the Brockman, Gascoyne and Yangibana projects.
Judgement was required by the Group to assess whether there were indicators of impairment of the deferred exploration expenditure due to the need to make estimates about future events and circumstances, such as whether the mineral resources may be economically viable to mine in the future.
This was a key audit matter because of the size of the balance and judgement in considering the risk of impairment of the assets should results of exploration activities not be positive.
We performed the following procedures, amongst others:
Evaluated the Group’s assessment that there had been no indicators of impairment for its deferred exploration expenditure assets, including performing inquiries with management and directors to develop an understanding of the current status and future intentions for the Group’s exploration projects.
Tested whether the Group retained right of tenure for its exploration licence areas by obtaining licence status records from relevant government databases.
Obtained management’s exploration expenditure forecasts supporting their assessment and compared these to the approved budgets and future cash flow forecasts of the Group.
Other information
The directors are responsible for the other information. The other information comprises the information included in the annual report for the year ended 30 June 2019, but does not include the financial report and our auditor’s report thereon.
Our opinion on the financial report does not cover the other information and accordingly we do not express any form of assurance conclusion thereon.
For
per
sona
l use
onl
y

In connection with our audit of the financial report, our responsibility is to read the other information and, in doing so, consider whether the other information is materially inconsistent with the financial report or our knowledge obtained in the audit, or otherwise appears to be materially misstated.
If, based on the work we have performed on the other information that we obtained prior to the date of this auditor’s report, we conclude that there is a material misstatement of this other information, we are required to report that fact. We have nothing to report in this regard.
Responsibilities of the directors for the financial report
The directors of the Company are responsible for the preparation of the financial report that gives a true and fair view in accordance with Australian Accounting Standards and the Corporations Act 2001 and for such internal control as the directors determine is necessary to enable the preparation of the financial report that gives a true and fair view and is free from material misstatement, whether due to fraud or error.
In preparing the financial report, the directors are responsible for assessing the ability of the Group to continue as a going concern, disclosing, as applicable, matters related to going concern and using the going concern basis of accounting unless the directors either intend to liquidate the Group or to cease operations, or have no realistic alternative but to do so.
Auditor’s responsibilities for the audit of the financial report
Our objectives are to obtain reasonable assurance about whether the financial report as a whole is free from material misstatement, whether due to fraud or error, and to issue an auditor’s report that includes our opinion. Reasonable assurance is a high level of assurance, but is not a guarantee that an audit conducted in accordance with the Australian Auditing Standards will always detect a material misstatement when it exists. Misstatements can arise from fraud or error and are considered material if, individually or in the aggregate, they could reasonably be expected to influence the economic decisions of users taken on the basis of the financial report.
A further description of our responsibilities for the audit of the financial report is located at the Auditing and Assurance Standards Board website at: http://www.auasb.gov.au/auditors_responsibilities/ar1.pdf. This description forms part of our auditor's report.
Report on the remuneration report
Our opinion on the remuneration report
We have audited the remuneration report included in pages 33 to 40 of the directors’ report for the year ended 30 June 2019.
In our opinion, the remuneration report of Hastings Technology Metals Ltd for the year ended 30 June 2019 complies with section 300A of the Corporations Act 2001. F
or p
erso
nal u
se o
nly

Responsibilities
The directors of the Company are responsible for the preparation and presentation of the remuneration report in accordance with section 300A of the Corporations Act 2001. Our responsibility is to express an opinion on the remuneration report, based on our audit conducted in accordance with Australian Auditing Standards.
PricewaterhouseCoopers
Helen Bathurst Perth Partner 24 September 2019
For
per
sona
l use
onl
y
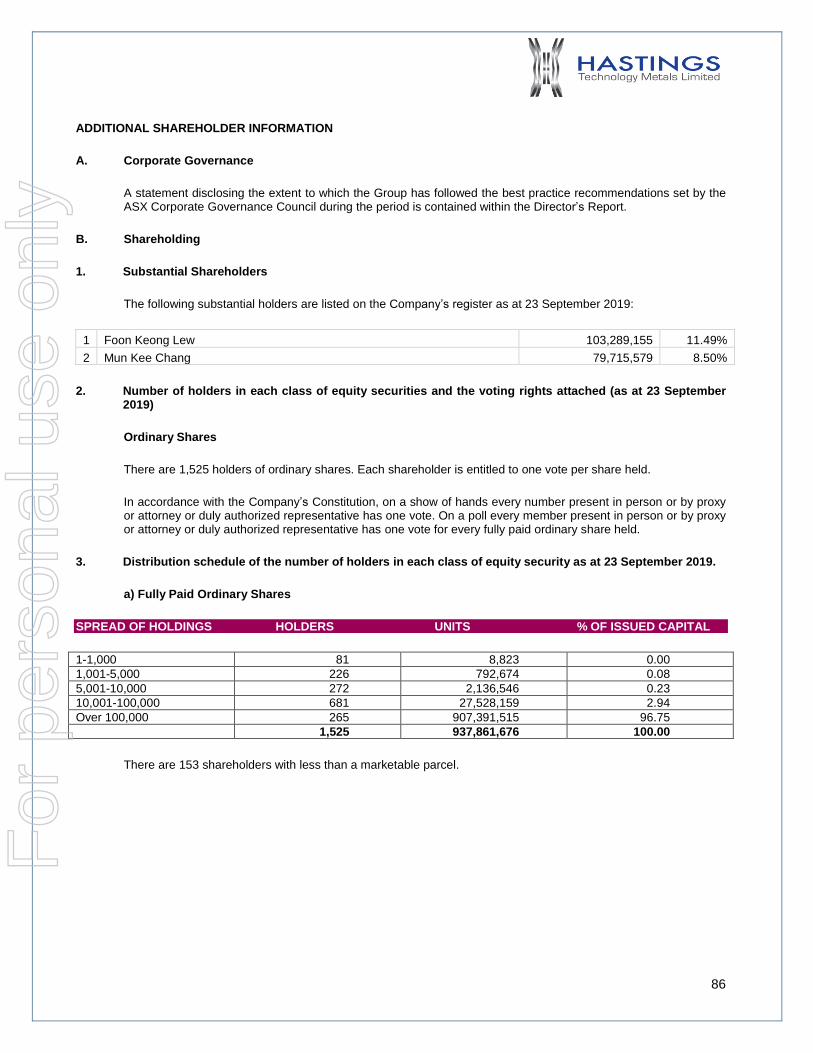
86
ADDITIONAL SHAREHOLDER INFORMATION
A. Corporate Governance
A statement disclosing the extent to which the Group has followed the best practice recommendations set by the ASX Corporate Governance Council during the period is contained within the Director’s Report.
B. Shareholding
1. Substantial Shareholders
The following substantial holders are listed on the Company’s register as at 23 September 2019:
1 Foon Keong Lew 103,289,155 11.49%
2 Mun Kee Chang 79,715,579 8.50%
2. Number of holders in each class of equity securities and the voting rights attached (as at 23 September 2019)
Ordinary Shares
There are 1,525 holders of ordinary shares. Each shareholder is entitled to one vote per share held.
In accordance with the Company’s Constitution, on a show of hands every number present in person or by proxy or attorney or duly authorized representative has one vote. On a poll every member present in person or by proxy or attorney or duly authorized representative has one vote for every fully paid ordinary share held.
3. Distribution schedule of the number of holders in each class of equity security as at 23 September 2019.
a) Fully Paid Ordinary Shares
SPREAD OF HOLDINGS HOLDERS UNITS % OF ISSUED CAPITAL
1-1,000 81 8,823 0.00
1,001-5,000 226 792,674 0.08
5,001-10,000 272 2,136,546 0.23
10,001-100,000 681 27,528,159 2.94
Over 100,000 265 907,391,515 96.75
1,525 937,861,676 100.00
There are 153 shareholders with less than a marketable parcel.
For
per
sona
l use
onl
y

87
ADDITIONAL SHAREHOLDER INFORMATION (Continued)
4. Twenty largest holders of each class of quoted equity security
The names of the twenty largest holders of each class of quoted security, the number of equity security each holds and the percentage of capital each holds (as at 23 September 2019) is as follows:
Ordinary Shares Top 20 holders and percentage held
HASTINGS TECHNOLOGY METALS LTD ORDINARY
ISSUED CAPITAL: 937,861,676 TOTAL HOLDERS : 1,525
* - Denotes Merged Holders Data Correct As At Close of Business : 23/09/2019
RANK HOLDER NAME DESIGNATION CURR. SECURITIES %
1 HSBC CUSTODY NOM AUST LTD 218,933,867 23.34%
2 CITICORP NOM PL 144,917,432 15.45%
3 J P MORGAN NOM AUST PL 98,690,665 10.52%
4 LEW FOON KEONG 84,405,753 9.00%
5 CHANG MUN KEE 40,337,283 4.30%
6 HSBC CUSTODY NOM AUST LTD 28,021,361 2.99%
7 THOONG CHONG WAI 26,176,470 2.79%
8 HSBC CUSTODY NOM AUST LTD EUROCLEAR BANK SA 26,035,568 2.78%
9 BNP PARIBAS NOMS PL DRP 14,640,478 1.56%
10 BNP PARIBAS NOM PL IB AU NOMS RETAILC 12,439,082 1.33%
11 SOON HOE CHUAN 11,764,706 1.25%
12 STEINMETZ HENRI 11,267,150 1.20%
13 NATIONAL NOM LTD DB A/C 9,268,065 0.99%
14 BNP PARIBAS NOMS PL UOB KAY HIAN PRIV 8,718,536 0.93%
15 *LEE CHOON HUAT 8,576,876 0.91%
16 GANGUS PL JIG FAM A/C 6,000,000 0.64%
17 TONG HOW SENG 5,450,000 0.58%
18 JAYA PT ADIREKSA ALAM 4,500,000 0.48%
19 ANNMAC INV PL ANNE MCNAMARA INVE 4,140,002 0.44%
20 MELDA SUPER PL MELDA S/F A/C 4,024,418 0.43%
768,307,712 81.91%
For
per
sona
l use
onl
y

88
ADDITIONAL SHAREHOLDER INFORMATION (Continued)
1. Company Secretary
The joint company secretaries are Mr Neil Hackett and Mr Guy Robertson.
2. Address and contact details of the Company’s registered office and principle place of business:
Level 8, Westralia Plaza 167 St Georges Terrace Perth WA 6000 Australia Telephone: +61 (8) 6117 6118
3. Address and telephone details of the office at which a registry of securities is kept:
Security Transfer Registrars Pty Ltd 770 Canning Highway APPLECROSS WA 6153
4. Stock exchange on which the Company’s securities are quoted:
The Company’s listed equity securities are quoted on the Australian Securities Exchange.
5. Restricted Securities
The Company does not have any restricted securities on issue.
6. Review of Operations
A review of operations is contained in the Directors’ Report.
For
per
sona
l use
onl
y