Embed Size (px)
Citation preview

INVESTING TO GROWANNUAL REPORT 2016
For
per
sona
l use
onl
y
WHO WE ARE AND WHAT WE DO
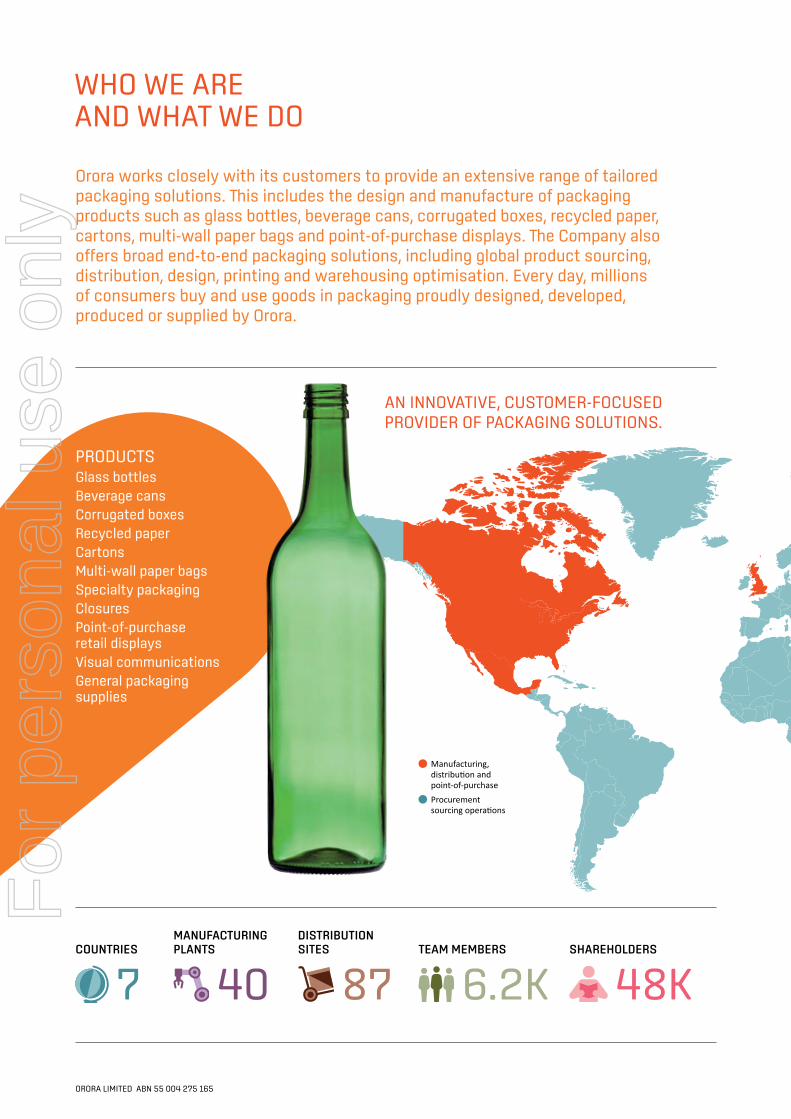
Orora works closely with its customers to provide an extensive range of tailored packaging solutions. This includes the design and manufacture of packaging products such as glass bottles, beverage cans, corrugated boxes, recycled paper, cartons, multi-wall paper bags and point-of-purchase displays. The Company also offers broad end-to-end packaging solutions, including global product sourcing, distribution, design, printing and warehousing optimisation. Every day, millions of consumers buy and use goods in packaging proudly designed, developed, produced or supplied by Orora.
PRODUCTS Glass bottlesBeverage cansCorrugated boxesRecycled paperCartonsMulti-wall paper bagsSpecialty packagingClosuresPoint-of-purchase retail displaysVisual communicationsGeneral packaging supplies
AN INNOVATIVE, CUSTOMER-FOCUSED PROVIDER OF PACKAGING SOLUTIONS.
COUNTRIES
MANUFACTURING PLANTS
TEAM MEMBERS
DISTRIBUTION SITES
SHAREHOLDERS
7 40 87 6.2K 48K
Manufacturing, distribution and point-of-purchaseProcurement sourcing operations
ORORA LIMITED ABN 55 004 275 165
For
per
sona
l use
onl
y
Our customer-led approachOur customers are at the very core of our business, the centre of all we do. In Australasia, we predominantly service defensive end markets, with customers in the grocery, fast moving consumer goods, agricultural and industrial markets. In North America, we target the food, healthcare/pharmaceutical, information technology and automotive industries.
We partner with our customers to constantly expand and improve our offering, and invest in our business to help our customers grow their business. Since listing on the Australian Securities Exchange in 2013, Orora has invested approximately $225.0 million in initiatives to grow our business, with more than $60.0 million of this directly supporting customer-led growth initiatives.
In the financial year ended 30 June 2016, Orora completed a $20.0 million upgrade at its dairy sack line in Victoria which is underpinned by a supply agreement with Fonterra. In February 2016, Orora announced that it would invest $42.0 million to expand its glass manufacturing capacity in South Australia by 60 million bottles each year, and opened two new distribution centres in North America, supported by large corporate accounts.
A passion for innovationWe anticipate changing consumer preferences and trends, and deliver innovative packaging solutions that help our customers establish, maintain and grow leading positions in their respective markets.
This customer-led approach ultimately drives our passion for innovation and generates shareholder value.
In July 2015, Orora announced the establishment of the Global Innovation Initiative, a program to invest $45.0 million over three years in value-generating innovation, modernisation and productivity initiatives.
In its first year, the Company has committed approximately $20.0 million in funding to a range of product and process innovations.
During the period, Orora was also named in the BRW Most Innovative Companies list for the second year running, and was awarded the Best Process Innovation for proprietary technology developed to enable cost-effective randomised printing of beverage cans to support consumer promotions.
Who we are and what we do IFCOperating and financial highlights 2Message to shareholders 3Operating and financial review 6• The Orora Way 6• Our business strategy 8• Board of Directors 10
• Executive leadership team 12• Operational review 14• Financial review summary 22• Our approach to sustainability 25• Principal risks 31Directors’ Report 33Financial Report 54
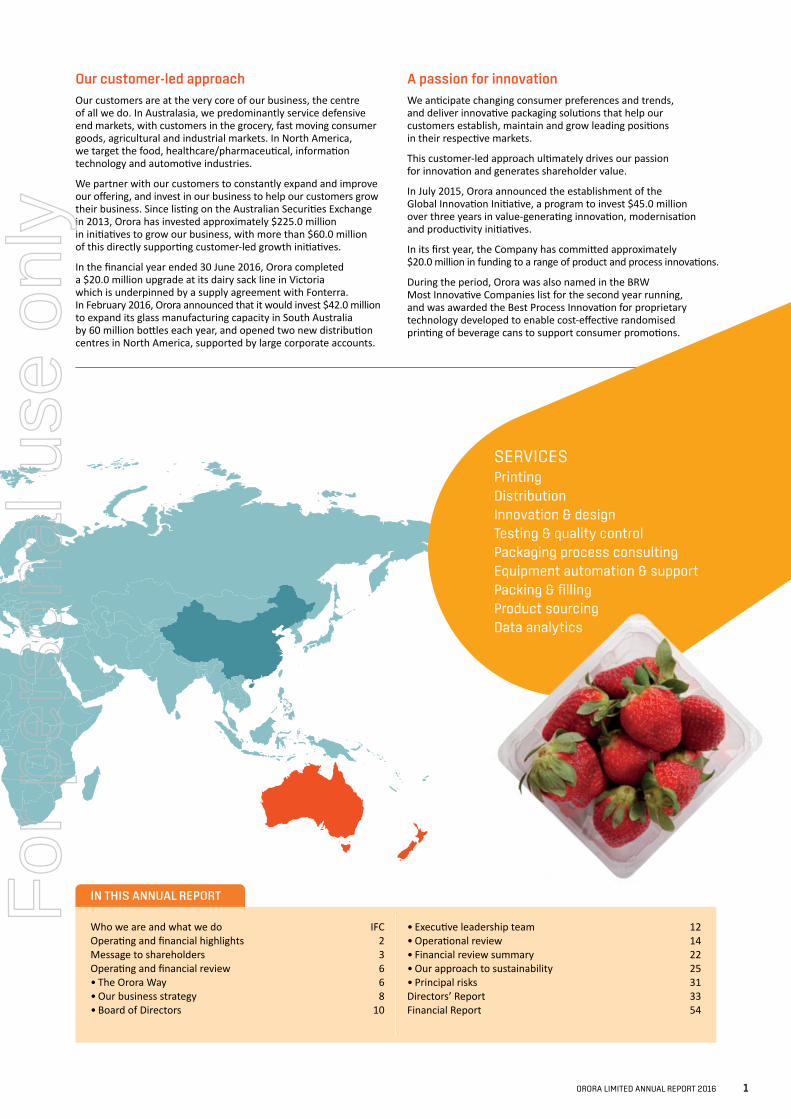
SERVICESPrintingDistributionInnovation & designTesting & quality control Packaging process consultingEquipment automation & supportPacking & filling Product sourcingData analytics
IN THIS ANNUAL REPORT
ORORA LIMITED ANNUAL REPORT 2016 1
For
per
sona
l use
onl
y
OPERATING AND FINANCIAL HIGHLIGHTS
↑from 6.6% 7.1%
EBIT TO SALES (3)
↑23.8% $162.7m
NET PROFIT AFTER TAX (3)
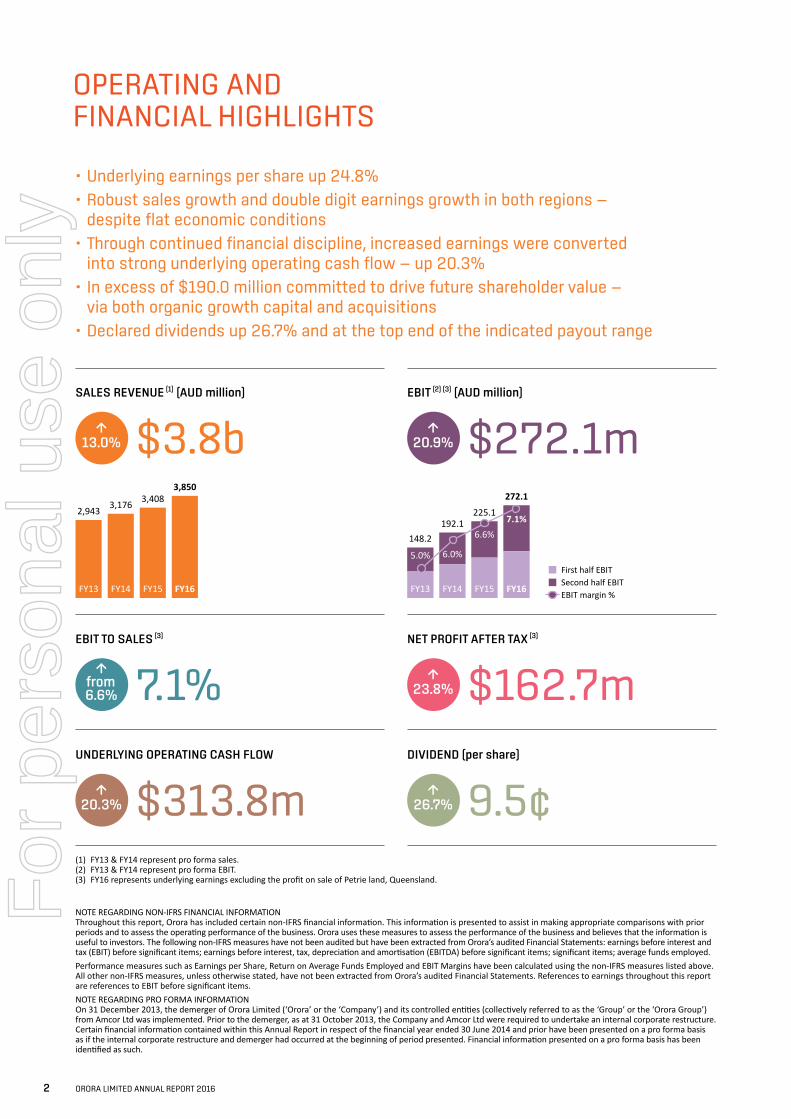
• Underlying earnings per share up 24.8%• Robust sales growth and double digit earnings growth in both regions —
despite flat economic conditions• Through continued financial discipline, increased earnings were converted
into strong underlying operating cash flow — up 20.3%• In excess of $190.0 million committed to drive future shareholder value —
via both organic growth capital and acquisitions• Declared dividends up 26.7% and at the top end of the indicated payout range
NOTE REGARDING NON-IFRS FINANCIAL INFORMATION Throughout this report, Orora has included certain non-IFRS financial information. This information is presented to assist in making appropriate comparisons with prior periods and to assess the operating performance of the business. Orora uses these measures to assess the performance of the business and believes that the information is useful to investors. The following non-IFRS measures have not been audited but have been extracted from Orora’s audited Financial Statements: earnings before interest and tax (EBIT) before significant items; earnings before interest, tax, depreciation and amortisation (EBITDA) before significant items; significant items; average funds employed.Performance measures such as Earnings per Share, Return on Average Funds Employed and EBIT Margins have been calculated using the non-IFRS measures listed above. All other non-IFRS measures, unless otherwise stated, have not been extracted from Orora’s audited Financial Statements. References to earnings throughout this report are references to EBIT before significant items.NOTE REGARDING PRO FORMA INFORMATION On 31 December 2013, the demerger of Orora Limited (‘Orora’ or the ‘Company’) and its controlled entities (collectively referred to as the ‘Group’ or the ‘Orora Group’) from Amcor Ltd was implemented. Prior to the demerger, as at 31 October 2013, the Company and Amcor Ltd were required to undertake an internal corporate restructure. Certain financial information contained within this Annual Report in respect of the financial year ended 30 June 2014 and prior have been presented on a pro forma basis as if the internal corporate restructure and demerger had occurred at the beginning of period presented. Financial information presented on a pro forma basis has been identified as such.
↑20.3% $313.8m
UNDERLYING OPERATING CASH FLOW
9.5¢DIVIDEND (per share)
↑26.7%
Sales (AUD billion)[1]
FY13 FY14 FY15 FY16
2,943 3,176 3,4083,850
First half EBITSecond half EBITEBIT margin %
EBIT (AUD million)[1]
FY13 FY14 FY15 FY16
148.2192.1
225.1
272.1
5.0% 6.0%
6.6%7.1%
SALES REVENUE (1) (AUD million)
↑13.0% $3.8b
EBIT (2) (3) (AUD million)
↑20.9% $272.1m
(1) FY13 & FY14 represent pro forma sales.(2) FY13 & FY14 represent pro forma EBIT.(3) FY16 represents underlying earnings excluding the profit on sale of Petrie land, Queensland.
2 ORORA LIMITED ANNUAL REPORT 2016
For
per
sona
l use
onl
y
TO ORORA’S SHAREHOLDERS
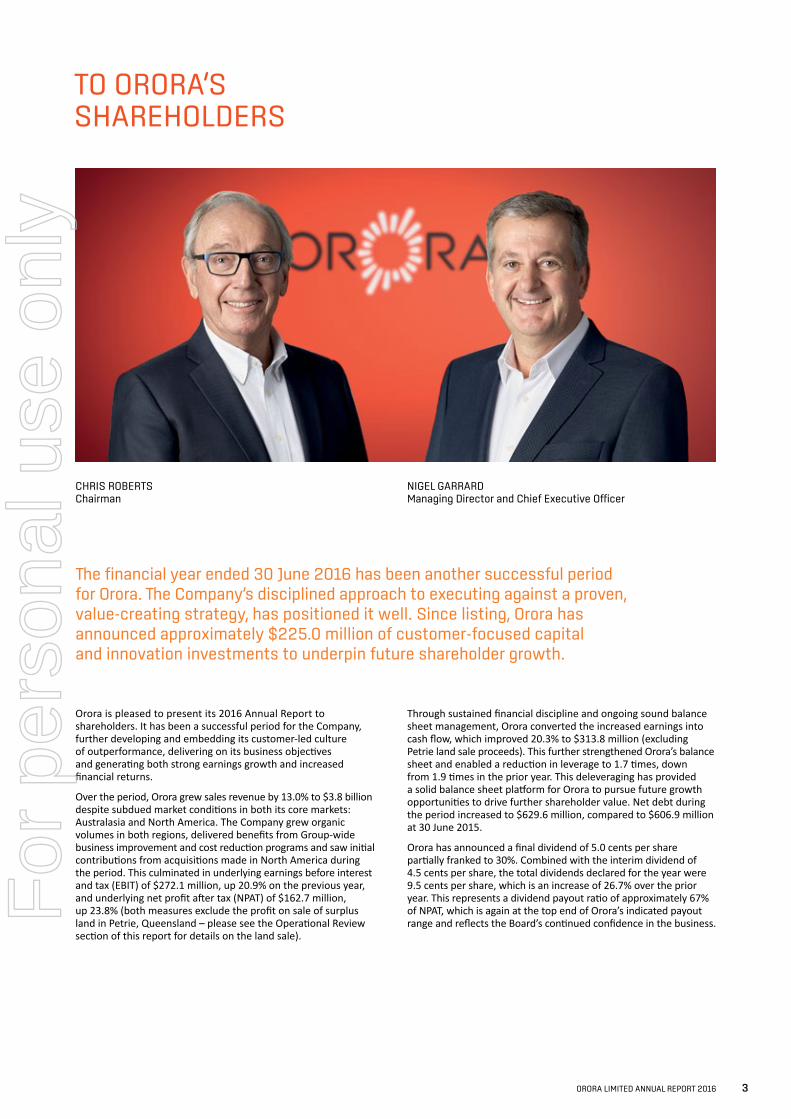
CHRIS ROBERTS Chairman
NIGEL GARRARD Managing Director and Chief Executive Officer
Orora is pleased to present its 2016 Annual Report to shareholders. It has been a successful period for the Company, further developing and embedding its customer-led culture of outperformance, delivering on its business objectives and generating both strong earnings growth and increased financial returns.
Over the period, Orora grew sales revenue by 13.0% to $3.8 billion despite subdued market conditions in both its core markets: Australasia and North America. The Company grew organic volumes in both regions, delivered benefits from Group-wide business improvement and cost reduction programs and saw initial contributions from acquisitions made in North America during the period. This culminated in underlying earnings before interest and tax (EBIT) of $272.1 million, up 20.9% on the previous year, and underlying net profit after tax (NPAT) of $162.7 million, up 23.8% (both measures exclude the profit on sale of surplus land in Petrie, Queensland – please see the Operational Review section of this report for details on the land sale).
Through sustained financial discipline and ongoing sound balance sheet management, Orora converted the increased earnings into cash flow, which improved 20.3% to $313.8 million (excluding Petrie land sale proceeds). This further strengthened Orora’s balance sheet and enabled a reduction in leverage to 1.7 times, down from 1.9 times in the prior year. This deleveraging has provided a solid balance sheet platform for Orora to pursue future growth opportunities to drive further shareholder value. Net debt during the period increased to $629.6 million, compared to $606.9 million at 30 June 2015.
Orora has announced a final dividend of 5.0 cents per share partially franked to 30%. Combined with the interim dividend of 4.5 cents per share, the total dividends declared for the year were 9.5 cents per share, which is an increase of 26.7% over the prior year. This represents a dividend payout ratio of approximately 67% of NPAT, which is again at the top end of Orora’s indicated payout range and reflects the Board’s continued confidence in the business.
The financial year ended 30 June 2016 has been another successful period for Orora. The Company’s disciplined approach to executing against a proven, value-creating strategy, has positioned it well. Since listing, Orora has announced approximately $225.0 million of customer-focused capital and innovation investments to underpin future shareholder growth.
ORORA LIMITED ANNUAL REPORT 2016 3
For
per
sona
l use
onl
y
ORORA LIMITED 2015—2016 AWARDS
TO ORORA’S SHAREHOLDERS
Operational reviewA detailed review of operational performance for the financial year ended 30 June 2016 can be found in the Operational Review section of this report.
Overall, the business performed well during the year, considering that economic conditions across Orora’s key markets remained generally subdued.
Orora Australasia delivered a 10.4% increase in EBIT to $200.4 million, with underlying sales increasing 2.5%.
Increased earnings in the Beverage business were driven by higher Glass volumes, improved operating efficiency across the business and the reversal of the adverse financial impact from the FY15 glass furnace rebuild. This was partially offset by the impact of rising gas, electricity and soda ash input costs within the Glass division.
With the Glass business seeing increased demand in customer wine volumes led by the impact of the lower Australian dollar, it was announced in February 2016 that $42.0 million would be invested to increase the manufacturing capacity of Orora’s forming lines by 60 million bottles. This additional volume is to replace product currently imported and underpinned by existing customer demand. The project will be completed progressively during FY17.
The Fibre Packaging business delivered increased sales driven by organic growth, improved Australasian agriculture volumes and higher sales to the grocery sector in Australia. Orora’s “Go Direct” transition in the Queensland fruit and produce sector is progressing well, with new depots already established in Bundaberg and Mareeba, and a further site expected to open in Innisfail in late 2016.
Incremental cost reduction and innovation benefits of $13.7 million were delivered at the B9 Recycled Paper Mill, taking total cumulative benefits to $35.1 million. The mill increased production by 15,000 tonnes to 382,000 tonnes and successfully exited FY16 at a run rate equal to design production capacity of 400,000 tonnes. Export of recycled paper to the Orora business and external customers in North America increased from 55,300 tonnes to 79,500 tonnes during the year.
The new $20.0 million state-of-the-art dairy sack line at the existing Thomastown, Victoria facility, underpinned by a supply agreement with Fonterra, is currently being commissioned and will become fully operational in the second quarter of FY17.
Orora North America, which is now comprised of Orora Packaging Solutions (Landsberg Packaging Solutions and Manufacturing) and the recently acquired IntegraColor, delivered a 20.2% increase in local currency EBIT to USD72.0 million on the back of a 6.0% increase in organic sales revenue, margin improvement initiatives and benefits from recent acquisitions.
Landsberg Packaging Solutions continued to execute on its market growth strategy through leveraging its product breadth, uniform service offering and national footprint to increase sales to existing customers and win market share, largely from independent players. The Manufacturing division delivered increased earnings through higher volumes and improved efficiencies and cost control, despite continued margin pressure.
In September 2015, Landsberg acquired Jakait, a specialised supplier of packaging, logistics services and label products to the greenhouse produce sector based in Ontario, Canada. The integration of Jakait is on plan, as is the successful integration of the 2014 acquisition of Worldwide Plastics, which met Orora’s targeted returns in FY16, a full year ahead of schedule.
In March 2016, Orora acquired IntegraColor, a Texas based provider of Point of Purchase (POP) retail display solutions. IntegraColor aligns with Orora’s total packaging solutions customer proposition and moves Orora North America further up the value curve, closer to the brand owner and provides a platform for future bolt-on acquisitions in the POP sector. The integration is on plan and the business is performing in line with expectations.
The Orora Way driving outperformanceOrganisational culture plays a critical role in driving operational and financial success. From the beginning, the Orora Board and leadership team recognised that the passion and goodwill of its 6,200 team members offered a compelling source of competitive advantage. Orora’s team members have played a unique role in shaping the Company’s culture and developing the proprietary The Orora Way, which includes a belief statement, company values and outperformance deliverables that will continue to drive success.
During the year, the Company continued to build on The Orora Way, uniting Orora team members across Australasia and North America with a shared vision for the future and linking their day-to-day efforts to the Company’s three strategic areas of focus – innovating to lead in Orora’s chosen markets, enhancing core operations, and investing to grow the business. The Company also announced the inaugural winners of the Orora Heroes Awards, a global recognition program that celebrates team members who role model a commitment to outperformance in the areas of safety, financial discipline, customer focus and Orora’s people.
2015 BRW Most Innovative Companies — Best Process Innovation Frucor Supplier of the Year Award (2015)
Point of Purchase Advertising International (POPAI), the Global Association for Marketing at Retail Temporary display category 2 Gold, 1 Silver, 1 Bronze
4 ORORA LIMITED ANNUAL REPORT 2016
For
per
sona
l use
onl
y
Australian Packaging Design Awards (2015) Silver Award and Highly Commended
Energy Efficiency Council and Conservation Authority New Zealand (2016)
Pride in Print Awards New Zealand 7 Gold and 2 Highly Commended
Innovating to leadInnovation is one of Orora’s three strategic focus areas and passion is one of the Company’s core values. Since announcing the establishment of the $45.0 million Orora Global Innovation Initiative in July 2015, approximately $20.0 million in funding has been committed to innovative customer-led product solutions, process improvement and productivity.
Some specific examples include, a digital printer which is to be installed in the Australian Fibre Packaging division in late 2016 to step change Orora’s product offering and customer value proposition; and the new Glass bottle sleeving line that was successfully commissioned in Gawler, South Australia, during July 2016. These demonstrate Orora’s willingness to invest and jointly support Orora’s and Orora’s customers’ future growth.
To further drive and cultivate innovative thinking, an internal crowd sourcing initiative was launched in July 2016 that provides all team members with a platform to contribute and develop ideas in relation to the Orora Global Innovation Initiative. The program has received a very high level of participation company-wide.
Shareholders can also experience Orora’s passion for innovation by downloading the new Orora app from the Apple App Store or Google Play Store. This is a leading example of how innovation can improve the way Orora connects with its shareholders, customers and communities, as well as its 6,200 team members, to help them keep up to date with company announcements, achievements and celebrations.
OutlookOrora looks forward to a period of accelerated innovation, ongoing enhancements to Orora’s core business operations and further strategic investments to continue to drive growth for shareholders.
The Board would like to thank all of Orora’s stakeholders, including customers, shareholders, team members and suppliers, for their support this year.
CHRIS ROBERTS Chairman
NIGEL GARRARD Managing Director and Chief Executive Officer
FY16 has been a successful period, further developing and embedding the Company’s customer-led culture of outperformance, delivering on its business objectives and generating both strong earnings growth and increased financial returns.
2016
2015AUSTRALIAN PACKAGING DESIGN AWARDS
ORORA LIMITED ANNUAL REPORT 2016 5
For
per
sona
l use
onl
y
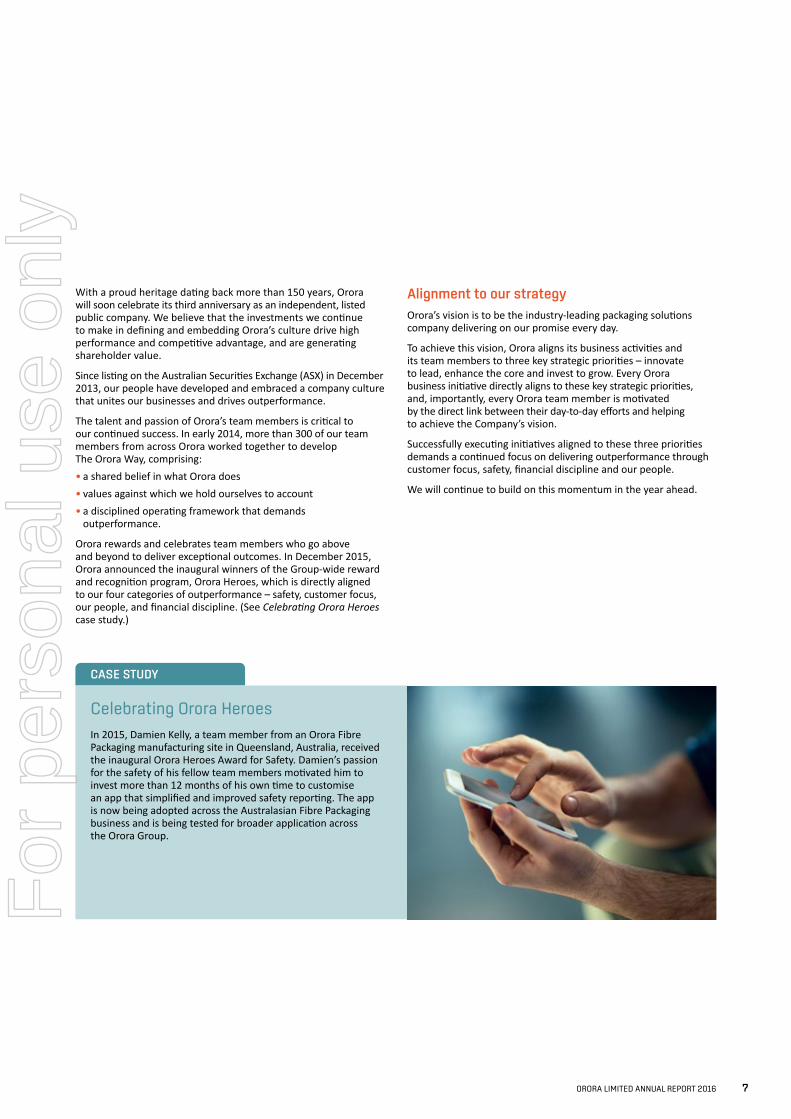
· Safety first· One Orora
· In it together
· Courageous· Innovative
· Responsible
· For each other· For the community· For our customers
· Do what is right· True to what we stand for
· True to our promise
AT ORORA WE BELIEVE PACKAGING TOUCHES LIVES. TOGETHER WE DELIVER ON THE PROMISE OF WHAT’S INSIDE.
INNOVATE TO LEAD
· Customer solutions· Technical leadership· Digital enablement
ENHANCE THE CORE
· Doing better every day· Best-in class capabilities — people, process & systems
· Improving e�ciency
INVEST TO GROW
· In partnership with customers· Extending our reach (bolt-on M&A)
· Diversified solutions (adjacent M&A)
TO BE THE INDUSTRY-LEADING PACKAGING SOLUTIONS COMPANYDELIVERING ON OUR PROMISE EVERY DAY.
CREATING SHAREHOLDER VALUE
OUR BELIEF
OUR VALUES
OUR VISION
OUR STRATEGIC FOCUS
OUR OUTPERFORMANCE
OUR MEASURES FOR SUCCESS
TEAMWORK PASSION RESPECT INTEGRITY
SAFETY CUSTOMER FOCUS OUR PEOPLE FINANCIAL DISCIPLINE
· Zero harm· Injury frequency
· Sales growth· Net Promoter Score
· Engagement· Diversity
· Increasing earnings& ROAFE
· Operating cash flow
THE WAY
THE ORORA WAYOPERATING AND FINANCIAL REVIEW
With a shared belief in what we do, values that guide us, and a culture of outperformance, Orora team members are united in their determination for Orora to be the industry-leading packaging solutions company delivering on our promise every day.
6 ORORA LIMITED ANNUAL REPORT 2016
For
per
sona
l use
onl
y
With a proud heritage dating back more than 150 years, Orora will soon celebrate its third anniversary as an independent, listed public company. We believe that the investments we continue to make in defining and embedding Orora’s culture drive high performance and competitive advantage, and are generating shareholder value.
Since listing on the Australian Securities Exchange (ASX) in December 2013, our people have developed and embraced a company culture that unites our businesses and drives outperformance.
The talent and passion of Orora’s team members is critical to our continued success. In early 2014, more than 300 of our team members from across Orora worked together to develop The Orora Way, comprising:• a shared belief in what Orora does• values against which we hold ourselves to account• a disciplined operating framework that demands
outperformance.
Orora rewards and celebrates team members who go above and beyond to deliver exceptional outcomes. In December 2015, Orora announced the inaugural winners of the Group-wide reward and recognition program, Orora Heroes, which is directly aligned to our four categories of outperformance – safety, customer focus, our people, and financial discipline. (See Celebrating Orora Heroes case study.)
Alignment to our strategyOrora’s vision is to be the industry-leading packaging solutions company delivering on our promise every day.
To achieve this vision, Orora aligns its business activities and its team members to three key strategic priorities – innovate to lead, enhance the core and invest to grow. Every Orora business initiative directly aligns to these key strategic priorities, and, importantly, every Orora team member is motivated by the direct link between their day-to-day efforts and helping to achieve the Company’s vision.
Successfully executing initiatives aligned to these three priorities demands a continued focus on delivering outperformance through customer focus, safety, financial discipline and our people.
We will continue to build on this momentum in the year ahead.
CASE STUDY
Celebrating Orora Heroes In 2015, Damien Kelly, a team member from an Orora Fibre Packaging manufacturing site in Queensland, Australia, received the inaugural Orora Heroes Award for Safety. Damien’s passion for the safety of his fellow team members motivated him to invest more than 12 months of his own time to customise an app that simplified and improved safety reporting. The app is now being adopted across the Australasian Fibre Packaging business and is being tested for broader application across the Orora Group.
ORORA LIMITED ANNUAL REPORT 2016 7
For
per
sona
l use
onl
y
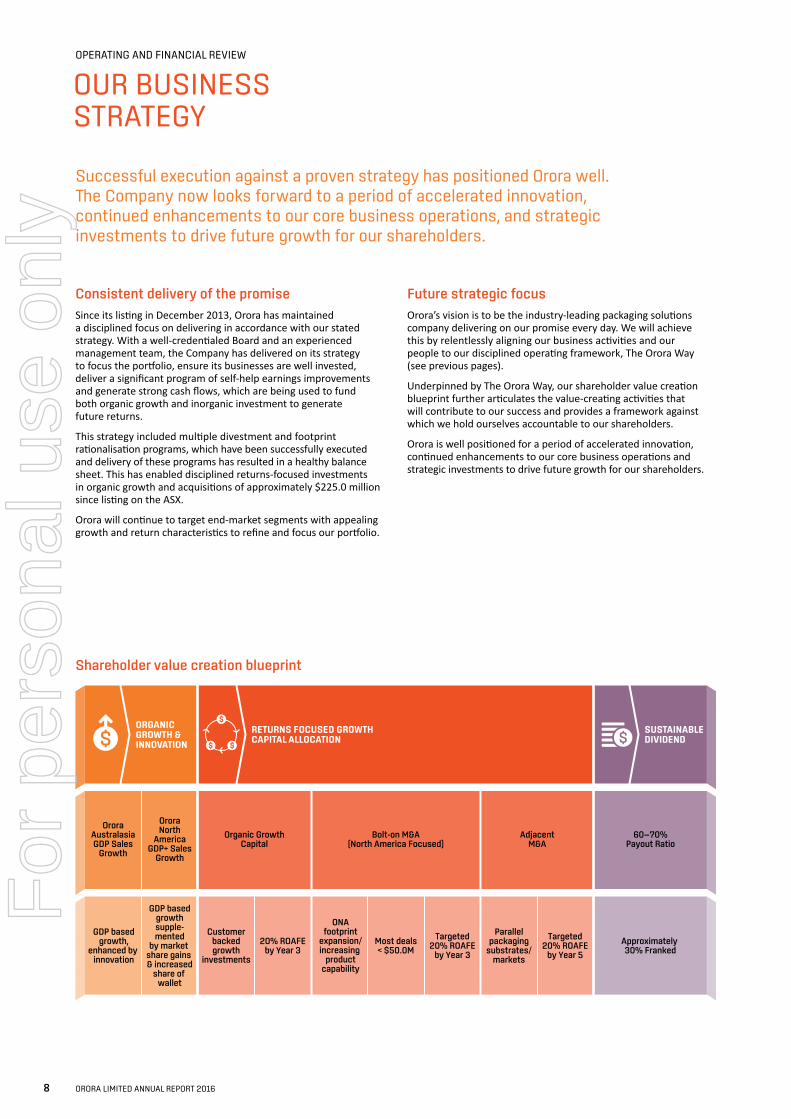
OroraNorth
AmericaGDP+ Sales
Growth
Organic GrowthCapital
Bolt-on M&A(North America Focused)
AdjacentM&A
60—70%Payout Ratio
OroraAustralasiaGDP Sales
Growth
GDP basedgrowthsupple-mented
by market share gains & increased
share of wallet
GDP basedgrowth,
enhanced by innovation
Customerbackedgrowth
investments
20% ROAFEby Year 3
Parallelpackaging
substrates/markets
Targeted20% ROAFE
by Year 5
Approximately 30% Franked
ONAfootprint
expansion/increasing
productcapability
Most deals< $50.0M
Targeted20% ROAFE
by Year 3
ORGANICGROWTH &INNOVATION
RETURNS FOCUSED GROWTHCAPITAL ALLOCATION
SUSTAINABLEDIVIDEND$ $
$
$ $
OPERATING AND FINANCIAL REVIEW
OUR BUSINESS STRATEGY
Successful execution against a proven strategy has positioned Orora well. The Company now looks forward to a period of accelerated innovation, continued enhancements to our core business operations, and strategic investments to drive future growth for our shareholders.
Consistent delivery of the promiseSince its listing in December 2013, Orora has maintained a disciplined focus on delivering in accordance with our stated strategy. With a well-credentialed Board and an experienced management team, the Company has delivered on its strategy to focus the portfolio, ensure its businesses are well invested, deliver a significant program of self-help earnings improvements and generate strong cash flows, which are being used to fund both organic growth and inorganic investment to generate future returns.
This strategy included multiple divestment and footprint rationalisation programs, which have been successfully executed and delivery of these programs has resulted in a healthy balance sheet. This has enabled disciplined returns-focused investments in organic growth and acquisitions of approximately $225.0 million since listing on the ASX.
Orora will continue to target end-market segments with appealing growth and return characteristics to refine and focus our portfolio.
Future strategic focusOrora’s vision is to be the industry-leading packaging solutions company delivering on our promise every day. We will achieve this by relentlessly aligning our business activities and our people to our disciplined operating framework, The Orora Way (see previous pages).
Underpinned by The Orora Way, our shareholder value creation blueprint further articulates the value-creating activities that will contribute to our success and provides a framework against which we hold ourselves accountable to our shareholders.
Orora is well positioned for a period of accelerated innovation, continued enhancements to our core business operations and strategic investments to drive future growth for our shareholders.
Shareholder value creation blueprint
8 ORORA LIMITED ANNUAL REPORT 2016
For
per
sona
l use
onl
y
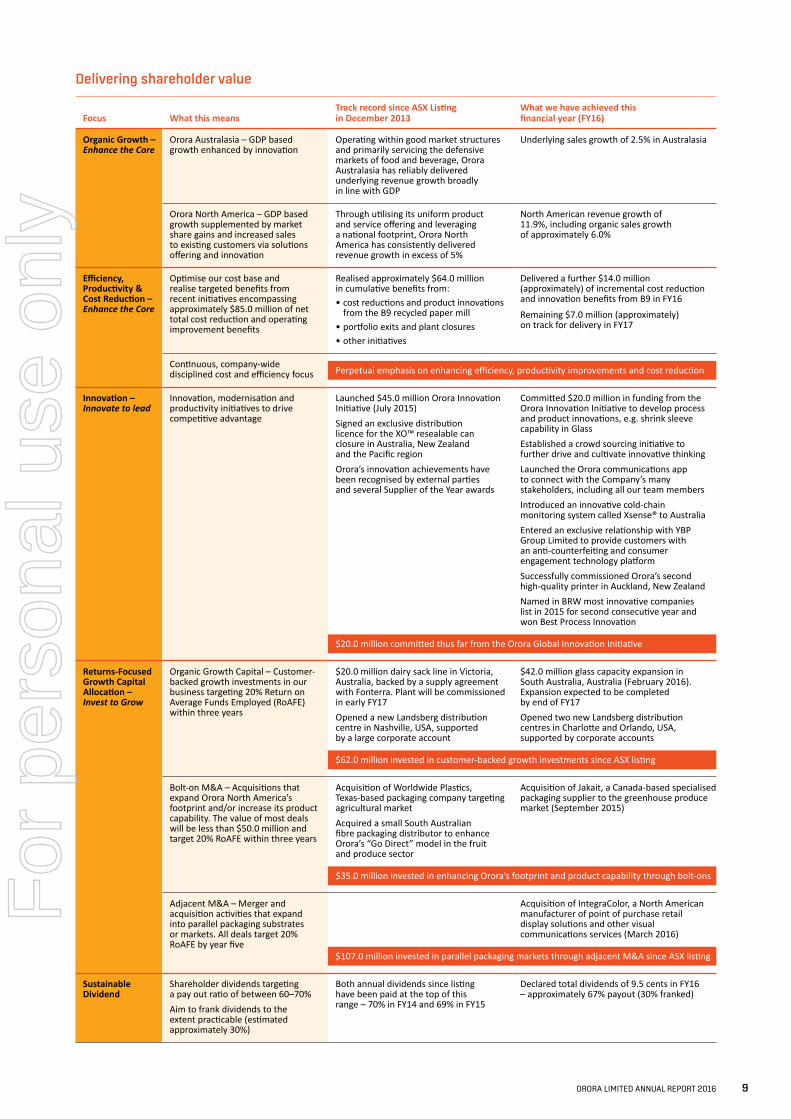
Delivering shareholder value
Focus What this meansTrack record since ASX Listing in December 2013
What we have achieved this financial year (FY16)
Organic Growth – Enhance the Core
Orora Australasia – GDP based growth enhanced by innovation
Operating within good market structures and primarily servicing the defensive markets of food and beverage, Orora Australasia has reliably delivered underlying revenue growth broadly in line with GDP
Underlying sales growth of 2.5% in Australasia
Orora North America – GDP based growth supplemented by market share gains and increased sales to existing customers via solutions offering and innovation
Through utilising its uniform product and service offering and leveraging a national footprint, Orora North America has consistently delivered revenue growth in excess of 5%
North American revenue growth of 11.9%, including organic sales growth of approximately 6.0%
Efficiency, Productivity & Cost Reduction – Enhance the Core
Optimise our cost base and realise targeted benefits from recent initiatives encompassing approximately $85.0 million of net total cost reduction and operating improvement benefits
Realised approximately $64.0 million in cumulative benefits from: • cost reductions and product innovations
from the B9 recycled paper mill • portfolio exits and plant closures • other initiatives
Delivered a further $14.0 million (approximately) of incremental cost reduction and innovation benefits from B9 in FY16
Remaining $7.0 million (approximately) on track for delivery in FY17
Continuous, company-wide disciplined cost and efficiency focus Perpetual emphasis on enhancing efficiency, productivity improvements and cost reduction
Innovation – Innovate to lead
Innovation, modernisation and productivity initiatives to drive competitive advantage
Launched $45.0 million Orora Innovation Initiative (July 2015) Signed an exclusive distribution licence for the XO™ resealable can closure in Australia, New Zealand and the Pacific region Orora’s innovation achievements have been recognised by external parties and several Supplier of the Year awards
Committed $20.0 million in funding from the Orora Innovation Initiative to develop process and product innovations, e.g. shrink sleeve capability in Glass Established a crowd sourcing initiative to further drive and cultivate innovative thinkingLaunched the Orora communications app to connect with the Company’s many stakeholders, including all our team members Introduced an innovative cold-chain monitoring system called Xsense® to Australia Entered an exclusive relationship with YBP Group Limited to provide customers with an anti-counterfeiting and consumer engagement technology platform Successfully commissioned Orora’s second high-quality printer in Auckland, New Zealand Named in BRW most innovative companies list in 2015 for second consecutive year and won Best Process Innovation
$20.0 million committed thus far from the Orora Global Innovation Initiative
Returns-Focused Growth Capital Allocation – Invest to Grow
Organic Growth Capital – Customer-backed growth investments in our business targeting 20% Return on Average Funds Employed (RoAFE) within three years
$20.0 million dairy sack line in Victoria, Australia, backed by a supply agreement with Fonterra. Plant will be commissioned in early FY17 Opened a new Landsberg distribution centre in Nashville, USA, supported by a large corporate account
$42.0 million glass capacity expansion in South Australia, Australia (February 2016). Expansion expected to be completed by end of FY17 Opened two new Landsberg distribution centres in Charlotte and Orlando, USA, supported by corporate accounts
$62.0 million invested in customer-backed growth investments since ASX listing
Bolt-on M&A – Acquisitions that expand Orora North America’s footprint and/or increase its product capability. The value of most deals will be less than $50.0 million and target 20% RoAFE within three years
Acquisition of Worldwide Plastics, Texas-based packaging company targeting agricultural market Acquired a small South Australian fibre packaging distributor to enhance Orora’s “Go Direct” model in the fruit and produce sector
Acquisition of Jakait, a Canada-based specialised packaging supplier to the greenhouse produce market (September 2015)
$35.0 million invested in enhancing Orora’s footprint and product capability through bolt-ons
Adjacent M&A – Merger and acquisition activities that expand into parallel packaging substrates or markets. All deals target 20% RoAFE by year five
Acquisition of IntegraColor, a North American manufacturer of point of purchase retail display solutions and other visual communications services (March 2016)
$107.0 million invested in parallel packaging markets through adjacent M&A since ASX listing
Sustainable Dividend
Shareholder dividends targeting a pay out ratio of between 60–70% Aim to frank dividends to the extent practicable (estimated approximately 30%)
Both annual dividends since listing have been paid at the top of this range – 70% in FY14 and 69% in FY15
Declared total dividends of 9.5 cents in FY16 – approximately 67% payout (30% franked)
ORORA LIMITED ANNUAL REPORT 2016 9
For
per
sona
l use
onl
y
OPERATING AND FINANCIAL REVIEW
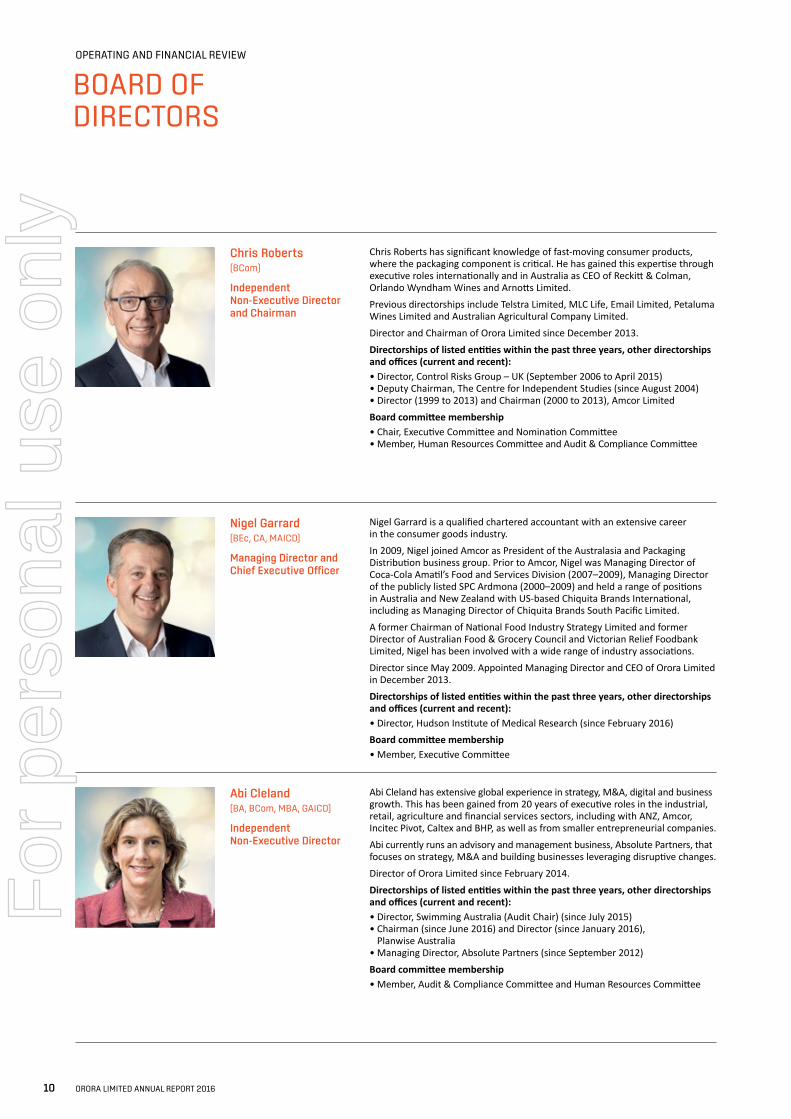
Chris Roberts(BCom)
Independent Non-Executive Director and Chairman
Chris Roberts has significant knowledge of fast-moving consumer products, where the packaging component is critical. He has gained this expertise through executive roles internationally and in Australia as CEO of Reckitt & Colman, Orlando Wyndham Wines and Arnotts Limited.Previous directorships include Telstra Limited, MLC Life, Email Limited, Petaluma Wines Limited and Australian Agricultural Company Limited.Director and Chairman of Orora Limited since December 2013.Directorships of listed entities within the past three years, other directorships and offices (current and recent):• Director, Control Risks Group – UK (September 2006 to April 2015)• Deputy Chairman, The Centre for Independent Studies (since August 2004)• Director (1999 to 2013) and Chairman (2000 to 2013), Amcor LimitedBoard committee membership• Chair, Executive Committee and Nomination Committee• Member, Human Resources Committee and Audit & Compliance Committee
Nigel Garrard(BEc, CA, MAICD)
Managing Director and Chief Executive Officer
Nigel Garrard is a qualified chartered accountant with an extensive career in the consumer goods industry.In 2009, Nigel joined Amcor as President of the Australasia and Packaging Distribution business group. Prior to Amcor, Nigel was Managing Director of Coca-Cola Amatil’s Food and Services Division (2007–2009), Managing Director of the publicly listed SPC Ardmona (2000–2009) and held a range of positions in Australia and New Zealand with US-based Chiquita Brands International, including as Managing Director of Chiquita Brands South Pacific Limited.A former Chairman of National Food Industry Strategy Limited and former Director of Australian Food & Grocery Council and Victorian Relief Foodbank Limited, Nigel has been involved with a wide range of industry associations.Director since May 2009. Appointed Managing Director and CEO of Orora Limited in December 2013.Directorships of listed entities within the past three years, other directorships and offices (current and recent):• Director, Hudson Institute of Medical Research (since February 2016)Board committee membership• Member, Executive Committee
Abi Cleland(BA, BCom, MBA, GAICD)
Independent Non-Executive Director
Abi Cleland has extensive global experience in strategy, M&A, digital and business growth. This has been gained from 20 years of executive roles in the industrial, retail, agriculture and financial services sectors, including with ANZ, Amcor, Incitec Pivot, Caltex and BHP, as well as from smaller entrepreneurial companies.Abi currently runs an advisory and management business, Absolute Partners, that focuses on strategy, M&A and building businesses leveraging disruptive changes. Director of Orora Limited since February 2014.Directorships of listed entities within the past three years, other directorships and offices (current and recent):• Director, Swimming Australia (Audit Chair) (since July 2015)• Chairman (since June 2016) and Director (since January 2016),
Planwise Australia• Managing Director, Absolute Partners (since September 2012)Board committee membership• Member, Audit & Compliance Committee and Human Resources Committee
BOARD OF DIRECTORS
10 ORORA LIMITED ANNUAL REPORT 2016
For
per
sona
l use
onl
y
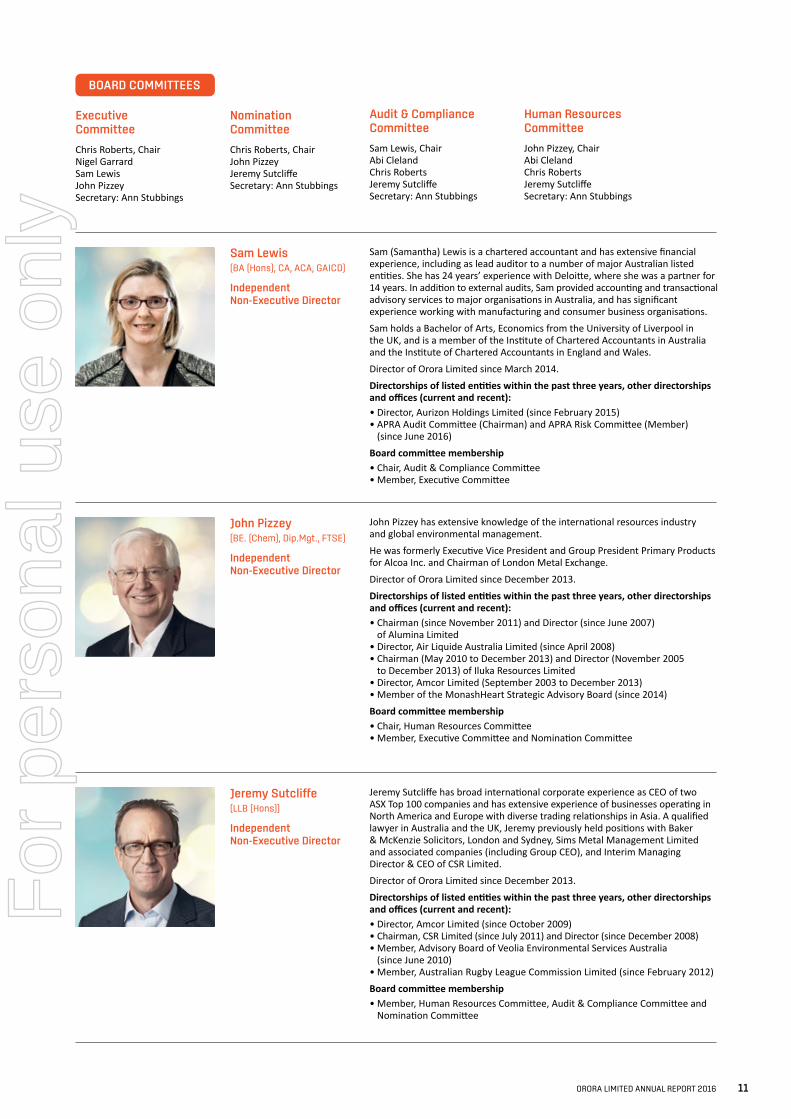
Executive Committee
Chris Roberts, ChairNigel GarrardSam LewisJohn PizzeySecretary: Ann Stubbings
Nomination Committee
Chris Roberts, ChairJohn PizzeyJeremy SutcliffeSecretary: Ann Stubbings
Sam Lewis(BA (Hons), CA, ACA, GAICD)
Independent Non-Executive Director
Sam (Samantha) Lewis is a chartered accountant and has extensive financial experience, including as lead auditor to a number of major Australian listed entities. She has 24 years’ experience with Deloitte, where she was a partner for 14 years. In addition to external audits, Sam provided accounting and transactional advisory services to major organisations in Australia, and has significant experience working with manufacturing and consumer business organisations.Sam holds a Bachelor of Arts, Economics from the University of Liverpool in the UK, and is a member of the Institute of Chartered Accountants in Australia and the Institute of Chartered Accountants in England and Wales.Director of Orora Limited since March 2014.Directorships of listed entities within the past three years, other directorships and offices (current and recent):• Director, Aurizon Holdings Limited (since February 2015)• APRA Audit Committee (Chairman) and APRA Risk Committee (Member)
(since June 2016)Board committee membership• Chair, Audit & Compliance Committee• Member, Executive Committee
John Pizzey(BE. (Chem), Dip.Mgt., FTSE)
Independent Non-Executive Director
John Pizzey has extensive knowledge of the international resources industry and global environmental management.He was formerly Executive Vice President and Group President Primary Products for Alcoa Inc. and Chairman of London Metal Exchange.Director of Orora Limited since December 2013.Directorships of listed entities within the past three years, other directorships and offices (current and recent):• Chairman (since November 2011) and Director (since June 2007)
of Alumina Limited• Director, Air Liquide Australia Limited (since April 2008)• Chairman (May 2010 to December 2013) and Director (November 2005
to December 2013) of Iluka Resources Limited• Director, Amcor Limited (September 2003 to December 2013)• Member of the MonashHeart Strategic Advisory Board (since 2014)Board committee membership• Chair, Human Resources Committee• Member, Executive Committee and Nomination Committee
Jeremy Sutcliffe(LLB (Hons))
Independent Non-Executive Director
Jeremy Sutcliffe has broad international corporate experience as CEO of two ASX Top 100 companies and has extensive experience of businesses operating in North America and Europe with diverse trading relationships in Asia. A qualified lawyer in Australia and the UK, Jeremy previously held positions with Baker & McKenzie Solicitors, London and Sydney, Sims Metal Management Limited and associated companies (including Group CEO), and Interim Managing Director & CEO of CSR Limited.Director of Orora Limited since December 2013.Directorships of listed entities within the past three years, other directorships and offices (current and recent):• Director, Amcor Limited (since October 2009)• Chairman, CSR Limited (since July 2011) and Director (since December 2008)• Member, Advisory Board of Veolia Environmental Services Australia
(since June 2010)• Member, Australian Rugby League Commission Limited (since February 2012)Board committee membership• Member, Human Resources Committee, Audit & Compliance Committee and
Nomination Committee
BOARD COMMITTEES
Audit & Compliance Committee
Sam Lewis, ChairAbi ClelandChris RobertsJeremy SutcliffeSecretary: Ann Stubbings
Human Resources Committee
John Pizzey, ChairAbi ClelandChris RobertsJeremy SutcliffeSecretary: Ann Stubbings
ORORA LIMITED ANNUAL REPORT 2016 11
For
per
sona
l use
onl
y
OPERATING AND FINANCIAL REVIEW
Nigel Garrard(BEc, CA, MAICD)
Managing Director and Chief Executive Officer
Please see page 10.
David Berry(BSc, GDip AppSc (Business Science))
Group General Manager, Packaging and Distribution
David Berry joined Orora as Group General Manager, Packaging and Distribution at the time of listing in December 2013. Prior to that, David was Group General Manager, Cartons and Sacks with Amcor Australasia, having joined Amcor in 2006. David brings more than 28 years’ experience in the packaging industry, including four years with Visy Industries and 10 years in technical, operations, sales and marketing roles at Southcorp Packaging and Containers Packaging.
Simon Bromell(BSc, GDip Agribus, GAICD)
Group General Manager, Beverage
Simon Bromell joined Orora in 2014 bringing 25 years’ experience in leadership roles across the national food supply chain in consumer goods and agribusiness. Prior to Orora, Simon was General Manager of Gold Coin Asia, and also spent four years as Managing Director of Fonterra’s Australian Ingredients business. Before this, he held senior management roles across a range of businesses and functions at Mars from 1996 to 2009.
Peter de Hennin(BBus (Marketing))
Group General Manager, Paper and Recycling
Prior to joining Orora in 2014, Peter de Hennin was the Chief Executive Officer (CEO) of Detmold Flexibles for five years. Peter brings more than 35 years’ experience in a wide variety of packaging mediums and manufacturing processes, including two years as CEO of Steelbro Group, and three years as CEO of the Finewrap Group of Companies.
Stuart Hutton(BBus, CA)
Chief Financial Officer
Stuart Hutton joined Orora in December 2013, having previously served as Chief Financial Officer (CFO) of Amcor’s Australasia and Packaging Distribution business. Stuart brings more than 20 years’ experience in senior finance roles, including five years with Orica as CFO for the Minova Group, Chemical Services Division and Mining Services (North America) and four years as CFO of WorldMark Holdings Pty Ltd. Stuart spent nine years during the early part of his career with Deloitte Touche Tohmatsu in audit and corporate finance.
Craig Jackson(BCom, MBA, CPA, GAICD)
Group General Manager, Procurement and Supply
Prior to joining Orora, Craig Jackson was Group General Manager, Procurement and Supply within Amcor’s Australasia and Packaging Distribution business, a role he commenced in April 2013. Prior to this, Craig held the position of General Manager Supply Chain and Operations at Fonterra Australia from 2009. Craig’s 20-year career in finance, procurement and supply chain roles includes four years as Commercial Vice President at Mars Australia and New Zealand, and three years as Commercial Director, Mars Food.
EXECUTIVE LEADERSHIP TEAM
12 ORORA LIMITED ANNUAL REPORT 2016
For
per
sona
l use
onl
y

Larry C KingChief Executive Officer, IntegraColor
Prior to joining Orora in 2016, through an acquisition of his company, Larry C King was Chairman/CEO of IntegraColor, having joined that company in 1980 and served in a number of roles, ultimately becoming its sole shareholder and driving its growth and development.IntegraColor serves as a single source, Point of Purchase and solutions provider for various industries throughout North America. Larry was also a two-year finalist for Entrepreneur of the Year.
David Lewis(BCom (Hons))
Group General Manager, Strategy
Prior to Orora’s listing on the ASX, David Lewis spent seven years with Amcor Limited, initially as Vice President of Strategy and then as a Global Key Account Director in Switzerland. Prior to joining Amcor, David had a nine-year career in the investment banking industry. This included six years with UBS, followed by three years at Goldman Sachs JBWere as Vice President, Investment Banking.
Brian Lowe(MBA)
Group General Manager, Fibre
Prior to taking on his current role, Brian Lowe was the Group General Manager of Orora’s Beverage business. This followed two years in the same role with Amcor’s Australasia and Packaging Distribution business. Before joining Amcor in 2011, Brian spent eight years as Managing Director of Delphi Automotive Systems, including four years as Managing Director for Asia Pacific Powertrain in Shanghai. This followed a 10-year career at General Electric (GE), where his last role was Managing Director of GE Plastics, Australia from 2001 to 2003.
Louise Marshall(BBus)
Group General Manager, Human Resources
Louise Marshall joined Orora in the role of Group General Manager, Human Resources in July 2015. Louise brings more than 17 years’ Human Resources experience, including five years at ASX-listed Tabcorp Holdings Limited, where she was Executive General Manager – Human Resources. Prior to her time at Tabcorp, Louise spent more than eight years at PricewaterhouseCoopers, where she was Executive Director Human Capital for its Australian business.
Bernie Salvatore(Dip Ind Mngt (Eng), MBA)
President, Orora Packaging Solutions
Prior to taking on his current role, Bernie Salvatore was President of Amcor Packaging Distribution, having joined the company in 2002. Bernie brings more than 30 years’ experience in the North American packaging industry, working for several publicly listed companies. Prior to Amcor, Bernie spent 20 years with Sealed Air and Cryovac, primarily in sales and marketing roles. His last role at Sealed Air was as Vice President Sales, North America from 2000 to 2002.
Ann Stubbings(BA/LLB, MAICD)
Company Secretary and Group General Counsel
Ann Stubbings has more than 20 years’ experience in corporate legal roles across the manufacturing and financial services sectors, in governance and company secretariat, regulatory matters, commercial law and dispute resolution. Ann joined Orora at its listing on the ASX in December 2013. Prior to her appointment as Orora’s Group General Counsel and Company Secretary, Ann was Senior Group Legal Counsel at Amcor Limited from 2008 to December 2013, and Alternate Company Secretary from 2009. Ann spent the early part of her career in private legal practice.
ORORA LIMITED ANNUAL REPORT 2016 13
For
per
sona
l use
onl
y
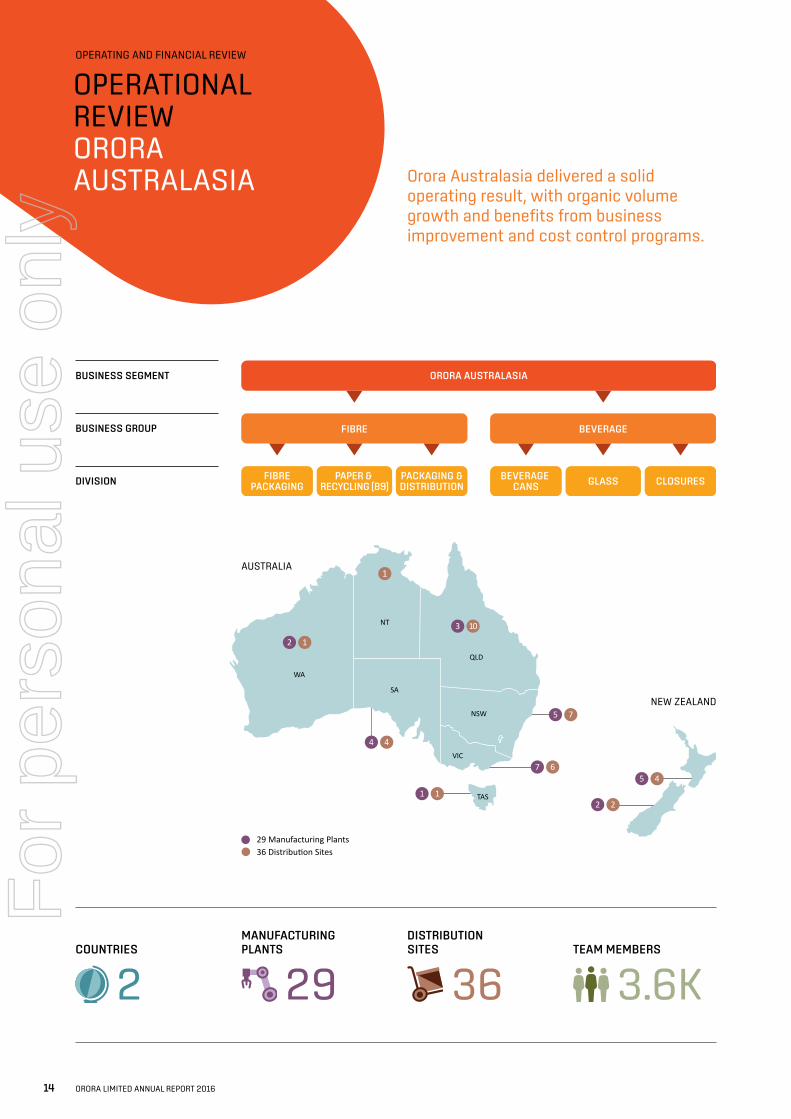
ORORA AUSTRALASIABUSINESS SEGMENT
FIBRE BEVERAGEBUSINESS GROUP
BEVERAGE CANS GLASS CLOSURESFIBRE
PACKAGINGPAPER &
RECYCLING (B9)PACKAGING &DISTRIBUTIONDIVISION
2
1
1
WA
29 Manufacturing Plants36 Distribution Sites
SA
NSW
QLD
VIC
TAS
NT
4 4
1 12 2
5 46
5 7
3 10
7
AUSTRALIA
NEW ZEALAND
OPERATING AND FINANCIAL REVIEW
OPERATIONAL REVIEW ORORA AUSTRALASIA Orora Australasia delivered a solid
operating result, with organic volume growth and benefits from business improvement and cost control programs.
COUNTRIES
MANUFACTURING PLANTS
TEAM MEMBERS
DISTRIBUTION SITES
2 29 36 3.6K
14 ORORA LIMITED ANNUAL REPORT 2016
For
per
sona
l use
onl
y
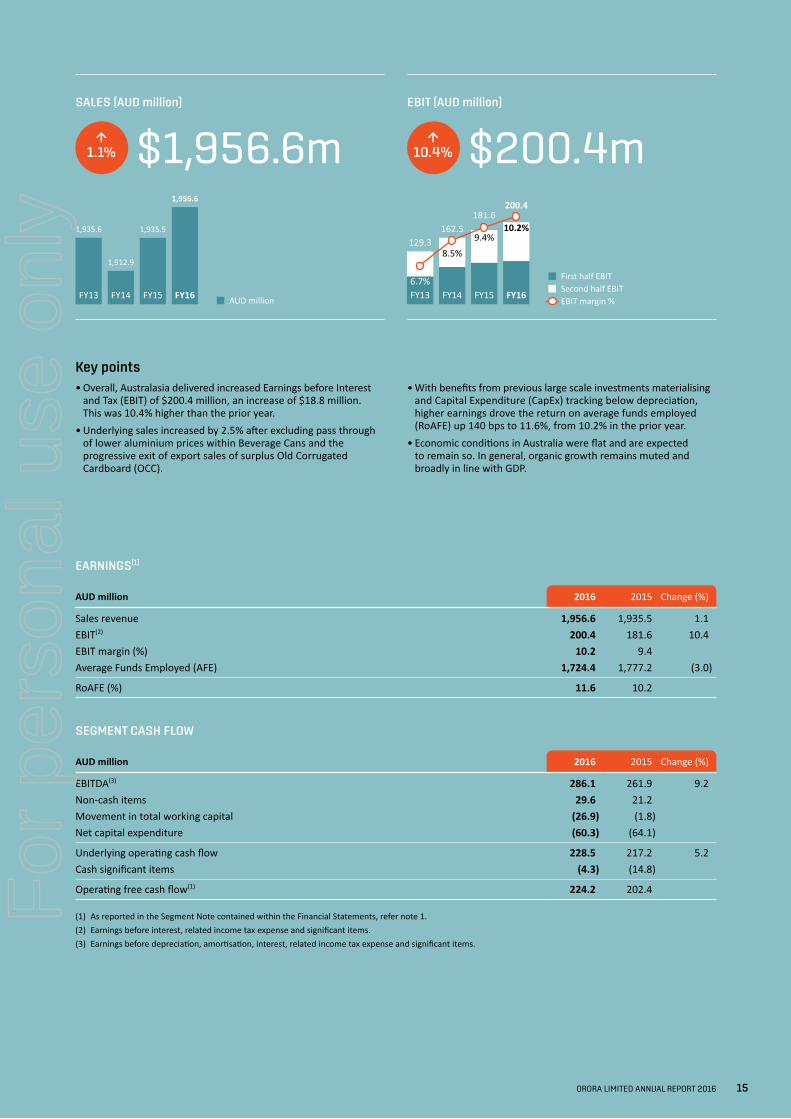
• Overall, Australasia delivered increased Earnings before Interest and Tax (EBIT) of $200.4 million, an increase of $18.8 million. This was 10.4% higher than the prior year.
• Underlying sales increased by 2.5% after excluding pass through of lower aluminium prices within Beverage Cans and the progressive exit of export sales of surplus Old Corrugated Cardboard (OCC).
Key points• With benefits from previous large scale investments materialising
and Capital Expenditure (CapEx) tracking below depreciation, higher earnings drove the return on average funds employed (RoAFE) up 140 bps to 11.6%, from 10.2% in the prior year.
• Economic conditions in Australia were flat and are expected to remain so. In general, organic growth remains muted and broadly in line with GDP.
SALES (AUD million) EBIT (AUD million)
↑1.1%
↑10.4%$1,956.6m $200.4m
AUD million
Sales (AUD million)[1]
FY13 FY14 FY15 FY16
1,935.6
1,912.9
1,935.5
1,956.6
First half EBITSecond half EBITEBIT margin %
EBIT (AUD million)[1]
FY13 FY14 FY15 FY16
129.3162.5
181.6200.4
6.7%
8.5%
9.4%10.2%
EARNINGS(1)
AUD million 2016 2015 Change (%)
Sales revenue 1,956.6 1,935.5 1.1 EBIT(2) 200.4 181.6 10.4 EBIT margin (%) 10.2 9.4Average Funds Employed (AFE) 1,724.4 1,777.2 (3.0)
RoAFE (%) 11.6 10.2
SEGMENT CASH FLOW
AUD million 2016 2015 Change (%)
EBITDA(3) 286.1 261.9 9.2 Non-cash items 29.6 21.2Movement in total working capital (26.9) (1.8)Net capital expenditure (60.3) (64.1)
Underlying operating cash flow 228.5 217.2 5.2 Cash significant items (4.3) (14.8)
Operating free cash flow(1) 224.2 202.4
(1) As reported in the Segment Note contained within the Financial Statements, refer note 1.(2) Earnings before interest, related income tax expense and significant items.(3) Earnings before depreciation, amortisation, interest, related income tax expense and significant items.
ORORA LIMITED ANNUAL REPORT 2016 15
For
per
sona
l use
onl
y
OPERATING AND FINANCIAL REVIEW
Fibre Business GroupFibre earnings were higher than the prior year driven by cost reduction and innovation benefits from the B9 Recycled Paper Mill and improved sales and efficiencies in Fibre Packaging.
Fibre PackagingSales in Australia were higher driven by improved volumes across the agriculture and grocery sectors. The “Go Direct” channel transition in the fruit and produce sector is progressing well with new business partially offsetting lost revenues from the distribution agreement terminated in May 2015.
The business has continued to expand its “Go Direct” channel to market. New depots in Queensland were opened in Bundaberg and Mareeba in July 2016 and a new site in Innisfail is expected to open in late calendar 2016. This expanded distribution network complements the strategic partnership formed with Australia’s largest refrigerated transport company, AHG Refrigerated Logistics. Orora’s augmented end-to-end value proposition, encompassing corrugated cartons and refrigerated logistics, is being well received by fruit and produce customers in the region.
Sales in New Zealand were higher than the prior period, driven by increased volumes in the agriculture sector led by a strong kiwi fruit and apple growing season.
Ongoing cost improvement and sales margin initiatives contributed to improved overall margins across the division.
Designed to improve product quality and output, the business committed approximately $20.0 million during the year to a continued asset upgrade program focusing on modernising printing and converting equipment across Orora’s Australian and New Zealand corrugating sites.
In line with its small and medium sized enterprise (SME) customer strategy focusing on short run, customised corrugated packaging, the Fibre Packaging business rebranded its network of smaller footprint box converters to “Orora Specialty Packaging”. Underpinned by the success of this SME initiative, an expanded Orora Specialty Packaging site in Oakleigh, Victoria, was opened in July 2016.
Packaging and DistributionImproved sales in the quick service restaurant sector were offset by general softness in the grocery and industrial segments. Sales in the dairy segment were broadly stable with the prior year.
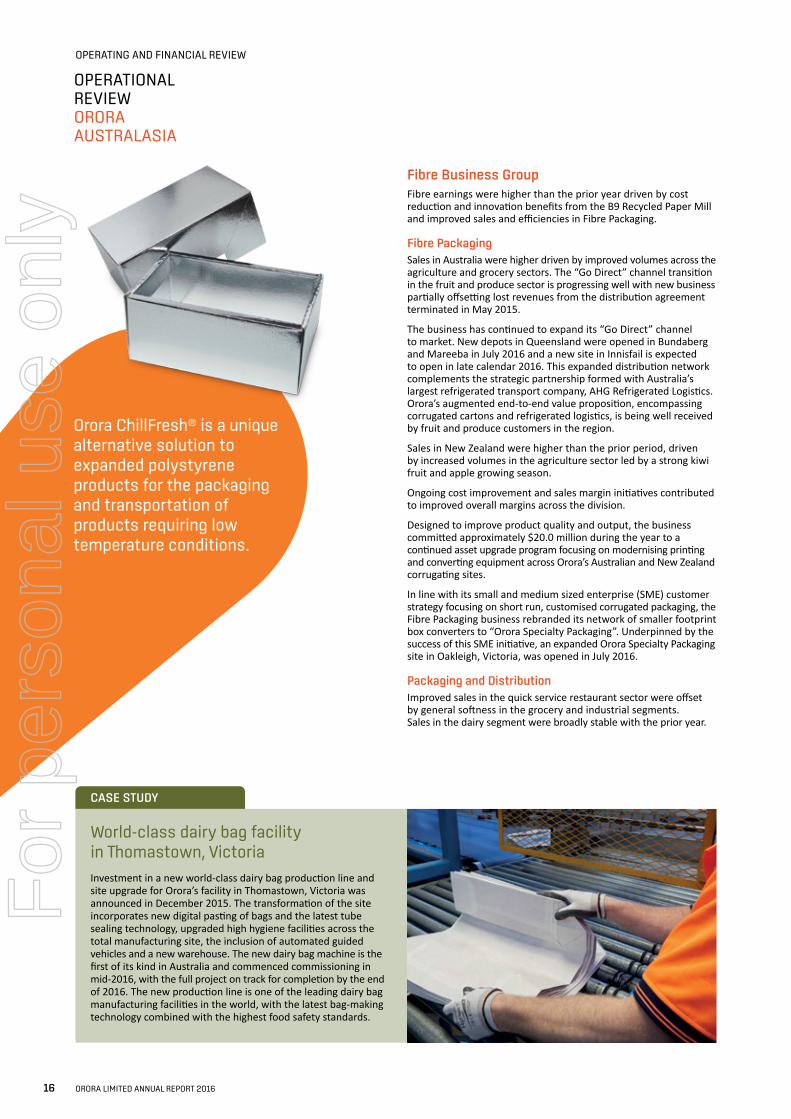
Orora ChillFresh® is a unique alternative solution to expanded polystyrene products for the packaging and transportation of products requiring low temperature conditions.
OPERATIONAL REVIEW ORORA AUSTRALASIA
World-class dairy bag facility in Thomastown, VictoriaInvestment in a new world-class dairy bag production line and site upgrade for Orora’s facility in Thomastown, Victoria was announced in December 2015. The transformation of the site incorporates new digital pasting of bags and the latest tube sealing technology, upgraded high hygiene facilities across the total manufacturing site, the inclusion of automated guided vehicles and a new warehouse. The new dairy bag machine is the first of its kind in Australia and commenced commissioning in mid-2016, with the full project on track for completion by the end of 2016. The new production line is one of the leading dairy bag manufacturing facilities in the world, with the latest bag-making technology combined with the highest food safety standards.
CASE STUDY
16 ORORA LIMITED ANNUAL REPORT 2016
For
per
sona
l use
onl
y
Botany Recycled Paper Mill (B9)B9 produced 382,000 tonnes of recycled paper during FY16 (367,000 tonnes in the prior period) and in line with expectations, successfully exited FY16 at a run rate equal to the design production capacity of 400,000 tonnes. Manufacturing consistency continued to stabilise in the second half of the year following the extended five day maintenance shut in September 2015, which affected first half volumes.
During FY16, B9 exported 79,500 tonnes of recycled paper to Orora North America and US-based customers (55,300 in FY15).
From January 2016, B9 commenced paying higher gas prices due to the expiry of the previous long-term supply agreement. The adverse EBIT impact in the second half of FY16 was approximately $2.0 million.
Beverage Business GroupBeverage volumes were higher than the prior period. Earnings were higher, with improved operating cost control across the Business Group and the reversal of the adverse financial impact from the FY15 glass furnace rebuild. These factors were partially offset by the impact of higher input costs in the Glass business.
Beverage CansVolumes were in line with the prior period with improved operating cost control and manufacturing efficiencies driving higher earnings. A long-term customer agreement which expired in June 2016, was renewed and extended for a further five years to June 2021.
GlassVolumes were ahead of the prior year aided by an increase in market share in beer and improving wine volumes through the period.
Operating efficiency improved and the majority of the adverse financial impact from the FY15 glass furnace rebuild reversed, although these upsides were largely offset by higher input costs of approximately $6.0 million (energy and soda ash) and increased depreciation resulting from the furnace rebuild.
With the Glass furnaces in an oversold position and Orora importing bottles to meet demand, in February 2016, it was announced that $42.0 million would be invested to expand the combined forming capacity of two of the three furnaces by 60 million bottles.
During the year, the business successfully extended two major wine customer contracts for multi-year terms.
Innovation, growth and sustainabilityConstruction of the new $20.0 million state of the art dairy sack line at the existing Thomastown, Victoria, facility is largely completed with the project tracking on time and cost. The new line is currently being commissioned and is expected to be fully operational in the second quarter of FY17.
The Australasian business has continued to actively utilise the Orora Global Innovation Initiative. Approximately $13.0 million of projects have been approved to enhance innovation, modernisation and productivity. As part of this program, to augment Orora’s product offering, a new Glass bottle sleeving line was installed in Gawler (South Australia) and was successfully commissioned in July 2016.
To enhance its customer value proposition through offering superior print and visual display quality, the Fibre Packaging division has committed to an investment in a new state of the art digital printer. This new asset will position Orora at the forefront of digital technology as it applies to the fibre packaging sector. The digital printer is to be located at Scoresby, Victoria, and is expected to be operational in late calendar 2016.
Orora established further relationships with specialist third party vendors during the period to augment its offering of innovative packaging concepts to customers.
• Through the Fibre Packaging business in Australia, Orora has introduced an innovative cold-chain monitoring system called Xsense® to Australia. The system proactively monitors, analyses and disseminates temperature and relative humidity data – optimising the quality of perishable products throughout the cold chain. This technology complements Orora’s solution portfolio for fresh produce, meat and other cold chain products.
• Orora has entered an exclusive relationship with YBP Group Limited to provide customers with an anti-counterfeiting and consumer engagement technology platform with initial applications expected in the wine industry.
Orora has committed to the world’s largest corporate sustainability initiative, the UN Global Compact (UNGC), which is both a framework for action and a platform for demonstrating corporate commitment and leadership. The UNGC establishes ten principles across issues such as Bribery & Corruption, Human Rights, Labour Standards and Environmental Performance.
Orora was awarded the Energy Efficiency & Conservation Council Energy Efficiency Award for large businesses in New Zealand. The Company also received a Highly Commended for specific energy efficiency initiatives at its Wiri Beverage Cans plant, New Zealand.
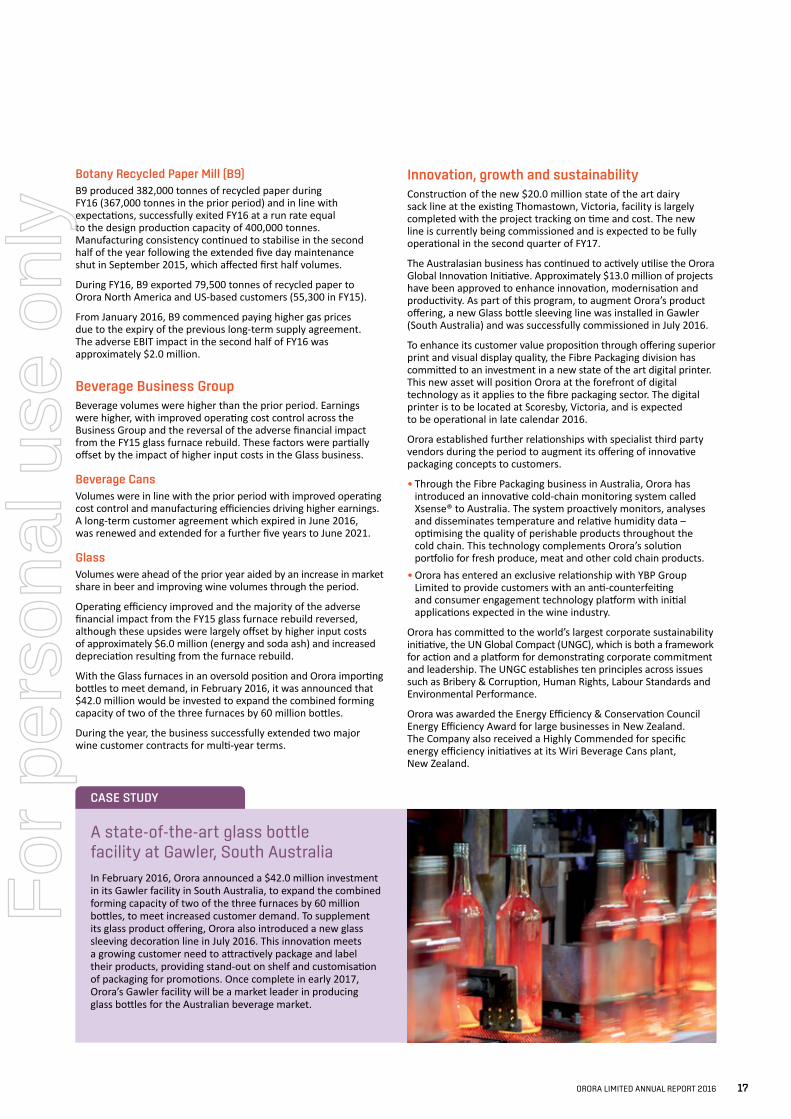
A state-of-the-art glass bottle facility at Gawler, South AustraliaIn February 2016, Orora announced a $42.0 million investment in its Gawler facility in South Australia, to expand the combined forming capacity of two of the three furnaces by 60 million bottles, to meet increased customer demand. To supplement its glass product offering, Orora also introduced a new glass sleeving decoration line in July 2016. This innovation meets a growing customer need to attractively package and label their products, providing stand-out on shelf and customisation of packaging for promotions. Once complete in early 2017, Orora’s Gawler facility will be a market leader in producing glass bottles for the Australian beverage market.
CASE STUDY
ORORA LIMITED ANNUAL REPORT 2016 17
For
per
sona
l use
onl
y
ORORA NORTH AMERICABUSINESS SEGMENT
ORORA PACKAGING SOLUTIONS INTEGRACOLORBUSINESS GROUP
MANUFACTURINGLANDSBERGPACKAGING SOLUTIONSDIVISION
1
9
1
17
WA
1OR
1NV 1CO
3AZ
6
1
2
OH
3TN 1NC
1PA
NY
VT
MENB
NS
KY
NM
UT
CA
1 3TX
1 1IL
1IN
MI
3GA
OK
KS
NE
SD
1
1
1
FL
1MO
LA
AR
MS ALSC
VAWV
IDWY
MT ND
IA
MN
WI
ON
QC
MASAALBC
NH
1 NJ
RICT
MDDE
MA
11 Manufacturing Plants51 Distribution Sites
UNITEDSTATES OF
AMERICA
UNITED KINGDOM
CHINA
CANADA
MEXICO
OPERATING AND FINANCIAL REVIEW
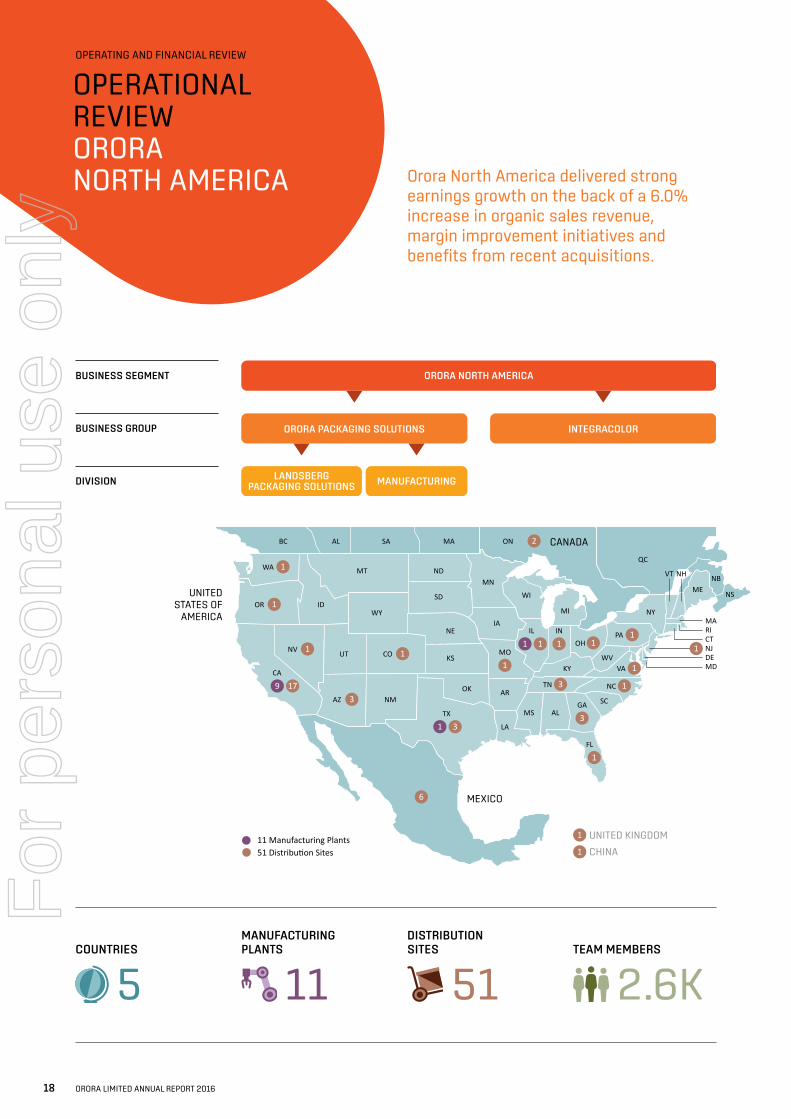
OPERATIONAL REVIEW ORORA NORTH AMERICA Orora North America delivered strong
earnings growth on the back of a 6.0% increase in organic sales revenue, margin improvement initiatives and benefits from recent acquisitions.
COUNTRIES
MANUFACTURING PLANTS
TEAM MEMBERS
DISTRIBUTION SITES
5 11 51 2.6K
18 ORORA LIMITED ANNUAL REPORT 2016
For
per
sona
l use
onl
y
Following the March 2016 acquisition of IntegraColor, Orora North America now comprises two Business Groups:• Orora Packaging Solutions – encompassing the existing Landsberg
and Manufacturing divisions; and• IntegraColor – the recently acquired point of purchase business.
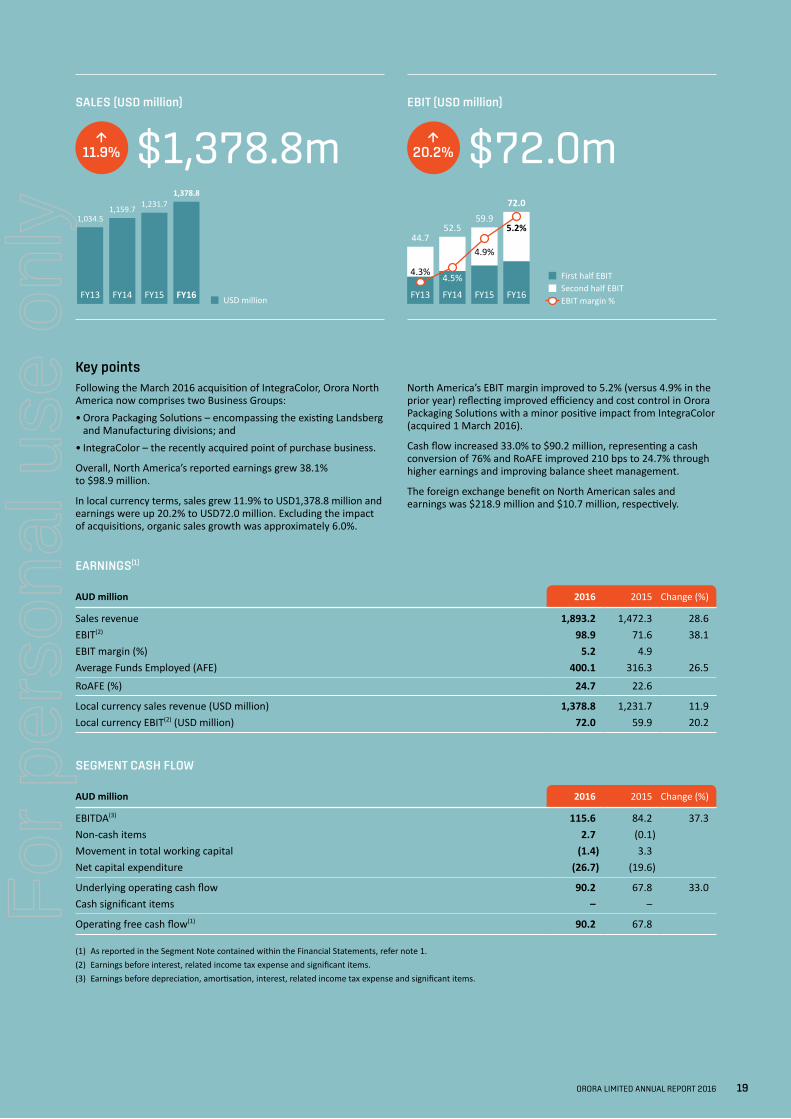
Overall, North America’s reported earnings grew 38.1% to $98.9 million.
In local currency terms, sales grew 11.9% to USD1,378.8 million and earnings were up 20.2% to USD72.0 million. Excluding the impact of acquisitions, organic sales growth was approximately 6.0%.
Key pointsNorth America’s EBIT margin improved to 5.2% (versus 4.9% in the prior year) reflecting improved efficiency and cost control in Orora Packaging Solutions with a minor positive impact from IntegraColor (acquired 1 March 2016).
Cash flow increased 33.0% to $90.2 million, representing a cash conversion of 76% and RoAFE improved 210 bps to 24.7% through higher earnings and improving balance sheet management.
The foreign exchange benefit on North American sales and earnings was $218.9 million and $10.7 million, respectively.
SALES (USD million) EBIT (USD million)
↑11.9%
↑20.2%$1,378.8m $72.0mSales (USD million)[1]
FY13 FY14 FY15 FY16
1,034.51,159.7 1,231.7
1,378.8
USD million
First half EBITSecond half EBITEBIT margin %
EBIT (USD million)[1]
FY13 FY14 FY15 FY16
44.752.5
59.972.0
4.3% 4.5%
4.9%
5.2%
EARNINGS(1)
AUD million 2016 2015 Change (%)
Sales revenue 1,893.2 1,472.3 28.6EBIT(2) 98.9 71.6 38.1EBIT margin (%) 5.2 4.9Average Funds Employed (AFE) 400.1 316.3 26.5
RoAFE (%) 24.7 22.6
Local currency sales revenue (USD million) 1,378.8 1,231.7 11.9Local currency EBIT(2) (USD million) 72.0 59.9 20.2
SEGMENT CASH FLOW
AUD million 2016 2015 Change (%)
EBITDA(3) 115.6 84.2 37.3Non-cash items 2.7 (0.1)Movement in total working capital (1.4) 3.3Net capital expenditure (26.7) (19.6)
Underlying operating cash flow 90.2 67.8 33.0Cash significant items – –
Operating free cash flow(1) 90.2 67.8
(1) As reported in the Segment Note contained within the Financial Statements, refer note 1.(2) Earnings before interest, related income tax expense and significant items.(3) Earnings before depreciation, amortisation, interest, related income tax expense and significant items.
ORORA LIMITED ANNUAL REPORT 2016 19
For
per
sona
l use
onl
y
OPERATING AND FINANCIAL REVIEW
The North American business imported 59,000 tonnes of B9 paper (49,000 tonnes in FY15), which enables the business to market an integrated fibre offering.
Roll out of the new Enterprise Resource Planning (ERP) system commenced in January 2016. It remains on track with the revised implementation schedule and eleven sites have now successfully converted. Implementation at the remaining sites will be progressive over the next 12 to 18 months. There is no change to the revised capital cost estimate of USD25.0 million. The total cumulative spend to date is approximately USD18.0 million.
IntegraColorOn 1 March 2016, Orora announced the acquisition of IntegraColor, a Texas-based provider of Point of Purchase (POP) retail display solutions and visual communication services, for USD77.0 million.
With sales of approximately USD100.0 million, IntegraColor provides Orora with a new earnings stream in North America. The acquisition aligns with Orora’s total packaging solutions customer proposition and moves the North American business further up the value chain and closer to the brand owner.
The vendor has continued with Orora post acquisition and, in addition to overseeing the IntegraColor business, will focus on executing Orora North America’s organic and inorganic growth strategy for POP. The experienced local management team will continue to run the day-to-day operations of IntegraColor.
Integration is tracking well, with good customer and employee engagement and sound progress being made across all integration components.
Financially, IntegraColor is performing in line with expectations. The contribution to FY16 has been adversely impacted by acquisition transaction costs of approximately $1.4 million (USD1.0 million), which were expensed during the period.
Orora Packaging SolutionsOrora Packaging Solutions delivered strong sales growth and higher earnings despite continued muted economic and market conditions.
Orora Packaging Solutions’ EBIT margin improved to 5.1% (versus 4.9% in the prior period) driven by an ongoing focus on enhancing the value add service offering and improving efficiency, cost control and procurement.
Despite flat market conditions, Landsberg increased revenue by continuing to successfully execute on its market growth strategy. Through its product breadth, uniform service offering and leveraging its national footprint, the business generated higher sales to existing customers and won market share largely from independent players. The business benefited from a continued focus on securing larger corporate accounts within the targeted markets of food, IT, auto and pharmaceutical/health and by sustained commission-only sales growth.
To further enhance the ongoing evolution to a “Total Packaging Solutions Supplier”, Landsberg acquired a small Californian based supplier of flexible packaging. The acquisition provides sourcing lines for flexible packaging from Asia and assisted Landsberg to win new business during the period, through augmenting its customer value proposition.
The successful integration of the July 2014 acquisition of Worldwide Plastics has delivered a 20% RoAFE in FY16 – a full year ahead of return criteria. Meanwhile, integration of the 1 September 2015 acquisition of Jakait, a specialised supplier of packaging, logistics services and label products to the greenhouse produce sector based in Ontario (Canada), is on track.
Underpinned by support from existing corporate accounts, two new distribution sites were opened in Orlando, Florida, and Charlotte, North Carolina, during the second half of FY16, further bolstering Landsberg’s geographic footprint.
The Manufacturing division increased earnings through higher volumes, improved manufacturing efficiency and solid operating cost control, despite continued margin pressure from surplus new industry capacity entering the market.
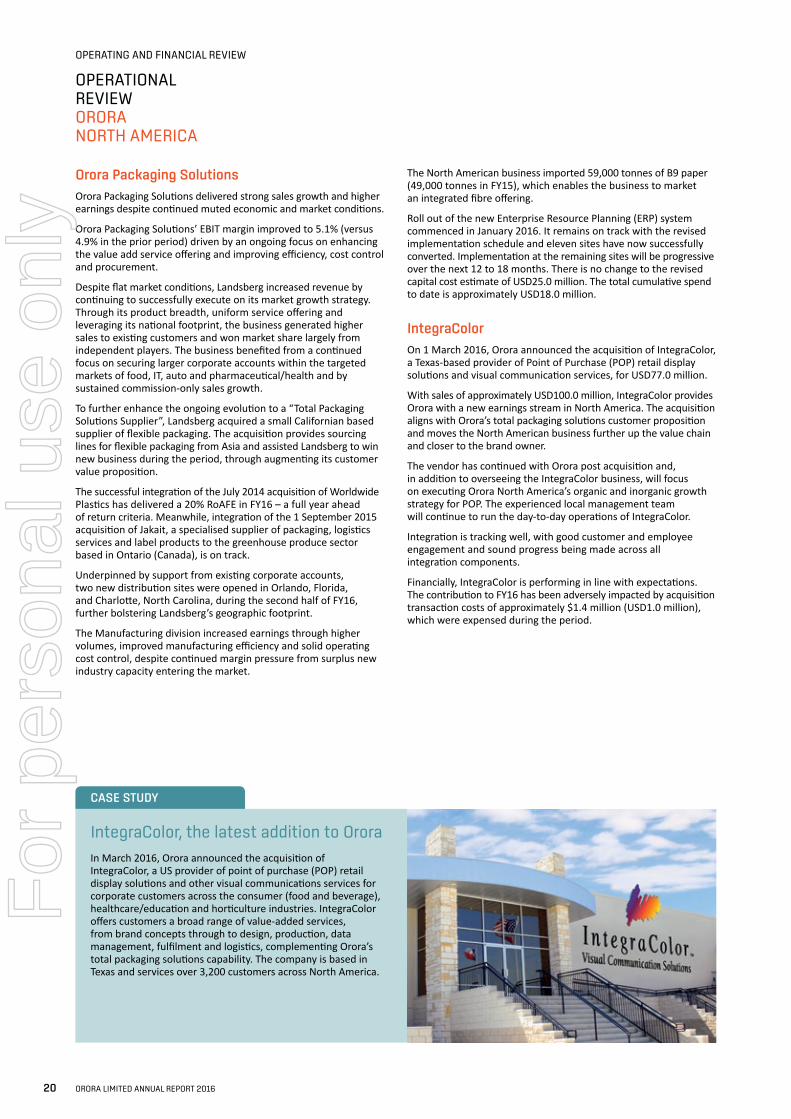
IntegraColor, the latest addition to OroraIn March 2016, Orora announced the acquisition of IntegraColor, a US provider of point of purchase (POP) retail display solutions and other visual communications services for corporate customers across the consumer (food and beverage), healthcare/education and horticulture industries. IntegraColor offers customers a broad range of value-added services, from brand concepts through to design, production, data management, fulfilment and logistics, complementing Orora’s total packaging solutions capability. The company is based in Texas and services over 3,200 customers across North America.
CASE STUDY
OPERATIONAL REVIEW ORORA NORTH AMERICA
20 ORORA LIMITED ANNUAL REPORT 2016
For
per
sona
l use
onl
y
Growth agendaWhilst the bias remains slightly positive, the business is yet to witness any tangible improvement in economic conditions within North America.
The focus of Landsberg remains on securing large corporate accounts and increasing sales with existing customers. This growth will be driven organically through leveraging the national footprint, extensive product breadth, uniform service offering and a customised packaging solution value proposition.
Orora Packaging Solutions will continue to seek to capitalise on the benefits of an integrated fibre operation through selling the enhanced performance characteristics of B9 paper.
Thus far, approximately USD5.0 million of Orora North America projects have been approved under the Orora Global Innovation Initiative. This includes an investment in a business-to-consumer offering to which Landsberg is already supplying packaging and fulfilment services. The innovative online business provides chilled fresh food to the customer’s home.
A pipeline of acquisition targets within the preferred market segments continues to be developed in the Packaging Solutions sector. These acquisitions either extend the geographic footprint and/or enhance the business’s customised product capability. The completion of the roll out of the new ERP system is a key enabler to this acquisition growth opportunity.
Attracted by heavily customised product/service dynamics of POP, a pipeline of national acquisition targets to be bolted onto IntegraColor is also now being developed. These opportunities are likely to be primarily focused on extending the geographic footprint as well as augmenting the product and service capability.
CASE STUDY
Two new distribution sites for Landsberg Packaging Solutions in 2016The packaging market in south-eastern USA is rapidly growing, as manufacturing companies continue to relocate there in order to capture the benefits of a more favourable business environment. Aligned with Orora’s growth strategy in this region, two new locations have been added.
In Charlotte, North Carolina, a 60,000 square foot (5,600 square metre) facility has been added with the capability of servicing customers within a 450-kilometre radius. The location is anchored with two long-term large corporate accounts and will provide Orora with a growth platform to extend our business in North and South Carolina.
In Orlando, Florida a 50,000 square foot (4,650 square metre) facility has been added, which is ideally located to support the growing fresh produce industry for the retail market. The facility, initially supported by a large food processing customer, has already allowed Orora to attract and support a number of additional new customers.
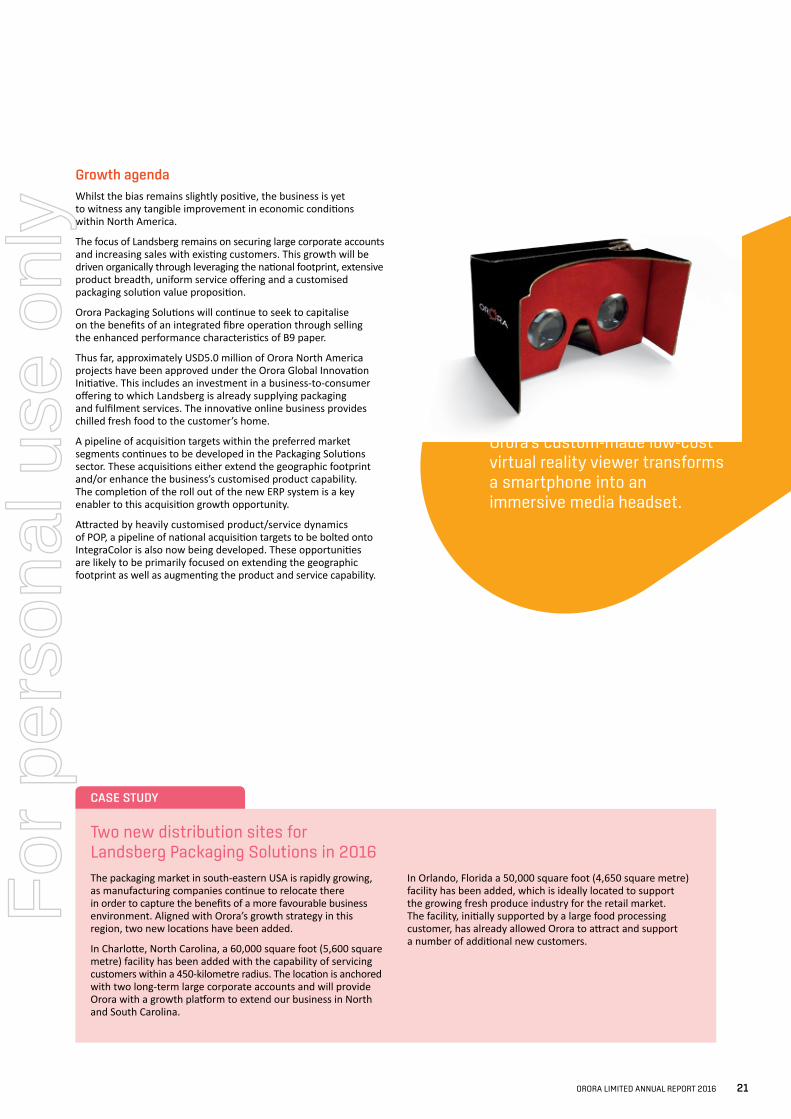
Orora’s custom-made low-cost virtual reality viewer transforms a smartphone into an immersive media headset.
ORORA LIMITED ANNUAL REPORT 2016 21
For
per
sona
l use
onl
y
OPERATING AND FINANCIAL REVIEW
FINANCIAL REVIEW SUMMARY
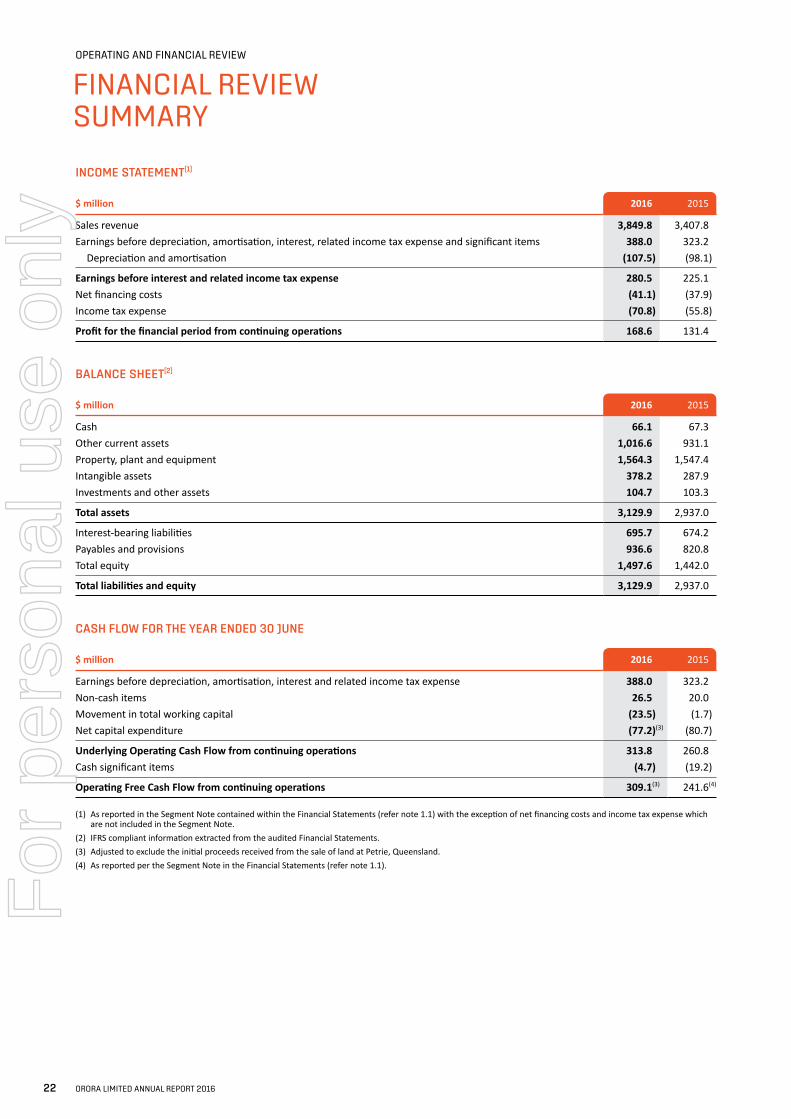
INCOME STATEMENT(1)
$ million 2016 2015
Sales revenue 3,849.8 3,407.8Earnings before depreciation, amortisation, interest, related income tax expense and significant items 388.0 323.2 Depreciation and amortisation (107.5) (98.1)
Earnings before interest and related income tax expense 280.5 225.1Net financing costs (41.1) (37.9)Income tax expense (70.8) (55.8)
Profit for the financial period from continuing operations 168.6 131.4
BALANCE SHEET(2)
$ million 2016 2015
Cash 66.1 67.3Other current assets 1,016.6 931.1Property, plant and equipment 1,564.3 1,547.4Intangible assets 378.2 287.9Investments and other assets 104.7 103.3
Total assets 3,129.9 2,937.0
Interest-bearing liabilities 695.7 674.2Payables and provisions 936.6 820.8Total equity 1,497.6 1,442.0
Total liabilities and equity 3,129.9 2,937.0
CASH FLOW FOR THE YEAR ENDED 30 JUNE
$ million 2016 2015
Earnings before depreciation, amortisation, interest and related income tax expense 388.0 323.2Non-cash items 26.5 20.0Movement in total working capital (23.5) (1.7)Net capital expenditure (77.2)(3) (80.7)
Underlying Operating Cash Flow from continuing operations 313.8 260.8Cash significant items (4.7) (19.2)
Operating Free Cash Flow from continuing operations 309.1(3) 241.6(4)
(1) As reported in the Segment Note contained within the Financial Statements (refer note 1.1) with the exception of net financing costs and income tax expense which are not included in the Segment Note.
(2) IFRS compliant information extracted from the audited Financial Statements.(3) Adjusted to exclude the initial proceeds received from the sale of land at Petrie, Queensland.(4) As reported per the Segment Note in the Financial Statements (refer note 1.1).
22 ORORA LIMITED ANNUAL REPORT 2016
For
per
sona
l use
onl
y
RevenueSales revenue of $3,849.8 million was up 13.0% on the prior period.
The Australasian segment increased underlying sales by 2.5% with the Fibre Packaging division delivering higher volumes across key segments, including benefits from very strong kiwi fruit and apple crops in New Zealand, and the net of the transition impact of the “Go Direct” model in fruit and produce. The Glass business delivered higher volumes aided by increased market share in beer and improving wine volumes through the period.
These revenue gains were partially offset by lower export sales of surplus Old Corrugated Cardboard (OCC) from ongoing OCC collection footprint rationalisation and the pass through of lower aluminium prices within Beverage Cans.
North America grew local currency revenue by 11.9% through securing increased sales to existing customers, winning market share and benefits from the acquisitions of IntegraColor (effective 1 March 2016) and Jakait (effective 1 September 2015). Excluding the impact of acquisitions, underlying organic local currency North American sales growth was approximately 6.0%.
The foreign exchange benefit on US dollar denominated North America sales was $218.9 million.
Earnings before interest and taxDuring the period, EBIT increased by 24.6% to $280.5 million. Excluding Petrie, underlying EBIT increased by 20.9% to $272.1 million.
The Australasian segment increased earnings with the Fibre Packaging division growing volumes and, together with B9, delivered incremental cost reduction and innovation benefits. The Beverage division improved operating efficiency, grew Glass volumes and benefited from the reversal of the majority of the adverse financial impact from FY15 glass furnace rebuild.
The North American business delivered increased earnings from higher sales and procurement and cost efficiency benefits. The business also benefited from acquisitions completed during the period and the foreign exchange translation benefit from US dollar denominated earnings of $10.7 million.
The business was not without headwinds and the increase in earnings were partially offset by higher input costs within the Glass division (gas, electricity and soda ash) and B9 (gas); higher depreciation within the Glass division following the furnace rebuild in the second half of FY15; the timing impact from the transition to the “Go Direct” channel in the fruit and produce sector in Fibre Australia; and tighter margins in the North American Manufacturing business.
Cost reduction updateOrora delivered $13.7 million of incremental cost reduction and innovation benefits from the B9 Recycled Paper Mill in FY16 (compared with FY15), taking the cumulative total to $35.1 million.
The incremental B9 benefits reflect $11.2 million from cost reduction and $2.5 million from innovation/sales synergy benefits.
Balance sheetThe increase in other current assets is mainly a result of a rise in capital receivables relating to the sale of land at Petrie, Queensland; higher receivables within the Fibre Packaging division owing to the New Zealand kiwi fruit and apple season; finished good stock build in Glass ahead of output curtailments in relation to the FY17 capacity expansion; foreign exchange translation effect on North American receivables and inventories and the impact of the North American acquisitions of IntegraColor and Jakait. This was offset by lower inventory in most Australasian divisions.
Net property, plant and equipment (PP&E) was higher with the foreign exchange translation impact on Orora North America PP&E and additions relating to the recent acquisitions offsetting the sale of surplus land at Petrie, Queensland, and Botany, New South Wales.
Capital expenditure (CapEx) for FY16 included spend on the following major items: plant and equipment for the new dairy sack line at Thomastown, Victoria, initial payments in relation to the Glass capacity expansion, corrugated converting equipment upgrades, beverage can manufacturing equipment improvements, construction of the new Auckland, New Zealand, Cartons site and payments for projects approved under the Orora Global Innovation Initiative. Depreciation and amortisation for the period was $107.5 million.
The increase in intangible assets reflects movement within the North American business associated with the foreign exchange translation effect on intangible assets, goodwill relating to acquisitions and costs associated with the new ERP system.
Net debt increased by $22.7 million during the period with investments in capital, acquisitions in North America and dividends offsetting increased operating cash flows and proceeds from the sale of surplus land. The adverse foreign exchange translation impact on USD denominated net debt was $2.1 million. On a constant currency basis, net debt would have been $20.6 million higher than June 2015.
The increase in payables is mainly the result of an ongoing improvement in trading terms with vendors, impact of the North American acquisitions and the foreign exchange translation effect of North American payables. There was also an increase in provisions attributable to the decommissioning costs following the sale of land at Petrie.
ORORA LIMITED ANNUAL REPORT 2016 23
For
per
sona
l use
onl
y
OPERATING AND FINANCIAL REVIEW
FINANCIAL REVIEW SUMMARY
Cash flowEarnings growth was successfully converted into cash with operating cash flow increasing by $53.0 million to $313.8 million. This excludes the initial proceeds on the sale of Petrie land.
Cash conversion was 76%, in line with the prior period and ahead of Management’s indicated cash conversion target of 70%.
Main cash flow movements included:• Increase in Earnings before Interest, Tax, Depreciation and
Amortisation (EBITDA) of $64.8 million;• Working capital was well managed across the Group.
The increase in working capital was mainly attributable to the following timing related issues, which are all expected to reverse during FY17:
– Inventory build at Glass ahead of the forthcoming capacity expansion; – Delay in transitioning to an import sourcing model for aluminium; and – Later fruit and produce season in New Zealand pushing up receivables in the Fibre Packaging business;
• Gross CapEx totalled $87.8 million which includes innovation projects;
• Net CapEx of $77.2 million includes the proceeds from the sale of surplus land at Botany ($10.6 million) but excludes the initial proceeds from the sale of Petrie land ($20.0 million) for reporting consistency;
• Cash significant items in FY16 relate to spend on onerous recycling contracts and minor plant closures.
Working capitalDuring the period, average total working capital to sales decreased to 9.6% (versus 10.3% in FY15) due to generally improved working capital management across the Group.
At the start of FY16, inventory levels at Glass were lower than the normal level following the furnace rebuild late in FY15 and have progressively increased during the year, including building inventories to cover downtime associated with the upcoming capacity expansion.
Working capital management remains an on-going focus across the Group and the management target for average total working capital to sales is less than 10.0% in the medium term.
CorporateCorporate costs were $18.8 million and include an $8.4 million gain from the sale of surplus land in Petrie. Underlying Corporate costs of $27.2 million were slightly lower than the prior period ($28.1 million).
Included in Corporate are reorganisation costs associated with both the new dairy sack line and New Zealand Cartons business partially offset by the profit on sale of surplus land at Botany.
The Petrie site was sold for $50.5 million. Consideration of $20.0 million was received during FY16. The balance of the proceeds will be received as decommissioning of the site progresses over the next two years.
24 ORORA LIMITED ANNUAL REPORT 2016
For
per
sona
l use
onl
y
SUSTAINABILITY AT ORORA
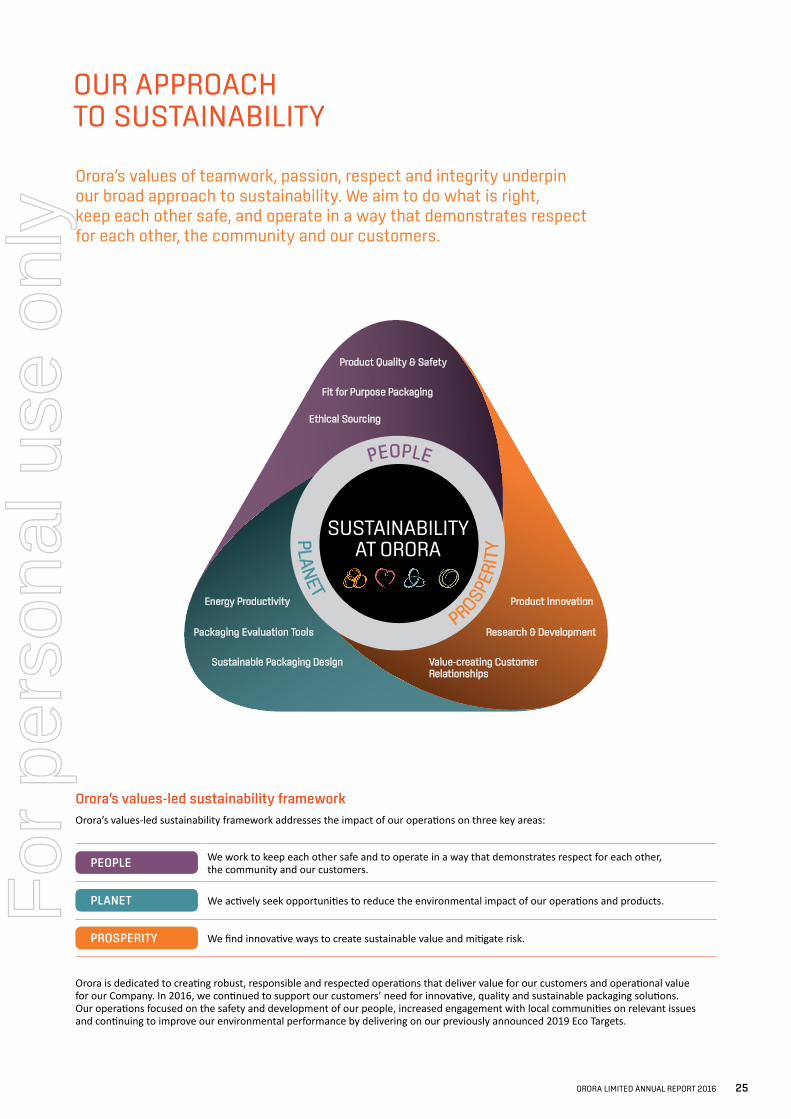
Orora’s values-led sustainability frameworkOrora’s values-led sustainability framework addresses the impact of our operations on three key areas:
PEOPLE We work to keep each other safe and to operate in a way that demonstrates respect for each other, the community and our customers.
PLANET We actively seek opportunities to reduce the environmental impact of our operations and products.
PROSPERITY We find innovative ways to create sustainable value and mitigate risk.
Orora is dedicated to creating robust, responsible and respected operations that deliver value for our customers and operational value for our Company. In 2016, we continued to support our customers’ need for innovative, quality and sustainable packaging solutions. Our operations focused on the safety and development of our people, increased engagement with local communities on relevant issues and continuing to improve our environmental performance by delivering on our previously announced 2019 Eco Targets.
OUR APPROACH TO SUSTAINABILITY
Orora’s values of teamwork, passion, respect and integrity underpin our broad approach to sustainability. We aim to do what is right, keep each other safe, and operate in a way that demonstrates respect for each other, the community and our customers.
ORORA LIMITED ANNUAL REPORT 2016 25
For
per
sona
l use
onl
y
OPERATING AND FINANCIAL REVIEW
Ethical sourcingEthical sourcing is a risk that spans both the people and planet pillars of Orora’s sustainability framework, and has both operational and customer value implications.
Orora’s ethical sourcing risk can be described as the reputational and supply chain risk arising from increased sourcing of materials from developing countries that may not necessarily have the same standards for governance, human rights, environmental protection and quality as more established markets.
Orora’s current priority is the responsible sourcing of fibre for our fibre and sack product range. Orora recognises the significant and detrimental impact of illegal logging on the global economy, society and the environment. Under Orora Australasia’s Sustainable Fibre Sourcing Policy, all wood, pulp and reclaimed fibres used in the manufacture of our paper and cartonboard products must be sourced from socially and environmentally responsible and controlled sources as defined by the Forest Stewardship Council® (FSC®) 3. Orora’s Sustainable Fibre Sourcing Due Diligence Framework also supports our compliance with the Illegal Logging Prohibition Act and Amendment Regulations 4.
Extract from Orora Australasia’s Sustainable Fibre Sourcing Policy
Orora Australasia is not and will not be directly or indirectly involved in the following activities: • illegal logging or the trade in illegal wood or forest products • violation of traditional and human rights in forestry operations • destruction of high conservation values in forestry operations• significant conversion of forests to plantations or non-forest use• introduction of genetically modified organisms in forestry
operations.
Moving forward, Orora will broaden its ethical sourcing focus to consider other priority inputs and general enhancements across our supplier base.
Freedom of AssociationUNGC Principle 3: Businesses should uphold the freedom of association and the effective recognition of the right to collective bargaining.
The majority of Orora’s production team members across the Company’s Australian and New Zealand production sites are believed to be members of a trade union. Additionally, and irrespective of whether the team members are members of a trade union, Orora bargains collectively with our production site team members to agree terms and conditions of employment.
In recent years, Orora has forged a new, highly effective and collaborative model of business change with our team members and their union representatives at a number of our Australian Fibre Packaging sites. This approach has been a significant contributing factor to improved business performance and the model has been recognised by academics and government authorities as particularly progressive.
See https://www.fwc.gov.au/documents/documents/engagement/case-studies/Orora-Case-Study-2015.pdf
CASE STUDY
OUR APPROACH TO SUSTAINABILITY
United Nations Global CompactIn April 2016, Orora’s Managing Director & CEO, Nigel Garrard, was pleased to commit Orora to the United Nations Global Compact (UNGC), a voluntary initiative to address global human rights, labour, environment and anti-corruption issues. The UNGC goals complement the Orora values, and particularly our focus on ethical sourcing. We are committed to making the UNGC principles part of Orora’s strategy and day-to-day operations. We will submit an annual Communication on Progress report to the UNGC and engage in collaborative projects which advance the broader development goals of the United Nations, particularly the Sustainable Development Goals.
Addressing sustainability riskIn 2015, Orora engaged external advisors to undertake an extensive assessment of its external risk profile. This year, Orora undertook an internal review of the findings of this assessment and has again determined that it does not have a material exposure to environmental or social sustainability risk at this time.
This reflects positively on our people and processes, and it is not a statement we take lightly. Orora has undertaken a detailed assessment of its exposure to material economic, environmental and social sustainability risks in accordance with Recommendation 7.4 of the 3rd Edition of the ASX’s Corporate Governance Principles and Recommendations 1. Orora’s approach to sustainability risk profiling in 2015 was positively recognised in the ASX/KPMG Corporate Governance Council report Adoption of the 3rd Edition Corporate Governance Principles and Recommendations 2 by ASX listed entities.
Building on our history of good operating practice, in the year ended 30 June 2016, Orora developed response plans to address our most significant potential impacts. While no material exposure to environmental or social sustainability risk exists at this time, Orora continues to actively monitor and address the other areas of potential impact detailed in the 2015 assessment, including ethical sourcing, safety, energy pricing and supply, innovation, waste and recycling, climate and resource depletion risks.
Orora intends to carry out the sustainability materiality assessment process on a periodic basis as part of the normal risk assessment cycle and respond to new risks that emerge as required.
For information on Orora’s assessment of material risks, including economic risks, refer to the Principal Risks section of this report.
26 ORORA LIMITED ANNUAL REPORT 2016
For
per
sona
l use
onl
y
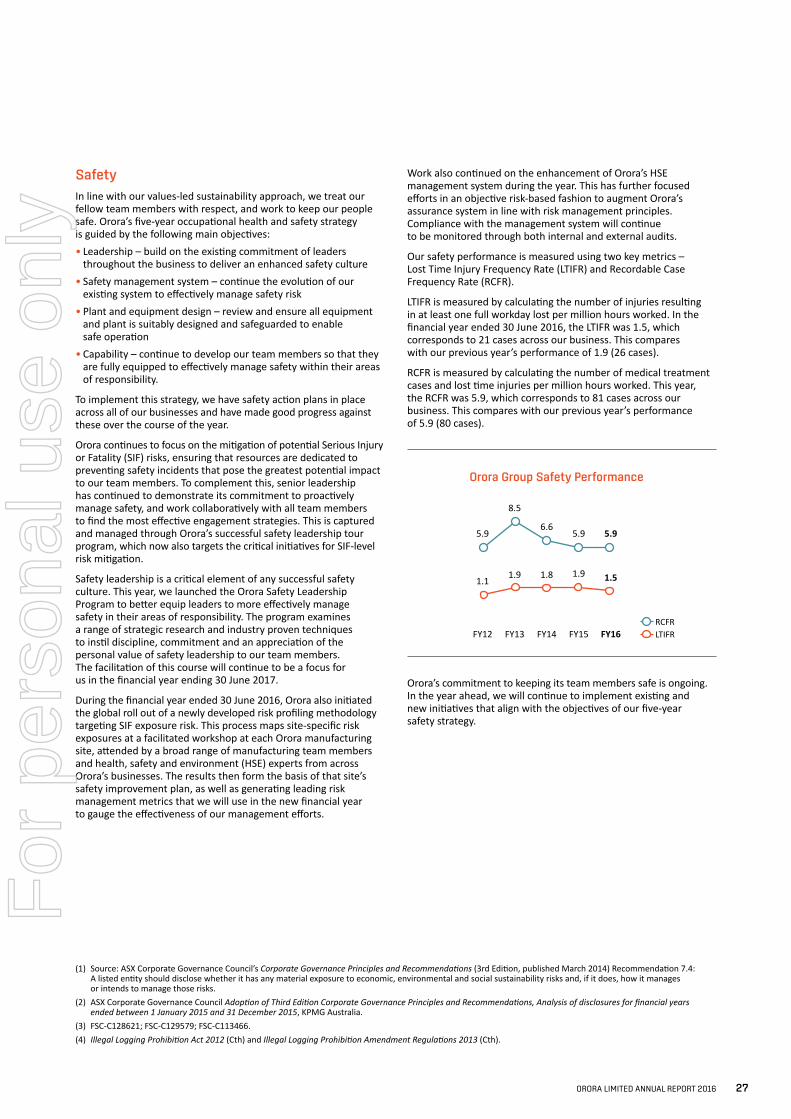
SafetyIn line with our values-led sustainability approach, we treat our fellow team members with respect, and work to keep our people safe. Orora’s five-year occupational health and safety strategy is guided by the following main objectives:• Leadership – build on the existing commitment of leaders
throughout the business to deliver an enhanced safety culture• Safety management system – continue the evolution of our
existing system to effectively manage safety risk• Plant and equipment design – review and ensure all equipment
and plant is suitably designed and safeguarded to enable safe operation
• Capability – continue to develop our team members so that they are fully equipped to effectively manage safety within their areas of responsibility.
To implement this strategy, we have safety action plans in place across all of our businesses and have made good progress against these over the course of the year.
Orora continues to focus on the mitigation of potential Serious Injury or Fatality (SIF) risks, ensuring that resources are dedicated to preventing safety incidents that pose the greatest potential impact to our team members. To complement this, senior leadership has continued to demonstrate its commitment to proactively manage safety, and work collaboratively with all team members to find the most effective engagement strategies. This is captured and managed through Orora’s successful safety leadership tour program, which now also targets the critical initiatives for SIF-level risk mitigation.
Safety leadership is a critical element of any successful safety culture. This year, we launched the Orora Safety Leadership Program to better equip leaders to more effectively manage safety in their areas of responsibility. The program examines a range of strategic research and industry proven techniques to instil discipline, commitment and an appreciation of the personal value of safety leadership to our team members. The facilitation of this course will continue to be a focus for us in the financial year ending 30 June 2017.
During the financial year ended 30 June 2016, Orora also initiated the global roll out of a newly developed risk profiling methodology targeting SIF exposure risk. This process maps site-specific risk exposures at a facilitated workshop at each Orora manufacturing site, attended by a broad range of manufacturing team members and health, safety and environment (HSE) experts from across Orora’s businesses. The results then form the basis of that site’s safety improvement plan, as well as generating leading risk management metrics that we will use in the new financial year to gauge the effectiveness of our management efforts.
Work also continued on the enhancement of Orora’s HSE management system during the year. This has further focused efforts in an objective risk-based fashion to augment Orora’s assurance system in line with risk management principles. Compliance with the management system will continue to be monitored through both internal and external audits.
Our safety performance is measured using two key metrics – Lost Time Injury Frequency Rate (LTIFR) and Recordable Case Frequency Rate (RCFR).
LTIFR is measured by calculating the number of injuries resulting in at least one full workday lost per million hours worked. In the financial year ended 30 June 2016, the LTIFR was 1.5, which corresponds to 21 cases across our business. This compares with our previous year’s performance of 1.9 (26 cases).
RCFR is measured by calculating the number of medical treatment cases and lost time injuries per million hours worked. This year, the RCFR was 5.9, which corresponds to 81 cases across our business. This compares with our previous year’s performance of 5.9 (80 cases).
RCFRLTIFR
Orora Group Safety Performance
5.9
8.5
6.65.9 5.9
1.11.9 1.8 1.9 1.5
FY12 FY13 FY14 FY15 FY16
Orora’s commitment to keeping its team members safe is ongoing. In the year ahead, we will continue to implement existing and new initiatives that align with the objectives of our five-year safety strategy.
(1) Source: ASX Corporate Governance Council’s Corporate Governance Principles and Recommendations (3rd Edition, published March 2014) Recommendation 7.4: A listed entity should disclose whether it has any material exposure to economic, environmental and social sustainability risks and, if it does, how it manages or intends to manage those risks.
(2) ASX Corporate Governance Council Adoption of Third Edition Corporate Governance Principles and Recommendations, Analysis of disclosures for financial years ended between 1 January 2015 and 31 December 2015, KPMG Australia.
(3) FSC-C128621; FSC-C129579; FSC-C113466.(4) Illegal Logging Prohibition Act 2012 (Cth) and Illegal Logging Prohibition Amendment Regulations 2013 (Cth).
ORORA LIMITED ANNUAL REPORT 2016 27
For
per
sona
l use
onl
y
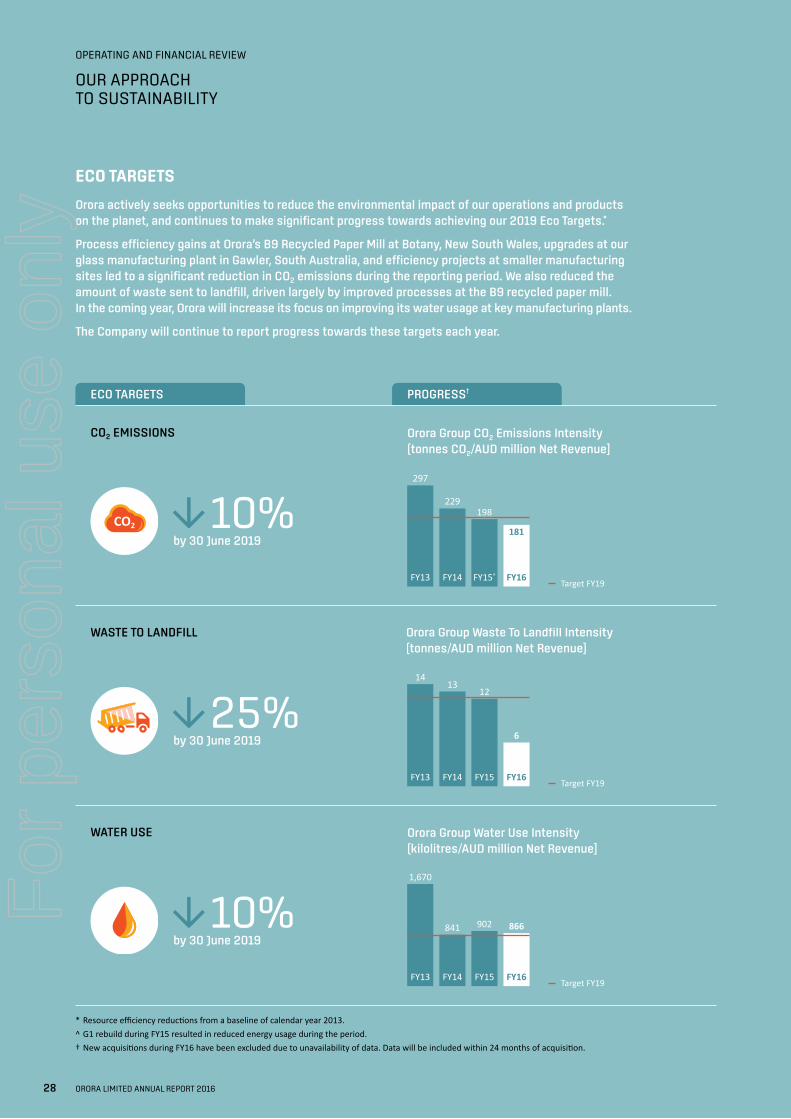
OPERATING AND FINANCIAL REVIEW
OUR APPROACH TO SUSTAINABILITY
* Resource efficiency reductions from a baseline of calendar year 2013.^ G1 rebuild during FY15 resulted in reduced energy usage during the period.† New acquisitions during FY16 have been excluded due to unavailability of data. Data will be included within 24 months of acquisition.
CO2 EMISSIONS
↓ 10%by 30 June 2019
CO2
WASTE TO LANDFILL
↓ 25%by 30 June 2019
WATER USE
↓ 10%by 30 June 2019
ECO TARGETS PROGRESS†
ECO TARGETS
Orora actively seeks opportunities to reduce the environmental impact of our operations and products on the planet, and continues to make significant progress towards achieving our 2019 Eco Targets.*
Process efficiency gains at Orora’s B9 Recycled Paper Mill at Botany, New South Wales, upgrades at our glass manufacturing plant in Gawler, South Australia, and efficiency projects at smaller manufacturing sites led to a significant reduction in CO2 emissions during the reporting period. We also reduced the amount of waste sent to landfill, driven largely by improved processes at the B9 recycled paper mill. In the coming year, Orora will increase its focus on improving its water usage at key manufacturing plants.
The Company will continue to report progress towards these targets each year.
Orora Group Waste To Landfill Intensity (tonnes/AUD million Net Revenue]
FY13 FY14 FY15 FY16Target FY19
1413
12
6
Target FY19
Orora Group Water Use Intensity (kilolitres/AUD million Net Revenue]
FY13 FY14 FY15 FY16
1,670
841 902 866
Target FY19
Orora Group CO2 Emissions Intensity (tonnes CO2/AUD million Net Revenue]
FY13 FY14 FY15^ FY16
297
229198
181
28 ORORA LIMITED ANNUAL REPORT 2016
For
per
sona
l use
onl
y
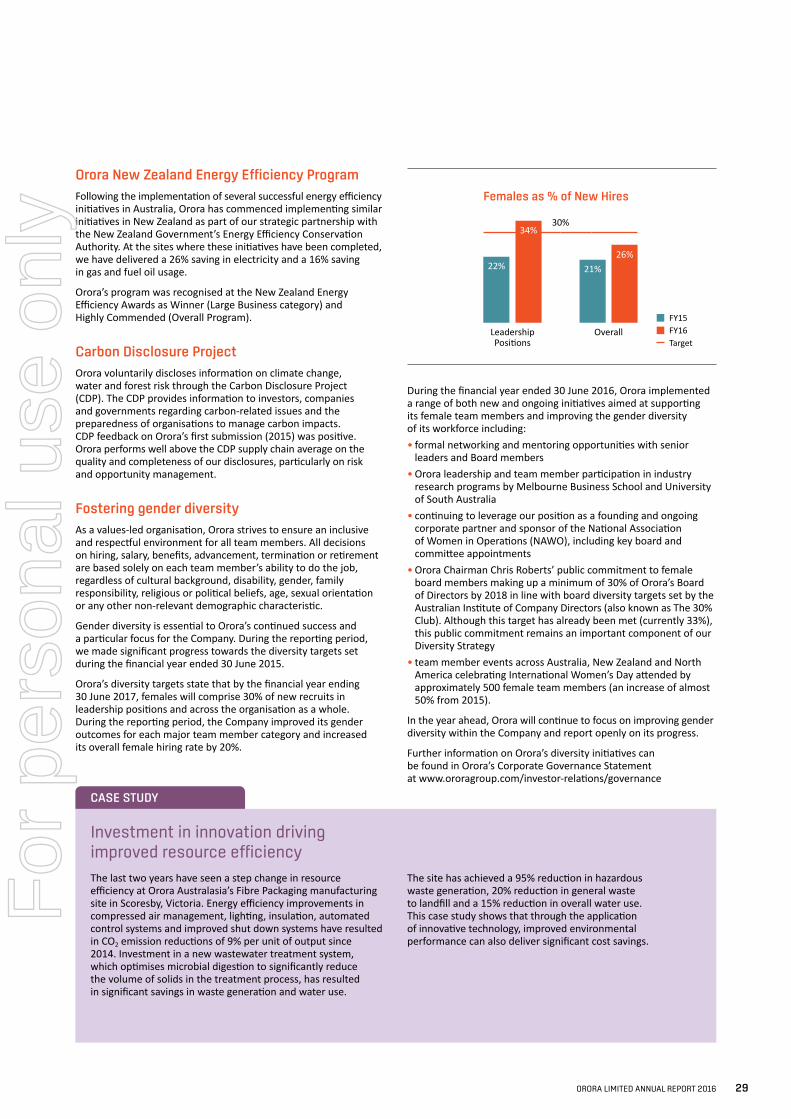
Investment in innovation driving improved resource efficiency The last two years have seen a step change in resource efficiency at Orora Australasia’s Fibre Packaging manufacturing site in Scoresby, Victoria. Energy efficiency improvements in compressed air management, lighting, insulation, automated control systems and improved shut down systems have resulted in CO2 emission reductions of 9% per unit of output since 2014. Investment in a new wastewater treatment system, which optimises microbial digestion to significantly reduce the volume of solids in the treatment process, has resulted in significant savings in waste generation and water use.
The site has achieved a 95% reduction in hazardous waste generation, 20% reduction in general waste to landfill and a 15% reduction in overall water use. This case study shows that through the application of innovative technology, improved environmental performance can also deliver significant cost savings.
CASE STUDY
FY15FY16Target
Females as % of New Hires
22%
30%
21%
Leadership Positions
Overall
34%
26%
During the financial year ended 30 June 2016, Orora implemented a range of both new and ongoing initiatives aimed at supporting its female team members and improving the gender diversity of its workforce including: • formal networking and mentoring opportunities with senior
leaders and Board members• Orora leadership and team member participation in industry
research programs by Melbourne Business School and University of South Australia
• continuing to leverage our position as a founding and ongoing corporate partner and sponsor of the National Association of Women in Operations (NAWO), including key board and committee appointments
• Orora Chairman Chris Roberts’ public commitment to female board members making up a minimum of 30% of Orora’s Board of Directors by 2018 in line with board diversity targets set by the Australian Institute of Company Directors (also known as The 30% Club). Although this target has already been met (currently 33%), this public commitment remains an important component of our Diversity Strategy
• team member events across Australia, New Zealand and North America celebrating International Women’s Day attended by approximately 500 female team members (an increase of almost 50% from 2015).
In the year ahead, Orora will continue to focus on improving gender diversity within the Company and report openly on its progress.
Further information on Orora’s diversity initiatives can be found in Orora’s Corporate Governance Statement at www.ororagroup.com/investor-relations/governance
Orora New Zealand Energy Efficiency ProgramFollowing the implementation of several successful energy efficiency initiatives in Australia, Orora has commenced implementing similar initiatives in New Zealand as part of our strategic partnership with the New Zealand Government’s Energy Efficiency Conservation Authority. At the sites where these initiatives have been completed, we have delivered a 26% saving in electricity and a 16% saving in gas and fuel oil usage.
Orora’s program was recognised at the New Zealand Energy Efficiency Awards as Winner (Large Business category) and Highly Commended (Overall Program).
Carbon Disclosure ProjectOrora voluntarily discloses information on climate change, water and forest risk through the Carbon Disclosure Project (CDP). The CDP provides information to investors, companies and governments regarding carbon-related issues and the preparedness of organisations to manage carbon impacts. CDP feedback on Orora’s first submission (2015) was positive. Orora performs well above the CDP supply chain average on the quality and completeness of our disclosures, particularly on risk and opportunity management.
Fostering gender diversity As a values-led organisation, Orora strives to ensure an inclusive and respectful environment for all team members. All decisions on hiring, salary, benefits, advancement, termination or retirement are based solely on each team member’s ability to do the job, regardless of cultural background, disability, gender, family responsibility, religious or political beliefs, age, sexual orientation or any other non-relevant demographic characteristic.
Gender diversity is essential to Orora’s continued success and a particular focus for the Company. During the reporting period, we made significant progress towards the diversity targets set during the financial year ended 30 June 2015.
Orora’s diversity targets state that by the financial year ending 30 June 2017, females will comprise 30% of new recruits in leadership positions and across the organisation as a whole. During the reporting period, the Company improved its gender outcomes for each major team member category and increased its overall female hiring rate by 20%.
ORORA LIMITED ANNUAL REPORT 2016 29
For
per
sona
l use
onl
y
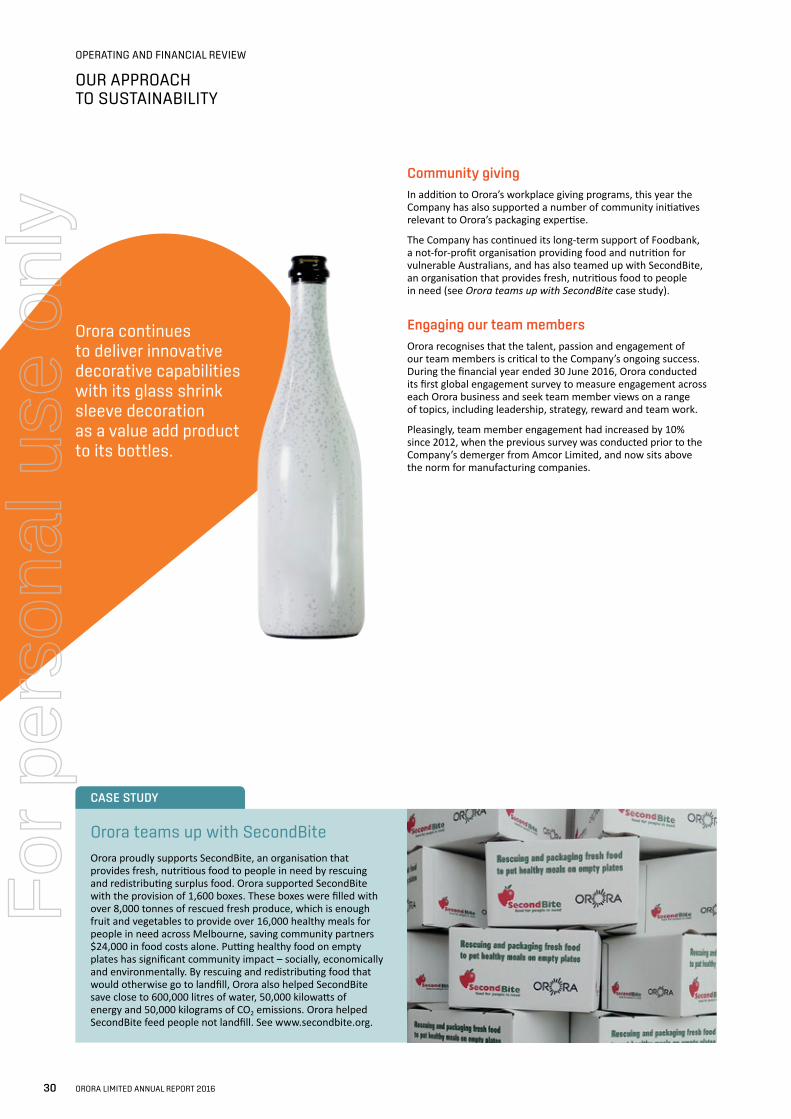
OPERATING AND FINANCIAL REVIEW
OUR APPROACH TO SUSTAINABILITY
Community givingIn addition to Orora’s workplace giving programs, this year the Company has also supported a number of community initiatives relevant to Orora’s packaging expertise.
The Company has continued its long-term support of Foodbank, a not-for-profit organisation providing food and nutrition for vulnerable Australians, and has also teamed up with SecondBite, an organisation that provides fresh, nutritious food to people in need (see Orora teams up with SecondBite case study).
Engaging our team membersOrora recognises that the talent, passion and engagement of our team members is critical to the Company’s ongoing success. During the financial year ended 30 June 2016, Orora conducted its first global engagement survey to measure engagement across each Orora business and seek team member views on a range of topics, including leadership, strategy, reward and team work.
Pleasingly, team member engagement had increased by 10% since 2012, when the previous survey was conducted prior to the Company’s demerger from Amcor Limited, and now sits above the norm for manufacturing companies.
Orora teams up with SecondBiteOrora proudly supports SecondBite, an organisation that provides fresh, nutritious food to people in need by rescuing and redistributing surplus food. Orora supported SecondBite with the provision of 1,600 boxes. These boxes were filled with over 8,000 tonnes of rescued fresh produce, which is enough fruit and vegetables to provide over 16,000 healthy meals for people in need across Melbourne, saving community partners $24,000 in food costs alone. Putting healthy food on empty plates has significant community impact – socially, economically and environmentally. By rescuing and redistributing food that would otherwise go to landfill, Orora also helped SecondBite save close to 600,000 litres of water, 50,000 kilowatts of energy and 50,000 kilograms of CO2 emissions. Orora helped SecondBite feed people not landfill. See www.secondbite.org.
CASE STUDY
Orora continues to deliver innovative decorative capabilities with its glass shrink sleeve decoration as a value add product to its bottles.
30 ORORA LIMITED ANNUAL REPORT 2016
For
per
sona
l use
onl
y
PRINCIPAL RISKS
Orora actively manages a range of principal risks and uncertainties with the potential to have a material impact on the Orora Group and its ability to achieve its stated objectives. While every effort is made to identify and manage material risks, additional risks not currently known or detailed below may also adversely affect future performance.Orora’s principal risks are outlined below in no particular order.*
Risk Description Mitigation Strategies
Economic Conditions
Orora is susceptible to major changes in macro-economic conditions in a single country, region or market. Sudden and/or prolonged deterioration in the economy may impact the value chain or industries on which Orora is dependent and could have a material negative impact on financial performance.
Orora seeks to mitigate the severity of impact that deterioration in macro-economic conditions in a single country, region or market may have by:• operating businesses that have a broad spread
of geographic locations, raw material inputs and customers servicing a number of end markets
• deploying an operating model that focuses on continually improving the value proposition to customers
• creating and maintaining a high-performance culture• remaining disciplined in cash and cost management• continuing to invest in manufacturing capabilities
to improve cost positions.
Country and Regulatory Risk
Orora predominantly operates in Australia, New Zealand and the United States. Orora also operates in other jurisdictions across a broad range of legal, accounting, tax, regulatory and political systems, some of which are subject to rapid change. The profitability of those operations may be adversely impacted by changes in the fiscal or regulatory regimes, difficulties in interpreting or complying with the local laws of those countries and reversal of current political, judicial or administrative policies. Orora’s customers, many of which operate across a broad range of countries, are subject to regulatory risk in various jurisdictions, which may have an impact on their operations and consequently Orora’s operations.
Orora continually monitors changes or proposed changes in regulatory regimes that may have an impact on Orora and, where appropriate, engages consultants and advisors to address specific issues. Where possible, Orora appoints local management teams that bring a strong understanding of the local operating environment and strong customer relationships. Orora also has a global compliance training program across the Orora Group and its business leaders regularly review country risk.
Customer Orora has strong relationships with key customers for the supply of packaging products and associated packaging-related services. These relationships are fundamental to Orora’s success, and the loss of key customers may have a negative impact on financial performance.
Orora seeks to mitigate this risk by delivering a superior value proposition to its customers by leveraging its operating model. Key to the success of this strategy is a continued drive on customer focus (delivery in full, on time and within specification), low cost and innovation. In addition, no single customer within an operating segment generates revenue greater than 10% of total revenue for the Orora Group.
Consumer Preferences
Changes in consumer preferences may result in some of Orora’s existing product range becoming obsolete or new products not meeting sales and margin expectations. Orora may not be able to accurately predict demand, end-user preferences and evolving industry standards, and this may result in the inability to meet consumer demand in a timely and cost effective manner.
Orora works closely with its customers and suppliers to propose solutions that address evolving consumer preferences. Orora also continues to build on its innovation capability to achieve the objective of being the innovation leader for the packaging industry.
Competition Orora operates in highly competitive markets with varying barriers to entry, industry structures and competitor motivational patterns. The actions of established or potential competitors may have a negative impact on financial performance.
Orora is ideally placed to leverage both its regional experience and insight, and its international footprint and scale to deliver new ideas and value propositions to customers to gain competitive advantage. Orora also recognises innovation as a source of competitive advantage.
* Environmental and social sustainability risks that are not considered material are referred to in the ‘Sustainability’ section of this Annual Report.
ORORA LIMITED ANNUAL REPORT 2016 31
For
per
sona
l use
onl
y
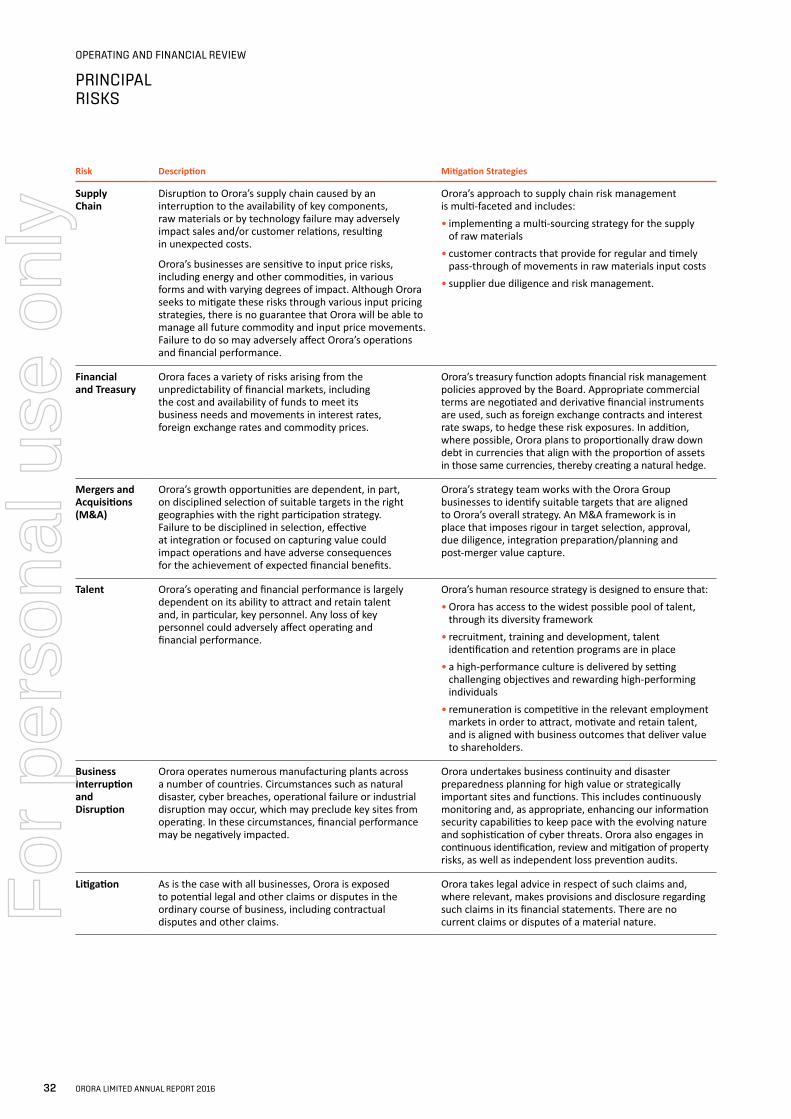
OPERATING AND FINANCIAL REVIEW
Risk Description Mitigation Strategies
Supply Chain
Disruption to Orora’s supply chain caused by an interruption to the availability of key components, raw materials or by technology failure may adversely impact sales and/or customer relations, resulting in unexpected costs.
Orora’s businesses are sensitive to input price risks, including energy and other commodities, in various forms and with varying degrees of impact. Although Orora seeks to mitigate these risks through various input pricing strategies, there is no guarantee that Orora will be able to manage all future commodity and input price movements. Failure to do so may adversely affect Orora’s operations and financial performance.
Orora’s approach to supply chain risk management is multi-faceted and includes:• implementing a multi-sourcing strategy for the supply
of raw materials• customer contracts that provide for regular and timely
pass-through of movements in raw materials input costs• supplier due diligence and risk management.
Financial and Treasury
Orora faces a variety of risks arising from the unpredictability of financial markets, including the cost and availability of funds to meet its business needs and movements in interest rates, foreign exchange rates and commodity prices.
Orora’s treasury function adopts financial risk management policies approved by the Board. Appropriate commercial terms are negotiated and derivative financial instruments are used, such as foreign exchange contracts and interest rate swaps, to hedge these risk exposures. In addition, where possible, Orora plans to proportionally draw down debt in currencies that align with the proportion of assets in those same currencies, thereby creating a natural hedge.
Mergers and Acquisitions (M&A)
Orora’s growth opportunities are dependent, in part, on disciplined selection of suitable targets in the right geographies with the right participation strategy. Failure to be disciplined in selection, effective at integration or focused on capturing value could impact operations and have adverse consequences for the achievement of expected financial benefits.
Orora’s strategy team works with the Orora Group businesses to identify suitable targets that are aligned to Orora’s overall strategy. An M&A framework is in place that imposes rigour in target selection, approval, due diligence, integration preparation/planning and post-merger value capture.
Talent Orora’s operating and financial performance is largely dependent on its ability to attract and retain talent and, in particular, key personnel. Any loss of key personnel could adversely affect operating and financial performance.
Orora’s human resource strategy is designed to ensure that:• Orora has access to the widest possible pool of talent,
through its diversity framework• recruitment, training and development, talent
identification and retention programs are in place• a high-performance culture is delivered by setting
challenging objectives and rewarding high-performing individuals
• remuneration is competitive in the relevant employment markets in order to attract, motivate and retain talent, and is aligned with business outcomes that deliver value to shareholders.
Business Interruption and Disruption
Orora operates numerous manufacturing plants across a number of countries. Circumstances such as natural disaster, cyber breaches, operational failure or industrial disruption may occur, which may preclude key sites from operating. In these circumstances, financial performance may be negatively impacted.
Orora undertakes business continuity and disaster preparedness planning for high value or strategically important sites and functions. This includes continuously monitoring and, as appropriate, enhancing our information security capabilities to keep pace with the evolving nature and sophistication of cyber threats. Orora also engages in continuous identification, review and mitigation of property risks, as well as independent loss prevention audits.
Litigation As is the case with all businesses, Orora is exposed to potential legal and other claims or disputes in the ordinary course of business, including contractual disputes and other claims.
Orora takes legal advice in respect of such claims and, where relevant, makes provisions and disclosure regarding such claims in its financial statements. There are no current claims or disputes of a material nature.
PRINCIPAL RISKS
32 ORORA LIMITED ANNUAL REPORT 2016
For
per
sona
l use
onl
y
DIRECTORS’ REPORT
IN THIS SECTION
Statutory Matters 34Board of Directors 34Company Secretary 34Directors’ meetings 34Operating and financial review 34State of affairs 34Principal activities 34Events subsequent to the end of the financial year 35Likely developments 35Dividends 35Environmental performance and reporting 35Directors’ interests 36Unissued shares under option 36Shares issued on exercise of options 36On-market share purchases to satisfy employee share plans 36Indemnification and insurance of officers 36Indemnification of auditors 37Proceedings on behalf of the Company 37Non-audit services 37Rounding off 37Loans to Directors and senior executives 37Corporate Governance Statement 37
Remuneration Report 38Auditor’s Independence Declaration 53
IN THIS SECTION
The Directors of Orora Limited (‘the Company’) present their report, together with the Financial Statements of the Company and its controlled entities (collectively referred to as ‘the consolidated entity’ or the ‘Orora Group’), for the year ended 30 June 2016
ORORA LIMITED ANNUAL REPORT 2016 33
For
per
sona
l use
onl
y
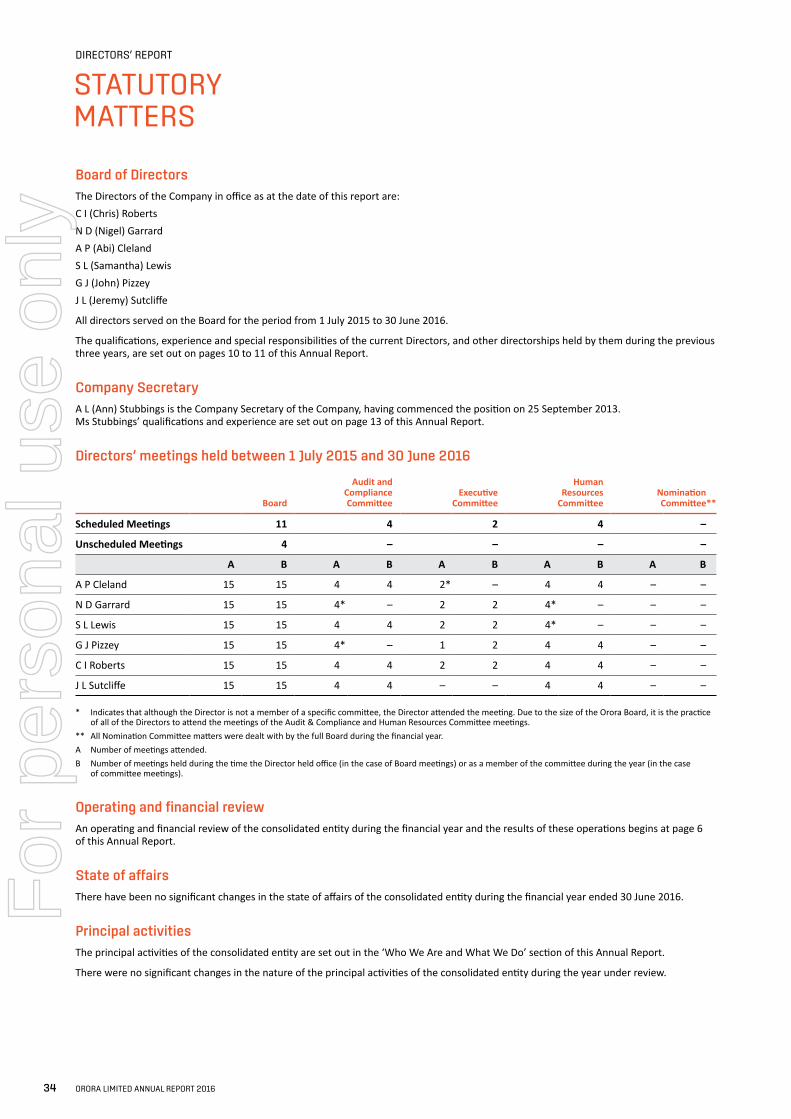
DIRECTORS’ REPORT
STATUTORY MATTERS
Board of DirectorsThe Directors of the Company in office as at the date of this report are:C I (Chris) RobertsN D (Nigel) GarrardA P (Abi) ClelandS L (Samantha) LewisG J (John) PizzeyJ L (Jeremy) Sutcliffe
All directors served on the Board for the period from 1 July 2015 to 30 June 2016.
The qualifications, experience and special responsibilities of the current Directors, and other directorships held by them during the previous three years, are set out on pages 10 to 11 of this Annual Report.
Company SecretaryA L (Ann) Stubbings is the Company Secretary of the Company, having commenced the position on 25 September 2013. Ms Stubbings’ qualifications and experience are set out on page 13 of this Annual Report.
Directors’ meetings held between 1 July 2015 and 30 June 2016
Board
Audit and Compliance Committee
Executive Committee
Human Resources
CommitteeNomination Committee**
Scheduled Meetings 11 4 2 4 –
Unscheduled Meetings 4 – – – –
A B A B A B A B A B
A P Cleland 15 15 4 4 2* – 4 4 – –
N D Garrard 15 15 4* – 2 2 4* – – –
S L Lewis 15 15 4 4 2 2 4* – – –
G J Pizzey 15 15 4* – 1 2 4 4 – –
C I Roberts 15 15 4 4 2 2 4 4 – –
J L Sutcliffe 15 15 4 4 – – 4 4 – –
* Indicates that although the Director is not a member of a specific committee, the Director attended the meeting. Due to the size of the Orora Board, it is the practice of all of the Directors to attend the meetings of the Audit & Compliance and Human Resources Committee meetings.
** All Nomination Committee matters were dealt with by the full Board during the financial year.A Number of meetings attended.B Number of meetings held during the time the Director held office (in the case of Board meetings) or as a member of the committee during the year (in the case
of committee meetings).
Operating and financial reviewAn operating and financial review of the consolidated entity during the financial year and the results of these operations begins at page 6 of this Annual Report.
State of affairsThere have been no significant changes in the state of affairs of the consolidated entity during the financial year ended 30 June 2016.
Principal activitiesThe principal activities of the consolidated entity are set out in the ‘Who We Are and What We Do’ section of this Annual Report.
There were no significant changes in the nature of the principal activities of the consolidated entity during the year under review.
34 ORORA LIMITED ANNUAL REPORT 2016
For
per
sona
l use
onl
y
Events subsequent to the end of the financial yearThere have been no matters or circumstances which have arisen between 30 June 2016 and the date of this report that have significantly affected, or may significantly affect, the operations of the Group, the results of those operations, or the state of affairs of the Group in future financial years.
Likely developmentsThe Operating and Financial Review section of this Annual Report contains information on the consolidated entity’s business strategies and prospects for future financial years, and refers to likely developments in the consolidated entity’s operations and the expected results of these operations in future financial years. Information on likely developments in the consolidated entity’s business strategies, prospects and operations for future financial years and the expected results of those operations has not been included in this report where the Directors believe it would likely result in unreasonable prejudice to the consolidated entity. Details that could give rise to material detriment to the consolidated entity; for example, information that is commercially sensitive, confidential or could give a third party a commercial advantage, have also not been included.
DividendsDividends paid or declared by the Company to members during the financial year ended 30 June 2016 are set out in the notes to the Financial Statements.
On 16 February and 15 August 2016, the Board authorised management to issue a request to the Trustee of the Orora Employee Share Trust to waive the entitlement of Treasury Shares held in the Trust to be paid the 2016 interim and final dividends. Refer to note 6.3 of the Financial Statements.
Environmental performance and reportingThe Orora Group is committed to continuous improvement of its environmental performance by finding better ways to manufacture and distribute its products. This is guided by the Orora Group’s Environmental Policy, a copy of which is available on the Orora Group’s website.
(a) Carbon emissions
The National Greenhouse and Energy Reporting (Safeguard Mechanism) Rule 2015 (“Rule”) made under the National Greenhouse and Energy Reporting Act 2007 (Cth) (“NGER Act”) applies to facilities with direct CO2 emissions (scope 1) of greater than 100,000 tonnes per year. These facilities are required to maintain their direct emissions below their historical peak level. Facilities that exceed their historical peak CO2 emissions will be required to purchase CO2 credits to offset their increase in emissions.
The only Orora Group facility that exceeds the 100,000 tonnes per year CO2 threshold is the glass facility in Gawler, South Australia. This facility will comply with its obligations under this Rule.
(b) Greenhouse gas requirements
In Australia, the Orora Group is subject to reporting obligations under the NGER Act.
The NGER Act requires the Company to report on its annual Australian greenhouse gas emissions and energy use. The Orora Group has data gathering and management systems in place that comply with the NGER Act and the Clean Energy Regulator’s audit processes.
(c) Manufacturing
All of the Orora Group’s manufacturing sites are subject to significant environmental regulation, including, where applicable, specific environmental licences. These licences require discharges to air, land and water to be below specified levels of contamination.
Compliance with these regulations and the Orora Group’s overall environmental performance is monitored by the Sustainability Team, which liaises directly with divisional and site-based health, safety and environment professionals. The Orora Group’s environmental performance and regulatory compliance is also discussed regularly at Executive Leadership Team meetings.
The Directors are not aware of any material breaches of environmental regulations or site-specific licences during or since the financial year ended 30 June 2016.
ORORA LIMITED ANNUAL REPORT 2016 35
For
per
sona
l use
onl
y
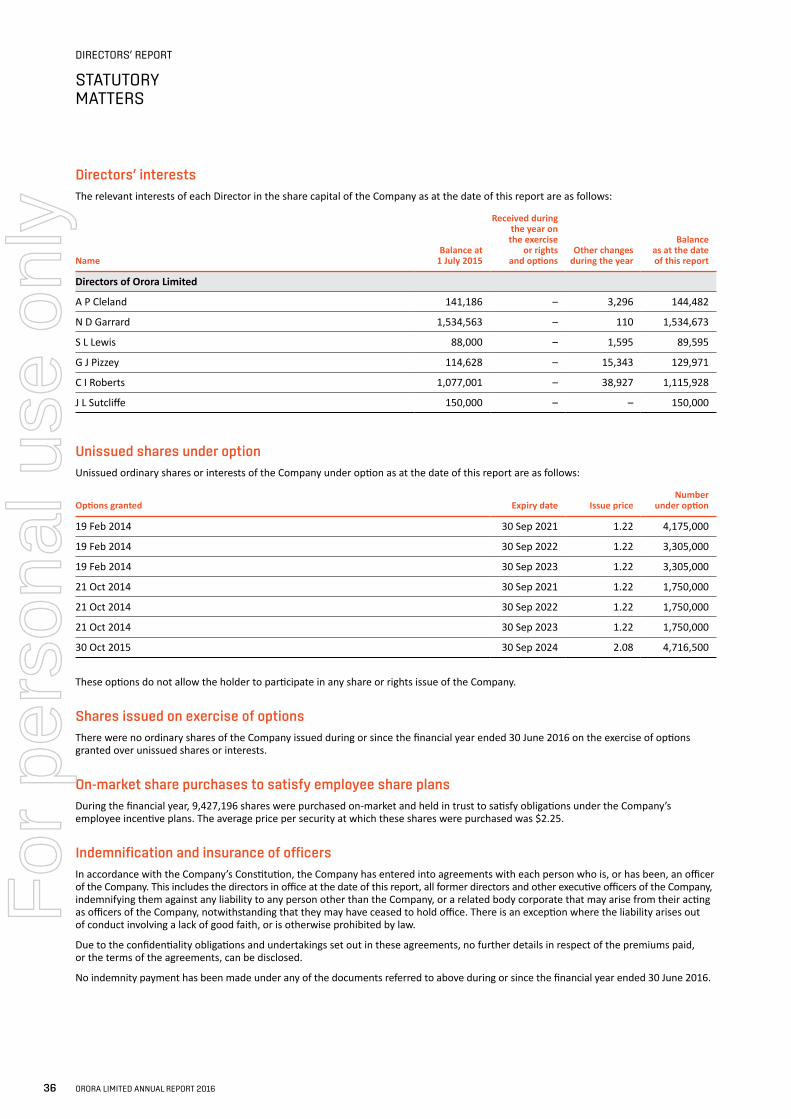
DIRECTORS’ REPORT
Directors’ interestsThe relevant interests of each Director in the share capital of the Company as at the date of this report are as follows:
NameBalance at
1 July 2015
Received during the year on the exercise
or rights and options
Other changes during the year
Balance as at the date of this report
Directors of Orora Limited
A P Cleland 141,186 – 3,296 144,482
N D Garrard 1,534,563 – 110 1,534,673
S L Lewis 88,000 – 1,595 89,595
G J Pizzey 114,628 – 15,343 129,971
C I Roberts 1,077,001 – 38,927 1,115,928
J L Sutcliffe 150,000 – – 150,000
Unissued shares under optionUnissued ordinary shares or interests of the Company under option as at the date of this report are as follows:
Options granted Expiry date Issue priceNumber
under option
19 Feb 2014 30 Sep 2021 1.22 4,175,000
19 Feb 2014 30 Sep 2022 1.22 3,305,000
19 Feb 2014 30 Sep 2023 1.22 3,305,000
21 Oct 2014 30 Sep 2021 1.22 1,750,000
21 Oct 2014 30 Sep 2022 1.22 1,750,000
21 Oct 2014 30 Sep 2023 1.22 1,750,000
30 Oct 2015 30 Sep 2024 2.08 4,716,500
These options do not allow the holder to participate in any share or rights issue of the Company.
Shares issued on exercise of optionsThere were no ordinary shares of the Company issued during or since the financial year ended 30 June 2016 on the exercise of options granted over unissued shares or interests.
On-market share purchases to satisfy employee share plansDuring the financial year, 9,427,196 shares were purchased on-market and held in trust to satisfy obligations under the Company’s employee incentive plans. The average price per security at which these shares were purchased was $2.25.
Indemnification and insurance of officersIn accordance with the Company’s Constitution, the Company has entered into agreements with each person who is, or has been, an officer of the Company. This includes the directors in office at the date of this report, all former directors and other executive officers of the Company, indemnifying them against any liability to any person other than the Company, or a related body corporate that may arise from their acting as officers of the Company, notwithstanding that they may have ceased to hold office. There is an exception where the liability arises out of conduct involving a lack of good faith, or is otherwise prohibited by law.
Due to the confidentiality obligations and undertakings set out in these agreements, no further details in respect of the premiums paid, or the terms of the agreements, can be disclosed.
No indemnity payment has been made under any of the documents referred to above during or since the financial year ended 30 June 2016.
STATUTORY MATTERS
36 ORORA LIMITED ANNUAL REPORT 2016
For
per
sona
l use
onl
y
Indemnification of auditorsThe Company’s auditor is PricewaterhouseCoopers (PwC). During and since the financial year ended 30 June 2016:• no premium has been paid by the Company in respect of any insurance for PwC• no indemnity has been paid by the Company in respect of PwC’s appointment as auditor• no officers of the Company were partners or directors of PwC, while PwC undertook an audit of the Company.
Proceedings on behalf of the CompanyNo proceedings have been brought or intervened in on behalf of the Company with leave of the Court, nor has any application for leave been made in respect of the Company, under section 237 of the Corporations Act 2001.
Non-audit servicesDuring the year, PwC, the Company’s auditor, performed certain other services in addition to their statutory duties. The Board has considered the non-audit services provided during the financial year by the auditor and, in accordance with written advice provided by resolution of the Audit & Compliance Committee, is satisfied that the provision of those non-audit services during the financial year by the auditors is compatible with the general standard of independence for auditors, and did not compromise, the auditor independence requirements of the Corporations Act 2001 for the following reasons:• All non-audit services were subject to the corporate governance procedures adopted by the Company and have been reviewed
by the Audit & Compliance Committee to ensure they do not impact the impartiality and objectivity of the auditor. In particular, all non-audit services are approved in accordance with the non-audit services delegations and approvals framework and reported to the Audit & Compliance Committee at each meeting.
• The non-audit services provided do not undermine the general principles relating to auditor independence as set out in APES 110 Code of Ethics for Professional Accountants, as they did not involve reviewing or auditing the auditor’s own work, acting in a management or decision-making capacity for the Company, acting as an advocate for the Company or jointly sharing risks and rewards. A copy of the auditor’s independence declaration as required under Section 307C of the Corporations Act 2001 can be found at the end of Remuneration Report within the Directors’ Report.
Details of the amounts paid to PwC and its related practices for audit and non-audit services provided during the financial year are set out in note 7.2 to the Financial Statements. In each case, the engagement of PwC was made on its merits (based on service level, expertise, cost, as well as geographical spread).
Rounding offThe Company is of a kind referred to in the Australian Investments and Securities Commission Instrument 2016/191. In accordance with the ASIC Corporations (Rounding in Financial/Directors’ Reports) Instrument 2016/191, and except where otherwise stated, amounts in the Financial Statements and Directors’ Report have been rounded off to the nearest $100,000 or to zero where the amount is $50,000 or less.
Loans to Directors and senior executivesThere are no loans to Directors or senior executives to report.
Corporate Governance StatementThe key features of the Company’s corporate governance framework are set out in the Corporate Governance Statement, which is available at: www.ororagroup.com/investor-relations/governance.
ORORA LIMITED ANNUAL REPORT 2016 37
For
per
sona
l use
onl
y
DIRECTORS’ REPORT
Prior to FY16, the fixed remuneration for Orora’s Other Executive KMP was split between base salary and other fixed remuneration (OFR). Both short-term and long-term incentives were calculated as a percentage of the base salary only. The move to TFR would have resulted in an uplift in the total remuneration package, therefore it was decided to recalibrate the potential outcome by reducing the target short-term incentive opportunity from 52.5% of base salary to 50% of TFR for Other Executive KMP.
The Board recognised this approach to be consistent with market practice for comparable organisations to Orora, and appropriate for Orora’s Other Executive KMP. This also aligns their structure to that of the Managing Director and Chief Executive Officer, whose remuneration structure did not change during the period.
No other changes were made to Orora’s approach to remuneration during the financial year ended 30 June 2016.
Role of the Human Resources CommitteeAs Chair of the Human Resources Committee, it is my role, together with my fellow Committee members, to ensure that Orora’s Senior Executives are motivated and incentivised to develop and successfully execute against a long-term strategy that grows the business and generates shareholder returns. The Committee is confident the remuneration structure in place for Orora’s Senior Executives provides the appropriate level and mix of both fixed remuneration and short and long-term incentives to do so.
Successful execution against Orora’s strategy also relies on the quality and engagement of all Orora team members. As such, the Human Resources Committee is accountable for ensuring that all aspects of Orora’s talent management program appeal to, attract and retain the best possible talent and develop that talent as a key differentiator for the Company.
The Committee is confident that Orora’s management team has developed and adopted an appropriate talent, development and diversity agenda that focuses on growing Orora’s bench strength, identifying and accelerating the progression of high potential team members, enhancing diversity and developing the core capabilities of Orora’s people.
It has been my pleasure to serve on the Board of Orora Limited and Chair the Human Resources Committee during the financial year ended 30 June 2016. I am proud to be part of a company that is investing for future growth, and am excited to be part of this continuing story in the year ahead.
JOHN PIZZEY Chair, Human Resources Committee
REMUNERATION REPORT
Dear Fellow Shareholder,
On behalf of the Board, I am pleased to present Orora’s Remuneration Report for the financial year ended 30 June 2016.
Strong company performanceOrora’s management team has continued its focus on outperformance throughout the year, driving value for shareholders. This was achieved by capitalising on growth opportunities, investing for innovation and maintaining financial discipline through self-help programs. In addition, a compelling source of competitive advantage for Orora is its team members, who have played a key role in shaping Orora’s culture and developing The Orora Way – its belief statement, company values and outperformance deliverables that set it apart.
Over the period, Orora has again delivered a solid set of financial and non-financial results, including a 24.6% increase in earnings before interest & tax (EBIT) to $280.5 million. This translates, from a compound annual growth rate (CAGR) perspective, to a 24% increase every year since the pro forma 30 June 2013 result achieved shortly prior to Orora’s establishment in December 2013.
This Company performance is reflected in the short-term incentive (STI) payments for the executive key management personnel (Executive KMP), which were paid out between 73.5% – 81.8% of their maximum STI opportunity. Although, this reflects a number of financial and non-financial metrics (at a group and individual level), this STI result was primarily driven by the achievement of earnings per share (EPS) at 14.1 cents (up 29.4% from FY15).
Improving value for shareholdersOne of the key objectives of Orora’s remuneration strategy is to drive long-term value for shareholders. Orora’s incentive plans achieve this by aligning challenging and relevant performance metrics with competitive and appropriate executive reward.
The Orora management team has delivered on its promise to shareholders, and consistently delivered this value with a cumulative total shareholder return (TSR) of 148.1% since listing in December 2013. In the financial year ended 30 June 2016, TSR was 36.1%.
Remuneration changes during the financial yearOrora regularly reviews its approach to executive remuneration to ensure it remains relevant, competitive, and appropriate in the context of changing business and economic environments.
During the financial year, the Board approved a change in the remuneration structure for Orora’s Other Executive KMP (excludes the Managing Director and Chief Executive Officer) to align them to a total fixed remuneration (TFR) approach.
I am proud to be part of a company that is investing for future growth, and am excited to be part of this continuing story in the year ahead.
38 ORORA LIMITED ANNUAL REPORT 2016
For
per
sona
l use
onl
y
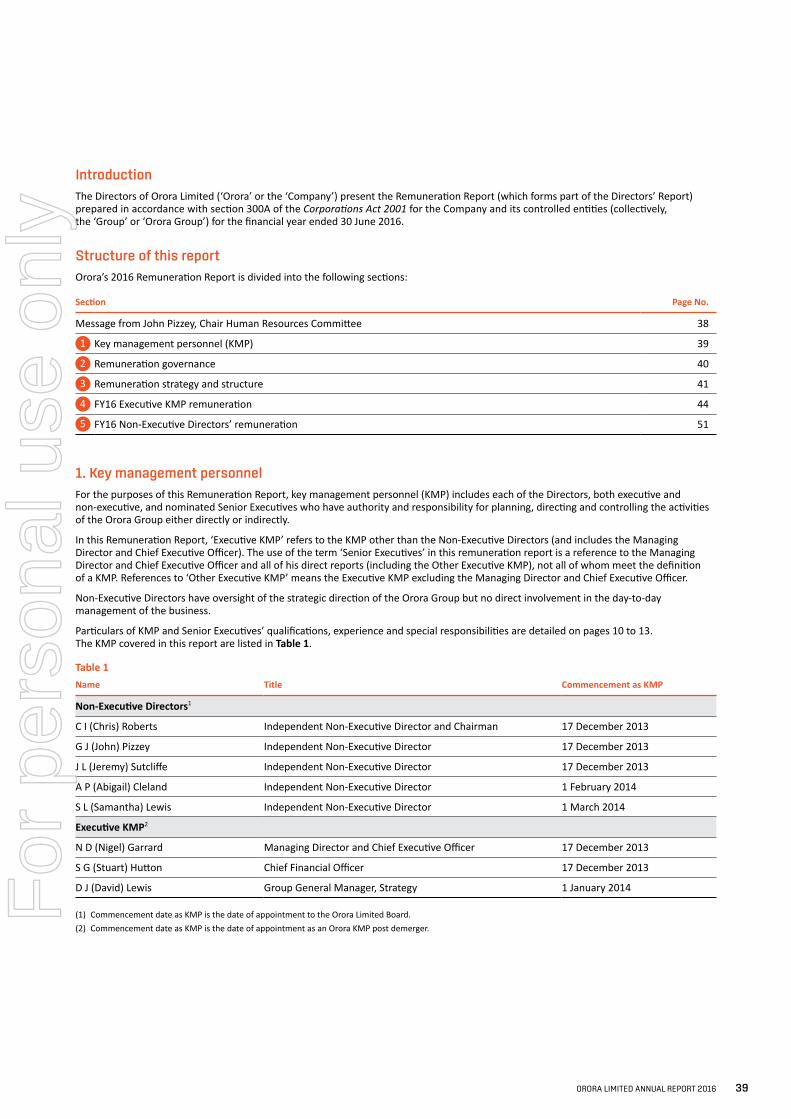
IntroductionThe Directors of Orora Limited (‘Orora’ or the ‘Company’) present the Remuneration Report (which forms part of the Directors’ Report) prepared in accordance with section 300A of the Corporations Act 2001 for the Company and its controlled entities (collectively, the ‘Group’ or ‘Orora Group’) for the financial year ended 30 June 2016.
Structure of this reportOrora’s 2016 Remuneration Report is divided into the following sections:
Section Page No.
Message from John Pizzey, Chair Human Resources Committee 38
1 Key management personnel (KMP) 39
2 Remuneration governance 40
3 Remuneration strategy and structure 41
4 FY16 Executive KMP remuneration 44
5 FY16 Non-Executive Directors’ remuneration 51
1. Key management personnelFor the purposes of this Remuneration Report, key management personnel (KMP) includes each of the Directors, both executive and non-executive, and nominated Senior Executives who have authority and responsibility for planning, directing and controlling the activities of the Orora Group either directly or indirectly.
In this Remuneration Report, ‘Executive KMP’ refers to the KMP other than the Non-Executive Directors (and includes the Managing Director and Chief Executive Officer). The use of the term ‘Senior Executives’ in this remuneration report is a reference to the Managing Director and Chief Executive Officer and all of his direct reports (including the Other Executive KMP), not all of whom meet the definition of a KMP. References to ‘Other Executive KMP’ means the Executive KMP excluding the Managing Director and Chief Executive Officer.
Non-Executive Directors have oversight of the strategic direction of the Orora Group but no direct involvement in the day-to-day management of the business.
Particulars of KMP and Senior Executives’ qualifications, experience and special responsibilities are detailed on pages 10 to 13. The KMP covered in this report are listed in Table 1.
Table 1Name Title Commencement as KMP
Non-Executive Directors1
C I (Chris) Roberts Independent Non-Executive Director and Chairman 17 December 2013
G J (John) Pizzey Independent Non-Executive Director 17 December 2013
J L (Jeremy) Sutcliffe Independent Non-Executive Director 17 December 2013
A P (Abigail) Cleland Independent Non-Executive Director 1 February 2014
S L (Samantha) Lewis Independent Non-Executive Director 1 March 2014
Executive KMP2
N D (Nigel) Garrard Managing Director and Chief Executive Officer 17 December 2013
S G (Stuart) Hutton Chief Financial Officer 17 December 2013
D J (David) Lewis Group General Manager, Strategy 1 January 2014
(1) Commencement date as KMP is the date of appointment to the Orora Limited Board.(2) Commencement date as KMP is the date of appointment as an Orora KMP post demerger.
ORORA LIMITED ANNUAL REPORT 2016 39
For
per
sona
l use
onl
y
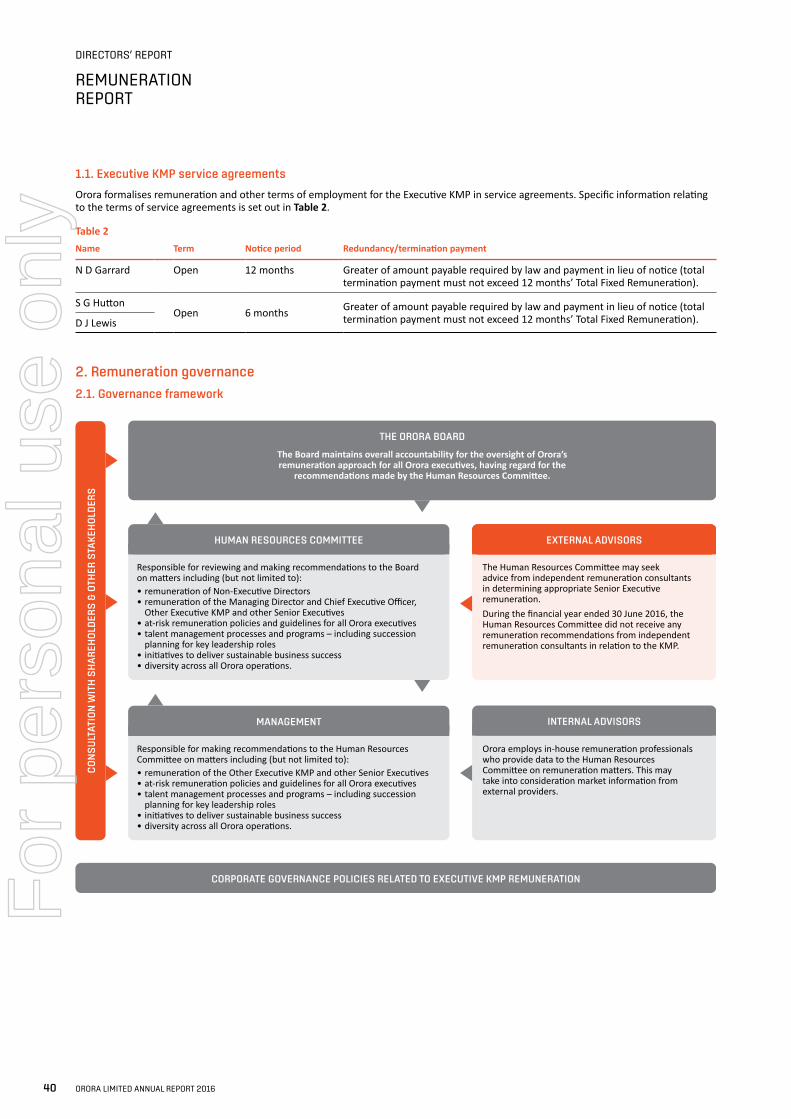
DIRECTORS’ REPORT
REMUNERATION REPORT
1.1. Executive KMP service agreements
Orora formalises remuneration and other terms of employment for the Executive KMP in service agreements. Specific information relating to the terms of service agreements is set out in Table 2.
Table 2Name Term Notice period Redundancy/termination payment
N D Garrard Open 12 months Greater of amount payable required by law and payment in lieu of notice (total termination payment must not exceed 12 months’ Total Fixed Remuneration).
S G HuttonOpen 6 months Greater of amount payable required by law and payment in lieu of notice (total
termination payment must not exceed 12 months’ Total Fixed Remuneration).D J Lewis
2. Remuneration governance
2.1. Governance framework
CO
NS
ULT
ATIO
N W
ITH
SH
AR
EHO
LDER
S &
OTH
ER S
TAK
EHO
LDER
S
HUMAN RESOURCES COMMITTEE
INTERNAL ADVISORS
The Human Resources Committee may seek advice from independent remuneration consultants in determining appropriate Senior Executive remuneration. During the financial year ended 30 June 2016, the Human Resources Committee did not receive any remuneration recommendations from independent remuneration consultants in relation to the KMP.
Orora employs in-house remuneration professionals who provide data to the Human Resources Committee on remuneration matters. This may take into consideration market information from external providers.
Responsible for reviewing and making recommendations to the Board on matters including (but not limited to):• remuneration of Non-Executive Directors• remuneration of the Managing Director and Chief Executive Officer, Other Executive KMP and other Senior Executives• at-risk remuneration policies and guidelines for all Orora executives• talent management processes and programs – including succession planning for key leadership roles• initiatives to deliver sustainable business success• diversity across all Orora operations.
The Board maintains overall accountability for the oversight of Orora’s remuneration approach for all Orora executives, having regard for the
recommendations made by the Human Resources Committee.
Responsible for making recommendations to the Human Resources Committee on matters including (but not limited to):• remuneration of the Other Executive KMP and other Senior Executives• at-risk remuneration policies and guidelines for all Orora executives• talent management processes and programs – including succession planning for key leadership roles• initiatives to deliver sustainable business success• diversity across all Orora operations.
MANAGEMENT
THE ORORA BOARD
CORPORATE GOVERNANCE POLICIES RELATED TO EXECUTIVE KMP REMUNERATION
EXTERNAL ADVISORS
40 ORORA LIMITED ANNUAL REPORT 2016
For
per
sona
l use
onl
y
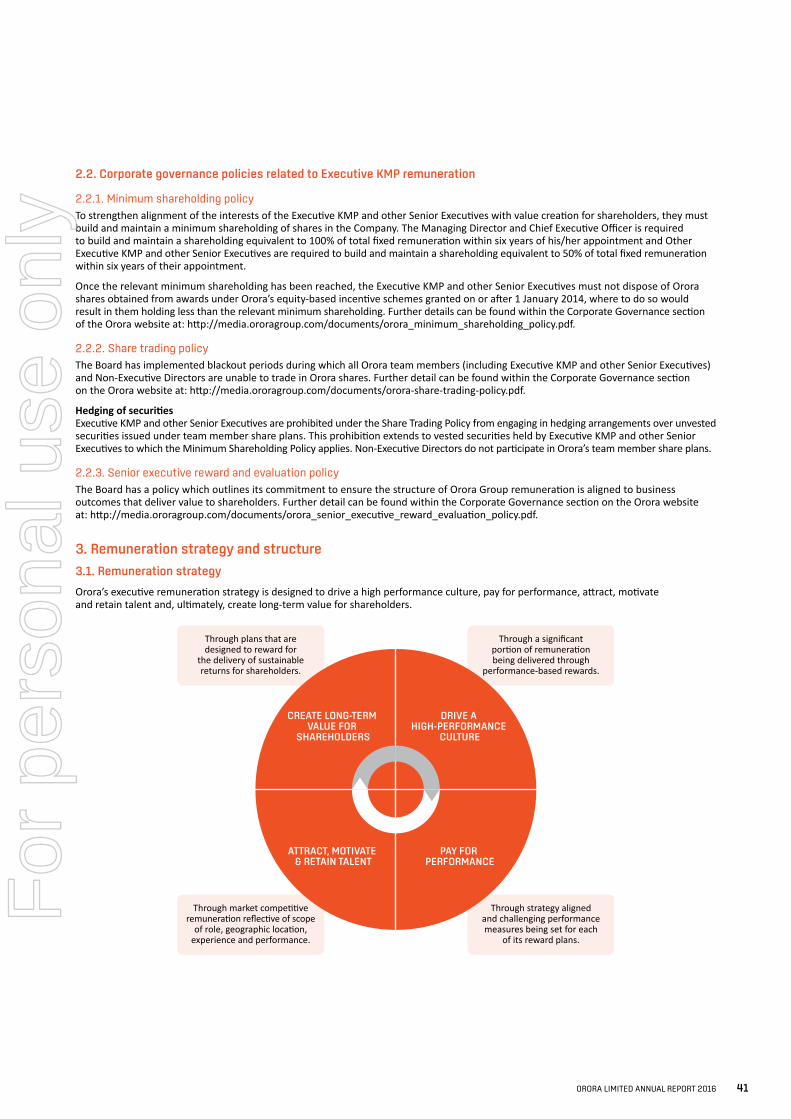
2.2. Corporate governance policies related to Executive KMP remuneration
2.2.1. Minimum shareholding policyTo strengthen alignment of the interests of the Executive KMP and other Senior Executives with value creation for shareholders, they must build and maintain a minimum shareholding of shares in the Company. The Managing Director and Chief Executive Officer is required to build and maintain a shareholding equivalent to 100% of total fixed remuneration within six years of his/her appointment and Other Executive KMP and other Senior Executives are required to build and maintain a shareholding equivalent to 50% of total fixed remuneration within six years of their appointment.
Once the relevant minimum shareholding has been reached, the Executive KMP and other Senior Executives must not dispose of Orora shares obtained from awards under Orora’s equity-based incentive schemes granted on or after 1 January 2014, where to do so would result in them holding less than the relevant minimum shareholding. Further details can be found within the Corporate Governance section of the Orora website at: http://media.ororagroup.com/documents/orora_minimum_shareholding_policy.pdf.
2.2.2. Share trading policyThe Board has implemented blackout periods during which all Orora team members (including Executive KMP and other Senior Executives) and Non-Executive Directors are unable to trade in Orora shares. Further detail can be found within the Corporate Governance section on the Orora website at: http://media.ororagroup.com/documents/orora-share-trading-policy.pdf.
Hedging of securitiesExecutive KMP and other Senior Executives are prohibited under the Share Trading Policy from engaging in hedging arrangements over unvested securities issued under team member share plans. This prohibition extends to vested securities held by Executive KMP and other Senior Executives to which the Minimum Shareholding Policy applies. Non-Executive Directors do not participate in Orora’s team member share plans.
2.2.3. Senior executive reward and evaluation policyThe Board has a policy which outlines its commitment to ensure the structure of Orora Group remuneration is aligned to business outcomes that deliver value to shareholders. Further detail can be found within the Corporate Governance section on the Orora website at: http://media.ororagroup.com/documents/orora_senior_executive_reward_evaluation_policy.pdf.
3. Remuneration strategy and structure
3.1. Remuneration strategy
Orora’s executive remuneration strategy is designed to drive a high performance culture, pay for performance, attract, motivate and retain talent and, ultimately, create long-term value for shareholders.
Through market competitive remuneration reflective of scope
of role, geographic location, experience and performance.
Through a significant portion of remuneration being delivered through
performance-based rewards.
Through plans that are designed to reward for
the delivery of sustainable returns for shareholders.
Through strategy aligned and challenging performance measures being set for each
of its reward plans.
CREATE LONG-TERM VALUE FOR
SHAREHOLDERS
DRIVE A HIGH-PERFORMANCE
CULTURE
ATTRACT, MOTIVATE & RETAIN TALENT
PAY FOR PERFORMANCE
ORORA LIMITED ANNUAL REPORT 2016 41
For
per
sona
l use
onl
y
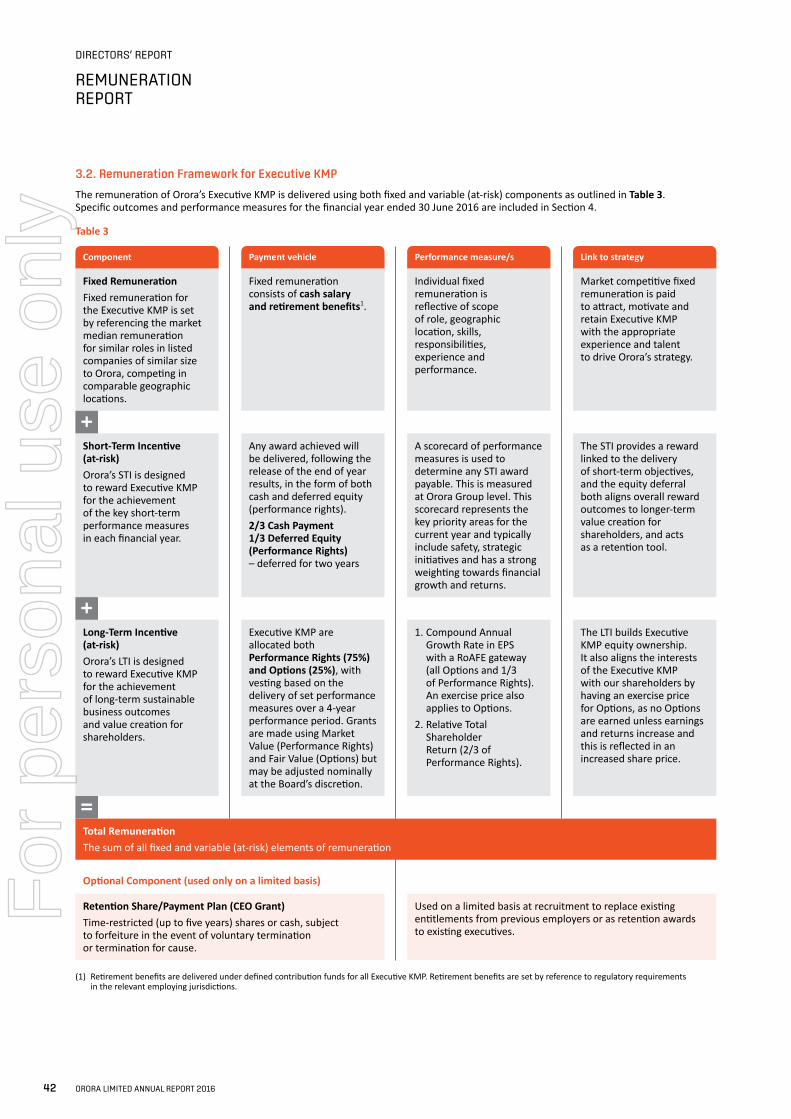
DIRECTORS’ REPORT
REMUNERATION REPORT
3.2. Remuneration Framework for Executive KMP
The remuneration of Orora’s Executive KMP is delivered using both fixed and variable (at-risk) components as outlined in Table 3. Specific outcomes and performance measures for the financial year ended 30 June 2016 are included in Section 4.
Table 3
Component Payment vehicle Performance measure/s Link to strategy
Fixed RemunerationFixed remuneration for the Executive KMP is set by referencing the market median remuneration for similar roles in listed companies of similar size to Orora, competing in comparable geographic locations.
Fixed remuneration consists of cash salary and retirement benefits1.
Individual fixed remuneration is reflective of scope of role, geographic location, skills, responsibilities, experience and performance.
Market competitive fixed remuneration is paid to attract, motivate and retain Executive KMP with the appropriate experience and talent to drive Orora’s strategy.
+Short-Term Incentive (at-risk)Orora’s STI is designed to reward Executive KMP for the achievement of the key short-term performance measures in each financial year.
Any award achieved will be delivered, following the release of the end of year results, in the form of both cash and deferred equity (performance rights).2/3 Cash Payment 1/3 Deferred Equity (Performance Rights) – deferred for two years
A scorecard of performance measures is used to determine any STI award payable. This is measured at Orora Group level. This scorecard represents the key priority areas for the current year and typically include safety, strategic initiatives and has a strong weighting towards financial growth and returns.
The STI provides a reward linked to the delivery of short-term objectives, and the equity deferral both aligns overall reward outcomes to longer-term value creation for shareholders, and acts as a retention tool.
+Long-Term Incentive (at-risk)Orora’s LTI is designed to reward Executive KMP for the achievement of long-term sustainable business outcomes and value creation for shareholders.
Executive KMP are allocated both Performance Rights (75%) and Options (25%), with vesting based on the delivery of set performance measures over a 4-year performance period. Grants are made using Market Value (Performance Rights) and Fair Value (Options) but may be adjusted nominally at the Board’s discretion.
1. Compound Annual Growth Rate in EPS with a RoAFE gateway (all Options and 1/3 of Performance Rights). An exercise price also applies to Options.
2. Relative Total Shareholder Return (2/3 of Performance Rights).
The LTI builds Executive KMP equity ownership. It also aligns the interests of the Executive KMP with our shareholders by having an exercise price for Options, as no Options are earned unless earnings and returns increase and this is reflected in an increased share price.
=Total RemunerationThe sum of all fixed and variable (at-risk) elements of remuneration
Optional Component (used only on a limited basis)
Retention Share/Payment Plan (CEO Grant)Time-restricted (up to five years) shares or cash, subject to forfeiture in the event of voluntary termination or termination for cause.
Used on a limited basis at recruitment to replace existing entitlements from previous employers or as retention awards to existing executives.
(1) Retirement benefits are delivered under defined contribution funds for all Executive KMP. Retirement benefits are set by reference to regulatory requirements in the relevant employing jurisdictions.
42 ORORA LIMITED ANNUAL REPORT 2016
For
per
sona
l use
onl
y
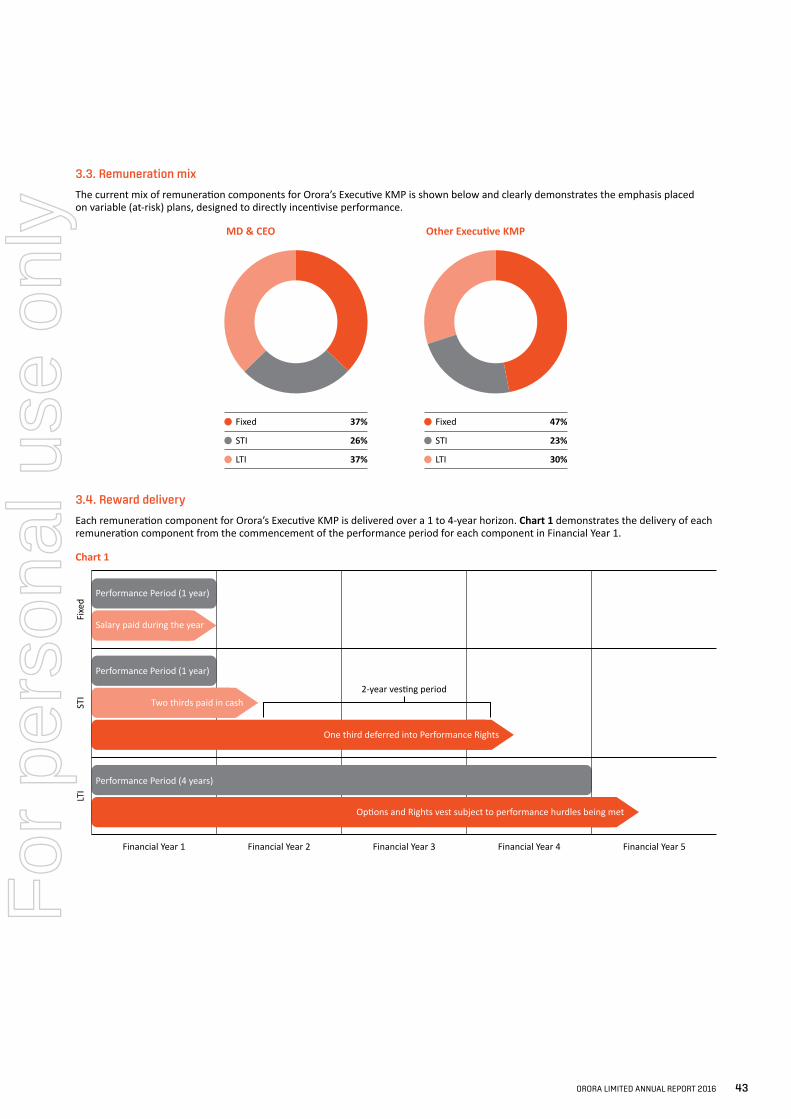
3.3. Remuneration mix
The current mix of remuneration components for Orora’s Executive KMP is shown below and clearly demonstrates the emphasis placed on variable (at-risk) plans, designed to directly incentivise performance.
MD & CEO Other Executive KMP
Fixed 37%
STI 26%
LTI 37%
Fixed 47%
STI 23%
LTI 30%
3.4. Reward delivery
Each remuneration component for Orora’s Executive KMP is delivered over a 1 to 4-year horizon. Chart 1 demonstrates the delivery of each remuneration component from the commencement of the performance period for each component in Financial Year 1.
Chart 1
STI
LTI
Fixe
d
Performance Period (1 year)
Performance Period (1 year)
Performance Period (4 years)
Two thirds paid in cash
One third deferred into Performance Rights
Financial Year 1 Financial Year 2 Financial Year 3
2-year vesting period
Financial Year 4 Financial Year 5
Salary paid during the year
Options and Rights vest subject to performance hurdles being met
ORORA LIMITED ANNUAL REPORT 2016 43
For
per
sona
l use
onl
y
DIRECTORS’ REPORT
REMUNERATION REPORT
4. FY16 Executive KMP remunerationOrora has a strong performance-based culture. The Board seeks to foster this through rewarding Senior Executives for the achievement of the Group’s short-term and long-term strategy and business objectives, with a view to generating above-average, sustainable returns for shareholders.
4.1. Shareholder return information
Table 4 summarises key indicators of the performance of the Orora Group and relevant shareholder returns over the financial year ended 30 June 2016. This table will be expanded in future years to include a five-year summary of the Orora Group’s financial results.
Table 4Financial Summary for year ended 30 June 2016(1) 2015 2014(2)
EBIT ($m) 280.5 225.1 192.1
Dividends per ordinary share (cents) 9.5 7.5 6.0
Closing share price (as at 30 June) $2.76 $2.09 $1.43
EPS Growth (%) 29.4% 25.9% –
NPAT ($m) 168.6 131.4 104.4
Cumulative TSR (%)(3) 36.1% 51.2% –
Operating Free Cash Flow(4) ($m) 313.8 260.8 218.9
RoAFE(5) (%) 12.7% 10.6% 9.3%
(1) EBIT and NPAT are as reported and include the one off profit on the sale of the Petrie land. EPS Growth has also been based on this NPAT number.(2) Effective 17 December 2013, the Orora Group demerged from Amcor Ltd. The demerger was implemented on 31 December 2013. As a result of the corporate restructure
to effect the demerger, the Orora Group’s statutory financial information as at 30 June 2014 did not represent the performance of the Orora Group as it is currently structured. Accordingly, the pro forma financial results of the Orora Group (which forms the base for future performance assessment) have been disclosed above in respect of the financial year ended 30 June 2014 and are presented on a pre-significant items basis.
(3) Total shareholder return (TSR) is calculated as the change in share price for the year, plus dividends paid during the financial year, divided by opening share price.(4) Operating Free Cash Flow excludes cash significant items that are considered to be outside the ordinary course of operations and non-recurring in nature but includes
net capital expenditure.(5) Return on Average Funds Employed (RoAFE) is calculated as EBIT/average funds employed.
4.2. Pay for performance
The Board has set challenging financial and non-financial performance targets for Senior Executives and has directly aligned Senior Executive incentives to the achievement of those targets for the financial year ended 30 June 2016.
The ‘Pay for Performance’ link is clear:Target performance achieved = target rewards paid.
Above-target performance achieved = above-target rewards paid.
Where the Orora Group’s performance does not meet the Board’s performance targets, either reduced or no benefits are earned from a Senior Executives’ at-risk short-term or long-term incentive components.
An outline of the Orora Executive KMP remuneration framework is set out in section 3.2.
A summary of the outcomes for each reward component in the financial year ended 30 June 2016 is provided in the section below in respect of the Executive KMP.
4.3. Fixed remuneration
Fixed remuneration was reviewed for each of the Executive KMP by referencing the market median remuneration for similar roles in listed companies, of similar size to Orora, competing in comparable geographic locations.
Appropriate adjustments were made for each of the Executive KMP giving consideration to their market position and individual performance.
44 ORORA LIMITED ANNUAL REPORT 2016
For
per
sona
l use
onl
y
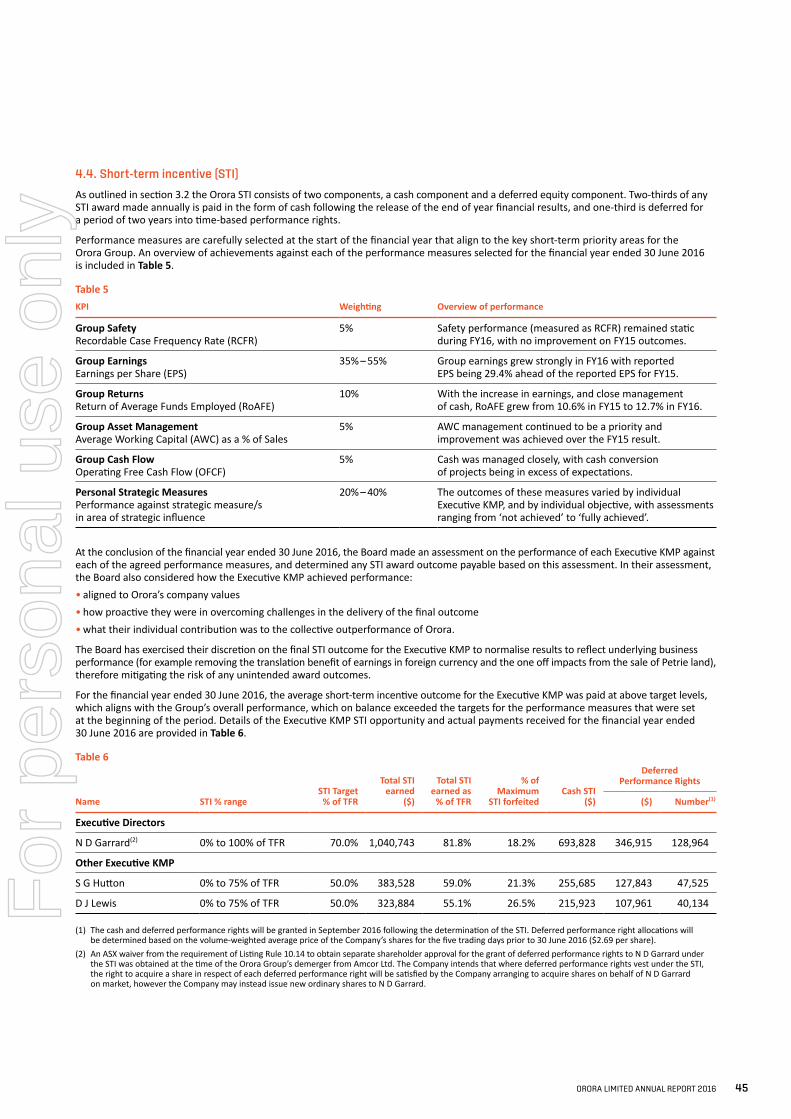
4.4. Short-term incentive (STI)
As outlined in section 3.2 the Orora STI consists of two components, a cash component and a deferred equity component. Two-thirds of any STI award made annually is paid in the form of cash following the release of the end of year financial results, and one-third is deferred for a period of two years into time-based performance rights.
Performance measures are carefully selected at the start of the financial year that align to the key short-term priority areas for the Orora Group. An overview of achievements against each of the performance measures selected for the financial year ended 30 June 2016 is included in Table 5.
Table 5KPI Weighting Overview of performance
Group Safety Recordable Case Frequency Rate (RCFR)
5% Safety performance (measured as RCFR) remained static during FY16, with no improvement on FY15 outcomes.
Group Earnings Earnings per Share (EPS)
35% – 55% Group earnings grew strongly in FY16 with reported EPS being 29.4% ahead of the reported EPS for FY15.
Group Returns Return of Average Funds Employed (RoAFE)
10% With the increase in earnings, and close management of cash, RoAFE grew from 10.6% in FY15 to 12.7% in FY16.
Group Asset Management Average Working Capital (AWC) as a % of Sales
5% AWC management continued to be a priority and improvement was achieved over the FY15 result.
Group Cash Flow Operating Free Cash Flow (OFCF)
5% Cash was managed closely, with cash conversion of projects being in excess of expectations.
Personal Strategic Measures Performance against strategic measure/s in area of strategic influence
20% – 40% The outcomes of these measures varied by individual Executive KMP, and by individual objective, with assessments ranging from ‘not achieved’ to ‘fully achieved’.
At the conclusion of the financial year ended 30 June 2016, the Board made an assessment on the performance of each Executive KMP against each of the agreed performance measures, and determined any STI award outcome payable based on this assessment. In their assessment, the Board also considered how the Executive KMP achieved performance:• aligned to Orora’s company values• how proactive they were in overcoming challenges in the delivery of the final outcome• what their individual contribution was to the collective outperformance of Orora.
The Board has exercised their discretion on the final STI outcome for the Executive KMP to normalise results to reflect underlying business performance (for example removing the translation benefit of earnings in foreign currency and the one off impacts from the sale of Petrie land), therefore mitigating the risk of any unintended award outcomes.
For the financial year ended 30 June 2016, the average short-term incentive outcome for the Executive KMP was paid at above target levels, which aligns with the Group’s overall performance, which on balance exceeded the targets for the performance measures that were set at the beginning of the period. Details of the Executive KMP STI opportunity and actual payments received for the financial year ended 30 June 2016 are provided in Table 6.
Table 6
Name STI % rangeSTI Target
% of TFR
Total STI earned
($)
Total STI earned as
% of TFR
% of Maximum
STI forfeitedCash STI
($)
Deferred Performance Rights
($) Number(1)
Executive Directors
N D Garrard(2) 0% to 100% of TFR 70.0% 1,040,743 81.8% 18.2% 693,828 346,915 128,964
Other Executive KMP
S G Hutton 0% to 75% of TFR 50.0% 383,528 59.0% 21.3% 255,685 127,843 47,525
D J Lewis 0% to 75% of TFR 50.0% 323,884 55.1% 26.5% 215,923 107,961 40,134
(1) The cash and deferred performance rights will be granted in September 2016 following the determination of the STI. Deferred performance right allocations will be determined based on the volume-weighted average price of the Company’s shares for the five trading days prior to 30 June 2016 ($2.69 per share).
(2) An ASX waiver from the requirement of Listing Rule 10.14 to obtain separate shareholder approval for the grant of deferred performance rights to N D Garrard under the STI was obtained at the time of the Orora Group’s demerger from Amcor Ltd. The Company intends that where deferred performance rights vest under the STI, the right to acquire a share in respect of each deferred performance right will be satisfied by the Company arranging to acquire shares on behalf of N D Garrard on market, however the Company may instead issue new ordinary shares to N D Garrard.
ORORA LIMITED ANNUAL REPORT 2016 45
For
per
sona
l use
onl
y
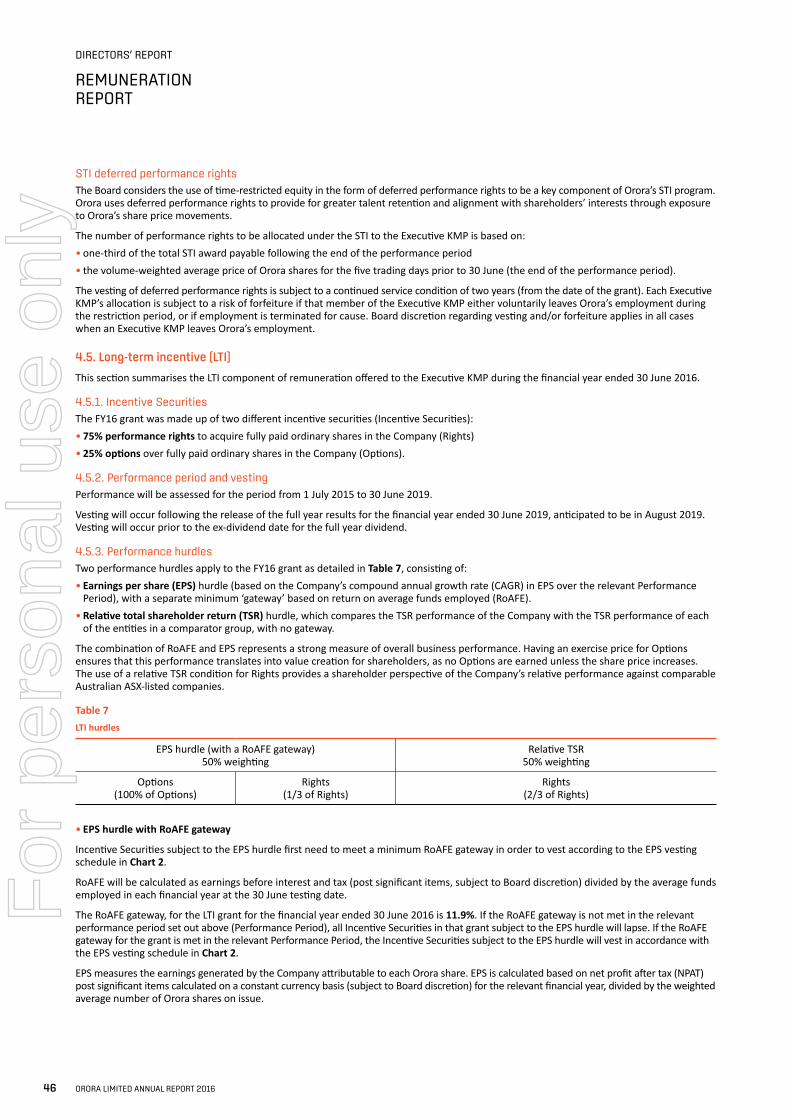
DIRECTORS’ REPORT
REMUNERATION REPORT
STI deferred performance rightsThe Board considers the use of time-restricted equity in the form of deferred performance rights to be a key component of Orora’s STI program. Orora uses deferred performance rights to provide for greater talent retention and alignment with shareholders’ interests through exposure to Orora’s share price movements.
The number of performance rights to be allocated under the STI to the Executive KMP is based on:• one-third of the total STI award payable following the end of the performance period• the volume-weighted average price of Orora shares for the five trading days prior to 30 June (the end of the performance period).
The vesting of deferred performance rights is subject to a continued service condition of two years (from the date of the grant). Each Executive KMP’s allocation is subject to a risk of forfeiture if that member of the Executive KMP either voluntarily leaves Orora’s employment during the restriction period, or if employment is terminated for cause. Board discretion regarding vesting and/or forfeiture applies in all cases when an Executive KMP leaves Orora’s employment.
4.5. Long-term incentive (LTI)
This section summarises the LTI component of remuneration offered to the Executive KMP during the financial year ended 30 June 2016.
4.5.1. Incentive SecuritiesThe FY16 grant was made up of two different incentive securities (Incentive Securities):• 75% performance rights to acquire fully paid ordinary shares in the Company (Rights)• 25% options over fully paid ordinary shares in the Company (Options).
4.5.2. Performance period and vestingPerformance will be assessed for the period from 1 July 2015 to 30 June 2019.
Vesting will occur following the release of the full year results for the financial year ended 30 June 2019, anticipated to be in August 2019. Vesting will occur prior to the ex-dividend date for the full year dividend.
4.5.3. Performance hurdlesTwo performance hurdles apply to the FY16 grant as detailed in Table 7, consisting of:• Earnings per share (EPS) hurdle (based on the Company’s compound annual growth rate (CAGR) in EPS over the relevant Performance
Period), with a separate minimum ‘gateway’ based on return on average funds employed (RoAFE).• Relative total shareholder return (TSR) hurdle, which compares the TSR performance of the Company with the TSR performance of each
of the entities in a comparator group, with no gateway.
The combination of RoAFE and EPS represents a strong measure of overall business performance. Having an exercise price for Options ensures that this performance translates into value creation for shareholders, as no Options are earned unless the share price increases. The use of a relative TSR condition for Rights provides a shareholder perspective of the Company’s relative performance against comparable Australian ASX-listed companies.
Table 7LTI hurdles
EPS hurdle (with a RoAFE gateway) 50% weighting
Relative TSR 50% weighting
Options (100% of Options)
Rights (1/3 of Rights)
Rights (2/3 of Rights)
• EPS hurdle with RoAFE gateway
Incentive Securities subject to the EPS hurdle first need to meet a minimum RoAFE gateway in order to vest according to the EPS vesting schedule in Chart 2.
RoAFE will be calculated as earnings before interest and tax (post significant items, subject to Board discretion) divided by the average funds employed in each financial year at the 30 June testing date.
The RoAFE gateway, for the LTI grant for the financial year ended 30 June 2016 is 11.9%. If the RoAFE gateway is not met in the relevant performance period set out above (Performance Period), all Incentive Securities in that grant subject to the EPS hurdle will lapse. If the RoAFE gateway for the grant is met in the relevant Performance Period, the Incentive Securities subject to the EPS hurdle will vest in accordance with the EPS vesting schedule in Chart 2.
EPS measures the earnings generated by the Company attributable to each Orora share. EPS is calculated based on net profit after tax (NPAT) post significant items calculated on a constant currency basis (subject to Board discretion) for the relevant financial year, divided by the weighted average number of Orora shares on issue.
46 ORORA LIMITED ANNUAL REPORT 2016
For
per
sona
l use
onl
y
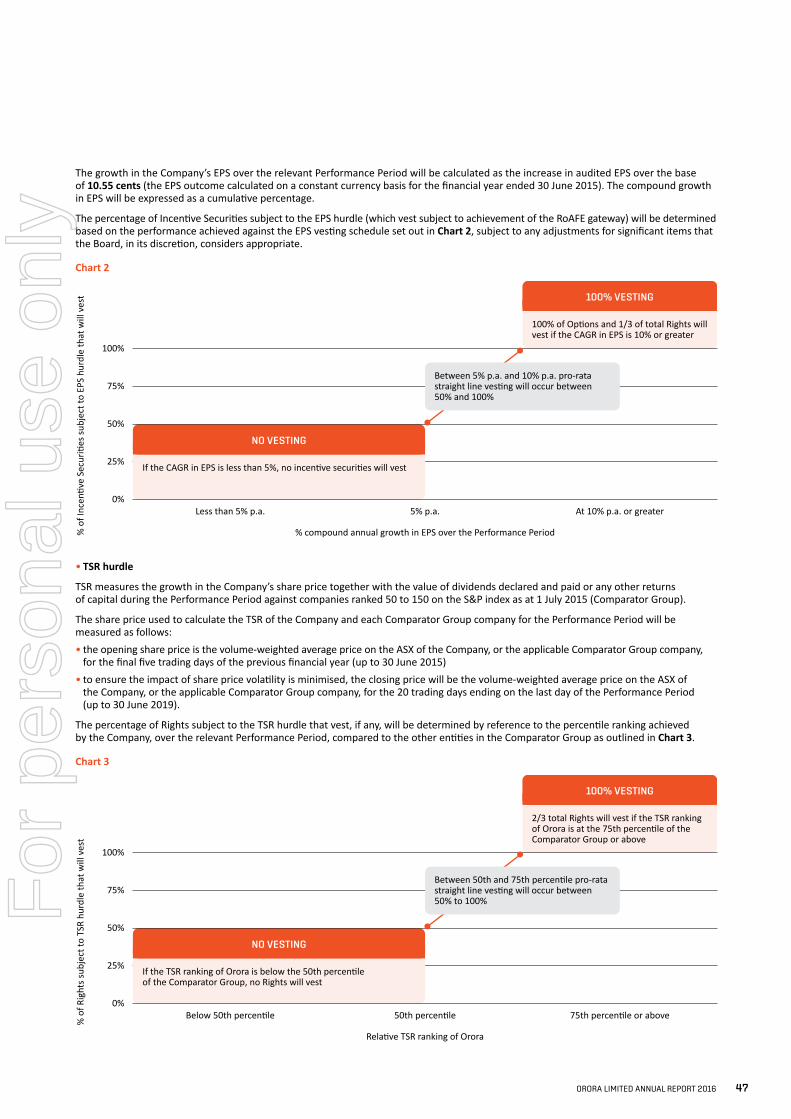
The growth in the Company’s EPS over the relevant Performance Period will be calculated as the increase in audited EPS over the base of 10.55 cents (the EPS outcome calculated on a constant currency basis for the financial year ended 30 June 2015). The compound growth in EPS will be expressed as a cumulative percentage.
The percentage of Incentive Securities subject to the EPS hurdle (which vest subject to achievement of the RoAFE gateway) will be determined based on the performance achieved against the EPS vesting schedule set out in Chart 2, subject to any adjustments for significant items that the Board, in its discretion, considers appropriate.
Chart 2
100% VESTING
100% of Options and 1/3 of total Rights will vest if the CAGR in EPS is 10% or greater
Less than 5% p.a.
If the CAGR in EPS is less than 5%, no incentive securities will vest
NO VESTING
% o
f Inc
entiv
e Se
curiti
es su
bjec
t to
EPS
hurd
le th
at w
ill v
est
100%
5% p.a. At 10% p.a. or greater
% compound annual growth in EPS over the Performance Period
75%
50%
25%
0%
Between 5% p.a. and 10% p.a. pro-rata straight line vesting will occur between 50% and 100%
• TSR hurdle
TSR measures the growth in the Company’s share price together with the value of dividends declared and paid or any other returns of capital during the Performance Period against companies ranked 50 to 150 on the S&P index as at 1 July 2015 (Comparator Group).
The share price used to calculate the TSR of the Company and each Comparator Group company for the Performance Period will be measured as follows:• the opening share price is the volume-weighted average price on the ASX of the Company, or the applicable Comparator Group company,
for the final five trading days of the previous financial year (up to 30 June 2015)• to ensure the impact of share price volatility is minimised, the closing price will be the volume-weighted average price on the ASX of
the Company, or the applicable Comparator Group company, for the 20 trading days ending on the last day of the Performance Period (up to 30 June 2019).
The percentage of Rights subject to the TSR hurdle that vest, if any, will be determined by reference to the percentile ranking achieved by the Company, over the relevant Performance Period, compared to the other entities in the Comparator Group as outlined in Chart 3.
Chart 3
100% VESTING
2/3 total Rights will vest if the TSR ranking of Orora is at the 75th percentile of the Comparator Group or above
Below 50th percentile
If the TSR ranking of Orora is below the 50th percentileof the Comparator Group, no Rights will vest
NO VESTING
% o
f Rig
hts s
ubje
ct to
TSR
hur
dle
that
will
ves
t
100%
50th percentile 75th percentile or above
Relative TSR ranking of Orora
75%
50%
25%
0%
Between 50th and 75th percentile pro-rata straight line vesting will occur between 50% to 100%
ORORA LIMITED ANNUAL REPORT 2016 47
For
per
sona
l use
onl
y
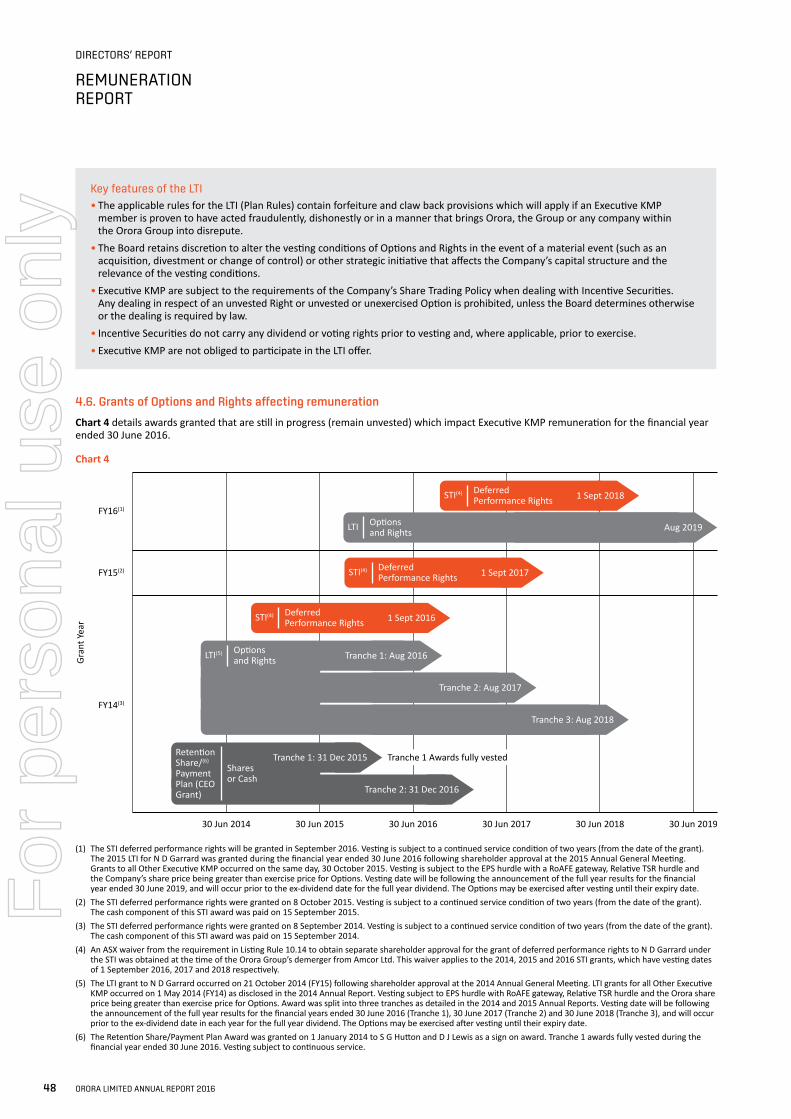
DIRECTORS’ REPORT
REMUNERATION REPORT
Key features of the LTI• The applicable rules for the LTI (Plan Rules) contain forfeiture and claw back provisions which will apply if an Executive KMP
member is proven to have acted fraudulently, dishonestly or in a manner that brings Orora, the Group or any company within the Orora Group into disrepute.
• The Board retains discretion to alter the vesting conditions of Options and Rights in the event of a material event (such as an acquisition, divestment or change of control) or other strategic initiative that affects the Company’s capital structure and the relevance of the vesting conditions.
• Executive KMP are subject to the requirements of the Company’s Share Trading Policy when dealing with Incentive Securities. Any dealing in respect of an unvested Right or unvested or unexercised Option is prohibited, unless the Board determines otherwise or the dealing is required by law.
• Incentive Securities do not carry any dividend or voting rights prior to vesting and, where applicable, prior to exercise.• Executive KMP are not obliged to participate in the LTI offer.
4.6. Grants of Options and Rights affecting remuneration
Chart 4 details awards granted that are still in progress (remain unvested) which impact Executive KMP remuneration for the financial year ended 30 June 2016.
Chart 4
Gran
t Yea
r
FY16(1)
One third deferred into Performance Rights
Tranche 2: 31 Dec 2016
STI(4) Deferred Performance Rights
30 Jun 2014 30 Jun 2015 30 Jun 2016 30 Jun 2017 30 Jun 2018 30 Jun 2019
FY15(2)
FY14(3)
1 Sept 2018
STI(4) Deferred Performance Rights 1 Sept 2017
STI(4) Deferred Performance Rights 1 Sept 2016
LTI Options and Rights Aug 2019
Tranche 1: Aug 2016
Tranche 2: Aug 2017
Tranche 3: Aug 2018
LTI(5) Options and Rights
Tranche 1: 31 Dec 2015 Tranche 1 Awards fully vestedRetention Share/(6)
Payment Plan (CEO Grant)
Shares or Cash
(1) The STI deferred performance rights will be granted in September 2016. Vesting is subject to a continued service condition of two years (from the date of the grant). The 2015 LTI for N D Garrard was granted during the financial year ended 30 June 2016 following shareholder approval at the 2015 Annual General Meeting. Grants to all Other Executive KMP occurred on the same day, 30 October 2015. Vesting is subject to the EPS hurdle with a RoAFE gateway, Relative TSR hurdle and the Company’s share price being greater than exercise price for Options. Vesting date will be following the announcement of the full year results for the financial year ended 30 June 2019, and will occur prior to the ex-dividend date for the full year dividend. The Options may be exercised after vesting until their expiry date.
(2) The STI deferred performance rights were granted on 8 October 2015. Vesting is subject to a continued service condition of two years (from the date of the grant). The cash component of this STI award was paid on 15 September 2015.
(3) The STI deferred performance rights were granted on 8 September 2014. Vesting is subject to a continued service condition of two years (from the date of the grant). The cash component of this STI award was paid on 15 September 2014.
(4) An ASX waiver from the requirement in Listing Rule 10.14 to obtain separate shareholder approval for the grant of deferred performance rights to N D Garrard under the STI was obtained at the time of the Orora Group’s demerger from Amcor Ltd. This waiver applies to the 2014, 2015 and 2016 STI grants, which have vesting dates of 1 September 2016, 2017 and 2018 respectively.
(5) The LTI grant to N D Garrard occurred on 21 October 2014 (FY15) following shareholder approval at the 2014 Annual General Meeting. LTI grants for all Other Executive KMP occurred on 1 May 2014 (FY14) as disclosed in the 2014 Annual Report. Vesting subject to EPS hurdle with RoAFE gateway, Relative TSR hurdle and the Orora share price being greater than exercise price for Options. Award was split into three tranches as detailed in the 2014 and 2015 Annual Reports. Vesting date will be following the announcement of the full year results for the financial years ended 30 June 2016 (Tranche 1), 30 June 2017 (Tranche 2) and 30 June 2018 (Tranche 3), and will occur prior to the ex-dividend date in each year for the full year dividend. The Options may be exercised after vesting until their expiry date.
(6) The Retention Share/Payment Plan Award was granted on 1 January 2014 to S G Hutton and D J Lewis as a sign on award. Tranche 1 awards fully vested during the financial year ended 30 June 2016. Vesting subject to continuous service.
48 ORORA LIMITED ANNUAL REPORT 2016
For
per
sona
l use
onl
y
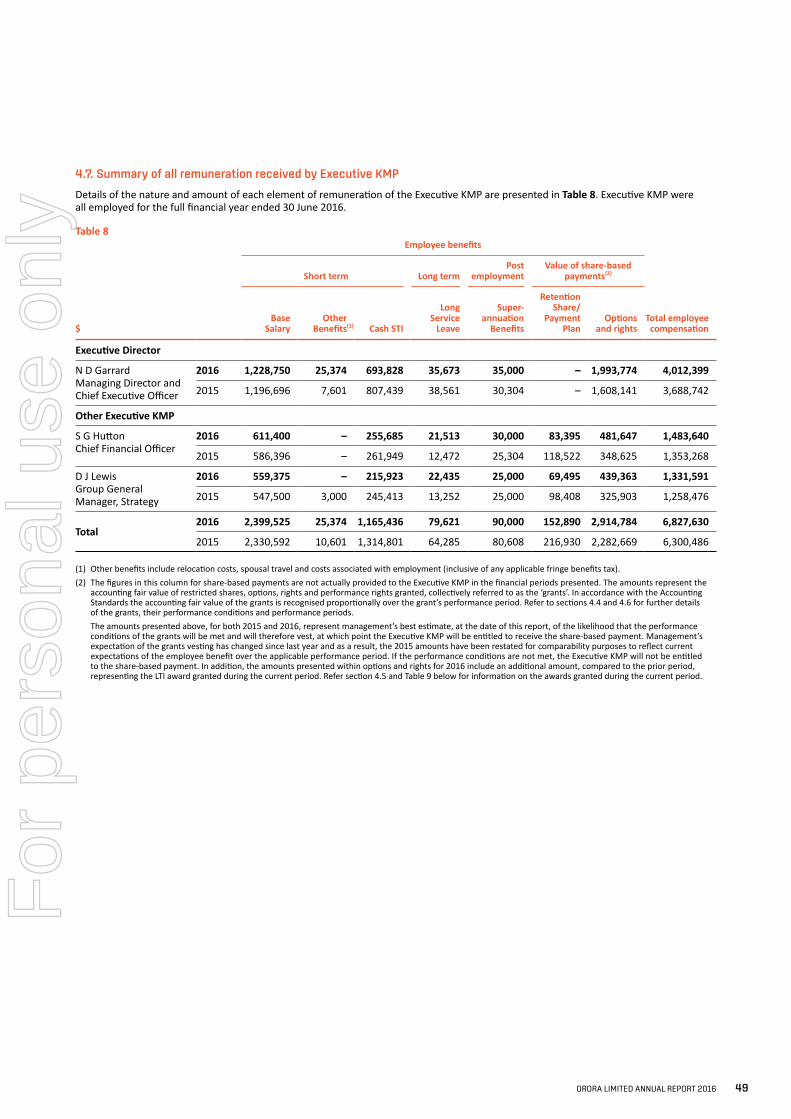
4.7. Summary of all remuneration received by Executive KMP
Details of the nature and amount of each element of remuneration of the Executive KMP are presented in Table 8. Executive KMP were all employed for the full financial year ended 30 June 2016.
Table 8
$
Employee benefits
Total employee compensation
Short term Long term Post
employment Value of share-based
payments(2)
Base Salary
OtherBenefits(1) Cash STI
Long Service
Leave
Super-annuation
Benefits
Retention Share/
Payment Plan
Options and rights
Executive Director
N D Garrard Managing Director and Chief Executive Officer
2016 1,228,750 25,374 693,828 35,673 35,000 – 1,993,774 4,012,399
2015 1,196,696 7,601 807,439 38,561 30,304 – 1,608,141 3,688,742
Other Executive KMP
S G Hutton Chief Financial Officer
2016 611,400 – 255,685 21,513 30,000 83,395 481,647 1,483,640
2015 586,396 – 261,949 12,472 25,304 118,522 348,625 1,353,268
D J Lewis Group General Manager, Strategy
2016 559,375 – 215,923 22,435 25,000 69,495 439,363 1,331,591
2015 547,500 3,000 245,413 13,252 25,000 98,408 325,903 1,258,476
Total2016 2,399,525 25,374 1,165,436 79,621 90,000 152,890 2,914,784 6,827,630
2015 2,330,592 10,601 1,314,801 64,285 80,608 216,930 2,282,669 6,300,486
(1) Other benefits include relocation costs, spousal travel and costs associated with employment (inclusive of any applicable fringe benefits tax).(2) The figures in this column for share-based payments are not actually provided to the Executive KMP in the financial periods presented. The amounts represent the
accounting fair value of restricted shares, options, rights and performance rights granted, collectively referred to as the ‘grants’. In accordance with the Accounting Standards the accounting fair value of the grants is recognised proportionally over the grant’s performance period. Refer to sections 4.4 and 4.6 for further details of the grants, their performance conditions and performance periods.
The amounts presented above, for both 2015 and 2016, represent management’s best estimate, at the date of this report, of the likelihood that the performance conditions of the grants will be met and will therefore vest, at which point the Executive KMP will be entitled to receive the share-based payment. Management’s expectation of the grants vesting has changed since last year and as a result, the 2015 amounts have been restated for comparability purposes to reflect current expectations of the employee benefit over the applicable performance period. If the performance conditions are not met, the Executive KMP will not be entitled to the share-based payment. In addition, the amounts presented within options and rights for 2016 include an additional amount, compared to the prior period, representing the LTI award granted during the current period. Refer section 4.5 and Table 9 below for information on the awards granted during the current period.
ORORA LIMITED ANNUAL REPORT 2016 49
For
per
sona
l use
onl
y
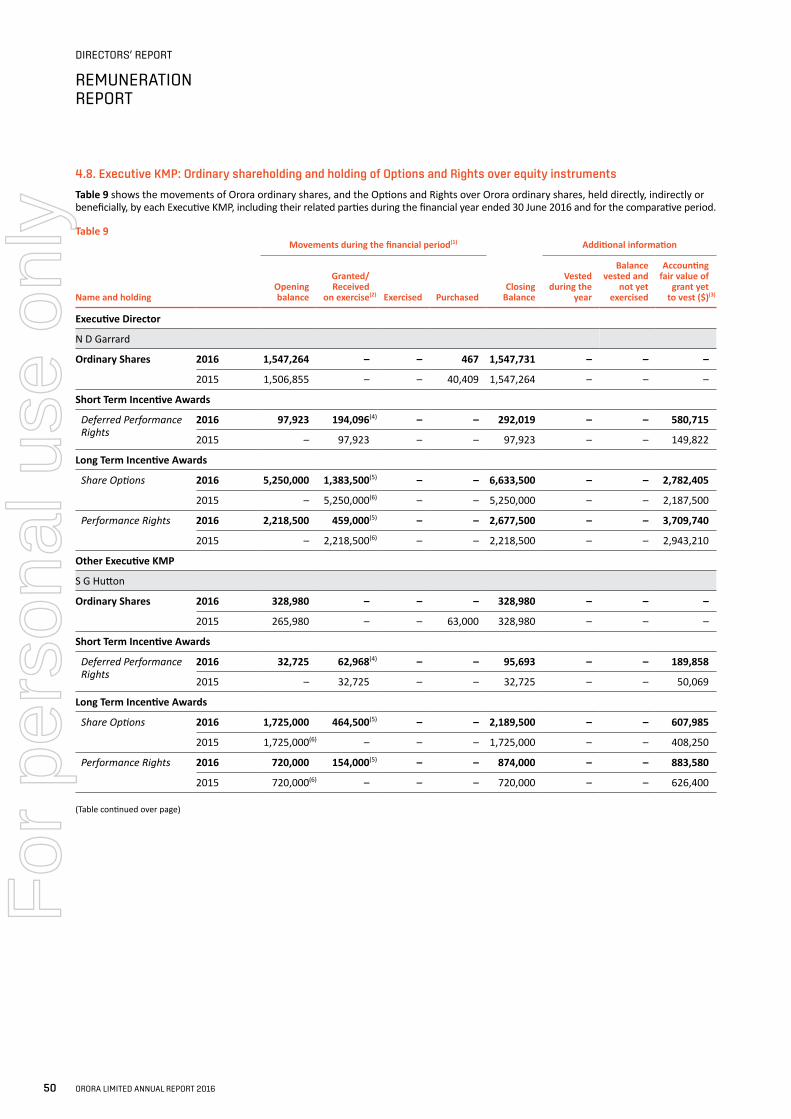
DIRECTORS’ REPORT
REMUNERATION REPORT
4.8. Executive KMP: Ordinary shareholding and holding of Options and Rights over equity instruments
Table 9 shows the movements of Orora ordinary shares, and the Options and Rights over Orora ordinary shares, held directly, indirectly or beneficially, by each Executive KMP, including their related parties during the financial year ended 30 June 2016 and for the comparative period.
Table 9
Name and holding
Movements during the financial period(1)
Closing Balance
Additional information
Opening balance
Granted/ Received
on exercise(2) Exercised Purchased
Vested during the
year
Balance vested and
not yet exercised
Accounting fair value of
grant yetto vest ($)(3)
Executive Director
N D Garrard
Ordinary Shares 2016 1,547,264 – – 467 1,547,731 – – –
2015 1,506,855 – – 40,409 1,547,264 – – –
Short Term Incentive Awards
Deferred Performance Rights
2016 97,923 194,096(4) – – 292,019 – – 580,715
2015 – 97,923 – – 97,923 – – 149,822
Long Term Incentive Awards
Share Options 2016 5,250,000 1,383,500(5) – – 6,633,500 – – 2,782,405
2015 – 5,250,000(6) – – 5,250,000 – – 2,187,500
Performance Rights 2016 2,218,500 459,000(5) – – 2,677,500 – – 3,709,740
2015 – 2,218,500(6) – – 2,218,500 – – 2,943,210
Other Executive KMP
S G Hutton
Ordinary Shares 2016 328,980 – – – 328,980 – – –
2015 265,980 – – 63,000 328,980 – – –
Short Term Incentive Awards
Deferred Performance Rights
2016 32,725 62,968(4) – – 95,693 – – 189,858
2015 – 32,725 – – 32,725 – – 50,069
Long Term Incentive Awards
Share Options 2016 1,725,000 464,500(5) – – 2,189,500 – – 607,985
2015 1,725,000(6) – – – 1,725,000 – – 408,250
Performance Rights 2016 720,000 154,000(5) – – 874,000 – – 883,580
2015 720,000(6) – – – 720,000 – – 626,400
(Table continued over page)
50 ORORA LIMITED ANNUAL REPORT 2016
For
per
sona
l use
onl
y
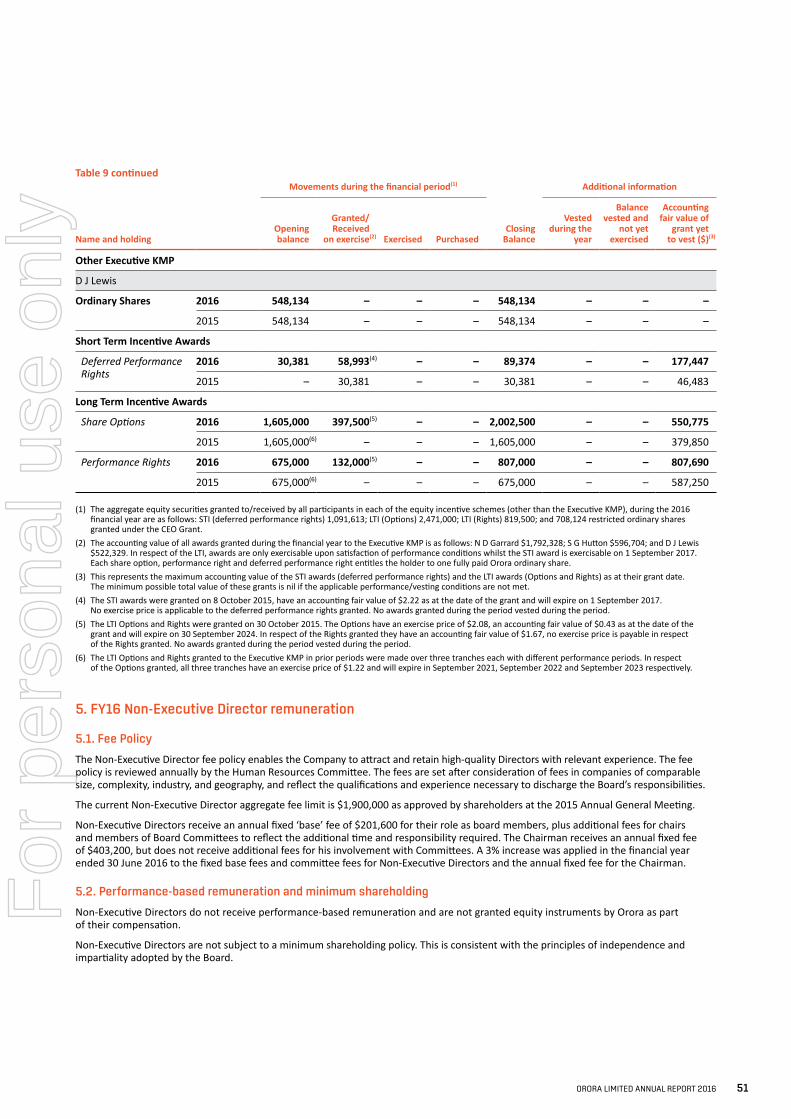
Name and holding
Movements during the financial period(1)
Closing Balance
Additional information
Opening balance
Granted/ Received
on exercise(2) Exercised Purchased
Vested during the
year
Balance vested and
not yet exercised
Accounting fair value of
grant yetto vest ($)(3)
Other Executive KMP
D J Lewis
Ordinary Shares 2016 548,134 – – – 548,134 – – –
2015 548,134 – – – 548,134 – – –
Short Term Incentive Awards
Deferred Performance Rights
2016 30,381 58,993(4) – – 89,374 – – 177,447
2015 – 30,381 – – 30,381 – – 46,483
Long Term Incentive Awards
Share Options 2016 1,605,000 397,500(5) – – 2,002,500 – – 550,775
2015 1,605,000(6) – – – 1,605,000 – – 379,850
Performance Rights 2016 675,000 132,000(5) – – 807,000 – – 807,690
2015 675,000(6) – – – 675,000 – – 587,250
(1) The aggregate equity securities granted to/received by all participants in each of the equity incentive schemes (other than the Executive KMP), during the 2016 financial year are as follows: STI (deferred performance rights) 1,091,613; LTI (Options) 2,471,000; LTI (Rights) 819,500; and 708,124 restricted ordinary shares granted under the CEO Grant.
(2) The accounting value of all awards granted during the financial year to the Executive KMP is as follows: N D Garrard $1,792,328; S G Hutton $596,704; and D J Lewis $522,329. In respect of the LTI, awards are only exercisable upon satisfaction of performance conditions whilst the STI award is exercisable on 1 September 2017. Each share option, performance right and deferred performance right entitles the holder to one fully paid Orora ordinary share.
(3) This represents the maximum accounting value of the STI awards (deferred performance rights) and the LTI awards (Options and Rights) as at their grant date. The minimum possible total value of these grants is nil if the applicable performance/vesting conditions are not met.
(4) The STI awards were granted on 8 October 2015, have an accounting fair value of $2.22 as at the date of the grant and will expire on 1 September 2017. No exercise price is applicable to the deferred performance rights granted. No awards granted during the period vested during the period.
(5) The LTI Options and Rights were granted on 30 October 2015. The Options have an exercise price of $2.08, an accounting fair value of $0.43 as at the date of the grant and will expire on 30 September 2024. In respect of the Rights granted they have an accounting fair value of $1.67, no exercise price is payable in respect of the Rights granted. No awards granted during the period vested during the period.
(6) The LTI Options and Rights granted to the Executive KMP in prior periods were made over three tranches each with different performance periods. In respect of the Options granted, all three tranches have an exercise price of $1.22 and will expire in September 2021, September 2022 and September 2023 respectively.
5. FY16 Non-Executive Director remuneration
5.1. Fee Policy
The Non-Executive Director fee policy enables the Company to attract and retain high-quality Directors with relevant experience. The fee policy is reviewed annually by the Human Resources Committee. The fees are set after consideration of fees in companies of comparable size, complexity, industry, and geography, and reflect the qualifications and experience necessary to discharge the Board’s responsibilities.
The current Non-Executive Director aggregate fee limit is $1,900,000 as approved by shareholders at the 2015 Annual General Meeting.
Non-Executive Directors receive an annual fixed ‘base’ fee of $201,600 for their role as board members, plus additional fees for chairs and members of Board Committees to reflect the additional time and responsibility required. The Chairman receives an annual fixed fee of $403,200, but does not receive additional fees for his involvement with Committees. A 3% increase was applied in the financial year ended 30 June 2016 to the fixed base fees and committee fees for Non-Executive Directors and the annual fixed fee for the Chairman.
5.2. Performance-based remuneration and minimum shareholding
Non-Executive Directors do not receive performance-based remuneration and are not granted equity instruments by Orora as part of their compensation.
Non-Executive Directors are not subject to a minimum shareholding policy. This is consistent with the principles of independence and impartiality adopted by the Board.
Table 9 continued
ORORA LIMITED ANNUAL REPORT 2016 51
For
per
sona
l use
onl
y
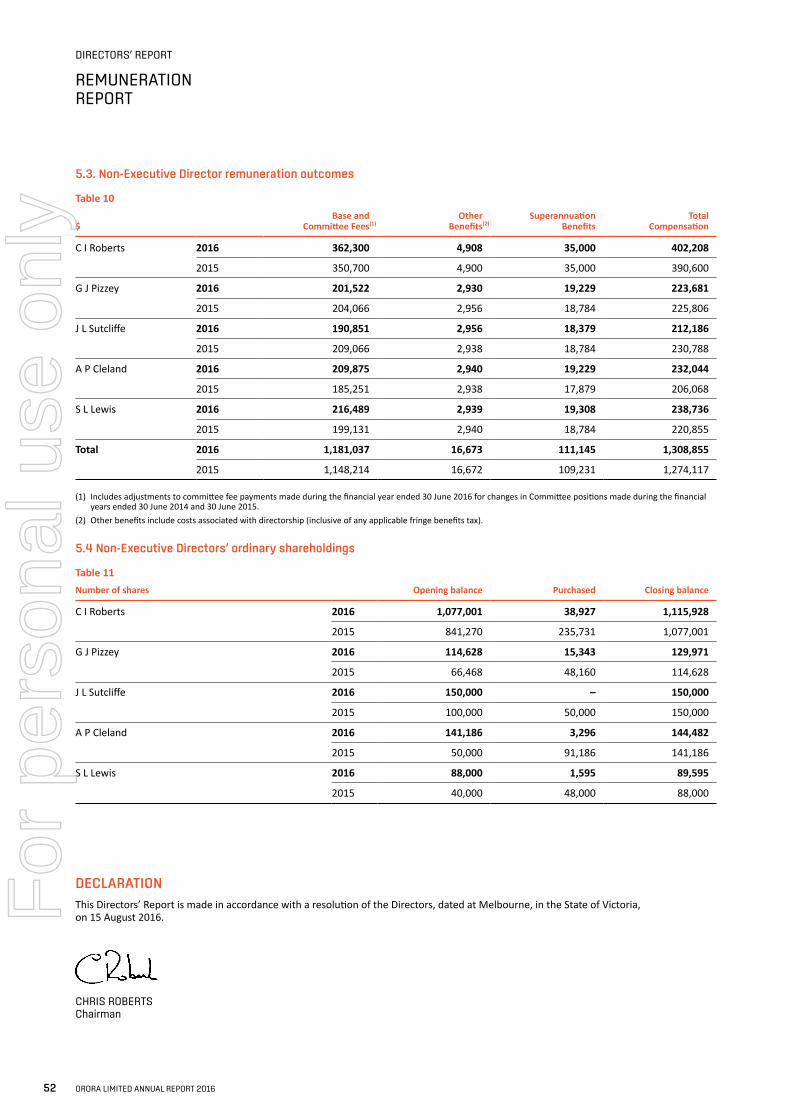
DIRECTORS’ REPORT
REMUNERATION REPORT
5.3. Non-Executive Director remuneration outcomes
Table 10
$Base and
Committee Fees(1)Other
Benefits(2)Superannuation
BenefitsTotal
Compensation
C I Roberts 2016 362,300 4,908 35,000 402,208
2015 350,700 4,900 35,000 390,600
G J Pizzey 2016 201,522 2,930 19,229 223,681
2015 204,066 2,956 18,784 225,806
J L Sutcliffe 2016 190,851 2,956 18,379 212,186
2015 209,066 2,938 18,784 230,788
A P Cleland 2016 209,875 2,940 19,229 232,044
2015 185,251 2,938 17,879 206,068
S L Lewis 2016 216,489 2,939 19,308 238,736
2015 199,131 2,940 18,784 220,855
Total 2016 1,181,037 16,673 111,145 1,308,855
2015 1,148,214 16,672 109,231 1,274,117
(1) Includes adjustments to committee fee payments made during the financial year ended 30 June 2016 for changes in Committee positions made during the financial years ended 30 June 2014 and 30 June 2015.
(2) Other benefits include costs associated with directorship (inclusive of any applicable fringe benefits tax).
5.4 Non-Executive Directors’ ordinary shareholdings
Table 11Number of shares Opening balance Purchased Closing balance
C I Roberts 2016 1,077,001 38,927 1,115,928
2015 841,270 235,731 1,077,001
G J Pizzey 2016 114,628 15,343 129,971
2015 66,468 48,160 114,628
J L Sutcliffe 2016 150,000 – 150,000
2015 100,000 50,000 150,000
A P Cleland 2016 141,186 3,296 144,482
2015 50,000 91,186 141,186
S L Lewis 2016 88,000 1,595 89,595
2015 40,000 48,000 88,000
DECLARATIONThis Directors’ Report is made in accordance with a resolution of the Directors, dated at Melbourne, in the State of Victoria, on 15 August 2016.
CHRIS ROBERTS Chairman
52 ORORA LIMITED ANNUAL REPORT 2016
For
per
sona
l use
onl
y
AUDITOR’S INDEPENDENCE DECLARATION
As lead auditor for the audit of Orora Limited for the year ended 30 June 2016, I declare that to the best of my knowledge and belief, there have been:
1. no contraventions of the auditor independence requirements of the Corporations Act 2001 in relation to the audit; and
2. no contraventions of any applicable code of professional conduct in relation to the audit.
This declaration is in respect of Orora Limited and the entities it controlled during the period.
LISA HARKER Partner PricewaterhouseCoopers
Melbourne 15 August 2016
ORORA LIMITED ANNUAL REPORT 2016 53
For
per
sona
l use
onl
y
FINANCIAL REPORT
This is the financial report of Orora Limited (the Company) and its subsidiaries (collectively referred to as the Group).
The financial report has been prepared in a style that attempts to make the report less complex and more relevant to shareholders. We have grouped the note disclosures into a number of sections with each section also including details of the accounting policies applied in producing the relevant note, along with details of any key judgements and estimates used.
Notes to the financial statements provide information required by statute, accounting standards or Listing Rules to explain a particular feature of the financial statements. The notes which follow also provide explanation and additional disclosures to assist readers in their understanding and interpretation Annual Report and the financial statements.
IN THIS SECTION
Financial statements
Income Statement 55Statement of Comprehensive Income 56Statement of Financial Position 57Statement of Changes in Equity 58Cash Flow Statement 59
Notes to the financial statements
About this report 60Results for the year 62
1.1 Segment results 621.2 Earnings per share (EPS) 651.3 Income 651.4 Operating costs 66
Income tax 672.1 Income tax expense 672.2 Deferred tax balances 68
Assets and liabilities 703.1 Trade and other receivables 703.2 Inventories 713.3 Trade and other payables 723.4 Other assets 723.5 Property, plant and equipment 733.6 Intangible assets 743.7 Provisions 763.8 Impairment of non-financial assets 78
Capital structure and financing 804.1 Capital management 804.2 Dividends 814.3 Net debt 824.4 Equity 83
Financial risk management 855.1 Market risks 865.2 Credit risk 885.3 Liquidity risk and funding risk 885.4 Hedging instruments 90
Group structure 946.1 Principal subsidiary undertakings and investments 946.2 Acquisition of controlled entities 946.3 Orora Employee Share Trust 96
Other 977.1 Share-based compensation 977.2 Auditors’ remuneration 1007.3 Commitments and contingent liabilities 1007.4 Orora Limited 1017.5 Deed of Cross Guarantee 1027.6 Related party transactions 1057.7 Key Management Personnel 1057.8 New and amended accounting standards
and interpretations 105
54 ORORA LIMITED ANNUAL REPORT 2016
For
per
sona
l use
onl
y
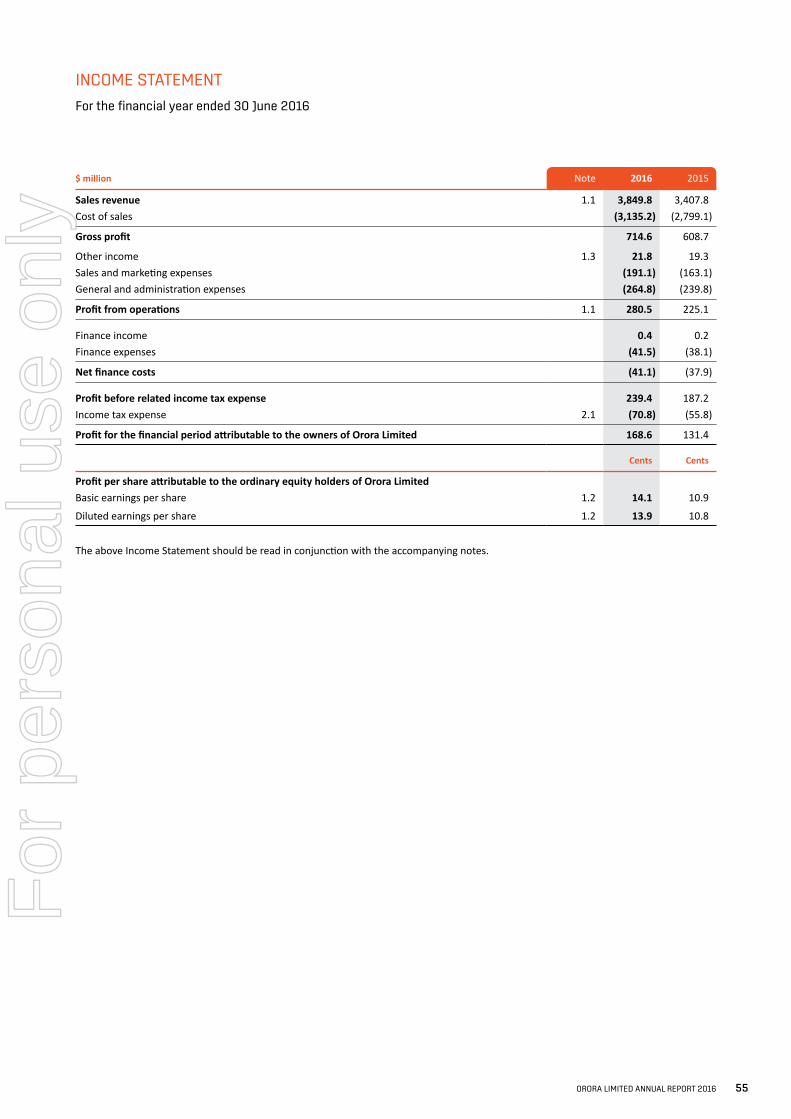
$ million Note 2016 2015
Sales revenue 1.1 3,849.8 3,407.8 Cost of sales (3,135.2) (2,799.1)
Gross profit 714.6 608.7
Other income 1.3 21.8 19.3 Sales and marketing expenses (191.1) (163.1)General and administration expenses (264.8) (239.8)
Profit from operations 1.1 280.5 225.1
Finance income 0.4 0.2 Finance expenses (41.5) (38.1)
Net finance costs (41.1) (37.9)
Profit before related income tax expense 239.4 187.2 Income tax expense 2.1 (70.8) (55.8)
Profit for the financial period attributable to the owners of Orora Limited 168.6 131.4
Cents Cents
Profit per share attributable to the ordinary equity holders of Orora LimitedBasic earnings per share 1.2 14.1 10.9
Diluted earnings per share 1.2 13.9 10.8
The above Income Statement should be read in conjunction with the accompanying notes.
INCOME STATEMENT
For the financial year ended 30 June 2016
ORORA LIMITED ANNUAL REPORT 2016 55
For
per
sona
l use
onl
y
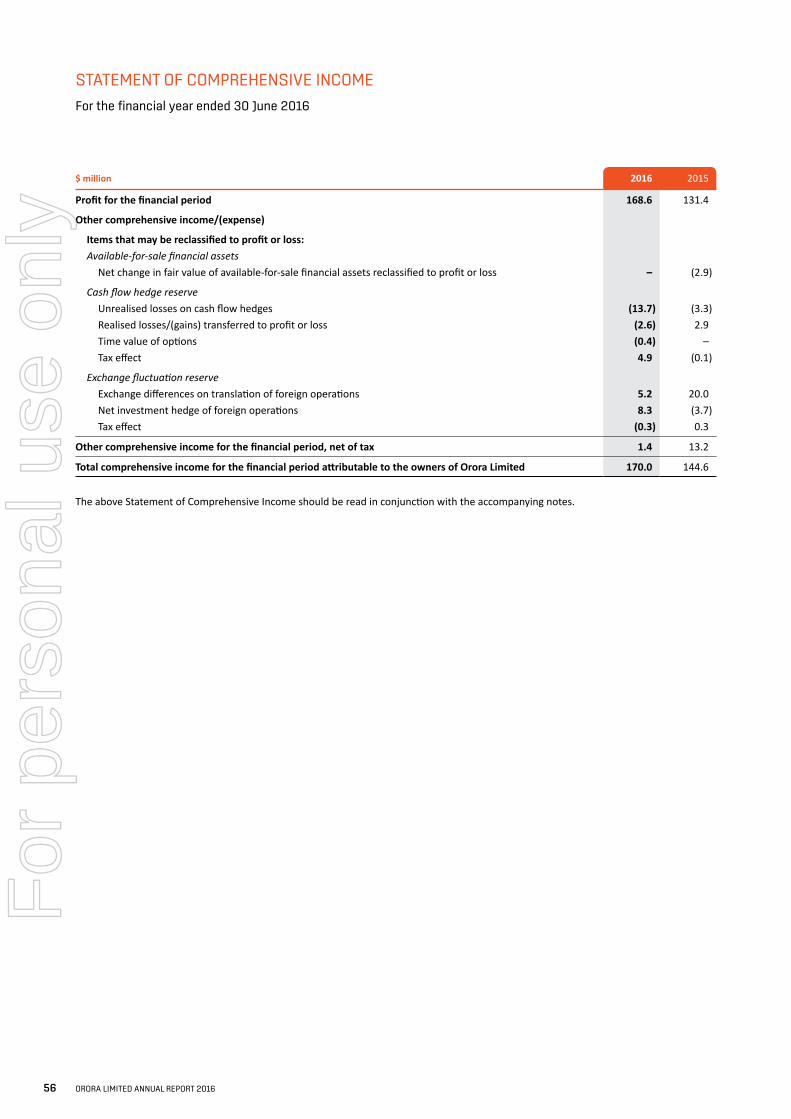
$ million 2016 2015
Profit for the financial period 168.6 131.4
Other comprehensive income/(expense)
Items that may be reclassified to profit or loss: Available-for-sale financial assets Net change in fair value of available-for-sale financial assets reclassified to profit or loss – (2.9)
Cash flow hedge reserve Unrealised losses on cash flow hedges (13.7) (3.3) Realised losses/(gains) transferred to profit or loss (2.6) 2.9 Time value of options (0.4) – Tax effect 4.9 (0.1)
Exchange fluctuation reserve Exchange differences on translation of foreign operations 5.2 20.0 Net investment hedge of foreign operations 8.3 (3.7) Tax effect (0.3) 0.3
Other comprehensive income for the financial period, net of tax 1.4 13.2
Total comprehensive income for the financial period attributable to the owners of Orora Limited 170.0 144.6
The above Statement of Comprehensive Income should be read in conjunction with the accompanying notes.
STATEMENT OF COMPREHENSIVE INCOME
For the financial year ended 30 June 2016
56 ORORA LIMITED ANNUAL REPORT 2016
For
per
sona
l use
onl
y
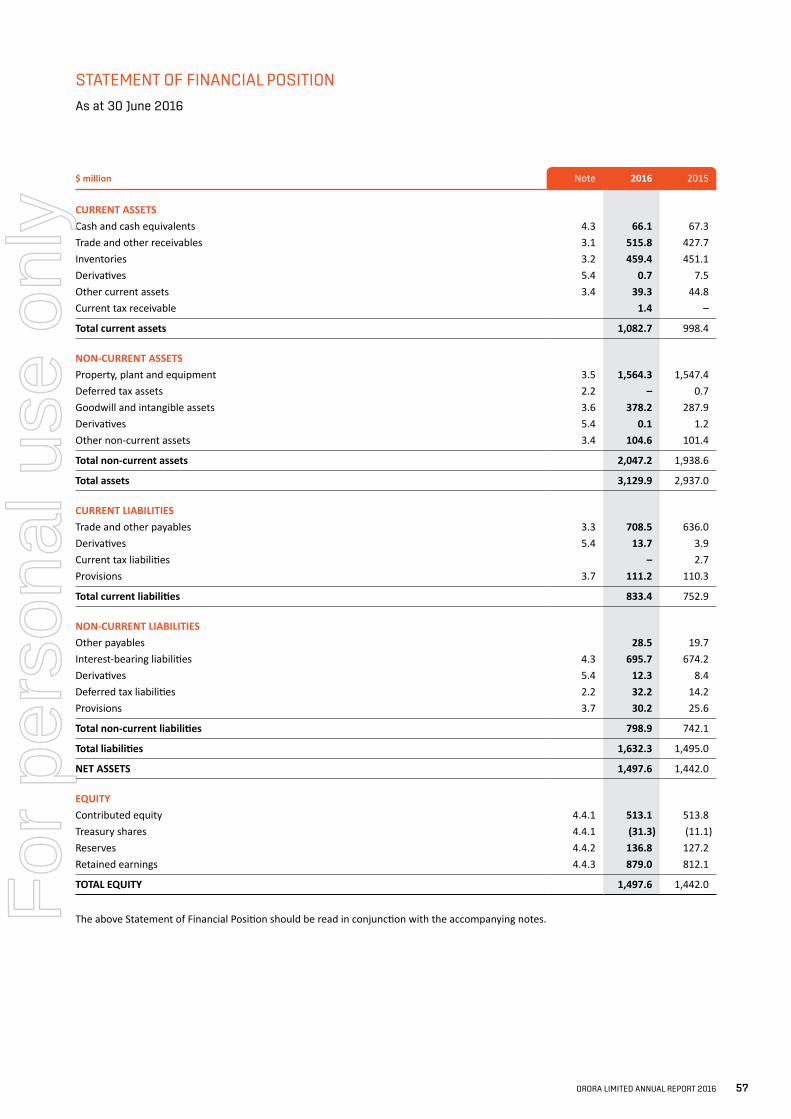
$ million Note 2016 2015
CURRENT ASSETSCash and cash equivalents 4.3 66.1 67.3 Trade and other receivables 3.1 515.8 427.7 Inventories 3.2 459.4 451.1 Derivatives 5.4 0.7 7.5 Other current assets 3.4 39.3 44.8 Current tax receivable 1.4 –
Total current assets 1,082.7 998.4
NON-CURRENT ASSETSProperty, plant and equipment 3.5 1,564.3 1,547.4 Deferred tax assets 2.2 – 0.7 Goodwill and intangible assets 3.6 378.2 287.9 Derivatives 5.4 0.1 1.2 Other non-current assets 3.4 104.6 101.4
Total non-current assets 2,047.2 1,938.6
Total assets 3,129.9 2,937.0
CURRENT LIABILITIESTrade and other payables 3.3 708.5 636.0 Derivatives 5.4 13.7 3.9 Current tax liabilities – 2.7 Provisions 3.7 111.2 110.3
Total current liabilities 833.4 752.9
NON-CURRENT LIABILITIESOther payables 28.5 19.7 Interest-bearing liabilities 4.3 695.7 674.2 Derivatives 5.4 12.3 8.4 Deferred tax liabilities 2.2 32.2 14.2 Provisions 3.7 30.2 25.6
Total non-current liabilities 798.9 742.1
Total liabilities 1,632.3 1,495.0
NET ASSETS 1,497.6 1,442.0
EQUITYContributed equity 4.4.1 513.1 513.8 Treasury shares 4.4.1 (31.3) (11.1)Reserves 4.4.2 136.8 127.2 Retained earnings 4.4.3 879.0 812.1
TOTAL EQUITY 1,497.6 1,442.0
The above Statement of Financial Position should be read in conjunction with the accompanying notes.
STATEMENT OF FINANCIAL POSITION
As at 30 June 2016
ORORA LIMITED ANNUAL REPORT 2016 57
For
per
sona
l use
onl
y
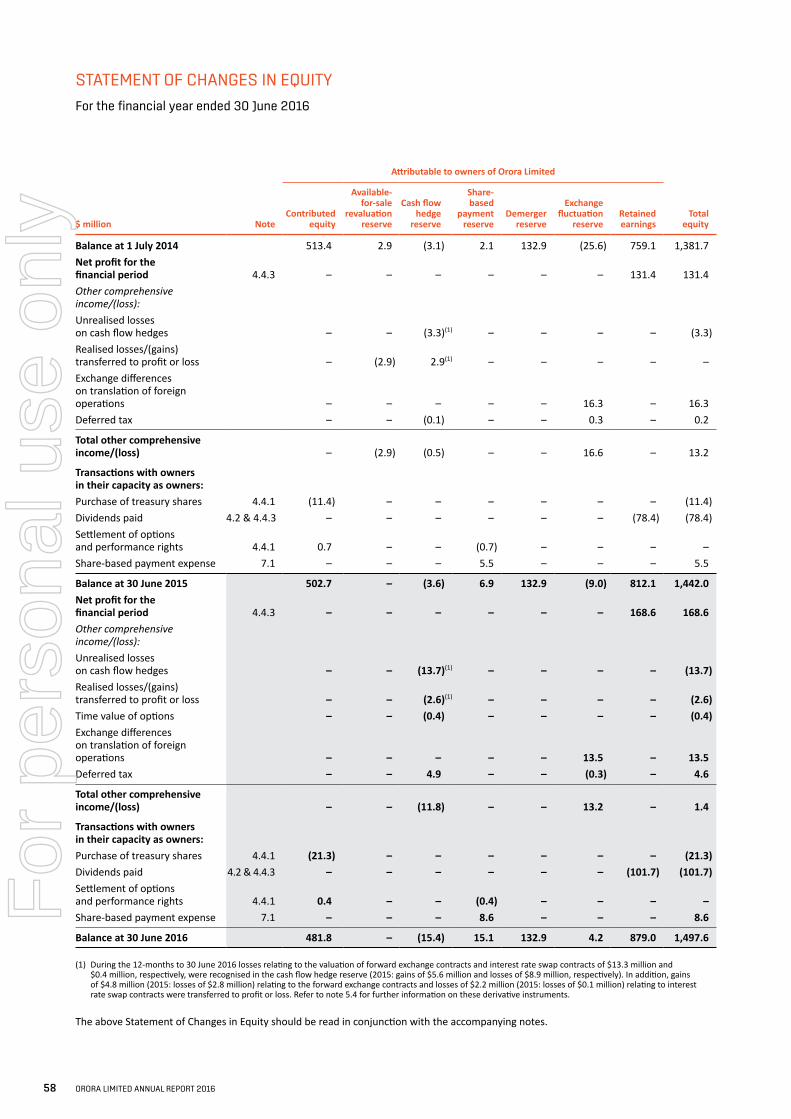
$ million Note
Attributable to owners of Orora Limited
Total equity
Contributed equity
Available-for-sale
revaluation reserve
Cash flow hedge
reserve
Share-based
payment reserve
Demerger reserve
Exchange fluctuation
reserveRetained earnings
Balance at 1 July 2014 513.4 2.9 (3.1) 2.1 132.9 (25.6) 759.1 1,381.7 Net profit for the financial period 4.4.3 – – – – – – 131.4 131.4 Other comprehensive income/(loss):Unrealised losses on cash flow hedges – – (3.3)(1) – – – – (3.3)Realised losses/(gains) transferred to profit or loss – (2.9) 2.9(1) – – – – – Exchange differences on translation of foreign operations – – – – – 16.3 – 16.3 Deferred tax – – (0.1) – – 0.3 – 0.2
Total other comprehensive income/(loss) – (2.9) (0.5) – – 16.6 – 13.2
Transactions with owners in their capacity as owners:Purchase of treasury shares 4.4.1 (11.4) – – – – – – (11.4)Dividends paid 4.2 & 4.4.3 – – – – – – (78.4) (78.4)Settlement of options and performance rights 4.4.1 0.7 – – (0.7) – – – – Share-based payment expense 7.1 – – – 5.5 – – – 5.5
Balance at 30 June 2015 502.7 – (3.6) 6.9 132.9 (9.0) 812.1 1,442.0Net profit for the financial period 4.4.3 – – – – – – 168.6 168.6 Other comprehensive income/(loss):Unrealised losses on cash flow hedges – – (13.7)(1) – – – – (13.7)Realised losses/(gains) transferred to profit or loss – – (2.6)(1) – – – – (2.6)Time value of options – – (0.4) – – – – (0.4)Exchange differences on translation of foreign operations – – – – – 13.5 – 13.5 Deferred tax – – 4.9 – – (0.3) – 4.6
Total other comprehensive income/(loss) – – (11.8) – – 13.2 – 1.4
Transactions with owners in their capacity as owners:Purchase of treasury shares 4.4.1 (21.3) – – – – – – (21.3)Dividends paid 4.2 & 4.4.3 – – – – – – (101.7) (101.7)Settlement of options and performance rights 4.4.1 0.4 – – (0.4) – – – – Share-based payment expense 7.1 – – – 8.6 – – – 8.6
Balance at 30 June 2016 481.8 – (15.4) 15.1 132.9 4.2 879.0 1,497.6
(1) During the 12-months to 30 June 2016 losses relating to the valuation of forward exchange contracts and interest rate swap contracts of $13.3 million and $0.4 million, respectively, were recognised in the cash flow hedge reserve (2015: gains of $5.6 million and losses of $8.9 million, respectively). In addition, gains of $4.8 million (2015: losses of $2.8 million) relating to the forward exchange contracts and losses of $2.2 million (2015: losses of $0.1 million) relating to interest rate swap contracts were transferred to profit or loss. Refer to note 5.4 for further information on these derivative instruments.
The above Statement of Changes in Equity should be read in conjunction with the accompanying notes.
STATEMENT OF CHANGES IN EQUITY
For the financial year ended 30 June 2016
58 ORORA LIMITED ANNUAL REPORT 2016
For
per
sona
l use
onl
y
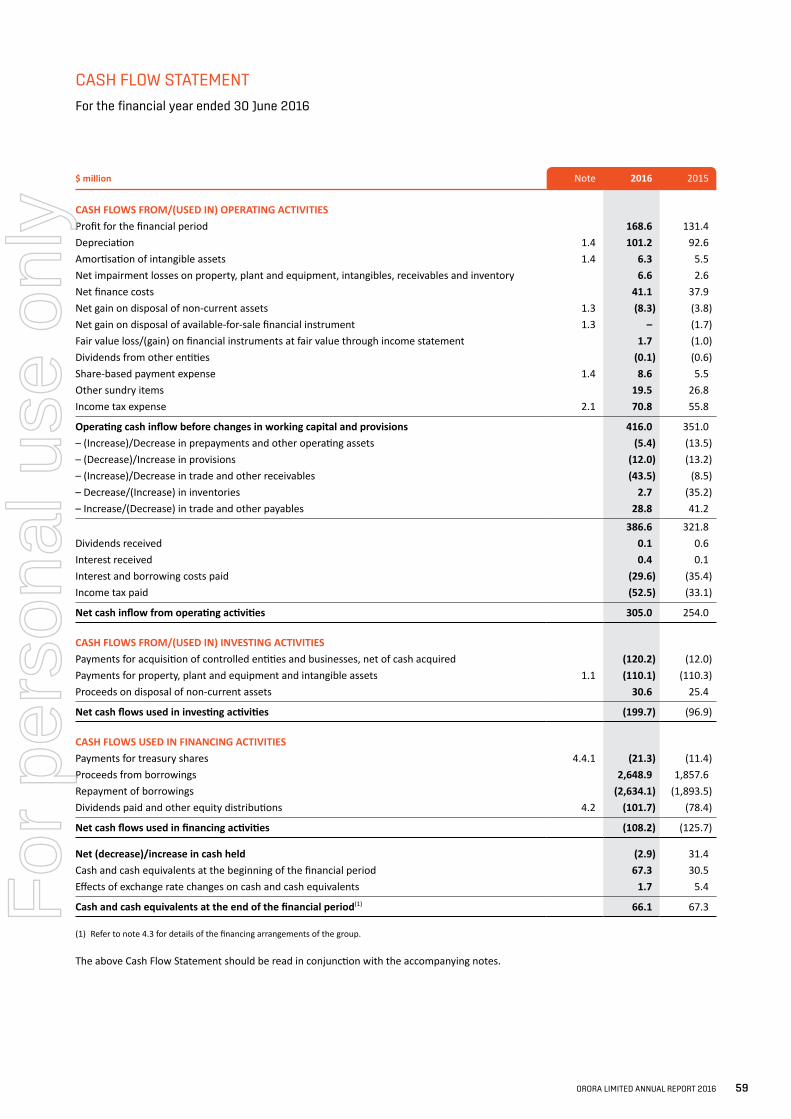
$ million Note 2016 2015
CASH FLOWS FROM/(USED IN) OPERATING ACTIVITIESProfit for the financial period 168.6 131.4 Depreciation 1.4 101.2 92.6 Amortisation of intangible assets 1.4 6.3 5.5 Net impairment losses on property, plant and equipment, intangibles, receivables and inventory 6.6 2.6 Net finance costs 41.1 37.9 Net gain on disposal of non-current assets 1.3 (8.3) (3.8)Net gain on disposal of available-for-sale financial instrument 1.3 – (1.7)Fair value loss/(gain) on financial instruments at fair value through income statement 1.7 (1.0)Dividends from other entities (0.1) (0.6)Share-based payment expense 1.4 8.6 5.5 Other sundry items 19.5 26.8 Income tax expense 2.1 70.8 55.8
Operating cash inflow before changes in working capital and provisions 416.0 351.0 – (Increase)/Decrease in prepayments and other operating assets (5.4) (13.5)– (Decrease)/Increase in provisions (12.0) (13.2)– (Increase)/Decrease in trade and other receivables (43.5) (8.5)– Decrease/(Increase) in inventories 2.7 (35.2)– Increase/(Decrease) in trade and other payables 28.8 41.2
386.6 321.8 Dividends received 0.1 0.6 Interest received 0.4 0.1 Interest and borrowing costs paid (29.6) (35.4)Income tax paid (52.5) (33.1)
Net cash inflow from operating activities 305.0 254.0
CASH FLOWS FROM/(USED IN) INVESTING ACTIVITIESPayments for acquisition of controlled entities and businesses, net of cash acquired (120.2) (12.0)Payments for property, plant and equipment and intangible assets 1.1 (110.1) (110.3)Proceeds on disposal of non-current assets 30.6 25.4
Net cash flows used in investing activities (199.7) (96.9)
CASH FLOWS USED IN FINANCING ACTIVITIESPayments for treasury shares 4.4.1 (21.3) (11.4)Proceeds from borrowings 2,648.9 1,857.6 Repayment of borrowings (2,634.1) (1,893.5)Dividends paid and other equity distributions 4.2 (101.7) (78.4)
Net cash flows used in financing activities (108.2) (125.7)
Net (decrease)/increase in cash held (2.9) 31.4 Cash and cash equivalents at the beginning of the financial period 67.3 30.5 Effects of exchange rate changes on cash and cash equivalents 1.7 5.4
Cash and cash equivalents at the end of the financial period(1) 66.1 67.3
(1) Refer to note 4.3 for details of the financing arrangements of the group.
The above Cash Flow Statement should be read in conjunction with the accompanying notes.
CASH FLOW STATEMENT
For the financial year ended 30 June 2016
ORORA LIMITED ANNUAL REPORT 2016 59
For
per
sona
l use
onl
y

NOTES TO THE FINANCIAL STATEMENTS
For the financial year ended 30 June 2016
About this reportOrora Limited (the Company) is a for-profit entity for the purposes of preparing this financial report and is domiciled in Australia. The Company and its subsidiaries (collectively referred to as the Group) are primarily involved in the manufacture and supply of packaging products and services to grocery, fast-moving consumer goods and industrial markets.
This general purpose financial report for the Group for the year ended 30 June 2016 was authorised for issue in accordance with a resolution of the Directors on 15 August 2016. The Directors have the power to amend and reissue the financial report.
This financial report is a general purpose financial report which:• has been prepared in accordance with Australian Accounting
Standards (AASBs), including Australian Accounting Interpretations adopted by the AASB, and the Corporations Act 2001. The financial report of the Group also complies with International Financial Reporting Standards (IFRSs) and Interpretations as issued by the International Accounting Standards Board (IASB);
• has been prepared under the historical cost basis except for financial instruments which have been measured at fair value. Non-derivative financial instruments are measured at fair value through the income statement;
• is presented in Australian dollars with values rounded to the nearest $100,000 unless otherwise stated, in accordance with the ASIC Corporations (Rounding in Financial/Directors’ Reports) Instrument 2016/191;
• presents reclassified comparative information where required for consistency with the current period presentation;
• adopts all new and amended Accounting Standards and Interpretations issued by the AASB that are relevant to the operations of the Group and effective for reporting periods beginning on or after 1 July 2015;
• does not early adopt any Accounting Standards and Interpretations that have been issued or amended but are not yet effective, with the exception of AASB 9 Financial Instruments (December 2014), including consequential amendments to other standards, which was adopted on 1 July 2015. Refer to note 7.8 for further details; and
• has applied the Group accounting policies consistently to all periods presented.
Key judgements and estimates
The preparation of the financial statements requires management to exercise judgement in applying the Group’s accounting policies. It also requires the use of estimates and assumptions that affect the reported amounts of assets, liabilities, income and expenses.
The areas involving a higher degree of judgement or complexity are set out below and in more detail in the related notes:
Page
67 Note 2 Income tax73 Note 3.5 Property, plant and equipment74 Note 3.6 Intangible assets76 Note 3.7 Provisions78 Note 3.8 Impairment of non-financial assets90 Note 5.4 Hedging instruments97 Note 7.1 Share-based compensation100 Note 7.3 Commitments and contingent liabilities
Basis of consolidationThe consolidated financial statements comprise the financial statements of the Company and its controlled entities. Details of the controlled entities (subsidiaries) of the Company are contained in note 6.1.
The financial statements of subsidiaries are included in the consolidated financial statements from the date that the Group obtains control until the date that control ceases. The subsidiary financial statements are prepared for the same reporting period as the parent company, using consistent accounting policies and all balances and transactions between entities included within the Group are eliminated.
The acquisition of subsidiaries is accounted for using the acquisition method of accounting when control is obtained by the Group.
Foreign currencyItems included in the financial statements of each of the entities included within the Group are measured using the currency of the economic environment in which the entity primarily generates and expends cash (the ‘functional currency’). These financial statements are presented in Australian dollars, which is the functional and reporting currency of the Company, Orora Limited.
Transactions in foreign currencies are initially recorded in the functional currency of the entity using the exchange rate prevailing at the date of the transaction. Monetary assets and liabilities denominated in foreign currencies are translated at the rate of exchange ruling at the balance sheet date. Foreign exchange gains and losses arising from the translation of the monetary assets and liabilities, or from the settlement of foreign currency transactions, are recognised in the income statement, except when deferred in equity as qualifying cash flow hedges or net investment hedges. The amounts deferred in equity in respect of cash flow hedges are recognised in the income statement when the hedged item affects profit or loss and for net investment hedges when the investment is disposed of.
As at the reporting date, the assets and liabilities of entities within the Group that have a functional currency different from the presentation currency, are translated into Australian dollars at the rate of exchange at the balance sheet date and the income statements are translated at the average exchange rate for the year. The exchange differences arising on the balance sheet translation are taken directly to a separate component of equity in the Exchange Fluctuation Reserve.
Other accounting policiesSignificant and other accounting policies that summarise the measurement basis used and are relevant to an understanding of the financial statements are provided throughout the notes to the financial statements.
60 ORORA LIMITED ANNUAL REPORT 2016
For
per
sona
l use
onl
y
The notes to the financial statementsThe following notes include information which is material and relevant to the operations, financial position and performance of the Group. Information is considered material and relevant due to its size or nature or the information:• is important for understanding the Group’s current period results;• provides an explanation of significant changes in the Group’s
business – for example, business acquisitions; or• it relates to an aspect of the Group’s operations that are
important to its future performance.
The notes are organised into the following sections:• Results for the year – provides details on the results and
performance of the Group for the year;• Income tax – provides information on the Group’s tax position
and the current and deferred tax charges or credits in the year;• Assets and liabilities – provides details of the assets used to
generate the Group’s trading performance and the liabilities incurred as a result;
• Capital structure and financing – outlines how the Group manages its capital structure and related financing activities;
• Financial risk management – provides information on how the Group manages financial risk exposures associated with holding financial instruments;
• Group structure – explains the characteristics of and changes within the group structure during the year;
• Other – provides additional financial information required by accounting standards and the Corporates Act 2001, including details of the Group’s employee reward and recognition programs and unrecognised items.
Current period highlights
Dividend
During the financial year, the Group paid a 30% franked dividend of $101.7 million being 8.5 cents per ordinary share, representing payment of the FY15 final dividend of 4.0 cents and the FY16 interim dividend of 4.5 cents.
Since 30 June 2016, the Directors have determined a final dividend for FY16 of $60.3 million, 30% franked, of 5.0 cents per ordinary share. Refer note 4.2 for further details.
Acquisitions
IntegraColor LLCOn 1 March 2016, the Group acquired 100% of the issued share capital of IntegraColor LLC (IntegraColor). The initial consideration of USD77.0 million ($100.4 million) includes a deferred payment of USD7.0 million ($9.2 million) payable in two instalments over the next eighteen months.
IntegraColor is a provider of point of purchase retail display solutions and other visual communication services for customers across consumer (food and beverage), healthcare/education and horticulture industries. The operations are based in Dallas, Texas, servicing customers across North America.
As at 30 June 2016, the acquisition accounting for IntegraColor has been provisionally determined as the post-close adjustment process remains in progress. Refer to note 6.2 for additional information on the business acquisition.
JakaitOn 1 September 2015, the Group acquired the assets and business of Jakait, a supplier of packaging, logistics and label products to the greenhouse produce sector based in Ontario, Canada. The initial consideration was CAD16.5 million ($17.7 million) with an additional returns based consideration, of up to CAD5.5 million ($5.9 million), payable over the next five years. Goodwill of $15.7 million has been recognised as a result of the acquisition.
Funding activities
During the year the Group successfully completed a US Private Placement of notes issued by its wholly-owned US subsidiary, raising USD250.0 million, of which USD100.0 million matures in July 2023, and USD150.0 million in July 2025. In addition, the Group also secured:• a USD200.0 million five-year USD denominated revolving facility
maturing in April 2021; and• two bilateral agreements for $50.0 million maturing in April 2018.
As a result of these refinancing activities the Group reduced the revolving multicurrency facility to $400.0 million and extended the maturity of the facility from December 2018 to December 2019.
Refer to note 4.3 for further details of the Group’s debt profile.
Australian land sale
On 20 July 2015, the Group reached an agreement to sell the former cartonboard mill site in Petrie, Queensland, Australia for total consideration of $50.5 million. The Group received $20.0 million on the exchange of contracts and the balance of the proceeds will be paid as decommissioning of the site progresses over the next two years. The profit before tax on the sale of $8.4 million (profit after tax $5.9 million) has been recognised in the period to 30 June 2016.
ORORA LIMITED ANNUAL REPORT 2016 61
For
per
sona
l use
onl
y
NOTES TO THE FINANCIAL STATEMENTS
For the financial year ended 30 June 2016
Section 1: Results for the year
This section focuses on the results and performance of the Group. On the following pages you will find disclosures explaining the Group’s results for the year, segmental information and earnings per share. Earnings before interest and related income tax expense (EBIT) is the key profit indicator for the segments, reflecting the way the business is managed and how the Directors assess the performance of the Group.
This section also analyses the Group’s profit before tax by reference to the activities performed by the Group and an analysis of key operating costs.
Financial highlights of the Group
• Sales revenue of $3,849.8 million, up 13.0%
• EBIT of $280.5 million, up 24.6%
• Operating free cash flow of $329.1 million, up 36.2%
• Earnings per share of 14.1 cents, up 29.4%
1.1 Segment results
The Group’s operating segments are organised and managed according to their geographical location. Each segment represents a strategic business that offers different products and operates in different industries and markets. The Corporate Executive Team (the chief operating decision-makers) monitor the operating results of the businesses separately for the purpose of making decisions about resource allocation and performance assessment.
The following summary describes the operations of each reportable segment.
Orora AustralasiaThis segment focuses on the manufacture of fibre and beverage packaging products within Australia and New Zealand. The products manufactured by this segment include glass bottles, beverage cans, wines closures, corrugated boxes, cartons and sacks, and the manufacture of recycled paper.
Orora North AmericaThis segment, predominately located in North America, purchases, warehouses, sells and delivers a wide range of packaging and other related materials. The business also includes integrated corrugated sheet and box manufacturing and equipment sales capabilities and the recently acquired point of purchase retail display solutions and other visual communication services provided by the IntegraColor business (refer note 6.2).
OtherThis segment includes the Corporate function of the Group.
Accounting policiesSegment performance is evaluated based on earnings before interest and related income tax expense (EBIT). This measure excludes the effects of individually significant non-recurring gains/losses whilst including items directly attributable to the segment as well as those that can be allocated on a reasonable basis.
Interest income and expenditure and other finance costs are not allocated to the segments, as this type of activity is managed at the Group level. Transfer prices between segments are priced on an ‘arms-length’ basis, in a manner similar to transactions with third parties, and are eliminated on consolidation.
IN THIS SECTION
62 ORORA LIMITED ANNUAL REPORT 2016
For
per
sona
l use
onl
y
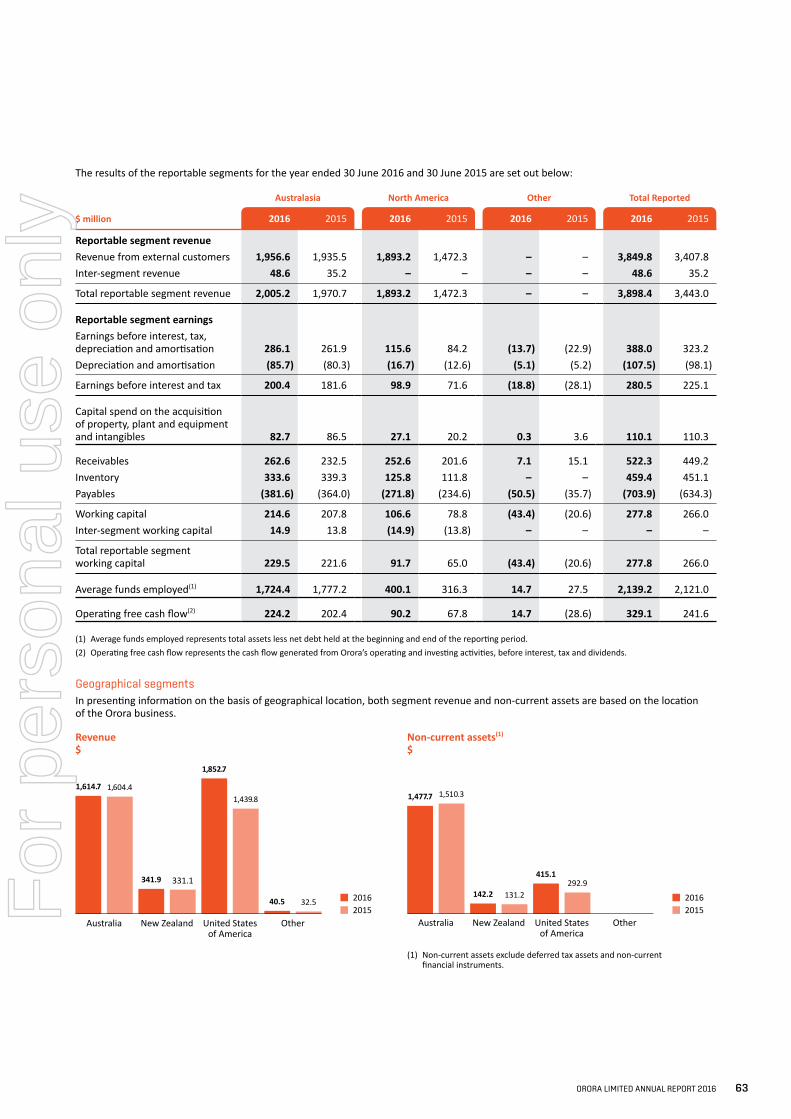
The results of the reportable segments for the year ended 30 June 2016 and 30 June 2015 are set out below:
$ million
Australasia North America Other Total Reported
2016 2015 2016 2015 2016 2015 2016 2015
Reportable segment revenueRevenue from external customers 1,956.6 1,935.5 1,893.2 1,472.3 – – 3,849.8 3,407.8 Inter-segment revenue 48.6 35.2 – – – – 48.6 35.2
Total reportable segment revenue 2,005.2 1,970.7 1,893.2 1,472.3 – – 3,898.4 3,443.0
Reportable segment earningsEarnings before interest, tax, depreciation and amortisation 286.1 261.9 115.6 84.2 (13.7) (22.9) 388.0 323.2 Depreciation and amortisation (85.7) (80.3) (16.7) (12.6) (5.1) (5.2) (107.5) (98.1)
Earnings before interest and tax 200.4 181.6 98.9 71.6 (18.8) (28.1) 280.5 225.1
Capital spend on the acquisition of property, plant and equipment and intangibles 82.7 86.5 27.1 20.2 0.3 3.6 110.1 110.3
Receivables 262.6 232.5 252.6 201.6 7.1 15.1 522.3 449.2 Inventory 333.6 339.3 125.8 111.8 – – 459.4 451.1 Payables (381.6) (364.0) (271.8) (234.6) (50.5) (35.7) (703.9) (634.3)
Working capital 214.6 207.8 106.6 78.8 (43.4) (20.6) 277.8 266.0 Inter-segment working capital 14.9 13.8 (14.9) (13.8) – – – –
Total reportable segment working capital 229.5 221.6 91.7 65.0 (43.4) (20.6) 277.8 266.0
Average funds employed(1) 1,724.4 1,777.2 400.1 316.3 14.7 27.5 2,139.2 2,121.0
Operating free cash flow(2) 224.2 202.4 90.2 67.8 14.7 (28.6) 329.1 241.6
(1) Average funds employed represents total assets less net debt held at the beginning and end of the reporting period.(2) Operating free cash flow represents the cash flow generated from Orora’s operating and investing activities, before interest, tax and dividends.
Geographical segmentsIn presenting information on the basis of geographical location, both segment revenue and non-current assets are based on the location of the Orora business.
Revenue Non-current assets(1)
$ $
Revenue$
1,614.7 1,604.4
341.9 331.1
1,852.7
1,439.8
40.5
Australia New Zealand United States of America
Other
32.5 20162015
Non-current assets(1)
$
1,477.7 1,510.3
142.2 131.2
415.1292.9
Australia New Zealand United States of America
Other
20162015
(1) Non-current assets exclude deferred tax assets and non-current financial instruments.
ORORA LIMITED ANNUAL REPORT 2016 63
For
per
sona
l use
onl
y
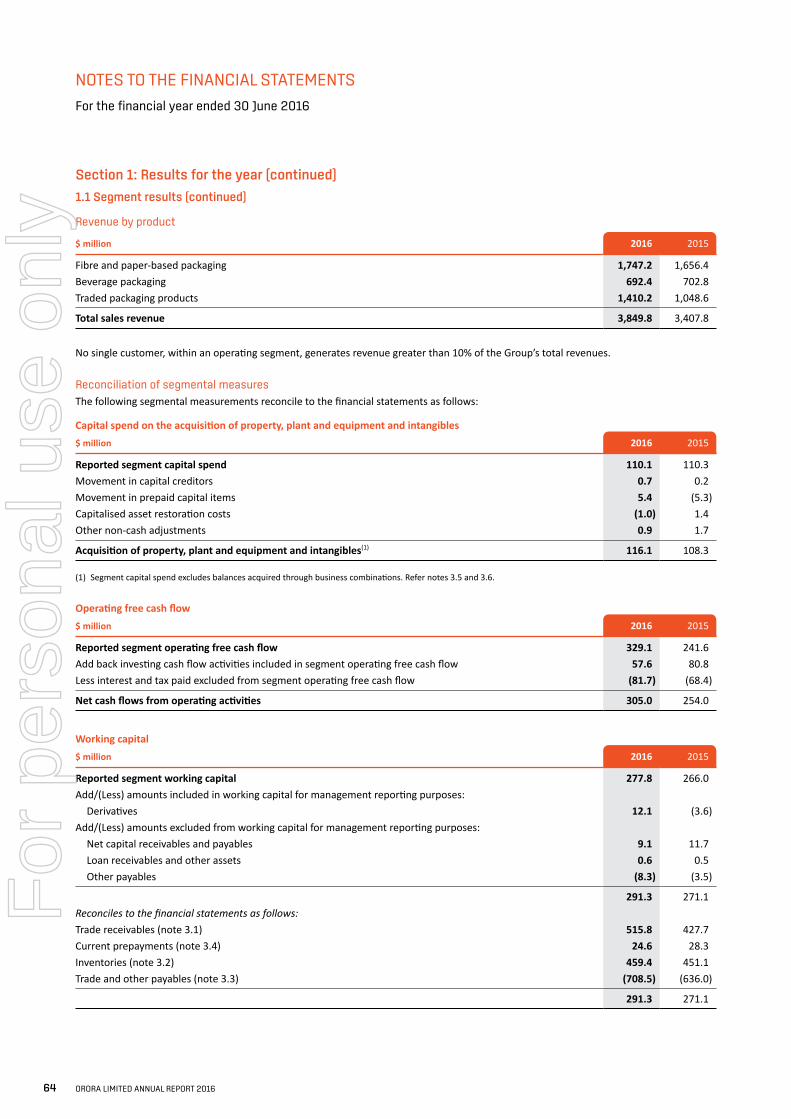
NOTES TO THE FINANCIAL STATEMENTS
For the financial year ended 30 June 2016
Section 1: Results for the year (continued)
1.1 Segment results (continued)
Revenue by product
$ million 2016 2015
Fibre and paper-based packaging 1,747.2 1,656.4 Beverage packaging 692.4 702.8 Traded packaging products 1,410.2 1,048.6
Total sales revenue 3,849.8 3,407.8
No single customer, within an operating segment, generates revenue greater than 10% of the Group’s total revenues.
Reconciliation of segmental measuresThe following segmental measurements reconcile to the financial statements as follows:
Capital spend on the acquisition of property, plant and equipment and intangibles$ million 2016 2015
Reported segment capital spend 110.1 110.3 Movement in capital creditors 0.7 0.2 Movement in prepaid capital items 5.4 (5.3)Capitalised asset restoration costs (1.0) 1.4Other non-cash adjustments 0.9 1.7
Acquisition of property, plant and equipment and intangibles(1) 116.1 108.3
(1) Segment capital spend excludes balances acquired through business combinations. Refer notes 3.5 and 3.6.
Operating free cash flow$ million 2016 2015
Reported segment operating free cash flow 329.1 241.6 Add back investing cash flow activities included in segment operating free cash flow 57.6 80.8 Less interest and tax paid excluded from segment operating free cash flow (81.7) (68.4)
Net cash flows from operating activities 305.0 254.0
Working capital$ million 2016 2015
Reported segment working capital 277.8 266.0 Add/(Less) amounts included in working capital for management reporting purposes: Derivatives 12.1 (3.6)Add/(Less) amounts excluded from working capital for management reporting purposes: Net capital receivables and payables 9.1 11.7 Loan receivables and other assets 0.6 0.5 Other payables (8.3) (3.5)
291.3 271.1 Reconciles to the financial statements as follows:Trade receivables (note 3.1) 515.8 427.7 Current prepayments (note 3.4) 24.6 28.3 Inventories (note 3.2) 459.4 451.1 Trade and other payables (note 3.3) (708.5) (636.0)
291.3 271.1
64 ORORA LIMITED ANNUAL REPORT 2016
For
per
sona
l use
onl
y
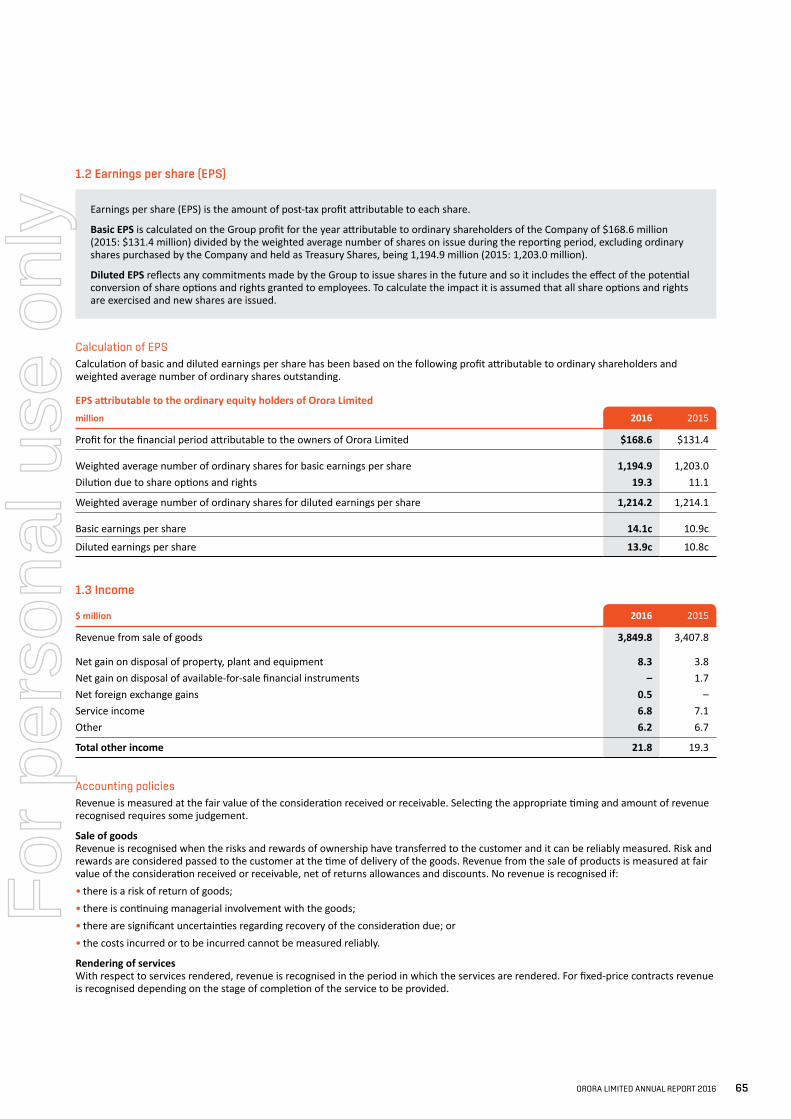
1.2 Earnings per share (EPS)
Earnings per share (EPS) is the amount of post-tax profit attributable to each share.
Basic EPS is calculated on the Group profit for the year attributable to ordinary shareholders of the Company of $168.6 million (2015: $131.4 million) divided by the weighted average number of shares on issue during the reporting period, excluding ordinary shares purchased by the Company and held as Treasury Shares, being 1,194.9 million (2015: 1,203.0 million).
Diluted EPS reflects any commitments made by the Group to issue shares in the future and so it includes the effect of the potential conversion of share options and rights granted to employees. To calculate the impact it is assumed that all share options and rights are exercised and new shares are issued.
Calculation of EPSCalculation of basic and diluted earnings per share has been based on the following profit attributable to ordinary shareholders and weighted average number of ordinary shares outstanding.
EPS attributable to the ordinary equity holders of Orora Limitedmillion 2016 2015
Profit for the financial period attributable to the owners of Orora Limited $168.6 $131.4
Weighted average number of ordinary shares for basic earnings per share 1,194.9 1,203.0 Dilution due to share options and rights 19.3 11.1
Weighted average number of ordinary shares for diluted earnings per share 1,214.2 1,214.1
Basic earnings per share 14.1c 10.9c
Diluted earnings per share 13.9c 10.8c
1.3 Income
$ million 2016 2015
Revenue from sale of goods 3,849.8 3,407.8
Net gain on disposal of property, plant and equipment 8.3 3.8 Net gain on disposal of available-for-sale financial instruments – 1.7 Net foreign exchange gains 0.5 –Service income 6.8 7.1 Other 6.2 6.7
Total other income 21.8 19.3
Accounting policiesRevenue is measured at the fair value of the consideration received or receivable. Selecting the appropriate timing and amount of revenue recognised requires some judgement.
Sale of goodsRevenue is recognised when the risks and rewards of ownership have transferred to the customer and it can be reliably measured. Risk and rewards are considered passed to the customer at the time of delivery of the goods. Revenue from the sale of products is measured at fair value of the consideration received or receivable, net of returns allowances and discounts. No revenue is recognised if:• there is a risk of return of goods;• there is continuing managerial involvement with the goods;• there are significant uncertainties regarding recovery of the consideration due; or• the costs incurred or to be incurred cannot be measured reliably.
Rendering of servicesWith respect to services rendered, revenue is recognised in the period in which the services are rendered. For fixed-price contracts revenue is recognised depending on the stage of completion of the service to be provided.
ORORA LIMITED ANNUAL REPORT 2016 65
For
per
sona
l use
onl
y
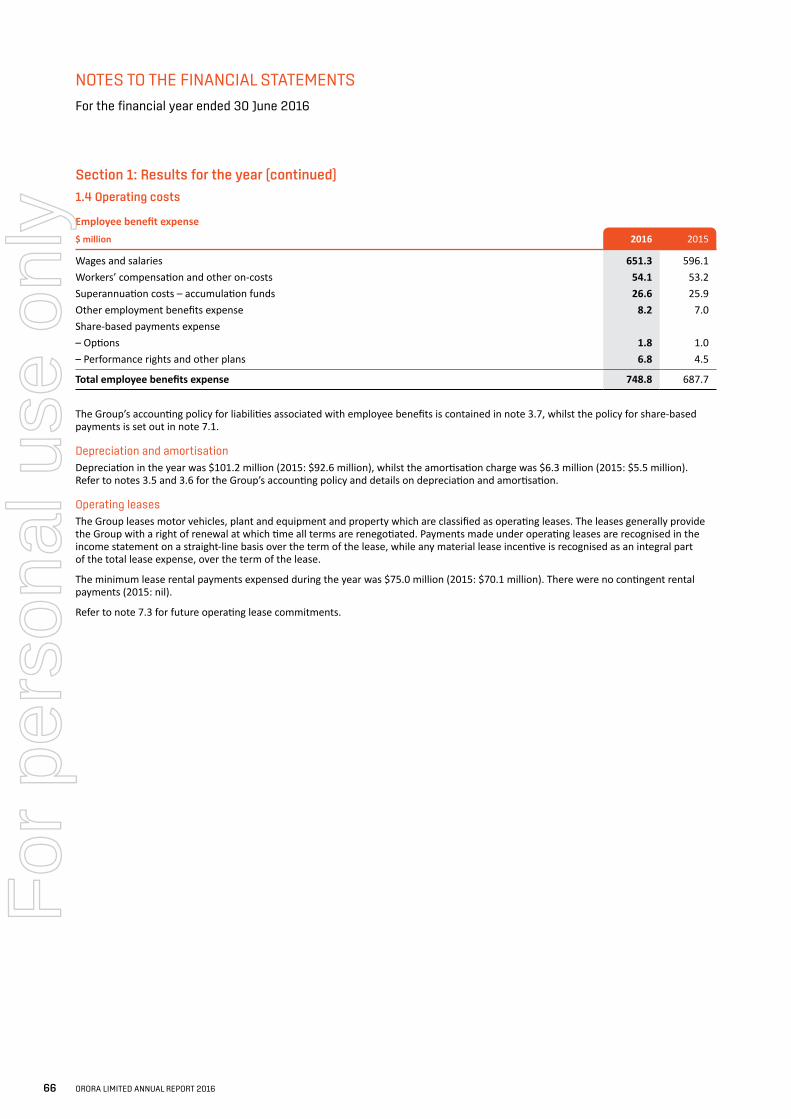
NOTES TO THE FINANCIAL STATEMENTS
For the financial year ended 30 June 2016
Section 1: Results for the year (continued)
1.4 Operating costs
Employee benefit expense$ million 2016 2015
Wages and salaries 651.3 596.1 Workers’ compensation and other on-costs 54.1 53.2 Superannuation costs – accumulation funds 26.6 25.9 Other employment benefits expense 8.2 7.0 Share-based payments expense – Options 1.8 1.0 – Performance rights and other plans 6.8 4.5
Total employee benefits expense 748.8 687.7
The Group’s accounting policy for liabilities associated with employee benefits is contained in note 3.7, whilst the policy for share-based payments is set out in note 7.1.
Depreciation and amortisationDepreciation in the year was $101.2 million (2015: $92.6 million), whilst the amortisation charge was $6.3 million (2015: $5.5 million). Refer to notes 3.5 and 3.6 for the Group’s accounting policy and details on depreciation and amortisation.
Operating leasesThe Group leases motor vehicles, plant and equipment and property which are classified as operating leases. The leases generally provide the Group with a right of renewal at which time all terms are renegotiated. Payments made under operating leases are recognised in the income statement on a straight-line basis over the term of the lease, while any material lease incentive is recognised as an integral part of the total lease expense, over the term of the lease.
The minimum lease rental payments expensed during the year was $75.0 million (2015: $70.1 million). There were no contingent rental payments (2015: nil).
Refer to note 7.3 for future operating lease commitments.
66 ORORA LIMITED ANNUAL REPORT 2016
For
per
sona
l use
onl
y
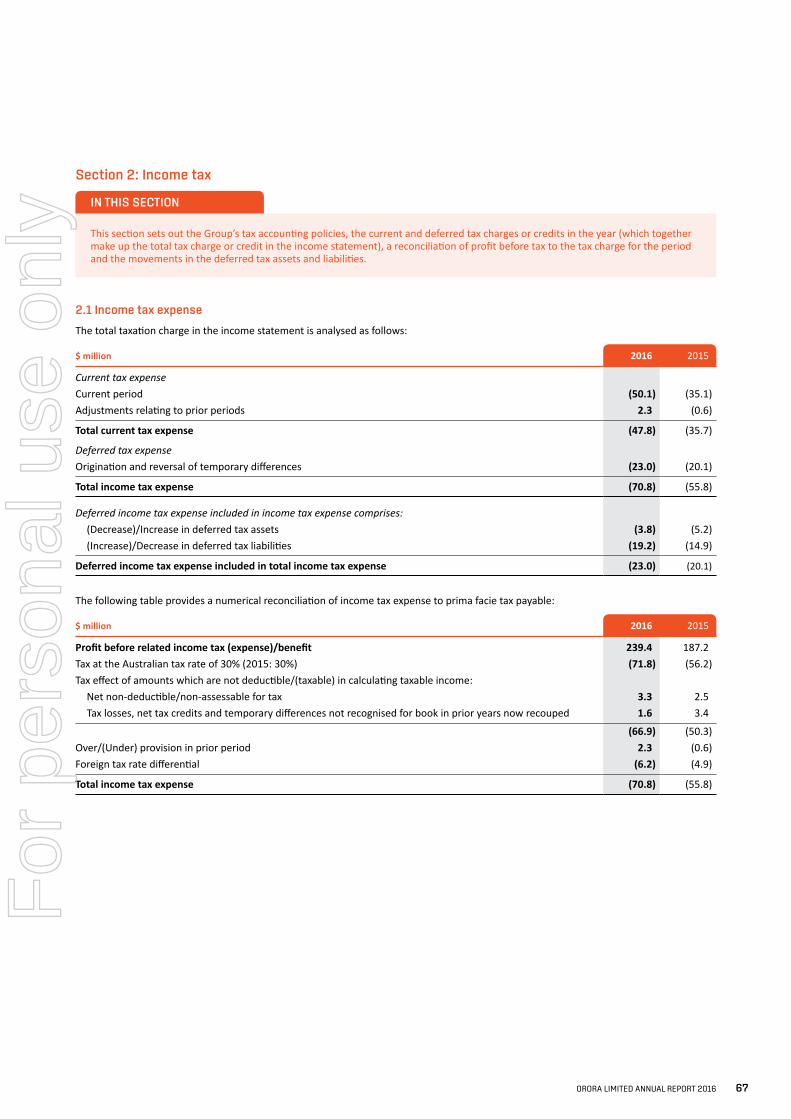
Section 2: Income tax
This section sets out the Group’s tax accounting policies, the current and deferred tax charges or credits in the year (which together make up the total tax charge or credit in the income statement), a reconciliation of profit before tax to the tax charge for the period and the movements in the deferred tax assets and liabilities.
2.1 Income tax expense
The total taxation charge in the income statement is analysed as follows:
$ million 2016 2015
Current tax expenseCurrent period (50.1) (35.1)Adjustments relating to prior periods 2.3 (0.6)
Total current tax expense (47.8) (35.7)
Deferred tax expenseOrigination and reversal of temporary differences (23.0) (20.1)
Total income tax expense (70.8) (55.8)
Deferred income tax expense included in income tax expense comprises: (Decrease)/Increase in deferred tax assets (3.8) (5.2) (Increase)/Decrease in deferred tax liabilities (19.2) (14.9)
Deferred income tax expense included in total income tax expense (23.0) (20.1)
The following table provides a numerical reconciliation of income tax expense to prima facie tax payable:
$ million 2016 2015
Profit before related income tax (expense)/benefit 239.4 187.2 Tax at the Australian tax rate of 30% (2015: 30%) (71.8) (56.2)Tax effect of amounts which are not deductible/(taxable) in calculating taxable income: Net non-deductible/non-assessable for tax 3.3 2.5 Tax losses, net tax credits and temporary differences not recognised for book in prior years now recouped 1.6 3.4
(66.9) (50.3)Over/(Under) provision in prior period 2.3 (0.6)Foreign tax rate differential (6.2) (4.9)
Total income tax expense (70.8) (55.8)
IN THIS SECTION
ORORA LIMITED ANNUAL REPORT 2016 67
For
per
sona
l use
onl
y
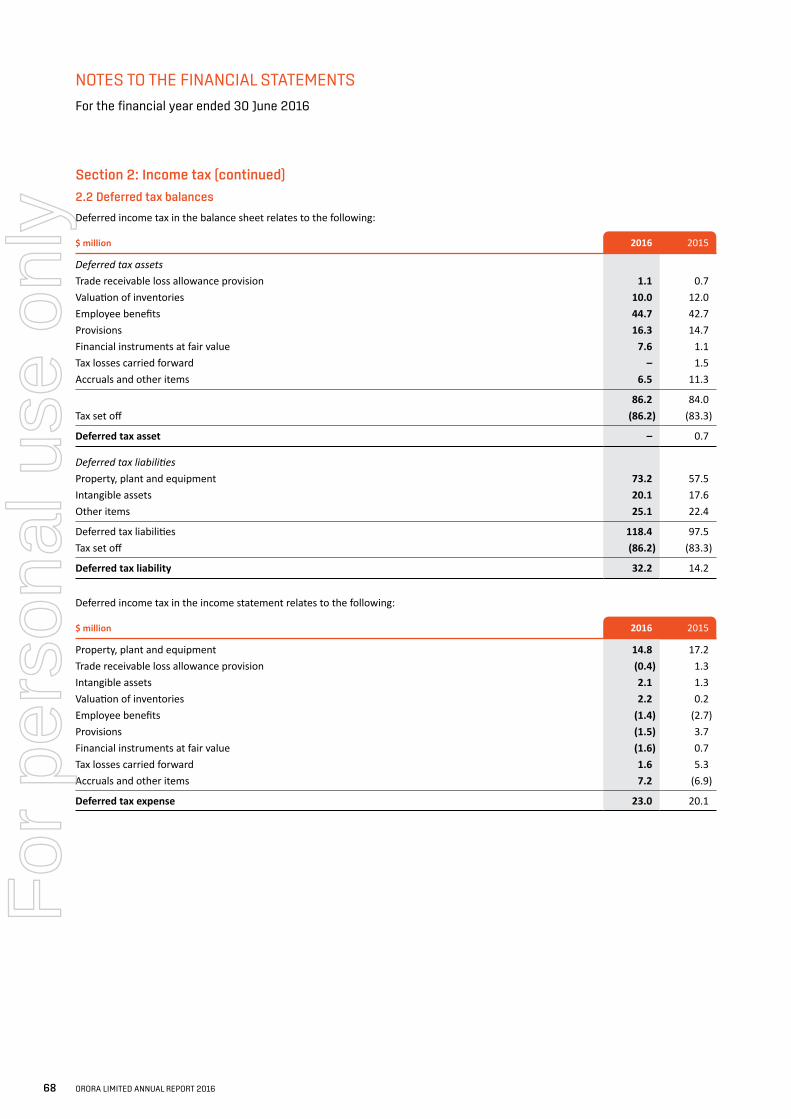
NOTES TO THE FINANCIAL STATEMENTS
For the financial year ended 30 June 2016
Section 2: Income tax (continued)
2.2 Deferred tax balances
Deferred income tax in the balance sheet relates to the following:
$ million 2016 2015
Deferred tax assetsTrade receivable loss allowance provision 1.1 0.7 Valuation of inventories 10.0 12.0 Employee benefits 44.7 42.7 Provisions 16.3 14.7 Financial instruments at fair value 7.6 1.1 Tax losses carried forward – 1.5 Accruals and other items 6.5 11.3
86.2 84.0 Tax set off (86.2) (83.3)
Deferred tax asset – 0.7
Deferred tax liabilitiesProperty, plant and equipment 73.2 57.5 Intangible assets 20.1 17.6 Other items 25.1 22.4
Deferred tax liabilities 118.4 97.5 Tax set off (86.2) (83.3)
Deferred tax liability 32.2 14.2
Deferred income tax in the income statement relates to the following:
$ million 2016 2015
Property, plant and equipment 14.8 17.2 Trade receivable loss allowance provision (0.4) 1.3 Intangible assets 2.1 1.3 Valuation of inventories 2.2 0.2 Employee benefits (1.4) (2.7)Provisions (1.5) 3.7 Financial instruments at fair value (1.6) 0.7 Tax losses carried forward 1.6 5.3 Accruals and other items 7.2 (6.9)
Deferred tax expense 23.0 20.1
68 ORORA LIMITED ANNUAL REPORT 2016
For
per
sona
l use
onl
y
Accounting policiesIncome tax expense comprises current and deferred tax. Income tax expense is recognised in profit or loss except to the extent that it relates to items recognised directly in equity or in other comprehensive income, in which case it is recognised directly in equity or in other comprehensive income respectively.
Current TaxCurrent tax is the expected tax payable on taxable income for the period, using tax rates enacted or substantively enacted at the reporting date, and any adjustment to tax payable in respect of previous periods. Current tax is also adjusted by changes in deferred tax assets and liabilities attributable to temporary differences between the tax bases of assets and liabilities and their carrying amounts in the financial statements, and by the availability of unused tax losses.
Current tax assets and liabilities are offset where the Group has a legally enforceable right to offset and intends either to settle on a net basis, or to realise the asset and settle the liability simultaneously.
Deferred TaxDeferred tax is recognised using the balance sheet method in which temporary differences are calculated based on the carrying amounts of assets and liabilities for financial reporting purposes and the amounts used for taxation purposes. Deferred tax is not recognised for:• taxable temporary differences arising on the initial recognition of goodwill;• taxable differences on the initial recognition of assets or liabilities in a transaction that is not a business combination and that affects
neither accounting nor taxable profit; and• temporary differences relating to investments in subsidiaries to the extent that the Group is able to control the timing of the reversal
of the temporary difference and it is probable that they will not reverse in the foreseeable future.
Deferred tax is measured at the tax rates that are expected to be applied when the temporary difference reverses, that is, when the asset is realised or the liability is settled, based on the laws that have been enacted or substantively enacted at the reporting date.
Deferred tax assets are recognised for deductible temporary differences and unused tax losses only to the extent that it is probable that future taxable profits will be available against which the assets can be utilised. Deferred tax assets are reviewed at each reporting date and are reduced to the extent that it is no longer probable that the related tax benefit will be realised.
Offsetting deferred tax balancesDeferred tax assets and liabilities are offset when there is a legally enforceable right to offset and when the deferred tax balances relate to taxes levied by the same tax authority on the same taxable entity, or on different tax entities, but the Group intends to settle current tax liabilities and assets on a net basis or their tax assets and liabilities will be realised simultaneously.
Unrecognised deferred tax assets and liabilitiesDeferred tax liabilities have not been recognised in respect of temporary differences arising as a result of the translation of the financial statements of the Group investments in subsidiaries. The deferred tax liability will only arise in the event of disposal of the subsidiary, and no such disposal is expected in the foreseeable future.
Unremitted earnings of the Group’s international operations are considered to be reinvested indefinitely and relate to the ongoing operations. Upon distribution of any earnings in the form of dividends or otherwise, the Group may be subject to withholding taxes payable to various foreign countries, however, such amounts are not considered to be significant. As the Group controls when the deferred tax liability will be incurred and is satisfied that it will not be incurred in the foreseeable future, the deferred tax liability has not been recognised. There are no unrecognised deferred tax assets.
Key judgements and estimatesThe Group is subject to income taxes in Australia and foreign jurisdictions and as a result the calculation of the Group’s tax charge involves a degree of estimation and judgement in respect of certain items, including assumptions made in respect of the application of tax legislation. There are many transactions and calculations relating to the ordinary course of business for which the ultimate tax determination is uncertain. The Group recognises liabilities for uncertain tax positions based on management’s best estimate of whether additional taxes will be due. Where the final outcome of these matters is different from the amounts that were initially recorded, these differences impact the current and deferred tax provisions in the period in which such determinations are made.
Deferred tax assets are recognised for deductible temporary differences and unused tax losses only if it is probable that future taxable profits are available to utilise those temporary differences and losses, and the tax losses continue to be available having regard to the nature and timing of their origination and compliance with the relevant tax legislation associated with their recoupment. The assumptions regarding the future realisation, and therefore the recognition of deferred tax assets, may change due to future operating performance and other factors.
The assumptions made in respect of the recognised tax balances are subject to risk and uncertainty and there is a possibility that changes in circumstances or differences in opinion will alter outcomes which may impact the amount of deferred tax assets and deferred tax liabilities recognised and the amount of tax losses and timing differences not yet recognised.
ORORA LIMITED ANNUAL REPORT 2016 69
For
per
sona
l use
onl
y
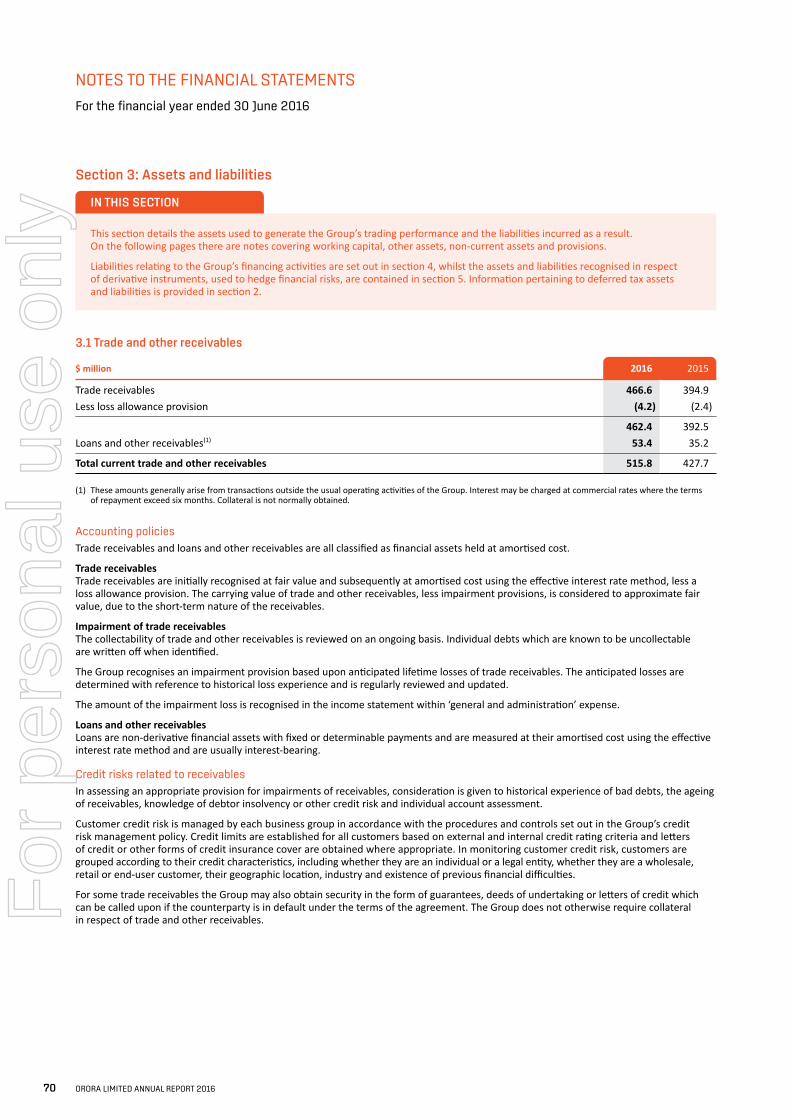
NOTES TO THE FINANCIAL STATEMENTS
For the financial year ended 30 June 2016
Section 3: Assets and liabilities
This section details the assets used to generate the Group’s trading performance and the liabilities incurred as a result. On the following pages there are notes covering working capital, other assets, non-current assets and provisions.
Liabilities relating to the Group’s financing activities are set out in section 4, whilst the assets and liabilities recognised in respect of derivative instruments, used to hedge financial risks, are contained in section 5. Information pertaining to deferred tax assets and liabilities is provided in section 2.
3.1 Trade and other receivables
$ million 2016 2015
Trade receivables 466.6 394.9 Less loss allowance provision (4.2) (2.4)
462.4 392.5 Loans and other receivables(1) 53.4 35.2
Total current trade and other receivables 515.8 427.7
(1) These amounts generally arise from transactions outside the usual operating activities of the Group. Interest may be charged at commercial rates where the terms of repayment exceed six months. Collateral is not normally obtained.
Accounting policiesTrade receivables and loans and other receivables are all classified as financial assets held at amortised cost.
Trade receivablesTrade receivables are initially recognised at fair value and subsequently at amortised cost using the effective interest rate method, less a loss allowance provision. The carrying value of trade and other receivables, less impairment provisions, is considered to approximate fair value, due to the short-term nature of the receivables.
Impairment of trade receivablesThe collectability of trade and other receivables is reviewed on an ongoing basis. Individual debts which are known to be uncollectable are written off when identified.
The Group recognises an impairment provision based upon anticipated lifetime losses of trade receivables. The anticipated losses are determined with reference to historical loss experience and is regularly reviewed and updated.
The amount of the impairment loss is recognised in the income statement within ‘general and administration’ expense.
Loans and other receivablesLoans are non-derivative financial assets with fixed or determinable payments and are measured at their amortised cost using the effective interest rate method and are usually interest-bearing.
Credit risks related to receivablesIn assessing an appropriate provision for impairments of receivables, consideration is given to historical experience of bad debts, the ageing of receivables, knowledge of debtor insolvency or other credit risk and individual account assessment.
Customer credit risk is managed by each business group in accordance with the procedures and controls set out in the Group’s credit risk management policy. Credit limits are established for all customers based on external and internal credit rating criteria and letters of credit or other forms of credit insurance cover are obtained where appropriate. In monitoring customer credit risk, customers are grouped according to their credit characteristics, including whether they are an individual or a legal entity, whether they are a wholesale, retail or end-user customer, their geographic location, industry and existence of previous financial difficulties.
For some trade receivables the Group may also obtain security in the form of guarantees, deeds of undertaking or letters of credit which can be called upon if the counterparty is in default under the terms of the agreement. The Group does not otherwise require collateral in respect of trade and other receivables.
IN THIS SECTION
70 ORORA LIMITED ANNUAL REPORT 2016
For
per
sona
l use
onl
y
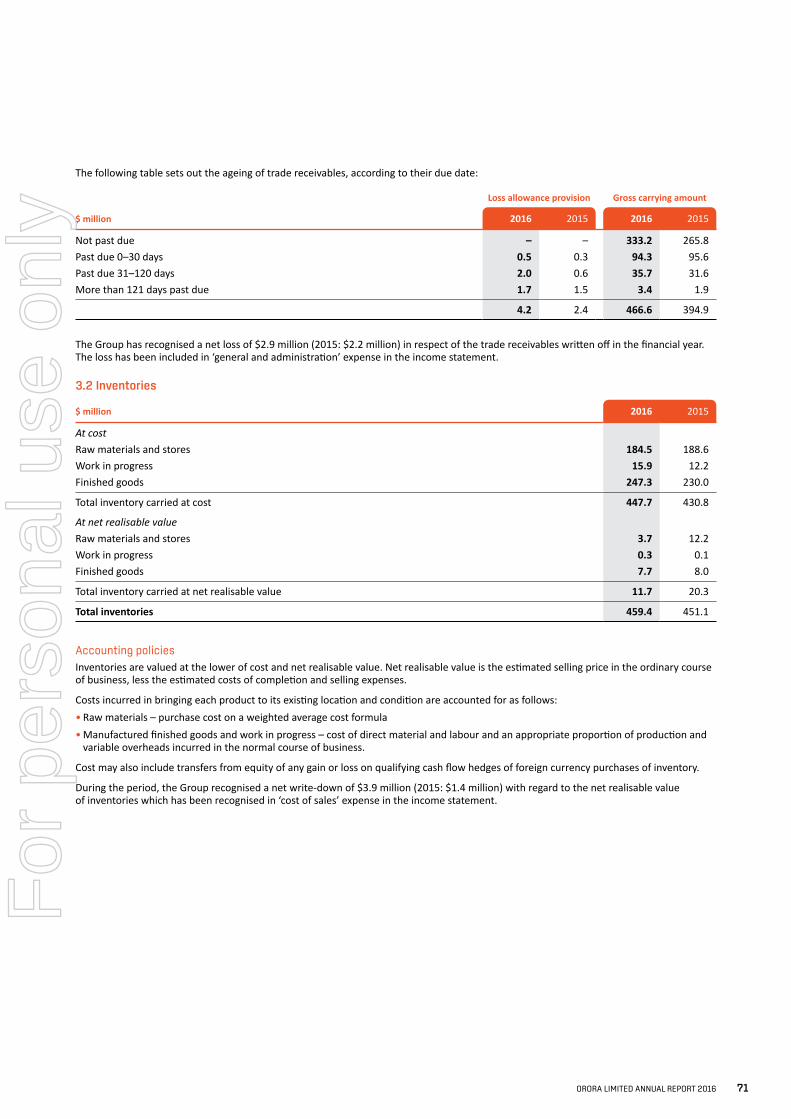
The following table sets out the ageing of trade receivables, according to their due date:
$ million
Loss allowance provision Gross carrying amount
2016 2015 2016 2015
Not past due – – 333.2 265.8 Past due 0–30 days 0.5 0.3 94.3 95.6 Past due 31–120 days 2.0 0.6 35.7 31.6 More than 121 days past due 1.7 1.5 3.4 1.9
4.2 2.4 466.6 394.9
The Group has recognised a net loss of $2.9 million (2015: $2.2 million) in respect of the trade receivables written off in the financial year. The loss has been included in ‘general and administration’ expense in the income statement.
3.2 Inventories
$ million 2016 2015
At costRaw materials and stores 184.5 188.6 Work in progress 15.9 12.2 Finished goods 247.3 230.0
Total inventory carried at cost 447.7 430.8
At net realisable valueRaw materials and stores 3.7 12.2 Work in progress 0.3 0.1 Finished goods 7.7 8.0
Total inventory carried at net realisable value 11.7 20.3
Total inventories 459.4 451.1
Accounting policiesInventories are valued at the lower of cost and net realisable value. Net realisable value is the estimated selling price in the ordinary course of business, less the estimated costs of completion and selling expenses.
Costs incurred in bringing each product to its existing location and condition are accounted for as follows:• Raw materials – purchase cost on a weighted average cost formula• Manufactured finished goods and work in progress – cost of direct material and labour and an appropriate proportion of production and
variable overheads incurred in the normal course of business.
Cost may also include transfers from equity of any gain or loss on qualifying cash flow hedges of foreign currency purchases of inventory.
During the period, the Group recognised a net write-down of $3.9 million (2015: $1.4 million) with regard to the net realisable value of inventories which has been recognised in ‘cost of sales’ expense in the income statement.
ORORA LIMITED ANNUAL REPORT 2016 71
For
per
sona
l use
onl
y
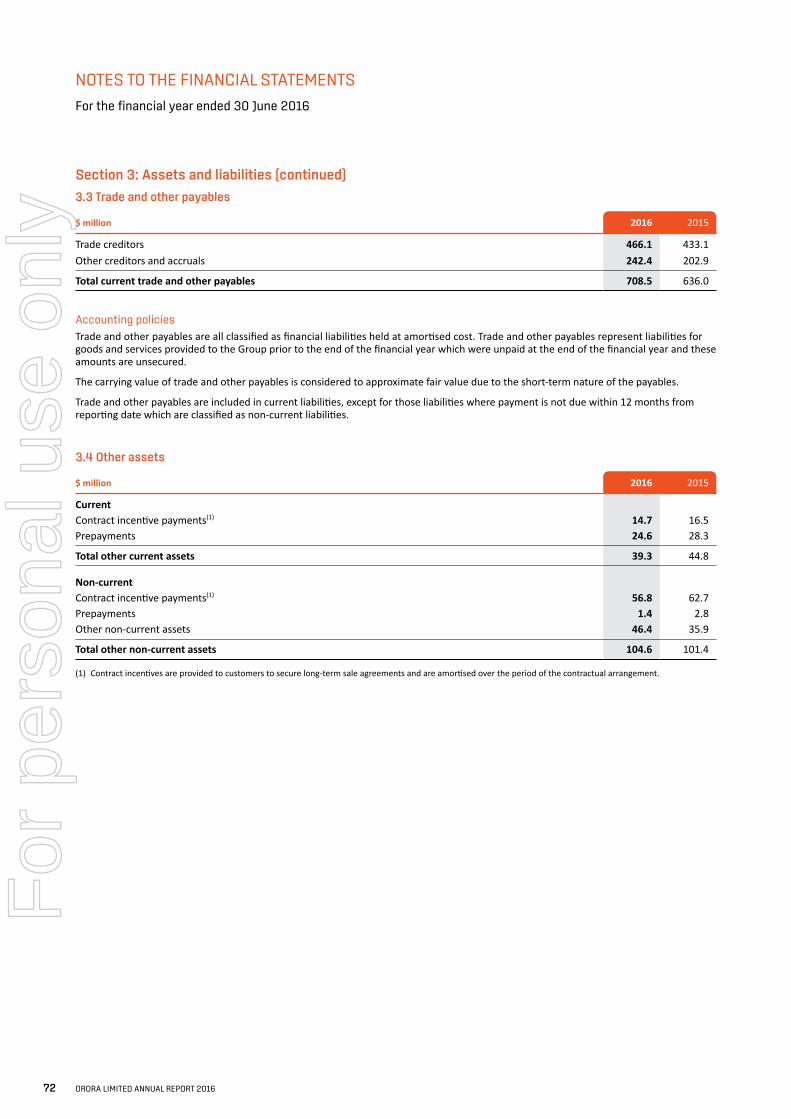
NOTES TO THE FINANCIAL STATEMENTS
For the financial year ended 30 June 2016
Section 3: Assets and liabilities (continued)
3.3 Trade and other payables
$ million 2016 2015
Trade creditors 466.1 433.1 Other creditors and accruals 242.4 202.9
Total current trade and other payables 708.5 636.0
Accounting policiesTrade and other payables are all classified as financial liabilities held at amortised cost. Trade and other payables represent liabilities for goods and services provided to the Group prior to the end of the financial year which were unpaid at the end of the financial year and these amounts are unsecured.
The carrying value of trade and other payables is considered to approximate fair value due to the short-term nature of the payables.
Trade and other payables are included in current liabilities, except for those liabilities where payment is not due within 12 months from reporting date which are classified as non-current liabilities.
3.4 Other assets
$ million 2016 2015
Current Contract incentive payments(1) 14.7 16.5 Prepayments 24.6 28.3
Total other current assets 39.3 44.8
Non-currentContract incentive payments(1) 56.8 62.7 Prepayments 1.4 2.8 Other non-current assets 46.4 35.9
Total other non-current assets 104.6 101.4
(1) Contract incentives are provided to customers to secure long-term sale agreements and are amortised over the period of the contractual arrangement.
72 ORORA LIMITED ANNUAL REPORT 2016
For
per
sona
l use
onl
y
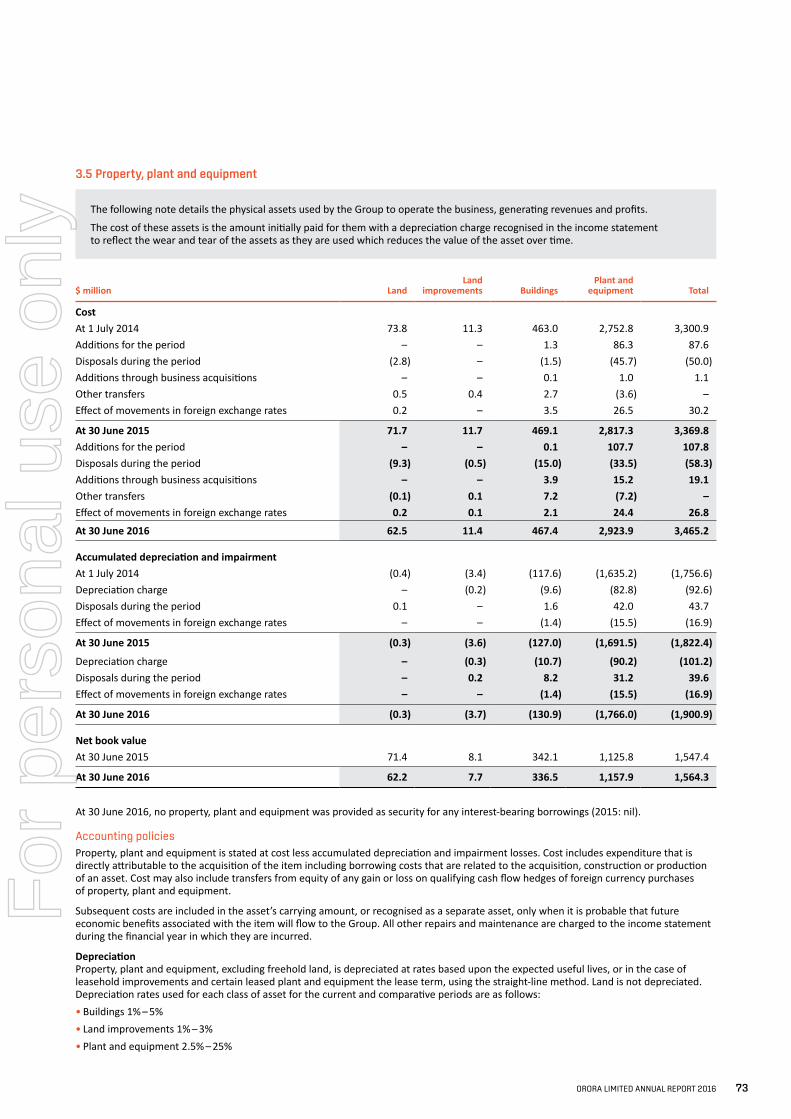
3.5 Property, plant and equipment
The following note details the physical assets used by the Group to operate the business, generating revenues and profits.
The cost of these assets is the amount initially paid for them with a depreciation charge recognised in the income statement to reflect the wear and tear of the assets as they are used which reduces the value of the asset over time.
$ million LandLand
improvements BuildingsPlant and
equipment Total
CostAt 1 July 2014 73.8 11.3 463.0 2,752.8 3,300.9 Additions for the period – – 1.3 86.3 87.6 Disposals during the period (2.8) – (1.5) (45.7) (50.0)Additions through business acquisitions – – 0.1 1.0 1.1 Other transfers 0.5 0.4 2.7 (3.6) – Effect of movements in foreign exchange rates 0.2 – 3.5 26.5 30.2
At 30 June 2015 71.7 11.7 469.1 2,817.3 3,369.8 Additions for the period – – 0.1 107.7 107.8 Disposals during the period (9.3) (0.5) (15.0) (33.5) (58.3)Additions through business acquisitions – – 3.9 15.2 19.1 Other transfers (0.1) 0.1 7.2 (7.2) – Effect of movements in foreign exchange rates 0.2 0.1 2.1 24.4 26.8
At 30 June 2016 62.5 11.4 467.4 2,923.9 3,465.2
Accumulated depreciation and impairmentAt 1 July 2014 (0.4) (3.4) (117.6) (1,635.2) (1,756.6)Depreciation charge – (0.2) (9.6) (82.8) (92.6)Disposals during the period 0.1 – 1.6 42.0 43.7 Effect of movements in foreign exchange rates – – (1.4) (15.5) (16.9)
At 30 June 2015 (0.3) (3.6) (127.0) (1,691.5) (1,822.4)
Depreciation charge – (0.3) (10.7) (90.2) (101.2)Disposals during the period – 0.2 8.2 31.2 39.6 Effect of movements in foreign exchange rates – – (1.4) (15.5) (16.9)
At 30 June 2016 (0.3) (3.7) (130.9) (1,766.0) (1,900.9)
Net book valueAt 30 June 2015 71.4 8.1 342.1 1,125.8 1,547.4
At 30 June 2016 62.2 7.7 336.5 1,157.9 1,564.3
At 30 June 2016, no property, plant and equipment was provided as security for any interest-bearing borrowings (2015: nil).
Accounting policiesProperty, plant and equipment is stated at cost less accumulated depreciation and impairment losses. Cost includes expenditure that is directly attributable to the acquisition of the item including borrowing costs that are related to the acquisition, construction or production of an asset. Cost may also include transfers from equity of any gain or loss on qualifying cash flow hedges of foreign currency purchases of property, plant and equipment.
Subsequent costs are included in the asset’s carrying amount, or recognised as a separate asset, only when it is probable that future economic benefits associated with the item will flow to the Group. All other repairs and maintenance are charged to the income statement during the financial year in which they are incurred.
DepreciationProperty, plant and equipment, excluding freehold land, is depreciated at rates based upon the expected useful lives, or in the case of leasehold improvements and certain leased plant and equipment the lease term, using the straight-line method. Land is not depreciated. Depreciation rates used for each class of asset for the current and comparative periods are as follows:• Buildings 1% – 5%• Land improvements 1% – 3%• Plant and equipment 2.5% – 25%
ORORA LIMITED ANNUAL REPORT 2016 73
For
per
sona
l use
onl
y
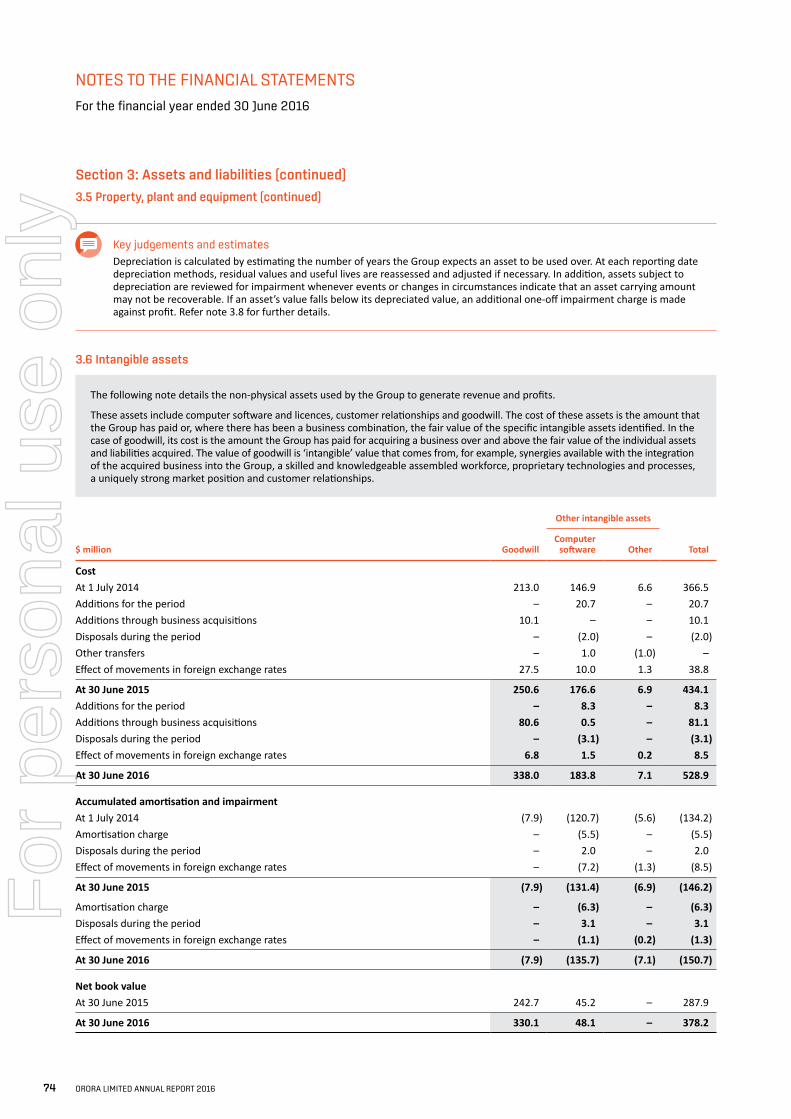
NOTES TO THE FINANCIAL STATEMENTS
For the financial year ended 30 June 2016
Section 3: Assets and liabilities (continued)
3.5 Property, plant and equipment (continued)
Key judgements and estimatesDepreciation is calculated by estimating the number of years the Group expects an asset to be used over. At each reporting date depreciation methods, residual values and useful lives are reassessed and adjusted if necessary. In addition, assets subject to depreciation are reviewed for impairment whenever events or changes in circumstances indicate that an asset carrying amount may not be recoverable. If an asset’s value falls below its depreciated value, an additional one-off impairment charge is made against profit. Refer note 3.8 for further details.
3.6 Intangible assets
The following note details the non-physical assets used by the Group to generate revenue and profits.
These assets include computer software and licences, customer relationships and goodwill. The cost of these assets is the amount that the Group has paid or, where there has been a business combination, the fair value of the specific intangible assets identified. In the case of goodwill, its cost is the amount the Group has paid for acquiring a business over and above the fair value of the individual assets and liabilities acquired. The value of goodwill is ‘intangible’ value that comes from, for example, synergies available with the integration of the acquired business into the Group, a skilled and knowledgeable assembled workforce, proprietary technologies and processes, a uniquely strong market position and customer relationships.
$ million Goodwill
Other intangible assets
TotalComputer
software Other
CostAt 1 July 2014 213.0 146.9 6.6 366.5 Additions for the period – 20.7 – 20.7 Additions through business acquisitions 10.1 – – 10.1 Disposals during the period – (2.0) – (2.0)Other transfers – 1.0 (1.0) – Effect of movements in foreign exchange rates 27.5 10.0 1.3 38.8
At 30 June 2015 250.6 176.6 6.9 434.1 Additions for the period – 8.3 – 8.3 Additions through business acquisitions 80.6 0.5 – 81.1 Disposals during the period – (3.1) – (3.1)Effect of movements in foreign exchange rates 6.8 1.5 0.2 8.5
At 30 June 2016 338.0 183.8 7.1 528.9
Accumulated amortisation and impairmentAt 1 July 2014 (7.9) (120.7) (5.6) (134.2)Amortisation charge – (5.5) – (5.5)Disposals during the period – 2.0 – 2.0 Effect of movements in foreign exchange rates – (7.2) (1.3) (8.5)
At 30 June 2015 (7.9) (131.4) (6.9) (146.2)
Amortisation charge – (6.3) – (6.3)Disposals during the period – 3.1 – 3.1 Effect of movements in foreign exchange rates – (1.1) (0.2) (1.3)
At 30 June 2016 (7.9) (135.7) (7.1) (150.7)
Net book valueAt 30 June 2015 242.7 45.2 – 287.9
At 30 June 2016 330.1 48.1 – 378.2
74 ORORA LIMITED ANNUAL REPORT 2016
For
per
sona
l use
onl
y
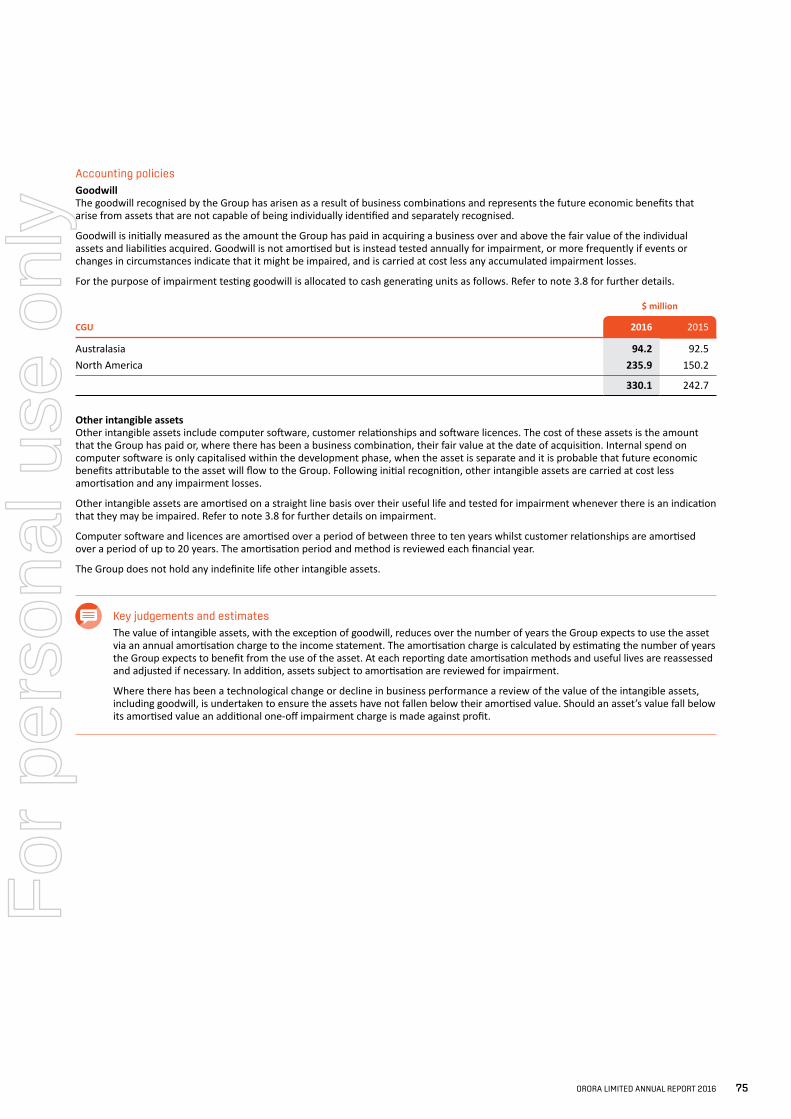
Accounting policiesGoodwillThe goodwill recognised by the Group has arisen as a result of business combinations and represents the future economic benefits that arise from assets that are not capable of being individually identified and separately recognised.
Goodwill is initially measured as the amount the Group has paid in acquiring a business over and above the fair value of the individual assets and liabilities acquired. Goodwill is not amortised but is instead tested annually for impairment, or more frequently if events or changes in circumstances indicate that it might be impaired, and is carried at cost less any accumulated impairment losses.
For the purpose of impairment testing goodwill is allocated to cash generating units as follows. Refer to note 3.8 for further details.
CGU
$ million
2016 2015
Australasia 94.2 92.5 North America 235.9 150.2
330.1 242.7
Other intangible assetsOther intangible assets include computer software, customer relationships and software licences. The cost of these assets is the amount that the Group has paid or, where there has been a business combination, their fair value at the date of acquisition. Internal spend on computer software is only capitalised within the development phase, when the asset is separate and it is probable that future economic benefits attributable to the asset will flow to the Group. Following initial recognition, other intangible assets are carried at cost less amortisation and any impairment losses.
Other intangible assets are amortised on a straight line basis over their useful life and tested for impairment whenever there is an indication that they may be impaired. Refer to note 3.8 for further details on impairment.
Computer software and licences are amortised over a period of between three to ten years whilst customer relationships are amortised over a period of up to 20 years. The amortisation period and method is reviewed each financial year.
The Group does not hold any indefinite life other intangible assets.
Key judgements and estimatesThe value of intangible assets, with the exception of goodwill, reduces over the number of years the Group expects to use the asset via an annual amortisation charge to the income statement. The amortisation charge is calculated by estimating the number of years the Group expects to benefit from the use of the asset. At each reporting date amortisation methods and useful lives are reassessed and adjusted if necessary. In addition, assets subject to amortisation are reviewed for impairment.
Where there has been a technological change or decline in business performance a review of the value of the intangible assets, including goodwill, is undertaken to ensure the assets have not fallen below their amortised value. Should an asset’s value fall below its amortised value an additional one-off impairment charge is made against profit.
ORORA LIMITED ANNUAL REPORT 2016 75
For
per
sona
l use
onl
y
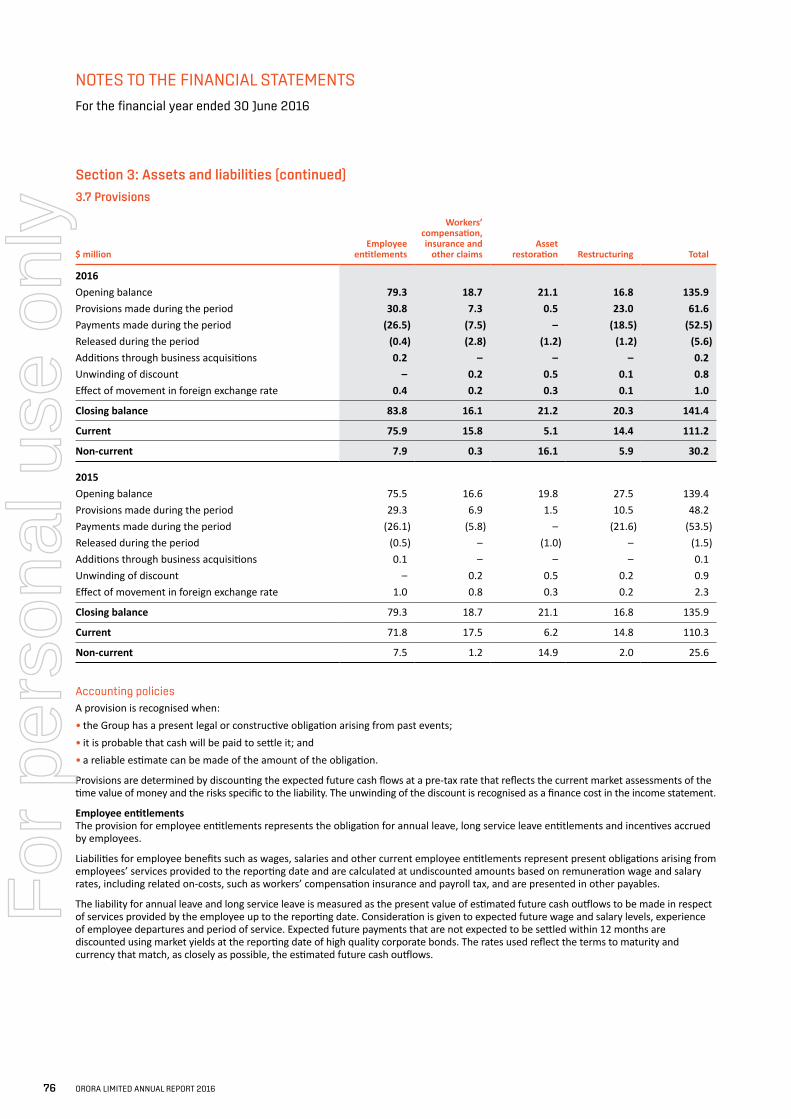
NOTES TO THE FINANCIAL STATEMENTS
For the financial year ended 30 June 2016
Section 3: Assets and liabilities (continued)
3.7 Provisions
$ millionEmployee
entitlements
Workers’ compensation, insurance and
other claimsAsset
restoration Restructuring Total
2016Opening balance 79.3 18.7 21.1 16.8 135.9 Provisions made during the period 30.8 7.3 0.5 23.0 61.6 Payments made during the period (26.5) (7.5) – (18.5) (52.5)Released during the period (0.4) (2.8) (1.2) (1.2) (5.6)Additions through business acquisitions 0.2 – – – 0.2 Unwinding of discount – 0.2 0.5 0.1 0.8 Effect of movement in foreign exchange rate 0.4 0.2 0.3 0.1 1.0
Closing balance 83.8 16.1 21.2 20.3 141.4
Current 75.9 15.8 5.1 14.4 111.2
Non-current 7.9 0.3 16.1 5.9 30.2
2015Opening balance 75.5 16.6 19.8 27.5 139.4 Provisions made during the period 29.3 6.9 1.5 10.5 48.2 Payments made during the period (26.1) (5.8) – (21.6) (53.5)Released during the period (0.5) – (1.0) – (1.5)Additions through business acquisitions 0.1 – – – 0.1 Unwinding of discount – 0.2 0.5 0.2 0.9 Effect of movement in foreign exchange rate 1.0 0.8 0.3 0.2 2.3
Closing balance 79.3 18.7 21.1 16.8 135.9
Current 71.8 17.5 6.2 14.8 110.3
Non-current 7.5 1.2 14.9 2.0 25.6
Accounting policiesA provision is recognised when:• the Group has a present legal or constructive obligation arising from past events;• it is probable that cash will be paid to settle it; and• a reliable estimate can be made of the amount of the obligation.
Provisions are determined by discounting the expected future cash flows at a pre-tax rate that reflects the current market assessments of the time value of money and the risks specific to the liability. The unwinding of the discount is recognised as a finance cost in the income statement.
Employee entitlementsThe provision for employee entitlements represents the obligation for annual leave, long service leave entitlements and incentives accrued by employees.
Liabilities for employee benefits such as wages, salaries and other current employee entitlements represent present obligations arising from employees’ services provided to the reporting date and are calculated at undiscounted amounts based on remuneration wage and salary rates, including related on-costs, such as workers’ compensation insurance and payroll tax, and are presented in other payables.
The liability for annual leave and long service leave is measured as the present value of estimated future cash outflows to be made in respect of services provided by the employee up to the reporting date. Consideration is given to expected future wage and salary levels, experience of employee departures and period of service. Expected future payments that are not expected to be settled within 12 months are discounted using market yields at the reporting date of high quality corporate bonds. The rates used reflect the terms to maturity and currency that match, as closely as possible, the estimated future cash outflows.
76 ORORA LIMITED ANNUAL REPORT 2016
For
per
sona
l use
onl
y
Workers’ compensation, insurance and other claimsThe Group self-insures for various risks including risks associated with workers’ compensation. Provisions are recognised for claims received and expected to be received in relation to incidents occurring prior to reporting date and are measured based upon historical claim rates.
Estimated net future cash flows are based on the assumption that all claims will be settled and the weighted average cost of historical claims adjusted for inflation will continue to approximate future costs.
Asset restorationThe Group is required to restore leased premises to their original condition at the end of the respective lease term. The restoration requirements typically relate to excessive wear and tear or alterations that have been made to the lease property to accommodate the operations of the business.
Where the Group has a legal or constructive obligation to restore a site on which an asset is located, either through make-good provisions included in lease agreements or decommissioning of environmental risks, the present value of the estimated costs of dismantling and removing the asset and restoring the site is recognised as a provision with a corresponding increase in the related item of property, plant and equipment. At each reporting date, the liability is remeasured in line with changes in discount rates, estimated cash flows and the timing of those cash flows. Any changes in the liability are added to or deducted from the related asset, other than the unwinding of the discount, which is recognised as a financing cost in the income statement.
RestructuringThe restructuring provision primarily relates to cost reduction and reorganisation activities associated with the Australasia operations.
A provision for restructuring is recognised when the Group has a detailed formal restructuring plan and the restructuring has either commenced or has been publicly announced, including discussions with affected personnel, with employee-related costs recognised over the period of any required further service. Future operating costs in relation to the restructuring are not provided for. Payments falling due greater than 12 months after reporting date are discounted to present value.
Key judgements and estimatesA provision is recognised by the Group where an obligation exists relating to a past event, it is probable that a cash payment will be required to settle it, and the Group is not certain how much cash will be required to settle the liability. The value of that provision is based upon estimates and assumptions with regards to the amount and timing of cash flows required to settle the obligation, which are dependent on future events. The key assumptions applicable to the determination of the provisions are as follows:
Employee entitlementsThe provision for employee entitlements is based on a number of management estimates, which include:• future increase in salaries and wages and on-cost rates• future probability of employee departures• future probability of years of service (long service leave provision)
Workers’ compensationThe self-insured workers’ compensation provision is based on a number of management estimates including, but not limited to:• future inflation• claim administration expenses• historical weighted average size of claims• claim development
Asset restorationAsset restoration provisions require assessments to be made of lease make-good conditions and decommissioning and environmental risks. The provisions also require estimates to be made of costs to dismantle and remove equipment and to restore the site to the condition required under the terms of the lease and required by environmental laws and regulations.
RestructuringRestructuring provisions require assessments to be made regarding the timing of recognition, specifically are plans sufficiently detailed, approved and communicated to support recognition at a point in time. The provisions also require estimates to be made of the cost of restructuring and the timing of these cash outflows.
The judgements, estimates and assumptions used in the booking of all provisions are management’s best estimates based on current and forecast operating and market conditions.
ORORA LIMITED ANNUAL REPORT 2016 77
For
per
sona
l use
onl
y
NOTES TO THE FINANCIAL STATEMENTS
For the financial year ended 30 June 2016
Section 3: Assets and liabilities (continued)
3.8 Impairment of non-financial assets
No impairment of non-financial assets has been recognised during the year ended 30 June 2016 or 30 June 2015.
In accordance with the Group’s accounting policies impairment losses recognised in prior periods were reassessed at 30 June 2016 for any indications that the loss may have decreased or may no longer exist, no such indicators were identified.
Testing for impairmentThe Group tests property, plant and equipment, intangibles and goodwill for impairment:• where there is an indication that an asset may be impaired (which is assessed at least each reporting date);• where there is an indication that previously recognised impairment (on assets other than goodwill) have changed; and• at least annually for indefinite life intangibles and goodwill.
In testing for impairment, the recoverable amount is estimated for an individual asset or, if it is not possible to estimate the recoverable amount for the individual asset, the recoverable amount of the cash generating unit (CGU) to which the asset belongs. CGUs are the smallest identifiable group of assets that generate cash inflows that are largely independent from the cash flows of other assets or group of assets. Each CGU is no larger than an operating segment.
Assets are impaired if their carrying value exceeds their recoverable amount. The recoverable amount of an asset or CGU is determined as the higher of its fair value less costs of disposal or value in use.
An impairment loss is recognised in the income statement if the carrying amount of an asset or a CGU exceeds its recoverable amount. Impairment losses recognised in respect of CGUs are allocated first to reduce the carrying amount of any goodwill allocated to the CGU (group of CGUs) and then, to reduce the carrying amount of the other assets in the CGU (group of CGUs).
Impairment calculationsIn assessing value in use, the estimated future cash flows are discounted to their present value using a pre-tax discount rate that reflects the risks specific to the asset or CGU and the market’s current assessment of the time value of money.
Value in use is assessed using cash flow projections for five years using data from the Group’s latest internal forecasts and is management’s best estimate of income, expenses, capital expenditure and cash flows for each CGU. Changes in selling prices and direct costs are based on past experience and management’s expectation of future changes in the markets in which the Group operates. Cash flows beyond the five year period are extrapolated using estimated growth rates which are determined with regard to the long-term performance of each CGU in their respective markets and are not expected to exceed the long-term average growth rates for the industry in which each CGU operates.
The discount rate used in performing the value in use calculations reflects the Group’s weighted average cost of capital, as adjusted for specific risks relating to each geographical region in which the CGU’s operate.
Reversal of impairmentWhere there is an indication that previously recognised impairment losses may no longer exist or may have decreased, the asset is tested. The impairment loss is reversed if there has been a change in the estimates used to determine the recoverable amount of the asset and is reversed only to the extent that the carrying amount of the asset does not exceed the carrying amount that would have been determined, net of depreciation or amortisation, had no impairment loss been recognised. Impairments recognised for goodwill are not reversed.
78 ORORA LIMITED ANNUAL REPORT 2016
For
per
sona
l use
onl
y
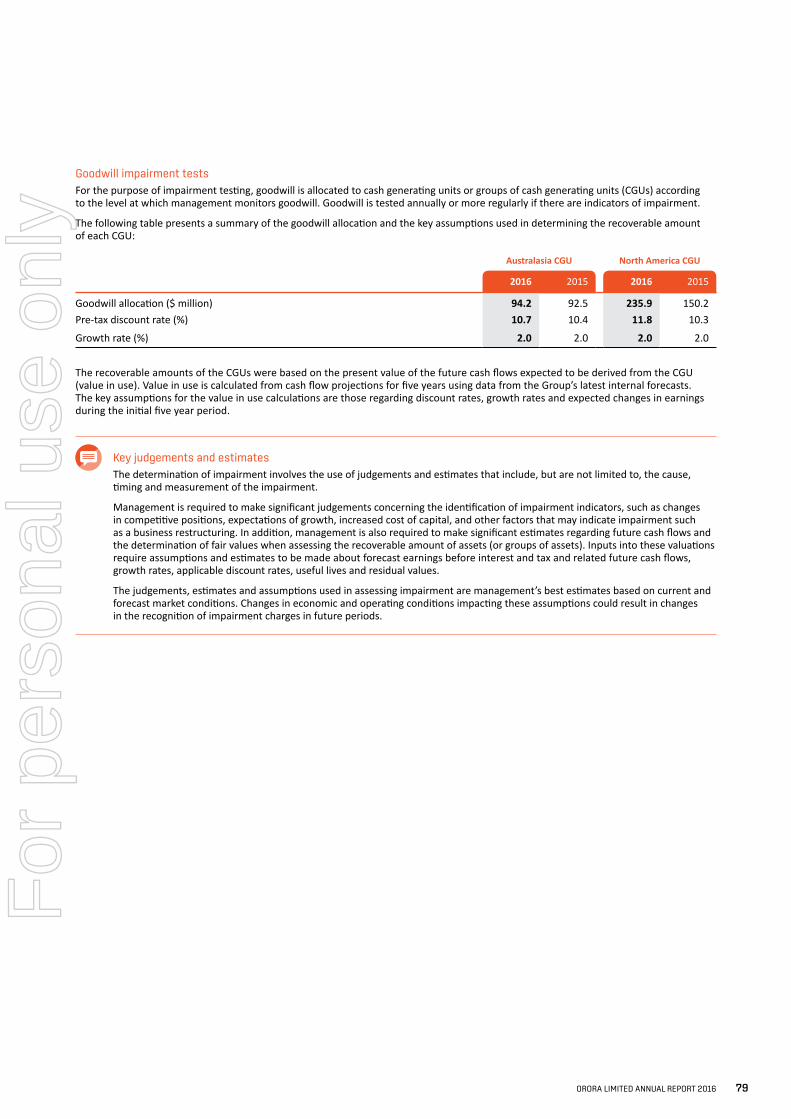
Goodwill impairment testsFor the purpose of impairment testing, goodwill is allocated to cash generating units or groups of cash generating units (CGUs) according to the level at which management monitors goodwill. Goodwill is tested annually or more regularly if there are indicators of impairment.
The following table presents a summary of the goodwill allocation and the key assumptions used in determining the recoverable amount of each CGU:
Australasia CGU North America CGU
2016 2015 2016 2015
Goodwill allocation ($ million) 94.2 92.5 235.9 150.2 Pre-tax discount rate (%) 10.7 10.4 11.8 10.3
Growth rate (%) 2.0 2.0 2.0 2.0
The recoverable amounts of the CGUs were based on the present value of the future cash flows expected to be derived from the CGU (value in use). Value in use is calculated from cash flow projections for five years using data from the Group’s latest internal forecasts. The key assumptions for the value in use calculations are those regarding discount rates, growth rates and expected changes in earnings during the initial five year period.
Key judgements and estimatesThe determination of impairment involves the use of judgements and estimates that include, but are not limited to, the cause, timing and measurement of the impairment.
Management is required to make significant judgements concerning the identification of impairment indicators, such as changes in competitive positions, expectations of growth, increased cost of capital, and other factors that may indicate impairment such as a business restructuring. In addition, management is also required to make significant estimates regarding future cash flows and the determination of fair values when assessing the recoverable amount of assets (or groups of assets). Inputs into these valuations require assumptions and estimates to be made about forecast earnings before interest and tax and related future cash flows, growth rates, applicable discount rates, useful lives and residual values.
The judgements, estimates and assumptions used in assessing impairment are management’s best estimates based on current and forecast market conditions. Changes in economic and operating conditions impacting these assumptions could result in changes in the recognition of impairment charges in future periods.
ORORA LIMITED ANNUAL REPORT 2016 79
For
per
sona
l use
onl
y
NOTES TO THE FINANCIAL STATEMENTS
For the financial year ended 30 June 2016
Section 4: Capital structure and financing
This section outlines how the Group manages its capital structure and related financing including its balance sheet liquidity and access to capital markets.
The Directors determine the appropriate capital structure of the Group, specifically, how much is raised from shareholders (equity) and how much is borrowed from financial institutions (debt) in order to finance the Group’s activities both now and in the future. Maintaining capital discipline and balance sheet efficiency remains important to the Group, as seen through the issuance of the US Private Placement notes during the year and other refinancing activities. Any potential courses of action, in respect of the Group’s structure, take into account the Group’s liquidity needs, flexibility to invest in the business and impact on credit ratings.
The Directors consider the Group’s capital structure and dividend policy at least twice a year ahead of announcing results and do so in the context of its ability to continue as a going concern, to execute the strategy and to invest in opportunities to grow the business and enhance shareholder value.
4.1 Capital management
Capital is defined as the combination of shareholders’ equity, reserves and net debt. The key objective of the Group when managing its capital is to safeguard its ability to continue as a going concern, so that the Group can continue to provide returns for shareholders and benefits for other stakeholders, and maintain an optimal capital and funding structure.
The aim of the Group’s capital management framework is to maintain an investment grade credit profile, and the requisite financial metrics, to secure access to alternate funding sources with a spread of maturity dates and sufficient undrawn committed facility capacity; and optimise, over the long term and to the extent practicable, the weighted average cost of capital to reduce the cost of capital to the Group while maintaining financial flexibility.
The Group uses a range of financial metrics to monitor the efficiency of its capital structure, including on-balance sheet gearing and leverage ratios, and ensure that its capital structure provides sufficient financial strength to allow it to secure access to debt finance at reasonable cost. At 30 June 2016, the Group’s on-balance sheet gearing and leverage ratios were 29.6% (2015: 29.6%) and 1.6 times (2015: 1.9 times), respectively.
$ million Note 2016 2015
Net debtTotal interest-bearing liabilities 4.3 695.7 674.2 Less: Cash and cash equivalents 4.3 (66.1) (67.3)
629.6 606.9 Equity and reservesContributed equity 4.4.1 513.1 513.8 Treasury shares 4.4.1 (31.3) (11.1)Reserves 4.4.2 136.8 127.2 Retained earnings 4.4.3 879.0 812.1
1,497.6 1,442.0
Net Capital 2,127.2 2,048.9
In order to optimise the capital structure, the Group may:• adjust the amount of ordinary dividends paid to shareholders• maintain a dividend investment plan• raise or return capital to shareholders; and• repay debt or raise debt for working capital and capital expenditure requirements, or to facilitate acquisitions in line with the strategic
objectives and operating plans of the Group.
IN THIS SECTION
80 ORORA LIMITED ANNUAL REPORT 2016
For
per
sona
l use
onl
y
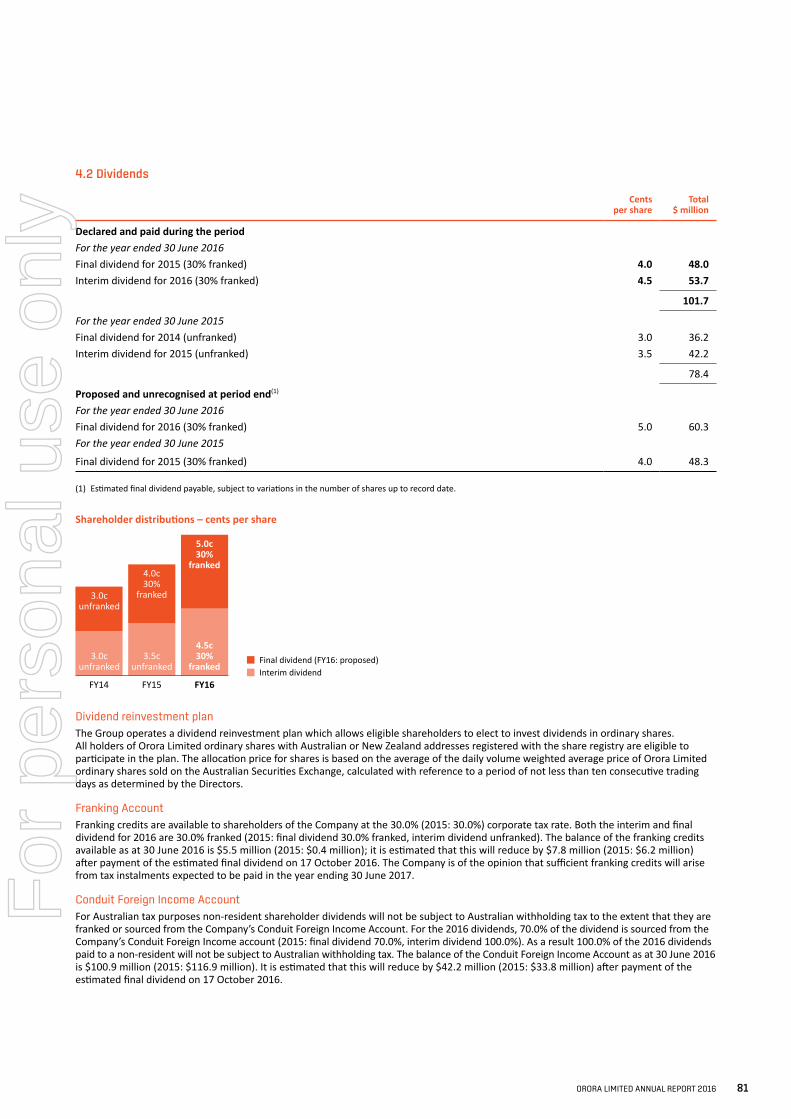
4.2 Dividends
Cents per share
Total $ million
Declared and paid during the periodFor the year ended 30 June 2016Final dividend for 2015 (30% franked) 4.0 48.0 Interim dividend for 2016 (30% franked) 4.5 53.7
101.7
For the year ended 30 June 2015Final dividend for 2014 (unfranked) 3.0 36.2 Interim dividend for 2015 (unfranked) 3.5 42.2
78.4
Proposed and unrecognised at period end(1)
For the year ended 30 June 2016Final dividend for 2016 (30% franked) 5.0 60.3 For the year ended 30 June 2015
Final dividend for 2015 (30% franked) 4.0 48.3
(1) Estimated final dividend payable, subject to variations in the number of shares up to record date.
Shareholder distributions – cents per share
Shareholder distributions — cents per share
3.0cunfranked
3.0cunfranked
3.5cunfranked
4.0c30%
franked
5.0c30%
franked
4.5c30%
franked
FY14 FY15 FY16
Final dividend (FY16: proposed)Interim dividend
Dividend reinvestment planThe Group operates a dividend reinvestment plan which allows eligible shareholders to elect to invest dividends in ordinary shares. All holders of Orora Limited ordinary shares with Australian or New Zealand addresses registered with the share registry are eligible to participate in the plan. The allocation price for shares is based on the average of the daily volume weighted average price of Orora Limited ordinary shares sold on the Australian Securities Exchange, calculated with reference to a period of not less than ten consecutive trading days as determined by the Directors.
Franking AccountFranking credits are available to shareholders of the Company at the 30.0% (2015: 30.0%) corporate tax rate. Both the interim and final dividend for 2016 are 30.0% franked (2015: final dividend 30.0% franked, interim dividend unfranked). The balance of the franking credits available as at 30 June 2016 is $5.5 million (2015: $0.4 million); it is estimated that this will reduce by $7.8 million (2015: $6.2 million) after payment of the estimated final dividend on 17 October 2016. The Company is of the opinion that sufficient franking credits will arise from tax instalments expected to be paid in the year ending 30 June 2017.
Conduit Foreign Income AccountFor Australian tax purposes non-resident shareholder dividends will not be subject to Australian withholding tax to the extent that they are franked or sourced from the Company’s Conduit Foreign Income Account. For the 2016 dividends, 70.0% of the dividend is sourced from the Company’s Conduit Foreign Income account (2015: final dividend 70.0%, interim dividend 100.0%). As a result 100.0% of the 2016 dividends paid to a non-resident will not be subject to Australian withholding tax. The balance of the Conduit Foreign Income Account as at 30 June 2016 is $100.9 million (2015: $116.9 million). It is estimated that this will reduce by $42.2 million (2015: $33.8 million) after payment of the estimated final dividend on 17 October 2016.
ORORA LIMITED ANNUAL REPORT 2016 81
For
per
sona
l use
onl
y
NOTES TO THE FINANCIAL STATEMENTS
For the financial year ended 30 June 2016
Section 4: Capital structure and financing (continued)
4.3 Net debt
During the period the Group successfully completed a US Private Placement of notes issued by its wholly-owned US subsidiary, raising USD250.0 million, of which USD100.0 million matures in July 2023 and USD150.0 million in July 2025.
In addition to the above, the following facilities were also secured:• a USD200.0 million five-year USD revolving facility, through a syndicate of domestic and international financial institutions,
maturing in April 2021, and• two bilateral agreements for $50.0 million, each with separate domestic institutions, maturing in April 2018.
As at 30 June 2016, the Group also had access to a $400.0 million revolving multicurrency facility through a syndicate of domestic and international financial institutions maturing in December 2019. This facility is unsecured and can be extended.
During both the current and comparative reporting period, Orora Limited has complied with the financial covenants of its borrowing facilities.
$ million 2016 2015
Cash on hand and at bank 66.1 67.3
Total cash and cash equivalents 66.1 67.3
Bank loans due after one year 361.9 674.2 US Private Placement due after one year 333.8 –
Total debt 695.7 674.2
Net debt 629.6 606.9
Accounting policiesCash and cash equivalentsCash and cash equivalents include, cash at bank and on hand and short-term money market investments with an original maturity of three months or less and are classified as financial assets held at amortised cost.
Cash at bank earns interest at floating rates based on daily bank deposits. Short-term deposits are made for varying periods, depending on the immediate cash requirements of the Group, and earn interest at the respective short-term deposit rates.
The carrying value of cash and cash equivalents is considered to approximate fair value due to the assets’ liquid nature.
Bank loansAll loans and borrowings are initially recognised at the fair value of the consideration received, less directly attributable transaction costs. Subsequent to initial recognition, interest-bearing liabilities are measured at amortised cost using the effective interest rate method.
Interest-bearing liabilities are derecognised when the obligation specified in the contract is discharged, cancelled or expires. The difference between the carrying amount of a financial liability that has been extinguished or transferred to another party and the consideration paid is recognised in profit or loss.
Interest-bearing liabilities are classified as current liabilities, except for those liabilities where the Group has an unconditional right to defer settlement for at least 12 months after the reporting period, which are classified as non-current liabilities.
The US Private Placement notes have a carrying value of $333.8 million, while the fair value of the notes is $370.5 million. For all other borrowings, the fair values are not materially different to their carrying amount since the interest payable on those borrowings is either close to current market rates or the borrowings are of a short-term nature.
82 ORORA LIMITED ANNUAL REPORT 2016
For
per
sona
l use
onl
y
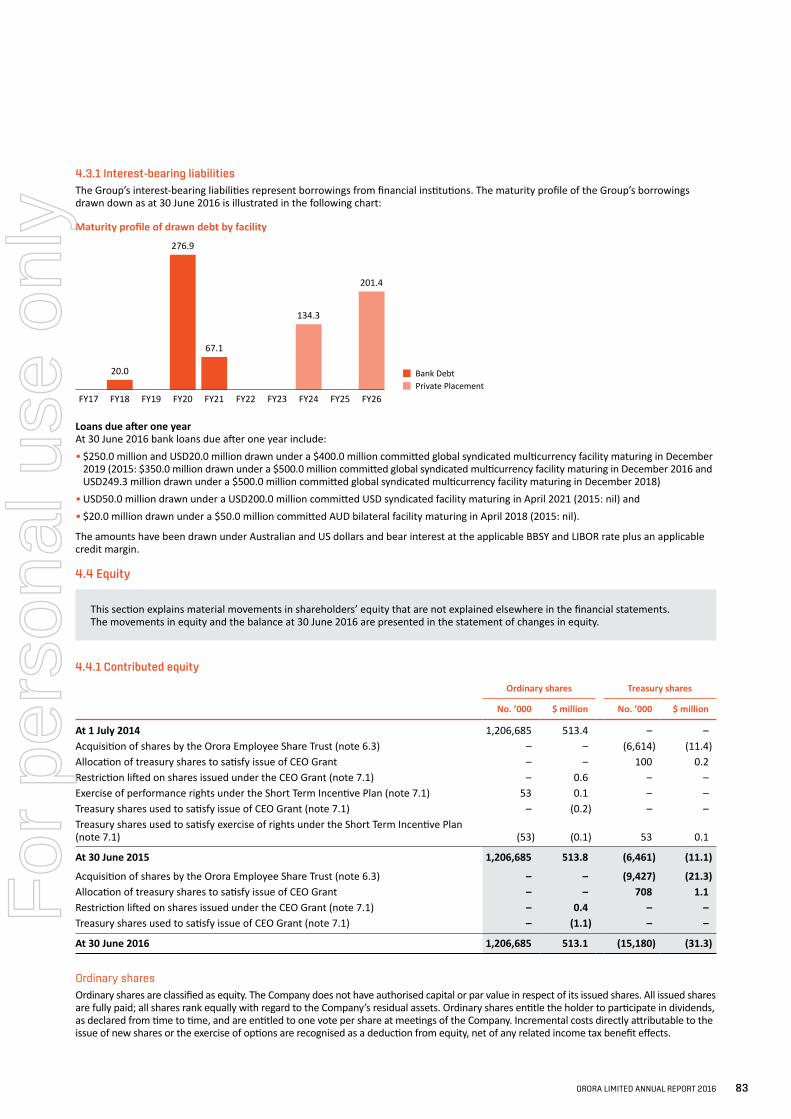
4.3.1 Interest-bearing liabilitiesThe Group’s interest-bearing liabilities represent borrowings from financial institutions. The maturity profile of the Group’s borrowings drawn down as at 30 June 2016 is illustrated in the following chart:
Maturity profile of drawn debt by facility
Maturity profile of drawn debt by facilityA$ million
20.0
276.9
67.1
134.3
201.4
FY17 FY18 FY19 FY20 FY21 FY22 FY23 FY24 FY25 FY26
Bank DebtPrivate Placement
Loans due after one yearAt 30 June 2016 bank loans due after one year include:• $250.0 million and USD20.0 million drawn under a $400.0 million committed global syndicated multicurrency facility maturing in December
2019 (2015: $350.0 million drawn under a $500.0 million committed global syndicated multicurrency facility maturing in December 2016 and USD249.3 million drawn under a $500.0 million committed global syndicated multicurrency facility maturing in December 2018)
• USD50.0 million drawn under a USD200.0 million committed USD syndicated facility maturing in April 2021 (2015: nil) and• $20.0 million drawn under a $50.0 million committed AUD bilateral facility maturing in April 2018 (2015: nil).
The amounts have been drawn under Australian and US dollars and bear interest at the applicable BBSY and LIBOR rate plus an applicable credit margin.
4.4 Equity
This section explains material movements in shareholders’ equity that are not explained elsewhere in the financial statements. The movements in equity and the balance at 30 June 2016 are presented in the statement of changes in equity.
4.4.1 Contributed equity
Ordinary shares Treasury shares
No. ’000 $ million No. ’000 $ million
At 1 July 2014 1,206,685 513.4 – – Acquisition of shares by the Orora Employee Share Trust (note 6.3) – – (6,614) (11.4)Allocation of treasury shares to satisfy issue of CEO Grant – – 100 0.2 Restriction lifted on shares issued under the CEO Grant (note 7.1) – 0.6 – – Exercise of performance rights under the Short Term Incentive Plan (note 7.1) 53 0.1 – – Treasury shares used to satisfy issue of CEO Grant (note 7.1) – (0.2) – – Treasury shares used to satisfy exercise of rights under the Short Term Incentive Plan (note 7.1) (53) (0.1) 53 0.1
At 30 June 2015 1,206,685 513.8 (6,461) (11.1)
Acquisition of shares by the Orora Employee Share Trust (note 6.3) – – (9,427) (21.3)Allocation of treasury shares to satisfy issue of CEO Grant – – 708 1.1 Restriction lifted on shares issued under the CEO Grant (note 7.1) – 0.4 – – Treasury shares used to satisfy issue of CEO Grant (note 7.1) – (1.1) – –
At 30 June 2016 1,206,685 513.1 (15,180) (31.3)
Ordinary sharesOrdinary shares are classified as equity. The Company does not have authorised capital or par value in respect of its issued shares. All issued shares are fully paid; all shares rank equally with regard to the Company’s residual assets. Ordinary shares entitle the holder to participate in dividends, as declared from time to time, and are entitled to one vote per share at meetings of the Company. Incremental costs directly attributable to the issue of new shares or the exercise of options are recognised as a deduction from equity, net of any related income tax benefit effects.
ORORA LIMITED ANNUAL REPORT 2016 83
For
per
sona
l use
onl
y
NOTES TO THE FINANCIAL STATEMENTS
For the financial year ended 30 June 2016
Section 4: Capital structure and financing (continued)4.4 Equity (continued)
4.4.1 Contributed equity (continued)
Treasury sharesWhere the Orora Employee Share Trust purchases equity instruments in the Company that have been identified as treasury shares, the consideration paid, including any directly attributable costs, is deducted from equity, net of any related income tax effects. When the treasury shares are subsequently sold or reissued, any consideration received, net of any directly attributable costs and the related income tax effects, is recognised as an increase in equity, and the resulting surplus or deficit on the transaction is presented in retained earnings. Refer to note 6.3 for further information on the Orora Employee Share Trust.
4.4.2 Reserves
$ million 2016 2015
Cash flow hedge reserve (15.4) (3.6)Share-based payment reserve 15.1 6.9 Demerger reserve 132.9 132.9 Exchange fluctuation reserve 4.2 (9.0)
Total reserves 136.8 127.2
Details of movements in each of the reserves is presented in the statement of changes in equity.
Accounting policiesCash flow hedge reserveThe cash flow hedge reserve comprises the effective portion of the cumulative net change in the fair value of cash flow hedging instruments related to hedged transactions that have not yet occurred and the cumulative change in fair value arising from the time value of options related to future forecast transactions. Refer to note 5.4 for more information on hedging instruments.
Share-based payment reserveThe share-based payment reserve is used to recognise the fair value of options and rights recognised as an expense. The Company provides benefits to employees of the Group in the form of share-based payments, whereby employees render services in exchange for options or rights over shares. Refer to note 7.1 for further details of the Group’s share-based payment plans.
The fair value of options and rights granted is recognised as an employee benefit expense in the income statement with a corresponding increase in the share-based payments reserve in equity and is spread over the vesting period during which the employees become unconditionally entitled to the option or right. Upon exercise of the options or rights, the balance of the share-based payments reserve, relating to the option or right, is transferred to share capital.
Demerger reserveThe demerger reserve represents the difference between the consideration paid by Orora under an internal corporate restructure and the assets and liabilities acquired, which were recognised at their carrying value under a common control transaction.
Exchange fluctuation reserveFor controlled entities with a functional currency, that is not Australian dollars, their assets and liabilities are translated at the closing exchange rate at reporting date while income and expenses are translated at year-to-date average exchange rates.
On consolidation all exchange differences arising from translation are recognised in other comprehensive income and accumulated in the exchange fluctuation reserve. When a foreign operation is disposed of, the amount within the reserve related to that entity is transferred to the income statement as an adjustment to the profit or loss on disposal.
4.4.3 Retained earningsRetained earnings comprises profit for the year attributable to owners of the Company and other items recognised directly in equity as presented on the statement of changes in equity.
$ million 2016 2015
Retained earnings at the beginning of the period 812.1 759.1 Net profit attributable to the owners of Orora Limited 168.6 131.4
980.7 890.5 Ordinary dividends:– Interim paid (refer note 4.2)(1) (53.7) (42.2)– Final paid (refer note 4.2)(2) (48.0) (36.2)
(101.7) (78.4)
Retained earnings at the end of the period 879.0 812.1
(1) 2016 Interim dividend paid on 6 April 2016 (2015: 2015 Interim dividend paid on 9 April 2015)(2) 2015 Final dividend paid on 13 October 2015 (2015: 2014 Final dividend paid on 8 October 2014)
84 ORORA LIMITED ANNUAL REPORT 2016
For
per
sona
l use
onl
y
Section 5: Financial risk management
The following section outlines how the Group manages the financial risks it is exposed to associated with holding financial instruments that arise from the Group’s need to access financing (bank loans and overdrafts and unsecured notes), from the Group’s operational activities (cash, trade receivables and payables) and instruments held as part of the Group’s risk management activities (derivate financial instruments).
Financial risk management is carried out by Orora Group Treasury under policies that have been approved by the Board for managing each of the below risks including principles and procedures with respect to risk tolerance, delegated levels of authority on the type and use of derivative financial instruments and the reporting of these exposures. The treasury function reports regularly to the Audit & Compliance Committee and treasury procedures are subject to periodic reviews.
In accordance with Board-approved policies the Group typically uses derivative financial instruments to hedge underlying exposures arising from the Group’s operational activities relating to; changes in foreign exchange rates on foreign currency commercial transactions (transaction risk), translation of balance sheet items of foreign subsidiaries (translation risk), exposure to changes in commodity prices, changes in interest rates on net borrowings and changes in the Company’s share price.
The Group’s overall financial risk management program focuses on the unpredictability of financial markets and seeks to minimise potential adverse effects on the Group’s financial performance as set out in the table below:
Risk Exposure Management
Market risks• Foreign
exchange riskThe Group is exposed to foreign exchange risk because of its international operations. These risks relate to future commercial transactions, financial assets and liabilities not denominated in A$ and net investments in foreign operations.
Where possible loans are drawn in foreign currency by foreign entities to create a natural hedge of foreign currency assets and liabilities. Where this is not possible the Group’s policy is to hedge contractual commitments denominated in a foreign currency by entering into forward exchange contracts. Refer notes 5.1.1 and 5.4.
• Interest rate risk The Group is exposed to interest rate risk in respect of short and long-term borrowings where interest is charged at variable rates.
The Group mitigates interest rate risk primarily by entering into fixed rate borrowing arrangements. Where necessary the Group hedges interest rate risk using derivative instruments – e.g. interest rate swaps. Refer notes 5.1.2 and 5.4.
• Commodity price risk
The Group is exposed to changes in commodity prices in respect of the purchase of aluminium raw materials.
Where possible, the Group mitigates raw material commodity price risk by contractually passing rise and fall adjustments through to customers. Refer notes 5.1.3 and 5.4.
• Employee share plan risk
The Group’s employee share plans require the delivery of shares to employees in the future when rights vest or options are exercised. The Group currently acquires shares on market to deliver these shares exposing the Group to cash flow risk – i.e. as the share price increases it costs more to acquire the shares on market.
The Group has established the Orora Employee Share Trust, which manages and administers the Group’s responsibilities under the employee share plans through acquiring, holding and transferring shares or rights to shares in the Company to participating employees. Refer note 5.1.4.
Credit risk The Group is exposed to credit risk from financial instrument contracts and trade and other receivables. The maximum exposure to credit risk at reporting date is the carrying amount, net of any provision for impairment, of each financial asset in the balance sheet.
The Group manages credit risk through a robust system of counterparty approval, granting and renewal of credit limits, regular monitoring of exposures against such credit limits and assessing the overall financial stability and competitive strength of the counterparty on an ongoing basis. Refer to notes 5.2 and 3.1 for credit risk exposures relating to trade and other receivables.
The Group only enters into financial instrument contracts with high credit quality financial institutions with a minimum long-term credit rating of A- or better by Standard & Poor’s.
IN THIS SECTION
ORORA LIMITED ANNUAL REPORT 2016 85
For
per
sona
l use
onl
y
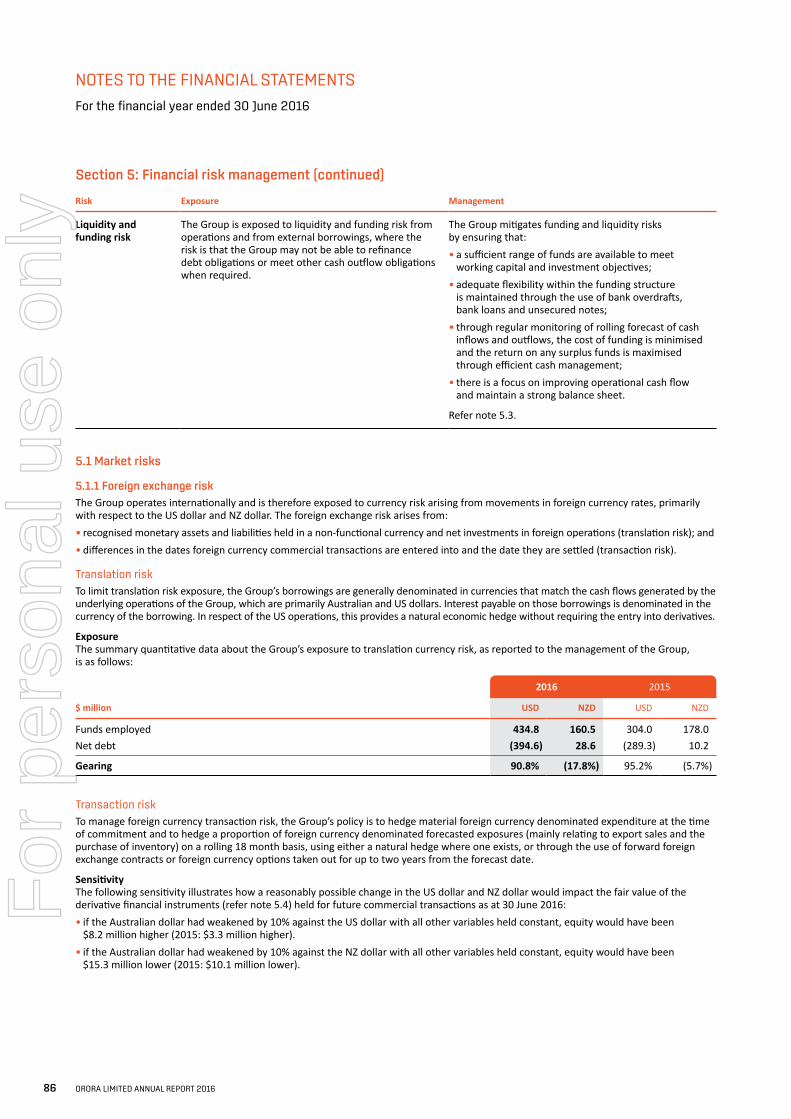
NOTES TO THE FINANCIAL STATEMENTS
For the financial year ended 30 June 2016
Risk Exposure Management
Liquidity and funding risk
The Group is exposed to liquidity and funding risk from operations and from external borrowings, where the risk is that the Group may not be able to refinance debt obligations or meet other cash outflow obligations when required.
The Group mitigates funding and liquidity risks by ensuring that:• a sufficient range of funds are available to meet
working capital and investment objectives;• adequate flexibility within the funding structure
is maintained through the use of bank overdrafts, bank loans and unsecured notes;
• through regular monitoring of rolling forecast of cash inflows and outflows, the cost of funding is minimised and the return on any surplus funds is maximised through efficient cash management;
• there is a focus on improving operational cash flow and maintain a strong balance sheet.
Refer note 5.3.
5.1 Market risks
5.1.1 Foreign exchange riskThe Group operates internationally and is therefore exposed to currency risk arising from movements in foreign currency rates, primarily with respect to the US dollar and NZ dollar. The foreign exchange risk arises from:• recognised monetary assets and liabilities held in a non-functional currency and net investments in foreign operations (translation risk); and• differences in the dates foreign currency commercial transactions are entered into and the date they are settled (transaction risk).
Translation riskTo limit translation risk exposure, the Group’s borrowings are generally denominated in currencies that match the cash flows generated by the underlying operations of the Group, which are primarily Australian and US dollars. Interest payable on those borrowings is denominated in the currency of the borrowing. In respect of the US operations, this provides a natural economic hedge without requiring the entry into derivatives.
ExposureThe summary quantitative data about the Group’s exposure to translation currency risk, as reported to the management of the Group, is as follows:
$ million
2016 2015
USD NZD USD NZD
Funds employed 434.8 160.5 304.0 178.0 Net debt (394.6) 28.6 (289.3) 10.2
Gearing 90.8% (17.8%) 95.2% (5.7%)
Transaction riskTo manage foreign currency transaction risk, the Group’s policy is to hedge material foreign currency denominated expenditure at the time of commitment and to hedge a proportion of foreign currency denominated forecasted exposures (mainly relating to export sales and the purchase of inventory) on a rolling 18 month basis, using either a natural hedge where one exists, or through the use of forward foreign exchange contracts or foreign currency options taken out for up to two years from the forecast date.
SensitivityThe following sensitivity illustrates how a reasonably possible change in the US dollar and NZ dollar would impact the fair value of the derivative financial instruments (refer note 5.4) held for future commercial transactions as at 30 June 2016:• if the Australian dollar had weakened by 10% against the US dollar with all other variables held constant, equity would have been
$8.2 million higher (2015: $3.3 million higher).• if the Australian dollar had weakened by 10% against the NZ dollar with all other variables held constant, equity would have been
$15.3 million lower (2015: $10.1 million lower).
Section 5: Financial risk management (continued)
86 ORORA LIMITED ANNUAL REPORT 2016
For
per
sona
l use
onl
y
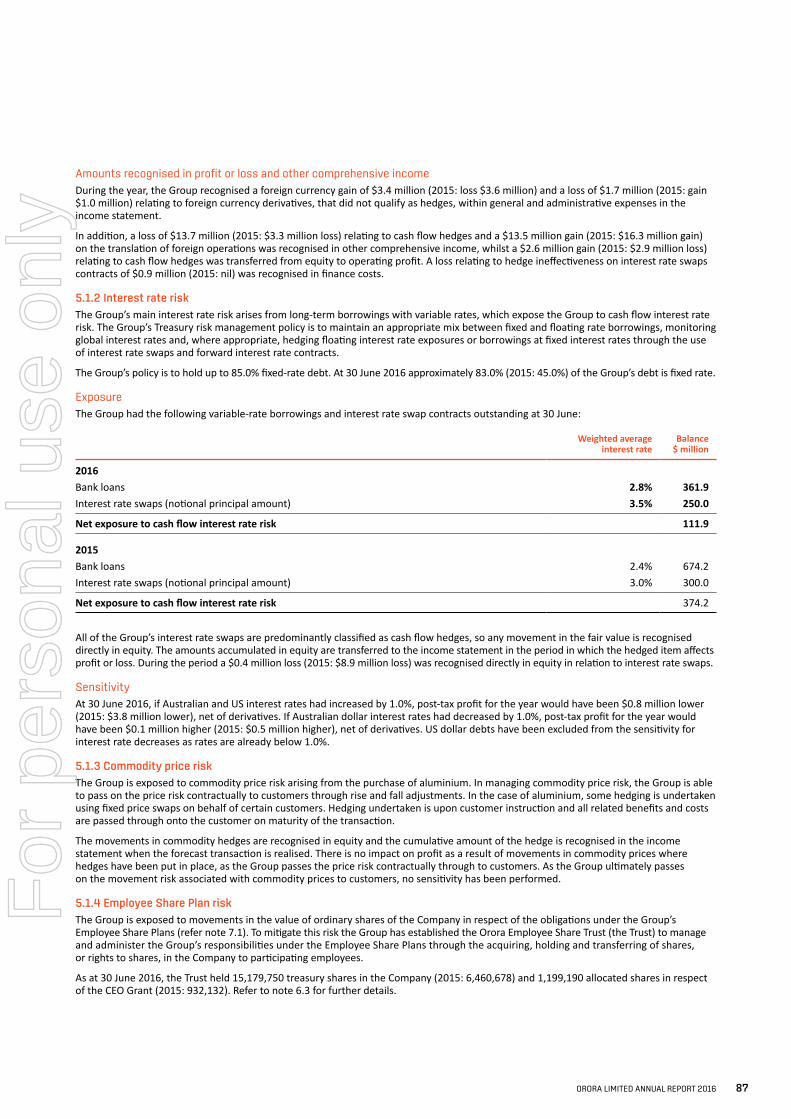
Amounts recognised in profit or loss and other comprehensive incomeDuring the year, the Group recognised a foreign currency gain of $3.4 million (2015: loss $3.6 million) and a loss of $1.7 million (2015: gain $1.0 million) relating to foreign currency derivatives, that did not qualify as hedges, within general and administrative expenses in the income statement.
In addition, a loss of $13.7 million (2015: $3.3 million loss) relating to cash flow hedges and a $13.5 million gain (2015: $16.3 million gain) on the translation of foreign operations was recognised in other comprehensive income, whilst a $2.6 million gain (2015: $2.9 million loss) relating to cash flow hedges was transferred from equity to operating profit. A loss relating to hedge ineffectiveness on interest rate swaps contracts of $0.9 million (2015: nil) was recognised in finance costs.
5.1.2 Interest rate riskThe Group’s main interest rate risk arises from long-term borrowings with variable rates, which expose the Group to cash flow interest rate risk. The Group’s Treasury risk management policy is to maintain an appropriate mix between fixed and floating rate borrowings, monitoring global interest rates and, where appropriate, hedging floating interest rate exposures or borrowings at fixed interest rates through the use of interest rate swaps and forward interest rate contracts.
The Group’s policy is to hold up to 85.0% fixed-rate debt. At 30 June 2016 approximately 83.0% (2015: 45.0%) of the Group’s debt is fixed rate.
ExposureThe Group had the following variable-rate borrowings and interest rate swap contracts outstanding at 30 June:
Weighted average interest rate
Balance $ million
2016Bank loans 2.8% 361.9 Interest rate swaps (notional principal amount) 3.5% 250.0
Net exposure to cash flow interest rate risk 111.9
2015Bank loans 2.4% 674.2 Interest rate swaps (notional principal amount) 3.0% 300.0
Net exposure to cash flow interest rate risk 374.2
All of the Group’s interest rate swaps are predominantly classified as cash flow hedges, so any movement in the fair value is recognised directly in equity. The amounts accumulated in equity are transferred to the income statement in the period in which the hedged item affects profit or loss. During the period a $0.4 million loss (2015: $8.9 million loss) was recognised directly in equity in relation to interest rate swaps.
SensitivityAt 30 June 2016, if Australian and US interest rates had increased by 1.0%, post-tax profit for the year would have been $0.8 million lower (2015: $3.8 million lower), net of derivatives. If Australian dollar interest rates had decreased by 1.0%, post-tax profit for the year would have been $0.1 million higher (2015: $0.5 million higher), net of derivatives. US dollar debts have been excluded from the sensitivity for interest rate decreases as rates are already below 1.0%.
5.1.3 Commodity price riskThe Group is exposed to commodity price risk arising from the purchase of aluminium. In managing commodity price risk, the Group is able to pass on the price risk contractually to customers through rise and fall adjustments. In the case of aluminium, some hedging is undertaken using fixed price swaps on behalf of certain customers. Hedging undertaken is upon customer instruction and all related benefits and costs are passed through onto the customer on maturity of the transaction.
The movements in commodity hedges are recognised in equity and the cumulative amount of the hedge is recognised in the income statement when the forecast transaction is realised. There is no impact on profit as a result of movements in commodity prices where hedges have been put in place, as the Group passes the price risk contractually through to customers. As the Group ultimately passes on the movement risk associated with commodity prices to customers, no sensitivity has been performed.
5.1.4 Employee Share Plan riskThe Group is exposed to movements in the value of ordinary shares of the Company in respect of the obligations under the Group’s Employee Share Plans (refer note 7.1). To mitigate this risk the Group has established the Orora Employee Share Trust (the Trust) to manage and administer the Group’s responsibilities under the Employee Share Plans through the acquiring, holding and transferring of shares, or rights to shares, in the Company to participating employees.
As at 30 June 2016, the Trust held 15,179,750 treasury shares in the Company (2015: 6,460,678) and 1,199,190 allocated shares in respect of the CEO Grant (2015: 932,132). Refer to note 6.3 for further details.
ORORA LIMITED ANNUAL REPORT 2016 87
For
per
sona
l use
onl
y
NOTES TO THE FINANCIAL STATEMENTS
For the financial year ended 30 June 2016
Section 5: Financial risk management (continued)
5.2 Credit risk
Credit risk is the risk of financial loss to the Group if a customer or counterparty to a financial instrument fails to meet its contractual obligations. It arises principally from the Group’s receivables from customers, cash and cash equivalents and in-the-money derivatives. There is also credit risk relating to the Group’s own credit rating as this impacts the availability and cost of future finance.
The Group manages credit risk through the maintenance of procedures such as the utilisation of systems of approval, granting and renewal of credit limits, regular monitoring of exposures against such credit limits and assessing the overall financial stability and competitive strength of the counterparty on an ongoing basis.
Trade and other receivablesCredit risk exposures related to trade and other receivables are discussed in note 3.1.
Cash and cash equivalents and derivativesCredit risk related to balances with banks and financial institutions is managed by Orora Group Treasury in accordance with Group policy. The policy only allows financial derivative instruments to be entered into with high credit quality financial institutions with a minimum long-term credit rating of A- or better by Standard & Poor’s. In addition, the Board has approved the use of these financial institutions, and specific internal guidelines have been established with regards to limits, dealing and settlement procedures.
The maximum exposure to credit risk by class of recognised financial assets at the end of the reporting period, excluding the value of any security held, is equivalent to the carrying amount and classification of the financial assets (net of any provisions) as presented in the statement of financial position.
GuaranteesThe Group’s policy is to provide financial guarantees only to certain parties securing the liabilities of subsidiaries, and are only provided in exceptional circumstances (refer note 7.3).
5.3 Liquidity risk and funding risk
Liquidity risk is the risk that the Group will not be able to meet its financial obligations as they fall due. The Group’s financing policy is to fund itself for the long term by using debt instruments with a range of maturities and to ensure access to appropriate short-term facilities. Orora Group Treasury aims to maintain flexibility within the funding structure through the use of bank overdrafts and bank loans.
Management manages liquidity risk through maintaining minimum undrawn committed liquidity of at least $175.0 million that can be drawn upon at short notice and regularly monitoring rolling forecasts of cash inflows and outflows in relation to the Group’s activities. This monitoring includes financial ratios to assess possible future credit ratings and headroom and takes into account the accessibility of cash and cash equivalents.
Financing arrangements
At 30 June 2016, the Group had access to:• a $400.0 million revolving multicurrency facility through a syndicate of domestic and international financial institutions maturing
in December 2019. This facility is unsecured and can be extended• US Private Placement of notes USD250.0 million, of which USD100.0 million matures in July 2023 and USD150.0 million which
matures in July 2025• a USD200.0 million five-year USD revolving facility, through a syndicate of domestic and international financial institutions,
maturing in April 2021• two bilateral agreements for $50.0 million each with separate domestic institutions, maturing in April 2018.
88 ORORA LIMITED ANNUAL REPORT 2016
For
per
sona
l use
onl
y
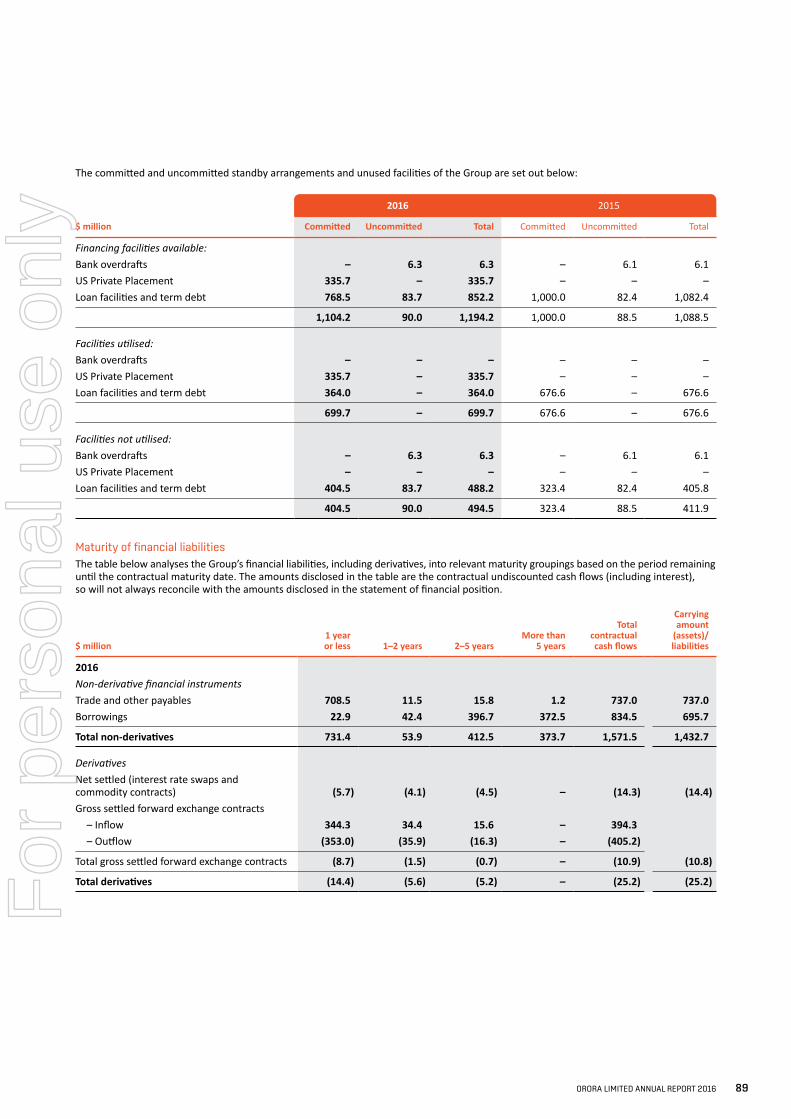
The committed and uncommitted standby arrangements and unused facilities of the Group are set out below:
$ million
2016 2015
Committed Uncommitted Total Committed Uncommitted Total
Financing facilities available:Bank overdrafts – 6.3 6.3 – 6.1 6.1 US Private Placement 335.7 – 335.7 – – – Loan facilities and term debt 768.5 83.7 852.2 1,000.0 82.4 1,082.4
1,104.2 90.0 1,194.2 1,000.0 88.5 1,088.5
Facilities utilised:Bank overdrafts – – – – – – US Private Placement 335.7 – 335.7 – – – Loan facilities and term debt 364.0 – 364.0 676.6 – 676.6
699.7 – 699.7 676.6 – 676.6
Facilities not utilised:Bank overdrafts – 6.3 6.3 – 6.1 6.1 US Private Placement – – – – – – Loan facilities and term debt 404.5 83.7 488.2 323.4 82.4 405.8
404.5 90.0 494.5 323.4 88.5 411.9
Maturity of financial liabilitiesThe table below analyses the Group’s financial liabilities, including derivatives, into relevant maturity groupings based on the period remaining until the contractual maturity date. The amounts disclosed in the table are the contractual undiscounted cash flows (including interest), so will not always reconcile with the amounts disclosed in the statement of financial position.
$ million1 year or less 1–2 years 2–5 years
More than 5 years
Total contractual cash flows
Carrying amount
(assets)/ liabilities
2016Non-derivative financial instrumentsTrade and other payables 708.5 11.5 15.8 1.2 737.0 737.0 Borrowings 22.9 42.4 396.7 372.5 834.5 695.7
Total non-derivatives 731.4 53.9 412.5 373.7 1,571.5 1,432.7
DerivativesNet settled (interest rate swaps and commodity contracts) (5.7) (4.1) (4.5) – (14.3) (14.4)Gross settled forward exchange contracts – Inflow 344.3 34.4 15.6 – 394.3 – Outflow (353.0) (35.9) (16.3) – (405.2)
Total gross settled forward exchange contracts (8.7) (1.5) (0.7) – (10.9) (10.8)
Total derivatives (14.4) (5.6) (5.2) – (25.2) (25.2)
ORORA LIMITED ANNUAL REPORT 2016 89
For
per
sona
l use
onl
y
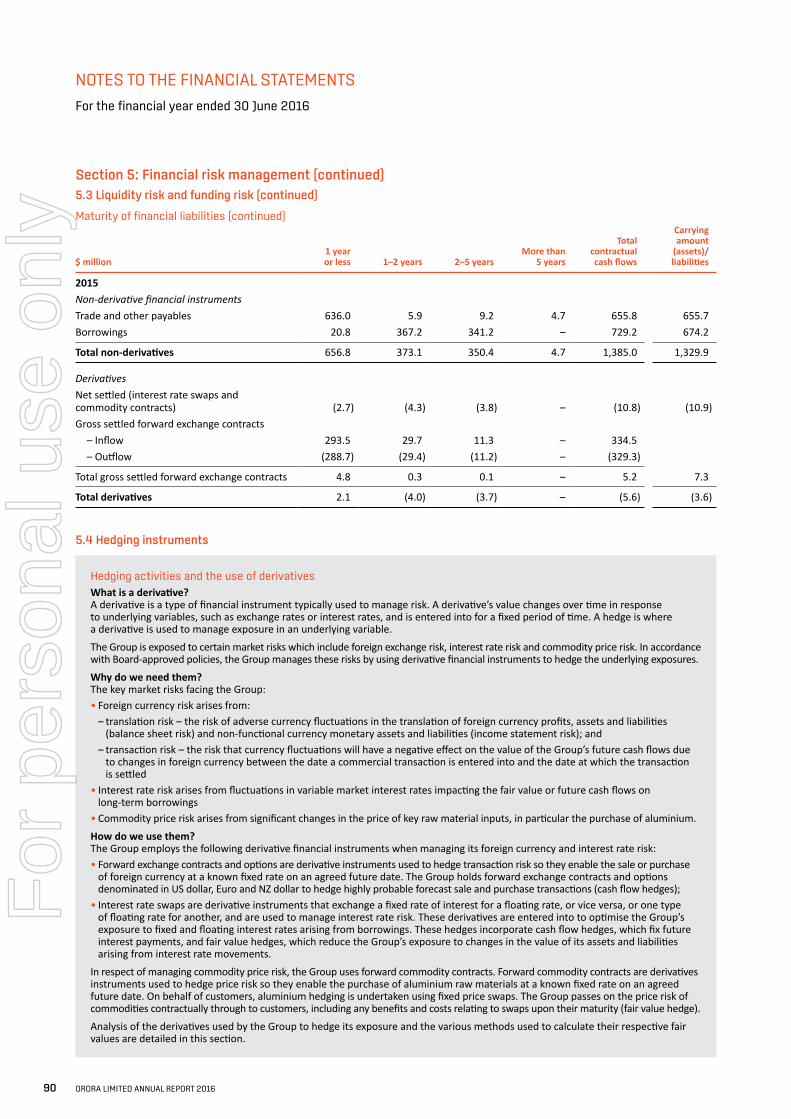
NOTES TO THE FINANCIAL STATEMENTS
For the financial year ended 30 June 2016
$ million1 year or less 1–2 years 2–5 years
More than 5 years
Total contractual cash flows
Carrying amount
(assets)/ liabilities
2015Non-derivative financial instrumentsTrade and other payables 636.0 5.9 9.2 4.7 655.8 655.7 Borrowings 20.8 367.2 341.2 – 729.2 674.2
Total non-derivatives 656.8 373.1 350.4 4.7 1,385.0 1,329.9
DerivativesNet settled (interest rate swaps and commodity contracts) (2.7) (4.3) (3.8) – (10.8) (10.9)Gross settled forward exchange contracts – Inflow 293.5 29.7 11.3 – 334.5 – Outflow (288.7) (29.4) (11.2) – (329.3)
Total gross settled forward exchange contracts 4.8 0.3 0.1 – 5.2 7.3
Total derivatives 2.1 (4.0) (3.7) – (5.6) (3.6)
5.4 Hedging instruments
Hedging activities and the use of derivativesWhat is a derivative?A derivative is a type of financial instrument typically used to manage risk. A derivative’s value changes over time in response to underlying variables, such as exchange rates or interest rates, and is entered into for a fixed period of time. A hedge is where a derivative is used to manage exposure in an underlying variable.
The Group is exposed to certain market risks which include foreign exchange risk, interest rate risk and commodity price risk. In accordance with Board-approved policies, the Group manages these risks by using derivative financial instruments to hedge the underlying exposures.
Why do we need them?The key market risks facing the Group:• Foreign currency risk arises from:
– translation risk – the risk of adverse currency fluctuations in the translation of foreign currency profits, assets and liabilities (balance sheet risk) and non-functional currency monetary assets and liabilities (income statement risk); and – transaction risk – the risk that currency fluctuations will have a negative effect on the value of the Group’s future cash flows due to changes in foreign currency between the date a commercial transaction is entered into and the date at which the transaction is settled
• Interest rate risk arises from fluctuations in variable market interest rates impacting the fair value or future cash flows on long-term borrowings
• Commodity price risk arises from significant changes in the price of key raw material inputs, in particular the purchase of aluminium.
How do we use them?The Group employs the following derivative financial instruments when managing its foreign currency and interest rate risk:• Forward exchange contracts and options are derivative instruments used to hedge transaction risk so they enable the sale or purchase
of foreign currency at a known fixed rate on an agreed future date. The Group holds forward exchange contracts and options denominated in US dollar, Euro and NZ dollar to hedge highly probable forecast sale and purchase transactions (cash flow hedges);
• Interest rate swaps are derivative instruments that exchange a fixed rate of interest for a floating rate, or vice versa, or one type of floating rate for another, and are used to manage interest rate risk. These derivatives are entered into to optimise the Group’s exposure to fixed and floating interest rates arising from borrowings. These hedges incorporate cash flow hedges, which fix future interest payments, and fair value hedges, which reduce the Group’s exposure to changes in the value of its assets and liabilities arising from interest rate movements.
In respect of managing commodity price risk, the Group uses forward commodity contracts. Forward commodity contracts are derivatives instruments used to hedge price risk so they enable the purchase of aluminium raw materials at a known fixed rate on an agreed future date. On behalf of customers, aluminium hedging is undertaken using fixed price swaps. The Group passes on the price risk of commodities contractually through to customers, including any benefits and costs relating to swaps upon their maturity (fair value hedge).
Analysis of the derivatives used by the Group to hedge its exposure and the various methods used to calculate their respective fair values are detailed in this section.
Section 5: Financial risk management (continued)5.3 Liquidity risk and funding risk (continued)
Maturity of financial liabilities (continued)
90 ORORA LIMITED ANNUAL REPORT 2016
For
per
sona
l use
onl
y
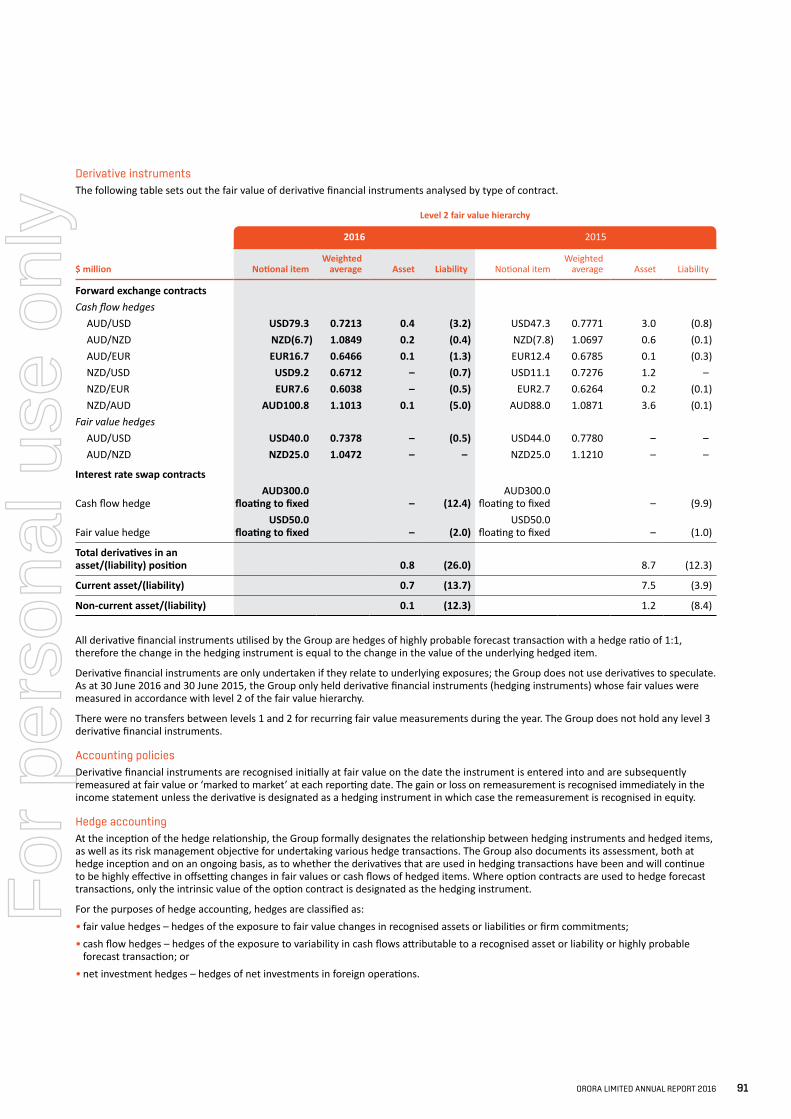
Derivative instrumentsThe following table sets out the fair value of derivative financial instruments analysed by type of contract.
$ million
Level 2 fair value hierarchy
2016 2015
Notional itemWeighted
average Asset Liability Notional itemWeighted
average Asset Liability
Forward exchange contractsCash flow hedges AUD/USD USD79.3 0.7213 0.4 (3.2) USD47.3 0.7771 3.0 (0.8) AUD/NZD NZD(6.7) 1.0849 0.2 (0.4) NZD(7.8) 1.0697 0.6 (0.1) AUD/EUR EUR16.7 0.6466 0.1 (1.3) EUR12.4 0.6785 0.1 (0.3) NZD/USD USD9.2 0.6712 – (0.7) USD11.1 0.7276 1.2 – NZD/EUR EUR7.6 0.6038 – (0.5) EUR2.7 0.6264 0.2 (0.1) NZD/AUD AUD100.8 1.1013 0.1 (5.0) AUD88.0 1.0871 3.6 (0.1)Fair value hedges AUD/USD USD40.0 0.7378 – (0.5) USD44.0 0.7780 – – AUD/NZD NZD25.0 1.0472 – – NZD25.0 1.1210 – –
Interest rate swap contracts
Cash flow hedgeAUD300.0
floating to fixed – (12.4)AUD300.0
floating to fixed – (9.9)
Fair value hedgeUSD50.0
floating to fixed – (2.0)USD50.0
floating to fixed – (1.0)
Total derivatives in an asset/(liability) position 0.8 (26.0) 8.7 (12.3)
Current asset/(liability) 0.7 (13.7) 7.5 (3.9)
Non-current asset/(liability) 0.1 (12.3) 1.2 (8.4)
All derivative financial instruments utilised by the Group are hedges of highly probable forecast transaction with a hedge ratio of 1:1, therefore the change in the hedging instrument is equal to the change in the value of the underlying hedged item.
Derivative financial instruments are only undertaken if they relate to underlying exposures; the Group does not use derivatives to speculate. As at 30 June 2016 and 30 June 2015, the Group only held derivative financial instruments (hedging instruments) whose fair values were measured in accordance with level 2 of the fair value hierarchy.
There were no transfers between levels 1 and 2 for recurring fair value measurements during the year. The Group does not hold any level 3 derivative financial instruments.
Accounting policiesDerivative financial instruments are recognised initially at fair value on the date the instrument is entered into and are subsequently remeasured at fair value or ‘marked to market’ at each reporting date. The gain or loss on remeasurement is recognised immediately in the income statement unless the derivative is designated as a hedging instrument in which case the remeasurement is recognised in equity.
Hedge accountingAt the inception of the hedge relationship, the Group formally designates the relationship between hedging instruments and hedged items, as well as its risk management objective for undertaking various hedge transactions. The Group also documents its assessment, both at hedge inception and on an ongoing basis, as to whether the derivatives that are used in hedging transactions have been and will continue to be highly effective in offsetting changes in fair values or cash flows of hedged items. Where option contracts are used to hedge forecast transactions, only the intrinsic value of the option contract is designated as the hedging instrument.
For the purposes of hedge accounting, hedges are classified as:• fair value hedges – hedges of the exposure to fair value changes in recognised assets or liabilities or firm commitments;• cash flow hedges – hedges of the exposure to variability in cash flows attributable to a recognised asset or liability or highly probable
forecast transaction; or• net investment hedges – hedges of net investments in foreign operations.
ORORA LIMITED ANNUAL REPORT 2016 91
For
per
sona
l use
onl
y
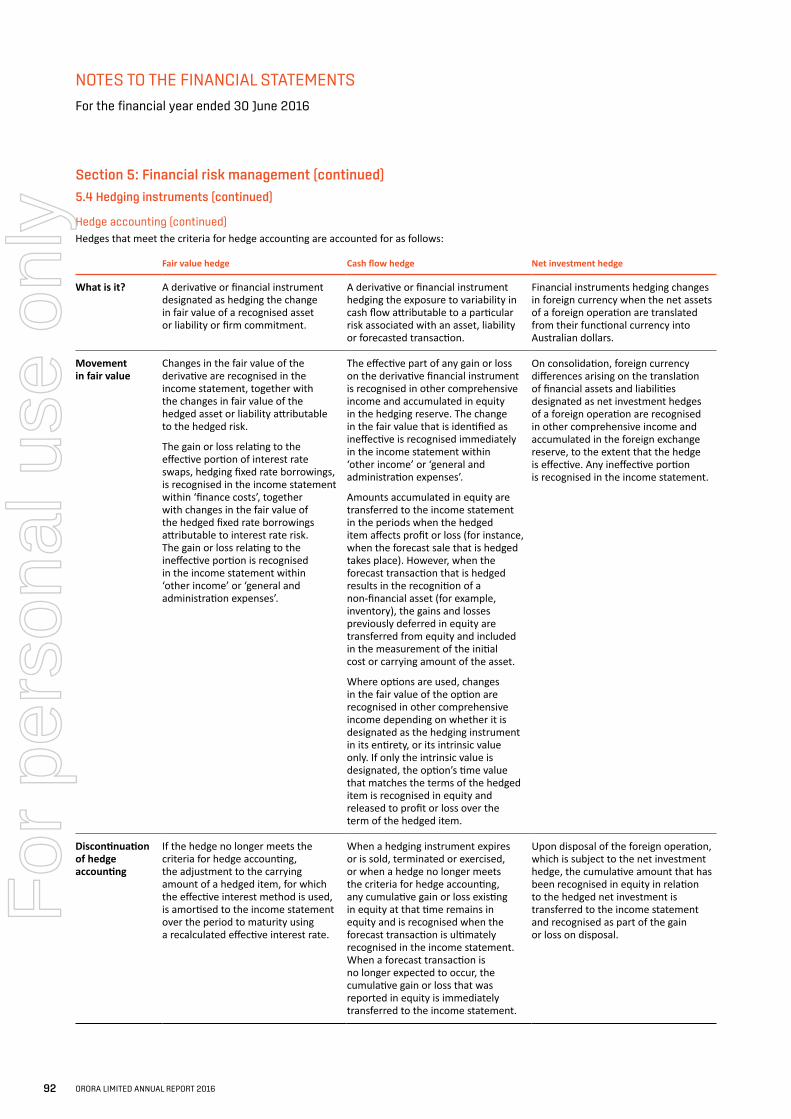
NOTES TO THE FINANCIAL STATEMENTS
For the financial year ended 30 June 2016
Section 5: Financial risk management (continued)
5.4 Hedging instruments (continued)
Hedge accounting (continued)Hedges that meet the criteria for hedge accounting are accounted for as follows:
Fair value hedge Cash flow hedge Net investment hedge
What is it? A derivative or financial instrument designated as hedging the change in fair value of a recognised asset or liability or firm commitment.
A derivative or financial instrument hedging the exposure to variability in cash flow attributable to a particular risk associated with an asset, liability or forecasted transaction.
Financial instruments hedging changes in foreign currency when the net assets of a foreign operation are translated from their functional currency into Australian dollars.
Movement in fair value
Changes in the fair value of the derivative are recognised in the income statement, together with the changes in fair value of the hedged asset or liability attributable to the hedged risk.
The gain or loss relating to the effective portion of interest rate swaps, hedging fixed rate borrowings, is recognised in the income statement within ‘finance costs’, together with changes in the fair value of the hedged fixed rate borrowings attributable to interest rate risk. The gain or loss relating to the ineffective portion is recognised in the income statement within ‘other income’ or ‘general and administration expenses’.
The effective part of any gain or loss on the derivative financial instrument is recognised in other comprehensive income and accumulated in equity in the hedging reserve. The change in the fair value that is identified as ineffective is recognised immediately in the income statement within ‘other income’ or ‘general and administration expenses’.
Amounts accumulated in equity are transferred to the income statement in the periods when the hedged item affects profit or loss (for instance, when the forecast sale that is hedged takes place). However, when the forecast transaction that is hedged results in the recognition of a non-financial asset (for example, inventory), the gains and losses previously deferred in equity are transferred from equity and included in the measurement of the initial cost or carrying amount of the asset.
Where options are used, changes in the fair value of the option are recognised in other comprehensive income depending on whether it is designated as the hedging instrument in its entirety, or its intrinsic value only. If only the intrinsic value is designated, the option’s time value that matches the terms of the hedged item is recognised in equity and released to profit or loss over the term of the hedged item.
On consolidation, foreign currency differences arising on the translation of financial assets and liabilities designated as net investment hedges of a foreign operation are recognised in other comprehensive income and accumulated in the foreign exchange reserve, to the extent that the hedge is effective. Any ineffective portion is recognised in the income statement.
Discontinuation of hedge accounting
If the hedge no longer meets the criteria for hedge accounting, the adjustment to the carrying amount of a hedged item, for which the effective interest method is used, is amortised to the income statement over the period to maturity using a recalculated effective interest rate.
When a hedging instrument expires or is sold, terminated or exercised, or when a hedge no longer meets the criteria for hedge accounting, any cumulative gain or loss existing in equity at that time remains in equity and is recognised when the forecast transaction is ultimately recognised in the income statement. When a forecast transaction is no longer expected to occur, the cumulative gain or loss that was reported in equity is immediately transferred to the income statement.
Upon disposal of the foreign operation, which is subject to the net investment hedge, the cumulative amount that has been recognised in equity in relation to the hedged net investment is transferred to the income statement and recognised as part of the gain or loss on disposal.
92 ORORA LIMITED ANNUAL REPORT 2016
For
per
sona
l use
onl
y
RebalancingIf the hedging ratio for risk management purposes is no longer optimal but the risk management objective remains unchanged and the hedge continues to qualify for hedge accounting, the hedge relationship will be rebalanced by adjusting either the volume of the hedging instrument or the volume of the hedged item so that the hedge ratio aligns with the ratio used for risk management purposes. Any hedge ineffectiveness is calculated and accounted for in profit or loss at the time of the hedge relationship rebalancing.
Key judgements and estimatesThe Orora Group Treasury team performs the financial instrument valuations and reports directly to the Chief Financial Officer (CFO) and the Audit & Compliance Committee. Discussions of valuation processes and results are held with the CFO and Orora Group Treasury at least once every six months, in line with the Group’s half-yearly reporting requirements. Significant valuation issues are reported to the Audit & Compliance Committee.
When measuring the fair value of an asset or liability, the Group uses market observable data as far as possible. Fair values are categorised into three levels as prescribed under accounting standards, with each of these levels indicating the reliability of the inputs used in determining fair value. The levels in the fair value hierarchy are:
Level 1: fair value identified from quoted price traded in an active market for an identical asset or liability at the end of the reporting period. The quoted market price used for assets is the last bid price.
Level 2: fair value determined using valuation techniques that maximise the use of observable market data and rely as little as possible on entity-specific estimates. All significant inputs used in the valuation method are observable.
Level 3: one or more of the significant inputs in determining fair value for the asset or liability is not based on observable market data (unobservable input).
Determining fair valueThe specific valuation techniques used to value derivative financial instruments are as follows:• the fair value of forward exchange contracts and currency options is determined by using the difference between the contract
exchange rate and the quoted exchange rate at the reporting date;• the fair value of interest rate swaps calculated as the present value of the estimated future cash flows – i.e. the amounts that the
Group would receive or pay to terminate the swap at the reporting date, based on observable yield curves;• the fair value of commodity forward contracts is determined by using the difference between the contract commodity price and
the quoted price at the reporting date.
ORORA LIMITED ANNUAL REPORT 2016 93
For
per
sona
l use
onl
y
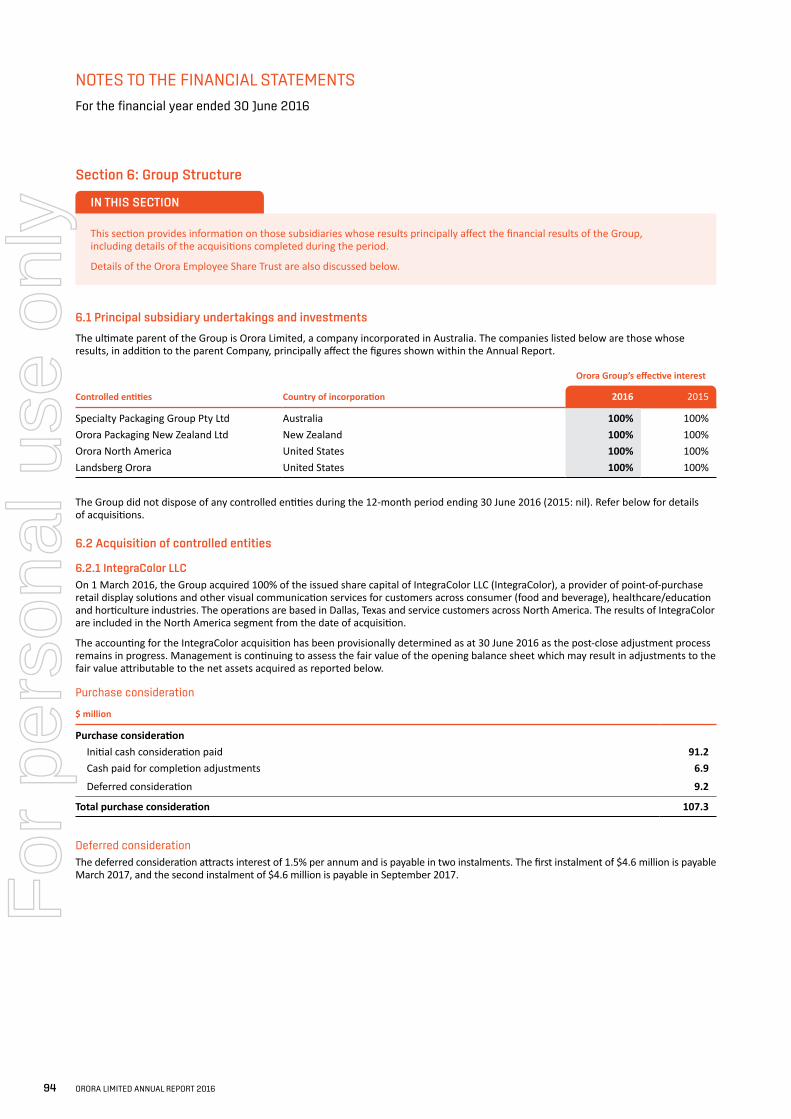
NOTES TO THE FINANCIAL STATEMENTS
For the financial year ended 30 June 2016
Section 6: Group Structure
This section provides information on those subsidiaries whose results principally affect the financial results of the Group, including details of the acquisitions completed during the period.
Details of the Orora Employee Share Trust are also discussed below.
6.1 Principal subsidiary undertakings and investments
The ultimate parent of the Group is Orora Limited, a company incorporated in Australia. The companies listed below are those whose results, in addition to the parent Company, principally affect the figures shown within the Annual Report.
Controlled entities Country of incorporation
Orora Group’s effective interest
2016 2015
Specialty Packaging Group Pty Ltd Australia 100% 100%Orora Packaging New Zealand Ltd New Zealand 100% 100%Orora North America United States 100% 100%Landsberg Orora United States 100% 100%
The Group did not dispose of any controlled entities during the 12-month period ending 30 June 2016 (2015: nil). Refer below for details of acquisitions.
6.2 Acquisition of controlled entities
6.2.1 IntegraColor LLCOn 1 March 2016, the Group acquired 100% of the issued share capital of IntegraColor LLC (IntegraColor), a provider of point-of-purchase retail display solutions and other visual communication services for customers across consumer (food and beverage), healthcare/education and horticulture industries. The operations are based in Dallas, Texas and service customers across North America. The results of IntegraColor are included in the North America segment from the date of acquisition.
The accounting for the IntegraColor acquisition has been provisionally determined as at 30 June 2016 as the post-close adjustment process remains in progress. Management is continuing to assess the fair value of the opening balance sheet which may result in adjustments to the fair value attributable to the net assets acquired as reported below.
Purchase consideration
$ million
Purchase consideration Initial cash consideration paid 91.2 Cash paid for completion adjustments 6.9
Deferred consideration 9.2
Total purchase consideration 107.3
Deferred considerationThe deferred consideration attracts interest of 1.5% per annum and is payable in two instalments. The first instalment of $4.6 million is payable March 2017, and the second instalment of $4.6 million is payable in September 2017.
IN THIS SECTION
94 ORORA LIMITED ANNUAL REPORT 2016
For
per
sona
l use
onl
y
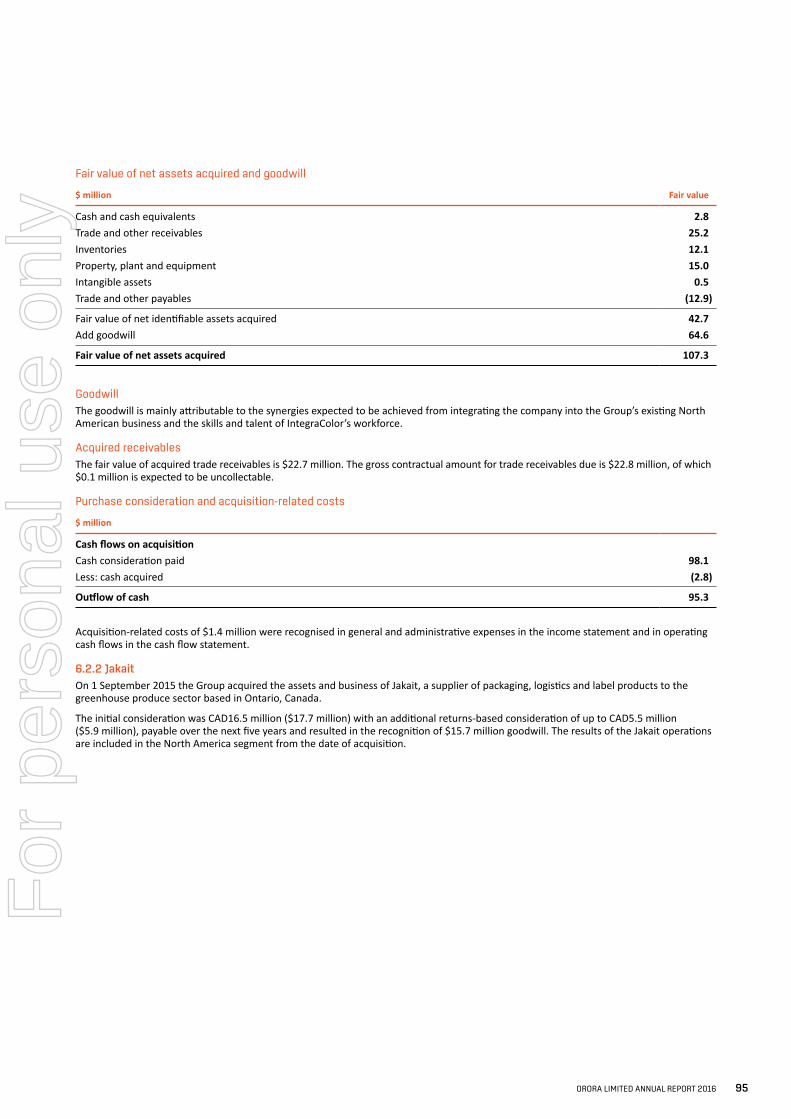
Fair value of net assets acquired and goodwill
$ million Fair value
Cash and cash equivalents 2.8 Trade and other receivables 25.2 Inventories 12.1 Property, plant and equipment 15.0 Intangible assets 0.5 Trade and other payables (12.9)
Fair value of net identifiable assets acquired 42.7 Add goodwill 64.6
Fair value of net assets acquired 107.3
GoodwillThe goodwill is mainly attributable to the synergies expected to be achieved from integrating the company into the Group’s existing North American business and the skills and talent of IntegraColor’s workforce.
Acquired receivablesThe fair value of acquired trade receivables is $22.7 million. The gross contractual amount for trade receivables due is $22.8 million, of which $0.1 million is expected to be uncollectable.
Purchase consideration and acquisition-related costs
$ million
Cash flows on acquisitionCash consideration paid 98.1 Less: cash acquired (2.8)
Outflow of cash 95.3
Acquisition-related costs of $1.4 million were recognised in general and administrative expenses in the income statement and in operating cash flows in the cash flow statement.
6.2.2 JakaitOn 1 September 2015 the Group acquired the assets and business of Jakait, a supplier of packaging, logistics and label products to the greenhouse produce sector based in Ontario, Canada.
The initial consideration was CAD16.5 million ($17.7 million) with an additional returns-based consideration of up to CAD5.5 million ($5.9 million), payable over the next five years and resulted in the recognition of $15.7 million goodwill. The results of the Jakait operations are included in the North America segment from the date of acquisition.
ORORA LIMITED ANNUAL REPORT 2016 95
For
per
sona
l use
onl
y
NOTES TO THE FINANCIAL STATEMENTS
For the financial year ended 30 June 2016
Section 6: Group Structure (continued)
6.3 Orora Employee Share Trust
The Group holds shares in itself as a result of shares purchased by the Orora Employee Share Trust (the Trust). The Trust was established to manage and administer the Company’s responsibilities under the Group’s Employee Share Plans (refer note 7.1) through the acquiring, holding and transferring of shares, or rights to shares, in the Company to participating employees. In respect of these transactions, at any point in time the Trust may hold ‘allocated’ and ‘unallocated’ shares.
Allocated sharesAllocated shares represent those shares that have been purchased and awarded to employees under the CEO Grant (refer note 7.1). Shares granted to an employee under the CEO Grant are restricted in that the employee is unable to dispose of the shares for a period of up to five years (or as otherwise determined by the Board). The Trust holds these shares on behalf of the employee until the restriction period is lifted at which time the Trust releases the shares to the employee. Allocated shares are not identified or accounted for as treasury shares.
Where the Orora Employee Share Trust purchases equity instruments in the Company, as a result of managing the Company’s responsibilities under the Group’s CEO Grant Employee Share Plan award, the consideration paid, including any directly attributable costs, is deducted from equity, net of any related income tax effects.
Unallocated sharesUnallocated shares represent those shares that have been purchased by the Trustee on-market to satisfy the potential future vesting of awards granted under the Group’s Employee Shares Plans, other than the CEO Grant. As the shares are unallocated they are identified and accounted for as treasury shares (Treasury Shares) refer note 4.4.1.
Accounting policiesAs at 30 June 2016, the Trust held 15,179,750 Treasury Shares (unallocated shares) in the Company (2015: 6,460,678) and 1,199,190 allocated shares in respect of the CEO Grant (2015: 932,132).
Transactions with the Group-sponsored Trust are included in these financial statements. In particular, the Trust’s purchases of shares in Orora Limited are debited directly to equity. The shares are held in the Trust until such time as they may be transferred to participants of the various Group share schemes. In accordance with the Trust Deed, the Trustees have the power to exercise all voting rights in relation to any investment (including shares) held within the Trust.
Subsequent to the end of the current reporting period, on 15 August 2016 the Board authorised management to issue a request to the Trustee to waive all right and entitlement to be paid the final FY16 dividend in respect of Treasury Shares held by the Trust. As a result, assuming the Trustee grants the request, the Treasury Shares will not receive a dividend payment in respect of the final FY16 dividend.
96 ORORA LIMITED ANNUAL REPORT 2016
For
per
sona
l use
onl
y
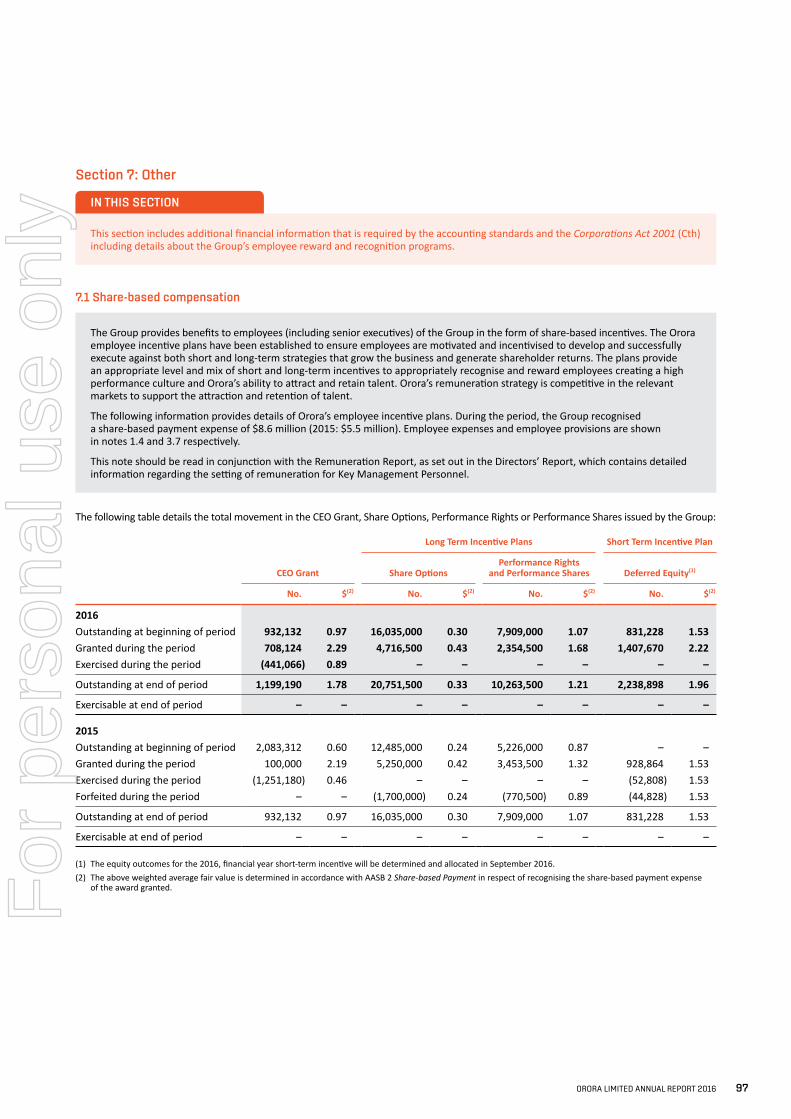
Section 7: Other
This section includes additional financial information that is required by the accounting standards and the Corporations Act 2001 (Cth) including details about the Group’s employee reward and recognition programs.
7.1 Share-based compensation
The Group provides benefits to employees (including senior executives) of the Group in the form of share-based incentives. The Orora employee incentive plans have been established to ensure employees are motivated and incentivised to develop and successfully execute against both short and long-term strategies that grow the business and generate shareholder returns. The plans provide an appropriate level and mix of short and long-term incentives to appropriately recognise and reward employees creating a high performance culture and Orora’s ability to attract and retain talent. Orora’s remuneration strategy is competitive in the relevant markets to support the attraction and retention of talent.
The following information provides details of Orora’s employee incentive plans. During the period, the Group recognised a share-based payment expense of $8.6 million (2015: $5.5 million). Employee expenses and employee provisions are shown in notes 1.4 and 3.7 respectively.
This note should be read in conjunction with the Remuneration Report, as set out in the Directors’ Report, which contains detailed information regarding the setting of remuneration for Key Management Personnel.
The following table details the total movement in the CEO Grant, Share Options, Performance Rights or Performance Shares issued by the Group:
CEO Grant
Long Term Incentive Plans Short Term Incentive Plan
Share OptionsPerformance Rights
and Performance Shares Deferred Equity(1)
No. $(2) No. $(2) No. $(2) No. $(2)
2016Outstanding at beginning of period 932,132 0.97 16,035,000 0.30 7,909,000 1.07 831,228 1.53 Granted during the period 708,124 2.29 4,716,500 0.43 2,354,500 1.68 1,407,670 2.22 Exercised during the period (441,066) 0.89 – – – – – –
Outstanding at end of period 1,199,190 1.78 20,751,500 0.33 10,263,500 1.21 2,238,898 1.96
Exercisable at end of period – – – – – – – –
2015Outstanding at beginning of period 2,083,312 0.60 12,485,000 0.24 5,226,000 0.87 – – Granted during the period 100,000 2.19 5,250,000 0.42 3,453,500 1.32 928,864 1.53 Exercised during the period (1,251,180) 0.46 – – – – (52,808) 1.53 Forfeited during the period – – (1,700,000) 0.24 (770,500) 0.89 (44,828) 1.53
Outstanding at end of period 932,132 0.97 16,035,000 0.30 7,909,000 1.07 831,228 1.53
Exercisable at end of period – – – – – – – –
(1) The equity outcomes for the 2016, financial year short-term incentive will be determined and allocated in September 2016.(2) The above weighted average fair value is determined in accordance with AASB 2 Share-based Payment in respect of recognising the share-based payment expense
of the award granted.
IN THIS SECTION
ORORA LIMITED ANNUAL REPORT 2016 97
For
per
sona
l use
onl
y
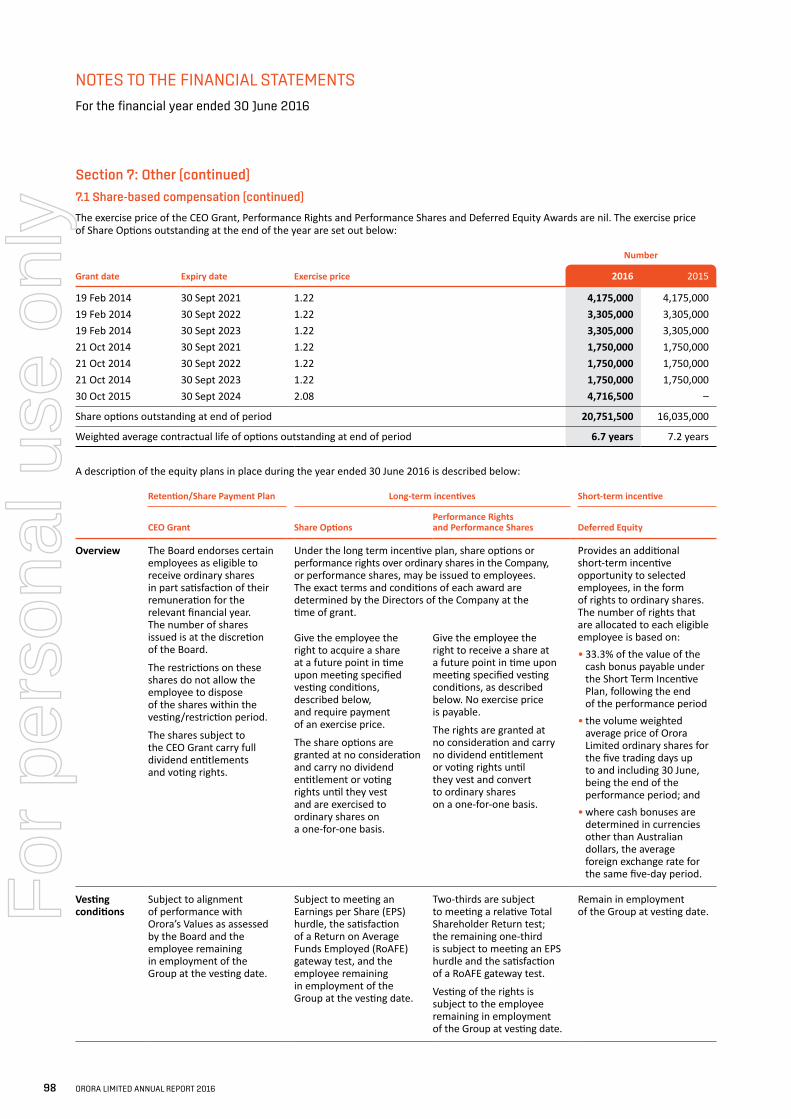
NOTES TO THE FINANCIAL STATEMENTS
For the financial year ended 30 June 2016
Section 7: Other (continued)
7.1 Share-based compensation (continued)
The exercise price of the CEO Grant, Performance Rights and Performance Shares and Deferred Equity Awards are nil. The exercise price of Share Options outstanding at the end of the year are set out below:
Grant date Expiry date Exercise price
Number
2016 2015
19 Feb 2014 30 Sept 2021 1.22 4,175,000 4,175,000 19 Feb 2014 30 Sept 2022 1.22 3,305,000 3,305,000 19 Feb 2014 30 Sept 2023 1.22 3,305,000 3,305,000 21 Oct 2014 30 Sept 2021 1.22 1,750,000 1,750,000 21 Oct 2014 30 Sept 2022 1.22 1,750,000 1,750,000 21 Oct 2014 30 Sept 2023 1.22 1,750,000 1,750,000 30 Oct 2015 30 Sept 2024 2.08 4,716,500 –
Share options outstanding at end of period 20,751,500 16,035,000
Weighted average contractual life of options outstanding at end of period 6.7 years 7.2 years
A description of the equity plans in place during the year ended 30 June 2016 is described below:
Retention/Share Payment Plan Long-term incentives Short-term incentive
CEO Grant Share OptionsPerformance Rights and Performance Shares Deferred Equity
Overview The Board endorses certain employees as eligible to receive ordinary shares in part satisfaction of their remuneration for the relevant financial year. The number of shares issued is at the discretion of the Board.
The restrictions on these shares do not allow the employee to dispose of the shares within the vesting/restriction period.
The shares subject to the CEO Grant carry full dividend entitlements and voting rights.
Under the long term incentive plan, share options or performance rights over ordinary shares in the Company, or performance shares, may be issued to employees. The exact terms and conditions of each award are determined by the Directors of the Company at the time of grant.
Provides an additional short-term incentive opportunity to selected employees, in the form of rights to ordinary shares. The number of rights that are allocated to each eligible employee is based on:• 33.3% of the value of the
cash bonus payable under the Short Term Incentive Plan, following the end of the performance period
• the volume weighted average price of Orora Limited ordinary shares for the five trading days up to and including 30 June, being the end of the performance period; and
• where cash bonuses are determined in currencies other than Australian dollars, the average foreign exchange rate for the same five-day period.
Give the employee the right to acquire a share at a future point in time upon meeting specified vesting conditions, described below, and require payment of an exercise price.
The share options are granted at no consideration and carry no dividend entitlement or voting rights until they vest and are exercised to ordinary shares on a one-for-one basis.
Give the employee the right to receive a share at a future point in time upon meeting specified vesting conditions, as described below. No exercise price is payable.
The rights are granted at no consideration and carry no dividend entitlement or voting rights until they vest and convert to ordinary shares on a one-for-one basis.
Vesting conditions
Subject to alignment of performance with Orora’s Values as assessed by the Board and the employee remaining in employment of the Group at the vesting date.
Subject to meeting an Earnings per Share (EPS) hurdle, the satisfaction of a Return on Average Funds Employed (RoAFE) gateway test, and the employee remaining in employment of the Group at the vesting date.
Two-thirds are subject to meeting a relative Total Shareholder Return test; the remaining one-third is subject to meeting an EPS hurdle and the satisfaction of a RoAFE gateway test.
Vesting of the rights is subject to the employee remaining in employment of the Group at vesting date.
Remain in employment of the Group at vesting date.
98 ORORA LIMITED ANNUAL REPORT 2016
For
per
sona
l use
onl
y
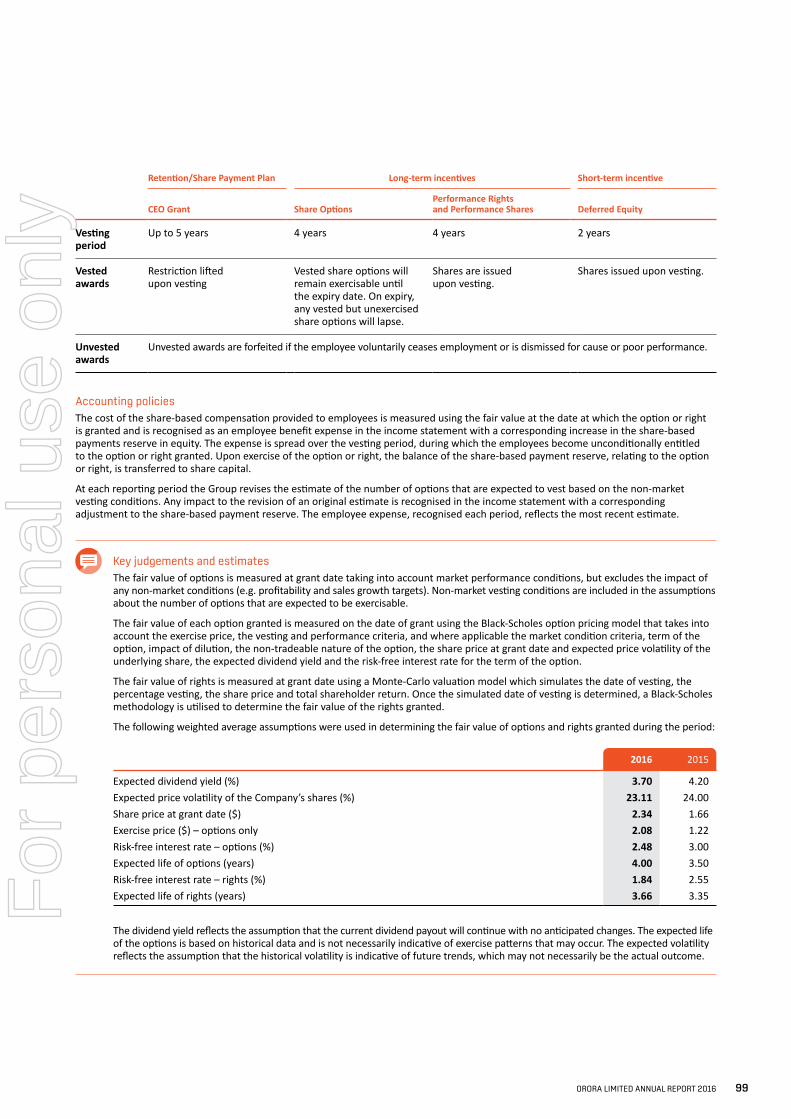
Retention/Share Payment Plan Long-term incentives Short-term incentive
CEO Grant Share OptionsPerformance Rights and Performance Shares Deferred Equity
Vesting period
Up to 5 years 4 years 4 years 2 years
Vested awards
Restriction lifted upon vesting
Vested share options will remain exercisable until the expiry date. On expiry, any vested but unexercised share options will lapse.
Shares are issued upon vesting.
Shares issued upon vesting.
Unvested awards
Unvested awards are forfeited if the employee voluntarily ceases employment or is dismissed for cause or poor performance.
Accounting policiesThe cost of the share-based compensation provided to employees is measured using the fair value at the date at which the option or right is granted and is recognised as an employee benefit expense in the income statement with a corresponding increase in the share-based payments reserve in equity. The expense is spread over the vesting period, during which the employees become unconditionally entitled to the option or right granted. Upon exercise of the option or right, the balance of the share-based payment reserve, relating to the option or right, is transferred to share capital.
At each reporting period the Group revises the estimate of the number of options that are expected to vest based on the non-market vesting conditions. Any impact to the revision of an original estimate is recognised in the income statement with a corresponding adjustment to the share-based payment reserve. The employee expense, recognised each period, reflects the most recent estimate.
Key judgements and estimatesThe fair value of options is measured at grant date taking into account market performance conditions, but excludes the impact of any non-market conditions (e.g. profitability and sales growth targets). Non-market vesting conditions are included in the assumptions about the number of options that are expected to be exercisable.
The fair value of each option granted is measured on the date of grant using the Black-Scholes option pricing model that takes into account the exercise price, the vesting and performance criteria, and where applicable the market condition criteria, term of the option, impact of dilution, the non-tradeable nature of the option, the share price at grant date and expected price volatility of the underlying share, the expected dividend yield and the risk-free interest rate for the term of the option.
The fair value of rights is measured at grant date using a Monte-Carlo valuation model which simulates the date of vesting, the percentage vesting, the share price and total shareholder return. Once the simulated date of vesting is determined, a Black-Scholes methodology is utilised to determine the fair value of the rights granted.
The following weighted average assumptions were used in determining the fair value of options and rights granted during the period:
2016 2015
Expected dividend yield (%) 3.70 4.20Expected price volatility of the Company’s shares (%) 23.11 24.00Share price at grant date ($) 2.34 1.66Exercise price ($) – options only 2.08 1.22Risk-free interest rate – options (%) 2.48 3.00Expected life of options (years) 4.00 3.50Risk-free interest rate – rights (%) 1.84 2.55Expected life of rights (years) 3.66 3.35
The dividend yield reflects the assumption that the current dividend payout will continue with no anticipated changes. The expected life of the options is based on historical data and is not necessarily indicative of exercise patterns that may occur. The expected volatility reflects the assumption that the historical volatility is indicative of future trends, which may not necessarily be the actual outcome.
ORORA LIMITED ANNUAL REPORT 2016 99
For
per
sona
l use
onl
y
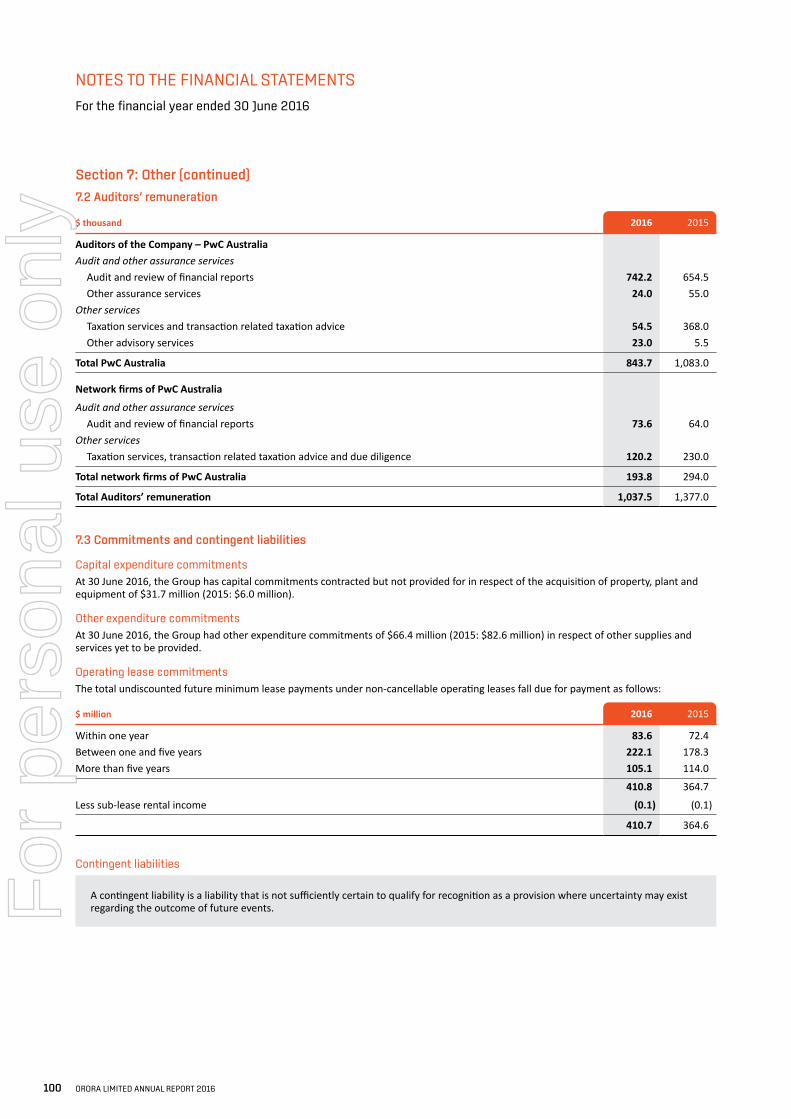
NOTES TO THE FINANCIAL STATEMENTS
For the financial year ended 30 June 2016
Section 7: Other (continued)
7.2 Auditors’ remuneration
$ thousand 2016 2015
Auditors of the Company – PwC AustraliaAudit and other assurance services Audit and review of financial reports 742.2 654.5 Other assurance services 24.0 55.0Other services Taxation services and transaction related taxation advice 54.5 368.0 Other advisory services 23.0 5.5
Total PwC Australia 843.7 1,083.0
Network firms of PwC Australia
Audit and other assurance services Audit and review of financial reports 73.6 64.0 Other services Taxation services, transaction related taxation advice and due diligence 120.2 230.0
Total network firms of PwC Australia 193.8 294.0
Total Auditors’ remuneration 1,037.5 1,377.0
7.3 Commitments and contingent liabilities
Capital expenditure commitmentsAt 30 June 2016, the Group has capital commitments contracted but not provided for in respect of the acquisition of property, plant and equipment of $31.7 million (2015: $6.0 million).
Other expenditure commitmentsAt 30 June 2016, the Group had other expenditure commitments of $66.4 million (2015: $82.6 million) in respect of other supplies and services yet to be provided.
Operating lease commitmentsThe total undiscounted future minimum lease payments under non-cancellable operating leases fall due for payment as follows:
$ million 2016 2015
Within one year 83.6 72.4 Between one and five years 222.1 178.3 More than five years 105.1 114.0
410.8 364.7
Less sub-lease rental income (0.1) (0.1)
410.7 364.6
Contingent liabilities
A contingent liability is a liability that is not sufficiently certain to qualify for recognition as a provision where uncertainty may exist regarding the outcome of future events.
100 ORORA LIMITED ANNUAL REPORT 2016
For
per
sona
l use
onl
y
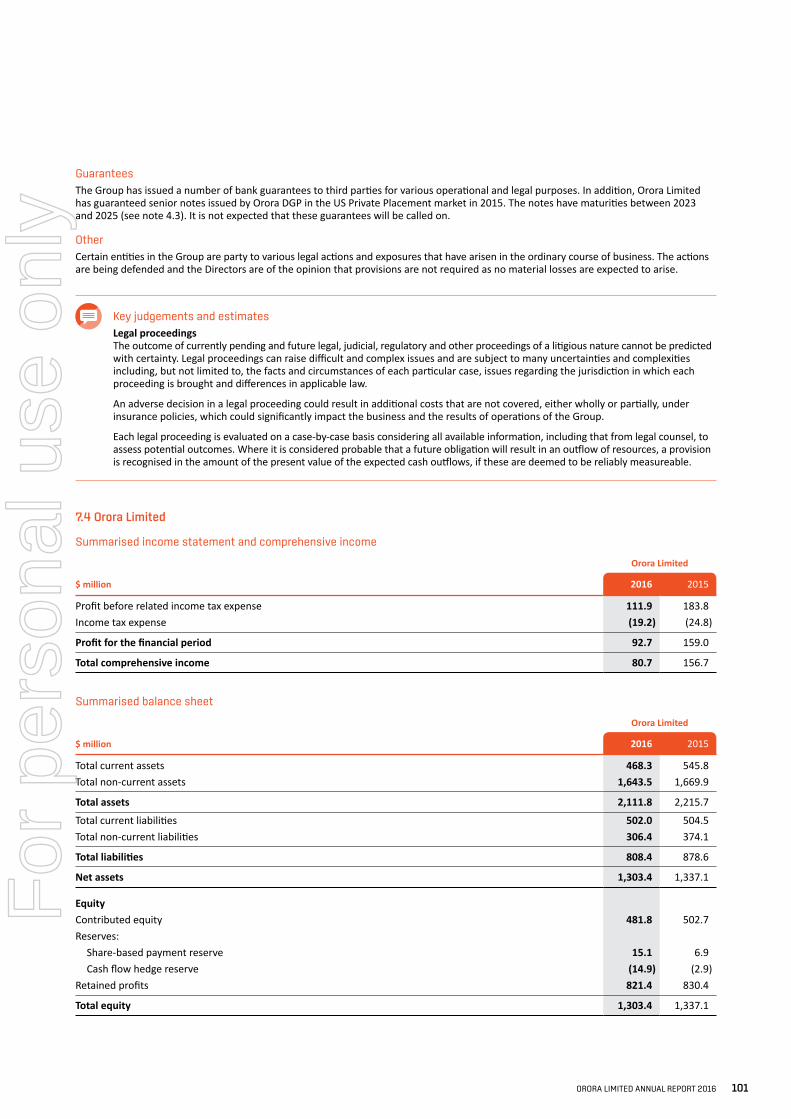
GuaranteesThe Group has issued a number of bank guarantees to third parties for various operational and legal purposes. In addition, Orora Limited has guaranteed senior notes issued by Orora DGP in the US Private Placement market in 2015. The notes have maturities between 2023 and 2025 (see note 4.3). It is not expected that these guarantees will be called on.
OtherCertain entities in the Group are party to various legal actions and exposures that have arisen in the ordinary course of business. The actions are being defended and the Directors are of the opinion that provisions are not required as no material losses are expected to arise.
Key judgements and estimatesLegal proceedingsThe outcome of currently pending and future legal, judicial, regulatory and other proceedings of a litigious nature cannot be predicted with certainty. Legal proceedings can raise difficult and complex issues and are subject to many uncertainties and complexities including, but not limited to, the facts and circumstances of each particular case, issues regarding the jurisdiction in which each proceeding is brought and differences in applicable law.
An adverse decision in a legal proceeding could result in additional costs that are not covered, either wholly or partially, under insurance policies, which could significantly impact the business and the results of operations of the Group.
Each legal proceeding is evaluated on a case-by-case basis considering all available information, including that from legal counsel, to assess potential outcomes. Where it is considered probable that a future obligation will result in an outflow of resources, a provision is recognised in the amount of the present value of the expected cash outflows, if these are deemed to be reliably measureable.
7.4 Orora Limited
Summarised income statement and comprehensive income
$ million
Orora Limited
2016 2015
Profit before related income tax expense 111.9 183.8 Income tax expense (19.2) (24.8)
Profit for the financial period 92.7 159.0
Total comprehensive income 80.7 156.7
Summarised balance sheet
$ million
Orora Limited
2016 2015
Total current assets 468.3 545.8 Total non-current assets 1,643.5 1,669.9
Total assets 2,111.8 2,215.7
Total current liabilities 502.0 504.5 Total non-current liabilities 306.4 374.1
Total liabilities 808.4 878.6
Net assets 1,303.4 1,337.1
EquityContributed equity 481.8 502.7 Reserves: Share-based payment reserve 15.1 6.9 Cash flow hedge reserve (14.9) (2.9)Retained profits 821.4 830.4
Total equity 1,303.4 1,337.1
ORORA LIMITED ANNUAL REPORT 2016 101
For
per
sona
l use
onl
y
NOTES TO THE FINANCIAL STATEMENTS
For the financial year ended 30 June 2016
Section 7: Other (continued)
7.4 Orora Limited (continued)
Orora Limited financial informationThe financial information for the parent entity, Orora Limited, has been prepared on the same basis as the consolidated financial statements, except as set out below.
Investments in subsidiariesIn the Company’s financial statements, investments in subsidiaries are carried at cost less, where applicable, accumulated impairment losses.
Tax consolidation regimeOrora Limited and its wholly-owned Australian resident entities have formed a tax-consolidated group and are therefore taxed as a single entity. The head entity within the tax-consolidated group is Orora Limited.
The Company, and the members of the tax-consolidated group, recognise their own current tax expense/income and deferred tax assets and liabilities arising from temporary differences using the ‘stand alone taxpayer’ approach by reference to the carrying amounts of assets and liabilities in the separate financial statements of each entity and the tax values applying under tax consolidation.
In addition to its current and deferred tax balances, the Company also recognises the current tax liabilities (or assets), and the deferred tax assets arising from unused tax losses and unused tax credits assumed from members of the tax-consolidated group, as part of the tax-consolidation arrangement. Assets or liabilities arising as part of the tax consolidation arrangement are recognised as current amounts receivable or payable from the other entities within the tax-consolidated group.
Nature of tax sharing agreementUpon tax consolidation, the entities within the tax-consolidated group entered into a tax sharing agreement. The terms of this agreement specify the methods of allocating any tax liability in the event of default by the Company on its group payment obligations and the treatment where a subsidiary member exits the group. The tax liability otherwise remains with the Company for tax purposes.
Contingent liabilities of Orora LimitedDeed of Cross GuaranteePursuant to the terms of the ASIC Class Order 98/1418 (as amended) dated 13 August 1998, which relieved certain wholly-owned subsidiaries from specific accounting and financial reporting requirements, Orora Limited and all of the Company’s Australian wholly-owned subsidiaries entered into an approved deed for the cross guarantee of liabilities. No liabilities subject to the Deed of Cross Guarantee at 30 June 2016 are expected to arise to Orora Limited and subsidiaries, as all such subsidiaries were financially sound and solvent at that date.
Details of the Deed and the consolidated financial position of the Company and the subsidiaries party to the Deed are set out in note 7.5.
Other guaranteesOrora Limited has guaranteed senior notes issued by Orora DGP in the US Private Placement Market in 2015. The notes have maturities between 2023 and 2025 (see note 4.3). It is not expected that these guarantees will be called on.
7.5 Deed of Cross Guarantee
The Company, Orora Limited, and the subsidiaries listed below are subject to a Deed of Cross Guarantee (Deed) under which each company guarantees the debts of the others:
Orora Packaging Australia Pty Ltd PP New Pty Ltd Pak Pacific Corporation Pty Ltd AP Chase Pty Ltd Fibre Containers (Queensland) Pty Ltd Lynyork Pty Ltd Speciality Packaging Group Pty Ltd Chapview Pty Ltd ACN 002693843 Box Pty Ltd AGAL Holdings Pty Ltd ACN 089523919 CCC Pty Ltd Rota Die Pty Ltd Rota Die International Pty Ltd Envirocrates Pty Ltd Orora Closure Systems Pty Ltd
Under the terms of ASIC Class Order 98/1418 (as amended), those wholly-owned subsidiaries that have entered into the Deed are granted relief from the Corporations Act 2001 requirement to prepare and lodge audited Financial Reports and Directors’ Reports.
102 ORORA LIMITED ANNUAL REPORT 2016
For
per
sona
l use
onl
y
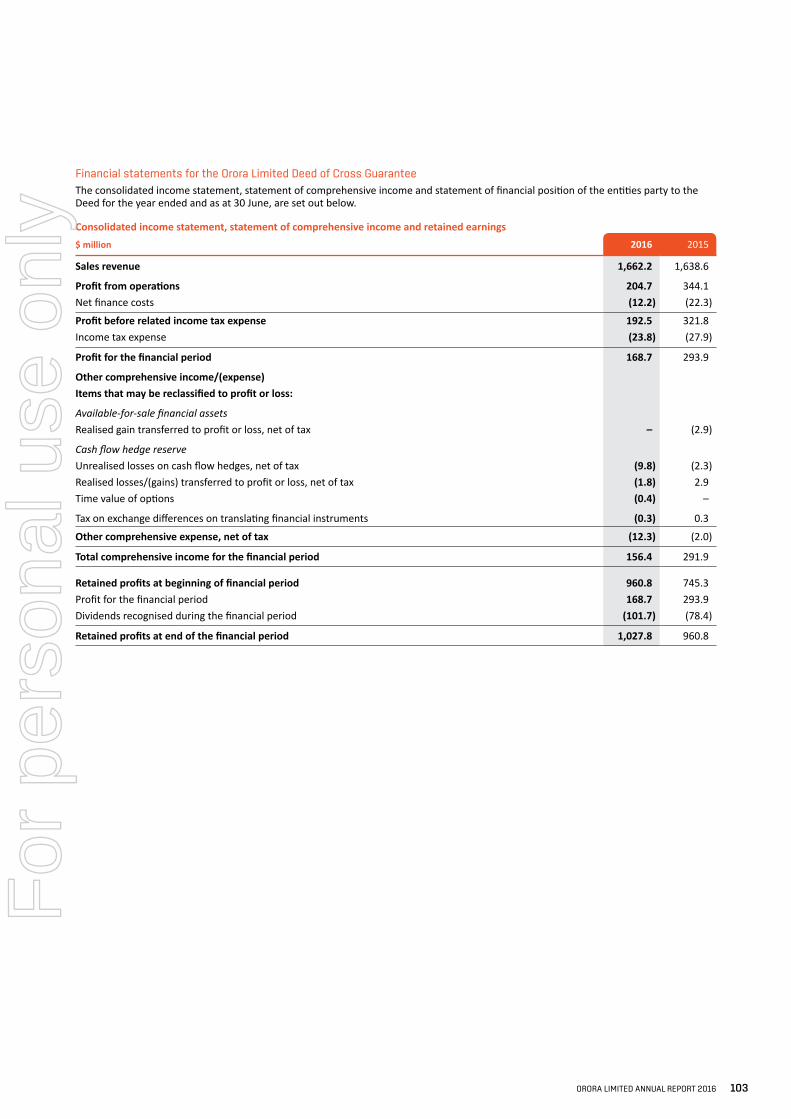
Financial statements for the Orora Limited Deed of Cross GuaranteeThe consolidated income statement, statement of comprehensive income and statement of financial position of the entities party to the Deed for the year ended and as at 30 June, are set out below.
Consolidated income statement, statement of comprehensive income and retained earnings$ million 2016 2015
Sales revenue 1,662.2 1,638.6
Profit from operations 204.7 344.1 Net finance costs (12.2) (22.3)
Profit before related income tax expense 192.5 321.8 Income tax expense (23.8) (27.9)
Profit for the financial period 168.7 293.9
Other comprehensive income/(expense)Items that may be reclassified to profit or loss:
Available-for-sale financial assetsRealised gain transferred to profit or loss, net of tax – (2.9)
Cash flow hedge reserveUnrealised losses on cash flow hedges, net of tax (9.8) (2.3)Realised losses/(gains) transferred to profit or loss, net of tax (1.8) 2.9 Time value of options (0.4) –
Tax on exchange differences on translating financial instruments (0.3) 0.3
Other comprehensive expense, net of tax (12.3) (2.0)
Total comprehensive income for the financial period 156.4 291.9
Retained profits at beginning of financial period 960.8 745.3 Profit for the financial period 168.7 293.9 Dividends recognised during the financial period (101.7) (78.4)
Retained profits at end of the financial period 1,027.8 960.8
ORORA LIMITED ANNUAL REPORT 2016 103
For
per
sona
l use
onl
y
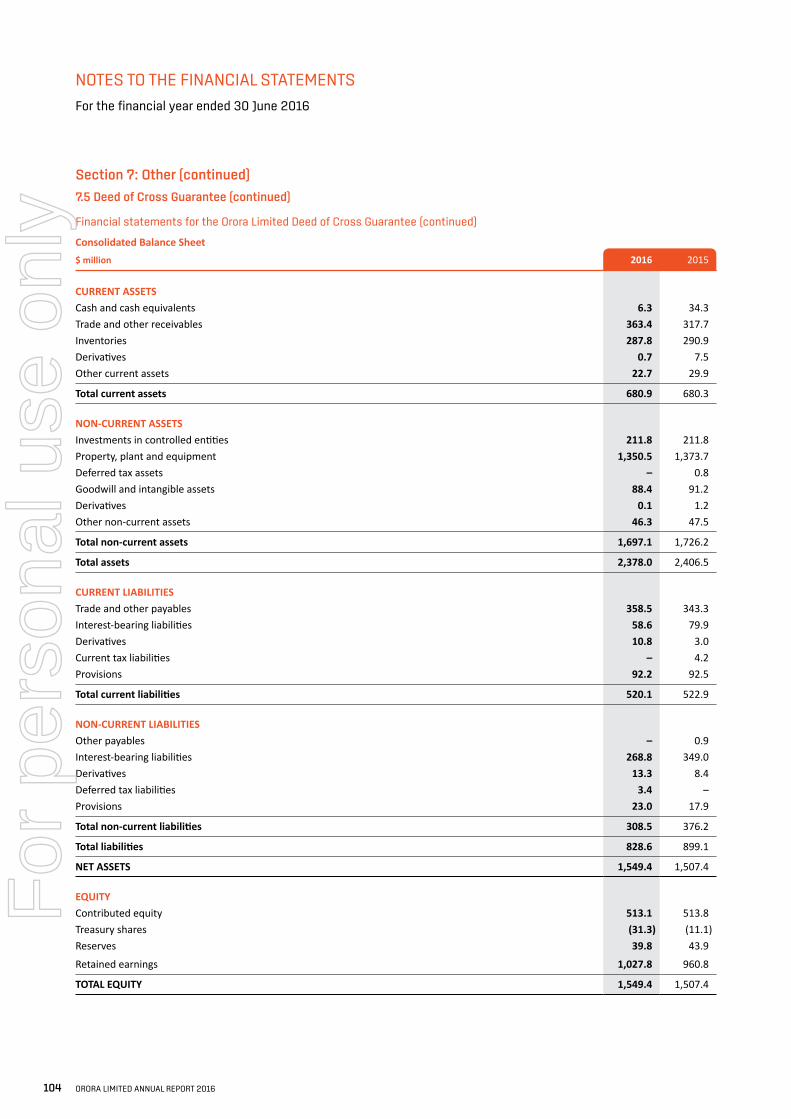
NOTES TO THE FINANCIAL STATEMENTS
For the financial year ended 30 June 2016
Section 7: Other (continued)
7.5 Deed of Cross Guarantee (continued)
Financial statements for the Orora Limited Deed of Cross Guarantee (continued)
Consolidated Balance Sheet$ million 2016 2015
CURRENT ASSETSCash and cash equivalents 6.3 34.3 Trade and other receivables 363.4 317.7 Inventories 287.8 290.9 Derivatives 0.7 7.5 Other current assets 22.7 29.9
Total current assets 680.9 680.3
NON-CURRENT ASSETSInvestments in controlled entities 211.8 211.8 Property, plant and equipment 1,350.5 1,373.7 Deferred tax assets – 0.8 Goodwill and intangible assets 88.4 91.2 Derivatives 0.1 1.2 Other non-current assets 46.3 47.5
Total non-current assets 1,697.1 1,726.2
Total assets 2,378.0 2,406.5
CURRENT LIABILITIESTrade and other payables 358.5 343.3 Interest-bearing liabilities 58.6 79.9 Derivatives 10.8 3.0 Current tax liabilities – 4.2 Provisions 92.2 92.5
Total current liabilities 520.1 522.9
NON-CURRENT LIABILITIESOther payables – 0.9 Interest-bearing liabilities 268.8 349.0 Derivatives 13.3 8.4 Deferred tax liabilities 3.4 – Provisions 23.0 17.9
Total non-current liabilities 308.5 376.2
Total liabilities 828.6 899.1
NET ASSETS 1,549.4 1,507.4
EQUITYContributed equity 513.1 513.8 Treasury shares (31.3) (11.1)Reserves 39.8 43.9
Retained earnings 1,027.8 960.8
TOTAL EQUITY 1,549.4 1,507.4
104 ORORA LIMITED ANNUAL REPORT 2016
For
per
sona
l use
onl
y
7.6 Related party transactions
The related parties identified by the Directors include investments and Key Management Personnel.
To enable users of our financial statements to form a view about the effects of related party relationships on the Group, we disclose the related party relationship when control exists, irrespective of whether there have been transactions between the related parties.
Details of investment in subsidiaries are disclosed in note 6.1 and details of the Orora Employee Share Trust are provided in note 6.3. The Group does not hold any interests in associates or joint ventures.
7.6.1 Parent entityThe ultimate parent entity within the Orora Group is Orora Limited, which is domiciled and incorporated in Australia. Transactions with entities in the wholly-owned Orora Group are made on normal commercial terms and conditions and during the year included:• purchases and sales of goods and services• advancement and repayment of loans• interest expense paid by Orora Limited for money borrowed• transfer of tax related balances for tax consolidation purposes• provision of transactional banking facilities on behalf of subsidiaries• provision of payroll, superannuation, share-based remuneration and managerial assistance.
7.6.2 Other related partiesContributions to superannuation funds on behalf of employees are disclosed in note 1.4.
7.7 Key Management Personnel
Key Management Personnel (KMP) consists of Orora Limited Executive and Non-Executive Directors, the Chief Financial Officer and the Group General Manager, Strategy. Key Management Personnel compensation is as follows:
$ thousand 2016 2015
Short-term employee benefits 4,785 4,821 Long-term employee benefits 80 64 Post employment benefits 201 190 Share-based payment expense 3,067 2,500
8,133 7,575
Detailed remuneration disclosures are provided in the Remuneration Report section of the Directors’ Report. Apart from the information disclosed in this note, no Director has entered into a material contract with the Group this financial year and there were no material contracts involving Directors’ interests existing at year end (2015: nil).
At 30 June 2016, no individual KMP or related party holds a loan with the Group (2015: nil).
7.8 New and amended accounting standards and interpretations
7.8.1 Adopted from 1 July 2015All new and amended Australian Accounting Standards mandatory as at 1 July 2015 to the Group have been adopted, including the early adoption of AASB 9 Financial Instruments (Dec 2014).
Although the adoption of these standards has resulted in some changes to the accounting policies of the Group, they have not resulted in any material adjustment to the amounts recognised in the financial statements. The adoption of AASB 9 (Dec 2014) is discussed further below.
AASB 9 Financial Instruments (Dec 2014)Orora early adopted and applied all of the requirements of AASB 9 (2014) including consequential amendments to other standards, from 1 July 2015.
The adoption of AASB 9 (Dec 2014) impacts the Group as follows:
Classification and measurementThe Group classified its financial assets and financial liabilities as subsequently measured at amortised cost or fair value in accordance with AASB 9 (2014). The principal impact on Orora’s financial assets at 1 July 2015 is the reclassification of cash and cash equivalents and trade and other receivables from ‘loans and receivables’ under AASB 139 to ‘financial assets at amortised cost’ under AASB 9 (Dec 2014).
There were no material changes in the measurement of the Group’s financial assets and financial liabilities as a result of the change in classification.
ORORA LIMITED ANNUAL REPORT 2016 105
For
per
sona
l use
onl
y
NOTES TO THE FINANCIAL STATEMENTS
For the financial year ended 30 June 2016
Section 7: Other (continued)
7.8 New and amended accounting standards and interpretations (continued)
7.8.1 Adopted from 1 July 2015 (continued)
AASB 9 Financial Instruments (Dec 2014) (continued)HedgingAASB 9 (2014) introduced a new hedge accounting model to simplify hedge accounting outcomes and more closely align hedge accounting with risk management objectives. This has resulted in the following key changes to Orora’s hedge accounting:• the intrinsic value of an option can now be designated as the hedging instrument, with the change in time value recognised in other
comprehensive income rather than in profit and loss. The amount recognised in other comprehensive income is then recycled to profit or loss either over the period of the hedge, if the hedge is time-related, or when the hedged transaction affects profit or loss, if the hedge is transaction related;
• effectiveness measurement testing will only be performed on a prospective basis with no defined numerical range of effectiveness applied in the testing.
Upon adoption of AASB 9 (Dec 2014), on 1 July 2015, there was a continuation of the existing hedge relationships. As a result, there was no material impact on the income statement, the statement of comprehensive income, balance sheet or statement of changes in equity.
The accounting policies for cash and cash equivalents (note 4.3), trade and other receivables (note 3.1) and derivative financial instruments (hedging instruments) (note 5.4) have been updated and are applicable from 1 July 2015. The terminology in these policies has been updated in accordance with the requirements of AASB 9 (Dec 2014). There has been no material change in the measurement and recognition of these items.
7.8.2 Issued but not yet effectiveThe following new or amended accounting standards issued by the AASB are relevant to current operations and may impact the Group in the period of initial application. They are available for early adoption but have not been applied in preparing this financial report.
AASB 15 Revenue from Contracts with CustomersAASB 15 replaces existing revenue recognition guidance, including AASB 118 Revenue, AASB 111 Construction Contracts, Interpretation 13 Customer Loyalty Programmes, Interpretation 15 Agreements for the Construction of Real Estate, Interpretation 18 Transfers of Assets from Customers and Interpretation 131 Revenue – Barter Transactions Involving Advertising Services. The new standard is based on the principle that revenue is recognised when control of a good or service transfers to a customer. The notion of control under AASB 15 replaces the existing notion of risks and rewards under the current accounting standards. The standard is applicable from 1 January 2018 with early adoption permitted.
The Group is currently assessing the potential impact of the new standard upon the Group’s revenue recognition policy and at this stage are unable to estimate the financial impact on adopting the standard. The standard is not however expected to have a material impact upon the financial results of the Group.
AASB 16 LeasesAASB 16 replaces the current dual operating/finance lease accounting model for lessees under AASB 117 Leases and the guidance contained in Interpretation 4 Determining whether an Arrangement contains a Lease. The new standard introduces a single, on-balance sheet accounting model, similar to the current finance lease accounting. Under the new standard Orora will be required to recognise a ‘right-of-use’ asset and a lease liability for all identified leased assets. The current operating lease expense will be replaced with a depreciation and finance charge.
The standard is applicable from 1 January 2019 with early adoption permitted with some targeted relief from the application of the lease accounting model where a lease is for a term of 12 months or less and for low value items.
The Group is currently assessing the impact of the new standard upon the income statement and balance sheet.
AASB 2016-5 Amendments to Australian Accounting Standards — Classification and Measurement of Share-based Payment TransactionsAASB 2016-5 amends the accounting for cash-settled share-based payments and equity-settled awards that include a ‘net settlement’ feature in respect of withholding taxes.
The amendment clarifies that the fair value of a cash-settled award is determined on a basis consistent with that used for equity-settled awards with any modification to a cash-settled award reflected immediately in the measurement of fair value. Any incremental value added to an equity-settled award is to be recognised over the remaining vesting period, any reduction in value is ignored.
In respect of net settlement features relating to withholdings taxes, the amendments require the entity to disclose an estimate of the amount that it expects to pay to the tax authority in respect of the withholding tax obligations.
The amendments are applicable from 1 January 2018, with early adoption permitted. At the date of this report, the assessment of the amendments made to AASB 2 by AASB 2016-5 indicate that there will be no impact upon the financial performance or position of Orora. The Group has not granted any cash-settlement arrangements nor are there any net settlement features relating to tax obligations. All current awards are accounted for as equity settled share based payments.
106 ORORA LIMITED ANNUAL REPORT 2016
For
per
sona
l use
onl
y
DIRECTORS’ DECLARATION
1. In the opinion of the Directors of Orora Limited (the ‘Company’):
(a) the financial statements and notes, and the Remuneration Report within the Directors’ Report, are in accordance with the Corporations Act 2001 including:
(i) complying with Australian Accounting Standards, the Corporations Regulations 2001 and other mandatory professional reporting requirements; and
(ii) giving a true and fair view of the Orora Group’s financial position as at 30 June 2016 and its performance for the year ended on that date; and
(b) there are reasonable grounds to believe that the Company will be able to pay its debts as and when they become due and payable.
2. Within the notes to the financial statements it is confirmed that the financial statements also comply with International Financial Reporting Standards as issued by the International Accounting Standards Board.
3. At the date of this declaration, there are reasonable grounds to believe that the Company and the consolidated entities identified in note 7.5 will be able to meet any obligations or liabilities to which they are or may become subject by virtue of the Deed of Cross Guarantee between the Company and those consolidated entities pursuant to ASIC Class Order 98/1418.
4. The Directors have been given the declarations required by section 295A of the Corporations Act 2001 by the Managing Director and Chief Executive Officer and Chief Financial Officer for the financial year ended 30 June 2016.
This declaration is made in accordance with a resolution of the Directors, dated at Melbourne, in the State of Victoria, on 15 August 2016.
C I ROBERTS Chairman
ORORA LIMITED ANNUAL REPORT 2016 107
For
per
sona
l use
onl
y
INDEPENDENT AUDITOR’S REPORT FOR THE MEMBERS OF ORORA LIMITED
Report on the financial reportWe have audited the accompanying financial report of Orora Limited (the company), which comprises the statement of financial position as at 30 June 2016, income statement, statement of comprehensive income, statement of changes in equity and cash flow statement for the year ended on that date, a summary of significant accounting policies, other explanatory notes and the directors’ declaration for Orora Limited Group (the consolidated entity). The consolidated entity comprises the company and the entities it controlled at year’s end or from time to time during the financial year.
Directors’ responsibility for the financial report
The directors of the company are responsible for the preparation of the financial report that gives a true and fair view in accordance with Australian Accounting Standards and the Corporations Act 2001 and for such internal control as the directors determine is necessary to enable the preparation of the financial report that is free from material misstatement, whether due to fraud or error. In the notes, the directors also state, in accordance with Accounting Standard AASB 101 Presentation of Financial Statements, that the financial statements comply with International Financial Reporting Standards.
Auditor’s responsibility
Our responsibility is to express an opinion on the financial report based on our audit. We conducted our audit in accordance with Australian Auditing Standards. Those standards require that we comply with relevant ethical requirements relating to audit engagements and plan and perform the audit to obtain reasonable assurance whether the financial report is free from material misstatement.
An audit involves performing procedures to obtain audit evidence about the amounts and disclosures in the financial report. The procedures selected depend on the auditor’s judgement, including the assessment of the risks of material misstatement of the financial report, whether due to fraud or error. In making those risk assessments, the auditor considers internal control relevant to the consolidated entity’s preparation and fair presentation of the financial report in order to design audit procedures that are appropriate in the circumstances, but not for the purpose of expressing an opinion on the effectiveness of the entity’s internal control. An audit also includes evaluating the appropriateness of accounting policies used and the reasonableness of accounting estimates made by the directors, as well as evaluating the overall presentation of the financial report.
We believe that the audit evidence we have obtained is sufficient and appropriate to provide a basis for our audit opinion.
Independence
In conducting our audit, we have complied with the independence requirements of the Corporations Act 2001.
Auditor’s opinion
In our opinion:(a) the financial report of Orora Limited is in accordance with the Corporations Act 2001, including:
(i) giving a true and fair view of the consolidated entity’s financial position as at 30 June 2016 and of its performance for the year ended on that date; and
(ii) complying with Australian Accounting Standards and the Corporations Regulations 2001.(b) the financial report and notes also comply with International Financial Reporting Standards
as disclosed in the notes.
PricewaterhouseCoopers, ABN 52 780 433 757 Freshwater Place, 2 Southbank Boulevard, SOUTHBANK VIC 3006, GPO Box 1331, MELBOURNE VIC 3001 T: 61 3 8603 1000, F: 61 3 8603 1999, www.pwc.com.au
Liability limited by a scheme approved under Professional Standards Legislation.
108 ORORA LIMITED ANNUAL REPORT 2016
For
per
sona
l use
onl
y
Report on the Remuneration ReportWe have audited the remuneration report included in pages 38 to 52 of the directors’ report for the year ended 30 June 2016. The directors of the company are responsible for the preparation and presentation of the remuneration report in accordance with section 300A of the Corporations Act 2001. Our responsibility is to express an opinion on the remuneration report, based on our audit conducted in accordance with Australian Auditing Standards.
Auditor’s opinion
In our opinion, the remuneration report of Orora Limited for the year ended 30 June 2016 complies with section 300A of the Corporations Act 2001.
Matters relating to the electronic presentation of the audited financial reportThis auditor’s report relates to the financial report and remuneration report of Orora Limited (the company) for the year ended 30 June 2016 included on Orora Limited’s web site. The company’s directors are responsible for the integrity of Orora Limited’s web site. We have not been engaged to report on the integrity of this web site. The auditor’s report refers only to the financial report and remuneration report named above. It does not provide an opinion on any other information which may have been hyperlinked to/from the financial report or the remuneration report. If users of this report are concerned with the inherent risks arising from electronic data communications they are advised to refer to the hard copy of the audited financial report and remuneration report to confirm the information included in the audited financial report and remuneration report presented on this web site.
PricewaterhouseCoopers
LISA HARKER Partner
Melbourne 15 August 2016
ORORA LIMITED ANNUAL REPORT 2016 109
For
per
sona
l use
onl
y
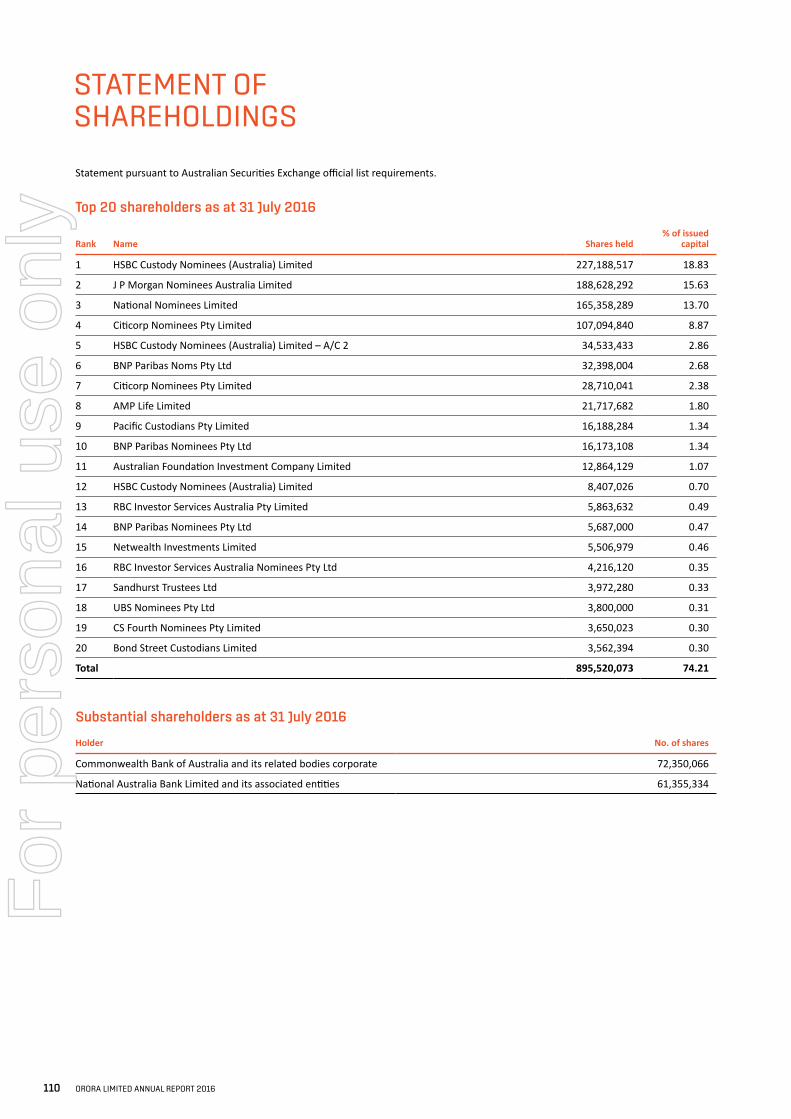
STATEMENT OF SHAREHOLDINGS
Statement pursuant to Australian Securities Exchange official list requirements.
Top 20 shareholders as at 31 July 2016
Rank Name Shares held% of issued
capital
1 HSBC Custody Nominees (Australia) Limited 227,188,517 18.83
2 J P Morgan Nominees Australia Limited 188,628,292 15.63
3 National Nominees Limited 165,358,289 13.70
4 Citicorp Nominees Pty Limited 107,094,840 8.87
5 HSBC Custody Nominees (Australia) Limited – A/C 2 34,533,433 2.86
6 BNP Paribas Noms Pty Ltd 32,398,004 2.68
7 Citicorp Nominees Pty Limited 28,710,041 2.38
8 AMP Life Limited 21,717,682 1.80
9 Pacific Custodians Pty Limited 16,188,284 1.34
10 BNP Paribas Nominees Pty Ltd 16,173,108 1.34
11 Australian Foundation Investment Company Limited 12,864,129 1.07
12 HSBC Custody Nominees (Australia) Limited 8,407,026 0.70
13 RBC Investor Services Australia Pty Limited 5,863,632 0.49
14 BNP Paribas Nominees Pty Ltd 5,687,000 0.47
15 Netwealth Investments Limited 5,506,979 0.46
16 RBC Investor Services Australia Nominees Pty Ltd 4,216,120 0.35
17 Sandhurst Trustees Ltd 3,972,280 0.33
18 UBS Nominees Pty Ltd 3,800,000 0.31
19 CS Fourth Nominees Pty Limited 3,650,023 0.30
20 Bond Street Custodians Limited 3,562,394 0.30
Total 895,520,073 74.21
Substantial shareholders as at 31 July 2016
Holder No. of shares
Commonwealth Bank of Australia and its related bodies corporate 72,350,066
National Australia Bank Limited and its associated entities 61,355,334
110 ORORA LIMITED ANNUAL REPORT 2016
For
per
sona
l use
onl
y
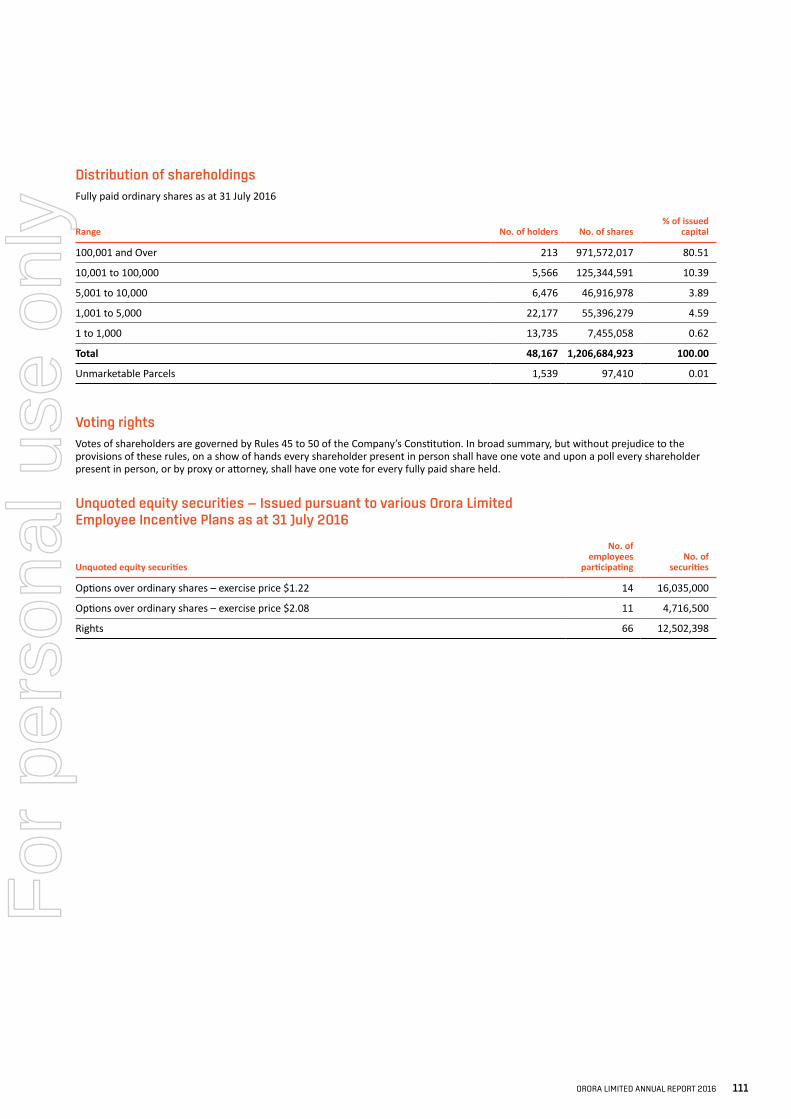
Distribution of shareholdingsFully paid ordinary shares as at 31 July 2016
Range No. of holders No. of shares% of issued
capital
100,001 and Over 213 971,572,017 80.51
10,001 to 100,000 5,566 125,344,591 10.39
5,001 to 10,000 6,476 46,916,978 3.89
1,001 to 5,000 22,177 55,396,279 4.59
1 to 1,000 13,735 7,455,058 0.62
Total 48,167 1,206,684,923 100.00
Unmarketable Parcels 1,539 97,410 0.01
Voting rightsVotes of shareholders are governed by Rules 45 to 50 of the Company’s Constitution. In broad summary, but without prejudice to the provisions of these rules, on a show of hands every shareholder present in person shall have one vote and upon a poll every shareholder present in person, or by proxy or attorney, shall have one vote for every fully paid share held.
Unquoted equity securities — Issued pursuant to various Orora Limited Employee Incentive Plans as at 31 July 2016
Unquoted equity securities
No. of employees
participatingNo. of
securities
Options over ordinary shares – exercise price $1.22 14 16,035,000
Options over ordinary shares – exercise price $2.08 11 4,716,500
Rights 66 12,502,398
ORORA LIMITED ANNUAL REPORT 2016 111
For
per
sona
l use
onl
y
SHAREHOLDER INFORMATION
Shareholder EnquiriesShareholders seeking information about their shareholding or dividends should contact Orora’s Share Registry, Link Market Services Limited (Link). Contact details are opposite. For security and privacy reasons, before contacting the Share Registry, shareholders should have their Securityholder Reference Number (SRN) or Holder Identification Number (HIN) available.
Shareholders can also access a wide variety of holding information via Link’s website: www.linkmarketservices.com.au and make changes either online or by downloading a form. These changes include:• choosing the preferred method of receiving the Annual Report,
Notice of Meeting and payment statements• checking holding balances• updating address details• providing an email address• updating bank details• electing to participate in the DRP.
Stock Exchange ListingOrora Limited shares are listed on the Australian Securities Exchange (ASX) and are traded under the code ORA.
Annual General MeetingThe Annual General Meeting of Orora Limited will be held at the Hawthorn Arts Centre, 360 Burwood Road, Hawthorn, at 10.30 am (Melbourne Time) on 13 October 2016.
Formal notice of the meeting is sent to each shareholder.
Orora Publications and CommunicationsThe Annual Report is mailed in mid-September only to those shareholders who have previously requested to receive hard copies of the document.
To view this report online, or to download a copy, visit Orora’s website: www.ororagroup.com.
If you have previously requested a printed copy of the Annual Report, but no longer require it in printed form, please update your preference online with Link Market Services or advise Link in writing.
Orora’s website, www.ororagroup.com, offers shareholders details of the latest share price, announcements made to the ASX, including half-year and full-year results, investor and analyst presentations and many other publications that may be of interest.
You can also keep up-to-date with Orora news and announcements by downloading the new Orora app. Visit the Apple App Store or Google Play Store, search for ‘Orora’ and install the app onto your device. The app is free and can be downloaded to most smartphones or iPads. To access the newsfeed simply tap ‘Skip to news’ on the bottom of the home screen.
DividendsThe Company normally pays dividends around April and October each year.
Shareholders should retain all remittance advice relating to dividend payments for tax purposes.
Orora currently pays its dividends by direct deposit to an Australian bank, building society or credit union account, or by cheque payable to international shareholders.
1. By direct deposit to an Australian bank, building society or credit union account
Shareholders can receive their dividends directly into a nominated bank, building society or credit union account anywhere in Australia. Payments are electronically credited on the dividend payment date and confirmed by a payment advice sent to the shareholders.
Shareholders can provide, or update, banking details online at Orora’s Share Registry at www.linkmarketservices.com.au.
2. By cheque payable to international shareholders
International shareholders who do not have an account with an Australian financial institution will receive their dividends by Australian dollar cheque.
Additional currencies available for dividend paymentsCommencing with the FY17 interim dividend payment, shareholders will be able to receive payments in AUD, USD and NZD.
Payments in any of the available currencies will be made in the following way:
1. By direct deposit to a bank, building society or credit union account
Shareholders can receive their dividends directly into a nominated bank, building society or credit union account held in Australia, the United States of America or New Zealand.
The currency selected must match the location of the financial institution. For example, NZD can only be paid into an account held with a financial institution located in New Zealand.
Shareholders can provide, or update, banking details online at Orora’s Share Registry at www.linkmarketservices.com.au.
2. By cheque payable to international shareholders
International shareholders who do not have an account with an Australian, United States or New Zealand financial institution will receive their dividends by Australian dollar cheque.
Lost or stolen cheques should be reported, in writing, immediately to Orora’s Share Registry to enable a ‘stop payment’ and replacement.
In addition, eligible shareholders can choose to have their dividend earnings reinvested in Orora shares.
Dividend Reinvestment Plan (DRP)The DRP provides shareholders in Australia and New Zealand, with the opportunity to reinvest their dividends to acquire additional Orora shares. Shares acquired under the DRP rank equally with existing fully paid ordinary shares.
Full details of the DRP and a DRP election form are available from Orora’s Share Registry or from Orora’s website.
112 ORORA LIMITED ANNUAL REPORT 2016
For
per
sona
l use
onl
y
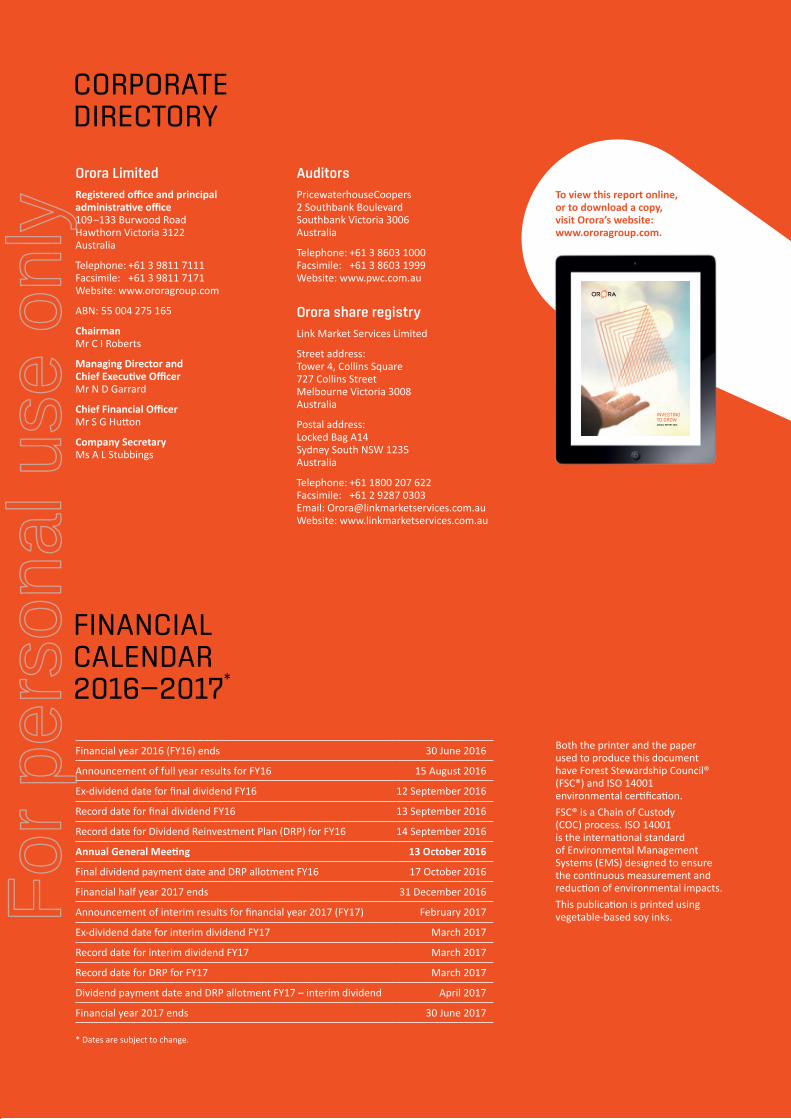
CORPORATE DIRECTORY
FINANCIAL CALENDAR 2016—2017*
Orora LimitedRegistered office and principal administrative office 109–133 Burwood Road Hawthorn Victoria 3122 Australia
Telephone: +61 3 9811 7111 Facsimile: +61 3 9811 7171 Website: www.ororagroup.com
ABN: 55 004 275 165
Chairman Mr C I Roberts
Managing Director and Chief Executive Officer Mr N D Garrard
Chief Financial Officer Mr S G Hutton
Company Secretary Ms A L Stubbings
AuditorsPricewaterhouseCoopers 2 Southbank Boulevard Southbank Victoria 3006 Australia
Telephone: +61 3 8603 1000 Facsimile: +61 3 8603 1999 Website: www.pwc.com.au
Orora share registryLink Market Services Limited
Street address: Tower 4, Collins Square 727 Collins Street Melbourne Victoria 3008 Australia
Postal address: Locked Bag A14 Sydney South NSW 1235 Australia
Telephone: +61 1800 207 622 Facsimile: +61 2 9287 0303 Email: [email protected] Website: www.linkmarketservices.com.au
Both the printer and the paper used to produce this document have Forest Stewardship Council® (FSC®) and ISO 14001 environmental certification.FSC® is a Chain of Custody (COC) process. ISO 14001 is the international standard of Environmental Management Systems (EMS) designed to ensure the continuous measurement and reduction of environmental impacts.This publication is printed using vegetable-based soy inks.
Financial year 2016 (FY16) ends 30 June 2016
Announcement of full year results for FY16 15 August 2016
Ex-dividend date for final dividend FY16 12 September 2016
Record date for final dividend FY16 13 September 2016
Record date for Dividend Reinvestment Plan (DRP) for FY16 14 September 2016
Annual General Meeting 13 October 2016
Final dividend payment date and DRP allotment FY16 17 October 2016
Financial half year 2017 ends 31 December 2016
Announcement of interim results for financial year 2017 (FY17) February 2017
Ex-dividend date for interim dividend FY17 March 2017
Record date for interim dividend FY17 March 2017
Record date for DRP for FY17 March 2017
Dividend payment date and DRP allotment FY17 – interim dividend April 2017
Financial year 2017 ends 30 June 2017
* Dates are subject to change.
To view this report online, or to download a copy, visit Orora’s website: www.ororagroup.com.
OR
OR
A A
NN
UA
L REPO
RT 2
016
INVESTING TO GROWANNUAL REPORT 2016
For
per
sona
l use
onl
y

www.ororagroup.com
ORORA LIMITED ABN 55 004 275 165
For
per
sona
l use
onl
y