Embed Size (px)
Citation preview

Facts Monthly fund analysis and market reviews
Figures inNovember 2019
For Scheme related details and Riskometer of BOI AXA Tax Advantage Fund, please refer page no. 4
Alok SinghCHIEF INVESTMENT OFFICERMARKET UPDATE
2
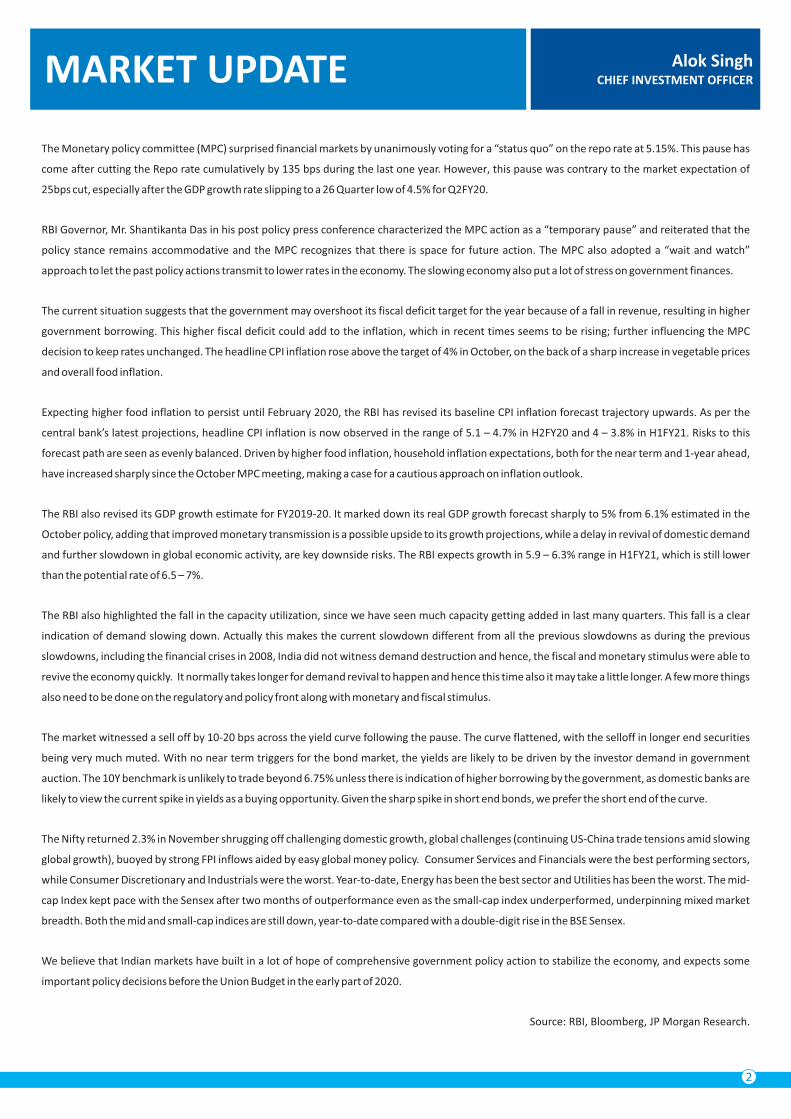
The RBI also revised its GDP growth estimate for FY2019-20. It marked down its real GDP growth forecast sharply to 5% from 6.1% estimated in the
October policy, adding that improved monetary transmission is a possible upside to its growth projections, while a delay in revival of domestic demand
and further slowdown in global economic activity, are key downside risks. The RBI expects growth in 5.9 – 6.3% range in H1FY21, which is still lower
than the potential rate of 6.5 – 7%.
Source: RBI, Bloomberg, JP Morgan Research.
Expecting higher food inflation to persist until February 2020, the RBI has revised its baseline CPI inflation forecast trajectory upwards. As per the
central bank’s latest projections, headline CPI inflation is now observed in the range of 5.1 – 4.7% in H2FY20 and 4 – 3.8% in H1FY21. Risks to this
forecast path are seen as evenly balanced. Driven by higher food inflation, household inflation expectations, both for the near term and 1-year ahead,
have increased sharply since the October MPC meeting, making a case for a cautious approach on inflation outlook.
The current situation suggests that the government may overshoot its fiscal deficit target for the year because of a fall in revenue, resulting in higher
government borrowing. This higher fiscal deficit could add to the inflation, which in recent times seems to be rising; further influencing the MPC
decision to keep rates unchanged. The headline CPI inflation rose above the target of 4% in October, on the back of a sharp increase in vegetable prices
and overall food inflation.
RBI Governor, Mr. Shantikanta Das in his post policy press conference characterized the MPC action as a “temporary pause” and reiterated that the
policy stance remains accommodative and the MPC recognizes that there is space for future action. The MPC also adopted a “wait and watch”
approach to let the past policy actions transmit to lower rates in the economy. The slowing economy also put a lot of stress on government finances.
The RBI also highlighted the fall in the capacity utilization, since we have seen much capacity getting added in last many quarters. This fall is a clear
indication of demand slowing down. Actually this makes the current slowdown different from all the previous slowdowns as during the previous
slowdowns, including the financial crises in 2008, India did not witness demand destruction and hence, the fiscal and monetary stimulus were able to
revive the economy quickly. It normally takes longer for demand revival to happen and hence this time also it may take a little longer. A few more things
also need to be done on the regulatory and policy front along with monetary and fiscal stimulus.
The market witnessed a sell off by 10-20 bps across the yield curve following the pause. The curve flattened, with the selloff in longer end securities
being very much muted. With no near term triggers for the bond market, the yields are likely to be driven by the investor demand in government
auction. The 10Y benchmark is unlikely to trade beyond 6.75% unless there is indication of higher borrowing by the government, as domestic banks are
likely to view the current spike in yields as a buying opportunity. Given the sharp spike in short end bonds, we prefer the short end of the curve.
The Monetary policy committee (MPC) surprised financial markets by unanimously voting for a “status quo” on the repo rate at 5.15%. This pause has
come after cutting the Repo rate cumulatively by 135 bps during the last one year. However, this pause was contrary to the market expectation of
25bps cut, especially after the GDP growth rate slipping to a 26 Quarter low of 4.5% for Q2FY20.
The Nifty returned 2.3% in November shrugging off challenging domestic growth, global challenges (continuing US-China trade tensions amid slowing
global growth), buoyed by strong FPI inflows aided by easy global money policy. Consumer Services and Financials were the best performing sectors,
while Consumer Discretionary and Industrials were the worst. Year-to-date, Energy has been the best sector and Utilities has been the worst. The mid-
cap Index kept pace with the Sensex after two months of outperformance even as the small-cap index underperformed, underpinning mixed market
breadth. Both the mid and small-cap indices are still down, year-to-date compared with a double-digit rise in the BSE Sensex.
We believe that Indian markets have built in a lot of hope of comprehensive government policy action to stabilize the economy, and expects some
important policy decisions before the Union Budget in the early part of 2020.
SIP SHIELD AVAILABLEDebt FundHybrid FundEquity Fund
L
A
R
G
E
&
M
I
D
C
A
P
F
U
N
D
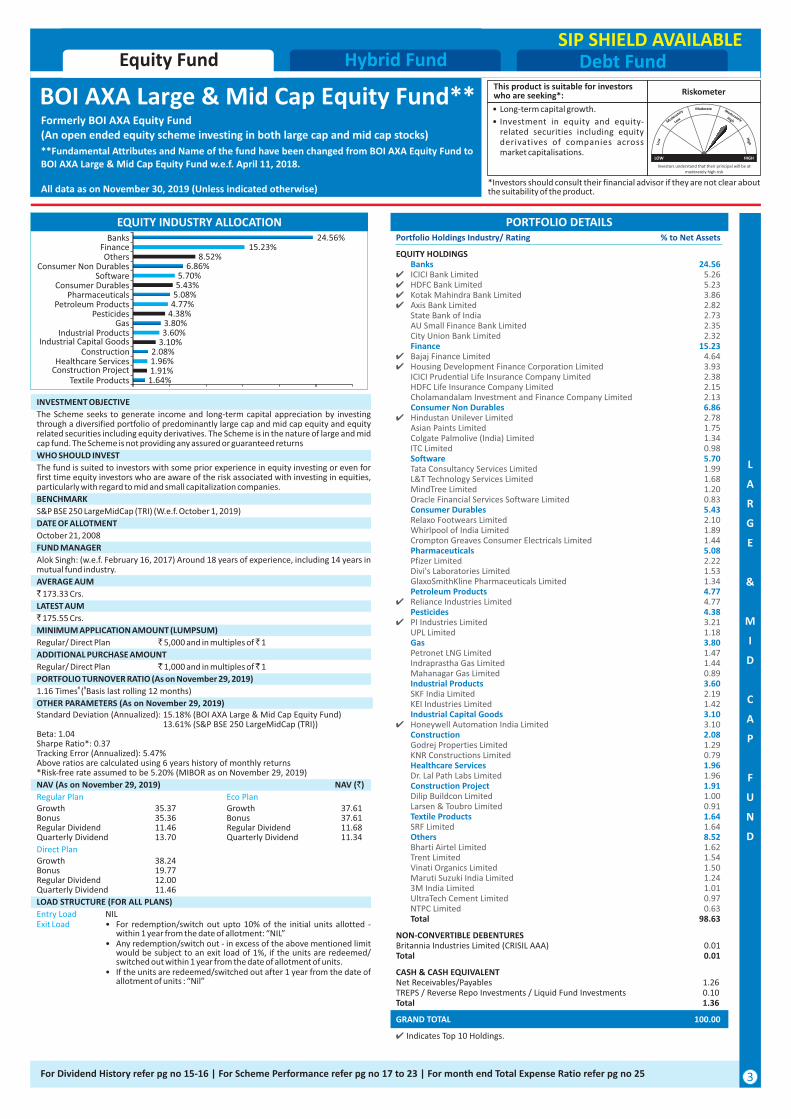
PORTFOLIO DETAILSPortfolio Holdings Industry/ Rating % to Net Assets
NON-CONVERTIBLE DEBENTURES Britannia Industries Limited (CRISIL AAA) 0.01Total 0.01
EQUITY HOLDINGS Banks 24.564 ICICI Bank Limited 5.264 HDFC Bank Limited 5.234 Kotak Mahindra Bank Limited 3.864 Axis Bank Limited 2.82 State Bank of India 2.73 AU Small Finance Bank Limited 2.35 City Union Bank Limited 2.32 Finance 15.234 Bajaj Finance Limited 4.644 Housing Development Finance Corporation Limited 3.93 ICICI Prudential Life Insurance Company Limited 2.38 HDFC Life Insurance Company Limited 2.15 Cholamandalam Investment and Finance Company Limited 2.13 Consumer Non Durables 6.864 Hindustan Unilever Limited 2.78 Asian Paints Limited 1.75 Colgate Palmolive (India) Limited 1.34 ITC Limited 0.98 Software 5.70 Tata Consultancy Services Limited 1.99 L&T Technology Services Limited 1.68 MindTree Limited 1.20 Oracle Financial Services Software Limited 0.83 Consumer Durables 5.43 Relaxo Footwears Limited 2.10 Whirlpool of India Limited 1.89 Crompton Greaves Consumer Electricals Limited 1.44 Pharmaceuticals 5.08 Pfizer Limited 2.22 Divi's Laboratories Limited 1.53 GlaxoSmithKline Pharmaceuticals Limited 1.34 Petroleum Products 4.774 Reliance Industries Limited 4.77 Pesticides 4.384 PI Industries Limited 3.21 UPL Limited 1.18 Gas 3.80 Petronet LNG Limited 1.47 Indraprastha Gas Limited 1.44 Mahanagar Gas Limited 0.89 Industrial Products 3.60 SKF India Limited 2.19 KEI Industries Limited 1.42 Industrial Capital Goods 3.104 Honeywell Automation India Limited 3.10 Construction 2.08 Godrej Properties Limited 1.29 KNR Constructions Limited 0.79 Healthcare Services 1.96 Dr. Lal Path Labs Limited 1.96 Construction Project 1.91 Dilip Buildcon Limited 1.00 Larsen & Toubro Limited 0.91 Textile Products 1.64 SRF Limited 1.64 Others 8.52 Bharti Airtel Limited 1.62 Trent Limited 1.54 Vinati Organics Limited 1.50 Maruti Suzuki India Limited 1.24 3M India Limited 1.01 UltraTech Cement Limited 0.97 NTPC Limited 0.63 Total 98.63
CASH & CASH EQUIVALENT Net Receivables/Payables 1.26TREPS / Reverse Repo Investments / Liquid Fund Investments 0.10Total 1.36
GRAND TOTAL 100.00
4 Indicates Top 10 Holdings.
INVESTMENT OBJECTIVE
WHO SHOULD INVEST
BENCHMARK
The Scheme seeks to generate income and long-term capital appreciation by investing through a diversified portfolio of predominantly large cap and mid cap equity and equity related securities including equity derivatives. The Scheme is in the nature of large and mid cap fund. The Scheme is not providing any assured or guaranteed returns
The fund is suited to investors with some prior experience in equity investing or even for first time equity investors who are aware of the risk associated with investing in equities, particularly with regard to mid and small capitalization companies.
DATE OF ALLOTMENT
October 21, 2008
FUND MANAGER
Alok Singh: (w.e.f. February 16, 2017) Around 18 years of experience, including 14 years in mutual fund industry.
AVERAGE AUM
` 173.33 Crs.
LATEST AUM
` 175.55 Crs.
MINIMUM APPLICATION AMOUNT (LUMPSUM)
ADDITIONAL PURCHASE AMOUNT
Regular/ Direct Plan ` 1,000 and in multiples of ̀ 1
PORTFOLIO TURNOVER RATIO (As on November 29, 2019)# #1.16 Times ( Basis last rolling 12 months)
OTHER PARAMETERS (As on November 29, 2019)Standard Deviation (Annualized): 15.18% (BOI AXA Large & Mid Cap Equity Fund) 13.61% (S&P BSE 250 LargeMidCap (TRI))Beta: 1.04Sharpe Ratio*: 0.37Tracking Error (Annualized): 5.47%Above ratios are calculated using 6 years history of monthly returns*Risk-free rate assumed to be 5.20% (MIBOR as on November 29, 2019)
S&P BSE 250 LargeMidCap (TRI) (W.e.f. October 1, 2019)
NAV (As on November 29, 2019) NAV (`)
Regular Plan Eco PlanGrowth 35.37 Growth 37.61Bonus 35.36 Bonus 37.61Regular Dividend 11.46 Regular Dividend 11.68Quarterly Dividend 13.70 Quarterly Dividend 11.34
Regular/ Direct Plan ` 5,000 and in multiples of ̀ 1
Direct PlanGrowth 38.24Bonus 19.77Regular Dividend 12.00Quarterly Dividend 11.46
LOAD STRUCTURE (FOR ALL PLANS)
• Any redemption/switch out - in excess of the above mentioned limit would be subject to an exit load of 1%, if the units are redeemed/ switched out within 1 year from the date of allotment of units.
Entry Load NIL
• If the units are redeemed/switched out after 1 year from the date of allotment of units : “Nil”
Exit Load • For redemption/switch out upto 10% of the initial units allotted -within 1 year from the date of allotment: “NIL”
EQUITY INDUSTRY ALLOCATION
3
*Investors should consult their financial advisor if they are not clear about the suitability of the product.
• Long-term capital growth.
• Investment in equity and equity-related securities including equity derivatives of companies across market capitalisations.
This product is suitable for investors who are seeking*: Riskometer
All data as on November 30, 2019 (Unless indicated otherwise)
BOI AXA Large & Mid Cap Equity Fund**Formerly BOI AXA Equity Fund(An open ended equity scheme investing in both large cap and mid cap stocks)
**Fundamental Attributes and Name of the fund have been changed from BOI AXA Equity Fund to BOI AXA Large & Mid Cap Equity Fund w.e.f. April 11, 2018.
Moderate
Low
High
Moderately
Low
ModeratelyHigh
Investors understand that their principal will be at moderately high risk
LOW HIGH
For Dividend History refer pg no 15-16 | For Scheme Performance refer pg no 17 to 23 | For month end Total Expense Ratio refer pg no 25
1.64%1.91%1.96%2.08%
3.10%3.60%3.80%
4.38%4.77%5.08%5.43%5.70%
6.86%8.52%
15.23%24.56%
Textile ProductsConstruction ProjectHealthcare Services
ConstructionIndustrial Capital Goods
Industrial ProductsGas
PesticidesPetroleum Products
PharmaceuticalsConsumer Durables
SoftwareConsumer Non Durables
OthersFinance
Banks
*Investors should consult their financial advisor if they are not clear about the suitability of the product.
• Long-term capital growth.
• Investment in equity and equity-related securities of companies across market capitalisations.
This product is suitable for investors who are seeking*: Riskometer
All data as on November 30, 2019 (Unless indicated otherwise)
Moderate
Low
High
Moderately
Low
ModeratelyHigh
Investors understand that their principal will be at moderately high risk
LOW HIGH
SIP SHIELD AVAILABLE
DATE OF ALLOTMENT
ADDITIONAL PURCHASE AMOUNT
PORTFOLIO TURNOVER RATIO (As on November 29, 2019)
Aakash Manghani: (w.e.f July 15, 2019) Around 10 years of experience in Equity Research
Direct Plan
FUND MANAGER
BSE 500 Total Return Index (TRI)
OTHER PARAMETERS (As on November 29, 2019)
` 255.81 Crs.
Growth 54.47 Growth 57.77Dividend 13.51 Dividend 12.21
Regular/ Direct Plan ` 500 and in multiples of ̀ 1
Exit Load NIL
The fund is suitable for investors with a long-term investment horizon. In terms of fund management, the 3 year lock-in period gives the fund manager the comfort of planning his investments with a long-term horizon.
Regular/ Direct Plan ` 500 and in multiples of ̀ 1
WHO SHOULD INVEST
INVESTMENT OBJECTIVE
AVERAGE AUM
` 257.43 Crs.
NAV (As on November 29, 2019) NAV (`)
BENCHMARK
LATEST AUM
MINIMUM APPLICATION AMOUNT (LUMPSUM)
The Scheme seeks to generate long-term capital growth from a diversified portfolio of predominantly equity and equity-related securities across all market capitalisations. The Scheme is in the nature of diversified multi-cap fund. The Scheme is not providing any assured or guaranteed returns. There can be no assurance that the investment objectives of the Scheme will be realized.
February 25, 2009
Standard Deviation (Annualized): 15.36% (BOI AXA Tax Advantage Fund) 13.94% (BSE 500 TRI)Beta: 1.01Sharpe Ratio*: 0.57Tracking Error (Annualized): 6.08%Above ratios are calculated using 6 years history of monthly returns*Risk-free rate assumed to be 5.20% (MIBOR as on November 29, 2019)
Regular Plan Eco Plan
Growth 59.64Dividend 27.28
# #0.89 Times ( Basis last rolling 12 months)
Entry Load NIL
LOAD STRUCTURE (FOR ALL PLANS)
EQUITY INDUSTRY ALLOCATION
Debt FundHybrid FundEquity Fund
BOI AXA Tax Advantage Fund(An open ended equity linked saving scheme with a statutory lock in of 3 years and tax benefit)
80C Benefit
4
E
Q
U
I
T
Y
L
I
N
K
E
D
S
A
V
I
N
G
S
C
H
E
M
E
PORTFOLIO DETAILS
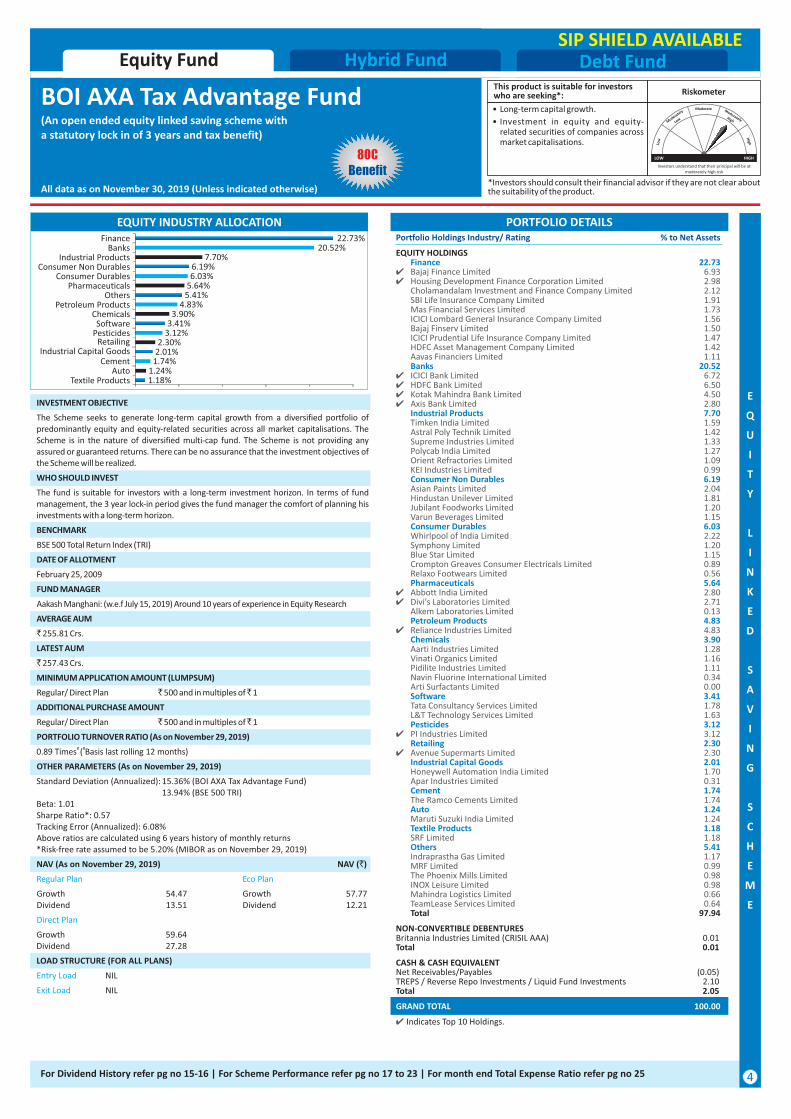
EQUITY HOLDINGS Finance 22.734 Bajaj Finance Limited 6.934 Housing Development Finance Corporation Limited 2.98 Cholamandalam Investment and Finance Company Limited 2.12 SBI Life Insurance Company Limited 1.91 Mas Financial Services Limited 1.73 ICICI Lombard General Insurance Company Limited 1.56 Bajaj Finserv Limited 1.50 ICICI Prudential Life Insurance Company Limited 1.47 HDFC Asset Management Company Limited 1.42 Aavas Financiers Limited 1.11 Banks 20.524 ICICI Bank Limited 6.724 HDFC Bank Limited 6.504 Kotak Mahindra Bank Limited 4.504 Axis Bank Limited 2.80 Industrial Products 7.70 Timken India Limited 1.59 Astral Poly Technik Limited 1.42 Supreme Industries Limited 1.33 Polycab India Limited 1.27 Orient Refractories Limited 1.09 KEI Industries Limited 0.99 Consumer Non Durables 6.19 Asian Paints Limited 2.04 Hindustan Unilever Limited 1.81 Jubilant Foodworks Limited 1.20 Varun Beverages Limited 1.15 Consumer Durables 6.03 Whirlpool of India Limited 2.22 Symphony Limited 1.20 Blue Star Limited 1.15 Crompton Greaves Consumer Electricals Limited 0.89 Relaxo Footwears Limited 0.56 Pharmaceuticals 5.644 Abbott India Limited 2.804 Divi's Laboratories Limited 2.71 Alkem Laboratories Limited 0.13 Petroleum Products 4.834 Reliance Industries Limited 4.83 Chemicals 3.90 Aarti Industries Limited 1.28 Vinati Organics Limited 1.16 Pidilite Industries Limited 1.11 Navin Fluorine International Limited 0.34 Arti Surfactants Limited 0.00 Software 3.41 Tata Consultancy Services Limited 1.78 L&T Technology Services Limited 1.63 Pesticides 3.124 PI Industries Limited 3.12 Retailing 2.304 Avenue Supermarts Limited 2.30 Industrial Capital Goods 2.01 Honeywell Automation India Limited 1.70 Apar Industries Limited 0.31 Cement 1.74 The Ramco Cements Limited 1.74 Auto 1.24 Maruti Suzuki India Limited 1.24 Textile Products 1.18 SRF Limited 1.18 Others 5.41 Indraprastha Gas Limited 1.17 MRF Limited 0.99 The Phoenix Mills Limited 0.98 INOX Leisure Limited 0.98 Mahindra Logistics Limited 0.66 TeamLease Services Limited 0.64 Total 97.94
NON-CONVERTIBLE DEBENTURES Britannia Industries Limited (CRISIL AAA) 0.01Total 0.01
4 Indicates Top 10 Holdings.
Portfolio Holdings Industry/ Rating % to Net Assets
CASH & CASH EQUIVALENT Net Receivables/Payables (0.05)TREPS / Reverse Repo Investments / Liquid Fund Investments 2.10Total 2.05
GRAND TOTAL 100.00
For Dividend History refer pg no 15-16 | For Scheme Performance refer pg no 17 to 23 | For month end Total Expense Ratio refer pg no 25
1.18%1.24%
1.74%2.01%2.30%
3.12%3.41%
3.90%4.83%
5.41%5.64%6.03%6.19%
7.70%20.52%
22.73%
Textile ProductsAuto
CementIndustrial Capital Goods
RetailingPesticidesSoftware
ChemicalsPetroleum Products
OthersPharmaceuticals
Consumer DurablesConsumer Non Durables
Industrial ProductsBanks
Finance
*Investors should consult their financial advisor if they are not clear about the suitability of the product.
• Long-term capital growth.
• Investment in equity and equity-related securities of companies e n g a g e d i n m a n u f a c t u r i n g & infrastructure related sectors.
This product is suitable for investors who are seeking*: Riskometer
All data as on November 30, 2019 (Unless indicated otherwise)
Debt FundHybrid FundEquity Fund
EQUITY INDUSTRY ALLOCATION
INVESTMENT OBJECTIVE
The Scheme seeks to generate long term capital appreciation through a portfolio of predominantly equity and equity related securities of companies engaged in manufacturing and infrastructure related sectors. Further, there can be no assurance that the investment objectives of the scheme will be realized. The Scheme is not providing any assured or guaranteed returns.
The Scheme would be more suitable for investors who are desirous of increasing their exposure to manufacturing & infrastructure sector in their personal equity portfolio. Thus, this Scheme could act as a "top up" over existing investments of such investors in diversified equity funds. However, for a first time investor, it might still be advisable to initially start his investment with a diversified equity fund.
BENCHMARK
S&P BSE India Manufacturing Total Return Index (TRI) - 50% & S&P BSE India Infrastructure Total Return Index (TRI) - 50%
WHO SHOULD INVEST
DATE OF ALLOTMENT
March 05, 2010
FUND MANAGER
Alok Singh: (w.e.f. February 16, 2017) Around 18 years of experience, including 14 years in mutual fund industry.
LATEST AUM
Standard Deviation (Annualized): 18.00% (BOI AXA Manufacturing & Infrastructure Fund) 17.39% (S&P BSE India Manufacturing TRI - 50% & S&P BSE India Infrastructure TRI - 50%)Beta: 0.93Sharpe Ratio*: (0.04)Tracking Error (Annualized): 8.01%
NAV (As on November 29, 2019) NAV (`)
• If the units are redeemed/switched out after 1 year from the date of allotment of units : “Nil”
Regular Plan Direct Plan
Regular/ Direct Plan ` 5,000 and in multiples of ̀ 1
Regular/ Direct Plan ` 1,000 and in multiples of ̀ 1
Exit Load • For redemption/switch out upto 10% of the initial units allotted -within 1 year from the date of allotment: “NIL”
• Any redemption/switch out - in excess of the above mentioned limit would be subject to an exit load of 1%, if the units are redeemed/ switched out within 1 year from the date of allotment of units.
` 44.45 Crs.
AVERAGE AUM
Growth 15.01 Growth 16.30Regular Dividend 9.80 Regular Dividend 15.39Quarterly Dividend 9.75 Quarterly Dividend 16.03
LOAD STRUCTURE (FOR ALL PLANS)
# #0.87 Times ( Basis last rolling 12 months)
Above ratios are calculated using 5 years history of monthly returns of the fund and the above Indices as the inception of S&P BSE Infrastructure Index is May 28, 2014.
ADDITIONAL PURCHASE AMOUNT
MINIMUM APPLICATION AMOUNT (LUMPSUM)
` 43.13 Crs.
Entry Load NIL
OTHER PARAMETERS (As on November 29, 2019)
PORTFOLIO TURNOVER RATIO (As on November 29, 2019)
*Risk-free rate assumed to be 5.20% (MIBOR as on November 29, 2019)
SIP SHIELD AVAILABLE
BOI AXA Manufacturing & Infrastructure Fund(An open ended equity scheme investing in manufacturing and infrastructure sectors)
Moderate
Low
High
Moderately
Low
ModeratelyHigh
Investors understand that their principal will be at high risk
LOW HIGH
5
S
E
C
T
O
R
A
L
F
U
N
D
PORTFOLIO DETAILS
4 Indicates Top 10 Holdings.
Portfolio Holdings Industry/ Rating % to Net Assets
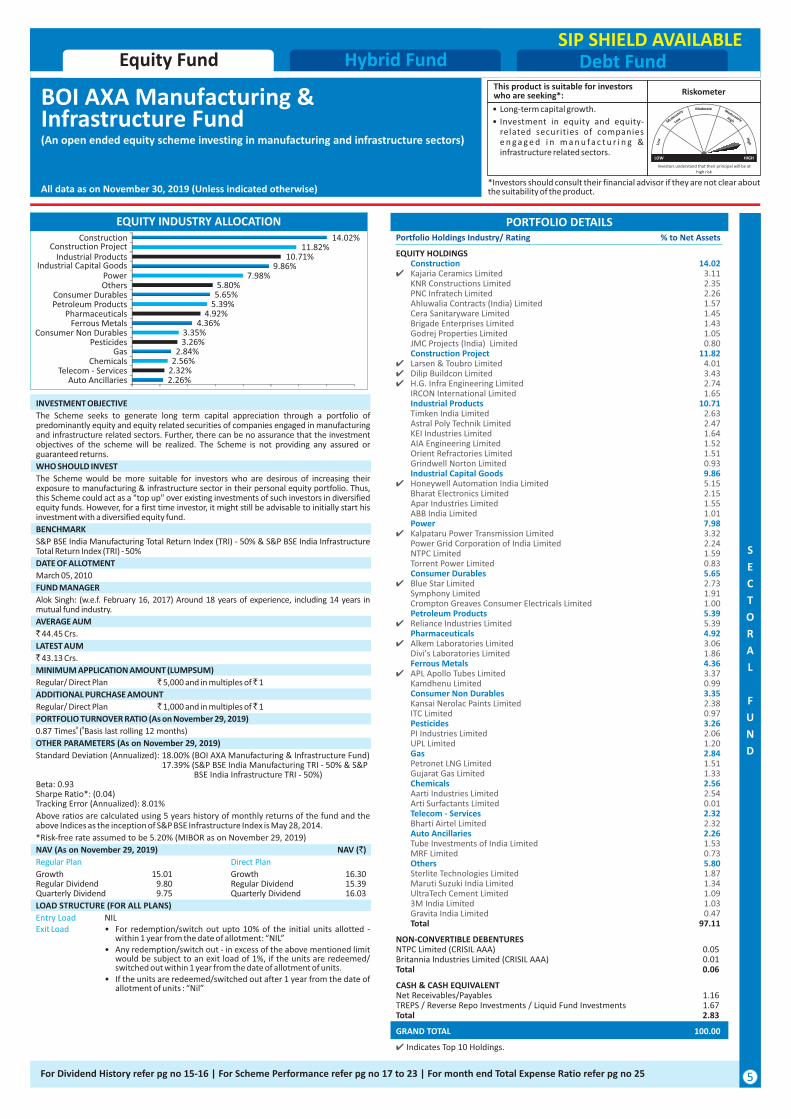
EQUITY HOLDINGS Construction 14.024 Kajaria Ceramics Limited 3.11 KNR Constructions Limited 2.35 PNC Infratech Limited 2.26 Ahluwalia Contracts (India) Limited 1.57 Cera Sanitaryware Limited 1.45 Brigade Enterprises Limited 1.43 Godrej Properties Limited 1.05 JMC Projects (India) Limited 0.80 Construction Project 11.824 Larsen & Toubro Limited 4.014 Dilip Buildcon Limited 3.434 H.G. Infra Engineering Limited 2.74 IRCON International Limited 1.65 Industrial Products 10.71 Timken India Limited 2.63 Astral Poly Technik Limited 2.47 KEI Industries Limited 1.64 AIA Engineering Limited 1.52 Orient Refractories Limited 1.51 Grindwell Norton Limited 0.93 Industrial Capital Goods 9.864 Honeywell Automation India Limited 5.15 Bharat Electronics Limited 2.15 Apar Industries Limited 1.55 ABB India Limited 1.01 Power 7.984 Kalpataru Power Transmission Limited 3.32 Power Grid Corporation of India Limited 2.24 NTPC Limited 1.59 Torrent Power Limited 0.83 Consumer Durables 5.654 Blue Star Limited 2.73 Symphony Limited 1.91 Crompton Greaves Consumer Electricals Limited 1.00 Petroleum Products 5.394 Reliance Industries Limited 5.39 Pharmaceuticals 4.924 Alkem Laboratories Limited 3.06 Divi's Laboratories Limited 1.86 Ferrous Metals 4.364 APL Apollo Tubes Limited 3.37 Kamdhenu Limited 0.99 Consumer Non Durables 3.35 Kansai Nerolac Paints Limited 2.38 ITC Limited 0.97 Pesticides 3.26 PI Industries Limited 2.06 UPL Limited 1.20 Gas 2.84 Petronet LNG Limited 1.51 Gujarat Gas Limited 1.33 Chemicals 2.56 Aarti Industries Limited 2.54 Arti Surfactants Limited 0.01 Telecom - Services 2.32 Bharti Airtel Limited 2.32 Auto Ancillaries 2.26 Tube Investments of India Limited 1.53 MRF Limited 0.73 Others 5.80 Sterlite Technologies Limited 1.87 Maruti Suzuki India Limited 1.34 UltraTech Cement Limited 1.09 3M India Limited 1.03 Gravita India Limited 0.47 Total 97.11
NON-CONVERTIBLE DEBENTURES NTPC Limited (CRISIL AAA) 0.05Britannia Industries Limited (CRISIL AAA) 0.01Total 0.06
CASH & CASH EQUIVALENT Net Receivables/Payables 1.16TREPS / Reverse Repo Investments / Liquid Fund Investments 1.67Total 2.83
GRAND TOTAL 100.00
For Dividend History refer pg no 15-16 | For Scheme Performance refer pg no 17 to 23 | For month end Total Expense Ratio refer pg no 25
2.26%2.32%2.56%2.84%
3.26%3.35%
4.36%4.92%
5.39%5.65%5.80%
7.98%9.86%
10.71%11.82%
14.02%
Auto AncillariesTelecom - Services
ChemicalsGas
PesticidesConsumer Non Durables
Ferrous MetalsPharmaceuticals
Petroleum ProductsConsumer Durables
OthersPower
Industrial Capital GoodsIndustrial Products
Construction ProjectConstruction
*Investors should consult their financial advisor if they are not clear about the suitability of the product.
• Long term capital appreciation
• Investment predominantly in equity & equity related instruments of Small Cap companies.
This product is suitable for investors who are seeking*: Riskometer
All data as on November 30, 2019 (Unless indicated otherwise)
Debt FundHybrid FundEquity Fund
EQUITY INDUSTRY ALLOCATION
DATE OF ALLOTMENT
Ajay Khandelwal (w.e.f December 19, 2018) - Around 14 years of experience, including 9 years in mutual fund industry.
LATEST AUM
FUND MANAGER
• Any redemption/switch out in excess of the above mentioned limit would be subject to an exit load of 1%, if the units are redeemed/ switched out within 1 year from the date of allotment of units.
The fund is suitable for investors who have a long term investment horizon, and prior experience in equity investing and who are aware of the risks associated with investing in equities, especially small cap companies.
WHO SHOULD INVEST
BENCHMARK
NAV (As on November 29, 2019) NAV (`)
Growth 10.27 Growth 10.45Dividend 10.27 Dividend 10.45
LOAD STRUCTURE (FOR ALL PLANS)
INVESTMENT OBJECTIVE
December 19, 2018
Regular/ Direct Plan ` 1,000 and in multiples of ̀ 1
• If the units are redeemed/switched out after 1 year from the date of allotment of units : “Nil”
Regular/ Direct Plan ` 5,000 and in multiples of ̀ 1
Entry Load NIL
The investment objective of the scheme is to generate long term capital appreciation by investing predominantly in equity and equity-related securities of small cap companies. However, there can be no assurance that the investment objectives of the Scheme will be realized.
` 48.22 Crs.
Nifty Smallcap 100 Total Return Index
MINIMUM APPLICATION AMOUNT (LUMPSUM)
` 48.11 Crs.
ADDITIONAL PURCHASE AMOUNT
Exit Load • For redemption/switch out Upto 10% of the initial units allotted - within 1 year from the date of allotment: “NIL”
Regular Plan Direct Plan
AVERAGE AUM
SIP SHIELD AVAILABLE
BOI AXA Small Cap Fund
6
(An open ended equity scheme predominantly investing in small cap stocks)Moderate
Low
High
Moderately
Low
ModeratelyHigh
Investors understand that their principal will be at moderately high risk
LOW HIGH
PORTFOLIO DETAILS
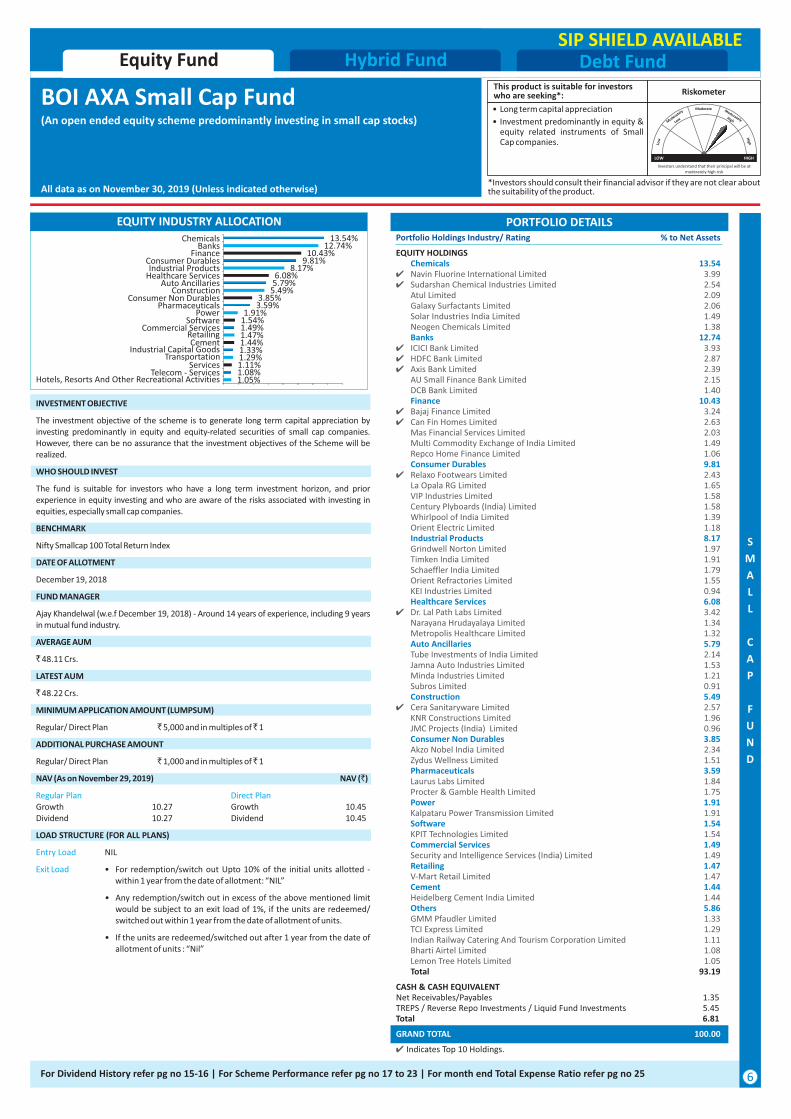
GRAND TOTAL 100.00
CASH & CASH EQUIVALENT Net Receivables/Payables 1.35TREPS / Reverse Repo Investments / Liquid Fund Investments 5.45Total 6.81
Portfolio Holdings Industry/ Rating % to Net Assets
EQUITY HOLDINGS Chemicals 13.544 Navin Fluorine International Limited 3.994 Sudarshan Chemical Industries Limited 2.54 Atul Limited 2.09 Galaxy Surfactants Limited 2.06 Solar Industries India Limited 1.49 Neogen Chemicals Limited 1.38 Banks 12.744 ICICI Bank Limited 3.934 HDFC Bank Limited 2.874 Axis Bank Limited 2.39 AU Small Finance Bank Limited 2.15 DCB Bank Limited 1.40 Finance 10.434 Bajaj Finance Limited 3.244 Can Fin Homes Limited 2.63 Mas Financial Services Limited 2.03 Multi Commodity Exchange of India Limited 1.49 Repco Home Finance Limited 1.06 Consumer Durables 9.814 Relaxo Footwears Limited 2.43 La Opala RG Limited 1.65 VIP Industries Limited 1.58 Century Plyboards (India) Limited 1.58 Whirlpool of India Limited 1.39 Orient Electric Limited 1.18 Industrial Products 8.17 Grindwell Norton Limited 1.97 Timken India Limited 1.91 Schaeffler India Limited 1.79 Orient Refractories Limited 1.55 KEI Industries Limited 0.94 Healthcare Services 6.084 Dr. Lal Path Labs Limited 3.42 Narayana Hrudayalaya Limited 1.34 Metropolis Healthcare Limited 1.32 Auto Ancillaries 5.79 Tube Investments of India Limited 2.14 Jamna Auto Industries Limited 1.53 Minda Industries Limited 1.21 Subros Limited 0.91 Construction 5.494 Cera Sanitaryware Limited 2.57 KNR Constructions Limited 1.96 JMC Projects (India) Limited 0.96 Consumer Non Durables 3.85 Akzo Nobel India Limited 2.34 Zydus Wellness Limited 1.51 Pharmaceuticals 3.59 Laurus Labs Limited 1.84 Procter & Gamble Health Limited 1.75 Power 1.91 Kalpataru Power Transmission Limited 1.91 Software 1.54 KPIT Technologies Limited 1.54 Commercial Services 1.49 Security and Intelligence Services (India) Limited 1.49 Retailing 1.47 V-Mart Retail Limited 1.47 Cement 1.44 Heidelberg Cement India Limited 1.44 Others 5.86 GMM Pfaudler Limited 1.33 TCI Express Limited 1.29 Indian Railway Catering And Tourism Corporation Limited 1.11 Bharti Airtel Limited 1.08 Lemon Tree Hotels Limited 1.05 Total 93.19
4 Indicates Top 10 Holdings.
S
M
A
L
L
C
A
P
F
U
N
D
For Dividend History refer pg no 15-16 | For Scheme Performance refer pg no 17 to 23 | For month end Total Expense Ratio refer pg no 25
1.05%1.08%1.11%1.29%1.33%1.44%1.47%1.49%1.54%1.91%
3.59%3.85%
5.49%5.79%6.08%
8.17%9.81%
10.43%12.74%
13.54%
Hotels, Resorts And Other Recreational ActivitiesTelecom - Services
ServicesTransportation
Industrial Capital GoodsCement
RetailingCommercial Services
SoftwarePower
PharmaceuticalsConsumer Non Durables
ConstructionAuto Ancillaries
Healthcare ServicesIndustrial Products
Consumer DurablesFinance
BanksChemicals
*Investors should consult their financial advisor if they are not clear about the suitability of the product.
• Long term capital appreciation and income distribution
• Equity fund investing in Mid & Small Cap equity and equity re lated securities (not part of the top 100 stocks by market capitalization) as well as fixed income securities.
This product is suitable for investors who are seeking*: Riskometer
Moderate
Low
High
Moderately
Low
ModeratelyHigh
Investors understand that their principal will be at moderately high risk
LOW HIGH
All data as on November 30, 2019 (Unless indicated otherwise)
Debt FundHybrid FundEquity Fund
INVESTMENT OBJECTIVE
DATE OF ALLOTMENT
• If the units are redeemed/switched out after 1 year from the date of allotment of units : “Nil”
Regular/ Direct Plan ` 1,000 and in multiples of ̀ 1
Entry Load NIL
NAV (As on November 29, 2019) NAV (`)
# #1.22 Times ( Basis last rolling 12 months)
ADDITIONAL PURCHASE AMOUNT
FUND MANAGER
Ajay Khandelwal (Assistant Fund Manager): (w.e.f. December 1, 2017) - Around 14 years of experience, including 9 years in mutual fund industry.
AVERAGE AUM
LATEST AUM
Regular/ Direct Plan ` 5,000 and in multiples of ̀ 1
Exit Load • For redemption/switch out upto 10% of the initial units allotted -within 1 year from the date of allotment: “NIL”
• Any redemption/switch out - in excess of the above mentioned limit would be subject to an exit load of 1%, if the units are redeemed/ switched out within 1 year from the date of allotment of units.
MINIMUM APPLICATION AMOUNT (LUMPSUM)
BENCHMARK
The scheme's objective is to provide capital appreciation and income distribution to investors from a portfolio constituting of mid and small cap equity and equity related securities as well as fixed income securities. However there can be no assurance that the income can be generated, regular or otherwise, or the investment objectives of the Scheme will be realized.
July 20, 2016
Standard Deviation (Annualized): 16.11% (BOI AXA Mid & Small Cap Equity & Debt Fund) 13.25% (Nifty Midsmall cap 400 TRI - 70% & CRISIL Short Term Bond Fund Index - 30%)Beta: 1.12Sharpe Ratio*: (0.03)Tracking Error (Annualized): 6.52%
NIFTY MidSmallcap 400 TRI: 70%; CRISIL Short Term Bond Fund Index: 30%
Alok Singh: (w.e.f. February 16, 2017) Around 18 years of experience, including 14 years in mutual fund industry.
` 345.05 Crs.
Above ratios are calculated using 2 years history of monthly returns
*Risk-free rate assumed to be 5.20% (MIBOR as on November 29, 2019)
PORTFOLIO TURNOVER RATIO (As on November 29, 2019)
Regular Plan Direct Plan
Growth 12.02 Growth 12.38Regular Dividend 10.63 Regular Dividend 10.85
OTHER PARAMETERS (As on November 29, 2019)
LOAD STRUCTURE (FOR ALL PLANS)
` 349.25 Crs.
EQUITY INDUSTRY ALLOCATION
SIP SHIELD AVAILABLE
BOI AXA Mid & Small Cap Equity & Debt Fund**Formerly BOI AXA Mid Cap Equity & Debt Fund(An open ended hybrid scheme investing predominantly in equity and equity related instruments)**Fundamental Attributes and Name of the fund have been changed from BOI AXA Mid Cap Equity & Debt Fund to BOI AXA Mid & Small Cap Equity & Debt Fund w.e.f. April 11, 2018.
7
Disclosures regarding the detailed rationale along with other details as required under Clause 2.1.4 of SEBI Circular no. SEBI/HO/IMD/DF4/CIR/P/2019/41 dated March 22, 2019, are available at below mentioned link :
Instances of deviation in valuation
https://www.boiaxamf.com/docs/default-source/reports/regulatory-disclosures/rationale-for-deviation-29-11-19.pdf?sfvrsn=350c92d1_4
PORTFOLIO DETAILSPortfolio Holdings % to Net Industry/ Rating Assets
Portfolio Holdings % to Net Industry/ Rating Assets
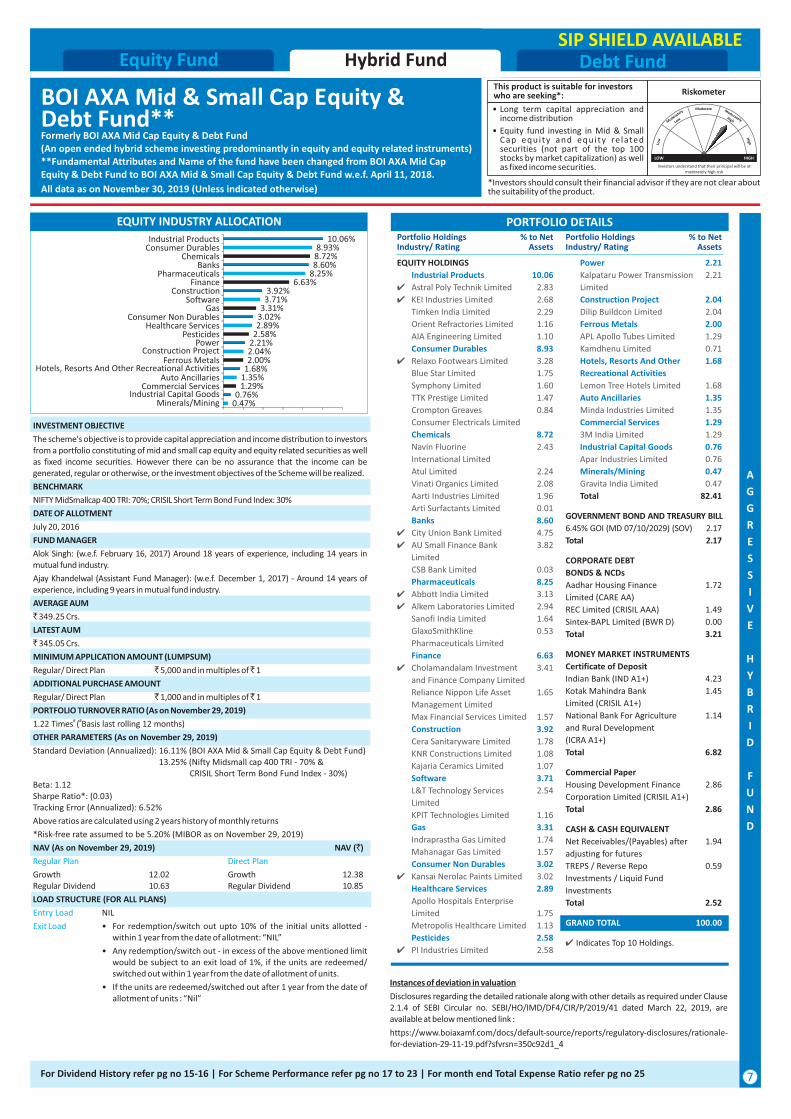
EQUITY HOLDINGS
Industrial Products 10.06
4 Astral Poly Technik Limited 2.83
4 KEI Industries Limited 2.68
Timken India Limited 2.29
Orient Refractories Limited 1.16
AIA Engineering Limited 1.10
Consumer Durables 8.93
4 Relaxo Footwears Limited 3.28
Blue Star Limited 1.75
Symphony Limited 1.60
TTK Prestige Limited 1.47
Crompton Greaves 0.84
Consumer Electricals Limited
Chemicals 8.72
Navin Fluorine 2.43
International Limited
Atul Limited 2.24
Vinati Organics Limited 2.08
Aarti Industries Limited 1.96
Arti Surfactants Limited 0.01
Banks 8.60
4 City Union Bank Limited 4.75
4 AU Small Finance Bank 3.82
Limited
CSB Bank Limited 0.03
Pharmaceuticals 8.25
4 Abbott India Limited 3.13
4 Alkem Laboratories Limited 2.94
Sanofi India Limited 1.64
GlaxoSmithKline 0.53
Pharmaceuticals Limited
Finance 6.63
4 Cholamandalam Investment 3.41
and Finance Company Limited
Reliance Nippon Life Asset 1.65
Management Limited
Max Financial Services Limited 1.57
Construction 3.92
Cera Sanitaryware Limited 1.78
KNR Constructions Limited 1.08
Kajaria Ceramics Limited 1.07
Software 3.71
L&T Technology Services 2.54
Limited
KPIT Technologies Limited 1.16
Gas 3.31
Indraprastha Gas Limited 1.74
Mahanagar Gas Limited 1.57
Consumer Non Durables 3.02
4 Kansai Nerolac Paints Limited 3.02
Healthcare Services 2.89
Apollo Hospitals Enterprise
Limited 1.75
Metropolis Healthcare Limited 1.13
Pesticides 2.58
4 PI Industries Limited 2.58
CORPORATE DEBT
BONDS & NCDs
Aadhar Housing Finance 1.72
Limited (CARE AA)
REC Limited (CRISIL AAA) 1.49
Sintex-BAPL Limited (BWR D) 0.00
Total 3.21
CASH & CASH EQUIVALENT
Net Receivables/(Payables) after 1.94
adjusting for futures
TREPS / Reverse Repo 0.59
Investments / Liquid Fund
Investments
Total 2.52
Power 2.21
Kalpataru Power Transmission 2.21
Limited
Construction Project 2.04
Dilip Buildcon Limited 2.04
Ferrous Metals 2.00
APL Apollo Tubes Limited 1.29
Kamdhenu Limited 0.71
Hotels, Resorts And Other 1.68
Recreational Activities
Lemon Tree Hotels Limited 1.68
Auto Ancillaries 1.35
Minda Industries Limited 1.35
Commercial Services 1.29
3M India Limited 1.29
Industrial Capital Goods 0.76
Apar Industries Limited 0.76
Minerals/Mining 0.47
Gravita India Limited 0.47
Total 82.41
GOVERNMENT BOND AND TREASURY BILL
6.45% GOI (MD 07/10/2029) (SOV) 2.17
Total 2.17
Commercial Paper
Housing Development Finance 2.86
Corporation Limited (CRISIL A1+)
Total 2.86
4 Indicates Top 10 Holdings.
GRAND TOTAL 100.00
MONEY MARKET INSTRUMENTS
Certificate of Deposit
Indian Bank (IND A1+) 4.23
Kotak Mahindra Bank 1.45
Limited (CRISIL A1+)
National Bank For Agriculture 1.14
and Rural Development
(ICRA A1+)
Total 6.82
A
G
G
R
E
S
S
I
V
E
H
Y
B
R
I
D
F
U
N
D
For Dividend History refer pg no 15-16 | For Scheme Performance refer pg no 17 to 23 | For month end Total Expense Ratio refer pg no 25
0.47%0.76%
1.29%1.35%1.68%2.00%2.04%2.21%2.58%2.89%3.02%3.31%3.71%3.92%
6.63%8.25%8.60%8.72%8.93%
10.06%
Minerals/MiningIndustrial Capital Goods
Commercial ServicesAuto Ancillaries
Hotels, Resorts And Other Recreational ActivitiesFerrous Metals
Construction ProjectPower
PesticidesHealthcare Services
Consumer Non DurablesGas
SoftwareConstruction
FinancePharmaceuticals
BanksChemicals
Consumer DurablesIndustrial Products
*Investors should consult their financial advisor if they are not clear about the suitability of the product.
• Dynamic asset allocation between equity and fixed income based on equity market valuations
• Long term capital appreciation
This product is suitable for investors who are seeking*: Riskometer
Moderate
Low
High
Moderately
Low
ModeratelyHigh
Investors understand that their principal will be at moderately high risk
LOW HIGH
Debt FundHybrid FundEquity Fund
EQUITY INDUSTRY ALLOCATION PORTFOLIO DETAILSPortfolio Holdings % to Net Industry/ Rating Assets
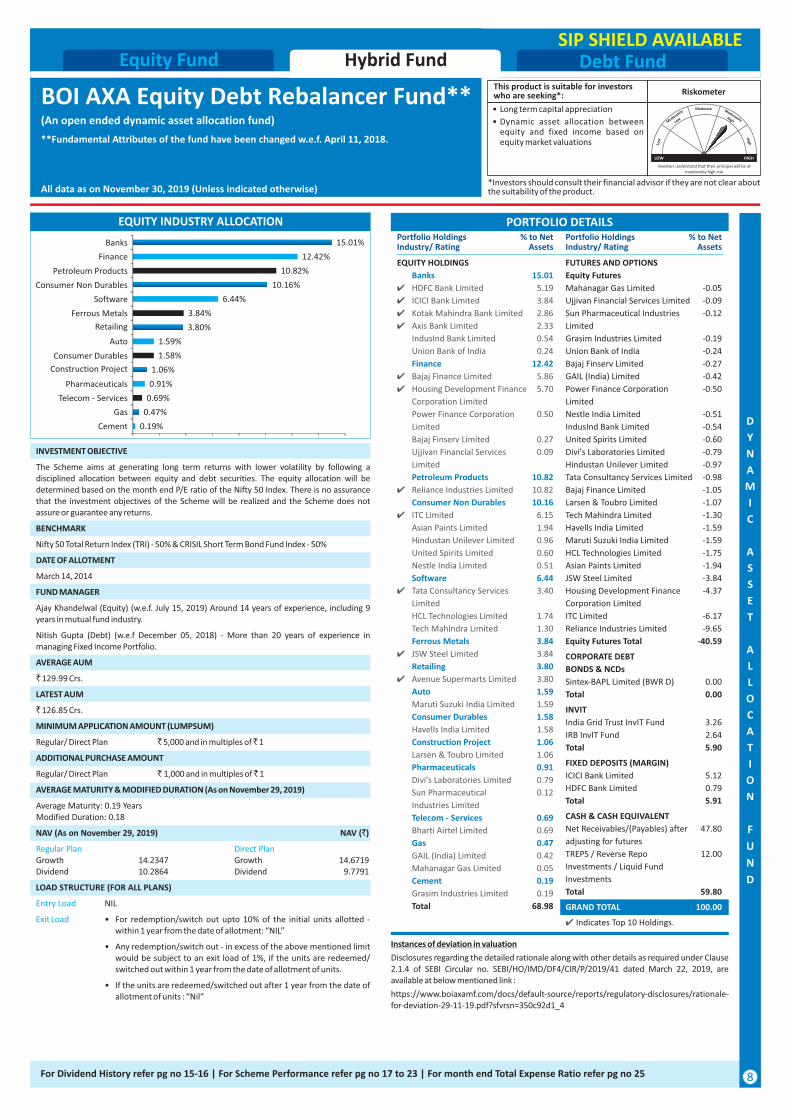
The Scheme aims at generating long term returns with lower volatility by following a disciplined allocation between equity and debt securities. The equity allocation will be determined based on the month end P/E ratio of the Nifty 50 Index. There is no assurance that the investment objectives of the Scheme will be realized and the Scheme does not assure or guarantee any returns.
Average Maturity: 0.19 YearsModified Duration: 0.18
Regular Plan Direct PlanGrowth 14.2347 Growth 14.6719Dividend 10.2864 Dividend 9.7791
March 14, 2014
INVESTMENT OBJECTIVE
DATE OF ALLOTMENT
Nitish Gupta (Debt) (w.e.f December 05, 2018) - More than 20 years of experience in managing Fixed Income Portfolio.
AVERAGE AUM
Regular/ Direct Plan ` 5,000 and in multiples of ̀ 1
ADDITIONAL PURCHASE AMOUNT
` 129.99 Crs.
LATEST AUM
Regular/ Direct Plan ` 1,000 and in multiples of ̀ 1
Ajay Khandelwal (Equity) (w.e.f. July 15, 2019) Around 14 years of experience, including 9 years in mutual fund industry.
` 126.85 Crs.
BENCHMARK
AVERAGE MATURITY & MODIFIED DURATION (As on November 29, 2019)
MINIMUM APPLICATION AMOUNT (LUMPSUM)
Nifty 50 Total Return Index (TRI) - 50% & CRISIL Short Term Bond Fund Index - 50%
FUND MANAGER
NAV (As on November 29, 2019) NAV (`)
LOAD STRUCTURE (FOR ALL PLANS)
Entry Load NIL
• Any redemption/switch out - in excess of the above mentioned limit would be subject to an exit load of 1%, if the units are redeemed/ switched out within 1 year from the date of allotment of units.
• If the units are redeemed/switched out after 1 year from the date of allotment of units : “Nil”
Exit Load • For redemption/switch out upto 10% of the initial units allotted -within 1 year from the date of allotment: “NIL”
SIP SHIELD AVAILABLE
All data as on November 30, 2019 (Unless indicated otherwise)
BOI AXA Equity Debt Rebalancer Fund**(An open ended dynamic asset allocation fund)
**Fundamental Attributes of the fund have been changed w.e.f. April 11, 2018.
8
D
Y
N
A
M
I
C
A
S
S
E
T
A
L
L
O
C
A
T
I
O
N
F
U
N
D
Disclosures regarding the detailed rationale along with other details as required under Clause 2.1.4 of SEBI Circular no. SEBI/HO/IMD/DF4/CIR/P/2019/41 dated March 22, 2019, are available at below mentioned link :
https://www.boiaxamf.com/docs/default-source/reports/regulatory-disclosures/rationale-for-deviation-29-11-19.pdf?sfvrsn=350c92d1_4
Instances of deviation in valuation
Portfolio Holdings % to Net Industry/ Rating Assets
EQUITY HOLDINGS
Banks 15.01
4 HDFC Bank Limited 5.19
4 ICICI Bank Limited 3.84
4 Kotak Mahindra Bank Limited 2.86
4 Axis Bank Limited 2.33
IndusInd Bank Limited 0.54
Union Bank of India 0.24
Finance 12.42
4 Bajaj Finance Limited 5.86
4 Housing Development Finance 5.70
Corporation Limited
Power Finance Corporation 0.50
Limited
Bajaj Finserv Limited 0.27
Ujjivan Financial Services 0.09
Limited
Petroleum Products 10.82
4 Reliance Industries Limited 10.82
Consumer Non Durables 10.16
4 ITC Limited 6.15
Asian Paints Limited 1.94
Hindustan Unilever Limited 0.96
United Spirits Limited 0.60
Nestle India Limited 0.51
Software 6.44
4 Tata Consultancy Services 3.40
Limited
HCL Technologies Limited 1.74
Tech Mahindra Limited 1.30
Ferrous Metals 3.84
4 JSW Steel Limited 3.84
Retailing 3.80
4 Avenue Supermarts Limited 3.80
Auto 1.59
Maruti Suzuki India Limited 1.59
Consumer Durables 1.58
Havells India Limited 1.58
Construction Project 1.06
Larsen & Toubro Limited 1.06
Pharmaceuticals 0.91
Divi's Laboratories Limited 0.79
Sun Pharmaceutical 0.12
Industries Limited
Telecom - Services 0.69
Bharti Airtel Limited 0.69
Gas 0.47
GAIL (India) Limited 0.42
Mahanagar Gas Limited 0.05
Cement 0.19
Grasim Industries Limited 0.19
Total 68.98
INVIT
India Grid Trust InvIT Fund 3.26
IRB InvIT Fund 2.64
Total 5.90
4 Indicates Top 10 Holdings.
GRAND TOTAL 100.00
FUTURES AND OPTIONS
Equity Futures
Mahanagar Gas Limited -0.05
Ujjivan Financial Services Limited -0.09
Sun Pharmaceutical Industries -0.12
Limited
Grasim Industries Limited -0.19
Union Bank of India -0.24
Bajaj Finserv Limited -0.27
GAIL (India) Limited -0.42
Power Finance Corporation -0.50
Limited
Nestle India Limited -0.51
IndusInd Bank Limited -0.54
United Spirits Limited -0.60
Divi's Laboratories Limited -0.79
Hindustan Unilever Limited -0.97
Tata Consultancy Services Limited -0.98
Bajaj Finance Limited -1.05
Larsen & Toubro Limited -1.07
Tech Mahindra Limited -1.30
Havells India Limited -1.59
Maruti Suzuki India Limited -1.59
HCL Technologies Limited -1.75
Asian Paints Limited -1.94
JSW Steel Limited -3.84
Housing Development Finance -4.37
Corporation Limited
ITC Limited -6.17
Reliance Industries Limited -9.65
Equity Futures Total -40.59
CORPORATE DEBT
BONDS & NCDs
Sintex-BAPL Limited (BWR D) 0.00
Total 0.00
CASH & CASH EQUIVALENT
Net Receivables/(Payables) after 47.80
adjusting for futures
TREPS / Reverse Repo 12.00
Investments / Liquid Fund
Investments
Total 59.80
FIXED DEPOSITS (MARGIN)
ICICI Bank Limited 5.12
HDFC Bank Limited 0.79
Total 5.91
For Dividend History refer pg no 15-16 | For Scheme Performance refer pg no 17 to 23 | For month end Total Expense Ratio refer pg no 25
0.19%
0.47%
0.69%
0.91%
1.06%
1.58%
1.59%
3.80%
3.84%
6.44%
10.16%
10.82%
12.42%
15.01%
Cement
Gas
Telecom - Services
Pharmaceuticals
Construction Project
Consumer Durables
Auto
Retailing
Ferrous Metals
Software
Consumer Non Durables
Petroleum Products
Finance
Banks
*Investors should consult their financial advisor if they are not clear about the suitability of the product.
• Long term capital appreciation and regular income.
• Investment in equity and equity related securities (10% - 25%) as well as fixed income securities (Debt / Money Market Instruments/ Govt. Securities).
This product is suitable for investors who are seeking*: Riskometer
All data as on November 30, 2019 (Unless indicated otherwise)
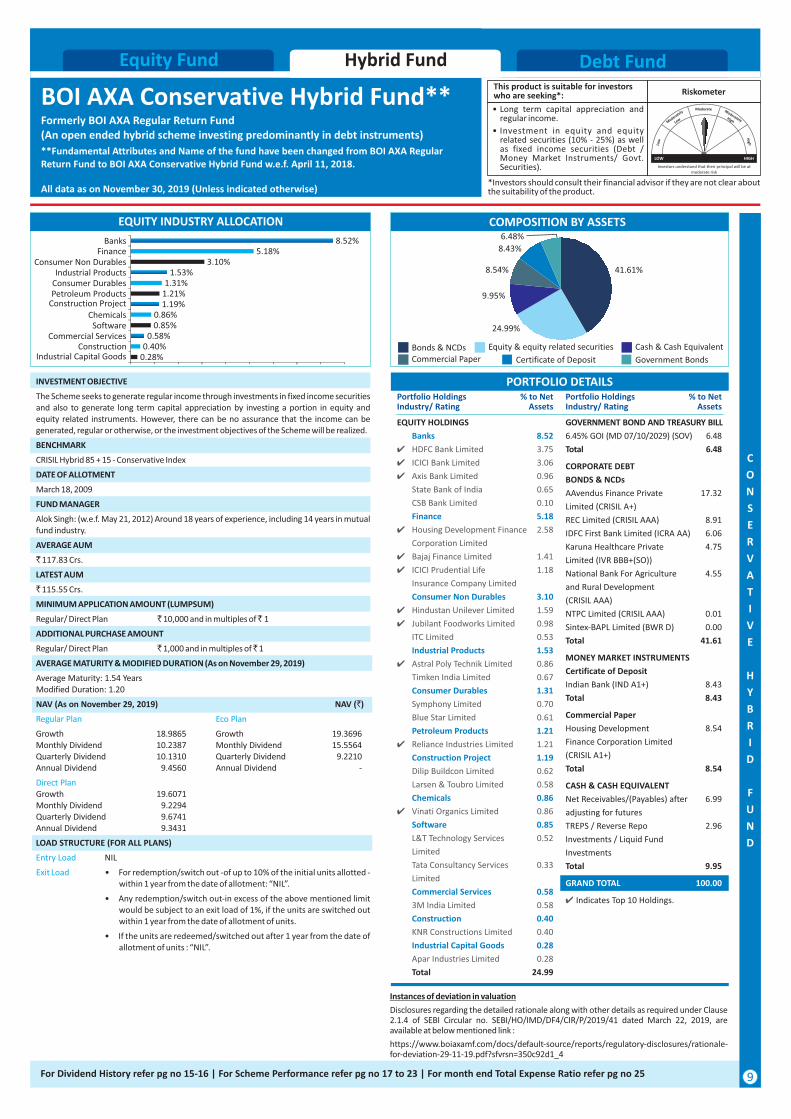
BOI AXA Conservative Hybrid Fund**Formerly BOI AXA Regular Return Fund(An open ended hybrid scheme investing predominantly in debt instruments)
**Fundamental Attributes and Name of the fund have been changed from BOI AXA Regular Return Fund to BOI AXA Conservative Hybrid Fund w.e.f. April 11, 2018.
Debt FundHybrid FundEquity Fund
41.61%
COMPOSITION BY ASSETSEQUITY INDUSTRY ALLOCATION
` 117.83 Crs.
Exit Load • For redemption/switch out -of up to 10% of the initial units allotted - within 1 year from the date of allotment: “NIL”.
NAV (As on November 29, 2019) NAV (`)
The Scheme seeks to generate regular income through investments in fixed income securities and also to generate long term capital appreciation by investing a portion in equity and equity related instruments. However, there can be no assurance that the income can be generated, regular or otherwise, or the investment objectives of the Scheme will be realized.
Average Maturity: 1.54 YearsModified Duration: 1.20
Direct PlanGrowth 19.6071Monthly Dividend 9.2294Quarterly Dividend 9.6741Annual Dividend 9.3431
• Any redemption/switch out-in excess of the above mentioned limit would be subject to an exit load of 1%, if the units are switched out within 1 year from the date of allotment of units.
` 115.55 Crs.
BENCHMARK
DATE OF ALLOTMENT
March 18, 2009
Alok Singh: (w.e.f. May 21, 2012) Around 18 years of experience, including 14 years in mutual fund industry.
ADDITIONAL PURCHASE AMOUNT
INVESTMENT OBJECTIVE
CRISIL Hybrid 85 + 15 - Conservative Index
LOAD STRUCTURE (FOR ALL PLANS)
Entry Load NIL
Regular Plan Eco Plan
FUND MANAGER
MINIMUM APPLICATION AMOUNT (LUMPSUM)
Regular/ Direct Plan ` 10,000 and in multiples of ̀ 1
AVERAGE MATURITY & MODIFIED DURATION (As on November 29, 2019)
• If the units are redeemed/switched out after 1 year from the date of allotment of units : “NIL”.
LATEST AUM
AVERAGE AUM
Regular/ Direct Plan ` 1,000 and in multiples of ̀ 1
Growth 18.9865 Growth 19.3696Monthly Dividend 10.2387 Monthly Dividend 15.5564Quarterly Dividend 10.1310 Quarterly Dividend 9.2210Annual Dividend 9.4560 Annual Dividend -
Bonds & NCDs Equity & equity related securities
24.99%
6.48%
Moderate
Low
High
Moderately
Low
ModeratelyHigh
Investors understand that their principal will be at moderate risk
LOW HIGH
9
C
O
N
S
E
R
V
A
T
I
V
E
H
Y
B
R
I
D
F
U
N
D
Cash & Cash Equivalent
Commercial Paper
8.54%
8.43%
Certificate of Deposit
Instances of deviation in valuation
Disclosures regarding the detailed rationale along with other details as required under Clause 2.1.4 of SEBI Circular no. SEBI/HO/IMD/DF4/CIR/P/2019/41 dated March 22, 2019, are available at below mentioned link :
https://www.boiaxamf.com/docs/default-source/reports/regulatory-disclosures/rationale-for-deviation-29-11-19.pdf?sfvrsn=350c92d1_4
PORTFOLIO DETAILSPortfolio Holdings % to Net Industry/ Rating Assets
Portfolio Holdings % to Net Industry/ Rating Assets
EQUITY HOLDINGS
Banks 8.52
4 HDFC Bank Limited 3.75
4 ICICI Bank Limited 3.06
4 Axis Bank Limited 0.96
State Bank of India 0.65
CSB Bank Limited 0.10
Finance 5.18
4 Housing Development Finance 2.58
Corporation Limited
4 Bajaj Finance Limited 1.41
4 ICICI Prudential Life 1.18
Insurance Company Limited
Consumer Non Durables 3.10
4 Hindustan Unilever Limited 1.59
4 Jubilant Foodworks Limited 0.98
ITC Limited 0.53
Industrial Products 1.53
4 Astral Poly Technik Limited 0.86
Timken India Limited 0.67
Consumer Durables 1.31
Symphony Limited 0.70
Blue Star Limited 0.61
Petroleum Products 1.21
4 Reliance Industries Limited 1.21
Construction Project 1.19
Dilip Buildcon Limited 0.62
Larsen & Toubro Limited 0.58
Chemicals 0.86
4 Vinati Organics Limited 0.86
Software 0.85
L&T Technology Services 0.52
Limited
Tata Consultancy Services 0.33
Limited
Commercial Services 0.58
3M India Limited 0.58
Construction 0.40
KNR Constructions Limited 0.40
Industrial Capital Goods 0.28
Apar Industries Limited 0.28
Total 24.99
MONEY MARKET INSTRUMENTS
Certificate of Deposit
Indian Bank (IND A1+) 8.43
Total 8.43
CASH & CASH EQUIVALENT
Net Receivables/(Payables) after 6.99
adjusting for futures
TREPS / Reverse Repo 2.96
Investments / Liquid Fund
Investments
Total 9.95
CORPORATE DEBT
BONDS & NCDs
AAvendus Finance Private 17.32
Limited (CRISIL A+)
REC Limited (CRISIL AAA) 8.91
IDFC First Bank Limited (ICRA AA) 6.06
Karuna Healthcare Private 4.75
Limited (IVR BBB+(SO))
National Bank For Agriculture 4.55
and Rural Development
(CRISIL AAA)
NTPC Limited (CRISIL AAA) 0.01
Sintex-BAPL Limited (BWR D) 0.00
Total 41.61
GOVERNMENT BOND AND TREASURY BILL
6.45% GOI (MD 07/10/2029) (SOV) 6.48
Total 6.48
Commercial Paper
Housing Development 8.54
Finance Corporation Limited
(CRISIL A1+)
Total 8.54
GRAND TOTAL 100.00
4 Indicates Top 10 Holdings.
For Dividend History refer pg no 15-16 | For Scheme Performance refer pg no 17 to 23 | For month end Total Expense Ratio refer pg no 25
0.28%0.40%
0.58%0.85%0.86%
1.19%1.21%1.31%
1.53%3.10%
5.18%8.52%
Industrial Capital GoodsConstruction
Commercial ServicesSoftware
ChemicalsConstruction ProjectPetroleum ProductsConsumer DurablesIndustrial Products
Consumer Non DurablesFinance
Banks
Government Bonds
9.95%
*Investors should consult their financial advisor if they are not clear about the suitability of the product.
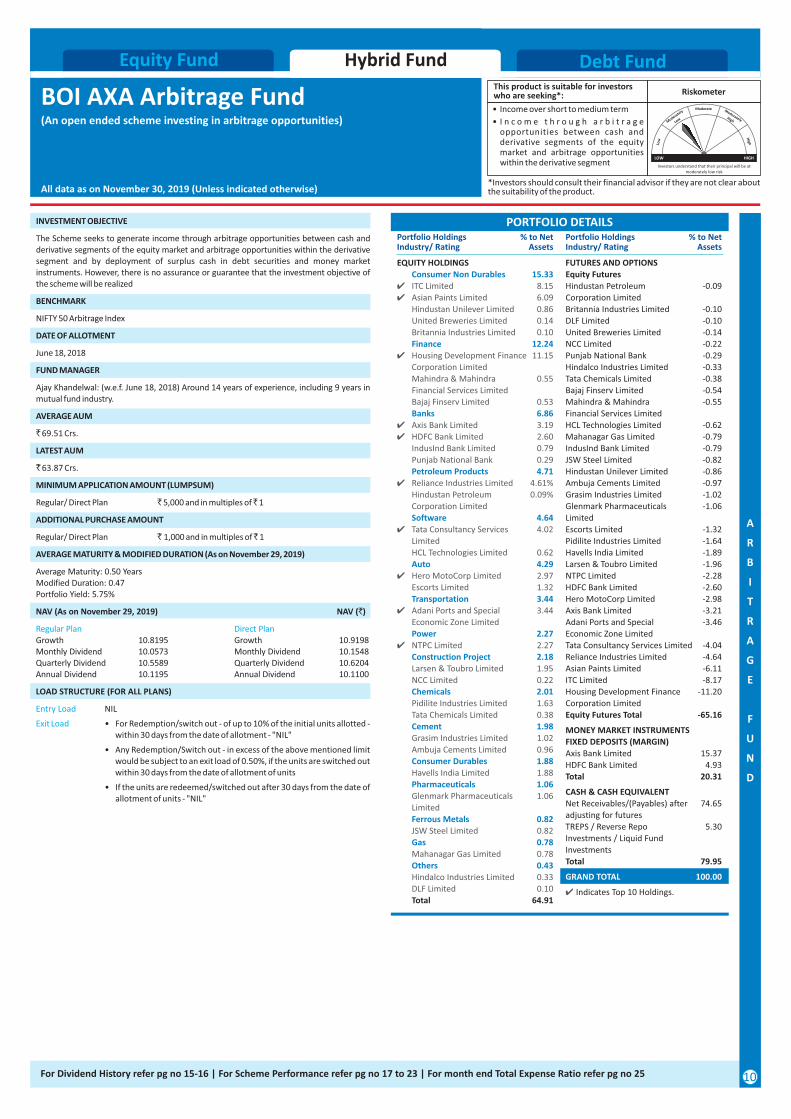
• I n c o m e t h r o u g h a r b i t r a g e opportunities between cash and derivative segments of the equity market and arbitrage opportunities within the derivative segment
• Income over short to medium term
This product is suitable for investors who are seeking*: Riskometer
Debt FundHybrid FundEquity Fund
June 18, 2018
` 63.87 Crs.
INVESTMENT OBJECTIVE
The Scheme seeks to generate income through arbitrage opportunities between cash and derivative segments of the equity market and arbitrage opportunities within the derivative segment and by deployment of surplus cash in debt securities and money market instruments. However, there is no assurance or guarantee that the investment objective of the scheme will be realized
BENCHMARK
NIFTY 50 Arbitrage Index
DATE OF ALLOTMENT
FUND MANAGER
Ajay Khandelwal: (w.e.f. June 18, 2018) Around 14 years of experience, including 9 years in mutual fund industry.
AVERAGE AUM
` 69.51 Crs.
LATEST AUM
Regular/ Direct Plan ` 5,000 and in multiples of ̀ 1
Regular/ Direct Plan ` 1,000 and in multiples of ̀ 1
Average Maturity: 0.50 YearsModified Duration: 0.47Portfolio Yield: 5.75%
• If the units are redeemed/switched out after 30 days from the date of allotment of units - "NIL"
AVERAGE MATURITY & MODIFIED DURATION (As on November 29, 2019)
ADDITIONAL PURCHASE AMOUNT
LOAD STRUCTURE (FOR ALL PLANS)
Entry Load NIL
NAV (As on November 29, 2019) NAV (`)
MINIMUM APPLICATION AMOUNT (LUMPSUM)
Exit Load • For Redemption/switch out - of up to 10% of the initial units allotted -within 30 days from the date of allotment - "NIL"
Regular Plan Direct PlanGrowth 10.8195 Growth 10.9198Monthly Dividend 10.0573 Monthly Dividend 10.1548Quarterly Dividend 10.5589 Quarterly Dividend 10.6204Annual Dividend 10.1195 Annual Dividend 10.1100
• Any Redemption/Switch out - in excess of the above mentioned limit would be subject to an exit load of 0.50%, if the units are switched out within 30 days from the date of allotment of units
All data as on November 30, 2019 (Unless indicated otherwise)
BOI AXA Arbitrage Fund(An open ended scheme investing in arbitrage opportunities)
Moderate
Low
High
Moderately
Low
ModeratelyHigh
Investors understand that their principal will be at moderately low risk
LOW HIGH
10
PORTFOLIO DETAILSPortfolio Holdings % to Net Industry/ Rating Assets
Portfolio Holdings % to Net Industry/ Rating Assets
EQUITY HOLDINGS Consumer Non Durables 15.334 ITC Limited 8.154 Asian Paints Limited 6.09 Hindustan Unilever Limited 0.86 United Breweries Limited 0.14 Britannia Industries Limited 0.10 Finance 12.244 Housing Development Finance 11.15 Corporation Limited Mahindra & Mahindra 0.55 Financial Services Limited Bajaj Finserv Limited 0.53 Banks 6.864 Axis Bank Limited 3.194 HDFC Bank Limited 2.60 IndusInd Bank Limited 0.79 Punjab National Bank 0.29 Petroleum Products 4.714 Reliance Industries Limited 4.61% Hindustan Petroleum 0.09% Corporation Limited Software 4.644 Tata Consultancy Services 4.02 Limited HCL Technologies Limited 0.62 Auto 4.294 Hero MotoCorp Limited 2.97 Escorts Limited 1.32 Transportation 3.444 Adani Ports and Special 3.44 Economic Zone Limited Power 2.274 NTPC Limited 2.27 Construction Project 2.18 Larsen & Toubro Limited 1.95 NCC Limited 0.22 Chemicals 2.01 Pidilite Industries Limited 1.63 Tata Chemicals Limited 0.38 Cement 1.98 Grasim Industries Limited 1.02 Ambuja Cements Limited 0.96 Consumer Durables 1.88 Havells India Limited 1.88 Pharmaceuticals 1.06 Glenmark Pharmaceuticals 1.06 Limited Ferrous Metals 0.82 JSW Steel Limited 0.82 Gas 0.78 Mahanagar Gas Limited 0.78 Others 0.43 Hindalco Industries Limited 0.33 DLF Limited 0.10 Total 64.91
FUTURES AND OPTIONS Equity FuturesHindustan Petroleum -0.09Corporation Limited Britannia Industries Limited -0.10DLF Limited -0.10United Breweries Limited -0.14NCC Limited -0.22Punjab National Bank -0.29Hindalco Industries Limited -0.33Tata Chemicals Limited -0.38Bajaj Finserv Limited -0.54Mahindra & Mahindra -0.55Financial Services Limited HCL Technologies Limited -0.62Mahanagar Gas Limited -0.79IndusInd Bank Limited -0.79JSW Steel Limited -0.82Hindustan Unilever Limited -0.86Ambuja Cements Limited -0.97Grasim Industries Limited -1.02Glenmark Pharmaceuticals -1.06Limited Escorts Limited -1.32Pidilite Industries Limited -1.64Havells India Limited -1.89Larsen & Toubro Limited -1.96NTPC Limited -2.28HDFC Bank Limited -2.60Hero MotoCorp Limited -2.98Axis Bank Limited -3.21Adani Ports and Special -3.46Economic Zone Limited Tata Consultancy Services Limited -4.04Reliance Industries Limited -4.64Asian Paints Limited -6.11ITC Limited -8.17Housing Development Finance -11.20Corporation Limited Equity Futures Total -65.16
MONEY MARKET INSTRUMENTSFIXED DEPOSITS (MARGIN) Axis Bank Limited 15.37HDFC Bank Limited 4.93Total 20.31
CASH & CASH EQUIVALENT Net Receivables/(Payables) after 74.65adjusting for futures TREPS / Reverse Repo 5.30Investments / Liquid Fund Investments Total 79.95
GRAND TOTAL 100.00
4 Indicates Top 10 Holdings.
A
R
B
I
T
R
A
G
E
F
U
N
D
For Dividend History refer pg no 15-16 | For Scheme Performance refer pg no 17 to 23 | For month end Total Expense Ratio refer pg no 25
*Investors should consult their financial advisor if they are not clear about the suitability of the product.
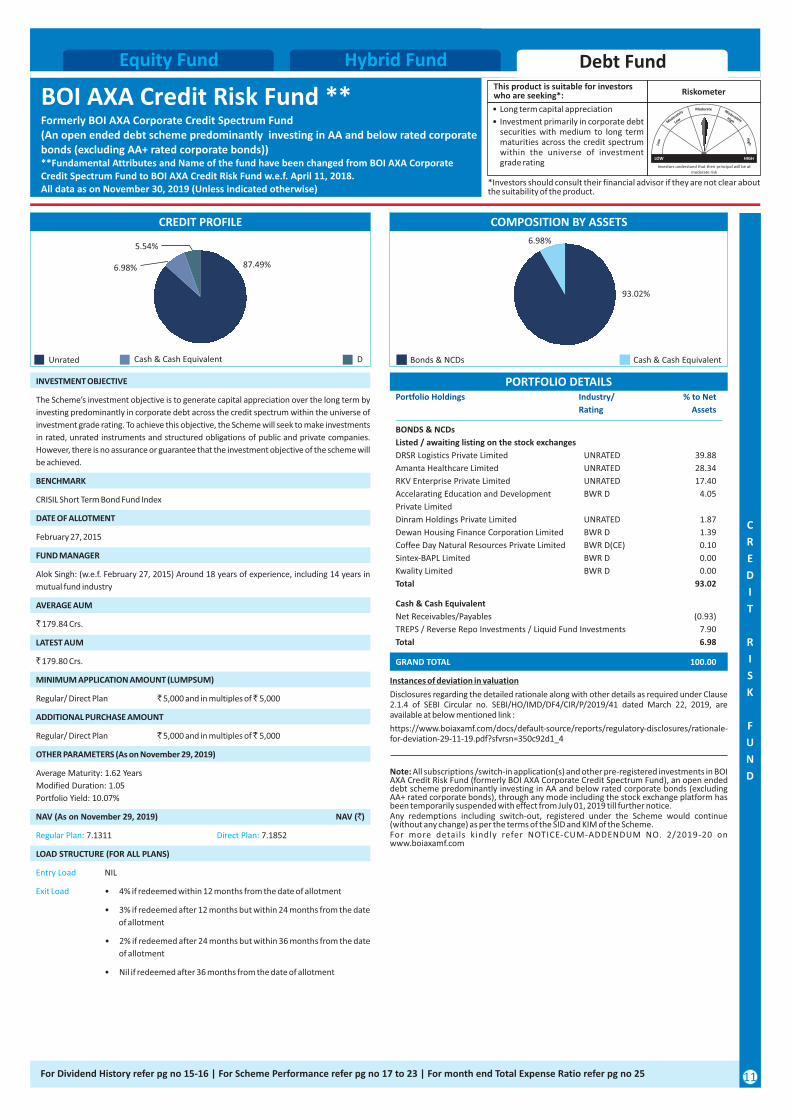
• Investment primarily in corporate debt securities with medium to long term maturities across the credit spectrum within the universe of investment grade rating
• Long term capital appreciation
This product is suitable for investors who are seeking*: Riskometer
Moderate
Low
High
Moderately
Low
ModeratelyHigh
Investors understand that their principal will be at moderate risk
LOW HIGH
All data as on November 30, 2019 (Unless indicated otherwise)
BOI AXA Credit Risk Fund **Formerly BOI AXA Corporate Credit Spectrum Fund(An open ended debt scheme predominantly investing in AA and below rated corporate bonds (excluding AA+ rated corporate bonds))**Fundamental Attributes and Name of the fund have been changed from BOI AXA Corporate Credit Spectrum Fund to BOI AXA Credit Risk Fund w.e.f. April 11, 2018.
Debt FundHybrid FundEquity Fund
PORTFOLIO DETAILS
CREDIT PROFILE
• 2% if redeemed after 24 months but within 36 months from the date
of allotment
` 179.84 Crs.
LOAD STRUCTURE (FOR ALL PLANS)
DATE OF ALLOTMENT
Average Maturity: 1.62 Years
Modified Duration: 1.05
Portfolio Yield: 10.07%
February 27, 2015
INVESTMENT OBJECTIVE
The Scheme’s investment objective is to generate capital appreciation over the long term by
investing predominantly in corporate debt across the credit spectrum within the universe of
investment grade rating. To achieve this objective, the Scheme will seek to make investments
in rated, unrated instruments and structured obligations of public and private companies.
However, there is no assurance or guarantee that the investment objective of the scheme will
be achieved.
FUND MANAGER
Alok Singh: (w.e.f. February 27, 2015) Around 18 years of experience, including 14 years in
mutual fund industry
AVERAGE AUM
MINIMUM APPLICATION AMOUNT (LUMPSUM)
BENCHMARK
` 179.80 Crs.
Regular/ Direct Plan ` 5,000 and in multiples of ̀ 5,000
OTHER PARAMETERS (As on November 29, 2019)
LATEST AUM
Regular/ Direct Plan ` 5,000 and in multiples of ̀ 5,000
CRISIL Short Term Bond Fund Index
NAV (As on November 29, 2019) NAV (`)
Regular Plan: Direct Plan: 7.1311 7.1852
Entry Load NIL
Exit Load • 4% if redeemed within 12 months from the date of allotment
• 3% if redeemed after 12 months but within 24 months from the date
of allotment
ADDITIONAL PURCHASE AMOUNT
• Nil if redeemed after 36 months from the date of allotment
COMPOSITION BY ASSETS
Portfolio Holdings Industry/ % to Net
Rating Assets
BONDS & NCDs
Listed / awaiting listing on the stock exchanges
DRSR Logistics Private Limited UNRATED 39.88
Amanta Healthcare Limited UNRATED 28.34
RKV Enterprise Private Limited UNRATED 17.40
Accelarating Education and Development BWR D 4.05
Private Limited
Dinram Holdings Private Limited UNRATED 1.87
Dewan Housing Finance Corporation Limited BWR D 1.39
Coffee Day Natural Resources Private Limited BWR D(CE) 0.10
Sintex-BAPL Limited BWR D 0.00
Kwality Limited BWR D 0.00
Total 93.02
Cash & Cash Equivalent
Net Receivables/Payables (0.93)
TREPS / Reverse Repo Investments / Liquid Fund Investments 7.90
Total 6.98
GRAND TOTAL 100.00
11
C
R
E
D
I
T
R
I
S
K
F
U
N
D
Bonds & NCDs Cash & Cash Equivalent
Note: All subscriptions /switch-in application(s) and other pre-registered investments in BOI AXA Credit Risk Fund (formerly BOI AXA Corporate Credit Spectrum Fund), an open ended debt scheme predominantly investing in AA and below rated corporate bonds (excluding AA+ rated corporate bonds), through any mode including the stock exchange platform has been temporarily suspended with effect from July 01, 2019 till further notice.
For more details kindly refer NOTICE-CUM-ADDENDUM NO. 2/2019-20 on www.boiaxamf.com
Any redemptions including switch-out, registered under the Scheme would continue (without any change) as per the terms of the SID and KIM of the Scheme.
93.02%
6.98%5.54%
87.49%
Unrated Cash & Cash Equivalent D
6.98%
https://www.boiaxamf.com/docs/default-source/reports/regulatory-disclosures/rationale-for-deviation-29-11-19.pdf?sfvrsn=350c92d1_4
Instances of deviation in valuation
Disclosures regarding the detailed rationale along with other details as required under Clause 2.1.4 of SEBI Circular no. SEBI/HO/IMD/DF4/CIR/P/2019/41 dated March 22, 2019, are available at below mentioned link :
For Dividend History refer pg no 15-16 | For Scheme Performance refer pg no 17 to 23 | For month end Total Expense Ratio refer pg no 25
*Investors should consult their financial advisor if they are not clear about the suitability of the product.
• Investment in Debt & Money Market instruments such that the Macaulay duration of the portfolio is between 1 year - 3 years
• Regular income over short to medium term.
This product is suitable for investors who are seeking*: Riskometer
Moderate
Low
High
Moderately
Low
ModeratelyHigh
Investors understand that their principal will be at moderate risk
LOW HIGH
All data as on November 30, 2019 (Unless indicated otherwise)
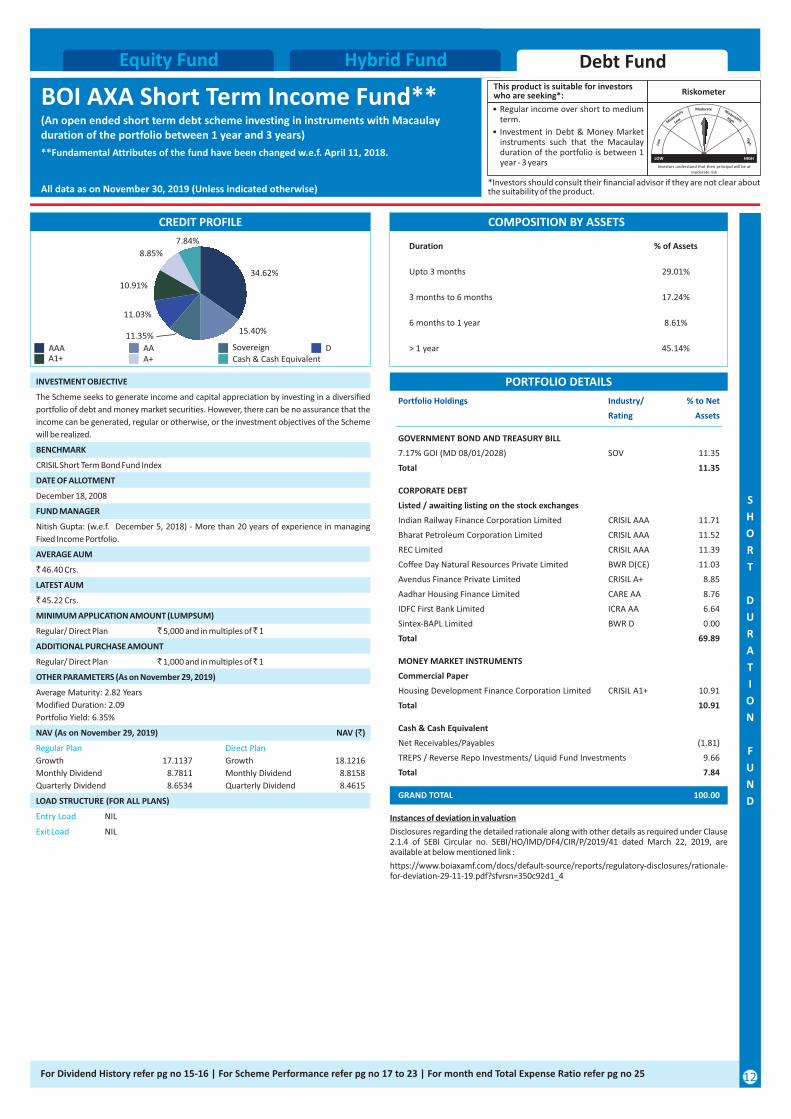
BOI AXA Short Term Income Fund**(An open ended short term debt scheme investing in instruments with Macaulay duration of the portfolio between 1 year and 3 years)
**Fundamental Attributes of the fund have been changed w.e.f. April 11, 2018.
Debt FundHybrid FundEquity Fund
Upto 3 months 29.01%
6 months to 1 year 8.61%
3 months to 6 months 17.24%
Duration % of Assets
> 1 year 45.14%
PORTFOLIO DETAILS
CORPORATE DEBT
Listed / awaiting listing on the stock exchanges
Indian Railway Finance Corporation Limited CRISIL AAA 11.71
Bharat Petroleum Corporation Limited CRISIL AAA 11.52
REC Limited CRISIL AAA 11.39
Coffee Day Natural Resources Private Limited BWR D(CE) 11.03
Avendus Finance Private Limited CRISIL A+ 8.85
Aadhar Housing Finance Limited CARE AA 8.76
IDFC First Bank Limited ICRA AA 6.64
Sintex-BAPL Limited BWR D 0.00
Total 69.89
MONEY MARKET INSTRUMENTS
Commercial Paper
Housing Development Finance Corporation Limited CRISIL A1+ 10.91
Total 10.91
Cash & Cash Equivalent
Net Receivables/Payables (1.81)
TREPS / Reverse Repo Investments/ Liquid Fund Investments 9.66
Total 7.84
Portfolio Holdings Industry/ % to Net
Rating Assets
GOVERNMENT BOND AND TREASURY BILL
7.17% GOI (MD 08/01/2028) SOV 11.35
Total 11.35
GRAND TOTAL 100.00
COMPOSITION BY ASSETS
` 45.22 Crs.
INVESTMENT OBJECTIVE
FUND MANAGER
` 46.40 Crs.
BENCHMARK
CRISIL Short Term Bond Fund Index
DATE OF ALLOTMENT
The Scheme seeks to generate income and capital appreciation by investing in a diversified
portfolio of debt and money market securities. However, there can be no assurance that the
income can be generated, regular or otherwise, or the investment objectives of the Scheme
will be realized.
Nitish Gupta: (w.e.f. December 5, 2018) - More than 20 years of experience in managing
Fixed Income Portfolio.
AVERAGE AUM
December 18, 2008
MINIMUM APPLICATION AMOUNT (LUMPSUM)
OTHER PARAMETERS (As on November 29, 2019)
LATEST AUM
NAV (As on November 29, 2019) NAV (`)
LOAD STRUCTURE (FOR ALL PLANS)
Regular/ Direct Plan ` 5,000 and in multiples of ̀ 1
Regular/ Direct Plan ` 1,000 and in multiples of ̀ 1
Exit Load NIL
ADDITIONAL PURCHASE AMOUNT
Average Maturity: 2.82 Years
Modified Duration: 2.09
Portfolio Yield: 6.35%
Entry Load NIL
Regular Plan Direct Plan
Growth 17.1137 Growth 18.1216
Monthly Dividend 8.7811 Monthly Dividend 8.8158
Quarterly Dividend 8.6534 Quarterly Dividend 8.4615
CREDIT PROFILE
AAA AA SovereignA1+
D
12
S
H
O
R
T
D
U
R
A
T
I
O
N
F
U
N
D
Cash & Cash Equivalent
https://www.boiaxamf.com/docs/default-source/reports/regulatory-disclosures/rationale-for-deviation-29-11-19.pdf?sfvrsn=350c92d1_4
Instances of deviation in valuation
Disclosures regarding the detailed rationale along with other details as required under Clause 2.1.4 of SEBI Circular no. SEBI/HO/IMD/DF4/CIR/P/2019/41 dated March 22, 2019, are available at below mentioned link :
A+
34.62%
11.35%
7.84%
8.85%
10.91%
15.40%
11.03%
For Dividend History refer pg no 15-16 | For Scheme Performance refer pg no 17 to 23 | For month end Total Expense Ratio refer pg no 25
*Investors should consult their financial advisor if they are not clear about the suitability of the product.
• Regular income over Short to Medium term.
• Investment in Debt & Money Market instruments such that the Macaulay duration of the portfolio is between 3 months and 6 months
This product is suitable for investors who are seeking*: Riskometer
Moderate
Low
High
Moderately
Low
ModeratelyHigh
Investors understand that their principal will be at moderately low risk
LOW HIGH
All data as on November 30, 2019 (Unless indicated otherwise)
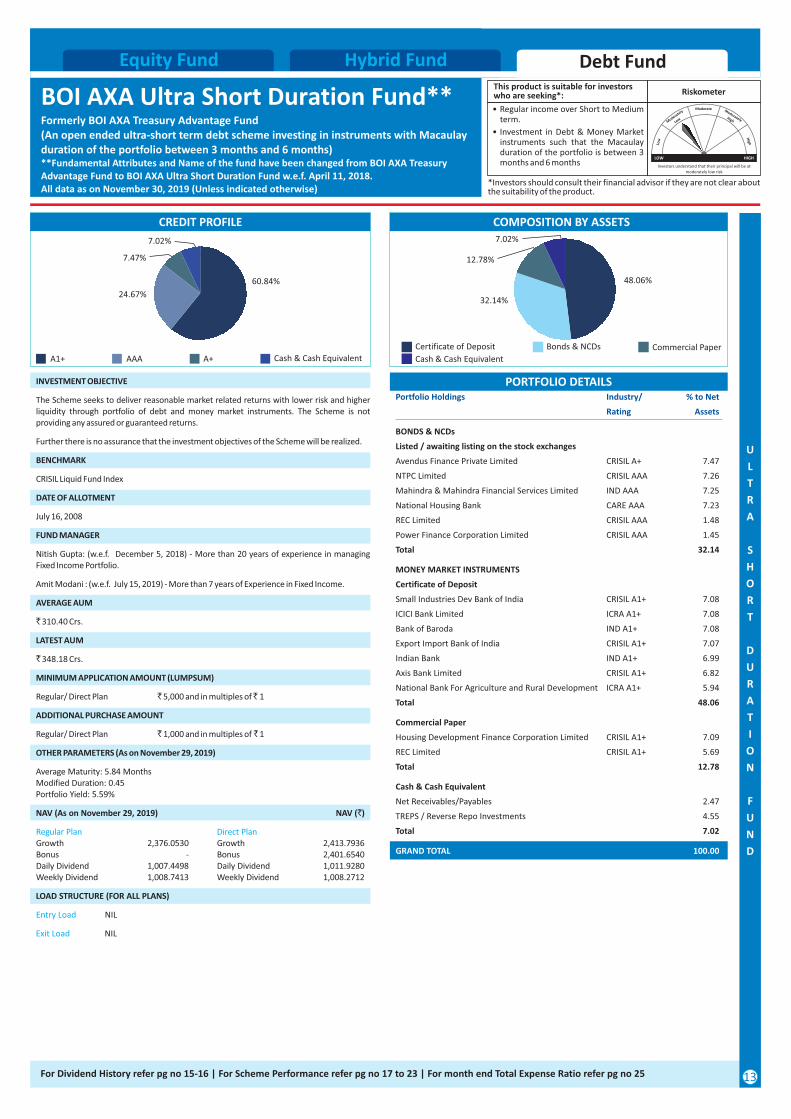
BOI AXA Ultra Short Duration Fund** Formerly BOI AXA Treasury Advantage Fund(An open ended ultra-short term debt scheme investing in instruments with Macaulay duration of the portfolio between 3 months and 6 months)**Fundamental Attributes and Name of the fund have been changed from BOI AXA Treasury Advantage Fund to BOI AXA Ultra Short Duration Fund w.e.f. April 11, 2018.
Debt FundHybrid FundEquity Fund
PORTFOLIO DETAILS
CREDIT PROFILE
60.84%
24.67%
7.02%
A1+ A+AAA
COMPOSITION BY ASSETS
48.06%
7.02%
12.78%
DATE OF ALLOTMENT
BENCHMARK
Entry Load NIL
Regular Plan Direct PlanGrowth 2,376.0530 Growth 2,413.7936Bonus - Bonus 2,401.6540Daily Dividend 1,007.4498 Daily Dividend 1,011.9280Weekly Dividend 1,008.7413 Weekly Dividend 1,008.2712
AVERAGE AUM
` 348.18 Crs.
INVESTMENT OBJECTIVE
The Scheme seeks to deliver reasonable market related returns with lower risk and higher liquidity through portfolio of debt and money market instruments. The Scheme is not providing any assured or guaranteed returns.
CRISIL Liquid Fund Index
July 16, 2008
` 310.40 Crs.
MINIMUM APPLICATION AMOUNT (LUMPSUM)
Regular/ Direct Plan ` 1,000 and in multiples of ̀ 1
NAV (As on November 29, 2019) NAV (`)
Regular/ Direct Plan ` 5,000 and in multiples of ̀ 1
Further there is no assurance that the investment objectives of the Scheme will be realized.
FUND MANAGER
Nitish Gupta: (w.e.f. December 5, 2018) - More than 20 years of experience in managing Fixed Income Portfolio.
Amit Modani : (w.e.f. July 15, 2019) - More than 7 years of Experience in Fixed Income.
LATEST AUM
OTHER PARAMETERS (As on November 29, 2019)
ADDITIONAL PURCHASE AMOUNT
Average Maturity: 5.84 MonthsModified Duration: 0.45Portfolio Yield: 5.59%
LOAD STRUCTURE (FOR ALL PLANS)
Exit Load NIL
GRAND TOTAL 100.00
Commercial Paper
Housing Development Finance Corporation Limited CRISIL A1+ 7.09
REC Limited CRISIL A1+ 5.69
Total 12.78
MONEY MARKET INSTRUMENTS
Certificate of Deposit
Small Industries Dev Bank of India CRISIL A1+ 7.08
ICICI Bank Limited ICRA A1+ 7.08
Bank of Baroda IND A1+ 7.08
Export Import Bank of India CRISIL A1+ 7.07
Indian Bank IND A1+ 6.99
Axis Bank Limited CRISIL A1+ 6.82
National Bank For Agriculture and Rural Development ICRA A1+ 5.94
Total 48.06
Portfolio Holdings Industry/ % to Net
Rating Assets
BONDS & NCDs
Listed / awaiting listing on the stock exchanges
Avendus Finance Private Limited CRISIL A+ 7.47
NTPC Limited CRISIL AAA 7.26
Mahindra & Mahindra Financial Services Limited IND AAA 7.25
National Housing Bank CARE AAA 7.23
REC Limited CRISIL AAA 1.48
Power Finance Corporation Limited CRISIL AAA 1.45
Total 32.14
Cash & Cash Equivalent
Net Receivables/Payables 2.47
TREPS / Reverse Repo Investments 4.55
Total 7.02
13
U
L
T
R
A
S
H
O
R
T
D
U
R
A
T
I
O
N
F
U
N
D
32.14%
Cash & Cash Equivalent
7.47%
Certificate of Deposit Bonds & NCDs Commercial Paper
Cash & Cash Equivalent
For Dividend History refer pg no 15-16 | For Scheme Performance refer pg no 17 to 23 | For month end Total Expense Ratio refer pg no 25
Moderate
Low
High
Moderately
Low
ModeratelyHigh
Investors understand that their principal will be at low risk
LOW HIGH
*Investors should consult their financial advisor if they are not clear about the suitability of the product.
• Investment in Debt and Money Market Instruments.
• Income over short term.
This product is suitable for investors who are seeking*: Riskometer
Debt FundHybrid FundEquity Fund
All data as on November 30, 2019 (Unless indicated otherwise)
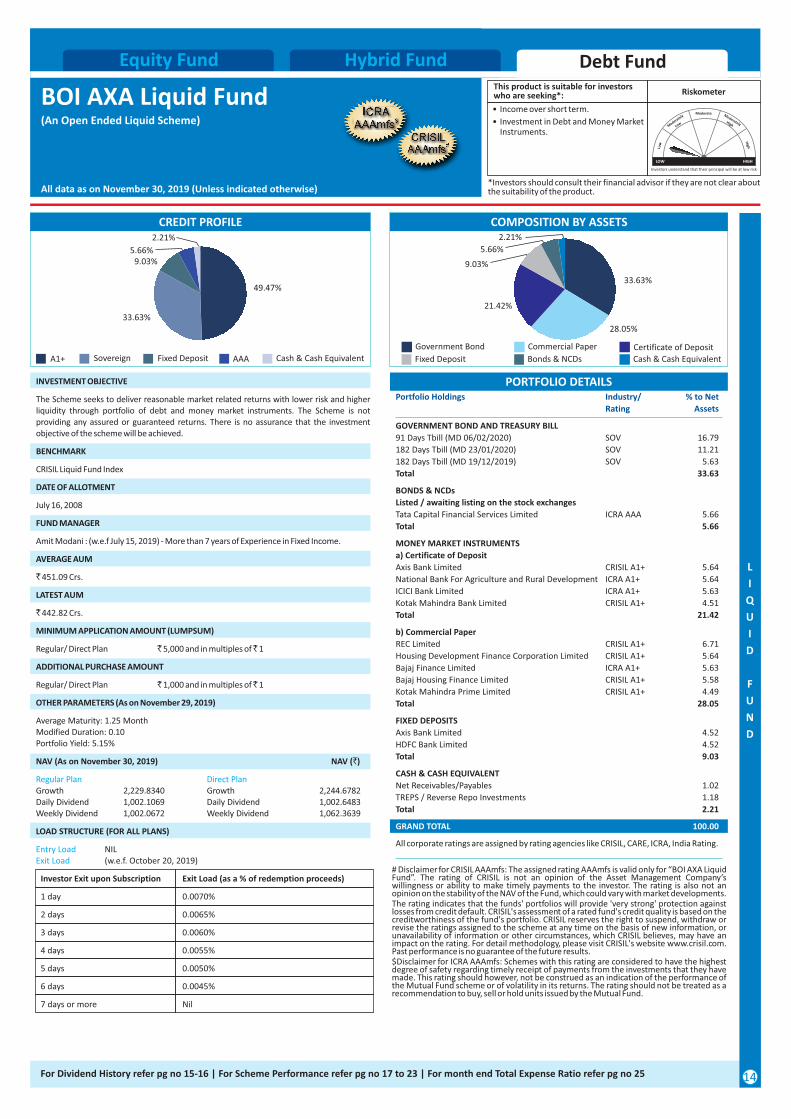
BOI AXA Liquid Fund(An Open Ended Liquid Scheme)
The rating indicates that the funds' portfolios will provide 'very strong' protection against losses from credit default. CRISIL's assessment of a rated fund's credit quality is based on the creditworthiness of the fund's portfolio. CRISIL reserves the right to suspend, withdraw or revise the ratings assigned to the scheme at any time on the basis of new information, or unavailability of information or other circumstances, which CRISIL believes, may have an impact on the rating. For detail methodology, please visit CRISIL's website www.crisil.com. Past performance is no guarantee of the future results.
# Disclaimer for CRISIL AAAmfs: The assigned rating AAAmfs is valid only for “BOI AXA Liquid Fund”. The rating of CRISIL is not an opinion of the Asset Management Company’s willingness or ability to make timely payments to the investor. The rating is also not an opinion on the stability of the NAV of the Fund, which could vary with market developments.
$Disclaimer for ICRA AAAmfs: Schemes with this rating are considered to have the highest degree of safety regarding timely receipt of payments from the investments that they have made. This rating should however, not be construed as an indication of the performance of the Mutual Fund scheme or of volatility in its returns. The rating should not be treated as a recommendation to buy, sell or hold units issued by the Mutual Fund.
PORTFOLIO DETAILSPortfolio Holdings Industry/ % to Net
Rating Assets
GOVERNMENT BOND AND TREASURY BILL
91 Days Tbill (MD 06/02/2020) SOV 16.79
182 Days Tbill (MD 23/01/2020) SOV 11.21
182 Days Tbill (MD 19/12/2019) SOV 5.63
Total 33.63
BONDS & NCDs
Listed / awaiting listing on the stock exchanges
Tata Capital Financial Services Limited ICRA AAA 5.66
Total 5.66
b) Commercial Paper
REC Limited CRISIL A1+ 6.71
Housing Development Finance Corporation Limited CRISIL A1+ 5.64
Bajaj Finance Limited ICRA A1+ 5.63
Bajaj Housing Finance Limited CRISIL A1+ 5.58
Kotak Mahindra Prime Limited CRISIL A1+ 4.49
Total 28.05
FIXED DEPOSITS
Axis Bank Limited 4.52
HDFC Bank Limited 4.52
Total 9.03
CASH & CASH EQUIVALENT
Net Receivables/Payables 1.02
TREPS / Reverse Repo Investments 1.18
Total 2.21
MONEY MARKET INSTRUMENTS
a) Certificate of Deposit
Axis Bank Limited CRISIL A1+ 5.64
National Bank For Agriculture and Rural Development ICRA A1+ 5.64
ICICI Bank Limited ICRA A1+ 5.63
Kotak Mahindra Bank Limited CRISIL A1+ 4.51
Total 21.42
GRAND TOTAL 100.00
All corporate ratings are assigned by rating agencies like CRISIL, CARE, ICRA, India Rating.
BENCHMARK
INVESTMENT OBJECTIVE
The Scheme seeks to deliver reasonable market related returns with lower risk and higher liquidity through portfolio of debt and money market instruments. The Scheme is not providing any assured or guaranteed returns. There is no assurance that the investment objective of the scheme will be achieved.
July 16, 2008
FUND MANAGER
DATE OF ALLOTMENT
CRISIL Liquid Fund Index
Amit Modani : (w.e.f July 15, 2019) - More than 7 years of Experience in Fixed Income.
AVERAGE AUM
` 451.09 Crs.
LATEST AUM
` 442.82 Crs.
2 days 0.0065%
7 days or more Nil
MINIMUM APPLICATION AMOUNT (LUMPSUM)
ADDITIONAL PURCHASE AMOUNT
NAV (As on November 30, 2019) NAV (`)
Investor Exit upon Subscription Exit Load (as a % of redemption proceeds)
1 day 0.0070%
Average Maturity: 1.25 MonthModified Duration: 0.10Portfolio Yield: 5.15%
Regular Plan Direct Plan Growth 2,229.8340 Growth 2,244.6782Daily Dividend 1,002.1069 Daily Dividend 1,002.6483Weekly Dividend 1,002.0672 Weekly Dividend 1,062.3639
6 days 0.0045%
Regular/ Direct Plan ` 1,000 and in multiples of ̀ 1
4 days 0.0055%
5 days 0.0050%
LOAD STRUCTURE (FOR ALL PLANS)
OTHER PARAMETERS (As on November 29, 2019)
Regular/ Direct Plan ` 5,000 and in multiples of ̀ 1
Entry Load NIL (w.e.f. October 20, 2019)Exit Load
3 days 0.0060%
14
L
I
Q
U
I
D
F
U
N
D
CREDIT PROFILE COMPOSITION BY ASSETS
Government Bond Commercial Paper Certificate of Deposit
Fixed Deposit Cash & Cash EquivalentA1+ AAASovereign Cash & Cash Equivalent
33.63%
2.21%
5.66%
28.05%
9.03%
2.21%
49.47%
33.63%
5.66%
For Dividend History refer pg no 15-16 | For Scheme Performance refer pg no 17 to 23 | For month end Total Expense Ratio refer pg no 25
Bonds & NCDs
21.42%
Fixed Deposit
9.03%
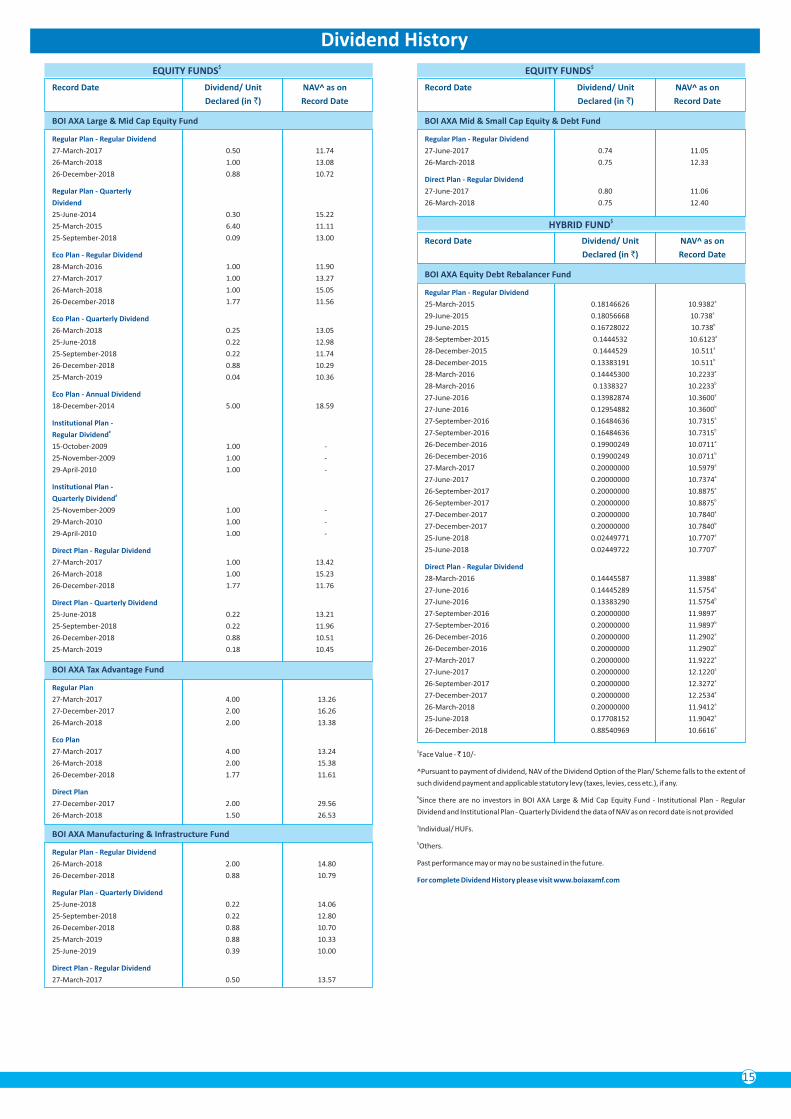
Dividend History$EQUITY FUNDS
aIndividual/ HUFs.
#Since there are no investors in BOI AXA Large & Mid Cap Equity Fund - Institutional Plan - Regular
Dividend and Institutional Plan - Quarterly Dividend the data of NAV as on record date is not provided
For complete Dividend History please visit www.boiaxamf.com
bOthers.
Past performance may or may no be sustained in the future.
^Pursuant to payment of dividend, NAV of the Dividend Option of the Plan/ Scheme falls to the extent of
such dividend payment and applicable statutory levy (taxes, levies, cess etc.), if any.
$Face Value - ̀ 10/-
$HYBRID FUND
Direct Plan - Regular Dividend a28-March-2016 0.14445587 11.3988 a27-June-2016 0.14445289 11.5754 b27-June-2016 0.13383290 11.5754 a27-September-2016 0.20000000 11.9897 b27-September-2016 0.20000000 11.9897 a26-December-2016 0.20000000 11.2902 b26-December-2016 0.20000000 11.2902a27-March-2017 0.20000000 11.9222 a27-June-2017 0.20000000 12.1220 a26-September-2017 0.20000000 12.3272 a27-December-2017 0.20000000 12.2534 a26-March-2018 0.20000000 11.9412 a25-June-2018 0.17708152 11.9042 a26-December-2018 0.88540969 10.6616
Regular Plan - Regular Dividend a25-March-2015 0.18146626 10.9382
a29-June-2015 0.18056668 10.738 b29-June-2015 0.16728022 10.738
a28-September-2015 0.1444532 10.6123 a28-December-2015 0.1444529 10.511 b28-December-2015 0.13383191 10.511 a28-March-2016 0.14445300 10.2233 b28-March-2016 0.1338327 10.2233 a
27-June-2016 0.13982874 10.3600 b
27-June-2016 0.12954882 10.3600 a
27-September-2016 0.16484636 10.7315 b
27-September-2016 0.16484636 10.7315 a
26-December-2016 0.19900249 10.0711 b
26-December-2016 0.19900249 10.0711a
27-March-2017 0.20000000 10.5979 a
27-June-2017 0.20000000 10.7374 a
26-September-2017 0.20000000 10.8875 b
26-September-2017 0.20000000 10.8875 a
27-December-2017 0.20000000 10.7840 b
27-December-2017 0.20000000 10.7840a
25-June-2018 0.02449771 10.7707 b
25-June-2018 0.02449722 10.7707
Record Date Dividend/ Unit NAV^ as on
Declared (in `) Record Date
BOI AXA Equity Debt Rebalancer Fund
BOI AXA Tax Advantage Fund
Eco Plan
27-March-2017 4.00 13.24
26-March-2018 2.00 15.38
26-December-2018 1.77 11.61
Regular Plan
27-March-2017 4.00 13.26
27-December-2017 2.00 16.26
26-March-2018 2.00 13.38
Direct Plan
27-December-2017 2.00 29.56
26-March-2018 1.50 26.53
Regular Plan - Regular Dividend
26-March-2018 2.00 14.80
26-December-2018 0.88 10.79
BOI AXA Manufacturing & Infrastructure Fund
Regular Plan - Quarterly Dividend
25-June-2018 0.22 14.06
25-September-2018 0.22 12.80
26-December-2018 0.88 10.70
25-March-2019 0.88 10.33
25-June-2019 0.39 10.00
Direct Plan - Regular Dividend
27-March-2017 0.50 13.57
Record Date Dividend/ Unit NAV^ as on
Declared (in `) Record Date
Regular Plan - Regular Dividend
27-March-2017 0.50 11.74
26-March-2018 1.00 13.08
26-December-2018 0.88 10.72
Eco Plan - Regular Dividend
28-March-2016 1.00 11.90
27-March-2017 1.00 13.27
26-March-2018 1.00 15.05
26-December-2018 1.77 11.56
Eco Plan - Quarterly Dividend
26-March-2018 0.25 13.05
25-June-2018 0.22 12.98
25-September-2018 0.22 11.74
26-December-2018 0.88 10.29
25-March-2019 0.04 10.36
BOI AXA Large & Mid Cap Equity Fund
Institutional Plan - #Regular Dividend
15-October-2009 1.00 -
25-November-2009 1.00 -
29-April-2010 1.00 -
Eco Plan - Annual Dividend
18-December-2014 5.00 18.59
Institutional Plan - #Quarterly Dividend
25-November-2009 1.00 -
29-March-2010 1.00 -
29-April-2010 1.00 -
Direct Plan - Quarterly Dividend
25-June-2018 0.22 13.21
25-September-2018 0.22 11.96
26-December-2018 0.88 10.51
25-March-2019 0.18 10.45
Direct Plan - Regular Dividend
27-March-2017 1.00 13.42
26-March-2018 1.00 15.23
26-December-2018 1.77 11.76
Regular Plan - Quarterly
Dividend
25-June-2014 0.30 15.22
25-March-2015 6.40 11.11
25-September-2018 0.09 13.00
$EQUITY FUNDS
Record Date Dividend/ Unit NAV^ as on
Declared (in `) Record Date
Regular Plan - Regular Dividend
27-June-2017 0.74 11.05
26-March-2018 0.75 12.33
BOI AXA Mid & Small Cap Equity & Debt Fund
Direct Plan - Regular Dividend
27-June-2017 0.80 11.06
26-March-2018 0.75 12.40
15
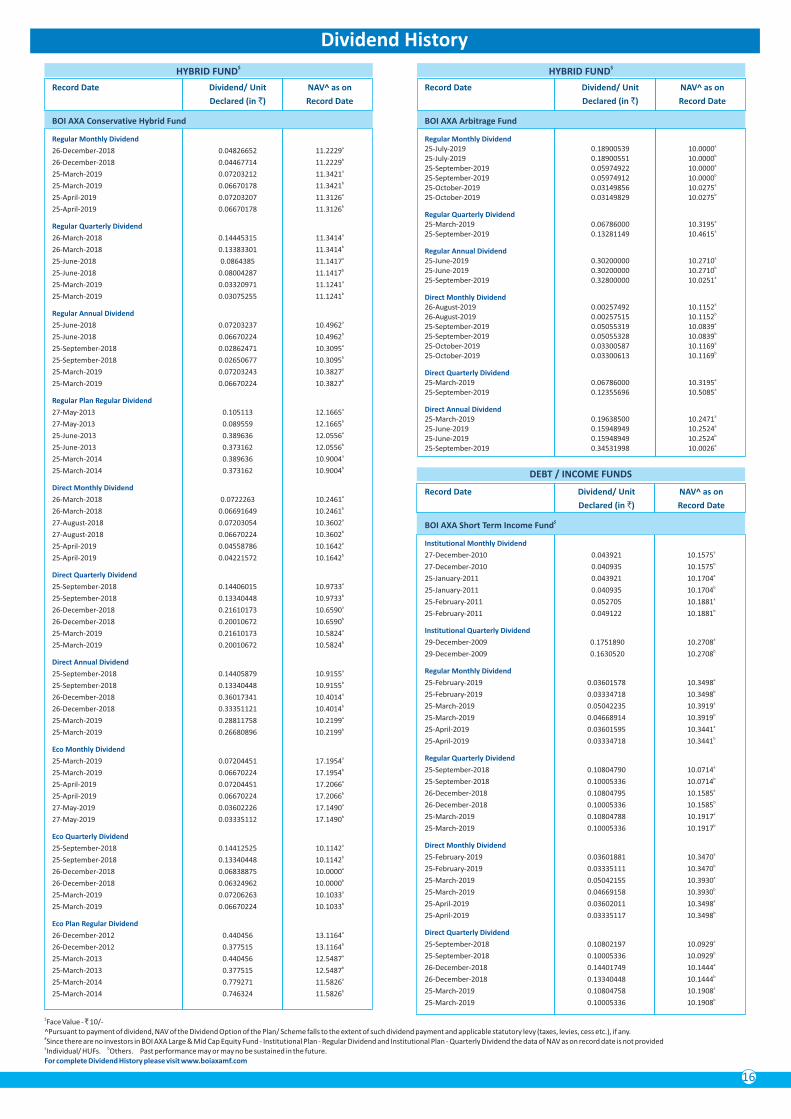
Dividend History
DEBT / INCOME FUNDS
$BOI AXA Short Term Income Fund
Institutional Monthly Dividend a27-December-2010 0.043921 10.1575b27-December-2010 0.040935 10.1575a25-January-2011 0.043921 10.1704b25-January-2011 0.040935 10.1704a25-February-2011 0.052705 10.1881b25-February-2011 0.049122 10.1881
Institutional Quarterly Dividend a
29-December-2009 0.1751890 10.2708 b
29-December-2009 0.1630520 10.2708
Regular Quarterly Dividend a25-September-2018 0.10804790 10.0714b25-September-2018 0.10005336 10.0714a26-December-2018 0.10804795 10.1585b26-December-2018 0.10005336 10.1585a25-March-2019 0.10804788 10.1917b25-March-2019 0.10005336 10.1917
Direct Monthly Dividend a25-February-2019 0.03601881 10.3470b25-February-2019 0.03335111 10.3470a25-March-2019 0.05042155 10.3930b25-March-2019 0.04669158 10.3930a25-April-2019 0.03602011 10.3498b25-April-2019 0.03335117 10.3498
Direct Quarterly Dividend a
25-September-2018 0.10802197 10.0929b
25-September-2018 0.10005336 10.0929a
26-December-2018 0.14401749 10.1444b
26-December-2018 0.13340448 10.1444a
25-March-2019 0.10804758 10.1908b
25-March-2019 0.10005336 10.1908
Regular Monthly Dividend a
25-February-2019 0.03601578 10.3498b
25-February-2019 0.03334718 10.3498a
25-March-2019 0.05042235 10.3919b
25-March-2019 0.04668914 10.3919a
25-April-2019 0.03601595 10.3441b
25-April-2019 0.03334718 10.3441
Record Date Dividend/ Unit NAV^ as on
Declared (in `) Record Date
Regular Annual Dividend a
25-June-2018 0.07203237 10.4962b
25-June-2018 0.06670224 10.4962a
25-September-2018 0.02862471 10.3095b
25-September-2018 0.02650677 10.3095a
25-March-2019 0.07203243 10.3827b
25-March-2019 0.06670224 10.3827
BOI AXA Conservative Hybrid Fund
Eco Monthly Dividend a25-March-2019 0.07204451 17.1954b25-March-2019 0.06670224 17.1954a25-April-2019 0.07204451 17.2066b25-April-2019 0.06670224 17.2066a27-May-2019 0.03602226 17.1490b27-May-2019 0.03335112 17.1490
Record Date Dividend/ Unit NAV^ as on
Declared (in `) Record Date
Regular Monthly Dividenda
26-December-2018 0.04826652 11.2229b
26-December-2018 0.04467714 11.2229a
25-March-2019 0.07203212 11.3421b
25-March-2019 0.06670178 11.3421a
25-April-2019 0.07203207 11.3126b
25-April-2019 0.06670178 11.3126
Regular Quarterly Dividend a26-March-2018 0.14445315 11.3414b26-March-2018 0.13383301 11.3414a25-June-2018 0.0864385 11.1417b25-June-2018 0.08004287 11.1417a25-March-2019 0.03320971 11.1241b25-March-2019 0.03075255 11.1241
Regular Plan Regular Dividend a
27-May-2013 0.105113 12.1665 b
27-May-2013 0.089559 12.1665 a
25-June-2013 0.389636 12.0556 b
25-June-2013 0.373162 12.0556 a
25-March-2014 0.389636 10.9004 b
25-March-2014 0.373162 10.9004
Direct Monthly Dividend a26-March-2018 0.0722263 10.2461b26-March-2018 0.06691649 10.2461a27-August-2018 0.07203054 10.3602b27-August-2018 0.06670224 10.3602a25-April-2019 0.04558786 10.1642b25-April-2019 0.04221572 10.1642
Direct Quarterly Dividend a25-September-2018 0.14406015 10.9733b25-September-2018 0.13340448 10.9733a
26-December-2018 0.21610173 10.6590b
26-December-2018 0.20010672 10.6590a
25-March-2019 0.21610173 10.5824b
25-March-2019 0.20010672 10.5824
Direct Annual Dividend a
25-September-2018 0.14405879 10.9155b
25-September-2018 0.13340448 10.9155a
26-December-2018 0.36017341 10.4014b
26-December-2018 0.33351121 10.4014a
25-March-2019 0.28811758 10.2199b
25-March-2019 0.26680896 10.2199
Eco Plan Regular Dividend a
26-December-2012 0.440456 13.1164 b
26-December-2012 0.377515 13.1164 a
25-March-2013 0.440456 12.5487 b
25-March-2013 0.377515 12.5487 a
25-March-2014 0.779271 11.5826 b
25-March-2014 0.746324 11.5826
Eco Quarterly Dividend a25-September-2018 0.14412525 10.1142b25-September-2018 0.13340448 10.1142a26-December-2018 0.06838875 10.0000b26-December-2018 0.06324962 10.0000a25-March-2019 0.07206263 10.1033b
25-March-2019 0.06670224 10.1033
$HYBRID FUND
16
Direct Monthly Dividend a26-August-2019 0.00257492 10.1152b
26-August-2019 0.00257515 10.1152a25-September-2019 0.05055319 10.0839b
25-September-2019 0.05055328 10.0839a
25-October-2019 0.03300587 10.1169b25-October-2019 0.03300613 10.1169
Regular Annual Dividenda25-June-2019 0.30200000 10.2710b
25-June-2019 0.30200000 10.2710a
25-September-2019 0.32800000 10.0251
Regular Quarterly Dividenda25-March-2019 0.06786000 10.3195a
25-September-2019 0.13281149 10.4615
Direct Annual Dividenda25-March-2019 0.19638500 10.2471a
25-June-2019 0.15948949 10.2524b25-June-2019 0.15948949 10.2524a
25-September-2019 0.34531998 10.0026
Direct Quarterly Dividenda
25-March-2019 0.06786000 10.3195a25-September-2019 0.12355696 10.5085
Record Date Dividend/ Unit NAV^ as on
Declared (in `) Record Date
BOI AXA Arbitrage Fund
Regular Monthly Dividenda25-July-2019 0.18900539 10.0000b25-July-2019 0.18900551 10.0000a
25-September-2019 0.05974922 10.0000b25-September-2019 0.05974912 10.0000a
25-October-2019 0.03149856 10.0275b25-October-2019 0.03149829 10.0275
$HYBRID FUND
$Face Value - ̀ 10/-
#Since there are no investors in BOI AXA Large & Mid Cap Equity Fund - Institutional Plan - Regular Dividend and Institutional Plan - Quarterly Dividend the data of NAV as on record date is not provided
For complete Dividend History please visit www.boiaxamf.com
a bIndividual/ HUFs. Others. Past performance may or may no be sustained in the future.
^Pursuant to payment of dividend, NAV of the Dividend Option of the Plan/ Scheme falls to the extent of such dividend payment and applicable statutory levy (taxes, levies, cess etc.), if any.
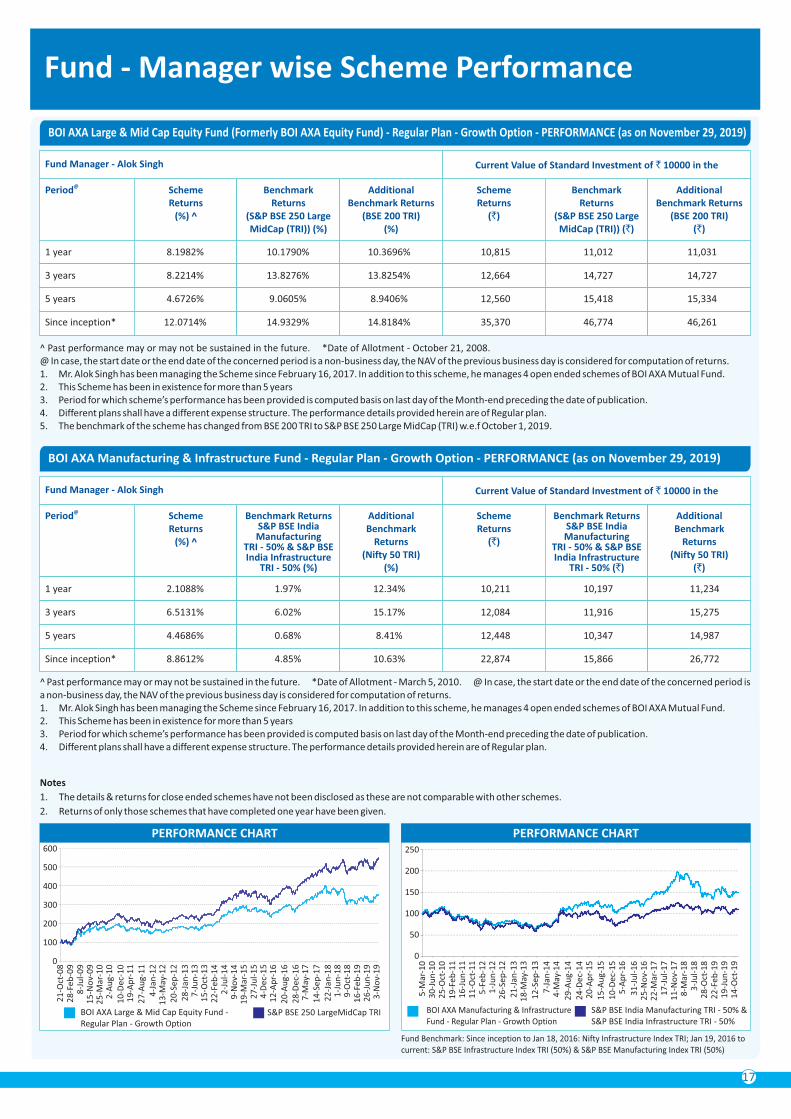
Fund - Manager wise Scheme Performance
@Period Scheme Returns
(%) ^
Benchmark Returns
(S&P BSE 250 LargeMidCap (TRI)) (%)
1. Mr. Alok Singh has been managing the Scheme since February 16, 2017. In addition to this scheme, he manages 4 open ended schemes of BOI AXA Mutual Fund.
4. Different plans shall have a different expense structure. The performance details provided herein are of Regular plan.
2. This Scheme has been in existence for more than 5 years 3. Period for which scheme’s performance has been provided is computed basis on last day of the Month-end preceding the date of publication.
^ Past performance may or may not be sustained in the future. *Date of Allotment - October 21, 2008.
5. The benchmark of the scheme has changed from BSE 200 TRI to S&P BSE 250 Large MidCap (TRI) w.e.f October 1, 2019.
@ In case, the start date or the end date of the concerned period is a non-business day, the NAV of the previous business day is considered for computation of returns.
PERFORMANCE CHART
BOI AXA Large & Mid Cap Equity Fund - Regular Plan - Growth Option
S&P BSE 250 LargeMidCap TRI
Additional Benchmark Returns
(BSE 200 TRI)(%)
Scheme Returns
(`)
Benchmark Returns
(S&P BSE 250 LargeMidCap (TRI)) (`)
Additional Benchmark Returns
(BSE 200 TRI)(`)
3 years 8.2214% 13.8276% 13.8254% 12,664 14,727 14,727
5 years 4.6726% 9.0605% 8.9406% 12,560 15,418 15,334
Since inception* 12.0714% 14.9329% 14.8184% 35,370 46,774 46,261
1 year 8.1982% 10.1790% 10.3696% 10,815 11,012 11,031
Current Value of Standard Investment of ` 10000 in the
^ Past performance may or may not be sustained in the future. *Date of Allotment - March 5, 2010. @ In case, the start date or the end date of the concerned period is a non-business day, the NAV of the previous business day is considered for computation of returns.1. Mr. Alok Singh has been managing the Scheme since February 16, 2017. In addition to this scheme, he manages 4 open ended schemes of BOI AXA Mutual Fund.
4. Different plans shall have a different expense structure. The performance details provided herein are of Regular plan.
2. This Scheme has been in existence for more than 5 years 3. Period for which scheme’s performance has been provided is computed basis on last day of the Month-end preceding the date of publication.
1 year 2.1088% 1.97% 12.34% 10,211 10,197 11,234
3 years 6.5131% 6.02% 15.17% 12,084 11,916 15,275
Since inception* 8.8612% 4.85% 10.63% 22,874 15,866 26,772
5 years 4.4686% 0.68% 8.41% 12,448 10,347 14,987
Notes
1. The details & returns for close ended schemes have not been disclosed as these are not comparable with other schemes.
2. Returns of only those schemes that have completed one year have been given.
PERFORMANCE CHART
BOI AXA Manufacturing & InfrastructureFund - Regular Plan - Growth Option
S&P BSE India Manufacturing TRI - 50% &S&P BSE India Infrastructure TRI - 50%
0
50
100
250
150
Fund Manager - Alok Singh
200
0
100
200
300
400
600
Fund Benchmark: Since inception to Jan 18, 2016: Nifty Infrastructure Index TRI; Jan 19, 2016 to current: S&P BSE Infrastructure Index TRI (50%) & S&P BSE Manufacturing Index TRI (50%)
@Period Scheme Returns
(%) ^
Benchmark Returns S&P BSE India Manufacturing
TRI - 50% & S&P BSE India Infrastructure
TRI - 50% (%)
Additional Benchmark
Returns (Nifty 50 TRI)
(%)
Scheme Returns
(`)
Benchmark Returns S&P BSE India Manufacturing
TRI - 50% & S&P BSE India Infrastructure
TRI - 50% (`)
Additional Benchmark
Returns (Nifty 50 TRI)
(`)
Current Value of Standard Investment of ` 10000 in theFund Manager - Alok Singh
17
BOI AXA Large & Mid Cap Equity Fund (Formerly BOI AXA Equity Fund) - Regular Plan - Growth Option - PERFORMANCE (as on November 29, 2019)
BOI AXA Manufacturing & Infrastructure Fund - Regular Plan - Growth Option - PERFORMANCE (as on November 29, 2019)
500
5-M
ar-1
03
0-J
un
-10
25
-Oct
-10
19
-Feb
-11
16
-Ju
n-1
11
1-O
ct-1
15
-Feb
-12
1-J
un
-12
26
-Sep
-12
21
-Jan
-13
18
-May
-13
12
-Sep
-13
7-J
an-1
44
-May
-14
29
-Au
g-1
42
4-D
ec-1
42
0-A
pr-
15
15
-Au
g-1
51
0-D
ec-1
55
-Ap
r-1
6
31
-Ju
l-1
62
5-N
ov-
16
22
-Mar
-17
17
-Ju
l-1
71
1-N
ov-
17
8-M
ar-1
83
-Ju
l-1
82
8-O
ct-1
82
2-F
eb-1
91
9-J
un
-19
14
-Oct
-19
21
-Oct
-08
28
-Feb
-09
8-J
ul-
09
15
-No
v-0
92
5-M
ar-1
02
-Au
g-1
01
0-D
ec-1
01
9-A
pr-
11
27
-Au
g-1
14
-Jan
-12
13
-May
-12
20
-Sep
-12
28
-Jan
-13
7-J
un
-13
15
-Oct
-13
22
-Feb
-14
2-J
ul-
14
9-N
ov-
14
19
-Mar
-15
27
-Ju
l-1
54
-Dec
-15
12
-Ap
r-1
62
0-A
ug-
16
28
-Dec
-16
7-M
ay-1
71
4-S
ep-1
72
2-J
an-1
81
-Ju
n-1
89
-Oct
-18
16
-Feb
-19
26
-Ju
n-1
93
-No
v-1
9
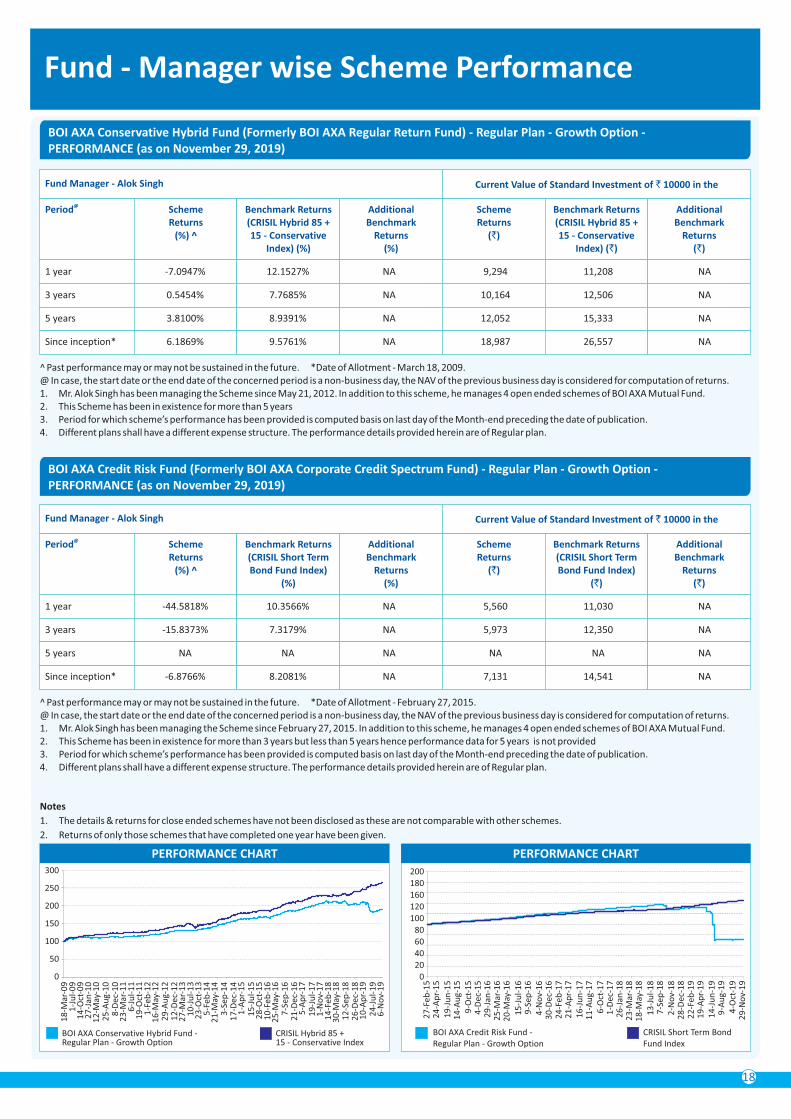
@Period Scheme Returns
(%) ^
Benchmark Returns(CRISIL Hybrid 85 + 15 - Conservative
Index) (%)
@ In case, the start date or the end date of the concerned period is a non-business day, the NAV of the previous business day is considered for computation of returns.^ Past performance may or may not be sustained in the future. *Date of Allotment - March 18, 2009.
1. Mr. Alok Singh has been managing the Scheme since May 21, 2012. In addition to this scheme, he manages 4 open ended schemes of BOI AXA Mutual Fund.2. This Scheme has been in existence for more than 5 years 3. Period for which scheme’s performance has been provided is computed basis on last day of the Month-end preceding the date of publication.4. Different plans shall have a different expense structure. The performance details provided herein are of Regular plan.
Additional Benchmark
Returns(%)
Scheme Returns
(`)
Benchmark Returns(CRISIL Hybrid 85 + 15 - Conservative
Index) (`)
Additional Benchmark
Returns(`)
Current Value of Standard Investment of ` 10000 in the
PERFORMANCE CHART
BOI AXA Conservative Hybrid Fund -Regular Plan - Growth Option
CRISIL Hybrid 85 + 15 - Conservative Index
0
50
100
150
200
300
Fund Manager - Alok Singh
@Period Scheme Returns
(%) ^
Benchmark Returns(CRISIL Short TermBond Fund Index)
(%)
@ In case, the start date or the end date of the concerned period is a non-business day, the NAV of the previous business day is considered for computation of returns.1. Mr. Alok Singh has been managing the Scheme since February 27, 2015. In addition to this scheme, he manages 4 open ended schemes of BOI AXA Mutual Fund.
3. Period for which scheme’s performance has been provided is computed basis on last day of the Month-end preceding the date of publication.
^ Past performance may or may not be sustained in the future. *Date of Allotment - February 27, 2015.
2. This Scheme has been in existence for more than 3 years but less than 5 years hence performance data for 5 years is not provided
4. Different plans shall have a different expense structure. The performance details provided herein are of Regular plan.
BOI AXA Credit Risk Fund (Formerly BOI AXA Corporate Credit Spectrum Fund) - Regular Plan - Growth Option -PERFORMANCE (as on November 29, 2019)
Additional Benchmark
Returns(%)
Scheme Returns
(`)
Benchmark Returns(CRISIL Short TermBond Fund Index)
(`)
Additional Benchmark
Returns(`)
1 year -7.0947% 12.1527% NA 9,294 11,208 NA
Since inception* 6.1869% 9.5761% NA 18,987 26,557 NA
3 years 0.5454% 7.7685% NA 10,164 12,506 NA
5 years 3.8100% 8.9391% NA 12,052 15,333 NA
1 year -44.5818% 10.3566% NA 5,560 11,030 NA
Since inception* -6.8766% 8.2081% NA 7,131 14,541 NA
3 years -15.8373% 7.3179% NA 5,973 12,350 NA
5 years NA NA NA NA NA NA
Current Value of Standard Investment of ` 10000 in theFund Manager - Alok Singh
BOI AXA Credit Risk Fund -Regular Plan - Growth Option
CRISIL Short Term BondFund Index
PERFORMANCE CHART
0
20
40
60
80
100
120
200
Fund - Manager wise Scheme Performance
18
BOI AXA Conservative Hybrid Fund (Formerly BOI AXA Regular Return Fund) - Regular Plan - Growth Option -PERFORMANCE (as on November 29, 2019)
250
2. Returns of only those schemes that have completed one year have been given.
1. The details & returns for close ended schemes have not been disclosed as these are not comparable with other schemes.
Notes
160
180
27
-Feb
-15
24
-Ap
r-1
51
9-J
un
-15
14
-Au
g-1
59
-Oct
-15
4-D
ec-1
52
9-J
an-1
62
5-M
ar-1
62
0-M
ay-1
61
5-J
ul-
16
9-S
ep-1
64
-No
v-1
63
0-D
ec-1
62
4-F
eb-1
72
1-A
pr-
17
16
-Ju
n-1
71
1-A
ug-
17
6-O
ct-1
71
-Dec
-17
26
-Jan
-18
23
-Mar
-18
18
-May
-18
13
-Ju
l-1
87
-Sep
-18
2-N
ov-
18
28
-Dec
-18
22
-Feb
-19
19
-Ap
r-1
91
4-J
un
-19
9-A
ug-
19
4-O
ct-1
92
9-N
ov-
19
18
-Mar
-09
1-J
ul-
09
14
-Oct
-09
27
-Jan
-10
12
-May
-10
25
-Au
g-1
08
-Dec
-10
23
-Mar
-11
6-J
ul-
11
19
-Oct
-11
1-F
eb-1
21
6-M
ay-1
22
9-A
ug-
12
12
-Dec
-12
27
-Mar
-13
10
-Ju
l-1
32
3-O
ct-1
35
-Feb
-14
21
-May
-14
3-S
ep-1
41
7-D
ec-1
41
-Ap
r-1
51
5-J
ul-
15
28
-Oct
-15
10
-Feb
-16
25
-May
-16
7-S
ep-1
62
1-D
ec-1
65
-Ap
r-1
71
9-J
ul-
17
1-N
ov-
17
14
-Feb
-18
30
-May
-18
12
-Sep
-18
26
-Dec
-18
10
-Ap
r-1
92
4-J
ul-
19
6-N
ov-
19
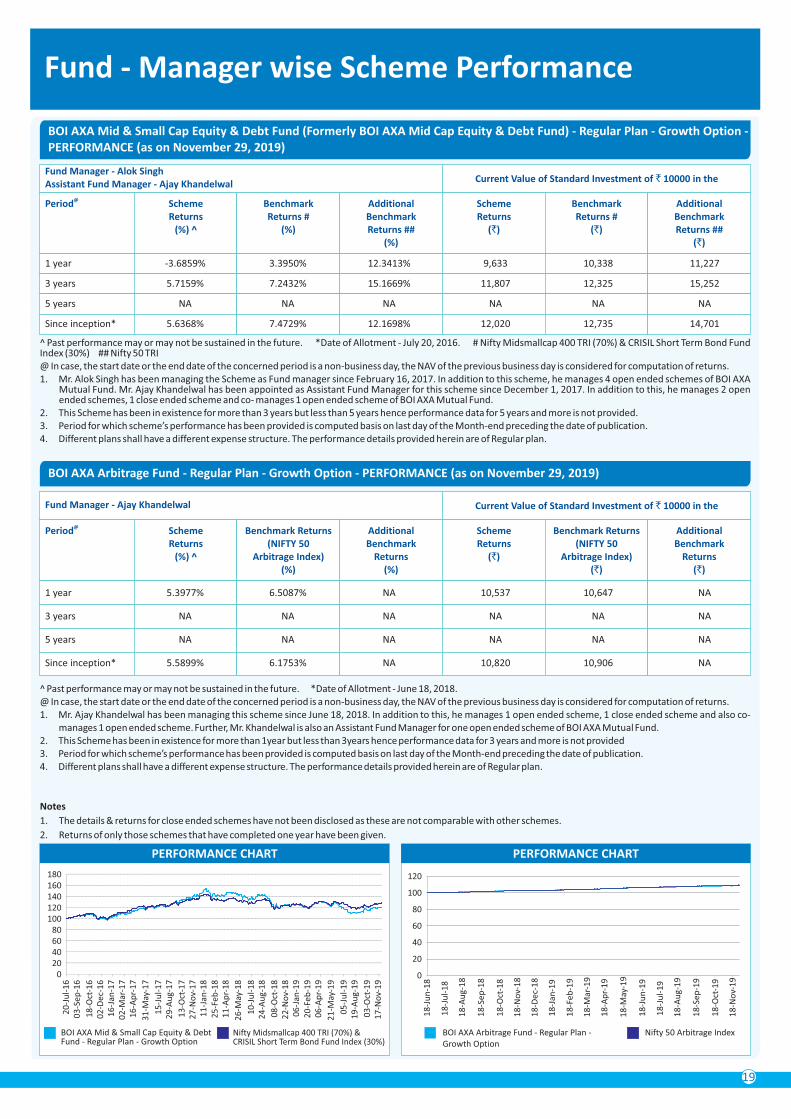
Fund - Manager wise Scheme Performance
19
Notes
2. Returns of only those schemes that have completed one year have been given.
1. The details & returns for close ended schemes have not been disclosed as these are not comparable with other schemes.
@Period Scheme Returns
(%) ^
Benchmark Returns #
(%)
2. This Scheme has been in existence for more than 3 years but less than 5 years hence performance data for 5 years and more is not provided.3. Period for which scheme’s performance has been provided is computed basis on last day of the Month-end preceding the date of publication.
1. Mr. Alok Singh has been managing the Scheme as Fund manager since February 16, 2017. In addition to this scheme, he manages 4 open ended schemes of BOI AXA Mutual Fund. Mr. Ajay Khandelwal has been appointed as Assistant Fund Manager for this scheme since December 1, 2017. In addition to this, he manages 2 open ended schemes, 1 close ended scheme and co- manages 1 open ended scheme of BOI AXA Mutual Fund.
^ Past performance may or may not be sustained in the future. *Date of Allotment - July 20, 2016. # Nifty Midsmallcap 400 TRI (70%) & CRISIL Short Term Bond Fund Index (30%) ## Nifty 50 TRI@ In case, the start date or the end date of the concerned period is a non-business day, the NAV of the previous business day is considered for computation of returns.
4. Different plans shall have a different expense structure. The performance details provided herein are of Regular plan.
Additional Benchmark Returns ##
(%)
Scheme Returns
(`)
Benchmark Returns #
(`)
Additional Benchmark Returns ##
(`)
Current Value of Standard Investment of ` 10000 in theFund Manager - Alok Singh Assistant Fund Manager - Ajay Khandelwal
1 year -3.6859% 3.3950% 12.3413% 9,633 10,338 11,227
3 years 5.7159% 7.2432% 15.1669% 11,807 12,325 15,252
5 years NA NA NA NA NA NA
Since inception* 5.6368% 7.4729% 12.1698% 12,020 12,735 14,701
BOI AXA Mid & Small Cap Equity & Debt Fund (Formerly BOI AXA Mid Cap Equity & Debt Fund) - Regular Plan - Growth Option - PERFORMANCE (as on November 29, 2019)
BOI AXA Mid & Small Cap Equity & Debt Fund - Regular Plan - Growth Option
Nifty Midsmallcap 400 TRI (70%) & CRISIL Short Term Bond Fund Index (30%)
PERFORMANCE CHART
20406080
100120
180
140
0
PERFORMANCE CHART
BOI AXA Arbitrage Fund - Regular Plan - Growth Option
Nifty 50 Arbitrage Index
0
20
40
60
80
120
100
@Period Scheme Returns
(%) ^
Benchmark Returns(NIFTY 50
Arbitrage Index)(%)
2. This Scheme has been in existence for more than 1year but less than 3years hence performance data for 3 years and more is not provided
@ In case, the start date or the end date of the concerned period is a non-business day, the NAV of the previous business day is considered for computation of returns.
4. Different plans shall have a different expense structure. The performance details provided herein are of Regular plan.3. Period for which scheme’s performance has been provided is computed basis on last day of the Month-end preceding the date of publication.
1. Mr. Ajay Khandelwal has been managing this scheme since June 18, 2018. In addition to this, he manages 1 open ended scheme, 1 close ended scheme and also co- manages 1 open ended scheme. Further, Mr. Khandelwal is also an Assistant Fund Manager for one open ended scheme of BOI AXA Mutual Fund.
^ Past performance may or may not be sustained in the future. *Date of Allotment - June 18, 2018.
BOI AXA Arbitrage Fund - Regular Plan - Growth Option - PERFORMANCE (as on November 29, 2019)
Additional Benchmark
Returns(%)
Scheme Returns
(`)
Benchmark Returns(NIFTY 50
Arbitrage Index)(`)
Additional Benchmark
Returns(`)
3 years NA NA NA NA NA NA
Since inception* 5.5899% 6.1753% NA 10,820 10,906 NA
5 years NA NA NA NA NA NA
1 year 5.3977% 6.5087% NA 10,537 10,647 NA
Current Value of Standard Investment of ` 10000 in theFund Manager - Ajay Khandelwal
160
20
-Ju
l-1
60
3-S
ep-1
6
18
-Oct
-16
02
-Dec
-16
16
-Jan
-17
02
-Mar
-17
16
-Ap
r-1
7
31
-May
-17
15
-Ju
l-1
72
9-A
ug-
17
13
-Oct
-17
27
-No
v-1
71
1-J
an-1
82
5-F
eb-1
81
1-A
pr-
18
26
-May
-18
10
-Ju
l-1
82
4-A
ug-
18
08
-Oct
-18
22
-No
v-1
80
6-J
an-1
92
0-F
eb-1
90
6-A
pr-
19
21
-May
-19
05
-Ju
l-1
91
9-A
ug-
19
03
-Oct
-19
17
-No
v-1
9
18
-Ju
n-1
8
18
-Ju
l-1
8
18
-Au
g-1
8
18
-Sep
-18
18
-Oct
-18
18
-No
v-1
8
18
-Dec
-18
18
-Jan
-19
18
-Feb
-19
18
-Mar
-19
18
-Ap
r-1
9
18
-May
-19
18
-Ju
n-1
9
18
-Ju
l-1
9
18
-Au
g-1
9
18
-Sep
-19
18
-Oct
-19
18
-No
v-1
9
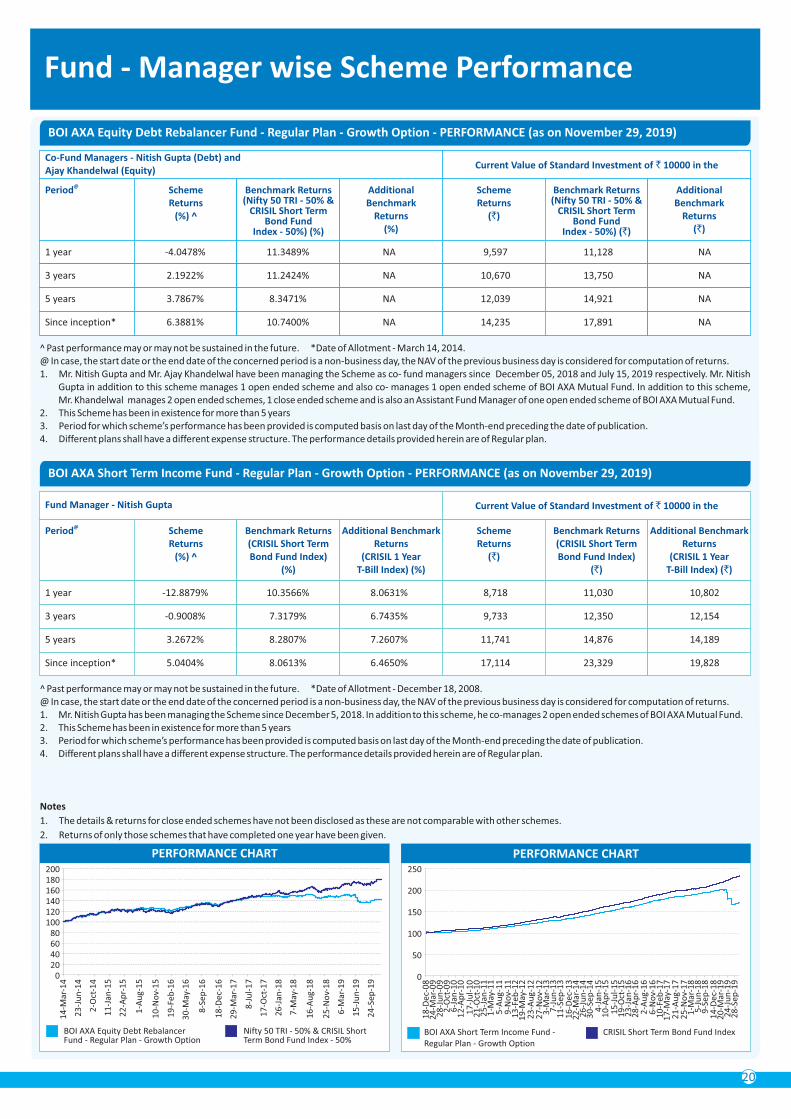
Fund - Manager wise Scheme Performance
20
@Period Scheme Returns
(%) ^
Benchmark Returns(Nifty 50 TRI - 50% &
CRISIL Short Term Bond Fund
Index - 50%) (%)
3. Period for which scheme’s performance has been provided is computed basis on last day of the Month-end preceding the date of publication.
@ In case, the start date or the end date of the concerned period is a non-business day, the NAV of the previous business day is considered for computation of returns.1. Mr. Nitish Gupta and Mr. Ajay Khandelwal have been managing the Scheme as co- fund managers since December 05, 2018 and July 15, 2019 respectively. Mr. Nitish
Gupta in addition to this scheme manages 1 open ended scheme and also co- manages 1 open ended scheme of BOI AXA Mutual Fund. In addition to this scheme, Mr. Khandelwal manages 2 open ended schemes, 1 close ended scheme and is also an Assistant Fund Manager of one open ended scheme of BOI AXA Mutual Fund.
^ Past performance may or may not be sustained in the future. *Date of Allotment - March 14, 2014.
2. This Scheme has been in existence for more than 5 years
4. Different plans shall have a different expense structure. The performance details provided herein are of Regular plan.
BOI AXA Equity Debt Rebalancer Fund - Regular Plan - Growth Option - PERFORMANCE (as on November 29, 2019)
Additional Benchmark
Returns(%)
Scheme Returns
(`)
Benchmark Returns(Nifty 50 TRI - 50% &
CRISIL Short Term Bond Fund
Index - 50%) (`)
Additional Benchmark
Returns(`)
Current Value of Standard Investment of ` 10000 in the
BOI AXA Equity Debt Rebalancer Fund - Regular Plan - Growth Option
Nifty 50 TRI - 50% & CRISIL Short Term Bond Fund Index - 50%
PERFORMANCE CHART
020406080
100120
200
Co-Fund Managers - Nitish Gupta (Debt) and Ajay Khandelwal (Equity)
1 year -4.0478% 11.3489% NA 9,597 11,128 NA
3 years 2.1922% 11.2424% NA 10,670 13,750 NA
5 years 3.7867% 8.3471% NA 12,039 14,921 NA
Since inception* 6.3881% 10.7400% NA 14,235 17,891 NA
140160
Notes
1. The details & returns for close ended schemes have not been disclosed as these are not comparable with other schemes.
2. Returns of only those schemes that have completed one year have been given.
180
@Period Scheme Returns
(%) ^
Benchmark Returns(CRISIL Short Term Bond Fund Index)
(%)
^ Past performance may or may not be sustained in the future. *Date of Allotment - December 18, 2008.
2. This Scheme has been in existence for more than 5 years
@ In case, the start date or the end date of the concerned period is a non-business day, the NAV of the previous business day is considered for computation of returns.1. Mr. Nitish Gupta has been managing the Scheme since December 5, 2018. In addition to this scheme, he co-manages 2 open ended schemes of BOI AXA Mutual Fund.
3. Period for which scheme’s performance has been provided is computed basis on last day of the Month-end preceding the date of publication.4. Different plans shall have a different expense structure. The performance details provided herein are of Regular plan.
BOI AXA Short Term Income Fund - Regular Plan - Growth Option - PERFORMANCE (as on November 29, 2019)
Additional Benchmark Returns
(CRISIL 1 Year T-Bill Index) (%)
Scheme Returns
(`)
Benchmark Returns(CRISIL Short Term Bond Fund Index)
(`)
Additional Benchmark Returns
(CRISIL 1 Year T-Bill Index) (`)
Since inception* 5.0404% 8.0613% 6.4650% 17,114 23,329 19,828
3 years -0.9008% 7.3179% 6.7435% 9,733 12,350 12,154
1 year -12.8879% 10.3566% 8.0631% 8,718 11,030 10,802
5 years 3.2672% 8.2807% 7.2607% 11,741 14,876 14,189
Current Value of Standard Investment of ` 10000 in theFund Manager - Nitish Gupta
PERFORMANCE CHART
BOI AXA Short Term Income Fund - Regular Plan - Growth Option
CRISIL Short Term Bond Fund Index
0
50
100
150
250
200
18
-Dec
-08
24
-Mar
-09
28
-Ju
n-0
92
-Oct
-09
6-J
an-1
01
2-A
pr-
10
17
-Ju
l-1
02
1-O
ct-1
02
5-J
an-1
11
-May
-11
5-A
ug-
11
9-N
ov-
11
13
-Feb
-12
19
-May
-12
23
-Au
g-1
22
7-N
ov-
12
3-M
ar-1
37
-Ju
n-1
31
1-S
ep-1
31
6-D
ec-1
32
2-M
ar-1
42
6-J
un
-14
30
-Sep
-14
4-J
an-1
51
0-A
pr-
15
15
-Ju
l-1
51
9-O
ct-1
52
3-J
an-1
62
8-A
pr-
16
2-A
ug-
16
6-N
ov-
16
10
-Feb
-17
17
-May
-17
21
-Au
g-1
72
5-N
ov-
17
1-M
ar-1
85
-Ju
n-1
89
-Sep
-18
14
-Dec
-18
20
-Mar
-19
24
-Ju
n-1
92
8-S
ep-1
9
14
-Mar
-14
23
-Ju
n-1
4
2-O
ct-1
4
11
-Jan
-15
22
-Ap
r-1
5
1-A
ug-
15
10
-No
v-1
5
19
-Feb
-16
30
-May
-16
8-S
ep-1
6
18
-Dec
-16
29
-Mar
-17
8-J
ul-
17
17
-Oct
-17
26
-Jan
-18
7-M
ay-1
8
16
-Au
g-1
8
25
-No
v-1
8
6-M
ar-1
9
15
-Ju
n-1
9
24
-Sep
-19
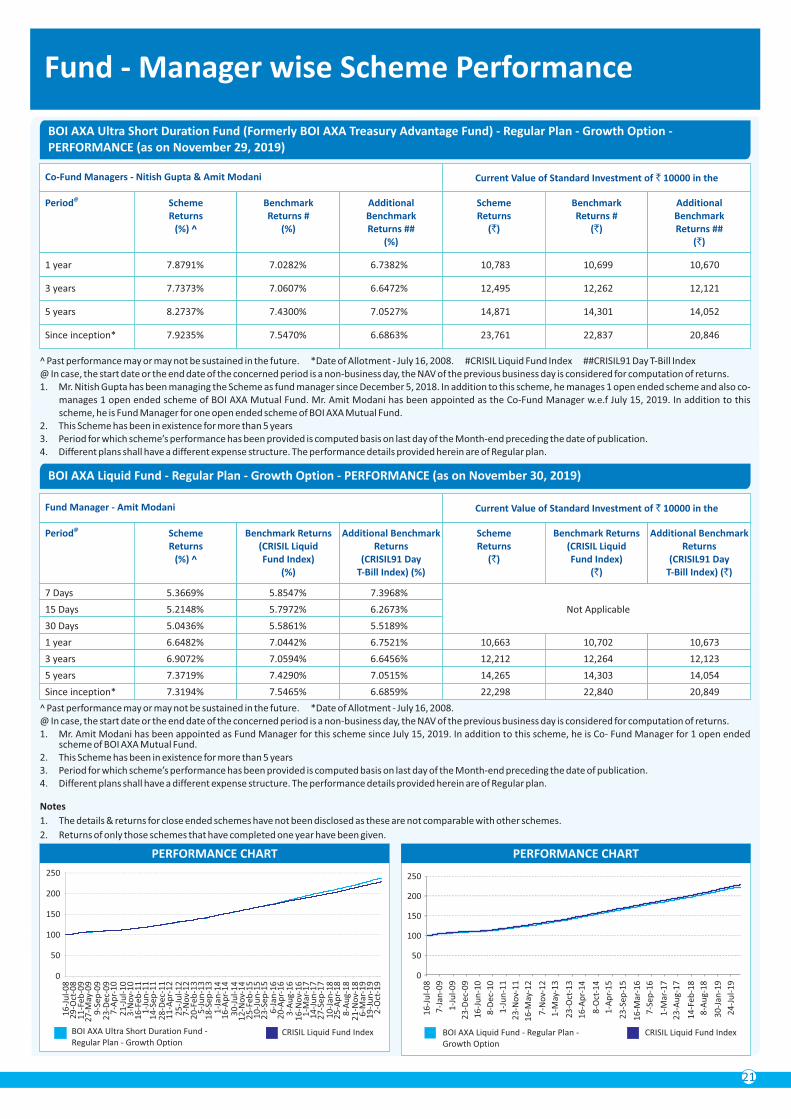
@Period Scheme Returns
(%) ^
Benchmark Returns(CRISIL Liquid Fund Index)
(%)
4. Different plans shall have a different expense structure. The performance details provided herein are of Regular plan.
@ In case, the start date or the end date of the concerned period is a non-business day, the NAV of the previous business day is considered for computation of returns.
2. This Scheme has been in existence for more than 5 years
1. Mr. Amit Modani has been appointed as Fund Manager for this scheme since July 15, 2019. In addition to this scheme, he is Co- Fund Manager for 1 open ended scheme of BOI AXA Mutual Fund.
^ Past performance may or may not be sustained in the future. *Date of Allotment - July 16, 2008.
3. Period for which scheme’s performance has been provided is computed basis on last day of the Month-end preceding the date of publication.
BOI AXA Liquid Fund - Regular Plan - Growth Option - PERFORMANCE (as on November 30, 2019)
Additional Benchmark Returns
(CRISIL91 Day T-Bill Index) (%)
Scheme Returns
(`)
Benchmark Returns (CRISIL Liquid Fund Index)
(`)
Additional Benchmark Returns
(CRISIL91 Day T-Bill Index) (`)
PERFORMANCE CHART
BOI AXA Liquid Fund - Regular Plan - Growth Option
CRISIL Liquid Fund Index
0
50
100
150
200
250
15 Days 5.2148% 5.7972% 6.2673% Not Applicable
1 year 6.6482% 7.0442% 6.7521% 10,663 10,702 10,673
7 Days 5.3669% 5.8547% 7.3968%
30 Days 5.0436% 5.5861% 5.5189%
3 years 6.9072% 7.0594% 6.6456% 12,212 12,264 12,123
5 years 7.3719% 7.4290% 7.0515% 14,265 14,303 14,054
Since inception* 7.3194% 7.5465% 6.6859% 22,298 22,840 20,849
Fund - Manager wise Scheme Performance
21
Current Value of Standard Investment of ` 10000 in theFund Manager - Amit Modani
1. The details & returns for close ended schemes have not been disclosed as these are not comparable with other schemes.
2. Returns of only those schemes that have completed one year have been given.
Notes
@Period Scheme Returns
(%) ^
Benchmark Returns #
(%)
4. Different plans shall have a different expense structure. The performance details provided herein are of Regular plan.
1. Mr. Nitish Gupta has been managing the Scheme as fund manager since December 5, 2018. In addition to this scheme, he manages 1 open ended scheme and also co-manages 1 open ended scheme of BOI AXA Mutual Fund. Mr. Amit Modani has been appointed as the Co-Fund Manager w.e.f July 15, 2019. In addition to this scheme, he is Fund Manager for one open ended scheme of BOI AXA Mutual Fund.
3. Period for which scheme’s performance has been provided is computed basis on last day of the Month-end preceding the date of publication.
@ In case, the start date or the end date of the concerned period is a non-business day, the NAV of the previous business day is considered for computation of returns.^ Past performance may or may not be sustained in the future. *Date of Allotment - July 16, 2008. #CRISIL Liquid Fund Index ##CRISIL91 Day T-Bill Index
2. This Scheme has been in existence for more than 5 years
Additional Benchmark Returns ##
(%)
Scheme Returns
(`)
Benchmark Returns #
(`)
Additional Benchmark Returns ##
(`)
3 years 7.7373% 7.0607% 6.6472% 12,495 12,262 12,121
1 year 7.8791% 7.0282% 6.7382% 10,783 10,699 10,670
Since inception* 7.9235% 7.5470% 6.6863% 23,761 22,837 20,846
5 years 8.2737% 7.4300% 7.0527% 14,871 14,301 14,052
BOI AXA Ultra Short Duration Fund (Formerly BOI AXA Treasury Advantage Fund) - Regular Plan - Growth Option -PERFORMANCE (as on November 29, 2019)
Current Value of Standard Investment of ` 10000 in theCo-Fund Managers - Nitish Gupta & Amit Modani
BOI AXA Ultra Short Duration Fund - Regular Plan - Growth Option
CRISIL Liquid Fund Index
PERFORMANCE CHART
0
50
100
150
200
250
16
-Ju
l-0
8
7-J
an-0
9
1-J
ul-
09
23
-Dec
-09
16
-Ju
n-1
0
8-D
ec-1
0
1-J
un
-11
23
-No
v-1
1
16
-May
-12
7-N
ov-
12
1-M
ay-1
3
23
-Oct
-13
16
-Ap
r-1
4
8-O
ct-1
4
1-A
pr-
15
23
-Sep
-15
16
-Mar
-16
7-S
ep-1
6
1-M
ar-1
7
23
-Au
g-1
7
14
-Feb
-18
8-A
ug-
18
30
-Jan
-19
24
-Ju
l-1
9
16
-Ju
l-0
82
9-O
ct-0
81
1-F
eb-0
92
7-M
ay-0
99
-Sep
-09
23
-Dec
-09
7-A
pr-
10
21
-Ju
l-1
03
-No
v-1
01
6-F
eb-1
11
-Ju
n-1
11
4-S
ep-1
12
8-D
ec-1
11
1-A
pr-
12
25
-Ju
l-1
27
-No
v-1
22
0-F
eb-1
35
-Ju
n-1
31
8-S
ep-1
31
-Jan
-14
16
-Ap
r-1
43
0-J
ul-
14
12
-No
v-1
42
5-F
eb-1
51
0-J
un
-15
23
-Sep
-15
6-J
an-1
62
0-A
pr-
16
3-A
ug-
16
16
-No
v-1
61
-Mar
-17
14
-Ju
n-1
72
7-S
ep-1
71
0-J
an-1
82
5-A
pr-
18
8-A
ug-
18
21
-No
v-1
86
-Mar
-19
19
-Ju
n-1
92
-Oct
-19
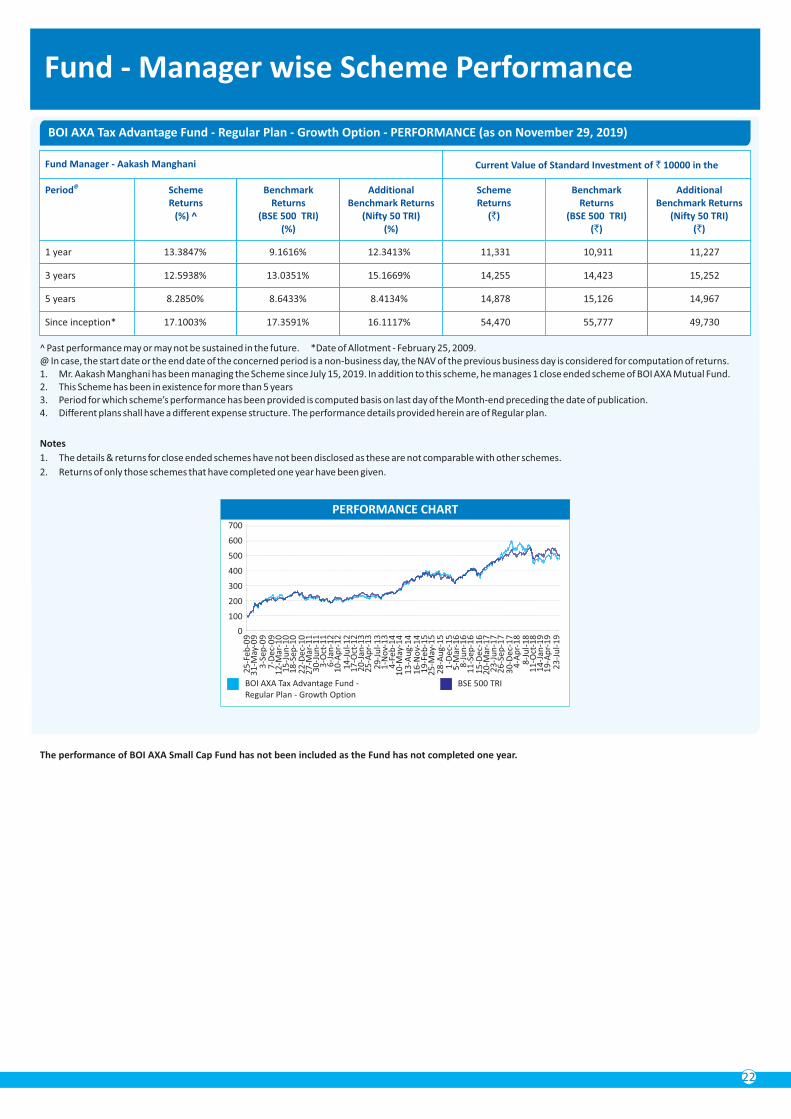
The performance of BOI AXA Small Cap Fund has not been included as the Fund has not completed one year.
Fund - Manager wise Scheme Performance
22
@Period Scheme Returns
(%) ^
Benchmark Returns
(BSE 500 TRI)(%)
2. This Scheme has been in existence for more than 5 years
4. Different plans shall have a different expense structure. The performance details provided herein are of Regular plan.
^ Past performance may or may not be sustained in the future. *Date of Allotment - February 25, 2009. @ In case, the start date or the end date of the concerned period is a non-business day, the NAV of the previous business day is considered for computation of returns.1. Mr. Aakash Manghani has been managing the Scheme since July 15, 2019. In addition to this scheme, he manages 1 close ended scheme of BOI AXA Mutual Fund.
3. Period for which scheme’s performance has been provided is computed basis on last day of the Month-end preceding the date of publication.
BOI AXA Tax Advantage Fund - Regular Plan - Growth Option - PERFORMANCE (as on November 29, 2019)
Additional Benchmark Returns
(Nifty 50 TRI)(%)
Scheme Returns
(`)
Benchmark Returns
(BSE 500 TRI)(`)
Additional Benchmark Returns
(Nifty 50 TRI)(`)
5 years 8.2850% 8.6433% 8.4134% 14,878 15,126 14,967
1 year 13.3847% 9.1616% 12.3413% 11,331 10,911 11,227
3 years 12.5938% 13.0351% 15.1669% 14,255 14,423 15,252
Since inception* 17.1003% 17.3591% 16.1117% 54,470 55,777 49,730
Current Value of Standard Investment of ` 10000 in theFund Manager - Aakash Manghani
BOI AXA Tax Advantage Fund - Regular Plan - Growth Option
BSE 500 TRI
100
200
300
400
700
PERFORMANCE CHART
500
600
0
1. The details & returns for close ended schemes have not been disclosed as these are not comparable with other schemes.
2. Returns of only those schemes that have completed one year have been given.
Notes
25
-Feb
-09
31
-May
-09
3-S
ep-0
97
-Dec
-09
12
-Mar
-10
15
-Ju
n-1
01
8-S
ep-1
02
2-D
ec-1
02
7-M
ar-1
13
0-J
un
-11
3-O
ct-1
16
-Jan
-12
10
-Ap
r-1
21
4-J
ul-
12
17
-Oct
-12
20
-Jan
-13
25
-Ap
r-1
32
9-J
ul-
13
1-N
ov-
13
4-F
eb-1
41
0-M
ay-1
41
3-A
ug-
14
16
-No
v-1
41
9-F
eb-1
52
5-M
ay-1
52
8-A
ug-
15
1-D
ec-1
55
-Mar
-16
8-J
un
-16
11
-Sep
-16
15
-Dec
-16
20
-Mar
-17
23
-Ju
n-1
72
6-S
ep-1
73
0-D
ec-1
74
-Ap
r-1
88
-Ju
l-1
81
1-O
ct-1
81
4-J
an-1
91
9-A
pr-
19
23
-Ju
l-1
9

Schemes managed by Fund Manager
Fund Manager:
BOI AXA Manufacturing & Infrastructure Fund - An open ended equity scheme investing in manufacturing and infrastructure sectors
Fund Manager:
1. Mr. Alok Singh
BOI AXA Large & Mid Cap Equity Fund - An open ended equity scheme investing in both large cap and mid cap stocks
BOI AXA Conservative Hybrid Fund - An open ended hybrid scheme investing predominantly in debt instruments
BOI AXA Credit Risk Fund - An open ended debt scheme predominantly investing in AA and below rated corporate bonds (excluding AA+ rated corporate bonds)
BOI AXA Mid & Small Cap Equity & Debt Fund - An open ended hybrid scheme investing predominantly in equity and equity related instruments
2. Mr. Nitish Gupta
BOI AXA Short Term Income Fund - An open ended short term debt scheme investing in instruments with Macaulay Duration of the portfolio between 1 year and 3 years
Co-Fund Manager:
BOI AXA Equity Debt Rebalancer Fund - An open ended dynamic asset allocation fund
BOI AXA Ultra Short Duration Fund - An open ended ultra -short term debt scheme investing in instruments with Macaulay Duration of the portfolio between 3 months and 6 months
3. Mr. Aakash Manghani
Fund Manager:
BOI AXA Tax Advantage Fund - An open ended equity linked saving scheme with a statutory lock in of 3 years and tax benefit
BOI AXA Midcap Tax Fund - Series 1 - A 10 year close ended equity linked savings scheme
4. Mr. Ajay Khandelwal
Fund Manager:
Co-Fund Manager:
BOI AXA Ultra Short Duration Fund - An open ended ultra -short term debt scheme investing in instruments with Macaulay Duration of the portfolio between 3 months and 6 months
BOI AXA Midcap Tax Fund - Series 2 - A 10 year close ended equity linked savings scheme
6. Mr. Dhruv Bhatia
BOI AXA Midcap Tax Fund - Series 1 - A 10 year close ended equity linked savings scheme
BOI AXA Mid & Small Cap Equity & Debt Fund - An open ended hybrid scheme investing predominantly in equity and equity related instruments
BOI AXA Equity Debt Rebalancer Fund - An open ended dynamic asset allocation fund
5. Mr. Amit Modani
BOI AXA Small Cap Fund - An open ended equity scheme predominantly investing in small cap stocks
Assistant Fund Manager:
Co-Fund Manager:
BOI AXA Liquid Fund - An Open ended liquid Scheme
Fund Manager:
BOI AXA Mid Cap Tax Fund - Series 2 - A 10 year close ended equity linked savings scheme
Assistant Fund Manager:
BOI AXA Arbitrage Fund - An open ended scheme investing in arbitrage opportunities
Fund - Manager wise Scheme Performance
23
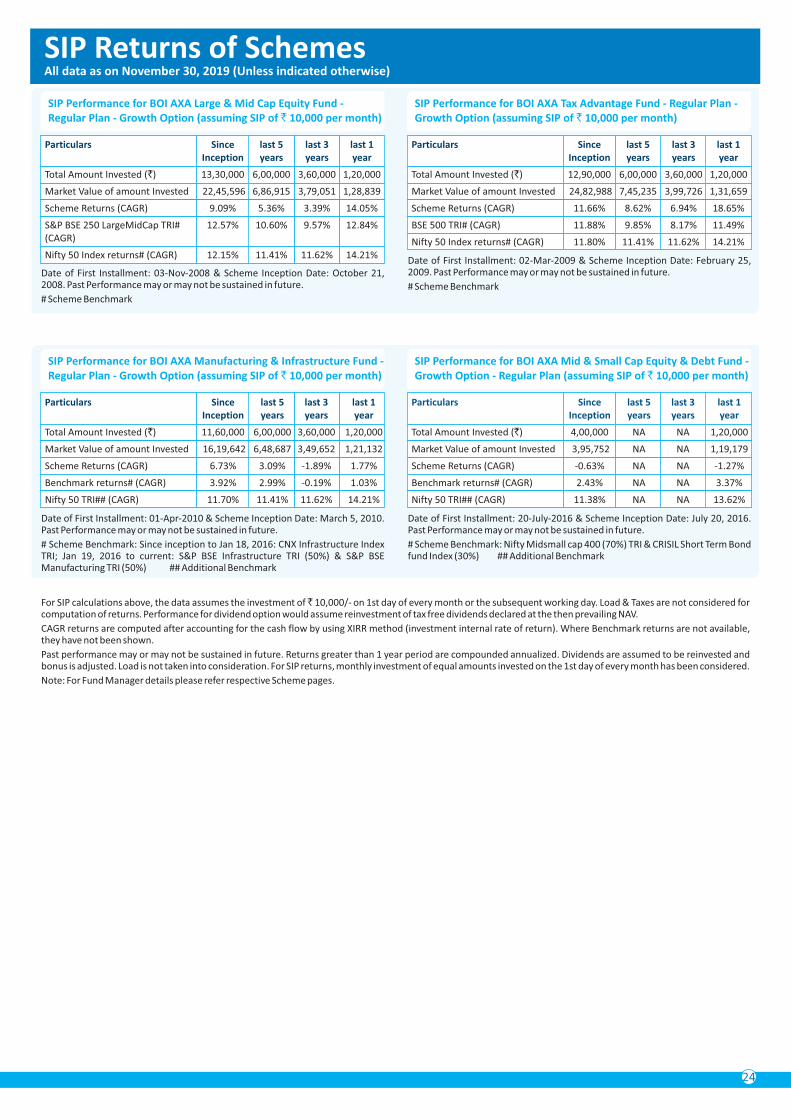
24
SIP Returns of SchemesAll data as on November 30, 2019 (Unless indicated otherwise)
Date of First Installment: 03-Nov-2008 & Scheme Inception Date: October 21, 2008. Past Performance may or may not be sustained in future.
# Scheme Benchmark# Scheme Benchmark
Date of First Installment: 02-Mar-2009 & Scheme Inception Date: February 25, 2009. Past Performance may or may not be sustained in future.
Past performance may or may not be sustained in future. Returns greater than 1 year period are compounded annualized. Dividends are assumed to be reinvested and bonus is adjusted. Load is not taken into consideration. For SIP returns, monthly investment of equal amounts invested on the 1st day of every month has been considered.
For SIP calculations above, the data assumes the investment of ̀ 10,000/- on 1st day of every month or the subsequent working day. Load & Taxes are not considered for computation of returns. Performance for dividend option would assume reinvestment of tax free dividends declared at the then prevailing NAV.
Note: For Fund Manager details please refer respective Scheme pages.
CAGR returns are computed after accounting for the cash flow by using XIRR method (investment internal rate of return). Where Benchmark returns are not available, they have not been shown.
Particulars Since last 5 last 3 last 1 Inception years years year
Market Value of amount Invested 22,45,596 6,86,915 3,79,051 1,28,839
Scheme Returns (CAGR) 9.09% 5.36% 3.39% 14.05%
S&P BSE 250 LargeMidCap TRI# 12.57% 10.60% 9.57% 12.84%(CAGR)
Total Amount Invested (`) 13,30,000 6,00,000 3,60,000 1,20,000
Nifty 50 Index returns# (CAGR) 12.15% 11.41% 11.62% 14.21%
Total Amount Invested (`) 12,90,000 6,00,000 3,60,000 1,20,000
Scheme Returns (CAGR) 11.66% 8.62% 6.94% 18.65%
Market Value of amount Invested 24,82,988 7,45,235 3,99,726 1,31,659
BSE 500 TRI# (CAGR) 11.88% 9.85% 8.17% 11.49%
Particulars Since last 5 last 3 last 1 Inception years years year
Nifty 50 Index returns# (CAGR) 11.80% 11.41% 11.62% 14.21%
Date of First Installment: 01-Apr-2010 & Scheme Inception Date: March 5, 2010. Past Performance may or may not be sustained in future.
# Scheme Benchmark: Since inception to Jan 18, 2016: CNX Infrastructure Index TRI; Jan 19, 2016 to current: S&P BSE Infrastructure TRI (50%) & S&P BSE Manufacturing TRI (50%) ## Additional Benchmark
Date of First Installment: 20-July-2016 & Scheme Inception Date: July 20, 2016. Past Performance may or may not be sustained in future.
# Scheme Benchmark: Nifty Midsmall cap 400 (70%) TRI & CRISIL Short Term Bond fund Index (30%) ## Additional Benchmark
Nifty 50 TRI## (CAGR) 11.70% 11.41% 11.62% 14.21%
Market Value of amount Invested 16,19,642 6,48,687 3,49,652 1,21,132
Scheme Returns (CAGR) 6.73% 3.09% -1.89% 1.77%
Total Amount Invested (`) 11,60,000 6,00,000 3,60,000 1,20,000
Benchmark returns# (CAGR) 3.92% 2.99% -0.19% 1.03%
Particulars Since last 5 last 3 last 1 Inception years years year
Particulars Since last 5 last 3 last 1 Inception years years year
Benchmark returns# (CAGR) 2.43% NA NA 3.37%
Nifty 50 TRI## (CAGR) 11.38% NA NA 13.62%
Market Value of amount Invested 3,95,752 NA NA 1,19,179
Scheme Returns (CAGR) -0.63% NA NA -1.27%
Total Amount Invested (`) 4,00,000 NA NA 1,20,000
SIP Performance for BOI AXA Large & Mid Cap Equity Fund - Regular Plan - Growth Option (assuming SIP of ` 10,000 per month)
SIP Performance for BOI AXA Tax Advantage Fund - Regular Plan - Growth Option (assuming SIP of ` 10,000 per month)
SIP Performance for BOI AXA Manufacturing & Infrastructure Fund - Regular Plan - Growth Option (assuming SIP of ` 10,000 per month)
SIP Performance for BOI AXA Mid & Small Cap Equity & Debt Fund - Growth Option - Regular Plan (assuming SIP of ` 10,000 per month)
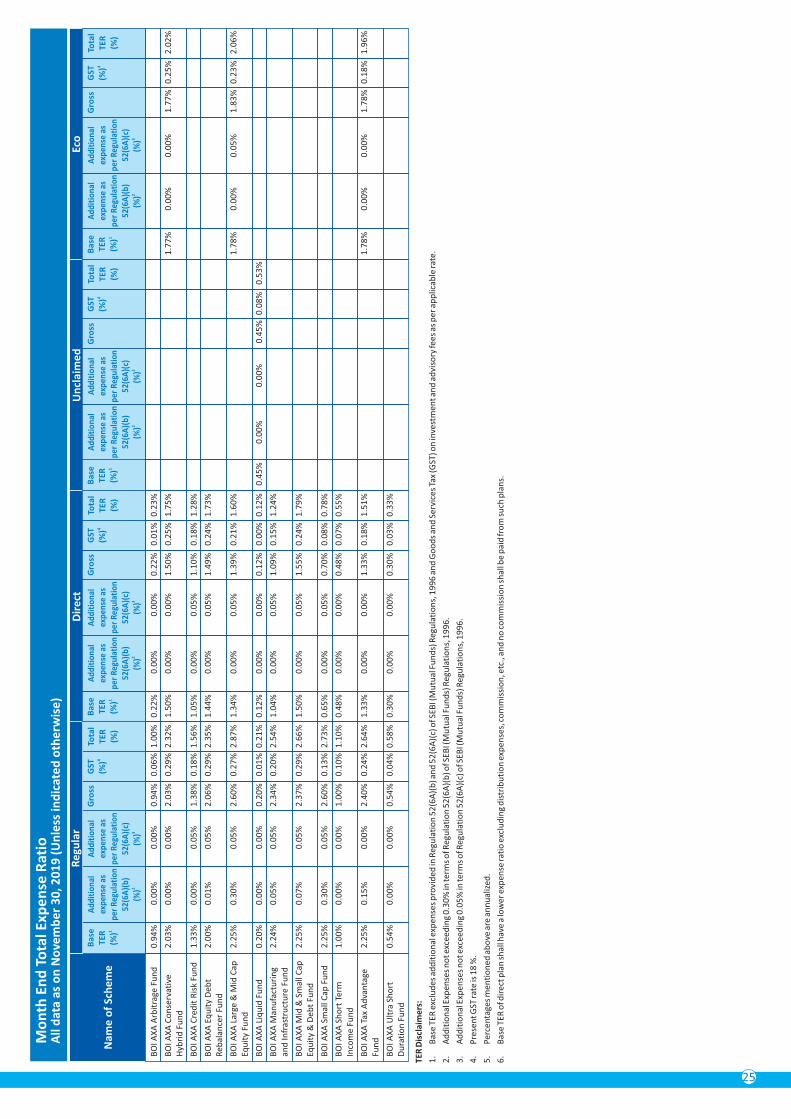
5.
Perc
enta
ges
men
tio
ned
ab
ove
are
an
nu
aliz
ed.
3.
Ad
dit
ion
al E
xpen
ses
no
t exc
eed
ing
0.0
5%
in te
rms
of R
egu
lati
on
52
(6A
)(c)
of S
EBI (
Mu
tual
Fu
nd
s) R
egu
lati
on
s, 1
99
6.
6.
Bas
e TE
R o
f dir
ect p
lan
sh
all h
ave
a lo
wer
exp
ense
rati
o e
xclu
din
g d
istr
ibu
tio
n e
xpen
ses,
co
mm
issi
on
, etc
., a
nd
no
co
mm
issi
on
sh
all b
e p
aid
fro
m s
uch
pla
ns.
TER
Dis
clai
me
rs:
2.
Ad
dit
ion
al E
xpen
ses
no
t exc
eed
ing
0.3
0%
in te
rms
of R
egu
lati
on
52
(6A
)(b
) of S
EBI (
Mu
tual
Fu
nd
s) R
egu
lati
on
s, 1
99
6.
1.
Bas
e TE
R e
xclu
des
ad
dit
ion
al e
xpen
ses
pro
vid
ed in
Reg
ula
tio
n 5
2(6
A)(
b) a
nd
52
(6A
)(c)
of S
EBI (
Mu
tual
Fu
nd
s) R
egu
lati
on
s, 1
99
6 a
nd
Go
od
s an
d S
ervi
ces
Tax
(GST
) on
inve
stm
ent a
nd
ad
viso
ry fe
es a
s p
er a
pp
licab
le ra
te.
4.
Pre
sen
t GST
rate
is 1
8 %
.
25
BO
I AX
A A
rbit
rage
Fu
nd
0
.94
%
0.0
0%
0
.00
%
0.9
4%
0
.06
%
1.0
0%
0
.22
%
0.0
0%
0
.00
%
0.2
2%
0
.01
%
0.2
3%
BO
I AX
A C
red
it R
isk
Fun
d
1.3
3%
0
.00
%
0.0
5%
1
.38
%
0.1
8%
1
.56
%
1.0
5%
0
.00
%
0.0
5%
1
.10
%
0.1
8%
1
.28
%
BO
I AX
A C
on
serv
ativ
e
2.0
3%
0
.00
%
0.0
0%
2
.03
%
0.2
9%
2
.32
%
1.5
0%
0
.00
%
0.0
0%
1
.50
%
0.2
5%
1
.75
%
1.7
7%
0
.00
%
0.0
0%
1
.77
%
0.2
5%
2
.02
%H
ybri
d F
un
d
BO
I AX
A L
iqu
id F
un
d
0.2
0%
0
.00
%
0.0
0%
0
.20
%
0.0
1%
0
.21
%
0.1
2%
0
.00
%
0.0
0%
0
.12
%
0.0
0%
0
.12
%
0.4
5%
0
.00
%
0.0
0%
0
.45
%
0.0
8%
0
.53
%
BO
I AX
A S
mal
l Cap
Fu
nd
2
.25
%
0.3
0%
0
.05
%
2.6
0%
0
.13
%
2.7
3%
0
.65
%
0.0
0%
0
.05
%
0.7
0%
0
.08
%
0.7
8%
BO
I AX
A S
ho
rt T
erm
1
.00
%
0.0
0%
0
.00
%
1.0
0%
0
.10
%
1.1
0%
0
.48
%
0.0
0%
0
.00
%
0.4
8%
0
.07
%
0.5
5%
Inco
me
Fun
d
BO
I AX
A U
ltra
Sh
ort
0
.54
%
0.0
0%
0
.00
%
0.5
4%
0
.04
%
0.5
8%
0
.30
%
0.0
0%
0
.00
%
0.3
0%
0
.03
%
0.3
3%
Du
rati
on
Fu
nd
BO
I AX
A T
ax A
dva
nta
ge
2.2
5%
0
.15
%
0.0
0%
2
.40
%
0.2
4%
2
.64
%
1.3
3%
0
.00
%
0.0
0%
1
.33
%
0.1
8%
1
.51
%
1.7
8%
0
.00
%
0.0
0%
1
.78
%
0.1
8%
1
.96
%Fu
nd
BO
I AX
A M
anu
fact
uri
ng
2
.24
%
0.0
5%
0
.05
%
2.3
4%
0
.20
%
2.5
4%
1
.04
%
0.0
0%
0
.05
%
1.0
9%
0
.15
%
1.2
4%
and
Infr
astr
uct
ure
Fu
nd
BO
I AX
A L
arge
& M
id C
ap
2.2
5%
0
.30
%
0.0
5%
2
.60
%
0.2
7%
2
.87
%
1.3
4%
0
.00
%
0.0
5%
1
.39
%
0.2
1%
1
.60
%
1.7
8%
0
.00
%
0.0
5%
1
.83
%
0.2
3%
2
.06
%Eq
uit
y Fu
nd
BO
I AX
A M
id &
Sm
all C
ap
2.2
5%
0
.07
%
0.0
5%
2
.37
%
0.2
9%
2
.66
%
1.5
0%
0
.00
%
0.0
5%
1
.55
%
0.2
4%
1
.79
%
Eq
uit
y &
Deb
t Fu
nd
BO
I AX
A E
qu
ity
Deb
t
2.0
0%
0
.01
%
0.0
5%
2
.06
%
0.2
9%
2
.35
%
1.4
4%
0
.00
%
0.0
5%
1
.49
%
0.2
4%
1
.73
%
R
ebal
ance
r Fu
nd
Mo
nth
En
d T
ota
l Exp
en
se R
atio
All
dat
a as
on
No
vem
be
r 3
0, 2
01
9 (
Un
less
ind
icat
ed
oth
erw
ise
)
Re
gula
rD
ire
ctU
ncl
aim
ed
Eco
Nam
e o
f Sc
he
me
Bas
e
TER
1(%
)
Add
itio
nal
expe
nse
as
per
Reg
ulat
ion
52(6
A)(
b)
2(%
)
Gro
ssG
ST 4
(%)
Tota
l TE
R
(%)
Add
itio
nal
expe
nse
as
per
Reg
ulat
ion
52(6
A)(
c)
3(%
)
Bas
e
TER
1(%
)
Add
itio
nal
expe
nse
as
per
Reg
ulat
ion
52(6
A)(
b)
2(%
)
Gro
ssG
ST 4
(%)
Tota
l TE
R
(%)
Add
itio
nal
expe
nse
as
per
Reg
ulat
ion
52(6
A)(
c)
3(%
)
Bas
e
TER
1(%
)
Add
itio
nal
expe
nse
as
per
Reg
ulat
ion
52(6
A)(
b)
2(%
)
Gro
ssG
ST 4
(%)
Tota
l TE
R
(%)
Add
itio
nal
expe
nse
as
per
Reg
ulat
ion
52(6
A)(
c)
3(%
)
Bas
e
TER
1(%
)
Add
itio
nal
expe
nse
as
per
Reg
ulat
ion
52(6
A)(
b)
2(%
)
Gro
ssG
ST 4
(%)
Tota
l TE
R
(%)
Add
itio
nal
expe
nse
as
per
Reg
ulat
ion
52(6
A)(
c)
3(%
)
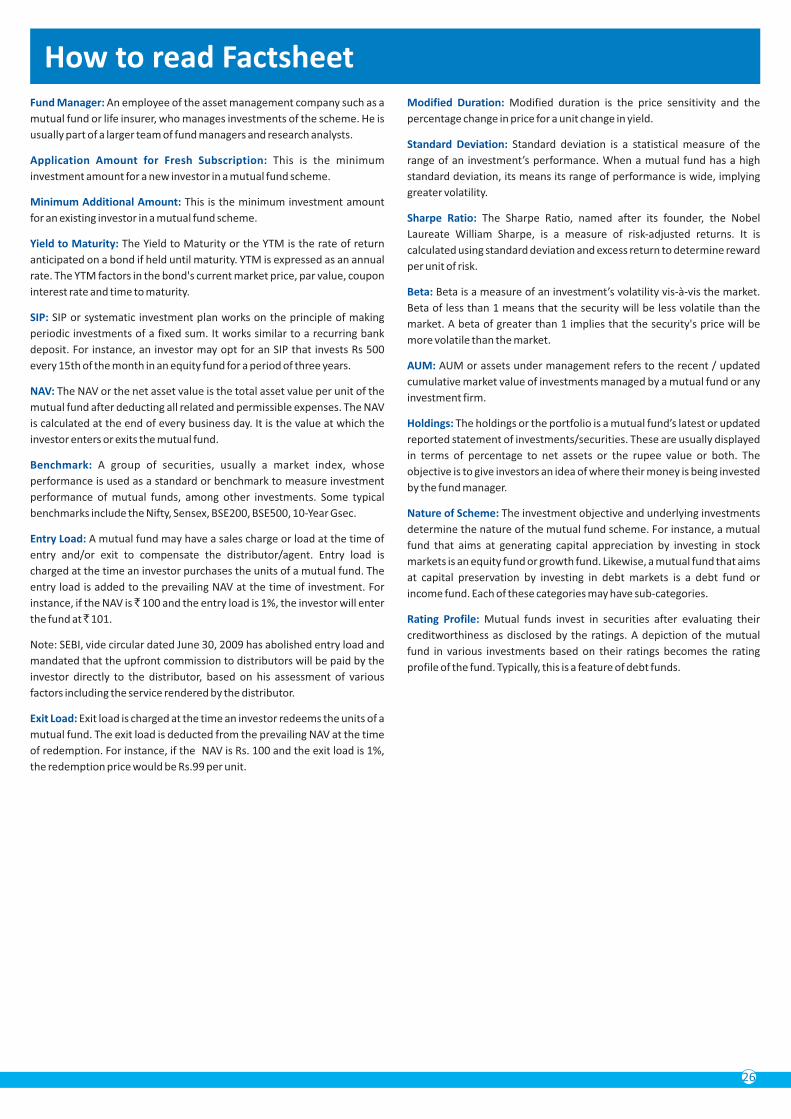
Application Amount for Fresh Subscription: This is the minimum
investment amount for a new investor in a mutual fund scheme.
Minimum Additional Amount: This is the minimum investment amount
for an existing investor in a mutual fund scheme.
Yield to Maturity: The Yield to Maturity or the YTM is the rate of return
anticipated on a bond if held until maturity. YTM is expressed as an annual
rate. The YTM factors in the bond's current market price, par value, coupon
interest rate and time to maturity.
NAV: The NAV or the net asset value is the total asset value per unit of the
mutual fund after deducting all related and permissible expenses. The NAV
is calculated at the end of every business day. It is the value at which the
investor enters or exits the mutual fund.
Benchmark: A group of securities, usually a market index, whose
performance is used as a standard or benchmark to measure investment
performance of mutual funds, among other investments. Some typical
benchmarks include the Nifty, Sensex, BSE200, BSE500, 10-Year Gsec.
Entry Load: A mutual fund may have a sales charge or load at the time of
entry and/or exit to compensate the distributor/agent. Entry load is
charged at the time an investor purchases the units of a mutual fund. The
entry load is added to the prevailing NAV at the time of investment. For
instance, if the NAV is ̀ 100 and the entry load is 1%, the investor will enter
the fund at ̀ 101.
Note: SEBI, vide circular dated June 30, 2009 has abolished entry load and
mandated that the upfront commission to distributors will be paid by the
investor directly to the distributor, based on his assessment of various
factors including the service rendered by the distributor.
Fund Manager: An employee of the asset management company such as a
mutual fund or life insurer, who manages investments of the scheme. He is
usually part of a larger team of fund managers and research analysts.
SIP: SIP or systematic investment plan works on the principle of making
periodic investments of a fixed sum. It works similar to a recurring bank
deposit. For instance, an investor may opt for an SIP that invests Rs 500
every 15th of the month in an equity fund for a period of three years.
Exit Load: Exit load is charged at the time an investor redeems the units of a
mutual fund. The exit load is deducted from the prevailing NAV at the time
of redemption. For instance, if the NAV is Rs. 100 and the exit load is 1%,
the redemption price would be Rs.99 per unit.
Sharpe Ratio: The Sharpe Ratio, named after its founder, the Nobel
Laureate William Sharpe, is a measure of risk-adjusted returns. It is
calculated using standard deviation and excess return to determine reward
per unit of risk.
Standard Deviation: Standard deviation is a statistical measure of the
range of an investment’s performance. When a mutual fund has a high
standard deviation, its means its range of performance is wide, implying
greater volatility.
Nature of Scheme: The investment objective and underlying investments
determine the nature of the mutual fund scheme. For instance, a mutual
fund that aims at generating capital appreciation by investing in stock
markets is an equity fund or growth fund. Likewise, a mutual fund that aims
at capital preservation by investing in debt markets is a debt fund or
income fund. Each of these categories may have sub-categories.
AUM: AUM or assets under management refers to the recent / updated
cumulative market value of investments managed by a mutual fund or any
investment firm.
Holdings: The holdings or the portfolio is a mutual fund’s latest or updated
reported statement of investments/securities. These are usually displayed
in terms of percentage to net assets or the rupee value or both. The
objective is to give investors an idea of where their money is being invested
by the fund manager.
Beta: Beta is a measure of an investment’s volatility vis-à-vis the market.
Beta of less than 1 means that the security will be less volatile than the
market. A beta of greater than 1 implies that the security's price will be
more volatile than the market.
Modified Duration: Modified duration is the price sensitivity and the
percentage change in price for a unit change in yield.
Rating Profile: Mutual funds invest in securities after evaluating their
creditworthiness as disclosed by the ratings. A depiction of the mutual
fund in various investments based on their ratings becomes the rating
profile of the fund. Typically, this is a feature of debt funds.
How to read Factsheet
26
Disclaimer/Statutory Details
Mutual Fund investments are subject to market risks, read all scheme related documents carefully.
The data in the Factsheet is updated up to November 30, 2019 unless indicated otherwise. Statements relating to outlook and forecast are the opinions of the Author. The views expressed by the author are personal and are not necessarily that of BOI AXA Investment Managers Private Limited (AMC). This report is for information purpose only and is not intended to be any investment advice. Please make independent research/ obtain professional help before taking any decision of investment/ sale. AMC makes no representation as to the quality, liquidity or market perception of any securities/ issuer/ borrower, if described in the report above, nor does it provide any guarantee whatsoever. Information and material used in this report are believed to be from reliable sources. However, AMC does not warrant the accuracy, reasonableness and/or completeness of any information. AMC does not undertake to update any information or material in this report. Decisions taken by you based on the information provided in this report are to your own account and risk. AMC and any of its officers, directors and employees shall not be liable for any loss or damage of any nature, as also any loss of profit in any way arising from the use of this material in any manner. AMC or its directors, officers and employees, including author of this report/ persons involved in the preparation or issuance of this report may, from time to time, have long or short positions in, and buy or sell the securities, if any, mentioned herein or have other potential conflict of interest with respect to any recommendation and related information and opinions given in the report/ report. This report, or any part of it, should not be duplicated, or contents altered/ modified, in whole or in part in any form and or re-distributed without AMC’s prior written consent. © BOI AXA Investment Managers Private Limited 2019.
AMC Website: www.boiaxamf.com is also an Investor Service Centre (for online transactions)
B/204, Tower 1, Peninsula Corporate Park, Ganpatrao Kadam Marg, Lower Parel, Mumbai - 400 013.Toll free number : 1800-266-2676 & 1800-103-2263 • Alternate number : 020-4011 2300 & 020-6685 4100 • Website : www.boiaxamf.com • Email : [email protected]
BOI AXA Investment Managers Pvt. Ltd.(Investment Manager for BOI AXA Mutual Fund)
BOI AXA Investment Managers’ Branches - Investor Service Centers (ISC's)
• Ahmedabad - Shop No.:- 405, 4th Floor, Zodiac Plaza, H. L. College Road, Navrangpura, Ahmedabad - 380 009. • Bangalore - 957, Regus Business Centre, Bangalore Pvt. Ltd., Level 9, Raheja Towers, 26 - 27, Mahatma Gandhi Road, Bangalore - 560 001. • Bhopal - F. F. 16, Part B, Mansarover Complex, Near Habibganj Railway Station, Bhopal - 462 016. • Chandigarh - 205, Megabyte Business Centre, SCO-333-334, Ist Floor, Sec-35B Chandigarh - 160 022. • Chennai - Cabin No. 203, Apeejay Business Center No: 39/12, Haddows Road, Nungambakkam, Chennai - 600 034. • Hyderabad - Cabin No. 23, Apeejay Business Centre, Tresorie, The Park, 22 Rajbhavan Road, Somajiguda, Hyderabad - 500 082. • Jaipur - Office no.154, 1st Floor, Ganpati Plaza,M I Road, Jaipur - 302 001. • Kolkata - Cabin 06, Block - A, 8th Floor, Apeejay House, 15 Park Street, Kolkata - 700 016. • Lucknow - Office No-504, 5th Floor, Sriram Tower, 13 Ashok Marg, Hazratganj, Lucknow - 226 001. • Mumbai - B/204, Tower 1, Peninsula Corporate Park, Ganpatrao Kadam Marg, Lower Parel, Mumbai - 400 013. • New Delhi - Room No. 610, Avanta Business Center, 4th Floor, Statesman House, Barakhamba Road, Connaught Place, New Delhi - 110 001. • Pune - Apeejay Business Centre, 1st Floor, Pride House, S.No. 108/7, Shivajinagar, University Road, Pune - 411 016. • Vadodara - 118, 1st Floor, Siddharth Complex, R C Dutt Road, Alkapuri, Vadodara - 390 005.
• Agra: 1st Floor, Deepak Wasan Plaza, Behind Holiday Inn, Sanjay Place, Agra - 282 002. • Ahmedabad: 201/202, Shail Complex, Opp: Madhusudan House, B/H Girish Cold Drink, Off C G Road, Navrangpura, Ahmedabad - 380 006. • Akola: Yamuna Tarang Complex, Shop No 30, Ground Floor, N.H. No- 06, Murtizapur Road, Opp Radhakrishna Talkies, Akola - 444 004. • Allahabad: Rsa Towers, 2nd Floor, Above Sony Tv Showroom, 57, S P Marg, Civil Lines, Allahabad - 211 001. • Ambala: 6349, Nicholson Road, Adjacent Kos Hospital, Ambala Cant, Ambala - 133 001. • Amritsar: 72-A, Taylor'S Road, Opp Aga Heritage Club, Amritsar - 143 001. • Anand: B-42, Vaibhav Commercial Center, Nr Tvs Down Town Shrow Room, Grid Char Rasta, Anand - 380 001. • Andheri: 6 & 7, 131 Andheri Industrial Estate, Veera Desai Road, Andheri (West), Mumbai - 400 053. • Asansol: 114/71, G T Road, Bhanga Panchil, Near Nokia Care, Asansol - 713 303. • Aurangabad: Ramkunj Niwas, Railway Station Road, Near Osmanpura Circle, Aurangabad - 431 005. • Bangalore: 59, Skanda Puttanna Road, Basavanagudi, Bangalore - 560 004. • Baroda: 203, Corner Point, Jetalpur Road, Baroda - 390 007. • Belgaum: Cts No 3939/ A2 A1, Above Raymonds Show Room, Beside Harsha Appliances, Club Road, Belgaum - 590 001. • Bhagalpur: 2nd Floor, Chandralok Complex, Ghantaghar, Radha Rani Sinha Road, Bhagalpur - 812 001. • Bhavnagar: 303, Sterling Building,,Above HDFC Bank,,Waghawadi Road,,Bhavnagar - 364 001. • Bhopal: Kay Kay Business Centre, 133, Zone I, Mp Nagar, Above City Bank, Bhopal - 462 011. • Bhubaneswar: A/181, Back Side of Shivam Honda Show Room, Saheed Nagar, Bhubaneswar - 751 007. • Bilaspur: Shop No - 225, 226 & 227, 2nd Floor, Narayan Plaza, Link Road, Bilaspur - 495 001. • Bokaro: B-1, 1St Floor, City Centre, Sector- 4, Near Sona Chandi Jwellars, Bokaro - 827 004. • Borivali: Gomati Smuti, Ground Floor, Jambli Gully, Near Railway Station, Borivali, Mumbai - 400 092. • Burdwan: 63, G.T. Road, 1ST Floor, Halder Complex, Birhata, Burdwan - 713 101. • Calicut: 2nd Floor, Soubhagya Shopping Complex, Arayidathpalam, Mavoor Road, Calicut - 673 004. • Chandigarh: Sco- 2423-2424, Above Mirchi Restaurent, New Aroma Hotel, First Floor, Sector 22-C, Chandigarh - 160 022. • Chembur: Shop No 4, Ground Floor, Shram Saflya Bldg, N G Acharya Marg, Chembur, Mumbai - 400 071. • Chennai: F-11, Akshaya Plaza, 1st Floor, 108, Adhithanar Salai, Egmore, Opp To Chief Metropolitan Court, Chennai - 600 002. • Cochin: Ali Arcade, 1st Floor, Kizhavana Road, Panampilly Nagar, Near Atlantis Junction, Ernakualm - 682 036. • Coimbatore: 3rd Floor, Jaya Enclave, 1057 Avinashi Road, Coimbatore - 641 018. • Cuttack: Po - Buxi Bazar, Cuttack, Opp Dargha Bazar Police station, Dargha Bazar, Cuttack - 753001. • Dalhousie: 2nd Floor, Room No-226, R N Mukherjee Road, Kolkata - 700 001. • Dehradun: Kaulagarh Road, Near Sirmaur Margabove, Reliance Webworld, Dehradun - 248 001. • Dhanbad: 208 New Market, 2nd Floor, Bank More, Dhanbad - 826 001. • Durgapur: MWAV-16, Bengal Ambuja, 2nd Floor, City Centre, Distt. Burdwan, Durgapur - 713 216. • Erode: No: 4, Veerappan Traders Complex, KMY Salai, Sathy Road, Opp. Erode Bus Stand, Erode - 638003. • Faridabad: A-2B, 1st Floor, Nehru Ground, Neelam Bata Road, NIT, Faridabad - 121001. • Gandhinagar: 123, First Floor, Megh Malhar Complex, Opp. Vijay Petrol Pump, Sector - 11, Gandhinagar - 382 011. • Ghaziabad: 1St Floor C-7, Lohia Nagar, Ghaziabad - 201 001. • Gorakhpur: Above V.I.P. House Ajdacent, A.D. Girls College, Bank Road, Gorakpur - 273 001. • Gurgaon: Shop No.18, Ground Floor, Sector - 14, Opp. Akd Tower, Near Huda Office, Gurgaon - 122 001. • Guwahati: 1st Floor, Bajrangbali Building, Near Bora Service Station, GS Road, Guwahati - 781 007. • Gwalior: 2nd Floor, Rajeev Plaza, Jayendra Ganj, Lashkar, Gwalior - 474 009. • Hubli: CTC No.483/A1/A2, Ground Floor, Shri Ram Palza, Behind Kotak Mahindra Bank, Club Road, Hubli - 580 029. • Hyderabad: KARVY HOUSE, No:46, 8-2-609/K, Avenue 4, Street No. 1, Banjara Hills, Hyderabad - 500 034. • Hyderabad (Gachibowli): KARVY Selenium, Plot No: 31 & 32, Tower B, Survey No.115/22, 115/24, 115/25, Financial District, Gachibowli, Nanakramguda, Serilimgampally Mandal, Hyderabad - 500 032. • Indore: 2nd Floor, 203-205 Balaji Corporate House, Above ICICI Bank, 19/1 New Palasia, NearCurewell Hospital, Janjeerwala Square, Indore - 452 001. • Jabalpur: Grover Chamber, 43 Naya Bazar, Malviya Chowk, Opp Shyam Market, Jabalpur - 482 002. • Jaipur: S16/A, IIIrd Floor, Land Mark Building, Opp Jai Club, Mahaver Marg, C Scheme, Jaipur - 302 001. • Jalandhar: 1st Floor, Shanti Towers, SCO No. 37, PUDA Complex, Opposite Tehsil Complex, Jalandhar - 144 001. • Jammu: Gupta’s Tower, 2nd Floor, CB-12, Rail Head Complex, Jammu - 180 012. • Jamshedpur: 2nd Floor, R R Square, SB Shop Area, Near Relaance Foot Print & Hotel- BS Park Plaza, Main Road, Bistupur, Jamshedpur - 831 001. • Jodhpur: 203, Modi Arcade, Chopasni Road, Jodhpur - 342 001. • Kanpur: 15/46, B, Ground Floor, Opp : Muir Mills, Civil Lines, Kanpur - 208 001. • Kolhapur: 605/1/4 E Ward, Shahupuri 2nd Lane, Laxmi Niwas, Near Sultane Chambers, Kolhapur - 416 001. • Kolkata: Apeejay House (Beside Park Hotel), C Block, 3rd Floor, 15 Park Street, Kolkata - 700 016. • Lucknow: Ist Floor, A. A. Complex, 5 Park Road, Hazratganj, Thaper House, Lucknow - 226 001. • Ludhiana: Sco - 136, 1st Floor, Above Airtel Showroom, Feroze Gandhi Market, Ludhiana - 141 001. • Madurai: Rakesh Towers, 30-C, Ist Floor, Bye Pass Road, Opp Nagappa Motors, Madurai - 625 010. • Margoa: 2nd Floor, Dalal Commercial Complex, Pajifond, Margao - 403 601. • Meerut: 1st Floor, Medi Centre, Opp. ICICI Bank, Hapur Road, Near Bachha Park, Meerut - 250 002. • Moradabad: Om Arcade, Parker Road, Above Syndicate Bank, Chowk Tari Khana, Moradabad - 244 001. • Mumbai: 24/B, Raja Bahadur Compound, Ambalal Doshi Marg, Behind BSE Bldg, Fort - 400 001. • Muzaffarpur: First Floor, Shukla Complex, Near ICICI Bank, Civil Court Branch, Company Bagh, Muzaffarpur - 842 001. • Nagpur: Plot No 2/1, House No 102/1, Mata Mandir Road, Mangaldeep Appartment, Opp Khandelwal Jewelers, Dharampeth, Nagpur - 440 010. • Nanded: Shop No. 4, Santakripa Market, G G Road, Opp.Bank o f India, Nanded - 431 601. • Nasik: S-9, Second Floor, Suyojit Sankul, Sharanpur Road, Nasik - 422 002. • New Delhi: 305, New Delhi House, 27 Barakhamba Road, New Delhi - 110 001. • Noida: 405, 4th Floor, Vishal Chamber, Plot No.1, Sector-18, Noida - 201 301. • Panipat: JAVA Complex, 1st Floor, Above Vijaya Bank, G T Road, Panipat - 132 103. • Panjim: Flat No.1-A, H. No. 13/70, Timotio Bldg, Heliodoro Salgado Road, Next to Navhind Bhavan (Market Area), Panjim - 403 001. • Patiala: SCO 27 D, Chotti Baradari, Near Car Bazaar, Patiala, Punjab, Pincode: 147 001. • Patna: 3A, 3rd Floor, Anand Tower, Exhibition Road, Opp ICICI Bank, Patna - 800 001. • Pune: Mozaic Bldg, CTS No.1216/1, Final Plot No.576/1 TP, Scheme No.1, F C Road, Bhamburda, Shivaji Nagar, Pune - 411 004. • Raipur: Office No S-13, Second Floor, Reheja Tower, Fafadih Chowk, Jail Road, Raipur - 492 001. • Rajkot: 302, Metro Plaza, Near Moti Tanki Chowk, Rajkot, Gujarat - 360 001. • Ranchi: Room No 307, 3rd Floor, Commerce Tower, Beside Mahabir Tower, Ranchi - 834 001. • Rohtak: 1st Floor, Ashoka Plaza, Delhi Road, Rohtak - 124001.• Rourkela: 1st Floor, Sandhu Complex, Kachery Road, Uditnagar, Rourekla - 769 012. • Secunderabad: Crystal Plaza, 2nd Floor, Manday Lane, Near Sunshine Hospital, P G Road, Secunderabad - 500 003. • Shillong: Annex Mani Bhawan, Lower Thana Road, Near R K M Lp School, Shillong - 793 001. • Siliguri: Nanak Complex, Sevoke Road, Siliguri - 734 001. • Solapur: Block No 06, Vaman Nagar, Opp D-Mart, Jule Solapur, Solapur - 413 004. • Surat: Office No. 516, 5th Floor, Empire State Building, Near Udhna Darwaja, Ring Road, Surat - 395002. • T Nagar: G1, Ground Floor, No 22, Vijayaraghava Road, Swathi Court, T Nagar, Chennai - 600 017. • Thane: 101, Yaswant Tower, 1st Floor, Opposite Puja Hotel, Ram Maruti Road, Naupada, Thane (West), Mumbai - 400 602. • Udaipur: 201-202, Madhav Chambers, Opp G P O, Chetak Circle, Udaipur -313 001. • Ujjain: 101 Aashta Tower, 13/1 Dhanwantri Marg, Freeganj, Ujjain - 456 010. • Varanasi: D-64/132, 1st Floor, Anant Complex, Sigra, Varanashi - 221 010. • Vashi: Shop No.43-A, Ground Floor, Vashi Plaza, Sector-17, Near Apna Bazar, Vashi, Mumbai - 400 705. • Vijayawada: 39-10-7, Opp : Municipal Water Tank, Labbipet, Vijayawada - 520 010. • Vile Parle: 104, Sangam Arcade, V P Road, Opp: Railway Station, Above Axis Bank Atm, Vile Parle (West), Mumbai - 400 056. • Visakhapatnam: Door No: 48-8-7, Dwaraka Diamond, Ground Floor, Srinagar, Visakhapatnam - 530 016.
Karvy Fintech Private Ltd Branches - Investor Service Centers (ISC's)
Date of Publication: 09/12/2019
27
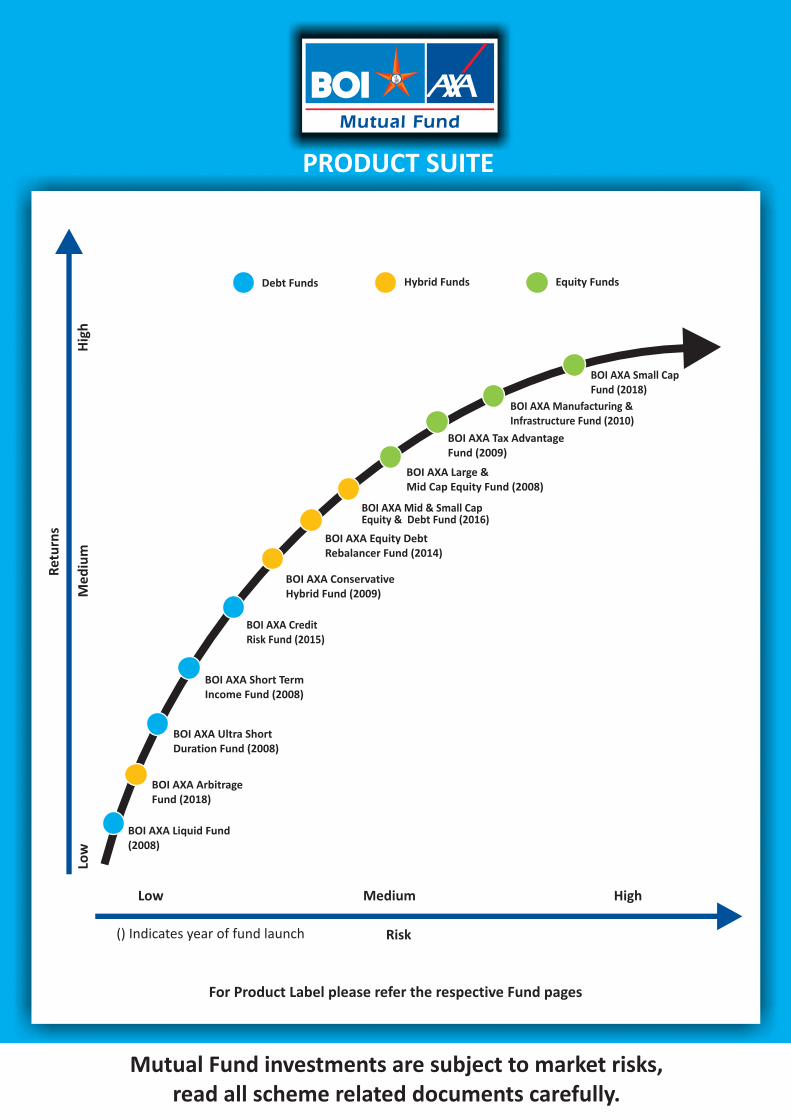
PRODUCT SUITE
Mutual Fund investments are subject to market risks, read all scheme related documents carefully.
For Product Label please refer the respective Fund pages
Risk
Low Medium High
() Indicates year of fund launch
Low
Me
diu
mH
igh
Ret
urn
s
BOI AXA Conservative Hybrid Fund (2009)
BOI AXA Credit Risk Fund (2015)
BOI AXA Manufacturing & Infrastructure Fund (2010)
BOI AXA Tax Advantage Fund (2009)
BOI AXA Large & Mid Cap Equity Fund (2008)
BOI AXA Mid & Small Cap Equity & Debt Fund (2016)
BOI AXA Equity Debt Rebalancer Fund (2014)
BOI AXA Short Term Income Fund (2008)
BOI AXA Ultra Short Duration Fund (2008)
BOI AXA Liquid Fund (2008)
BOI AXA Arbitrage Fund (2018)
Debt Funds Hybrid Funds Equity Funds
BOI AXA Small CapFund (2018)