Embed Size (px)
Citation preview

Results Presentation for the Fiscal Year Ended March 31, 2014
April 25, 2014
1 1
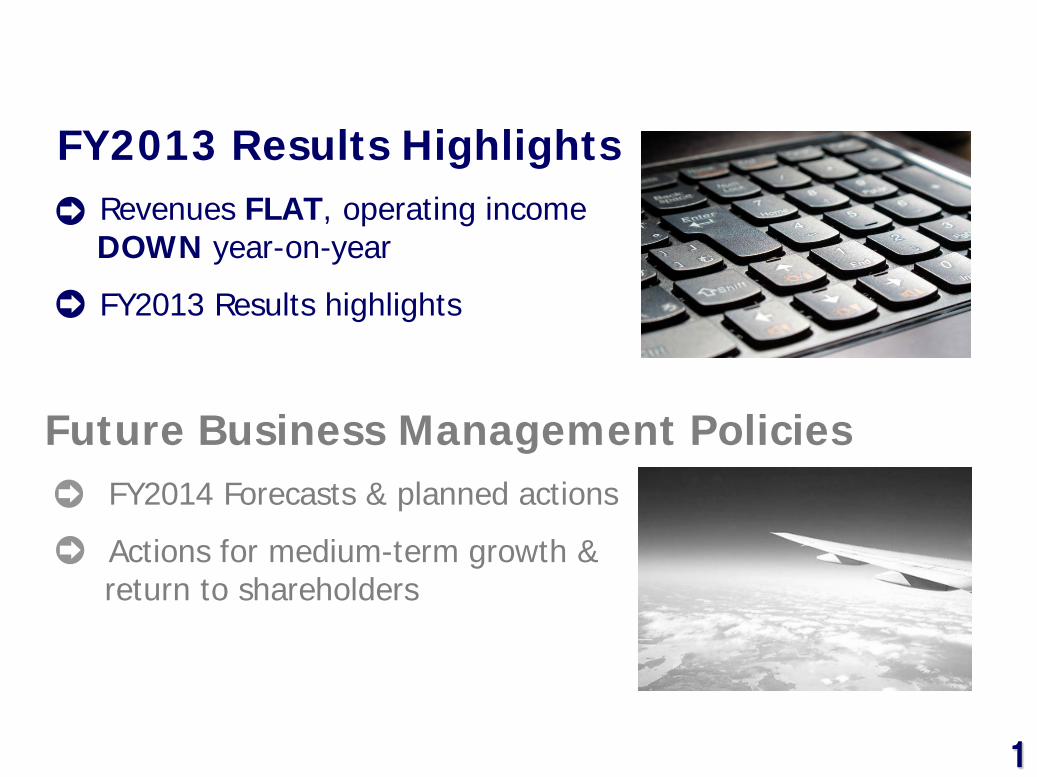
Future Business Management Policies FY2014 Forecasts & planned actions
Actions for medium-term growth & return to shareholders
FY2013 Results Highlights Revenues FLAT, operating income DOWN year-on-year
FY2013 Results highlights
2 2
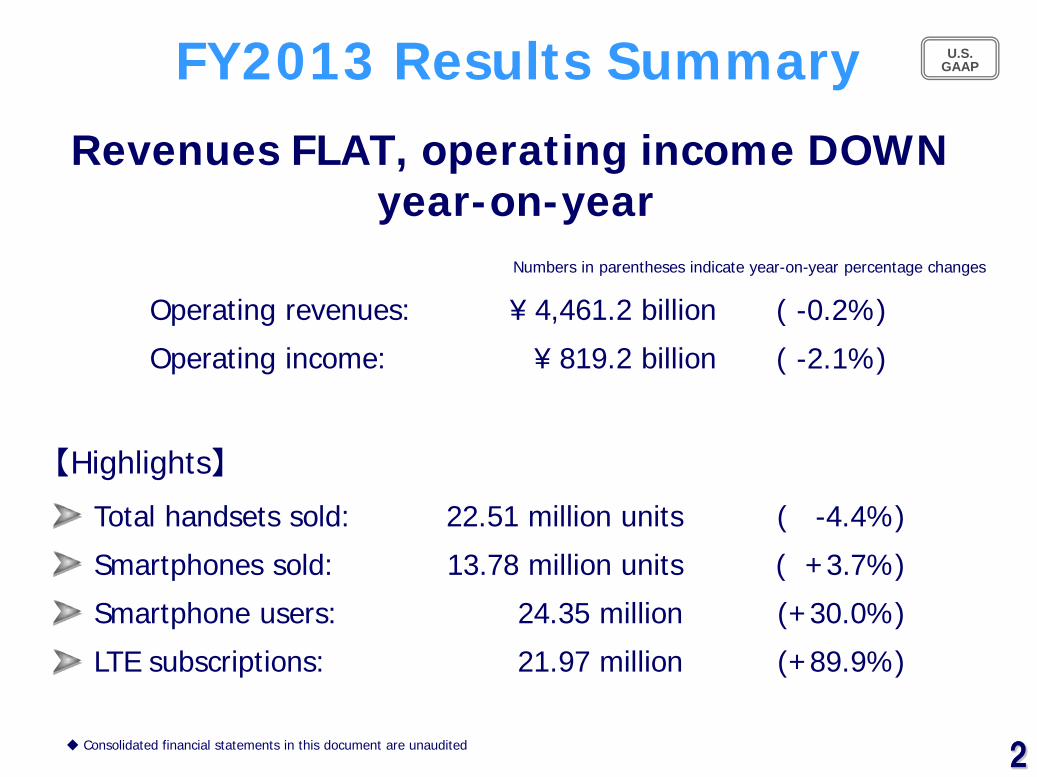
FY2013 Results Summary U.S. GAAP
Operating revenues:
Operating income:
【Highlights】
Total handsets sold:
Smartphones sold:
Smartphone users:
LTE subscriptions:
Revenues FLAT, operating income DOWN year-on-year
◆ Consolidated financial statements in this document are unaudited
¥ 4,461.2 billion
¥ 819.2 billion
( -0.2%)
( -2.1%)
22.51 million units
13.78 million units
24.35 million
21.97 million
( -4.4%)
( +3.7%)
(+30.0%)
(+89.9%)
Numbers in parentheses indicate year-on-year percentage changes
3 3
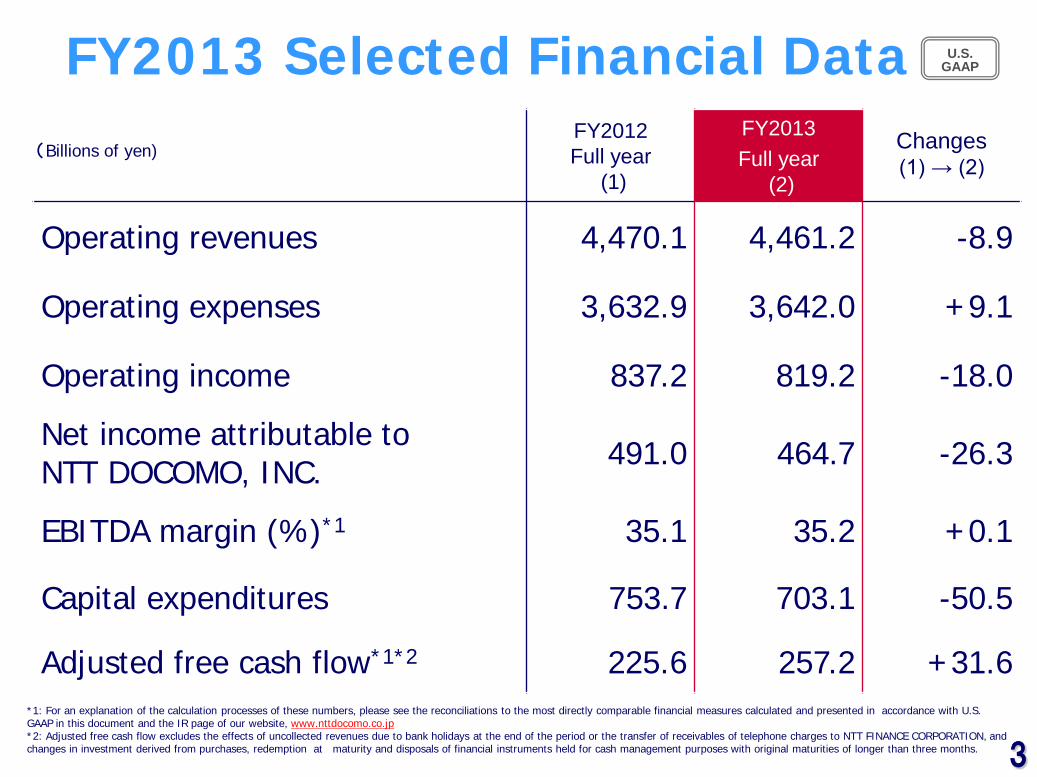
FY2012 Full year
(1)
FY2013 Full year
(2)
Changes (1) → (2)
Operating revenues 4,470.1 4,461.2 -8.9
Operating expenses 3,632.9 3,642.0 +9.1
Operating income 837.2 819.2 -18.0
Net income attributable to NTT DOCOMO, INC. 491.0 464.7 -26.3
EBITDA margin (%)*1 35.1 35.2 +0.1
Capital expenditures
753.7 703.1 -50.5
Adjusted free cash flow*1*2 225.6 257.2 +31.6
FY2013 Selected Financial Data (Billions of yen)
U.S. GAAP
*1: For an explanation of the calculation processes of these numbers, please see the reconciliations to the most directly comparable financial measures calculated and presented in accordance with U.S. GAAP in this document and the IR page of our website, www.nttdocomo.co.jp *2: Adjusted free cash flow excludes the effects of uncollected revenues due to bank holidays at the end of the period or the transfer of receivables of telephone charges to NTT FINANCE CORPORATION, and changes in investment derived from purchases, redemption at maturity and disposals of financial instruments held for cash management purposes with original maturities of longer than three months.
4 4
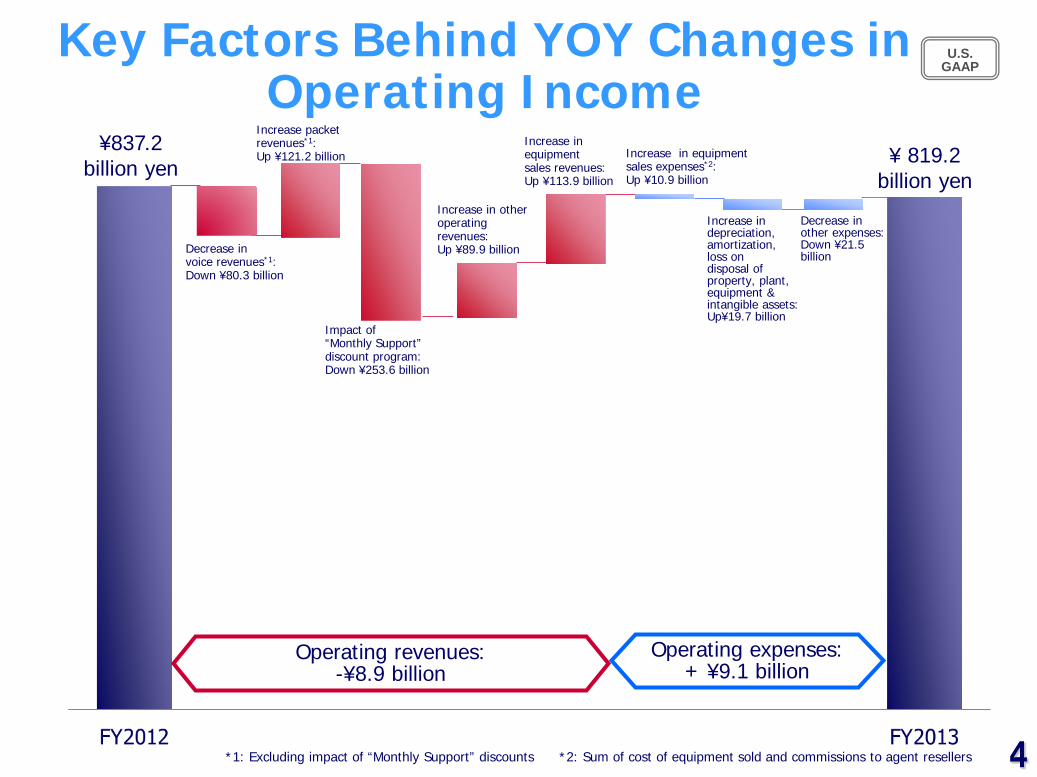
Key Factors Behind YOY Changes in Operating Income
U.S. GAAP
*1: Excluding impact of “Monthly Support” discounts *2: Sum of cost of equipment sold and commissions to agent resellers
Decrease in voice revenues*1: Down ¥80.3 billion
Increase packet revenues*1: Up ¥121.2 billion
Impact of “Monthly Support” discount program: Down ¥253.6 billion
Increase in other operating revenues: Up ¥89.9 billion
Increase in equipment sales revenues: Up ¥113.9 billion
Increase in equipment sales expenses*2: Up ¥10.9 billion
Increase in depreciation, amortization, loss on disposal of property, plant, equipment & intangible assets: Up¥19.7 billion
Decrease in other expenses: Down ¥21.5 billion
¥837.2 billion yen ¥ 819.2
billion yen
Operating revenues: -¥8.9 billion
Operating expenses: + ¥9.1 billion
5 5
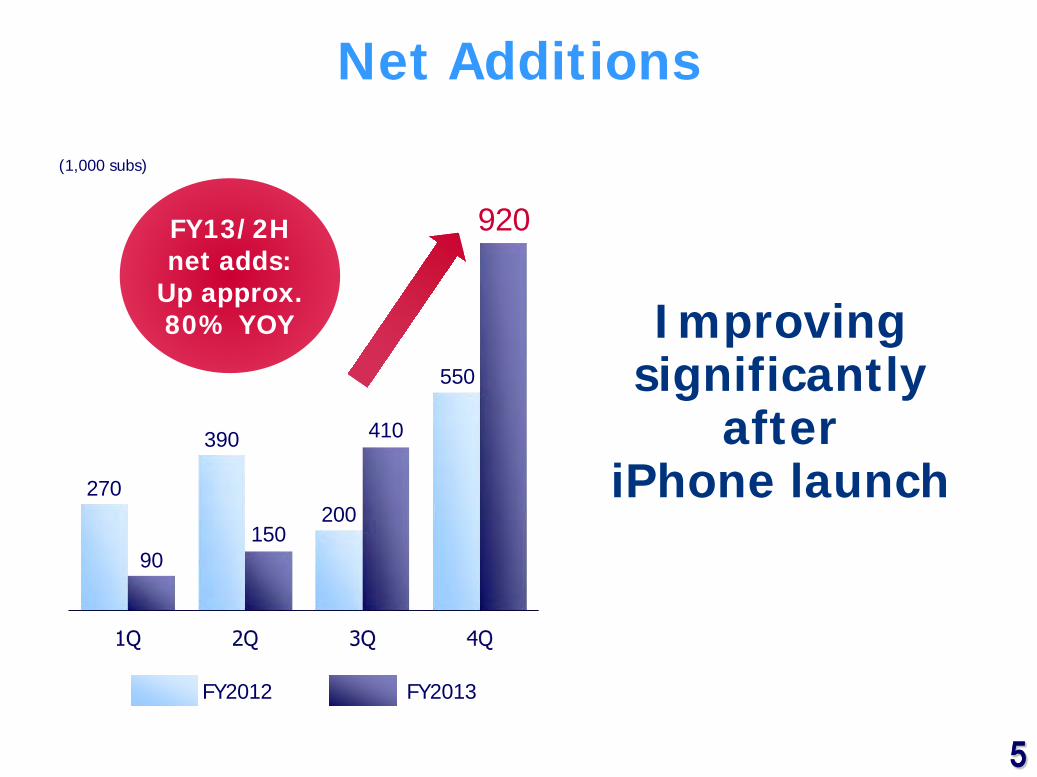
Net Additions
Improving significantly
after iPhone launch
(1,000 subs)
FY2012 FY2013
FY13/2H net adds:
Up approx. 80% YOY
920
550
200 150
90
410 390
270
6 6
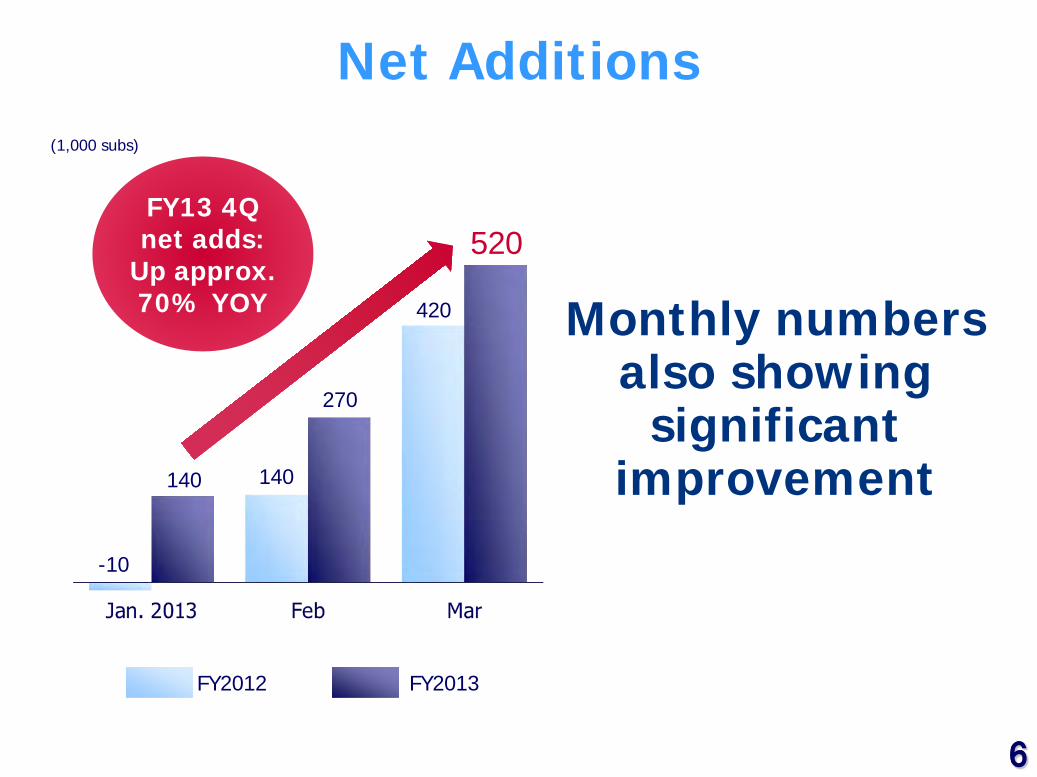
520
270
140
FY2012 FY2013
140
-10
420
Net Additions
Monthly numbers also showing
significant improvement
(1,000 subs)
FY13 4Q net adds:
Up approx. 70% YOY
7 7
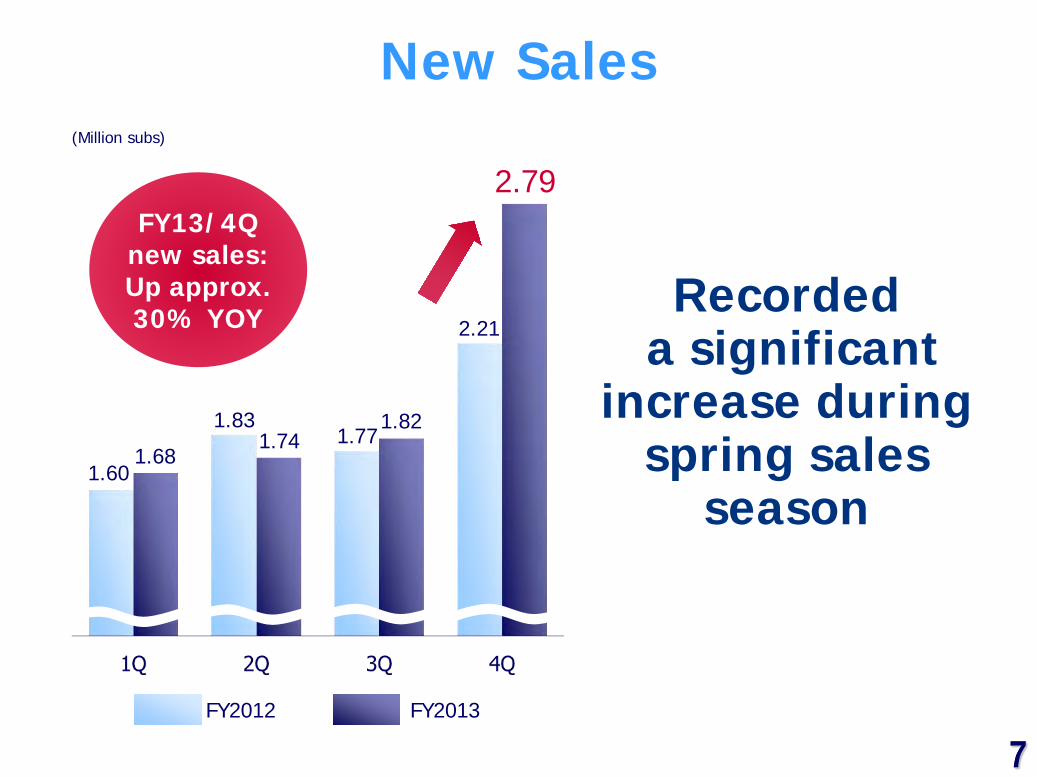
New Sales
Recorded a significant
increase during spring sales
season
FY2012 FY2013
2.79
1.82 1.74
1.68 1.60
1.83 1.77
2.21
FY13/4Q new sales: Up approx. 30% YOY
(Million subs)
8 8
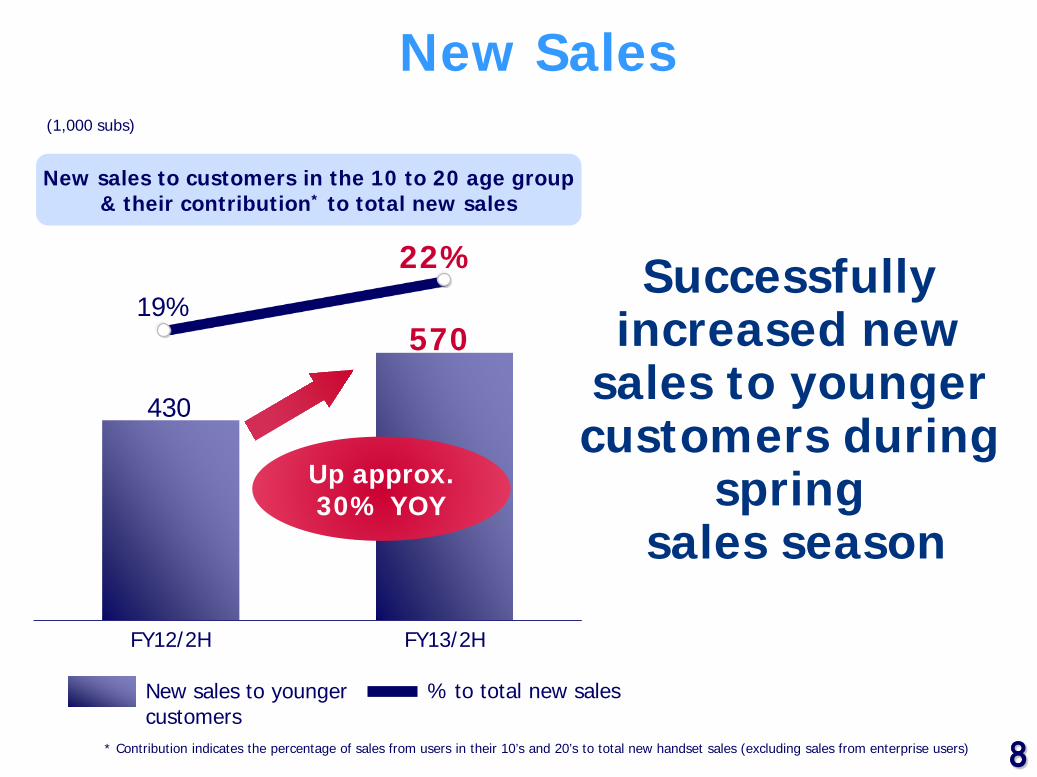
New Sales (1,000 subs)
Successfully increased new
sales to younger customers during
spring sales season
New sales to customers in the 10 to 20 age group & their contribution* to total new sales
% to total new sales New sales to younger customers
* Contribution indicates the percentage of sales from users in their 10’s and 20’s to total new handset sales (excluding sales from enterprise users)
Up approx. 30% YOY
570
430
19%
22%
FY12/2H FY13/2H
9 9
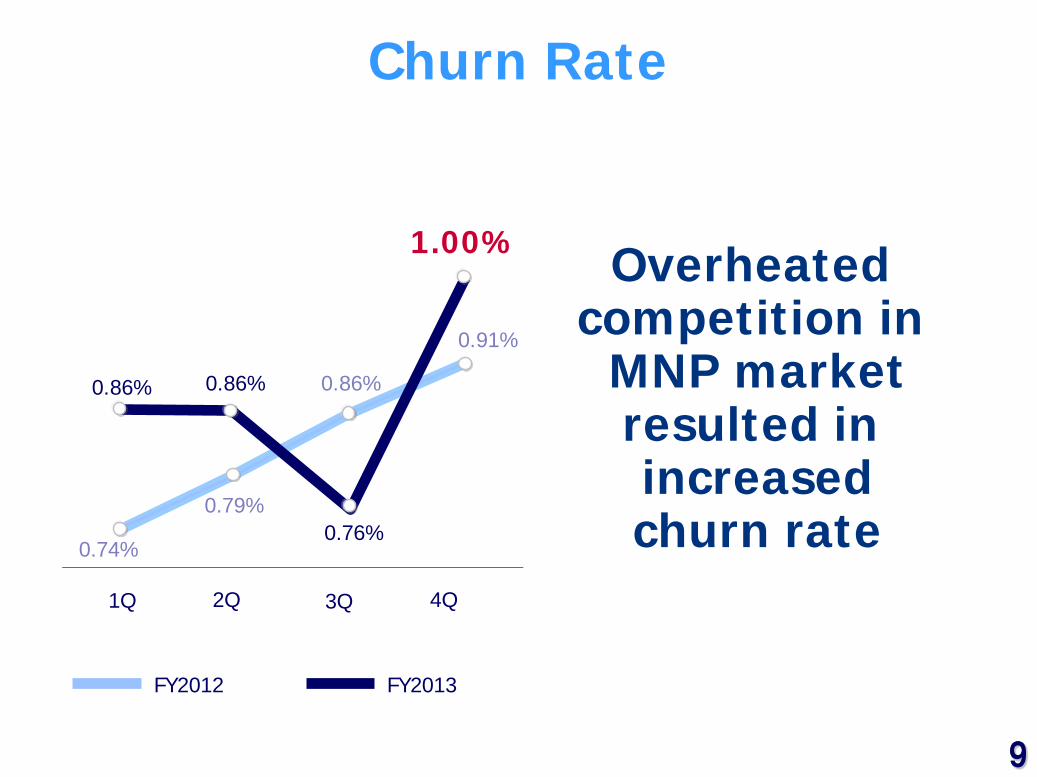
Churn Rate
Overheated competition in MNP market resulted in increased churn rate
FY2012 FY2013
0.86%
1.00%
0.76%
0.86%
0.74%
0.79%
0.86%
0.91%
1Q 2Q 3Q 4Q
10 10
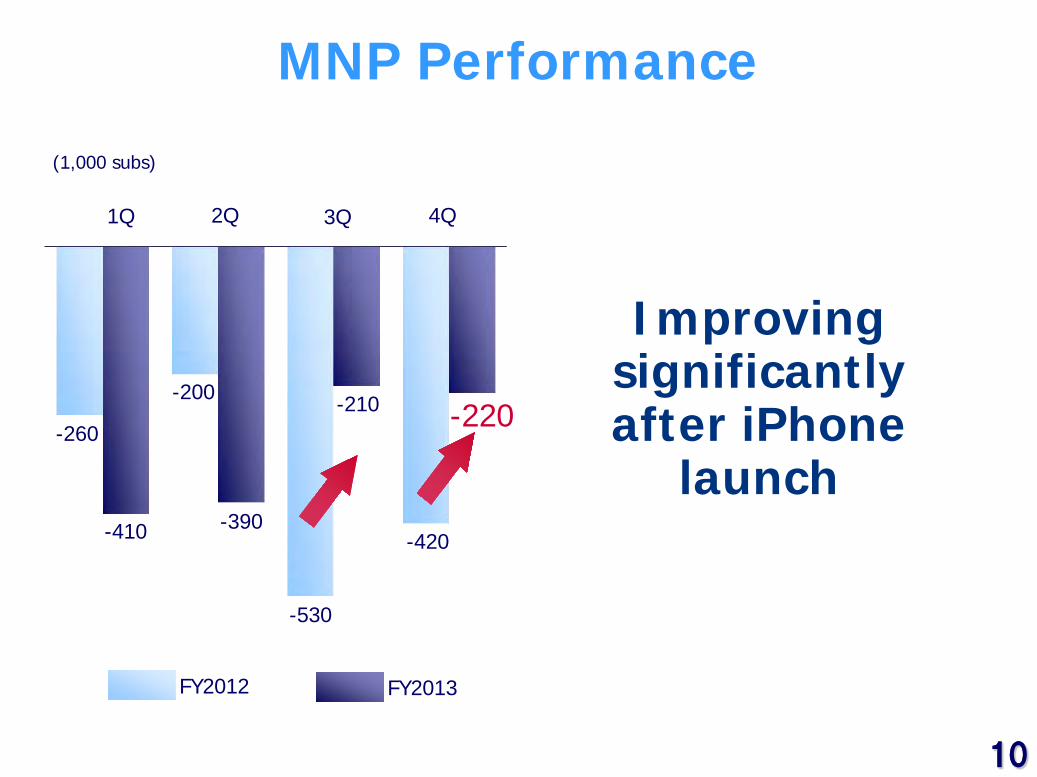
(1,000 subs)
MNP Performance
FY2012 FY2013
-220
-420
-210
-530
-390
-200
-260
-410
1Q 2Q 3Q 4Q
Improving significantly after iPhone
launch
11 11
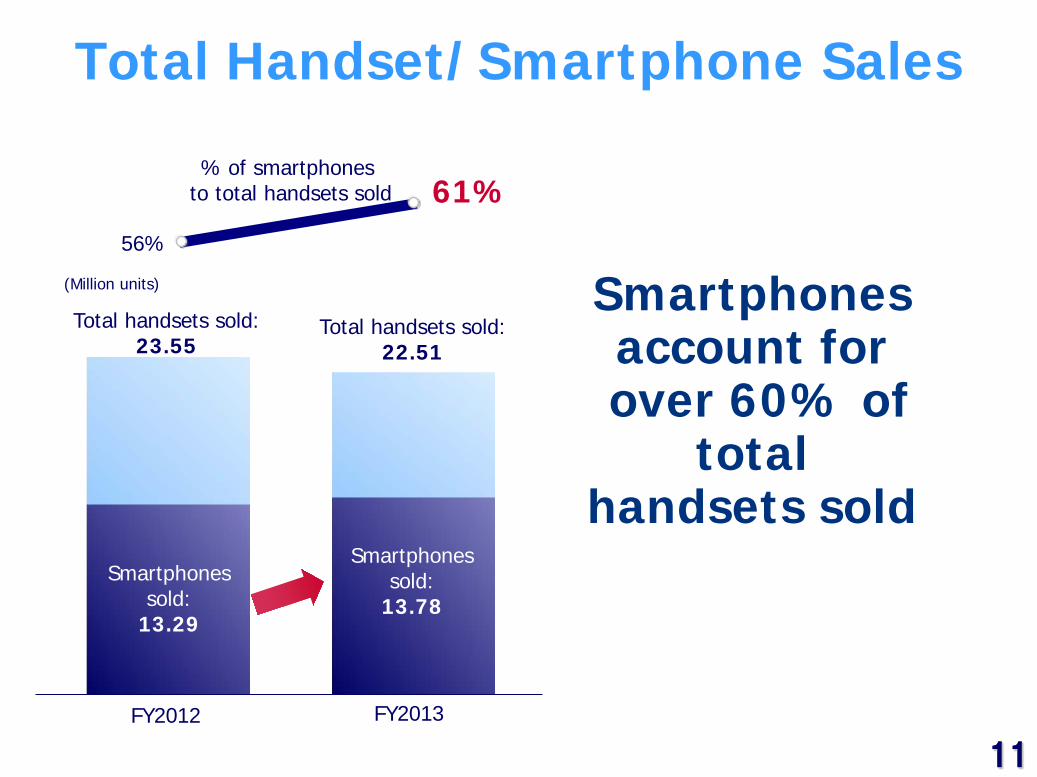
56%
Total Handset/Smartphone Sales
61%
Smartphones account for
over 60% of total
handsets sold
FY2012 FY2013
% of smartphones to total handsets sold
Smartphones sold:
13.29
Smartphones sold:
13.78
Total handsets sold: 23.55
Total handsets sold: 22.51
(Million units)
12 12
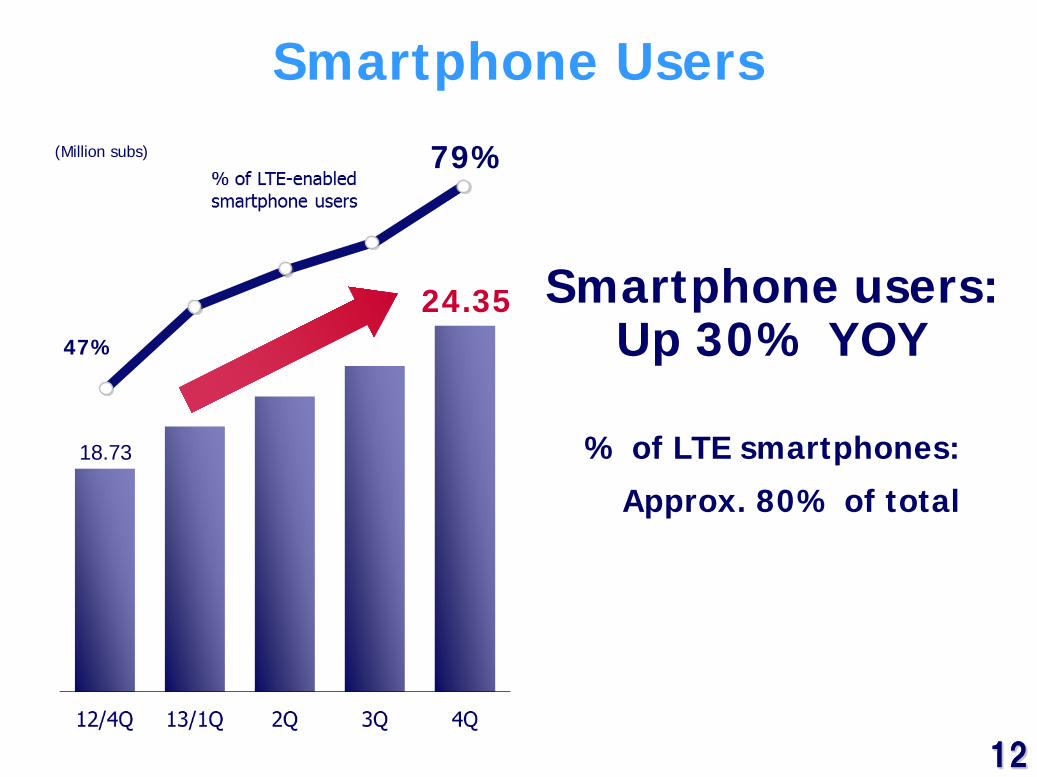
Smartphone Users
(Million subs)
47%
24.35
18.73
79%
Smartphone users: Up 30% YOY
% of LTE smartphones:
Approx. 80% of total
13
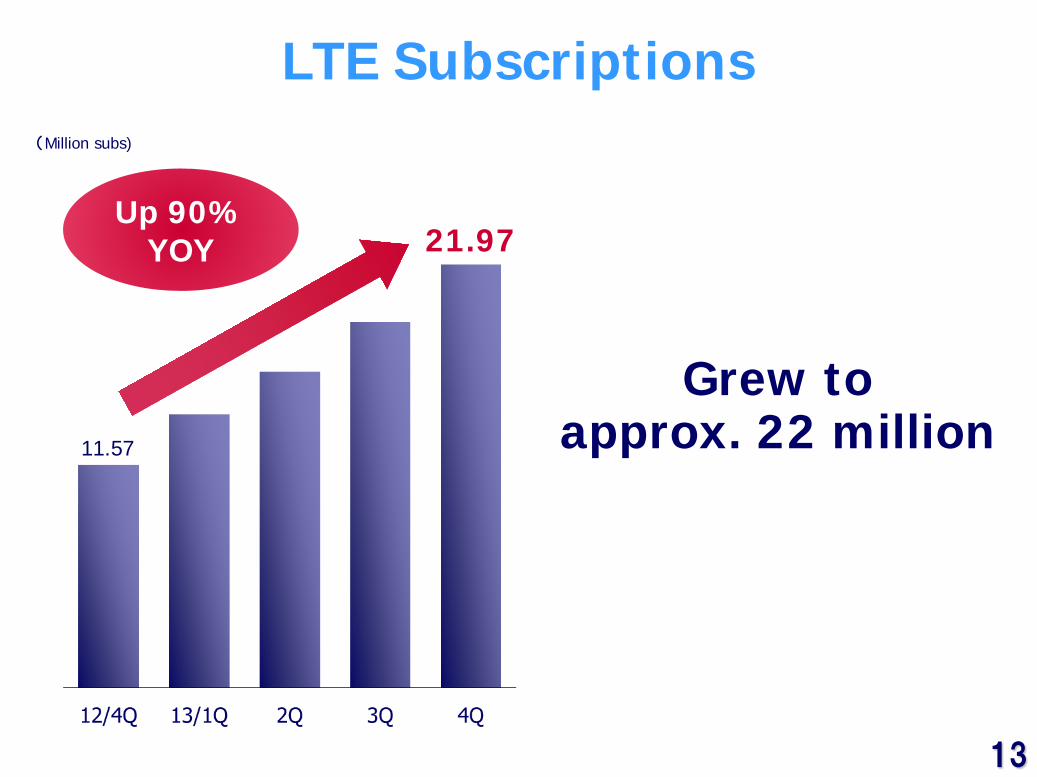
LTE Subscriptions
Grew to approx. 22 million
21.97
11.57
(Million subs)
Up 90% YOY
14
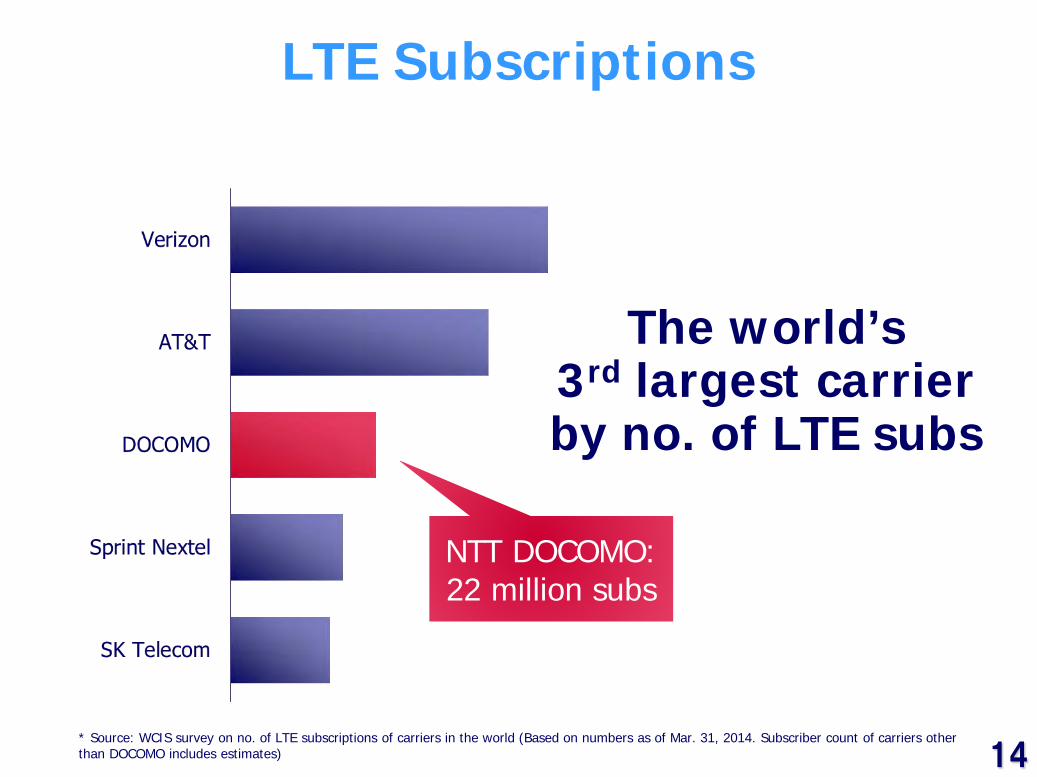
LTE Subscriptions
The world’s 3rd largest carrier by no. of LTE subs
NTT DOCOMO: 22 million subs
* Source: WCIS survey on no. of LTE subscriptions of carriers in the world (Based on numbers as of Mar. 31, 2014. Subscriber count of carriers other than DOCOMO includes estimates)
15
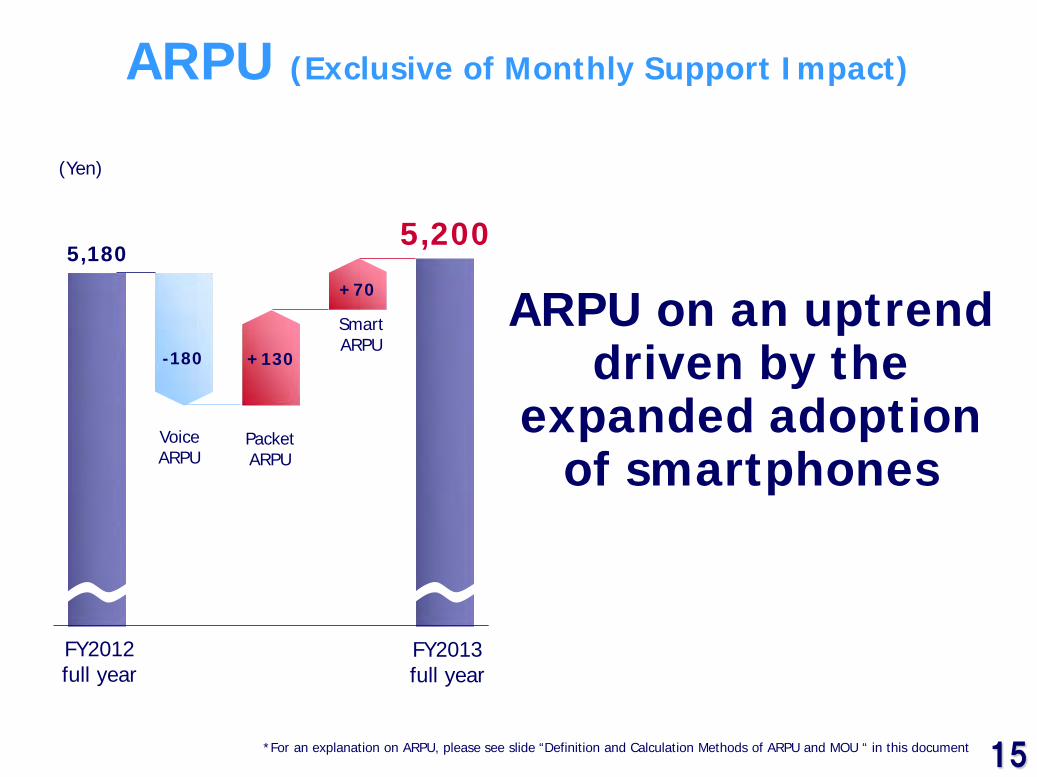
ARPU (Exclusive of Monthly Support Impact)
(Yen)
5,180
-180 +130
+70
5,200
Voice ARPU
Packet ARPU
Smart ARPU
ARPU on an uptrend driven by the
expanded adoption of smartphones
*For an explanation on ARPU, please see slide “Definition and Calculation Methods of ARPU and MOU “ in this document
FY2012 full year
FY2013 full year
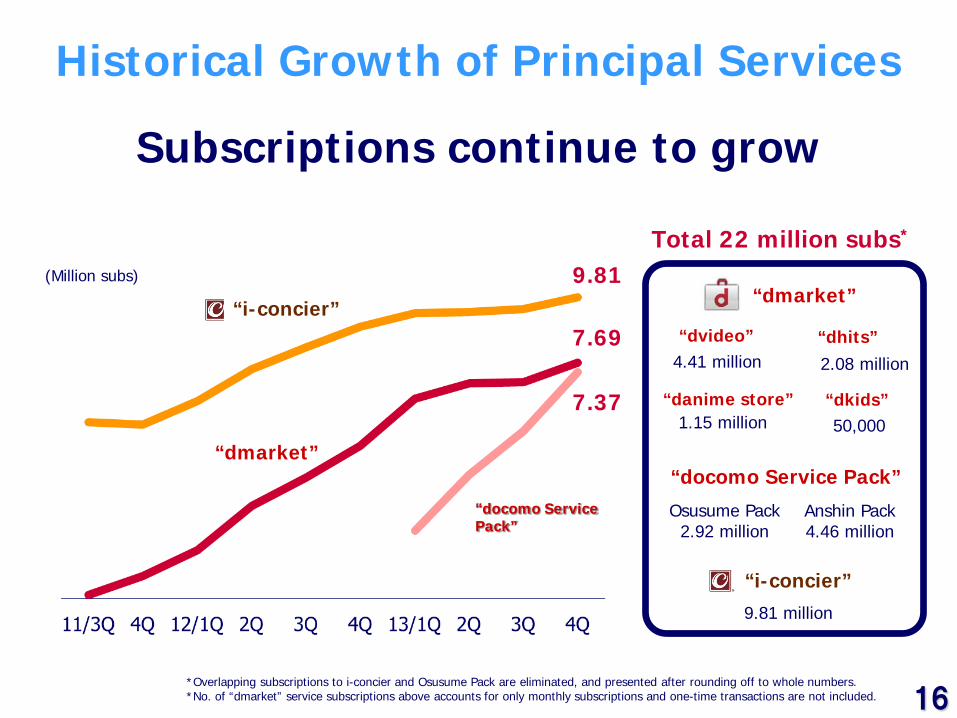
Subscriptions continue to grow
9.81 (Million subs)
7.69
7.37
*Overlapping subscriptions to i-concier and Osusume Pack are eliminated, and presented after rounding off to whole numbers. *No. of “dmarket” service subscriptions above accounts for only monthly subscriptions and one-time transactions are not included.
50,000
Total 22 million subs*
Historical Growth of Principal Services
“i-concier”
“dmarket”
“docomo Service Pack”
4.41 million
1.15 million
2.08 million
“dvideo” “dhits”
“danime store” “dkids”
9.81 million
Osusume Pack 2.92 million
Anshin Pack 4.46 million
“docomo Service Pack”
“dmarket”
“i-concier”
16
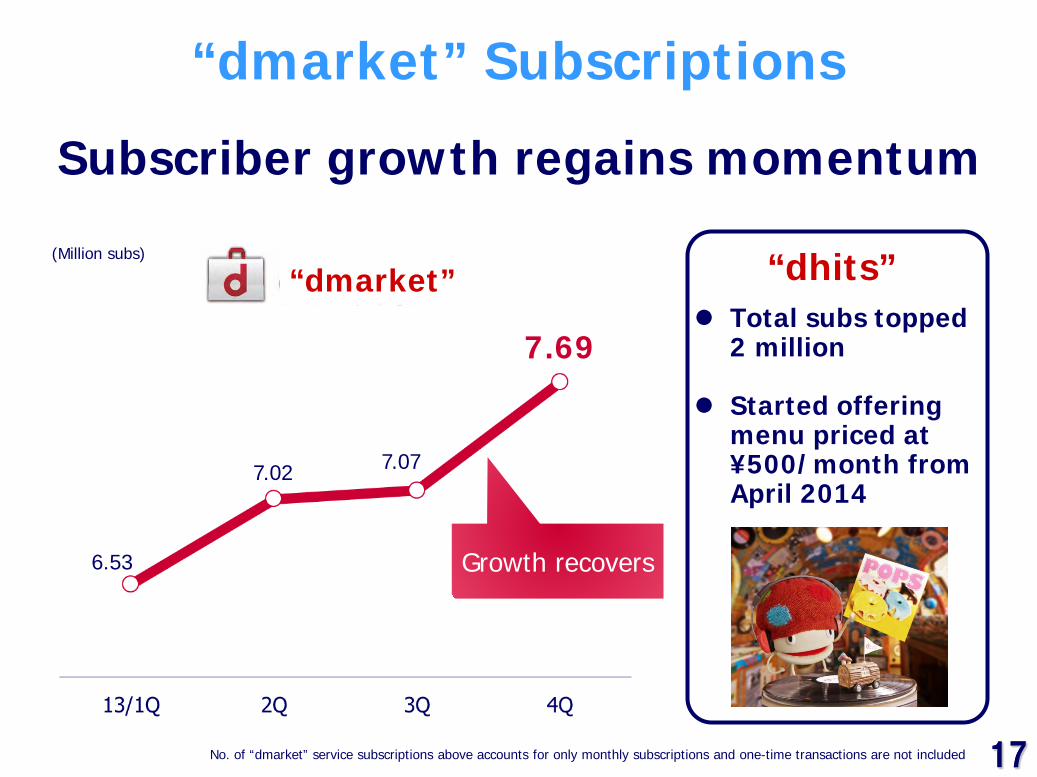
17 17
Total subs topped
2 million
Started offering menu priced at ¥500/month from April 2014
“dmarket” Subscriptions
Subscriber growth regains momentum
(Million subs)
7.69
No. of “dmarket” service subscriptions above accounts for only monthly subscriptions and one-time transactions are not included
7.07 7.02
6.53 Growth recovers
“dhits” “dmarket”
18 18
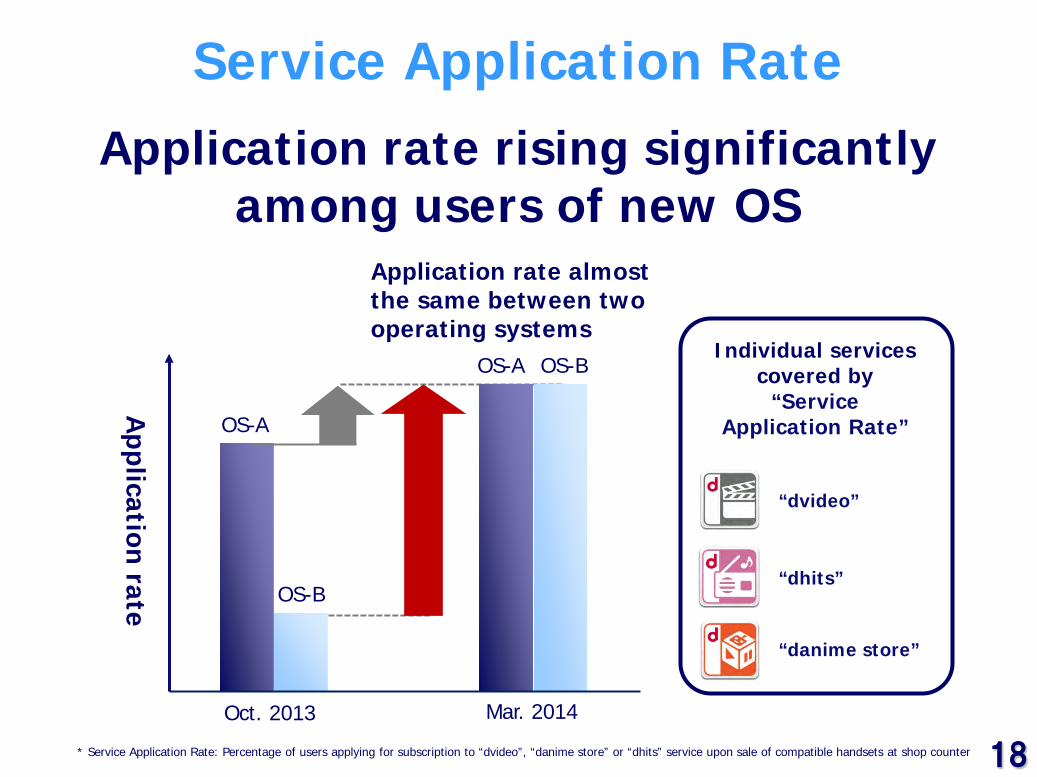
Service Application Rate
Application rate rising significantly among users of new OS
Application
rate
OS-A
OS-B
Application rate almost the same between two operating systems
* Service Application Rate: Percentage of users applying for subscription to “dvideo”, “danime store” or “dhits” service upon sale of compatible handsets at shop counter
OS-A OS-B
Oct. 2013 Mar. 2014
Individual services covered by
“Service Application Rate”
“dvideo”
“dhits”
“danime store”
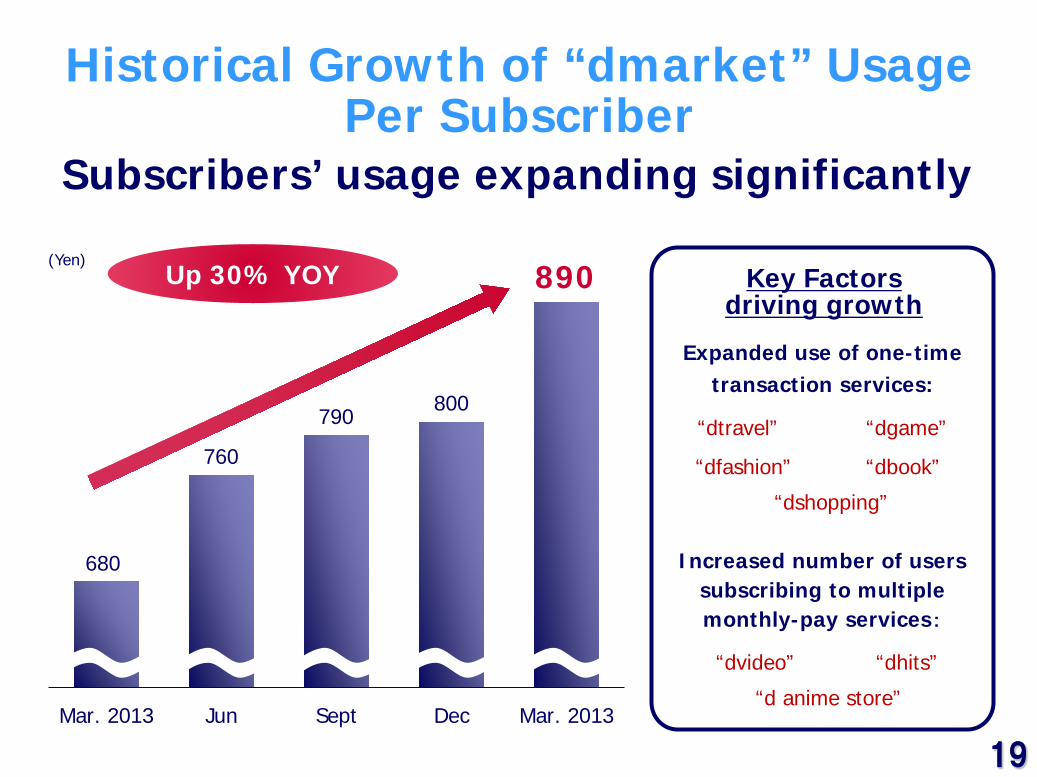
19 19
Mar. 2013 Jun Sept Dec Mar. 2013
(Yen)
680
Up 30% YOY 890
800 790
760
Expanded use of one-time
transaction services:
Increased number of users subscribing to multiple monthly-pay services:
Key Factors driving growth
Historical Growth of “dmarket” Usage Per Subscriber
Subscribers’ usage expanding significantly
“dtravel” “dgame”
“dshopping”
“dvideo” “dhits”
“d anime store”
“dfashion” “dbook”
20 20
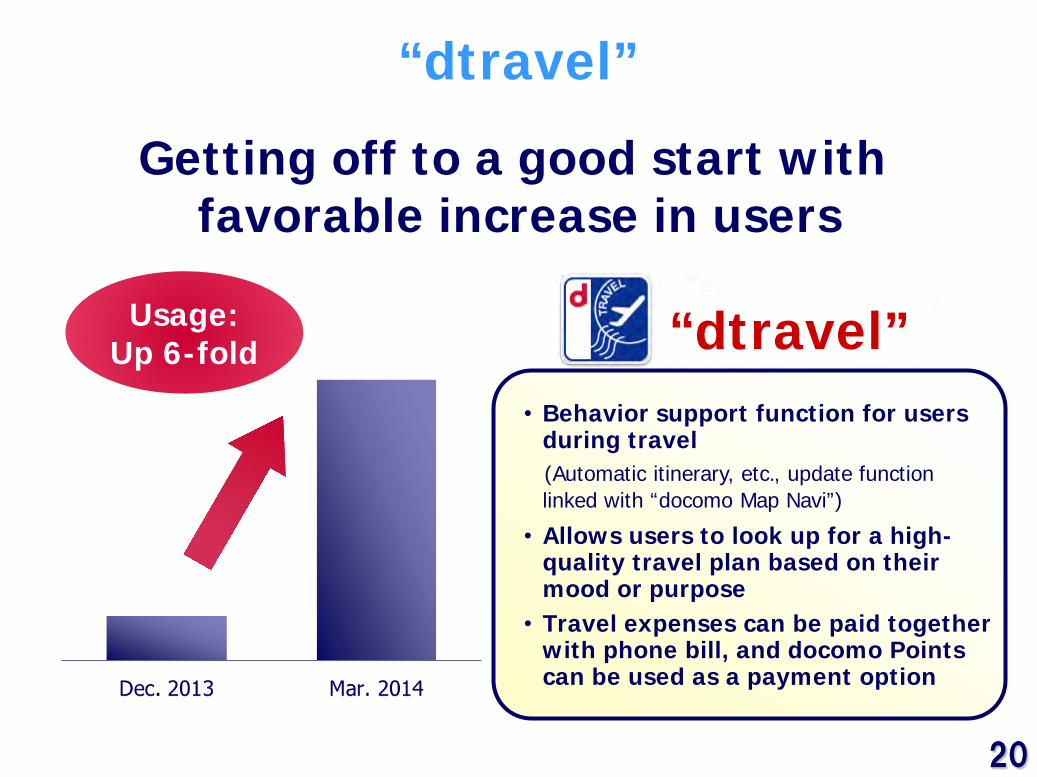
“dtravel”
Getting off to a good start with favorable increase in users
“dtravel” • Behavior support function for users
during travel (Automatic itinerary, etc., update function
linked with “docomo Map Navi”)
• Allows users to look up for a high-quality travel plan based on their mood or purpose
• Travel expenses can be paid together with phone bill, and docomo Points can be used as a payment option
Usage: Up 6-fold
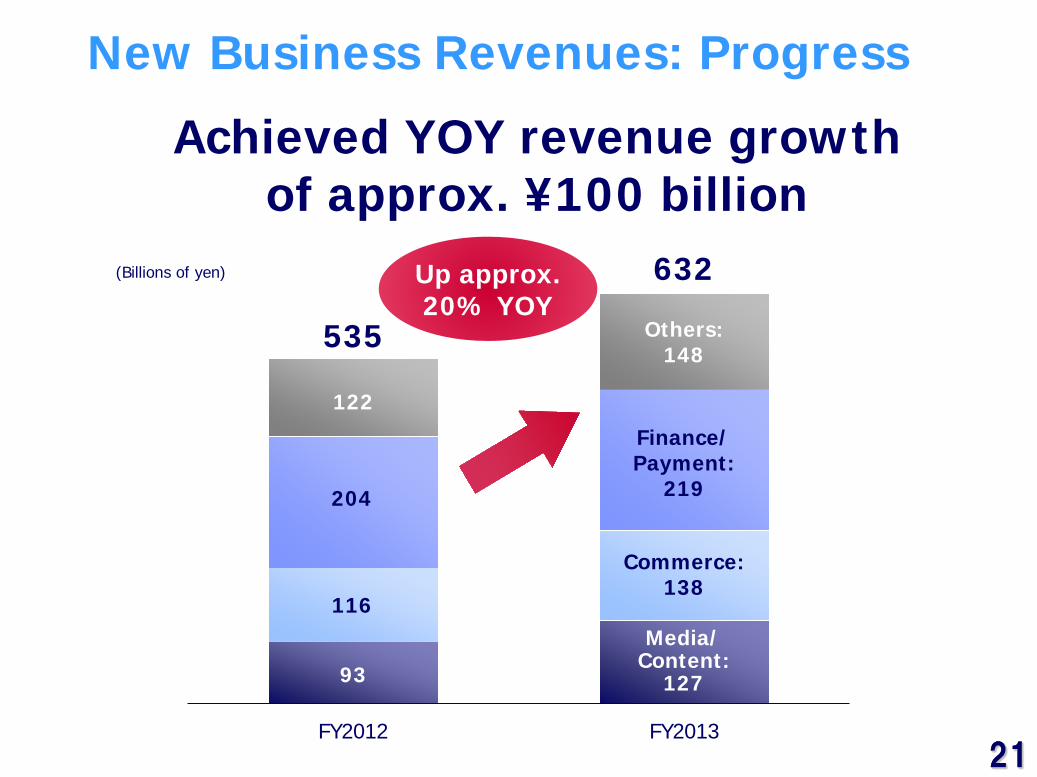
21 21 FY2012 FY2013
Media/ Content:
127
Others: 148
Finance/ Payment:
219
Commerce: 138
632
535
93
116
204
122
New Business Revenues: Progress
(Billions of yen)
Achieved YOY revenue growth of approx. ¥100 billion
Up approx. 20% YOY
22 22
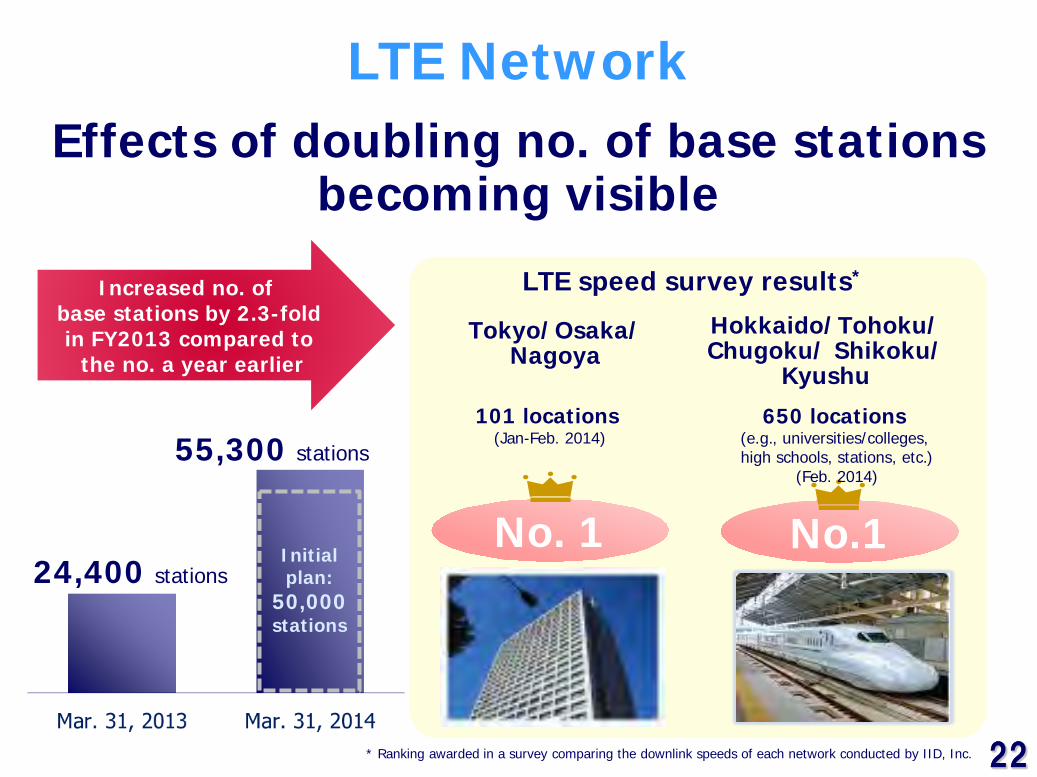
55,300 stations
24,400 stations
LTE Network
Initial plan:
50,000 stations
Tokyo/Osaka/ Nagoya
101 locations (Jan-Feb. 2014)
Hokkaido/Tohoku/ Chugoku/ Shikoku/
Kyushu
No.1 No. 1
* Ranking awarded in a survey comparing the downlink speeds of each network conducted by IID, Inc.
LTE speed survey results* Increased no. of base stations by 2.3-fold in FY2013 compared to the no. a year earlier
Effects of doubling no. of base stations becoming visible
650 locations (e.g., universities/colleges, high schools, stations, etc.)
(Feb. 2014)
23 23
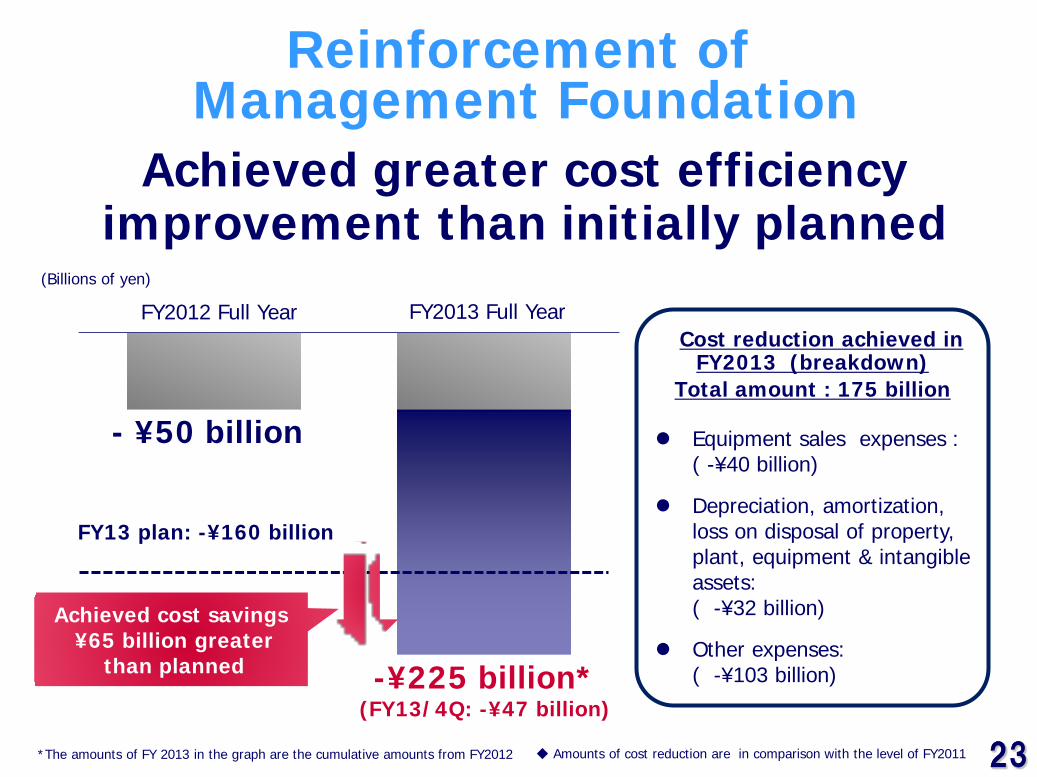
Reinforcement of Management Foundation
FY13 plan: -¥160 billion
- ¥50 billion
-¥225 billion* (FY13/4Q: -¥47 billion)
Achieved cost savings ¥65 billion greater
than planned
*The amounts of FY 2013 in the graph are the cumulative amounts from FY2012
Cost reduction achieved in FY2013 (breakdown)
Total amount : 175 billion
Equipment sales expenses : ( -¥40 billion)
Depreciation, amortization, loss on disposal of property, plant, equipment & intangible assets: ( -¥32 billion)
Other expenses: ( -¥103 billion)
◆ Amounts of cost reduction are in comparison with the level of FY2011
FY2012 Full Year FY2013 Full Year
Achieved greater cost efficiency improvement than initially planned
(Billions of yen)
24 24
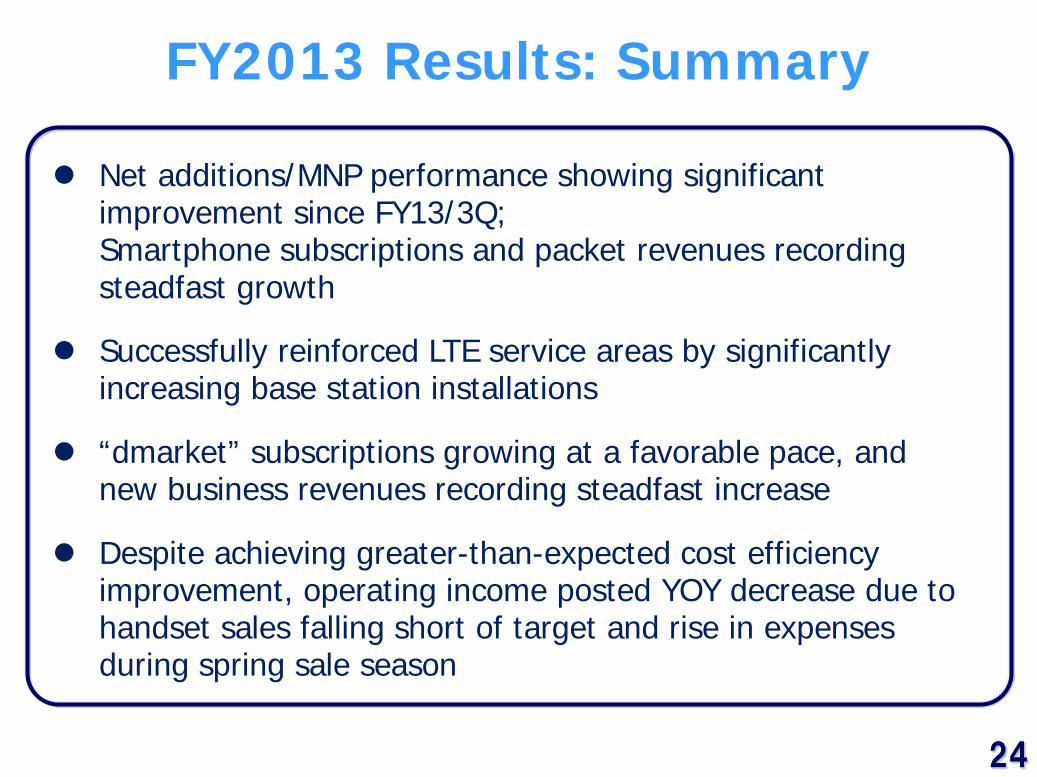
FY2013 Results: Summary
Net additions/MNP performance showing significant improvement since FY13/3Q; Smartphone subscriptions and packet revenues recording steadfast growth
Successfully reinforced LTE service areas by significantly increasing base station installations
“dmarket” subscriptions growing at a favorable pace, and new business revenues recording steadfast increase
Despite achieving greater-than-expected cost efficiency improvement, operating income posted YOY decrease due to handset sales falling short of target and rise in expenses during spring sale season
25 25
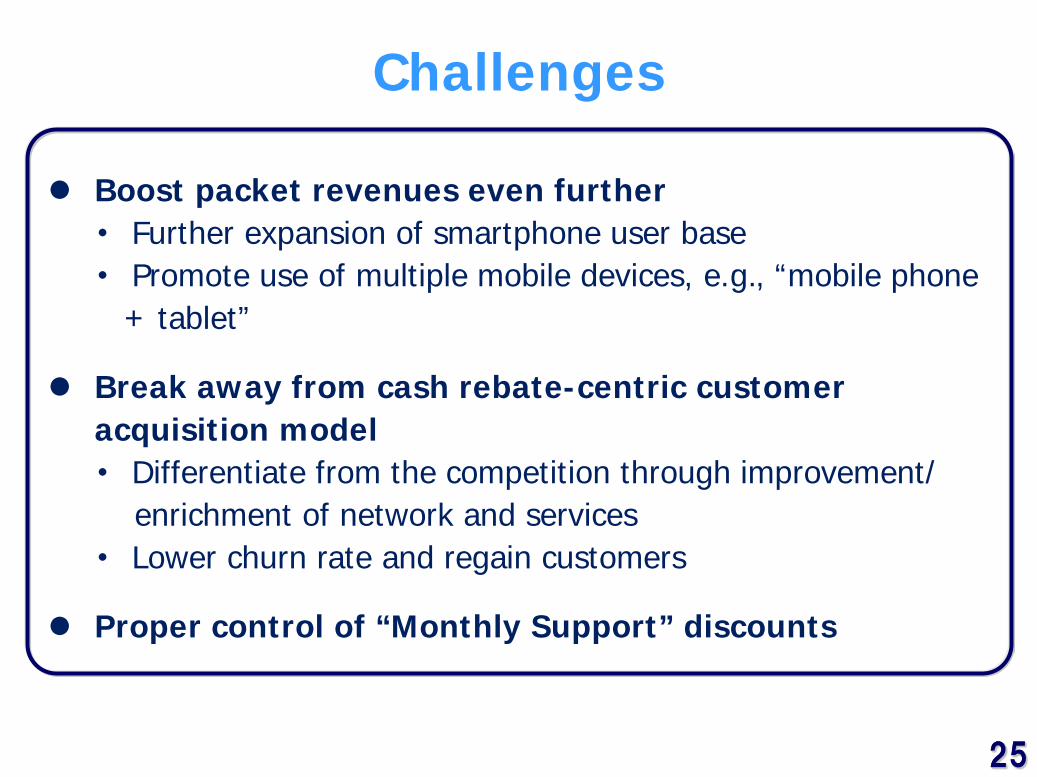
Challenges
Boost packet revenues even further ・ Further expansion of smartphone user base ・ Promote use of multiple mobile devices, e.g., “mobile phone + tablet”
Break away from cash rebate-centric customer acquisition model ・ Differentiate from the competition through improvement/ enrichment of network and services ・ Lower churn rate and regain customers
Proper control of “Monthly Support” discounts
26 26
FY2013 Results Highlights Revenues FLAT, operating income DOWN year-on-year FY2013 Results highlights
Future Business Management Policies FY2014 Forecasts & planned actions
Actions for medium-term growth & return to shareholders
27 27
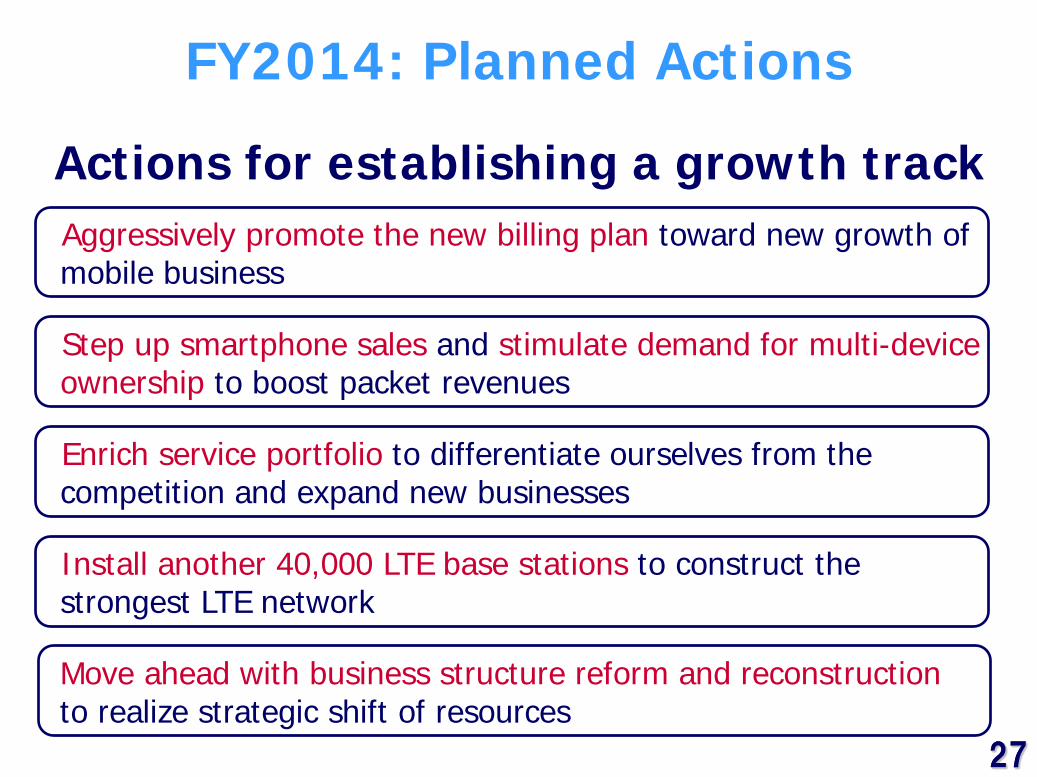
FY2014: Planned Actions
Move ahead with business structure reform and reconstruction to realize strategic shift of resources
Aggressively promote the new billing plan toward new growth of mobile business
Install another 40,000 LTE base stations to construct the strongest LTE network
Step up smartphone sales and stimulate demand for multi-device ownership to boost packet revenues
Actions for establishing a growth track
Enrich service portfolio to differentiate ourselves from the competition and expand new businesses
28 28
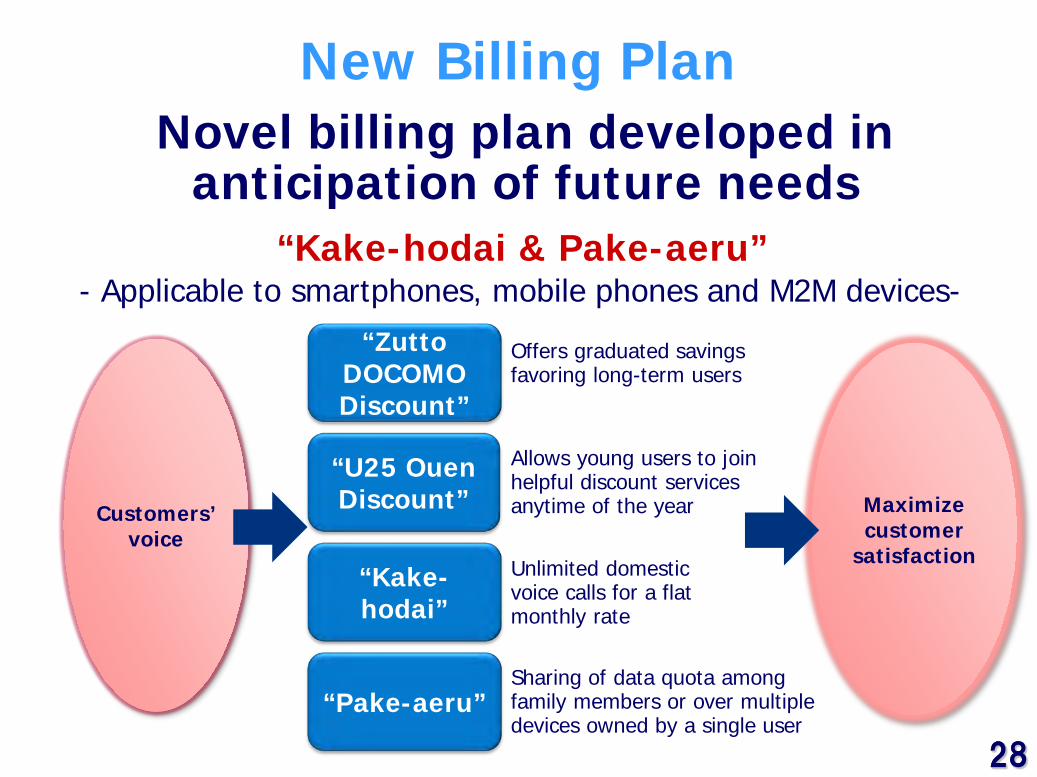
“Zutto DOCOMO Discount”
“U25 Ouen Discount”
“Kake-hodai”
“Pake-aeru”
New Billing Plan
“Kake-hodai & Pake-aeru”
Novel billing plan developed in anticipation of future needs
Customers’ voice
- Applicable to smartphones, mobile phones and M2M devices-
Offers graduated savings favoring long-term users
Allows young users to join helpful discount services anytime of the year
Unlimited domestic voice calls for a flat monthly rate
Sharing of data quota among family members or over multiple devices owned by a single user
Maximize customer
satisfaction
29 29
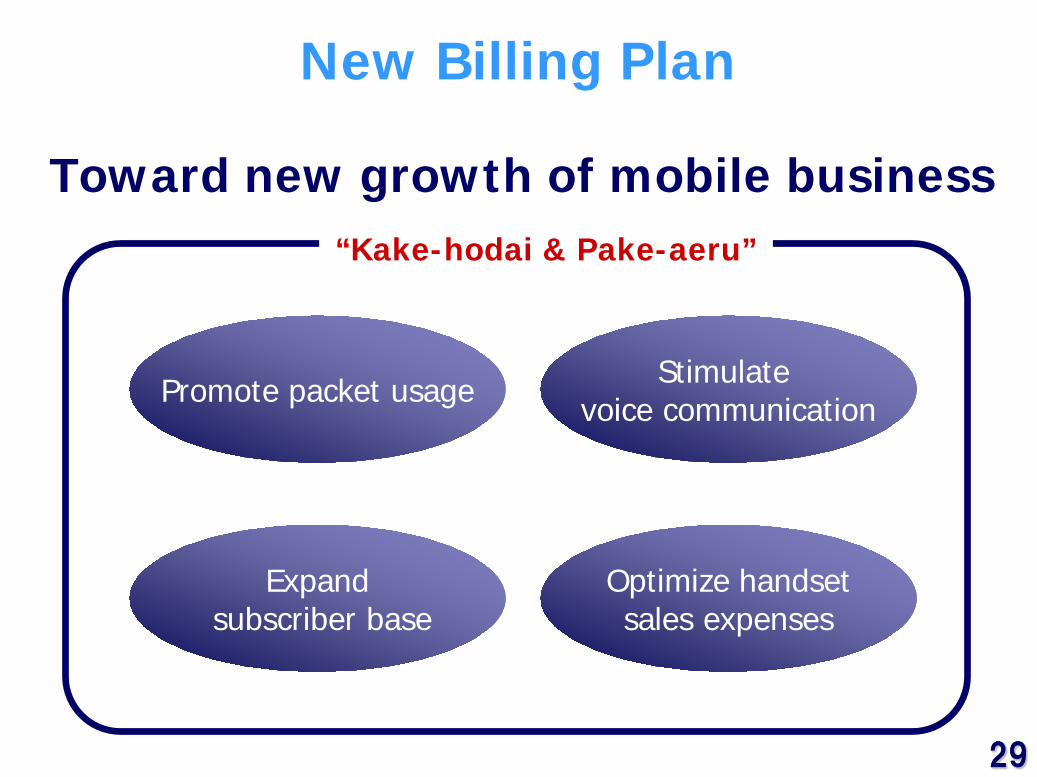
New Billing Plan
Promote packet usage Stimulate voice communication
Expand subscriber base
Optimize handset sales expenses
“Kake-hodai & Pake-aeru”
Toward new growth of mobile business
30 30
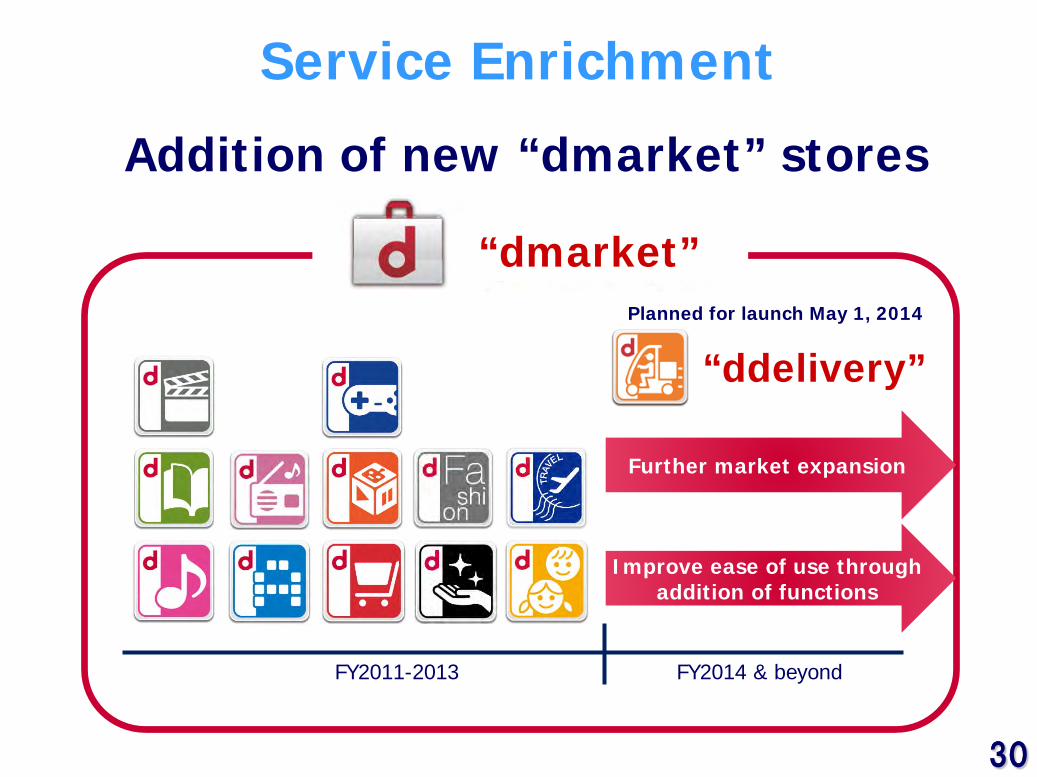
Service Enrichment
FY2011-2013
“dmarket”
Addition of new “dmarket” stores
Further market expansion
Planned for launch May 1, 2014
Improve ease of use through addition of functions
FY2014 & beyond
“ddelivery”
31 31
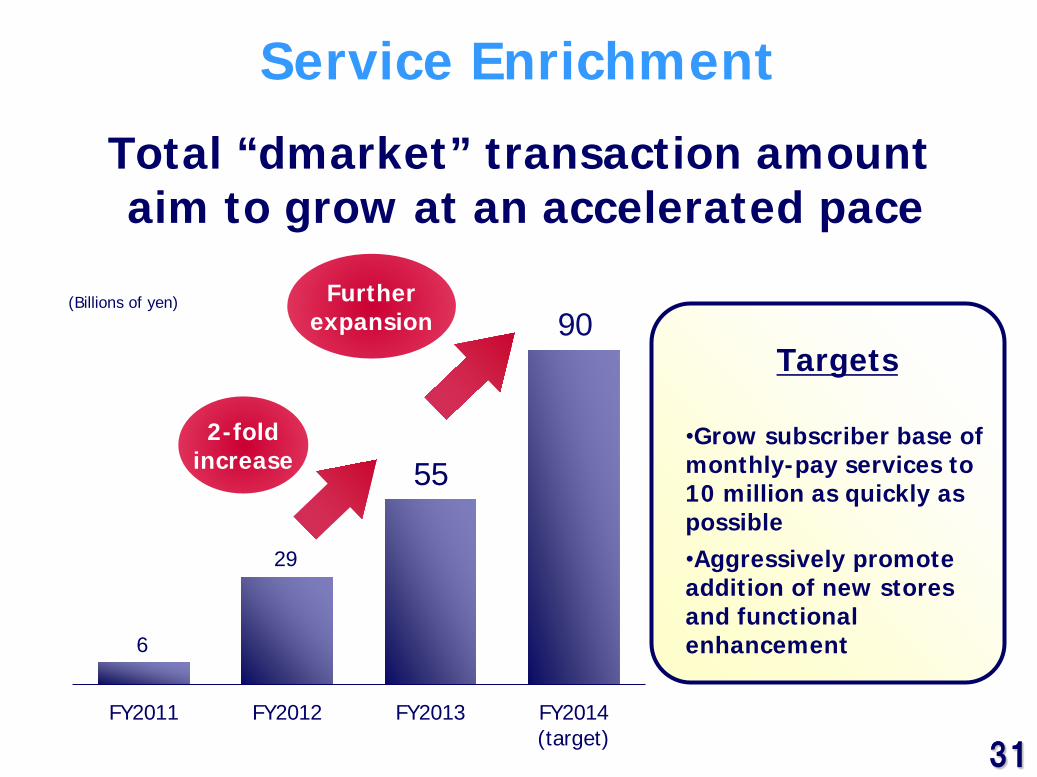
FY2011 FY2012 FY2013 FY2014(target)
Service Enrichment
Total “dmarket” transaction amount aim to grow at an accelerated pace
6
29
55 2-fold
increase
Further expansion
Targets
•Grow subscriber base of monthly-pay services to 10 million as quickly as possible •Aggressively promote addition of new stores and functional enhancement
90 (Billions of yen)
32 32
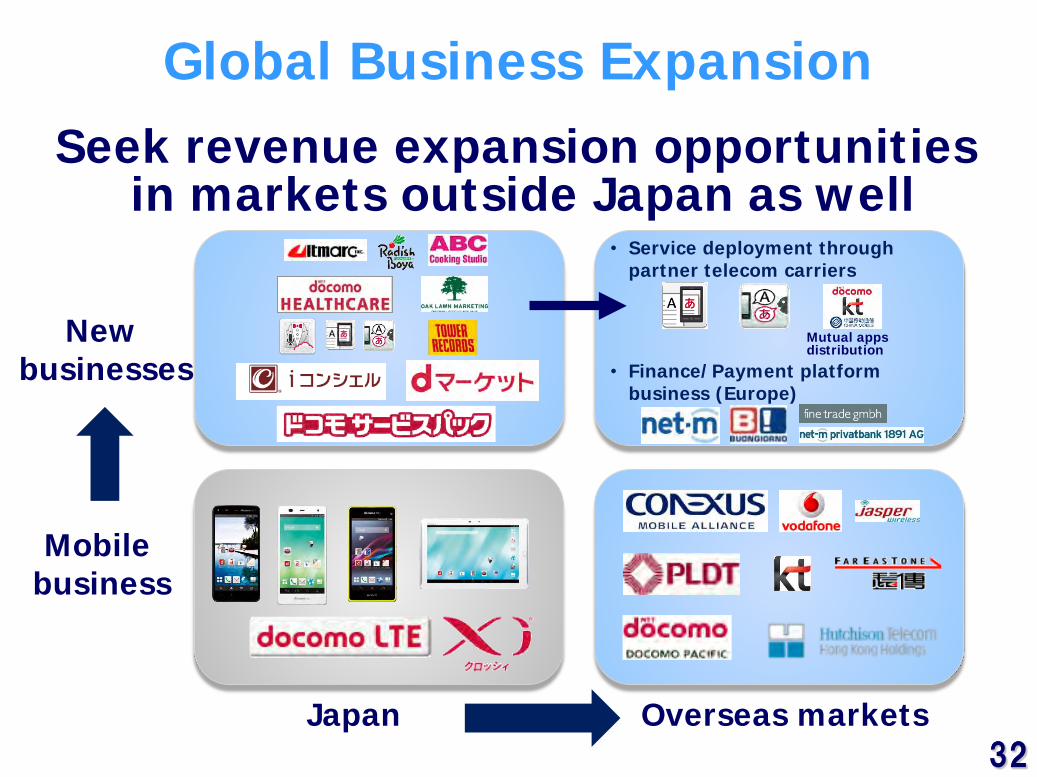
Global Business Expansion
Japan Overseas markets
Mobile business
New businesses
Seek revenue expansion opportunities in markets outside Japan as well
• Service deployment through partner telecom carriers
• Finance/Payment platform business (Europe)
Mutual apps distribution
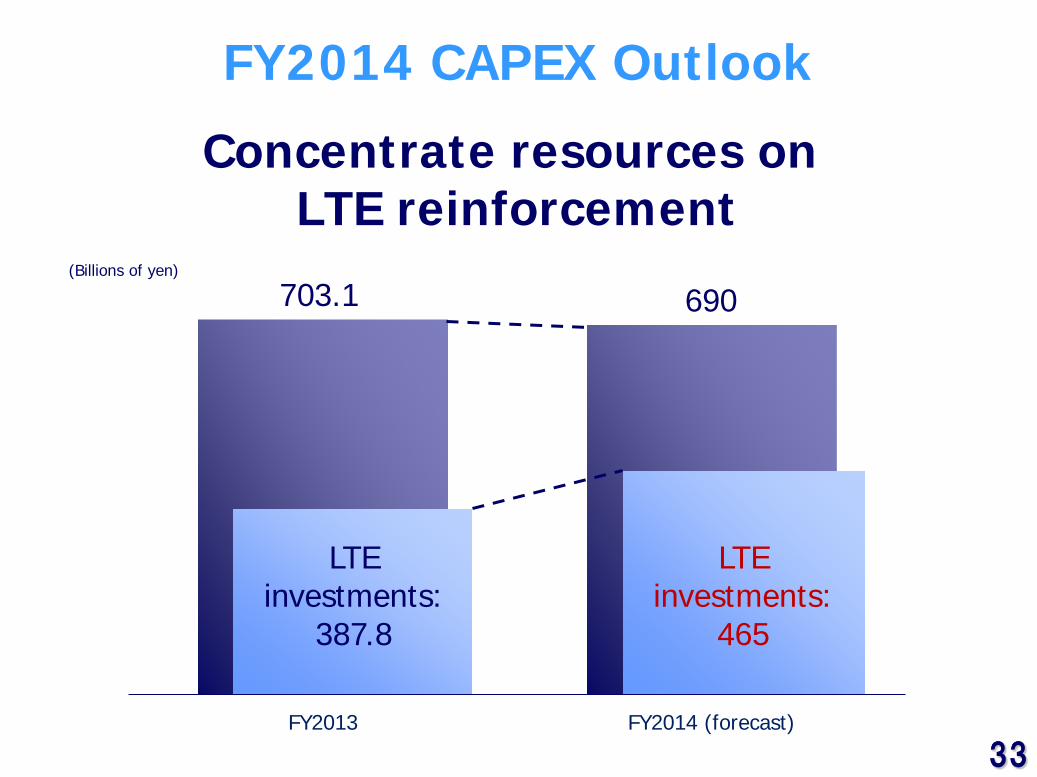
33 33 FY2013 FY2014 (forecast)
FY2014 CAPEX Outlook
LTE investments:
465
LTE investments:
387.8
703.1 690
Concentrate resources on LTE reinforcement
(Billions of yen)
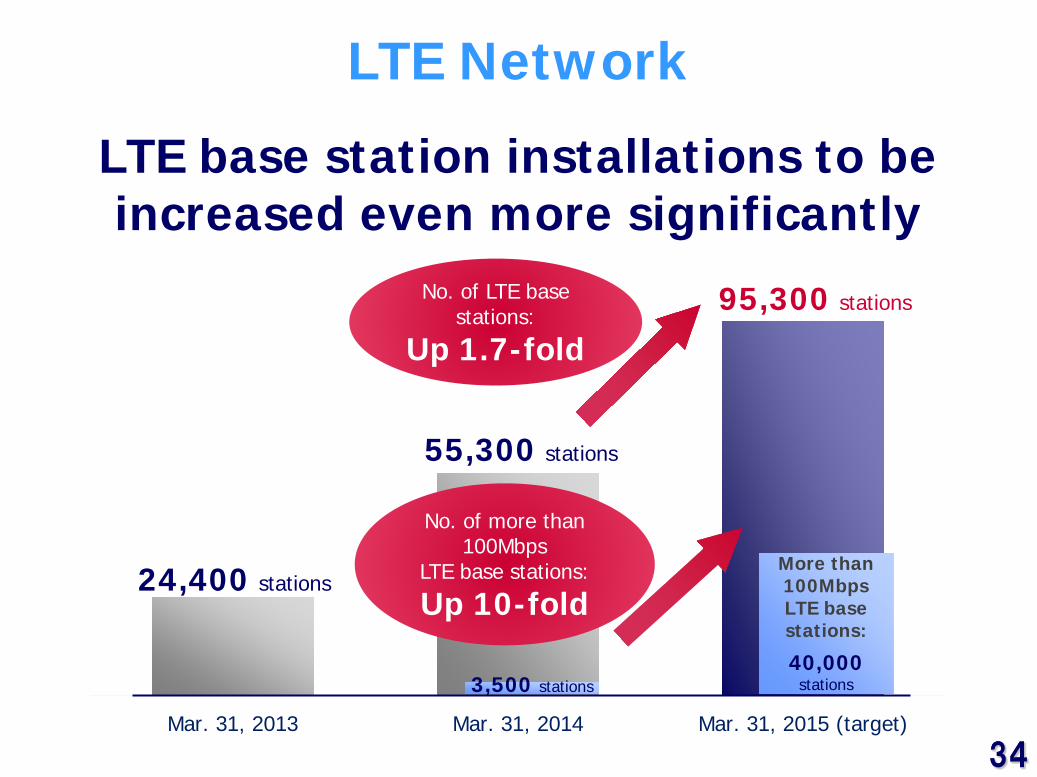
34 34 Mar. 31, 2013 Mar. 31, 2014 Mar. 31, 2015 (target)
LTE base station installations to be increased even more significantly
55,300 stations
24,400 stations
95,300 stations
LTE Network
No. of LTE base stations:
Up 1.7-fold
More than 100Mbps LTE base stations:
40,000 stations 3,500 stations
No. of more than 100Mbps
LTE base stations:
Up 10-fold
35 35
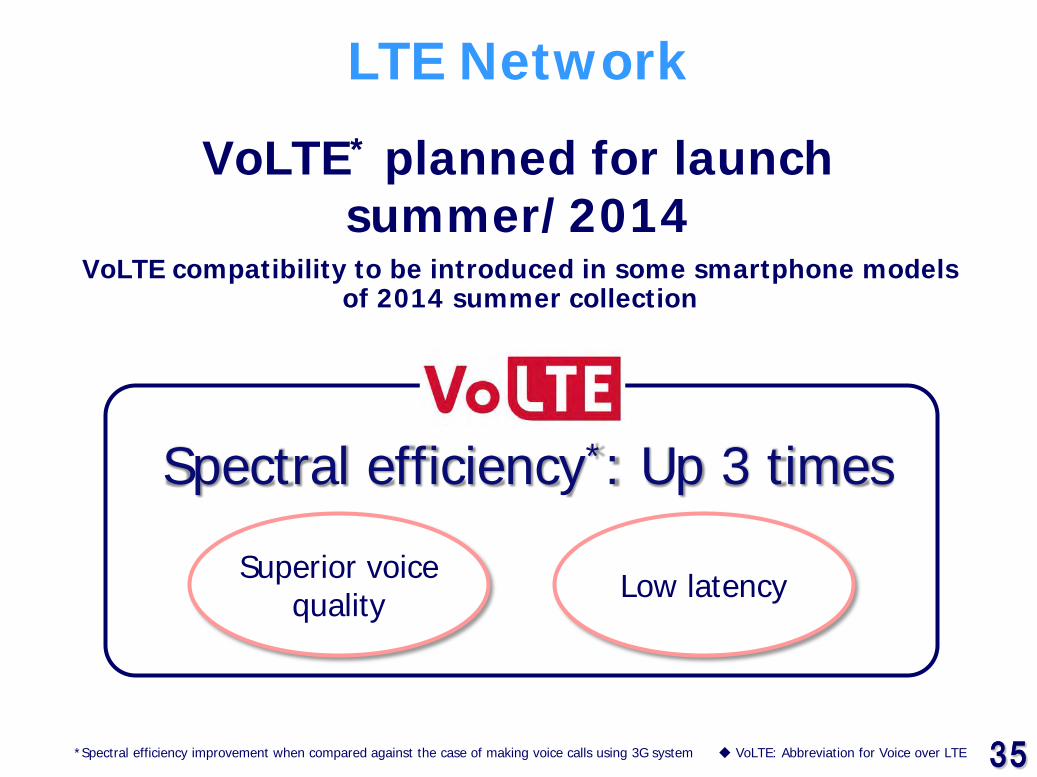
VoLTE* planned for launch summer/2014
VoLTE compatibility to be introduced in some smartphone models of 2014 summer collection
*Spectral efficiency improvement when compared against the case of making voice calls using 3G system ◆ VoLTE: Abbreviation for Voice over LTE
Spectral efficiency*: Up 3 times
LTE Network
Low latency Superior voice quality
36 36
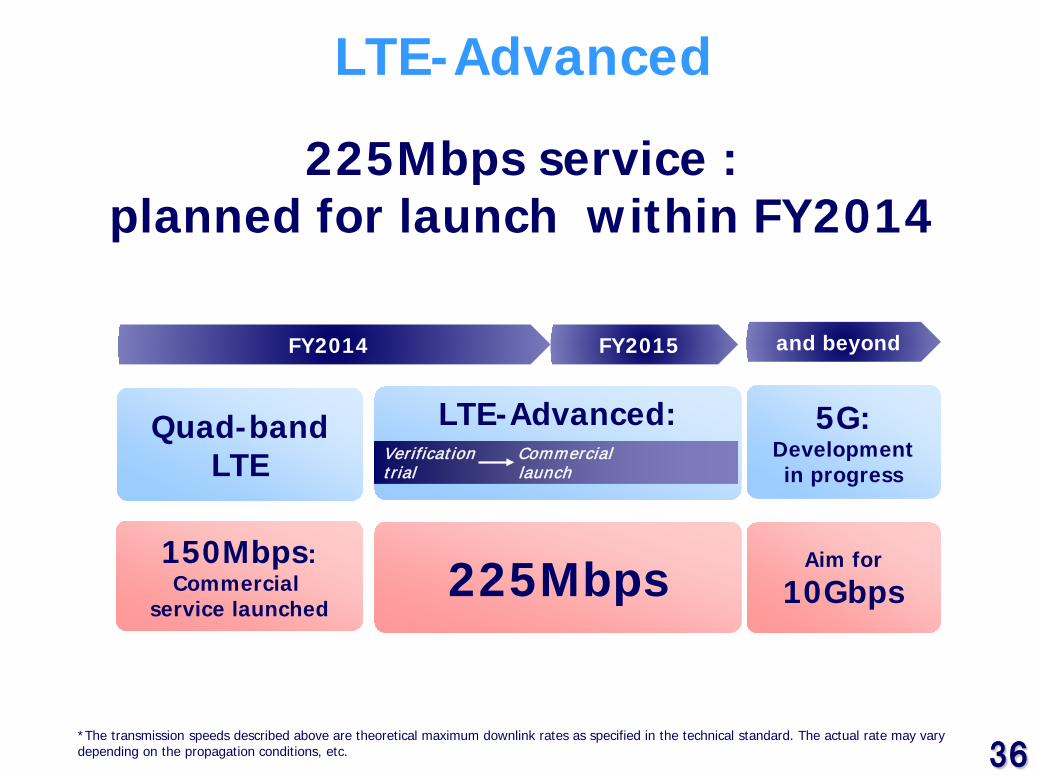
LTE-Advanced: Verification Commercial trial launch
225Mbps service : planned for launch within FY2014
LTE-Advanced
FY2014 FY2015 and beyond
5G: Development in progress
Quad-band LTE
150Mbps: Commercial
service launched 225Mbps Aim for
10Gbps
*The transmission speeds described above are theoretical maximum downlink rates as specified in the technical standard. The actual rate may vary depending on the propagation conditions, etc.
37 37
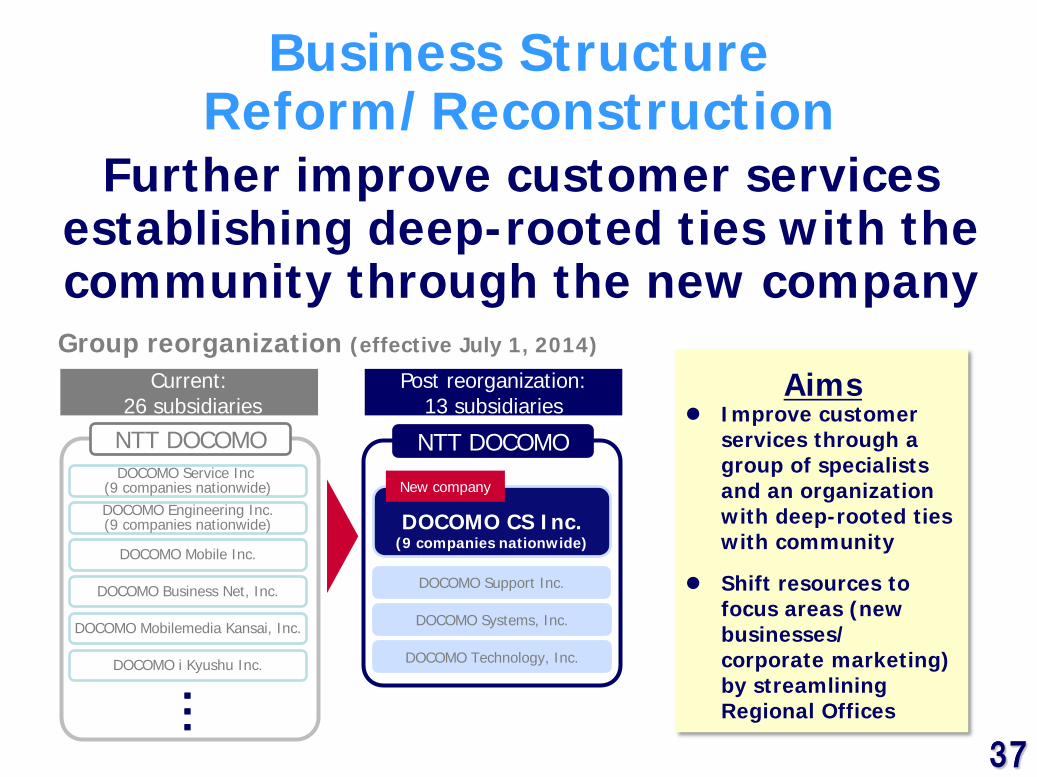
Business Structure Reform/Reconstruction
Further improve customer services establishing deep-rooted ties with the community through the new company
DOCOMO Service Inc (9 companies nationwide)
NTT DOCOMO
DOCOMO Engineering Inc. (9 companies nationwide)
DOCOMO Mobile Inc.
DOCOMO Business Net, Inc.
DOCOMO Mobilemedia Kansai, Inc.
DOCOMO i Kyushu Inc.
・・・
Current: 26 subsidiaries
Post reorganization: 13 subsidiaries
DOCOMO CS Inc.
(9 companies nationwide)
NTT DOCOMO
DOCOMO Support Inc.
DOCOMO Systems, Inc.
DOCOMO Technology, Inc.
New company
Group reorganization (effective July 1, 2014)
Improve customer services through a group of specialists and an organization with deep-rooted ties with community
Shift resources to focus areas (new businesses/ corporate marketing) by streamlining Regional Offices
Aims
38 38
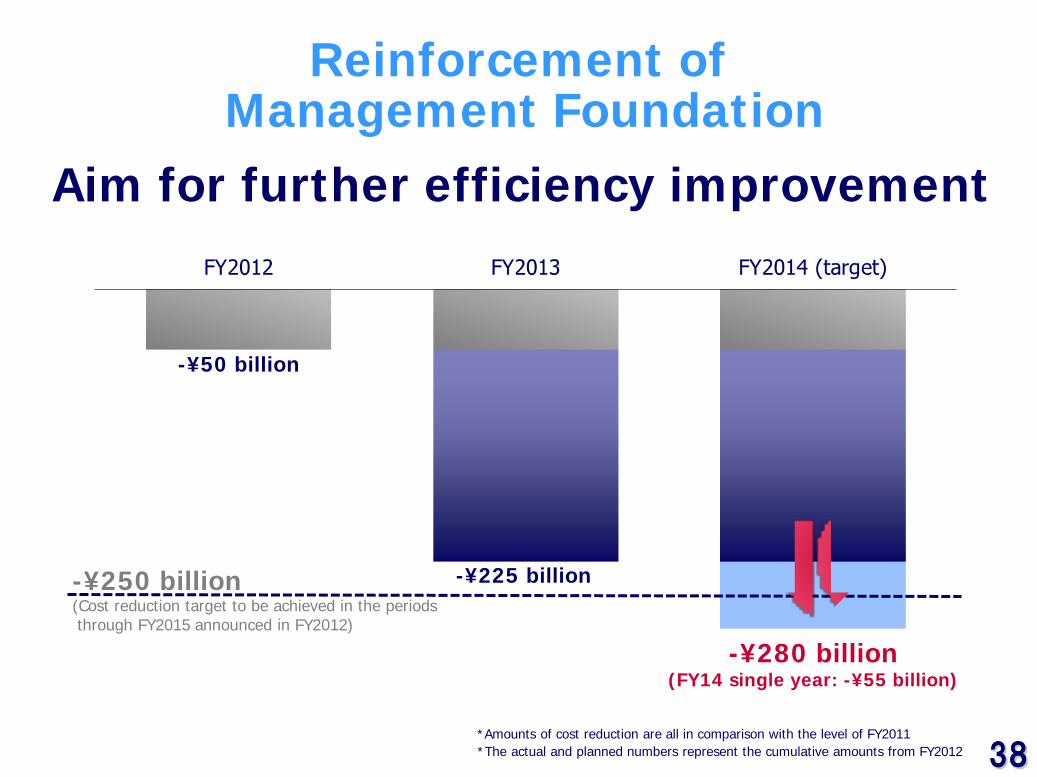
-¥50 billion
-¥225 billion
-¥280 billion (FY14 single year: -¥55 billion)
Reinforcement of Management Foundation
*The actual and planned numbers represent the cumulative amounts from FY2012 *Amounts of cost reduction are all in comparison with the level of FY2011
Aim for further efficiency improvement
-¥250 billion (Cost reduction target to be achieved in the periods through FY2015 announced in FY2012)
39 39
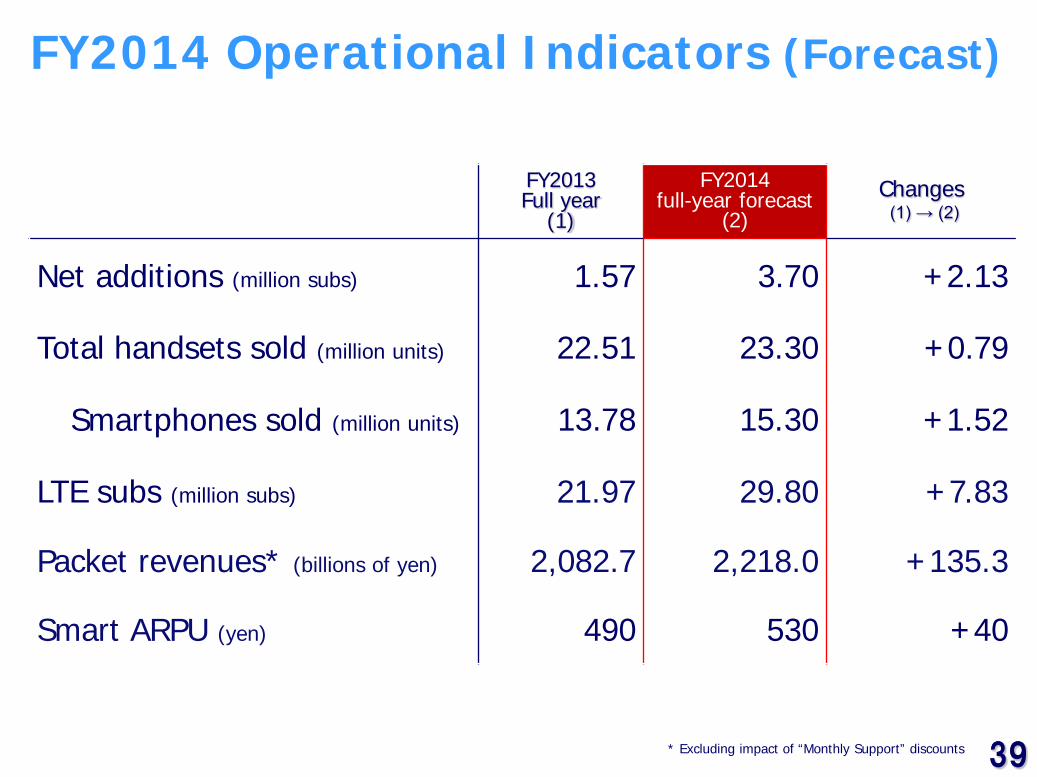
FY2014 Operational Indicators (Forecast)
FY2013 Full year
(1)
FY2014 full-year forecast
(2) Changes (1) → (2)
Net additions (million subs) 1.57 3.70 +2.13
Total handsets sold (million units) 22.51 23.30 +0.79
Smartphones sold (million units) 13.78 15.30 +1.52
LTE subs (million subs) 21.97 29.80 +7.83
Packet revenues* (billions of yen) 2,082.7 2,218.0 +135.3
Smart ARPU (yen) 490 530 +40
* Excluding impact of “Monthly Support” discounts
40 40
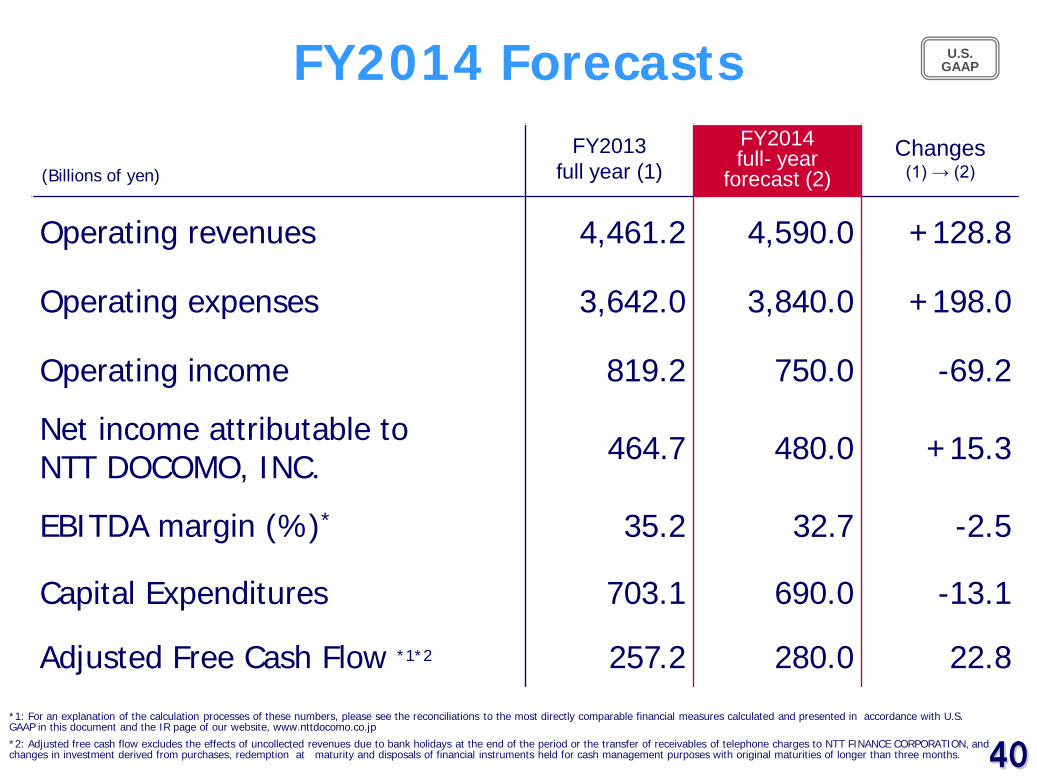
FY2014 Forecasts FY2013
full year (1) FY2014 full- year
forecast (2) Changes
(1) → (2)
Operating revenues 4,461.2 4,590.0 +128.8
Operating expenses 3,642.0 3,840.0 +198.0
Operating income 819.2 750.0 -69.2
Net income attributable to NTT DOCOMO, INC. 464.7 480.0 +15.3
EBITDA margin (%)* 35.2 32.7 -2.5
Capital Expenditures
703.1 690.0 -13.1
Adjusted Free Cash Flow *1*2 257.2 280.0 22.8
(Billions of yen)
U.S. GAAP
*1: For an explanation of the calculation processes of these numbers, please see the reconciliations to the most directly comparable financial measures calculated and presented in accordance with U.S. GAAP in this document and the IR page of our website, www.nttdocomo.co.jp
*2: Adjusted free cash flow excludes the effects of uncollected revenues due to bank holidays at the end of the period or the transfer of receivables of telephone charges to NTT FINANCE CORPORATION, and changes in investment derived from purchases, redemption at maturity and disposals of financial instruments held for cash management purposes with original maturities of longer than three months.
41 41
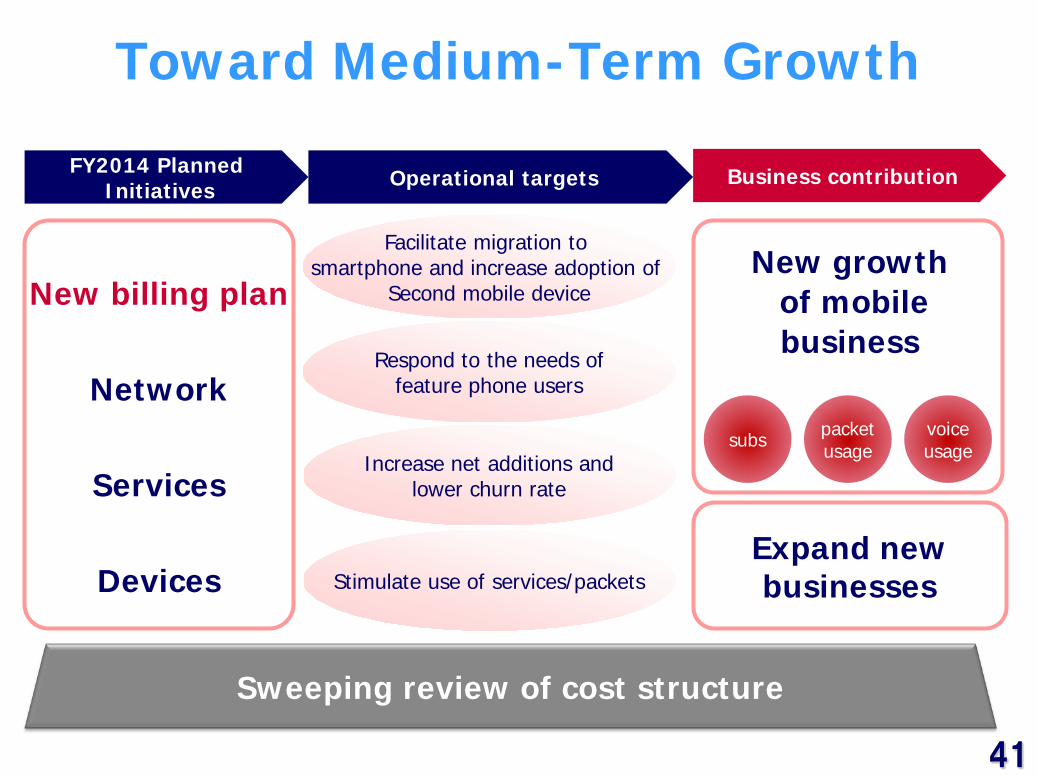
Facilitate migration to smartphone and increase adoption of
Second mobile device
Stimulate use of services/packets
Toward Medium-Term Growth
New billing plan
Network
Services
Devices
New growth of mobile business
Increase net additions and lower churn rate
Expand new businesses
FY2014 Planned Initiatives Operational targets Business contribution
Respond to the needs of feature phone users
Sweeping review of cost structure
subs packet usage
voice usage
42
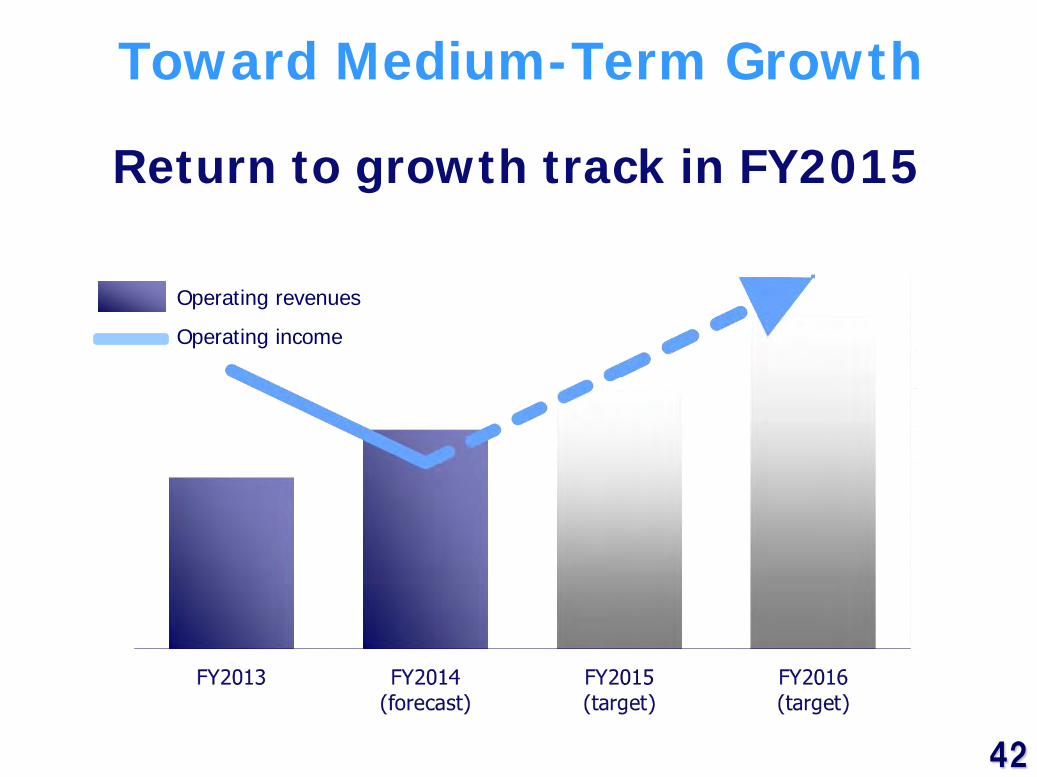
Operating revenues
Operating income
Return to growth track in FY2015
Toward Medium-Term Growth
43 43
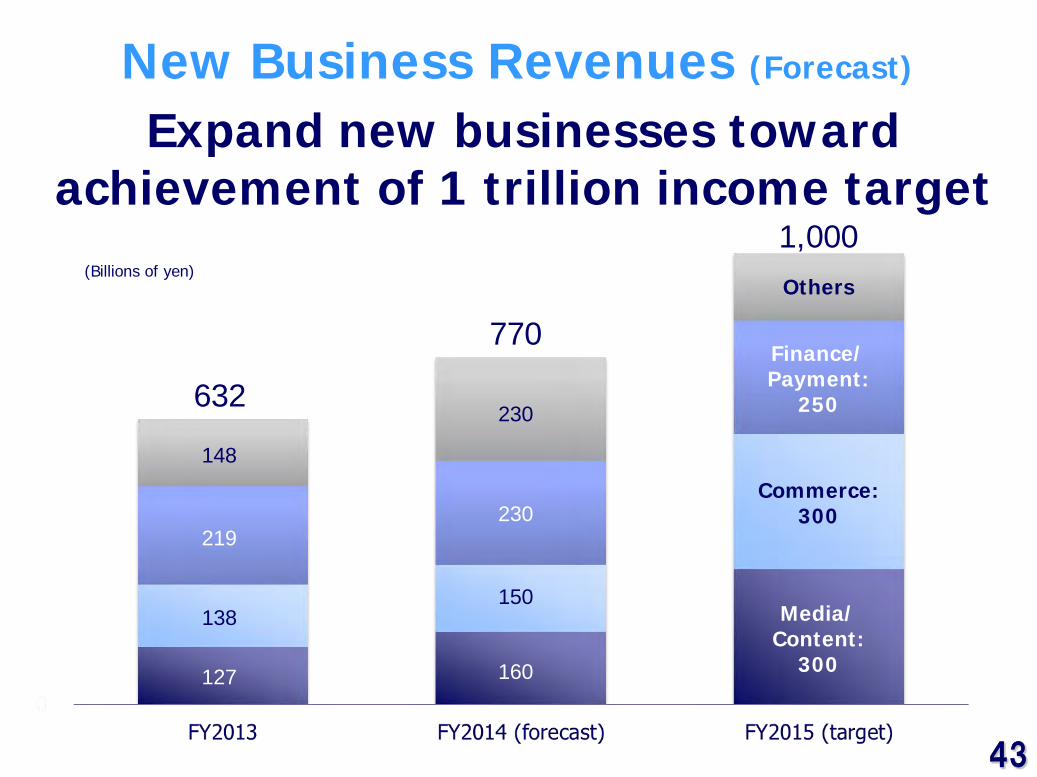
New Business Revenues (Forecast)
Expand new businesses toward achievement of 1 trillion income target
160
Media/ Content:
300
230
150
230 Commerce:
300
632
770
1,000 (Billions of yen)
Others
Finance/ Payment:
250
127
148
138
219
44 44
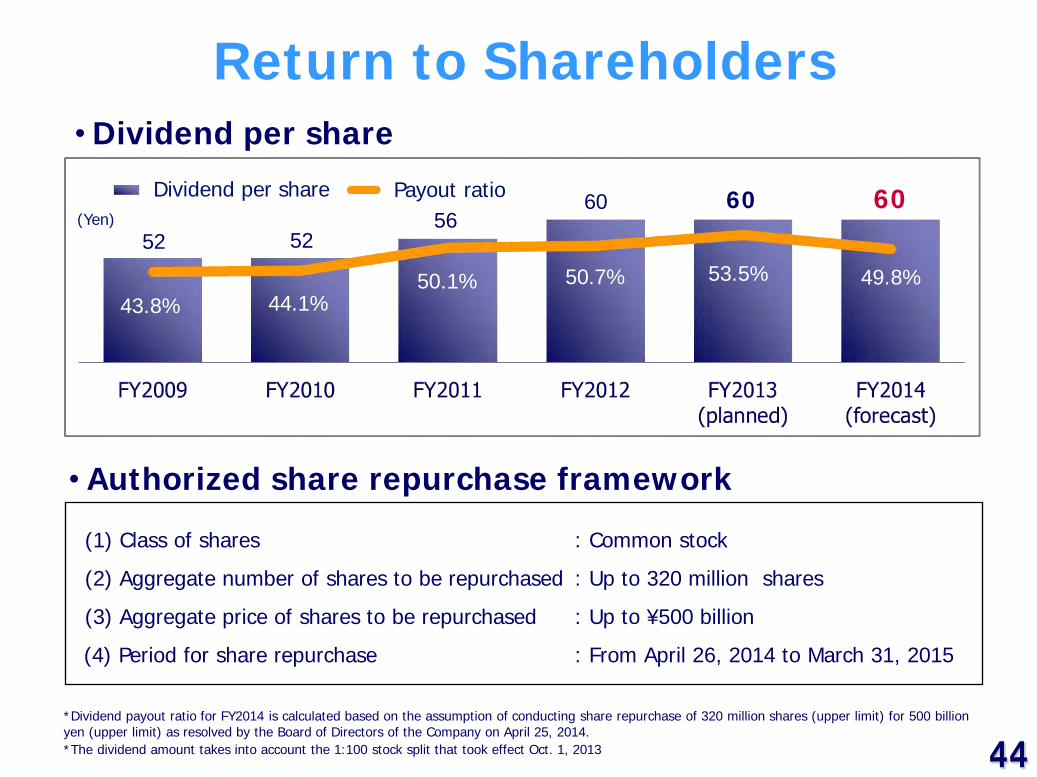
*Dividend payout ratio for FY2014 is calculated based on the assumption of conducting share repurchase of 320 million shares (upper limit) for 500 billion yen (upper limit) as resolved by the Board of Directors of the Company on April 25, 2014. *The dividend amount takes into account the 1:100 stock split that took effect Oct. 1, 2013
Return to Shareholders
• Authorized share repurchase framework
56 52 52
60
43.8% 44.1% 50.1% 50.7%
(円)
53.5%
60
49.8%
60
• Dividend per share
Payout ratio (Yen)
: Common stock
: Up to 320 million shares
: Up to ¥500 billion
: From April 26, 2014 to March 31, 2015
(1) Class of shares
(2) Aggregate number of shares to be repurchased
(3) Aggregate price of shares to be repurchased
(4) Period for share repurchase
Dividend per share
45 45
Before Concluding…
Challenges to be addressed to establish a growth track
Increase net additions, facilitate subscriber migration to smartphones, boost packet usage and lower churn leveraging the introduction of the new billing plan, thereby achieving new growth of mobile business
Expand smartphone user base by brushing up our offerings in the areas of network and devices. Take the lead in service differentiation, and expand new business revenues and income
Properly control the amount of “Monthly Support” discounts, sales and network expenses to ensure efficient use of expenses
46 46
47 47
Appendices
48 48
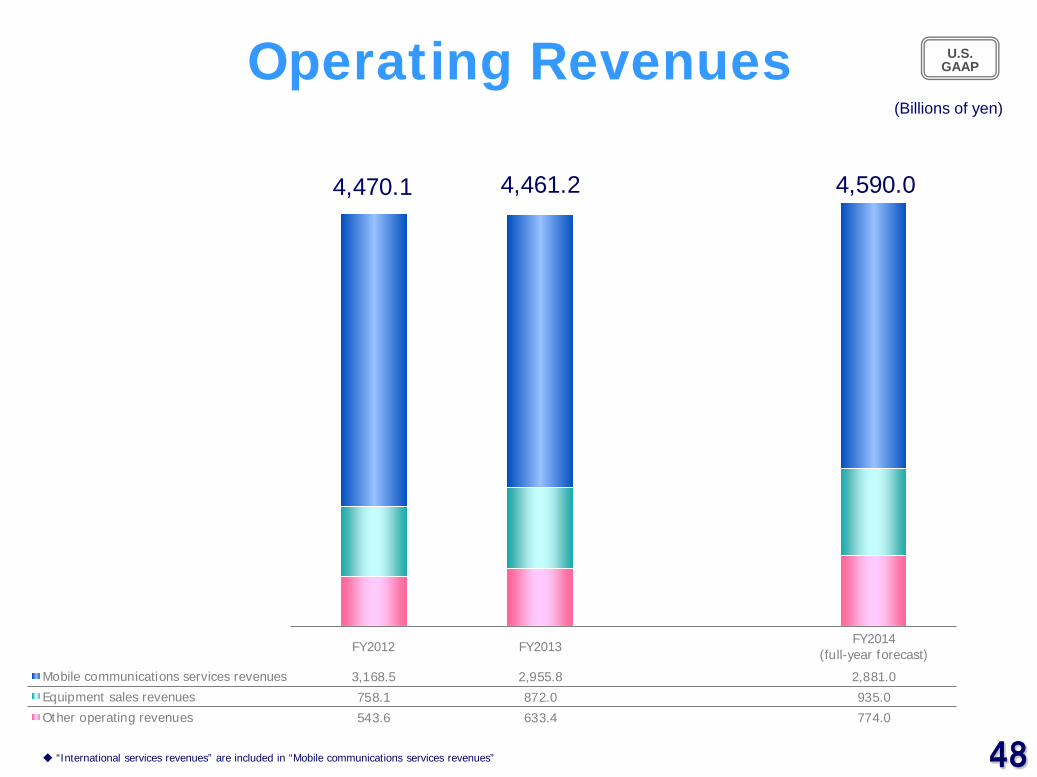
Operating Revenues
4,470.1 4,461.2
U.S. GAAP
(Billions of yen)
◆ “International services revenues” are included in “Mobile communications services revenues”
FY2012 FY2013 FY2014(full-year forecast)
Mobile communications services revenues 3,168.5 2,955.8 2,881.0Equipment sales revenues 758.1 872.0 935.0Other operating revenues 543.6 633.4 774.0
4,590.0
49 49
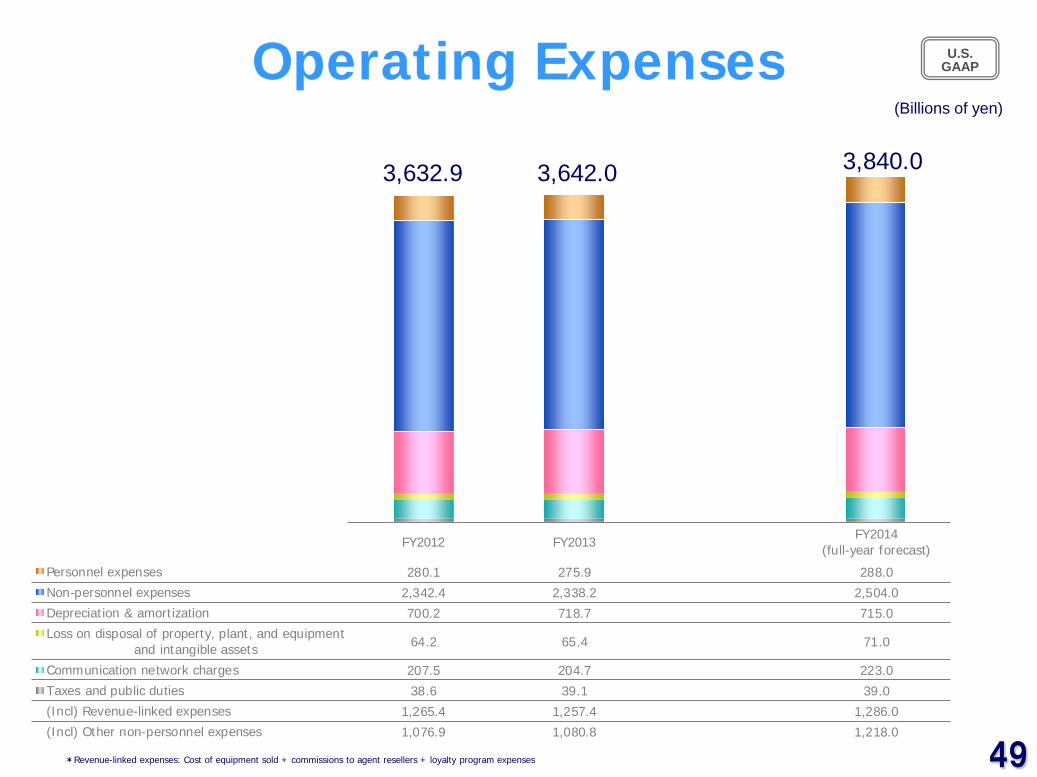
FY2012 FY2013 FY2014(full-year forecast)
Personnel expenses 280.1 275.9 288.0Non-personnel expenses 2,342.4 2,338.2 2,504.0Depreciation & amortization 700.2 718.7 715.0Loss on disposal of property, plant, and equipment
and intangible assets 64.2 65.4 71.0
Communication network charges 207.5 204.7 223.0Taxes and public duties 38.6 39.1 39.0(Incl) Revenue-linked expenses 1,265.4 1,257.4 1,286.0(Incl) Other non-personnel expenses 1,076.9 1,080.8 1,218.0
Operating Expenses
3,632.9 3,642.0
U.S. GAAP
(Billions of yen)
*Revenue-linked expenses: Cost of equipment sold + commissions to agent resellers + loyalty program expenses
3,840.0
50 50
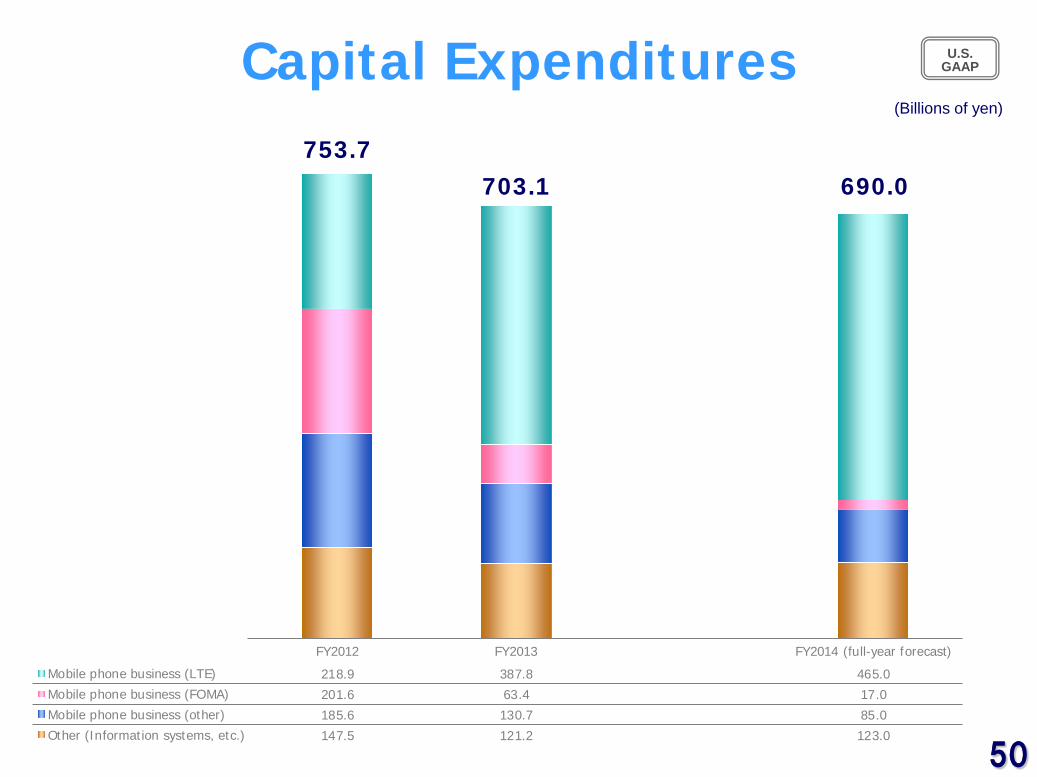
FY2012 FY2013 FY2014 (full-year forecast)
Mobile phone business (LTE) 218.9 387.8 465.0Mobile phone business (FOMA) 201.6 63.4 17.0Mobile phone business (other) 185.6 130.7 85.0Other (Information systems, etc.) 147.5 121.2 123.0
Capital Expenditures 753.7
U.S. GAAP
(Billions of yen)
703.1 690.0
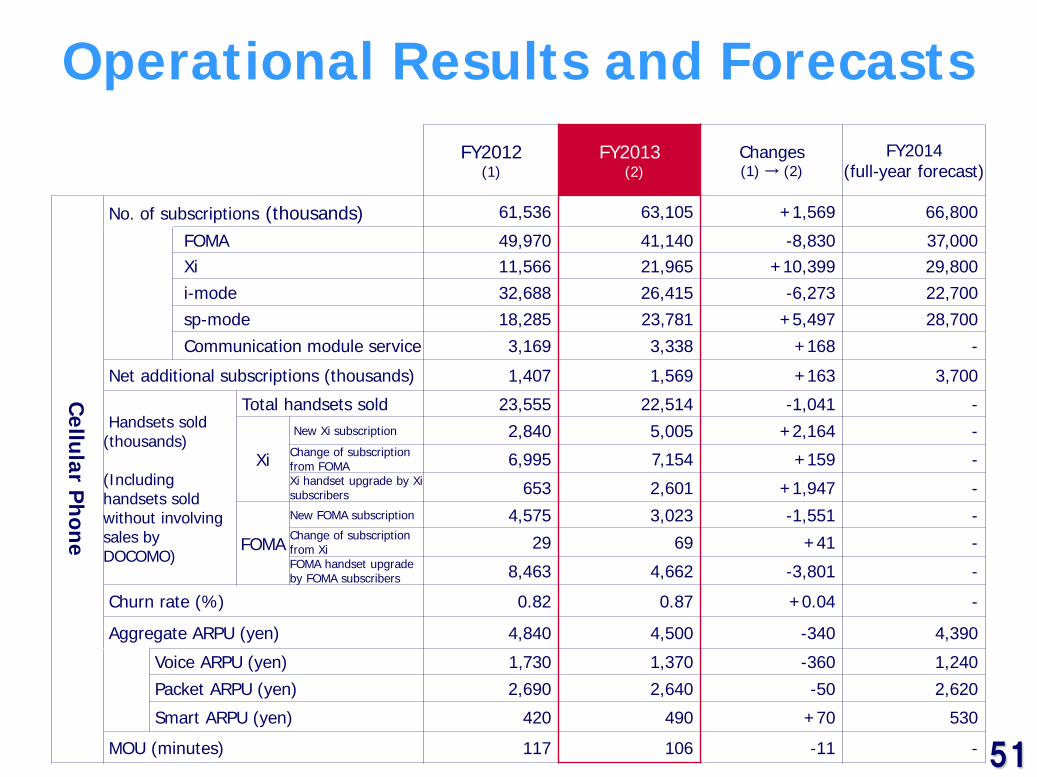
51
Operational Results and Forecasts FY2012
(1) FY2013
(2) Changes (1) → (2)
FY2014 (full-year forecast)
Cellular P
hone
No. of subscriptions (thousands) 61,536 63,105 +1,569 66,800
FOMA 49,970 41,140 -8,830 37,000 Xi 11,566 21,965 +10,399 29,800 i-mode 32,688 26,415 -6,273 22,700 sp-mode 18,285 23,781 +5,497 28,700 Communication module service 3,169 3,338 +168 -
Net additional subscriptions (thousands) 1,407 1,569 +163 3,700
Handsets sold (thousands) (Including handsets sold without involving sales by DOCOMO)
Total handsets sold 23,555 22,514 -1,041 -
Xi
New Xi subscription 2,840 5,005 +2,164 - Change of subscription from FOMA 6,995 7,154 +159 - Xi handset upgrade by Xi subscribers 653 2,601 +1,947 -
FOMA
New FOMA subscription 4,575 3,023 -1,551 - Change of subscription from Xi 29 69 +41 - FOMA handset upgrade by FOMA subscribers 8,463 4,662 -3,801 -
Churn rate (%) 0.82 0.87 +0.04 -
Aggregate ARPU (yen) 4,840 4,500 -340 4,390
Voice ARPU (yen) 1,730 1,370 -360 1,240
Packet ARPU (yen) 2,690 2,640 -50 2,620
Smart ARPU (yen) 420 490 +70 530
MOU (minutes) 117 106 -11 -
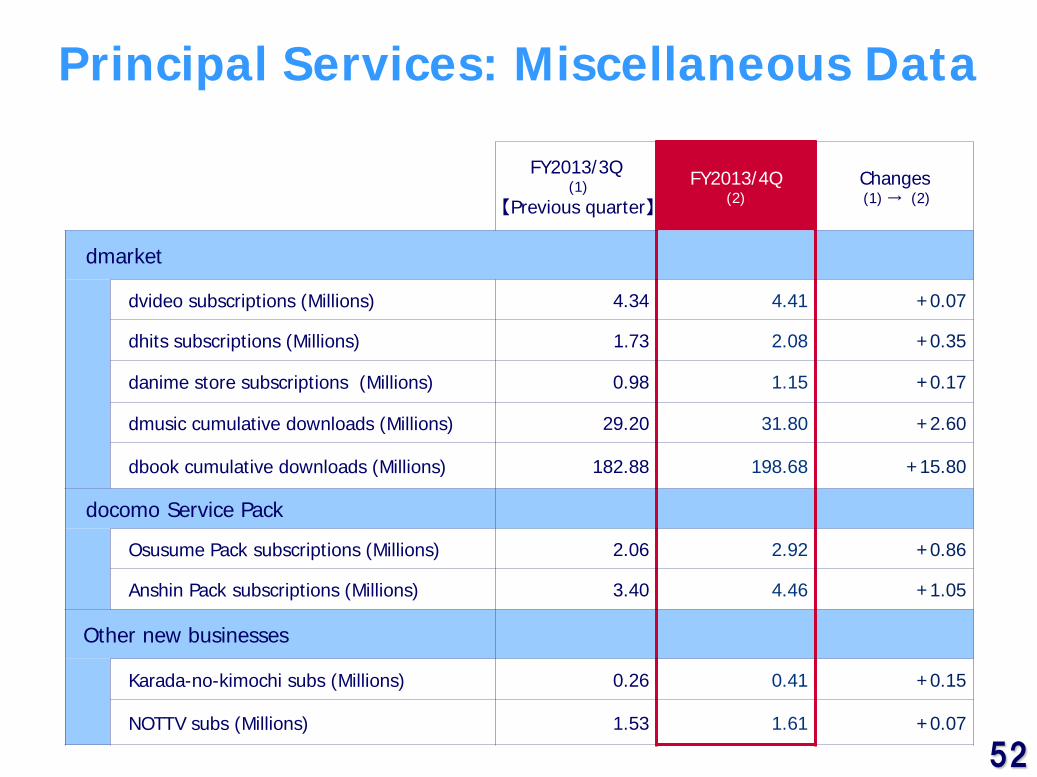
52
Principal Services: Miscellaneous Data
FY2013/3Q (1)
【Previous quarter】 FY2013/4Q
(2) Changes (1) → (2)
dmarket
dvideo subscriptions (Millions) 4.34 4.41 +0.07
dhits subscriptions (Millions) 1.73 2.08 +0.35
danime store subscriptions (Millions) 0.98 1.15 +0.17
dmusic cumulative downloads (Millions) 29.20 31.80 +2.60
dbook cumulative downloads (Millions) 182.88 198.68 +15.80
docomo Service Pack
Osusume Pack subscriptions (Millions) 2.06 2.92 +0.86
Anshin Pack subscriptions (Millions) 3.40 4.46 +1.05
Other new businesses
Karada-no-kimochi subs (Millions) 0.26 0.41 +0.15
NOTTV subs (Millions) 1.53 1.61 +0.07
53 53
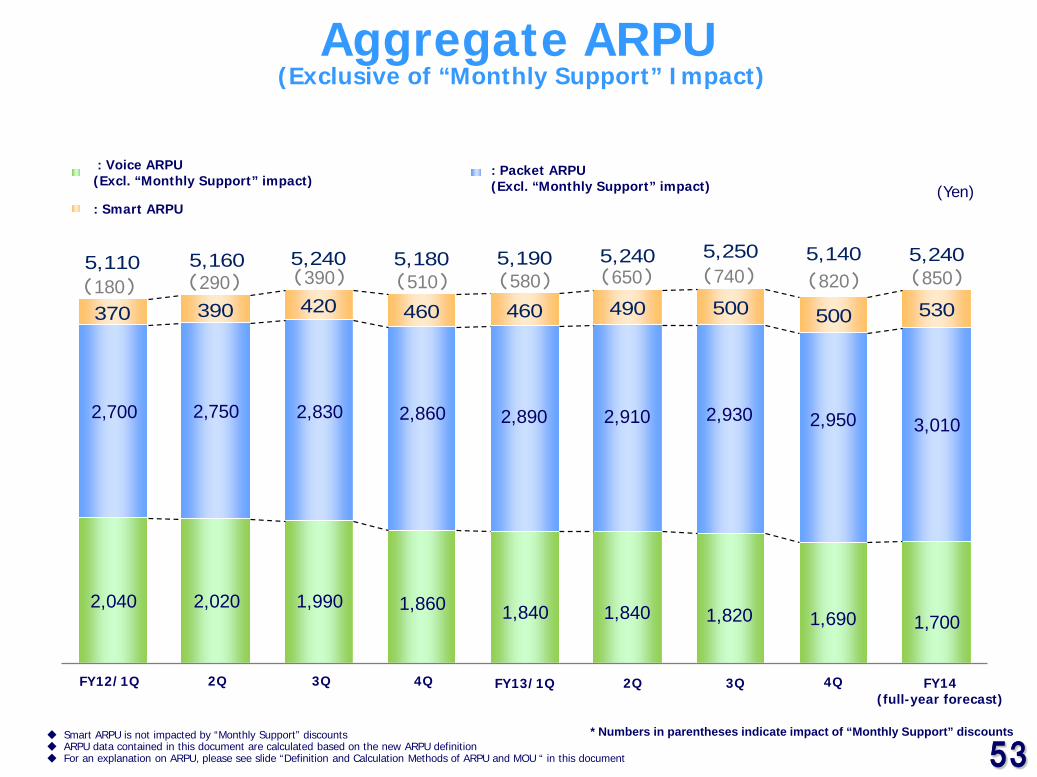
370 390 420 460 460 490 500 500 530
5,110 5,160 5,240 5,180 5,190 5,240 5,250 5,140 5,240
音声ARPU (月々サポート除き) パケットARPU (月々サポート除き)
スマートARPU
2,700 2,750 2,830 2,860 2,890 2,910 2,930
2,040 2,020 1,990 1,860 1,840 1,840 1,820
(180) (290) (390) (510) (580) (650) (740)
(Yen)
Aggregate ARPU (Exclusive of “Monthly Support” Impact)
: Voice ARPU (Excl. “Monthly Support” impact)
: Packet ARPU (Excl. “Monthly Support” impact)
: Smart ARPU
FY12/1Q 2Q 3Q 4Q FY13/1Q 2Q 3Q 4Q FY14 (full-year forecast)
◆ Smart ARPU is not impacted by “Monthly Support” discounts ◆ ARPU data contained in this document are calculated based on the new ARPU definition ◆ For an explanation on ARPU, please see slide “Definition and Calculation Methods of ARPU and MOU “ in this document
* Numbers in parentheses indicate impact of “Monthly Support” discounts
(820) (850)
2,950 3,010
1,690 1,700
54 54
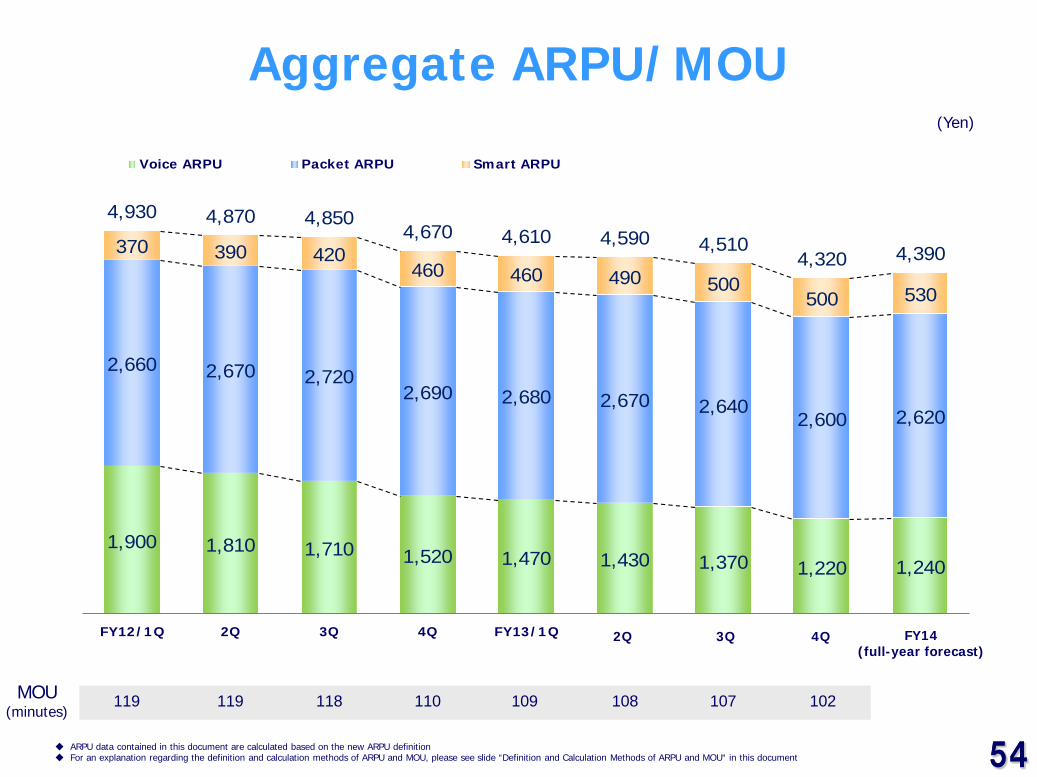
1,900 1,810 1,710 1,520 1,470 1,430 1,370 1,220 1,240
2,660 2,670 2,7202,690 2,680 2,670 2,640
2,600 2,620
370 390 420460 460 490 500
500 530
4,930 4,870 4,8504,670 4,610 4,590 4,510
4,320 4,390
FY12/1Q 2Q 3Q 4Q FY13/1Q 2Q2 3Q2 4Q2 FY14(full-yearforecast)
Voice ARPU Packet ARPU Smart ARPU
(Yen)
MOU (minutes)
119 119 118 110 109 108 107
Aggregate ARPU/MOU
◆ ARPU data contained in this document are calculated based on the new ARPU definition ◆ For an explanation regarding the definition and calculation methods of ARPU and MOU, please see slide “Definition and Calculation Methods of ARPU and MOU“ in this document
2Q 3Q 4Q FY14 (full-year forecast)
102
55 55
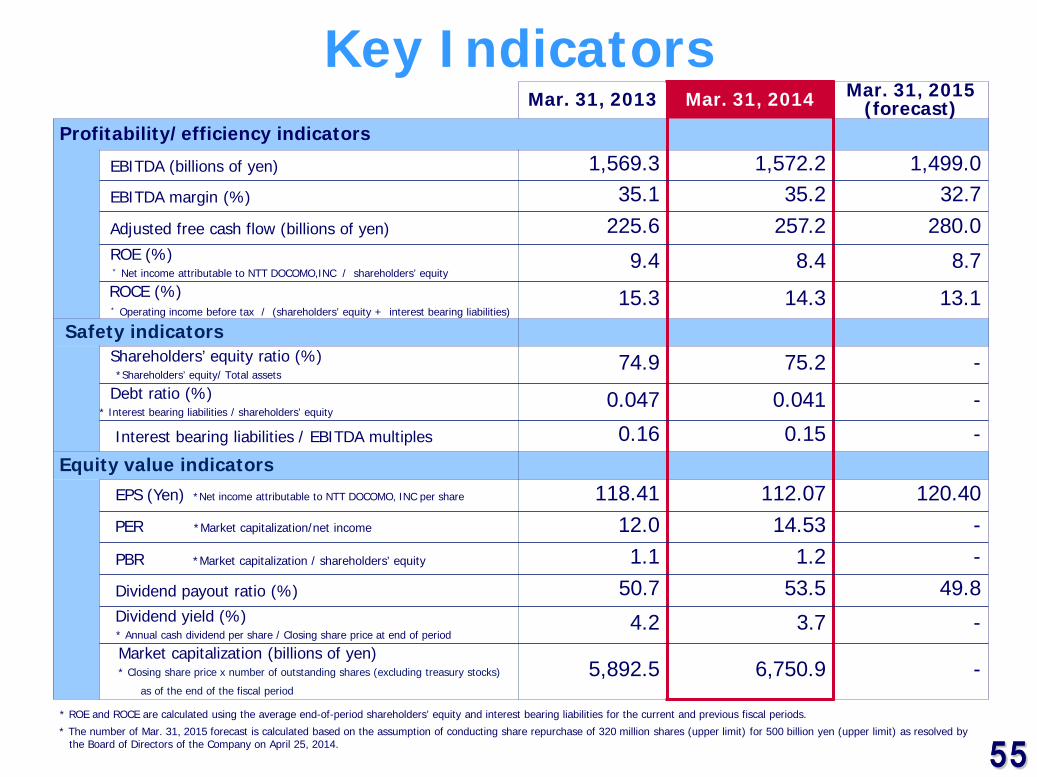
Key Indicators Mar. 31, 2013 Mar. 31, 2014 Mar. 31, 2015
(forecast) Profitability/efficiency indicators
EBITDA (billions of yen) 1,569.3 1,572.2 1,499.0 EBITDA margin (%) 35.1 35.2 32.7 Adjusted free cash flow (billions of yen) 225.6 257.2 280.0 ROE (%) * Net income attributable to NTT DOCOMO,INC / shareholders’ equity
9.4 8.4 8.7 ROCE (%) * Operating income before tax / (shareholders’ equity + interest bearing liabilities)
15.3 14.3 13.1 Safety indicators
Shareholders’ equity ratio (%) *Shareholders’ equity/ Total assets
74.9 75.2 - Debt ratio (%) * Interest bearing liabilities / shareholders’ equity
0.047 0.041 -
Interest bearing liabilities / EBITDA multiples 0.16 0.15 - Equity value indicators
EPS (Yen) *Net income attributable to NTT DOCOMO, INC per share 118.41 112.07 120.40 PER *Market capitalization/net income 12.0 14.53 - PBR *Market capitalization / shareholders’ equity 1.1 1.2 - Dividend payout ratio (%) 50.7 53.5 49.8 Dividend yield (%) * Annual cash dividend per share / Closing share price at end of period
4.2 3.7 - Market capitalization (billions of yen) * Closing share price x number of outstanding shares (excluding treasury stocks)
as of the end of the fiscal period
5,892.5 6,750.9 -
* ROE and ROCE are calculated using the average end-of-period shareholders’ equity and interest bearing liabilities for the current and previous fiscal periods.
* The number of Mar. 31, 2015 forecast is calculated based on the assumption of conducting share repurchase of 320 million shares (upper limit) for 500 billion yen (upper limit) as resolved by the Board of Directors of the Company on April 25, 2014.
56 56
57 57
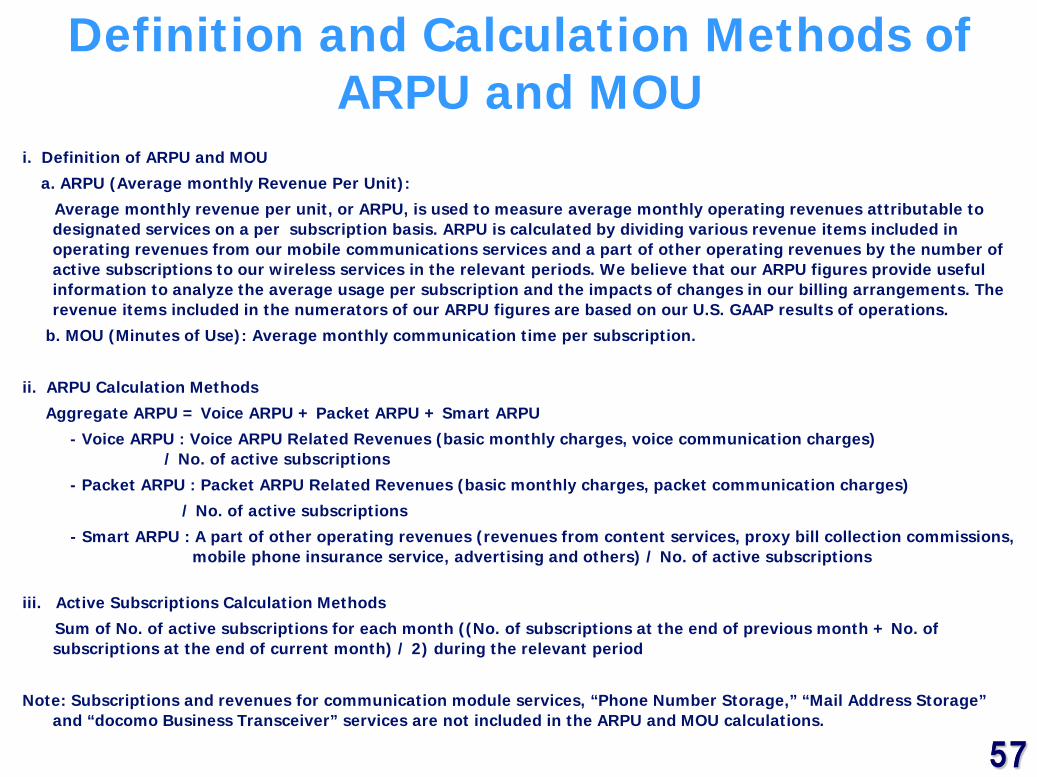
i. Definition of ARPU and MOU
a. ARPU (Average monthly Revenue Per Unit):
Average monthly revenue per unit, or ARPU, is used to measure average monthly operating revenues attributable to designated services on a per subscription basis. ARPU is calculated by dividing various revenue items included in operating revenues from our mobile communications services and a part of other operating revenues by the number of active subscriptions to our wireless services in the relevant periods. We believe that our ARPU figures provide useful information to analyze the average usage per subscription and the impacts of changes in our billing arrangements. The revenue items included in the numerators of our ARPU figures are based on our U.S. GAAP results of operations.
b. MOU (Minutes of Use): Average monthly communication time per subscription.
ii. ARPU Calculation Methods
Aggregate ARPU = Voice ARPU + Packet ARPU + Smart ARPU
- Voice ARPU : Voice ARPU Related Revenues (basic monthly charges, voice communication charges) / No. of active subscriptions
- Packet ARPU : Packet ARPU Related Revenues (basic monthly charges, packet communication charges)
/ No. of active subscriptions
- Smart ARPU : A part of other operating revenues (revenues from content services, proxy bill collection commissions, mobile phone insurance service, advertising and others) / No. of active subscriptions
iii. Active Subscriptions Calculation Methods
Sum of No. of active subscriptions for each month ((No. of subscriptions at the end of previous month + No. of subscriptions at the end of current month) / 2) during the relevant period
Note: Subscriptions and revenues for communication module services, “Phone Number Storage,” “Mail Address Storage” and “docomo Business Transceiver” services are not included in the ARPU and MOU calculations.
Definition and Calculation Methods of ARPU and MOU
58 58
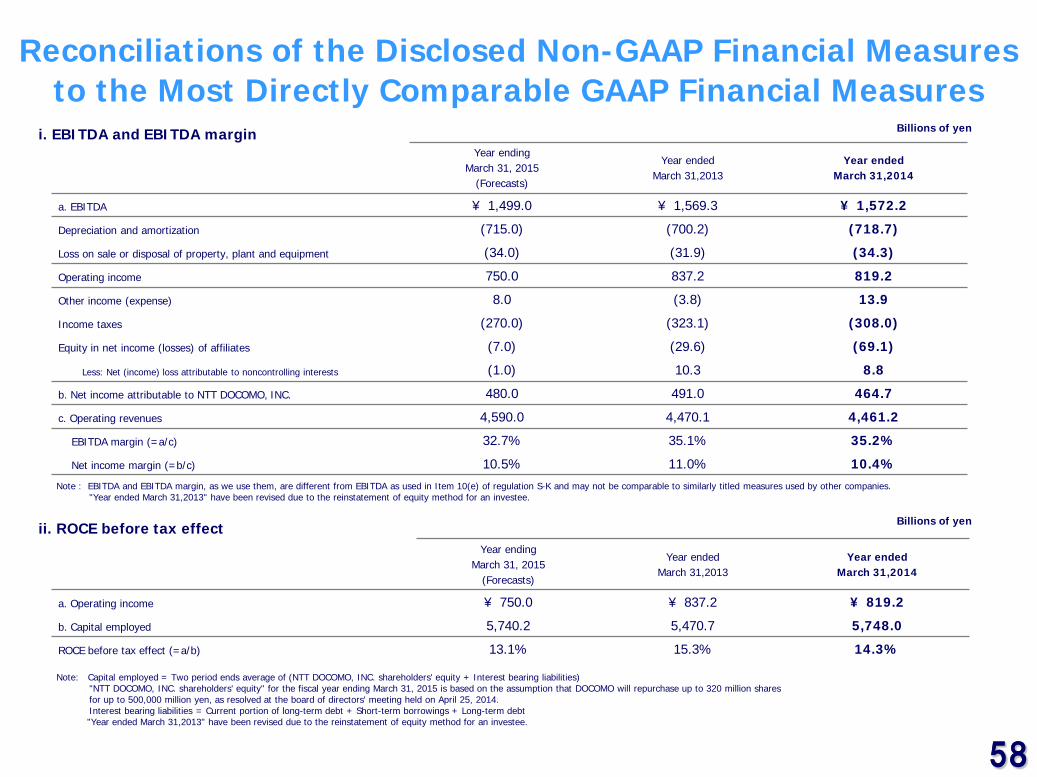
Reconciliations of the Disclosed Non-GAAP Financial Measures to the Most Directly Comparable GAAP Financial Measures
Year ending March 31, 2015
(Forecasts)
Year ended March 31,2013
Year ended March 31,2014
a. EBITDA ¥ 1,499.0 ¥ 1,569.3 ¥ 1,572.2
Depreciation and amortization (715.0) (700.2) (718.7)
Loss on sale or disposal of property, plant and equipment (34.0) (31.9) (34.3)
Operating income 750.0 837.2 819.2
Other income (expense) 8.0 (3.8) 13.9
Income taxes (270.0) (323.1) (308.0)
Equity in net income (losses) of affiliates (7.0) (29.6) (69.1)
Less: Net (income) loss attributable to noncontrolling interests (1.0) 10.3 8.8
b. Net income attributable to NTT DOCOMO, INC. 480.0 491.0 464.7
c. Operating revenues 4,590.0 4,470.1 4,461.2
EBITDA margin (=a/c) 32.7% 35.1% 35.2%
Net income margin (=b/c) 10.5% 11.0% 10.4%
i. EBITDA and EBITDA margin
ii. ROCE before tax effect Year ending
March 31, 2015 (Forecasts)
Year ended March 31,2013
Year ended March 31,2014
a. Operating income ¥ 750.0 ¥ 837.2 ¥ 819.2
b. Capital employed 5,740.2 5,470.7 5,748.0
ROCE before tax effect (=a/b) 13.1% 15.3% 14.3%
Note: Capital employed = Two period ends average of (NTT DOCOMO, INC. shareholders' equity + Interest bearing liabilities) "NTT DOCOMO, INC. shareholders' equity" for the fiscal year ending March 31, 2015 is based on the assumption that DOCOMO will repurchase up to 320 million shares for up to 500,000 million yen, as resolved at the board of directors' meeting held on April 25, 2014. Interest bearing liabilities = Current portion of long-term debt + Short-term borrowings + Long-term debt "Year ended March 31,2013" have been revised due to the reinstatement of equity method for an investee.
Billions of yen
Note : EBITDA and EBITDA margin, as we use them, are different from EBITDA as used in Item 10(e) of regulation S-K and may not be comparable to similarly titled measures used by other companies. "Year ended March 31,2013" have been revised due to the reinstatement of equity method for an investee.
Billions of yen
59 59
Reconciliations of the Disclosed Non-GAAP Financial Measures to the Most Directly Comparable GAAP Financial Measures
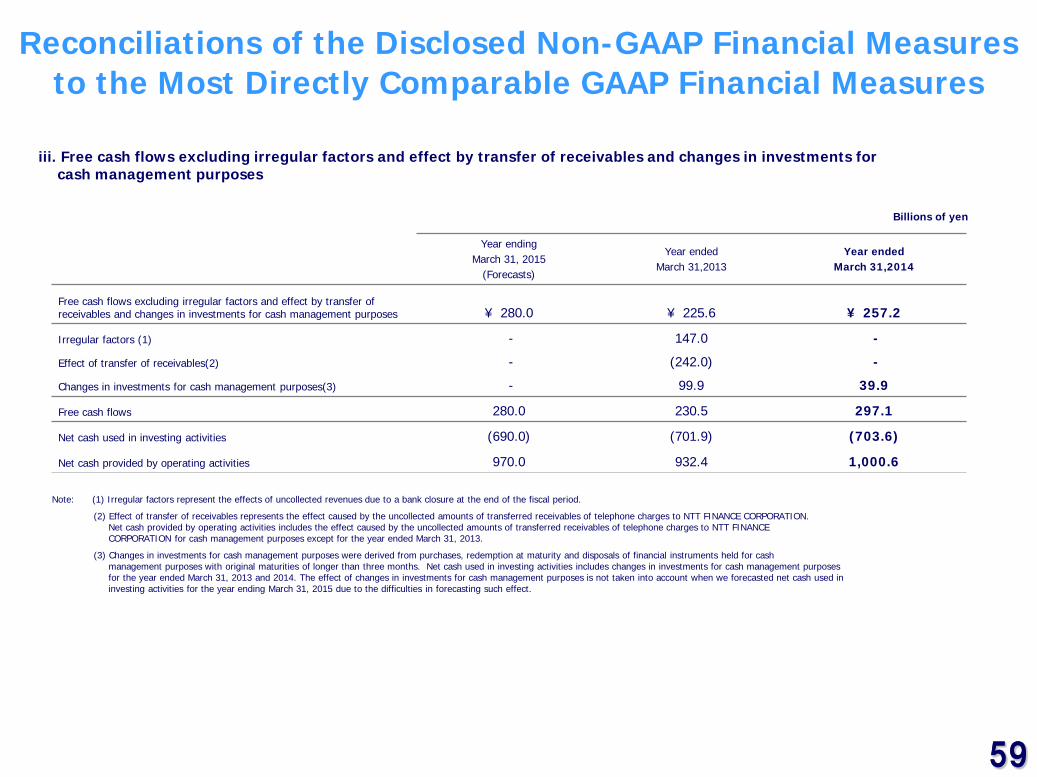
iii. Free cash flows excluding irregular factors and effect by transfer of receivables and changes in investments for cash management purposes
Year ending March 31, 2015
(Forecasts)
Year ended March 31,2013
Year ended March 31,2014
Free cash flows excluding irregular factors and effect by transfer of receivables and changes in investments for cash management purposes ¥ 280.0 ¥ 225.6 ¥ 257.2
Irregular factors (1) - 147.0 -
Effect of transfer of receivables(2) - (242.0) -
Changes in investments for cash management purposes(3) - 99.9 39.9
Free cash flows 280.0 230.5 297.1
Net cash used in investing activities (690.0) (701.9) (703.6)
Net cash provided by operating activities 970.0 932.4 1,000.6
Note: (1) Irregular factors represent the effects of uncollected revenues due to a bank closure at the end of the fiscal period.
(2) Effect of transfer of receivables represents the effect caused by the uncollected amounts of transferred receivables of telephone charges to NTT FINANCE CORPORATION. Net cash provided by operating activities includes the effect caused by the uncollected amounts of transferred receivables of telephone charges to NTT FINANCE CORPORATION for cash management purposes except for the year ended March 31, 2013.
(3) Changes in investments for cash management purposes were derived from purchases, redemption at maturity and disposals of financial instruments held for cash management purposes with original maturities of longer than three months. Net cash used in investing activities includes changes in investments for cash management purposes for the year ended March 31, 2013 and 2014. The effect of changes in investments for cash management purposes is not taken into account when we forecasted net cash used in investing activities for the year ending March 31, 2015 due to the difficulties in forecasting such effect.
Billions of yen
60 60
This earnings release contains forward-looking statements such as forecasts of results of operations, management strategies, objectives and plans, forecasts of operational data such as the expected number of subscription, and the expected dividend payments. All forward-looking statements that are not historical facts are based on management’s current plans, expectations, assumptions and estimates based on the information currently available. Some of the projected numbers in this earnings release were derived using certain assumptions that are indispensable for making such projections in addition to historical facts. These forward-looking statements are subject to various known and unknown risks, uncertainties and other factors that could cause our actual results to differ materially from those contained in or suggested by any forward-looking statement. Potential risks and uncertainties include, without limitation, the following: (1) Changes in the market environment in the telecommunications industry, such as intensifying competition from other businesses or other technologies caused by Mobile Number Portability, development of appealing new handsets, new market entrants, mergers among other service providers and other factors, or the expansion of the areas of competition could limit the acquisition of new subscriptions and retention of existing subscriptions by our corporate group or may lead to ARPU diminishing at a greater than expected rate, an increase in our costs or an inability to reduce expenses as expected. (2) If current and new services, usage patterns, and sales schemes proposed and introduced by our corporate group cannot be developed as planned, or if unanticipated expenses arise the financial condition of our corporate group could be affected and our growth could be limited. (3) The introduction or change of various laws or regulations inside and outside of Japan, or the application of such laws and regulations to our corporate group, could restrict our business operations, which may adversely affect our financial condition and results of operations. (4) Limitations in the amount of frequency spectrum or facilities made available to us could negatively affect our ability to maintain and improve our service quality and level of customer satisfaction and could increase our costs. (5) Other mobile service providers in the world may not adopt the technologies and the frequency bands that are compatible with those used by our corporate group’s mobile communications system on a continuing basis, which could affect our ability to sufficiently offer international services. (6) Our domestic and international investments, alliances and collaborations, as well as investments in new business fields may not produce the returns or provide the opportunities we expect. (7) Malfunctions, defects or imperfection in our products and services or those of other parties may give rise to problems. (8) Social problems that could be caused by misuse or misunderstanding of our products and services may adversely affect our credibility or corporate image. (9) Inadequate handling of confidential business information including personal information by our corporate group, contractors and others may adversely affect our credibility or corporate image. (10) Owners of intellectual property rights that are essential for our business execution may not grant us a license or other use of such intellectual property rights, which may result in our inability to offer certain technologies, products and/or services, and our corporate group may also be held liable for damage compensation if we infringe the intellectual property rights of others. In addition, the illicit use by a third party of the intellectual property rights owned by our corporate group could reduce our license revenues actually obtained and may inhibit our competitive superiority. (11) Events and incidents caused by natural disasters, social infrastructure paralysis such as power shortages, proliferation of harmful substances, terror or other destructive acts, the malfunctioning of equipment, software bugs, deliberate incidents induced by computer viruses, cyber attacks, equipment misconfiguration, hacking, unauthorized access and other problems could cause failure in our networks, distribution channels and/or other factors necessary for the provision of service, disrupting our ability to offer services to our subscribers, and such incidents may adversely affect our credibility or corporate image or lead to a reduction of revenues and/or increase of costs. (12) Concerns about adverse health effects arising from wireless telecommunications may spread and consequently adversely affect our financial condition and results of operations. (13) Our parent company, NIPPON TELEGRAPH AND TELEPHONE CORPORATION (NTT), could exercise influence that may not be in the interests of our other shareholders. Company names, product names, service names, logos and brands included in this document are the trademarks or registered trademarks of NTT DOCOMO, INC., or their respective organizations. iPhone is a trademark of Apple Inc. The iPhone trademark is used under a license from Aiphone K.K.
Special Note Regarding Forward-Looking Statements