Embed Size (px)
Citation preview
1
Resettlement Action Plan
(RAP)
For the Sierra Leone Energy Access Project: Rehabilitation of Sub-Stations and transmission line in Freetown,
Sierra Leone
November 29, 2012
Prepared for: National Power Authority SIERRA LEONE
Power and Water Project (P126180) Ministry of Energy and Power
Project Implementation Unit
Pub
lic D
iscl
osur
e A
utho
rized
Pub
lic D
iscl
osur
e A
utho
rized
Pub
lic D
iscl
osur
e A
utho
rized
Pub
lic D
iscl
osur
e A
utho
rized
Pub
lic D
iscl
osur
e A
utho
rized
Pub
lic D
iscl
osur
e A
utho
rized
Pub
lic D
iscl
osur
e A
utho
rized
Pub
lic D
iscl
osur
e A
utho
rized

2
TABLE OF CONTENTS
1.0 Background ......................................................................................................... 4
2.0 State Of The Route Line ..................................................................................... 7
3.0 Socio – Economic Survey ................................................................................... 7
4.0 Legal Frame Work And World Bank Op 4.12 (Involuntary Resettlement) ..... 62
5.0 Institutional Frame Work .................................................................................. 64
6.0 Eligibility .......................................................................................................... 66
7.0 Compensation ................................................................................................... 68
8.0 Grievance Mechanism ...................................................................................... 73
9.0 Monitoring And Evaluation .............................................................................. 74
10.0 Emerging Issues ................................................................................................ 75
11.0 Conclusions ....................................................................................................... 76
Annex 1: Field Visit Report on Encroachment ............................................................ 77
Annex 2: Clarification on Distribution Line ................................................................ 90
Annex 3: Monitoring Action Plan for Distribution Lines in Freetown, Sierra Leone
Error! Bookmark not defined.

3
LIST OF ABBREVIATIONS
GoSL Government of Sierra Leone
RoW Right of Way
MoEWR Ministry of Energy and Water Resources
MW Megawatts
NPA National Power Authority
kV kilovolts
AGO Diesel oil
MFO Marine fuel oil
IEC International Electricity Commission
ICNRIP International Commission on Non-ionizing
Radiation Protection
kms kilometers
EU European Union
RAP Resettlement Action Plan
PAPs Project affected persons
MLCP Ministry of Lands and Country Planning
RAC Resettlement Advisory Committee
M&E Monitoring and evaluation
FCC Freetown City Council
ONS Office of National Security
HV High voltage
EHV Extra high voltage
XLPE HV cross linked polypropylhene

4
1.0 BACKGROUND
This Resettlement Action Plan (RAP) is an update of the RAP that was
prepared for the Sierra Leone Power and Water project, which closed in March
2011. The RAP Completion Report for the earlier Project was finalized in
November 2011.
The Energy Access Project covers a segment of the distribution network from
the Blackhall Road substation to Wellington substation with large density of
households and commercial activities, most of whom have already received
compensation under the Sierra Leone Power and Water Project with which the
Energy Access Project overlaps in this segment.1 A 13 km-long 11kV section
line, which included the 7.6 km Blackhall Rd-Wellington line, was added
under the old Power and Water project during project restructuring in
December 2007. Although 95% of compensation was paid at that time, a
portion of the upgrade of 11kV transmission lines was not completed under
the old project. This 7.6 km. unfinished portion is the segment of the 11kV
network between the Blackhall Road and Wellington sub-stations that is to be
rehabilitated and upgraded to 33 kV under the proposed Energy Access
Project. It is expected that there will be few Project Affected Persons (PAPs)
in the Energy Access project, or, that the amounts of compensation will be
relatively small because they are primarily for temporary disturbances during
project implementation of the rehabilitation of the 7.5 km section of the
distribution network between the Blackhall Roadand Wellington sub-stations.
Nevertheless, the Government of Sierra Leone has decided to prepare an
updated RAP in case there are any resettlement/compensation issues,
especially for temporary disturbances, along the Blackhall Road – Wellington
line to be rehabilitated under this Project.
The Energy Access project includes the following three components:
Component I: Rehabilitation of Primary Distribution Network, Loss
Reduction and Improvement of NPA’s Operational and Commercial
Performance (US$12.200 million)2. This component envisages multiple
investment and technical assistance activities. The Project has identified
priority investments in network upgrade including the provision of additional
161/33kV transformer and a 33kV earthing transformer at Freetown
substation. Further investments will focus on the upgrading of other critical
components of the primary MV network, including the 33kV upgrade of the
line from Blackhall Road to Wellington substations, currently operated at
11kV; a 33/11kV transformer at Wellington substation, a 5MVA transformer
1 This updated RAP may contain some information pertaining to the entire scope of lines covered under
the earlier Power and Water Project. It should be emphasized that the Energy Access project proposed
supports rehabilitation of the line between the Wellington and Blackhall Road sub-stations, which is
only a part of the network intended to be covered under the Power and Water project. 2 Cost estimate exclude contingencies.
5
at the Portii sub-station, and related substation equipment at Freetown,
Blackhall Road, Wellington, Portii and Wilberforce substations.
The focus of these upgrades is to: (i) improve evacuation capacity from the
16.5 MW Blackhall Road thermal power station during times when
insufficient hydropower is available from Bumbuna; (ii) reduce overloading
and hence technical losses; and (iii) improve network reliability and hence
reduce the number of service interruptions. All these distribution system
rehabilitation investments have been appraised as suitable for significantly
improving network evacuation capacity, reducing technical losses and
improving system reliability.
The investments in the distribution network will raise its transfer capacity by
approximately 8MW. In addition, the Project will finance supply and
installation of approximately 20,000 pre-paid meters as well as an appropriate
vending and control system to replace the current aging system. Since NPA
currently has no means of precisely locating high loss areas in the network, the
Project will also finance supply and installation of a statistical metering and
data management system. Finally, an appropriate business information system
will be installed to replace manual systems and improve utility management,
particularly in the financial, commercial and logistics areas. Investments in
each area will be complemented with extensive technical assistance to ensure
optimal application of the investment support. Additional technical assistance
will focus on strengthening NPA’s expertise in two key areas: (i) operations,
through focused training on system operation with an emphasis on operating
regulations and safety; and (ii) commercial management, by providing support
to the implementation of the loss reduction program.
A handful of encroaching structures have been identified inside the RoW
along the Blackhall Road-Wellington line, posing safety issues, and could be
eligible for compensation, if they were inside the RoW as of the end of March
2012 and not previously compensated under the Power and Water Project.
Compensation related to such encroaching structures, if any, would be payable
through funds made available through the Energy Access Project.
In order to address these encroachments, as well as future possible
encroachments along the Blackhall Road-Wellington line, the GoSL has set up
an inter-ministerial sub-committee comprising of representatives from the
Ministry of Land, Country Planning and Environment; Works, Housing and
Infrastructure; and Information and Communications. Additionally, the Office
of National Security (ONS) and the Police under Freetown City Council have
been asked to assist the committee especially throughout enforcement of the
regulations governing land uses inside the RoW. An Environmental and Social
Development Specialist will be hired under the Project to oversee
environmental and social management. The Project also envisages technical
assistance to ensure risk mitigation; and build capacity for monitoring of the
RoW, with a view to reduce the impacts from encroachments and land uses
that may negatively affect the operation of distribution facilities
6
The specific activities involved in the completion of the distribution network upgrade
will also include replacement of two sets of poles along the line track between the
Blackhall Road and Wellington substations and installation of other three sets of poles
(one set at the Blackhall Road substation, one set at the Wellington substation and
another set along the line track). This will require some excavation and cement works
as described below:
Excavation – excavations are carried out to lay foundations for pole pads.
Some of the excavated soil is used to backfill as necessary.
Concrete works – concrete works for the foundations and footings are carried
out as required.
In relation with the stringing of the 33kVlines, – in most cases, lines are strung
by manual labour. The minimum clearance of the lines to ground is about 6 m
at the lowest point of sag and this increases to about 7 – 9 m in way of road
crossings. The RoW for 33 kV lines spans a width of 10 (5 m on either side of
the contreline) In built up urban settlements this space may be reduced in
certain situations due to space constraints.
Prior to commencement of construction and stringing, there is the need to
sensitize the public in the project areas to obtain their cooperation and to avoid
disruption to its smooth implementation.
Component II: Rural Electrification (US$1.460 million). This component will
launch a pilot program for the installation of PV systems in public buildings in
14 rural villages, to demonstrate applicability of the solar technology for larger
deployment. Villages have been selected by the Ministry of Energy and Water
Resources and the Ministry of Local Government and Rural Development
from each administrative district, based on gender diversity, number of public
buildings where the PV systems can be installed and road accessibility. The
development of small-scale decentralized solar power supply in rural areas has
been included by the GoSL’s in the National Energy Policy and Strategic Plan.
Also, a roadmap for scaling-up renewable energy technologies (RETs) and
markedly solar power has been identified. The pilot installation of PV systems
is expected to complement current efforts by other donors as well as to
leverage wider donor support to the GoSL’s long-term program of rural
electrification using solar energy. In the short term, this component promises
high returns in terms of improved living standards for the populations of the
villages targeted under the Project.
Component III: Project Implementation Management (US$1.225 million).
This component has been specifically designed to strengthen project
implementation and management capacity. The component will finance
external expertise that will support key project management functions.
7
This RAP has been prepared to address any potential resettlement issues in
Component I. Components II and III will not involve any land acquisition
leading to resettlement and/or restrictions of access to resources or livelihoods.
1.1 Sensitization
In the Power and Water project, the Government and PAPs decided that:
the PAPs take ownership of the project by fully participating in the
implementation process;
three main committees be formed which would include representatives
of Government Ministries and the City Council of Freetown. These
were:
The Resettlement Advisory Group (RAG)
The Grievance Committee, and,
The Monitoring Committee
Land should be provided by the Government to resettle Project
Affected Persons.
The Witness NGO and PAPs Representatives will monitor the work of
the consultant(s).
2.0 STATE OF THE ROUTE LINE
In the Power and Water project, some of the transmission line towers were relocated
to minimise the impact of the line on the settlements. The heights of the towers or
span above the settlements were also increased, as an additional safety measure. The
line between the Blackhall Road and Wellington sub-stations runs across Kissy and
Wellington Townships which are densely populated and centers of commercial
activity.
3.0 SOCIO – ECONOMIC SURVEY
As Component I of the Energy Access project overlaps with the project area of the
Power and Water project between the Blackhall road and Wellington sub-stations, this
RAP includes the socio-economic survey work that was prepared for the Power and
Water project.
The socio-economic survey was conducted during which PAPs were interviewed, plus
a sample of non-PAPs households. A census was done and a socio-economic profile
of the PAPs was recorded. Three sets of questionnaires were administered;
Asset Owner
8
Tenants
Community (General)
This was followed by community meetings and face to face discussions of their social
and economic lives. In general the survey found that the average income levels of the
communities were low and income generation activities were also limited. Living
conditions of PAPs were equally low. A picturesque of the environment portrayed an
area devoid of certain basic social amenities.
3.1 Objective of the Survey
i. To inform the PAPs about the changes in reviewed RAP Implementation
Project
ii. To inform and educate them about the low mitigating impact of the
Transmission Line on the communities.
iii. Establish that compensation was specifically for those directly affected by the
Project i.e. those whose lands have been occupied and portions of their
structures Affected.
iv. Estimate the level of income generation.
v. Determine the status of the Environment.
The Socio-economic survey covered the entire route line which reflected both affected
and non-affected persons so as to present a broad picture of the situation on the
ground.
At the end of the survey, it was noted that with the diversion of the Route of the
Transmission Line, the number of affected Persons and structures drastically reduced.

9
3.2 Results of Statistical Analysis of Asset Owners
Frequencies of Analysis: Section 1 Bio-Data
Household Size
Frequency Percent
Valid 2 1 2.3
3 3 6.8
4 2 4.5
5 7 15.9
6 5 11.4
7 6 13.6
8 4 9.1
9 1 2.3
10 2 4.5
12 1 2.3
13 3 6.8
19 1 2.3
Total 36 81.8
N/A 8 18.2
Total 44 100.0
According to results of the survey, a total number of 138 households were
interviewed. Of these, 44 of them were recorded as Asset Owners, and 94 as Tenants.
Of the total number of Asset Owners, 2 respondents of a household size which shows
a frequency of 1, records 2.3%. 3 of the household sizes show a frequency of 3 with
6.8%, 5 responses record a frequency of 7 which accounts for 15.9%, and 4 with a
frequency of 2, amounting to 4.5%.
A frequency of 5 reflects household sizes of 6 which record a percentage of 11.4%.
Further still, survey records reveal that households sizes of 7 record a frequency of 6
which make up for 13.6%, while those of 8 with a percentage of 9.1% show a
frequency of 4. However, 9 responses with a frequency of 1 equally record 2.3%.
Not surprisingly, household sizes of 10 show a frequency of 2 with 4.5%. The
frequency of 1 is also recorded for a size of 12 which equally account for 2.3%. In
spite of this range, household sizes of 13 show a frequency of 3 culminating to a
percentage of 6.8%, closely following in line with households of 19 which also reflect
a frequency of 1 and a percentage of 2.3% which is so far the lowest, while There
were no responses (N/A) from a frequency of 8 which account for 18.2%.

10
Sex Distribution
Frequency Percent
FEMAL
E 10 22.7
MALE 34 77.3
Total 44 100.0
Statistical results of the survey show that in the sex distribution, the numbers of men
are dominant among Asset Owners. This obviously records a high percentage of 77.3
with a frequency of 34, while the female distribution rests at 22.7% with a frequency
of 10 far below that of the men.

11
Age Frequency
Frequency Percent
Valid 28 1 2.3
33 2 4.5
35 2 4.5
37 1 2.3
40 3 6.8
41 1 2.3
42 1 2.3
45 6 13.6
46 1 2.3
50 1 2.3
52 2 4.5
53 1 2.3
54 1 2.3
55 3 6.8
56 2 4.5
57 1 2.3
58 1 2.3
60 1 2.3
73 1 2.3
76 1 2.3
Total 33 75.0
N/A 11 25.0
Total 44 100.0
According to the survey, age differences among Asset Owners range from 28 Years to
76 Years which indicates that age disparity is from the youngest to the oldest. The age
groups of 28, 37, 41, 42, 46, 50, 53, 54, 57, 58, 60, 73 and 76 reflect a low percentage
of 2.3% with a frequency of 1 to each. A percentage of 6.8% in a frequency of 3
records the ages of 40 and 55 Years. A group of people also reflect 13.6% with a
frequency of 6 at the age of 45 Years. Those in the middle ages of 33, 35, 52 and 56
Years with a frequency of 2, each reflects a percentage of 4.5% in every case. The age
group of 55 records a percentage of 6.8 with a frequency of 3. A non applicable group
of respondents account for 25.0% with a frequency of 11.

12
Present Marital Status
Frequency Percent
INFORMAL/LOOSE
UNION 1 2.3
MARRIED 35 79.6
NA 2 4.5
NEVER MARRIED 4 9.1
WIDOWED 2 4.5
Total 44 100.0
In a bid to establish their marital statuses, those who are formally married record a
percentage of 79.6 with a frequency of 35 which reflects the highest percentage of the
kind of relationship. Others engaged in informal and loose/Union show a frequency of
1 only, with 2.3% which is the lowest so far. A frequency 4, shows a percentage of
9.1% of those who had not been married. Widows rate a frequency of 2 with 4.5%.
No responses (N/A) were available from a frequency of 2 to 4.5%.
Regional Background
Frequency Percent
EASTERN 1 2.3
NA 1 2.3
NORTHERN 17 38.6
SOUTHERN 1 2.3
WESTERN
AREA 24 54.5
Total 44 100.0
The survey equally reveals that 54.5% with a frequency of 24 of the Asset Owners
hail from Freetown – Greater Freetown, (Western Area) which is the highest
percentage recorded in terms of regional basis. These are closely followed by those
from the Northern Region with a frequency of 17 and 38.6%. 0f these, the Eastern and

13
Southern Regions record the lowest frequencies of 1 each with the same percentages
of 2.3 which are the lowest. However, no response was received from 1 frequency
with a 2.3%.
Nationality
Frequency Percent
Valid NON SIERRA
LEONEAN 6 13.6
SIERRA
LEONEAN 38 86.4
Total 44 100.0
In terms of nationality, Sierra Leones are in the majority which records a frequency of
38 and a percentage of 86.4%. Non Sierra Leoneans reflect a percentage of 13.6 in a
frequency of 6.
Ethnic Groupings
Frequency Percent
FULLA 2 4.5
KONO 1 2.3
KORANK
O 1 2.3
KRIO 7 15.9
LIMBA 16
36.4
LOKO 2 4.5
MENDE 5 11.4
SUSU 2 4.5
TEMNE 8 18.2
Total 44 100.0

14
Among the Ethnic groups, the Limbas form the majority culminating in to the highest
frequency of 16, which accounts for 36.4% of their number. Behind them are the
Temnes who equally form 18.2% with a frequency of 8. Although these two Ethnic
groups outnumber the Krios who hail from the Western Area, they make a mark by
recording 15.9% with a frequency of 7, who are third in the row. The Mendes from
the far South and East make up for 11.4% to a frequency of 5. The Konos and
Korankos are in the minority in the frequencies of 1 each amounting to equal
percentages of 2.3% of either group. The Fullas, the Lokos and the Susus form a fairly
recognizable group each with a frequency of 2 accounting for 4.5% each.
Frequencies of Analysis: Section 2 Livelihood
Having provided a detailed account of the various situations of Asset Owners, it is
worthy of note to also state that considerable attention was also focused on livelihood
and income generation activities.
In general, the survey established that though Asset Owners are engaged in various
economic activities, they are living in adject poverty and deprivation. The study also
proves that income levels are low culminating from limited income generation
activities of the property owners.
Limited resources has hampered developments in the Community. This is one of the
factors that is responsible for the absence of social cohesion among the people as well
as individual progress.
These financial constraints have affected the lives of the people to such an extent that
some of them could hardly send their children to school, let alone afford to pay their
children’s medical bills. It is quite obvious that in such a situation, the people virtually
continue to live in appalling conditions.
15
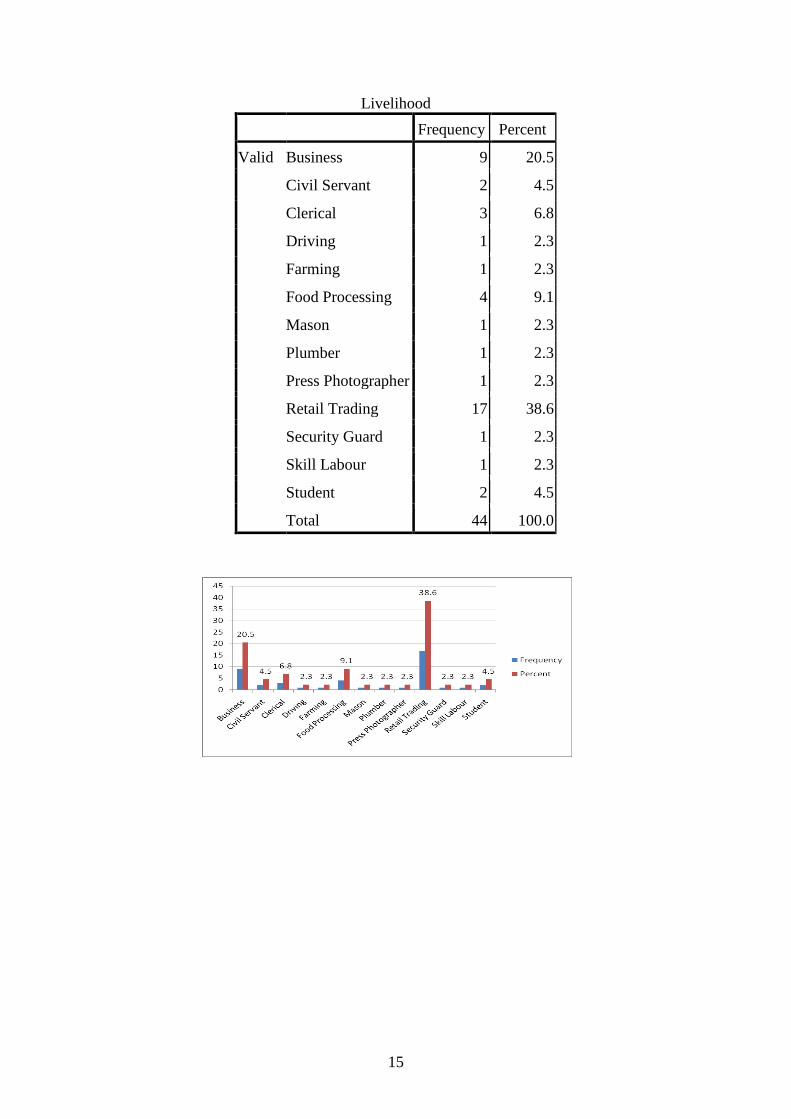
Livelihood
Frequency Percent
Valid Business 9 20.5
Civil Servant 2 4.5
Clerical 3 6.8
Driving 1 2.3
Farming 1 2.3
Food Processing 4 9.1
Mason 1 2.3
Plumber 1 2.3
Press Photographer 1 2.3
Retail Trading 17 38.6
Security Guard 1 2.3
Skill Labour 1 2.3
Student 2 4.5
Total 44 100.0

16
Similar to the Tenants, 38.6% with a frequency of 17 of the Asset Owners are
engaged in Retail Trading. 20.5% from a frequency of 9 are also in businesses of
various sets. 9.1% with a frequency of 4 are into food processing. Those who are
equally serving in various capacities in clerical jobs, lie at a level of 6.8% with a
frequency of 3.
Civil Servants account for 4.5% with a frequency of 2, as well as Students who also
account for the same percentage and frequency.
Those Asset Owners who are engaged in Driving, Farming, Masonry, Plumbing and
Press Photography, as well as Security Guards and Skilled Labour are all rated at
2.3% with frequencies of 1 to each of them.
Frequencies of Analysis: Section 3 General Educational, Literacy and
Apprenticeship
Level of Education Attained
Frequency Percent
NA 4 9.1
NONE 1 2.3
PRIMARY 5 11.4
SECONDAR
Y 22 50.0
TERTIARY 12 27.2
Total 44 100.0
Among other things, it was recorded that the population is fairly literate with different
levels of education, ranging from Primary, secondary and Tertiary. It was therefore
noted that 50% attained Secondary Education, with a frequency of 22. 27.2% in a
frequency of 12, attained Tertiary level of education, whilst 11.4% with a frequency
of 5, only stopped at Primary level, it could be seen that survey records reflect those
of Secondary School education as the highest, the lowest show those with Primary
Education. There were however some without any educational background who
accounted for 2.3% with a frequency of 1. Of those without responses (N/A) a
frequency of 4 is recorded with a percentage of 9.1.

17
Literacy Level
Frequency Percent
NO 32 72.7
YES 12 27.3
Total 44 100.0
As a means to enhance their levels of education, 27.3% with a frequency of 12 were
able to attend literacy courses. Of a frequency of 32 with a percentage recording of
72.7% of the asset owners could not attend literacy courses.
Ability to Read and Write a Simple Letter in English
Frequency Percent
NO 6 13.7
YES 38 86.3
Total 44 100.0
Invariably, a reasonably high percentage of 86.3 with a frequency of 38 can read and
write simple English, 13.7% of a frequency of 6 cannot read or write.
Aptitude to do Simple Calculations
Frequency Percent
NO 5 11.4
YES 39 88.6
Total 44 100.0
In near corresponding frequency of 39, 88.6% of them can also do simple calculations
whilst 11.4% with a frequency of 5 cannot.

18
Apprenticeship
Frequency Percent
NO 29 65.9
YES 15 34.1
Total 44 100.0
In a bid to enhance their personal capacities, it is recorded that 34.1% in a frequency
of 15 have been through some form of apprenticeship over the years. A frequency of
29, which accounts for 65.9% have never gone through any process of formal training
or apprenticeship.
Frequencies of Analysis: Section 4 Health Conditions in Past 2 Weeks
Health Condition, Illnesses and Injuries
Frequency Percent
BOTH 2 4.5
ILLNESS 17 38.6
INJURY 1 2.3
NA 7 15.9
NEITHE
R 17 38.7
Total 44 100.0
During the course of the survey, access to health and other Social facilities was of
significance. In this situation, it was noted that there had been health hazards in the
communities, which shows that 38.6% with a frequency of 17 have suffered from
various illness. A low level of 4.5% in a frequency of 2 has suffered from both
illnesses and injuries. It is however encouraging to record that the lowest percentage
of 2.3% with a frequency of 1 suffers from injury. However, a percentage recording of
38.7 from a frequency of 17 have neither suffered from any illness or injury. There
were no responses (N/A) from a frequency of 7 with a percentage of 15.9.

19
Type of Injury
Frequency Percent
ACCIDEN
T 9 20.4
NA 35 79.6
Total 44 100.0
However, recordings show that a frequency of 9, which reflects 20.4% have suffered
from accidents. No responses were received from a frequency of 35 with a percentage
of 79.6.
Type of Illnesses
Frequency Percent
COMMON
COLD/FLU 1 2.3
DIARRHOEA 1 2.3
HYPERTENSION 1 2.3
MALARIA 13 29.5
MALARIA/TYPH
OID 7 15.9
NA 19 43.2
TYPHOID 2 4.5
Total 44 100.0
A track of the illnesses shows that malaria appears to be more harmful to the populace
which records a percentage of 29.5% with a frequency of 13. The highest of the
illnesses though, is recorded from a combination of malaria and typhoid which is most
common in the communities, and stands at 15.9% and a frequency of 7. Typhoid all
by itself affects only 4.5% of them with a frequency of 2. In the face of this
development, it is recorded that Common Cold and Flu, Diarrhea and Hypertension
fall to the lowest of the percentages recorded to as low as 2.3% with a frequency of 1
in each case. No responses (N/A) were recorded from a frequency of 19 with a
percentage of 43.2.
Period of Consultation (Treatment)
Frequency Percent
1 WEEK 2 4.6
2 WEEKS 21 47.8
NA 21 47.7
Total 44 100.0

20
Survey records also reflect that in a frequency of 2, 4.6% of the populace are treated
within a week while a frequency of 21 records 47.7% of those who are treated in two
weeks or diagnosed as the case may be. Unavailable responses reflect a frequency of
21 with a percentage of 47.7.
Reasons for Medical Consultation
Frequency Percent
CHECK UP 6 13.6
ILLNESS 14 31.8
NA 23 52.3
POSTNATAL
CARE 1 2.3
Total 44 100.0
A frequency of 6, with a percentage 13.6 can afford to do checkups, while a frequency
of 14 with a percentage of 31.8 do visit when they suffer from an Illness. Others who
visit Postnatal Care account for 2.3% from a frequency of 1. Unavailable responses
record a frequency of 23 with 52.3%.
Consultations from Medical Specialist
Frequency Percent
DOCTOR 7 15.9
MEDICAL
ASSISTANT 2 4.5
NA 7 15.9
NURSE 2 4.5
PHARMACIST 2 4.5
SELF 1 2.3
TRADITIONAL
HEALER 23 52.4
Total 44 100.0
However, based on income levels and educational background, or enlightenment,
some of the people are able to discern the right kind of treatment for the type of illness
they suffer from. Others hardly seek medical help but rather depend on traditional
medicines from local herbalist, private nurses in their homes, or simply seek help
from local pharmacies.
Not surprisingly, the highest percentages of 52.4% in a frequency of 23 seek treatment
from Traditional Healers. Notwithstanding that, 15.9% of a frequency of 7 seeks

21
medical advice from professional medical Doctors. Others in frequencies of 2 in every
case, with a percentage recording of 4.5% rely on Nurses, Pharmacists and Medical
Assistants. Some of them who rely on treating themselves make up for 2.3% in a
frequency of 1. Apparently, this accounts for the reasons why there are poor health
conditions among the populace. There were no responses from a frequency of 7 with a
percentage of 15.9.
Length of Illnesses
Frequency Percent
NA 2 4.5
OFTEN 7 15.9
SELDOM 32 72.8
VERY
OFTEN 3 6.8
Total 44 100.0
In spite of this prevailing situation, many of them appear to be resistant to health
hazards since 72.8% in a frequency of 32, seldom fall sick or ill, which records the
highest so far. However, 6.8% of a frequency of 3 very often fall Ill, while an upsurge
of 15.9% in a frequency of 7 experiences those who often fall ill. Non available
responses account for 4.5% from a frequency of 2.
Vaccination of Children Against Diseases
Frequency Percent
NA 7 15.9
NO 2 4.5
YES 35 79.6
Total 44 100.0
Although, there is a high degree of resistance, precautionary and preventive measures
are taken to protect children from various diseases. Consequently, a remarkable

22
percentage of 79.6% of the children are vaccinated from a frequency of 35. Those
who do not take responsibility to vaccinated their children account for 4.5% from a
frequency of 2. Non available responses register a percentage of 15.9 with a frequency
of 7.
Vulnerable Persons from Disabilities
Frequency Percent
Valid YES 7 15.9
NO 37 84.1
Total 44 100.0
The survey also focused on vulnerable persons particularly those with long
disabilities. This however records an encouraging percentage of 84.1% in a
frequency of 37, without disabilities. A reasonable percentage of 15.9% in a
frequency of 7 are disabled.

23
Frequencies of Analysis: Section 5 Housing
Type of Dwelling Living in?
Frequency Percent
APARTMENT/FLAT 8 18.9
CHURCH 1 2.3
COMPOUND HOUSE
(ROOMS) 17 36.9
EMPTY LAND 2 4.8
NA 6 13.9
SEVERAL HUTS IN
SAME COMPOUND 1 2.3
SINGLE FAMILY
HOUSE/HUL 9 20.9
Total 44 100.0
Accommodation in these settlements is of paramount importance. It is however
worthy of note that the area covered in this survey, is not a well structured or
developed environment with the required or necessary facilities in place.
The type of dwellings, range from compound structures with considerable numbers of
single rooms to households, to hurts/shanty structures in a compound. Some
households however reside in private apartments. Many of the structures are
constructed with a combination of Cement, Zinc, Mud and Sand.
The study therefore establishes that a frequency of 9 of single family households
record a high percentage of 20.9. However, a rising frequency of 17 signifies that
36.9% of them dwell in compound houses with single rooms to a household. An
impressive percentage of 18.9% in a recurring frequency of 8 live in apartments. Yet
still, those living in hurts/shanty structures in a compound, account for as low a
percentage as 2.3 with a frequency of 1, along side a church with the same percentage
and frequency. Vacant/empty lands account for 4.8% with a frequency of 2 in its
case. Non applicable responses account for a frequency of 6 with 13.9%.

24
Present Occupancy Status
Frequency Percent
CARE TAKER 1 2.3
NA 6 13.6
OWNING 35 79.6
RENTING FREE
DWELLING 2 4.5
Total 44 100.0
Among those interviewed, 79.6% of them in an occurring frequency of 35, personally
own their properties. 2.3% with a recurring frequency of 1 are Caretakers, while 4.5%
from a frequency of 2 are Renting/Free dwelling. Non applicable responses account
for 13.6% from a frequency of 6.
25
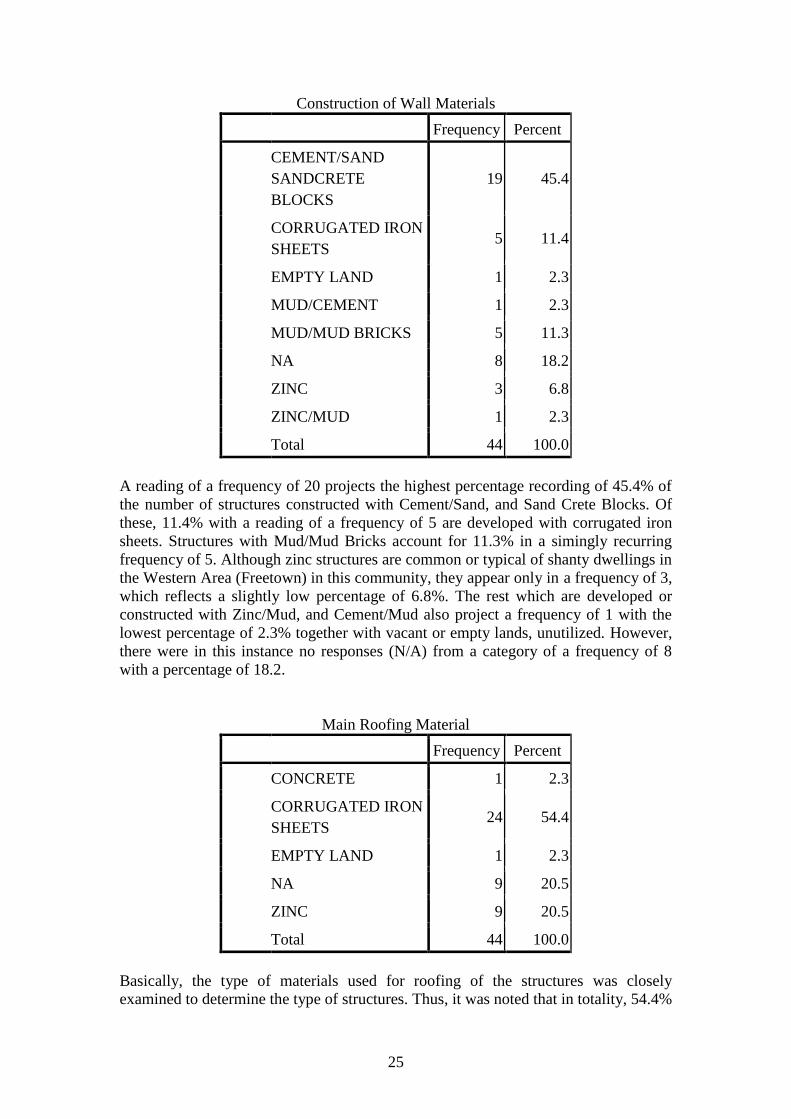
Construction of Wall Materials
Frequency Percent
CEMENT/SAND
SANDCRETE
BLOCKS
19 45.4
CORRUGATED IRON
SHEETS 5 11.4
EMPTY LAND 1 2.3
MUD/CEMENT 1 2.3
MUD/MUD BRICKS 5 11.3
NA 8 18.2
ZINC 3 6.8
ZINC/MUD 1 2.3
Total 44 100.0
A reading of a frequency of 20 projects the highest percentage recording of 45.4% of
the number of structures constructed with Cement/Sand, and Sand Crete Blocks. Of
these, 11.4% with a reading of a frequency of 5 are developed with corrugated iron
sheets. Structures with Mud/Mud Bricks account for 11.3% in a simingly recurring
frequency of 5. Although zinc structures are common or typical of shanty dwellings in
the Western Area (Freetown) in this community, they appear only in a frequency of 3,
which reflects a slightly low percentage of 6.8%. The rest which are developed or
constructed with Zinc/Mud, and Cement/Mud also project a frequency of 1 with the
lowest percentage of 2.3% together with vacant or empty lands, unutilized. However,
there were in this instance no responses (N/A) from a category of a frequency of 8
with a percentage of 18.2.
Main Roofing Material
Frequency Percent
CONCRETE 1 2.3
CORRUGATED IRON
SHEETS 24 54.4
EMPTY LAND 1 2.3
NA 9 20.5
ZINC 9 20.5
Total 44 100.0
Basically, the type of materials used for roofing of the structures was closely
examined to determine the type of structures. Thus, it was noted that in totality, 54.4%

26
with a sharp frequency of 24 shows that structures are roofed with corrugated iron
sheets. The structures which are covered with Zinc make up for 20.5% rating a
frequency of 9. Structures with concrete roof floating account for the lowest
percentage of 2.3 with a similarly recorded frequency of 1 in its case. Unutilized
lands (Vacant) also account for 2.3% from a frequency of 1, while the non applicable
ones register a frequency of 9 for a percentage of 20.5.
Main Flooring Material
Frequency Percent
CEMENT/CONCRE
TE 33 75.0
EMPTY LAND 1 2.3
NA 8 18.2
STONE/BRICK 2 4.5
Total 44 100.0
In this report, as the recordings show, a recurrence of a frequency of 33 provides that
75.0% of the floors of the structures are smothered with cement concrete. Other
structures account for 4.5% of the floors that are made of stone/Brick, reflecting a
frequency of only 2. Unutilized pieces of land which lie vacant, make up for 2.3%
with a frequency of 1. Non applicable ones register a frequency of 8 to a percentage of
18.2.
Type of Toilet Facility
Frequency Percent
COMMON
PIT 21 47.8
FLUSH 6 13.6
NA 11 25.0
PRIVATE
PIT 6 13.6
Total 44 100.0
Along these lines, it was observed that toilet facilities are not only limited, but also
appalling. It was not a surprise therefore to see that 47.8% of the people use common
pit toilets, (outside toilet) which show a frequency reading of 21. An affordable cadre
of persons in this group reflect that 13.6% of them in a frequency recording of 6 use
flush toilets, while those who use private pit toilets also register a percentage of 13.6
with a frequency of 6. In this regard non applicable ones however recorded a
frequency of 11 to a percentage of 25.0.

27
Period of Occupation of Residence
Frequency Percent
INHERITAN
CE 11 25.0
LEASED 2 4.5
NA 8 18.2
PURCHASE 23 52.3
Total 44 100.0
Acquisition of property in the Western Area over the years had been either through
construction from personal savings, by inheritance or by purchase. The survey records
that in consonance with the analysis, a given frequency of 23 signifies that 52.3% of
the properties were purchased. Those properties that had been inherited stand at
25.0% with a frequency of 11. However, a frequency of 2 establishes that 4.5% of the
properties were leased. In this case, there were no responses from 18.2% of the asset
owners with a return of a frequency of 8.
Frequencies of Analysis: Section 6 Utilities and Amenities
Main Source of Drinking Water
Frequency Percent
LAKE/SPRINGS 1 2.3
NA 5 11.4
PIPE BORNE 1 2.3
PRIVATE STAND
PIPE 1 2.3
PUBLIC STAND PIPE 22 50.0
WATER WELL WITH
PUMP 6 13.6
WATER WELL
WITHOUT PUMP 8 18.1
Total 44 100.0

28
As expressed earlier, facilities such as water and electricity are extremely limited, and
quite in contrast with the sharp increase of the population in the settlements. It was
however recorded that 50.0% of the population of a given frequency of 22 highly
depend on public stand pipes which are the main sources of Water. A frequency of 8
reads that 18.1% of the people also rely on Water wells without pumps for Water. An
impressive percentage of 13.6% in a given frequency of 6, are dependent on Water
Wells with Pumps. A reliable number ranging down to 2.3% with similar occurrence
of frequencies of 1 respectively, access water from Lakes, Springs, Pipe Borne Water
and Private Stand Pipes. A non applicable frequency of 5 with 11.4% was also
recorded.
Distance from Source of Water Supply
Frequency Percent
1 METRE 5 11.4
1 MILE 1 2.3
10 METRE 1 2.3
100
METRE 11 25.1
15 METRE 2 4.5
200
METRE 4 9.1
30 METRE 4 9.1
32 METRE 1 2.3
40 METRE 2 4.5
400
METRE 1 2.3
50 METRE 3 6.8
NA 9 20.3
Total 44 100.0
As it stands to reason, distance to sources of water also counts in this respect. In this
regard, some of the people are quite a distance away from the source of water, others
who are near or nearer as the case may be, while some are also half way in-between.
In a given situation as this, a frequency of 11 of them signifies that 25.1% are 100
meters from the source of Water. 9.1% in a frequency of 4 are 200 meters away from
the source, much the same as those 30 meters away respectively, with a percentage of
9.1 and a frequency of 4. Those who are 15 meters and 40 meters make up for 4.5% in
frequencies of 2 of each. People who are away from the source of Water from 50
meters account for 6.8% with a frequency of 3. Some who also reside about a mile

29
away show a frequency of 1 with a percentage of 2.3. Equally so, those who reside 1
meter from the source of Water make up for 11.4% with a frequency of 5. Others who
are 10 meters as well as those who are 32 and 400 meters account for 2.3% each with
frequencies of 1 to each. However, non applicable responses show a frequency of 9 to
a percentage of 20.3%
Purchase of Water
Frequency Percent
NO 6 11.4
YES 38 88.6
Total 44 100.0
Evidently, responses from the survey shows that there is an acute shortage of water
supply in the area concerned. It is therefore not surprising that in a frequency of 38 an
exceedingly high percentage of 88.6% actually purchase water. An 11.4% class in a
frequency of 6 cannot afford to purchase water.
Sources of Light into Dwellings
Frequency Percent
ELECTRICITY 26 59.1
GENERATOR 1 2.3
KEROSENE 9 20.5
NA 8 18.1
Total 44 100.0
In terms of accessibility to light for dwelling, a considerable number of people now
have access to electricity supply. At least a frequency of 26 express that 59.1% of the
people enjoy electricity supply. Notwithstanding this development however, 20.5% of
the people still depend on the use of Kerosene to provide light in a given frequency of
9. A surprisingly low drop of percentage of 2.3 with a recurring frequency of 1 still
use generators for light. In this regard, a non applicable category shows a frequency of
8 and a percentage of 18.1.

30
Fuel Used by Household for Cooking
Frequency Percent
CHARCOAL 34 77.2
GAS 1 2.3
ELECTRICITY 1 2.3
FIREWOOD 1 2.3
NA 7 15.9
Total 44 100.0
Equally so, a far higher number of 77.2% of a frequency of 34 depend on the use of
charcoal for cooking. Except for this level, the rest who rely on Gas, Electricity and
Fire Wood account for a down ward trend of 2.3% with recurring frequencies of 1
each. A non applicable group records a percentage of 15.9 from a frequency of 7.
3.3 Results of Statistical Analysis of Tenants
Frequencies of Analysis: Section 1 Bio-Data
Household Size
Frequency Percent
Valid 1 1 1.1
2 10 10.6
3 20 21.3
4 18 19.1
5 18 19.1
6 10 10.6
7 7 7.4
8 1 1.1
9 3 3.2
10 1 1.1
11 1 1.1
12 1 1.1
Total 91 96.8
N/A 3 3.2
Total 94 100.0

31
In analyzing the results of the survey, it is established that tenants equally play a
significant role in the life of the community. In some respects, tenants provide the
basic and dependable source of income for Asset Owners who rely solely on rent paid
by tenants for their livelihood. This has been noted since the beginning of the entire
process of the Resettlement Action Plan. For the purpose of the survey, out of the
recorded number of 94 Tenants from a random sample size method adopted,
households of tenants basically range from very small family units to large ones. In
this survey, it is recorded that 21.3% of a frequency of 20 register the highest
percentage of Tenant households of 3. 19.1% with a frequency of 18, reflect
households of 4 and 5.
Those who lie at 10.6% from a frequency of 10, register those of 2 and 6 in a
household. Households of 7 register a percentage of 7.4% with a frequency of 7.
Households of 9 present a frequency of 3 with a percentage of 3.2. The rest of which
make up for 1.1% with a frequency of 1, account for households of 1, 8, 10, 11, and
12, which is the lowest percentage recording of the survey. Respondents of a non
applicable category record a percentage of 3.2 with a frequency of 3.
Sex Distribution
Frequency Percent
Valid FEMAL
E 34 36.2
MALE 60 63.8
Total 94 100.0
In these groupings, it is experienced that there is a male dominant factor, whereby
men account for 63.8% from a frequency of 60. Even so, the female percentage
reasonably stands at 36.2 from a frequency of 34.
32
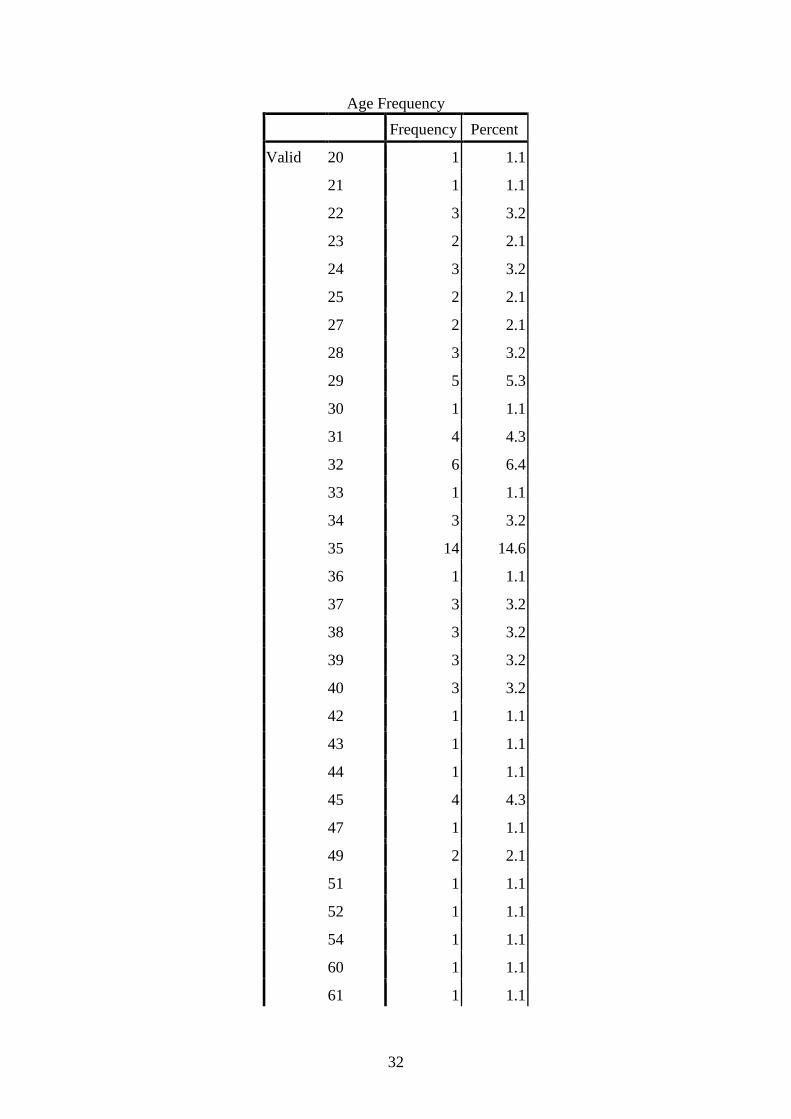
Age Frequency
Frequency Percent
Valid 20 1 1.1
21 1 1.1
22 3 3.2
23 2 2.1
24 3 3.2
25 2 2.1
27 2 2.1
28 3 3.2
29 5 5.3
30 1 1.1
31 4 4.3
32 6 6.4
33 1 1.1
34 3 3.2
35 14 14.6
36 1 1.1
37 3 3.2
38 3 3.2
39 3 3.2
40 3 3.2
42 1 1.1
43 1 1.1
44 1 1.1
45 4 4.3
47 1 1.1
49 2 2.1
51 1 1.1
52 1 1.1
54 1 1.1
60 1 1.1
61 1 1.1

33
66 1 1.1
Total 80 85.1
N/A 14 14.6
Total 94 100.0
According to survey records, age differences among tenants appear to emerge from 20
years which is the youngest to 66 years which is the oldest. In this regard, 14.6% of a
frequency of 14, are at the age of 35. 6.4% of a frequency 6, are 52 years of age, while
5.3% of the number which show a frequency of 5, are 29 years old.
A percentage of 2.1 with a frequency of 2 account for those in the age groups of 23,
25, 27 and 49.
Of the total number, tenants aged 31 and 45 years account for 4.3% with a frequency
of 4 each. Tenants at the ages of 22, 24, 28, 34,37,38,39 and 40 record a percentage of
3.2% with a recurrence of a frequency of 3 along the line.
Some in the youthful ages of 20, 21, 30, 33, 36, 42, 43, 44, 47 make up for 1.1% of a
frequency of 1, just as those in the middle ages of 51,52, 54, 60 and 61 , as well as
the oldest of 66 years. A non applicable percentage of 14.6 account a frequency of 6.
Present Marital Status
Frequency Percent
Valid DIVORCED 2 2.1
INFORMAL/LOOSE
UNION 1 1.1
MARRIED 71 75.6
NA 1 1.1
NEVER MARRIED 10 10.6
SEPARATED 7 7.4
WIDOWED 2 2.1
Total 94 100.0

34
The survey records also show that 75.6% with a frequency of 71 of the tenants are
married while 10.6% from a frequency of 10 are not married. The divorced account
for 2.1% in a frequency of 2, with those separated at a percentage of 7.4 with a
frequency of 7. The widowed also account for 2.1% of a frequency of 2. Tenants
engaged in an informal and loose union are rated at the lowest percentage of 1.1%
with a frequency of 1. Non applicable cases culminate to 1.1% with a frequency of 1.
Regional Background
Frequency Percent
Valid EASTERN 3 3.2
FOREIGN
COUNTRY 4 4.3
NORTHERN 47 50.0
SOUTHERN 15 16.0
WESTERN AREA 25 26.5
Total 94 100.0
Regional backgrounds in these settlements show that 50% in a frequency of 47 are
Northerners who are in the majority. These are closely followed by Tenants from the
Western Area with a percentage of 26.5% with a frequency range of 25. Those who
hail from the Southern Region make up for 16% of a frequency of 15. The Easterners
account for the lowest in a frequency of 3 to a percentage of 3.2%.
Nationality
Frequency Percent
Valid NON SIERRA
LEONEAN 4 4.3
SIERRA LEONEAN 90 95.7
Total 94 100.0
With reference to nationality, Sierra Leoneans obviously make up for the highest
percentage which is 95.7 with a frequency of 90. Non Sierra Leoneans lie at a level of
4.3% in a frequency of 4.

35
Ethnic Groupings
Frequency Percent
Valid FULLAH 5 5.3
KONO 1 1.1
KORANKO 2 2.1
KRIO 2 2.1
LIMBA 24 25.5
LOKO 2 2.1
MANDINGO 4 4.3
MENDE 15 16.0
SUSU 5 5.3
TEMNE 34 36.2
Total 94 100.0
Consequent of the huge
Northern Presence, it
could be seen that the Temnes make up for 36.2% in a frequency of 34, which
presents the highest recording of ethnic grouping. Closely followed by them are the
Limbas with a percentage of 25.5% in a frequency of 24. Although the Mendes form
the largest ethnic group in Sierra Leone, their presence in this community is minimal
as they record only 16.0% within a frequency of 15, compared to those from the
North. The Fullas and the Susus’ who also hail from the North, account for 5.3% with
a frequency of 5. The Mandingo ethnic community also marks a reading of 4.3% in a
frequency of 4.
Unlike the others, the Korankos, Krios and Lokos’, experience a downward trend of
percentage recordings of 2.1 in similar occurrence of frequencies of 2 in each case.
The Konos form the least of the grouping with no less a recorded percentage of 1.1
% from a frequency of 1.

36
Frequencies of Analysis: Section 2 Livelihood
Livelihood
Frequency Percent
Valid Business 21 22.3
Carpentry 2 2.1
Civil Servant 9 9.6
Clerical 15 16.0
Cookery Seller 1 1.1
Cooling System
Repair 1 1.1
Driving 2 2.1
Farming 3 3.2
Fishing 2 2.1
Food Processing 1 1.1
Labourer 1 1.1
Mason 1 1.1
Photographer 1 1.1
Retail Trading 26 27.7
Sea Worker 1 1.1
Security Guard 1 1.1
Tailoring 3 3.2
Teacher 3 3.2
Total 94 100.0
Like the Asset Owners, the livelihood and income generation activities of Tenants
also formed a significant part of the survey.

37
However, further in-depth analysis clearly manifest that 27.7% of a frequency of 26 of
them are engaged in Retail Trading. This is so far the highest percentage recording of
income generation or livelihood activities which is visibly present in the Community.
A close look at the recordings also show that of a frequency of 21, 22.3% are doing
business. Tenants who are serving in various capacities in clerical jobs, reflect a
percentage 16.0 from a frequency of 15.
Among them, are others who are enrolled as Civil Servants. These account for 9.6%
with a frequency of 9. Farming, Tailoring and Teaching appear to be regular
professions which registers a percentage of 3.2 and a frequency of 3.
Similarly, Carpentry, Driving and Fishing also register percentages of 2.1 each with
frequencies of 2 in every case. Among other things, economic activities such as
Cookery Selling, Repairs of Cooling Systems, Food processing, Labourers and
Masons, Photography, Sea farers and Security Guards all record a low level
percentage of 1.1 with frequencies of 1 along the line.
Frequencies of Analysis: Section 3 General Education, Literacy and
Apprenticeship
Level of Education Attained
Frequency Percent
Valid NA 23 24.5
PRIMARY 5 5.3
SECONDARY 45 47.9
TERTIARY 21 22.3
Total 94 100.0
An in-depth analysis of the level of Education points to the fact that education is
indeed a significant factor in the life of the community. Inspite of the emerging
difficulties and appalling conditions, a good number of them had attained some level
of education to enhance their capacities and capabilities.

38
Interestingly, a survey of the tenant level of education reflects that 47.9% in a
frequency of 45 have been through secondary education. An impressive percentage of
22.3% from a frequency of 21, have attained Tertiary Education, while 5.3% with a
frequency of 5, stopped at Primary level. There were no responses from a percentage
of 24.5 with a frequency of 23.
Literacy Level
Frequency Percent
Valid NA 6 6.4
NO 52 55.3
YES 36 38.3
Total 94 100.0
Not withstanding this development, it appears that there had been some contentment
with the levels they have attained and do not wish to go further. This accounts for the
fact that 55.3% from a frequency of 52 have not attended literacy courses. Invariably,
with a standing record of an improved secondary education, it is not surprising that
38.3% with a frequency of 36 have attended literacy courses. A non applicable
response of a frequency of 6 registers a percentage of 6.4.
Ability to Read and Write a Simple Letter in English
Frequency Percent
Valid NA 1 1.1
NO 23 24.4
YES 70 74.5
Total 94 100.0
In regard to this aspect of the survey, it was established that an outstanding percentage
of 74.5 with a frequency of 70 can read and write in simple English. However, 24.4%
with a frequency of 23 cannot read or write simple English. In this category, the non
applicable responses indicate that 1.1% to a frequency of 1 were unavailable.

39
Aptitude to do Simple Calculations
Frequency Percent
Valid NA 2 2.1
NO 19 20.2
YES 73 77.7
Total 94 100.0
Following these impressive lines, it is worthy of note that an outstanding percentage
of 77.7 with a frequency of 73 can also do simple calculations. A lesser percentage of
20.2 with a frequency of 19, can hardly do simple calculations. There were however
no responses from a percentage of 2.1 from a frequency of 2.
Apprenticeship
Frequency Percent
Valid NA 6 6.4
NO 58 61.7
YES 30 31.9
Total 94 100.0
In regard to personal enhancement, or improvement of personal lives to acquire some
kind of dependable profession, only 31.9% have been through some from of
apprenticeship with a frequency of 30, while the bulk of 61.7% of them from a
frequency of 58 have not. Non applicable responses show a frequency of 2 with a
percentage of 2.1
Frequencies of Analysis: Section 4 Health Conditions in Past 2 Weeks
Health Condition, Illness and Injuries
Frequency Percent
Valid BOTH 8 8.5
ILLNESS 63 67.0
INJURY 1 1.1
NA 9 9.6
NEITHE
R 13 13.8
Total 94 100.0

40
Although there are a number of health centres and health posts, it is recorded that
health conditions among tenants are rather appalling as 67.0 % with a frequency of 63
have suffered from illness. Those who have suffered from both Illnesses and Injuries
account for 8.5% from a frequency of 8 of their number. It could be seen that 13.8%
with a frequency of 13 have neither suffered from illness nor injury.
In the category of tenants who have suffered from injury only, a low percentages of
1.1 with a frequency of 1 is recorded on their account. No applicable responses
records a 9.6% of a frequency of 9.
Type of Injury
Frequency Percent
Valid ACCIDEN
T 8 8.5
NA 86 91.5
Total 94 100.0
With respect to the occurrence of accidents, only 8.5% with a frequency of 8 of the
tenants have had accidents. Here, there is a non available response of 91.5% with a
frequency of 86.
Type of Illnesses
Frequency Percent
Valid COMMON
COLD/FLU 14 14.9
CUT IN THE LEG 1 1.1
DIARRHOEA 1 1.1
FUNGI
INFECTION 1 1.1
HEAD ACE 2 2.1
HYPERTENSION 5 5.3
MALARIA 41 43.5
NA 22 23.4
STOMACK ACE 1 1.1
TYPHOID 6 6.4
Total 94 100.0
Notably also, a percentage of 14.9% from a frequency of 14, suffered from common
cold and flu. As mentioned earlier in previous chapters, Malaria records the highest

41
percentage among other illnesses. This accounts for 43.5% with a frequency of 41,
here, Typhoid appears in a frequency of 6 to a percentage of 6.4% of tenants who
suffer from it.
Hypertension records 5.3% with a frequency of 5 among others. Though headache
may be common, yet, it stands at a low ebb, in the recordings with 2.1% from a
frequency of 2.
A close look at minor injuries like a Cut in the Leg, Fungi Infection, Diarrhoea and
Stomach Ache, show a percentage flow of 1.1 with frequencies of 1 to each. A
percentage of 23.4 with a frequency of 22 account for non applicable responses.
Period of Consultation (Treatment)
Frequency Percent
Valid 1 2 2.1
2 3 3.2
3 6 6.4
4 6 6.4
5 2 2.1
6 1 1.1
7 18 19.1
8 1 1.1
10 2 2.1
14 20 21.3
21 4 4.3
30 3 3.2
31 1 1.1
Total 69 73.4
N/A 25 26.5
Total 94 100.0
The period of time experienced in treating the types of Illnesses is also of concern.
More often than not, the groups of tenants who are treated in 14 days record the
highest percentage in this respect. It could therefore be seen that 21.3% with an
occurring frequency of 20 stands in their favour. Those who are treated in a slightly
lesser period of 7 days closely toe the line. These ones record a percentage of 19.1 %
from a frequency of 18. Some of them who are treated in three and four days present a
percentage of 6.4% with a recurring frequency of 6 in either case.

42
Coincidentally, tenants who are treated in 3 days and those who are treated in 30 days
share the same level of percentage recordings of 3.2% with recording frequencies of 3
in both cases. Among those who are treated in 21 days, appear to stand alone at 4.3%
from a frequency of 4. Three groups of tenants who are treated in 2 days, 5 days and
10 days also fall at the level of 2.1% with recorded frequencies of 2 in each case.
Similarly, those who are treated in 6, 8, and 3, days also share a percentage of 1.1%
with frequencies of 1 in every case. Non applicable responses indicate a recording of
26.5 with a frequency of 25.
Reasons for Medical Consultation
Frequency Percent
Valid CHECK UP 16 17.0
ILLNESS 43 45.7
INJURY 1 1.1
NA 32 34.0
POSTNATAL CARE 1 1.1
TRADITIONAL
HEALER 1 1.1
Total 94 100.0
The percentage recordings however, points to the fact that tenants take the initiative to
do Medical checkups to establish their health status or when they fall Ill. Of these,
45.7% with a frequency of 43 visit Doctors whenever they fall ill/sick. 17.0% of a
recorded frequency of 16 can afford to do Medical checkups, whilst others who make
up for 1.1% of a frequency of 1, seek other means through Postnatal Care, Injury and
Traditional Healers. No responses account for 34% with a frequency of 32.
Consultations from Medical Specialist
Frequency Percent
Valid DENTIST 1 1.1
DOCTOR 60 63.8
MEDICAL
ASSISTANT 5 5.3
NA 5 5.3
NURSE 13 13.9
PHARMACIST 7 7.4
TRADITIONAL
HEALER 3 3.2
Total 94 100.0

43
In this situation, 63.8% with a frequency of 60 can afford to seek medical attention
from a Medical Doctor. Those who rely on treatment from private nurses account for
13.9% from a frequency of 13. Apparently, a recording of 3.2% with a frequency of 3
of tenants seek help from Traditional Healers. Nonetheless, a class of them also rely
on Pharmacists for treatment, who make up for 7.4% in a frequency of 7. A slightly
low percentage of 5.3 with a frequency of 5 accounts for these who seek Medical
attention from a Medical Assistant. Among the ones who refer to Dentists, an
exceedingly low percentage is recorded, basically of 1.1% from a frequency of 1. Non
applicable responses registered a percentage of 5.3 with a frequency of 5.
Length of Illness
Frequency Percent
Valid NA 3 3.2
OFTEN 19 20.2
SELDOM 60 63.8
VERY
OFTEN 12 12.8
Total 94 100.0
However, a fairly high but resistible percentage of 63.8% of a frequency of 60,
seldom fall sick, while 20.2% with a frequency of 19, often fall ill. Although it could
be seen that 12.8% of them from a frequency 12 very after fall ill. Non applicable
responses account for 3.2% with a frequency of 3.
Vaccination of Children Against Diseases
Frequency Percent
Valid NA 4 4.3
NO 9 9.6
YES 81 86.1
Total 94 100.0
44
Going by the present records, it is observed that due attention has been paid to their
childrens’ welfare and Health conditions. The tenants have therefore ensured that
86.1% of their children in a frequency of 81, have been vaccinated against occurring
diseases. These responses demonstrate a reasonably high degree of responsibility
among the tenants. This therefore leaves very little room for those who lack attention
for their children. It thus account for 9.6% with a recorded frequency of 9 of the
children who are not vaccinated. However, non applicable responses register a
percentage of 4.3 from a frequency of 4.
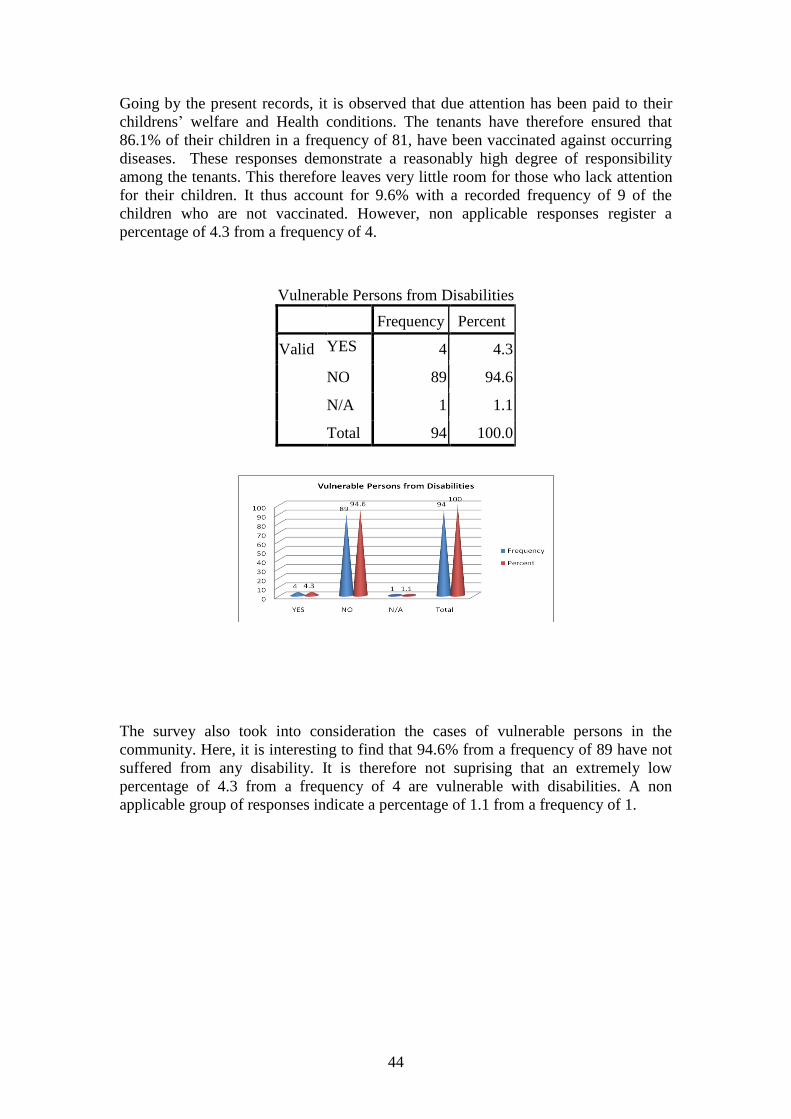
Vulnerable Persons from Disabilities
Frequency Percent
Valid YES 4 4.3
NO 89 94.6
N/A 1 1.1
Total 94 100.0
The survey also took into consideration the cases of vulnerable persons in the
community. Here, it is interesting to find that 94.6% from a frequency of 89 have not
suffered from any disability. It is therefore not suprising that an extremely low
percentage of 4.3 from a frequency of 4 are vulnerable with disabilities. A non
applicable group of responses indicate a percentage of 1.1 from a frequency of 1.

45
Frequencies of Analysis: Section 5 Housing
Type of Dwelling Living In?
Frequency Percent
Valid APARTMENT/FLAT 49 52.1
COMPOUND HOUSE
(ROOMS) 29 30.8
CORRUGATED IRON
APARTMENT 1 1.1
OTHER TYPE OF
ROOMS 1 1.1
SEVERAL HUTS IN
SAME COMPOUND 1 1.1
SINGLE FAMILY
HOUSE/HUL 11 11.7
ZINC 2 2.1
Total 94 100.0
Although dwelling conditions may not be favourable for some people in the
community, yet a sizeable number of tenants can afford to live in better conditions. In
this regard, 52.1% with a frequency of 49 of tenants are living in apartments or flats.
Others who live in compound homes with single rooms account for 30.8% from a
frequency of 29. Another category of tenants who are living in single family homes
register a frequency of 11 to a percentage of 11.7%. Those who are living in Zinc
structures reflect a small but accountable percentage of 2.1% with a frequency of 2.
Along these lines, tenants who are living in corrugated Iron apartments, other type of
rooms and several huts in the same compound all register a percentage of 1.1 with
continued recurrence of frequencies of 1 to each of them.

46
Present Occupancy Status
Frequency Percent
RENT/FREE
DWELLING 5 5.3
RENTING 89 94.7
Total 94 100.0
Among their lot, an excessively high percentage of 94.7 with a frequency of 89, are
renting, compared to a small percentage of 5.3% of a frequency of 5, who are rent/free
dwelling
Construction of Wall Materials
Frequency Percent
CEMENT/MUD 1 1.1
CEMENT/SAND
SANDCRETE
BLOCKS
52 55.3
CORRUGATED IRON
SHEETS 14 14.9
MUD/MUD BRICKS 18 19.1
NA 1 1.1
WOOD 1 1.1
ZINC 7 7.4
Total 94 100.0
A close study of the environment showed that structures in the community are
constructed mainly of Cements, Sand and Sand Crete Blocks, some of zinc only, and a
number of others of Wood and Sticks, Cement and Mud. The structures constructed of
Cement/Sand and Sand Crete Blocks out number the others by 55.3% with a
frequency of 52, which reflect the highest percentage. Mud Brick structures make up
for 19.1% of a frequency of 18.
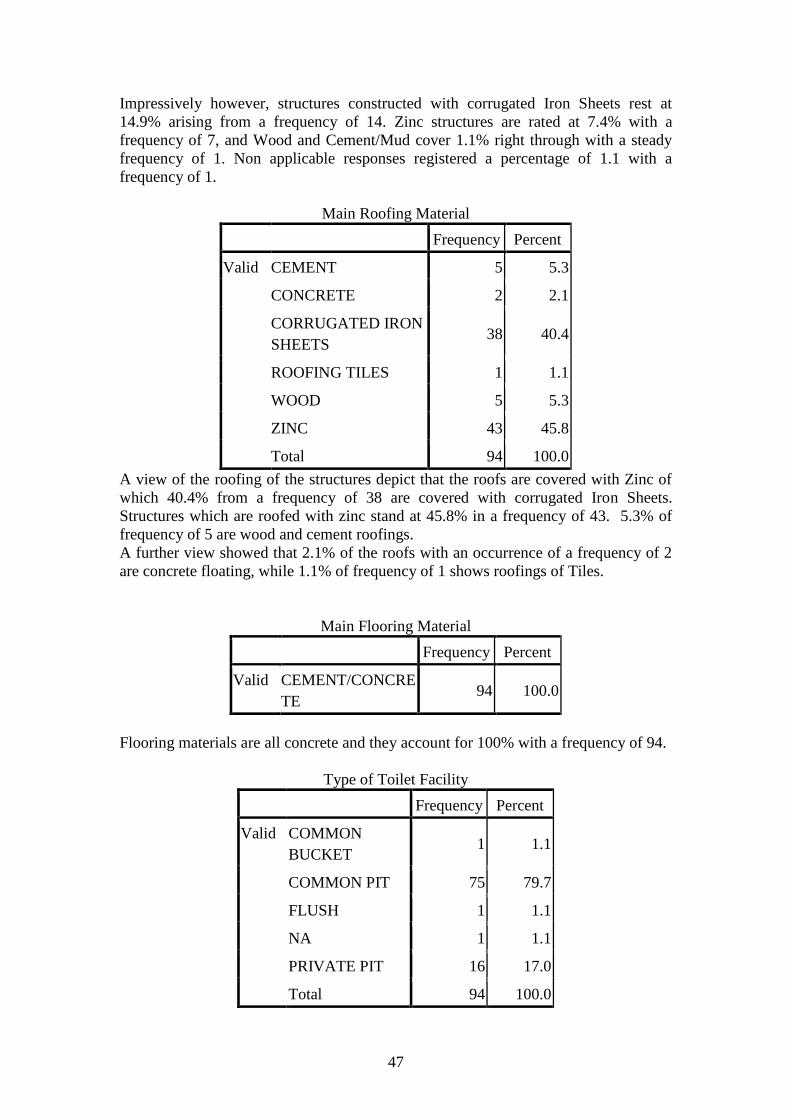
47
Impressively however, structures constructed with corrugated Iron Sheets rest at
14.9% arising from a frequency of 14. Zinc structures are rated at 7.4% with a
frequency of 7, and Wood and Cement/Mud cover 1.1% right through with a steady
frequency of 1. Non applicable responses registered a percentage of 1.1 with a
frequency of 1.
Main Roofing Material
Frequency Percent
Valid CEMENT 5 5.3
CONCRETE 2 2.1
CORRUGATED IRON
SHEETS 38 40.4
ROOFING TILES 1 1.1
WOOD 5 5.3
ZINC 43 45.8
Total 94 100.0
A view of the roofing of the structures depict that the roofs are covered with Zinc of
which 40.4% from a frequency of 38 are covered with corrugated Iron Sheets.
Structures which are roofed with zinc stand at 45.8% in a frequency of 43. 5.3% of
frequency of 5 are wood and cement roofings.
A further view showed that 2.1% of the roofs with an occurrence of a frequency of 2
are concrete floating, while 1.1% of frequency of 1 shows roofings of Tiles.
Main Flooring Material
Frequency Percent
Valid CEMENT/CONCRE
TE 94 100.0
Flooring materials are all concrete and they account for 100% with a frequency of 94.
Type of Toilet Facility
Frequency Percent
Valid COMMON
BUCKET 1 1.1
COMMON PIT 75 79.7
FLUSH 1 1.1
NA 1 1.1
PRIVATE PIT 16 17.0
Total 94 100.0
48
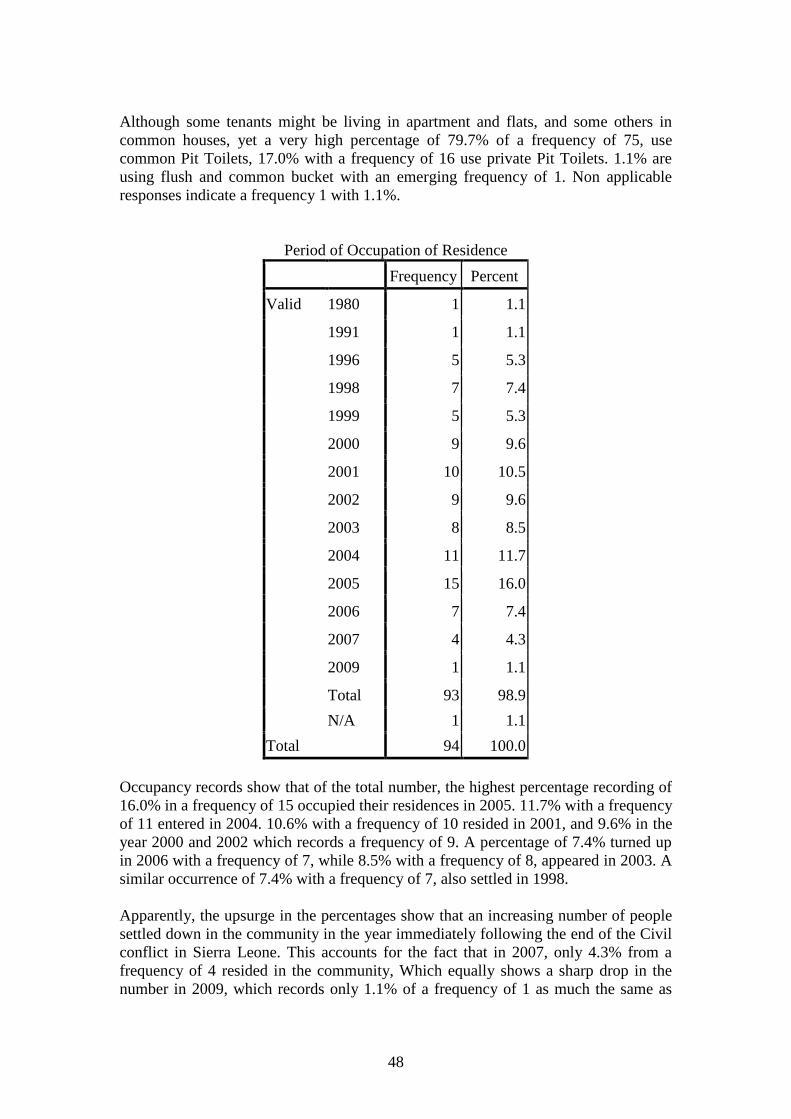
Although some tenants might be living in apartment and flats, and some others in
common houses, yet a very high percentage of 79.7% of a frequency of 75, use
common Pit Toilets, 17.0% with a frequency of 16 use private Pit Toilets. 1.1% are
using flush and common bucket with an emerging frequency of 1. Non applicable
responses indicate a frequency 1 with 1.1%.
Period of Occupation of Residence
Frequency Percent
Valid 1980 1 1.1
1991 1 1.1
1996 5 5.3
1998 7 7.4
1999 5 5.3
2000 9 9.6
2001 10 10.5
2002 9 9.6
2003 8 8.5
2004 11 11.7
2005 15 16.0
2006 7 7.4
2007 4 4.3
2009 1 1.1
Total 93 98.9
N/A 1 1.1
Total 94 100.0
Occupancy records show that of the total number, the highest percentage recording of
16.0% in a frequency of 15 occupied their residences in 2005. 11.7% with a frequency
of 11 entered in 2004. 10.6% with a frequency of 10 resided in 2001, and 9.6% in the
year 2000 and 2002 which records a frequency of 9. A percentage of 7.4% turned up
in 2006 with a frequency of 7, while 8.5% with a frequency of 8, appeared in 2003. A
similar occurrence of 7.4% with a frequency of 7, also settled in 1998.
Apparently, the upsurge in the percentages show that an increasing number of people
settled down in the community in the year immediately following the end of the Civil
conflict in Sierra Leone. This accounts for the fact that in 2007, only 4.3% from a
frequency of 4 resided in the community, Which equally shows a sharp drop in the
number in 2009, which records only 1.1% of a frequency of 1 as much the same as
49
1980, 1991 and non applicable responses all of which reflect the same percentages
and frequencies.
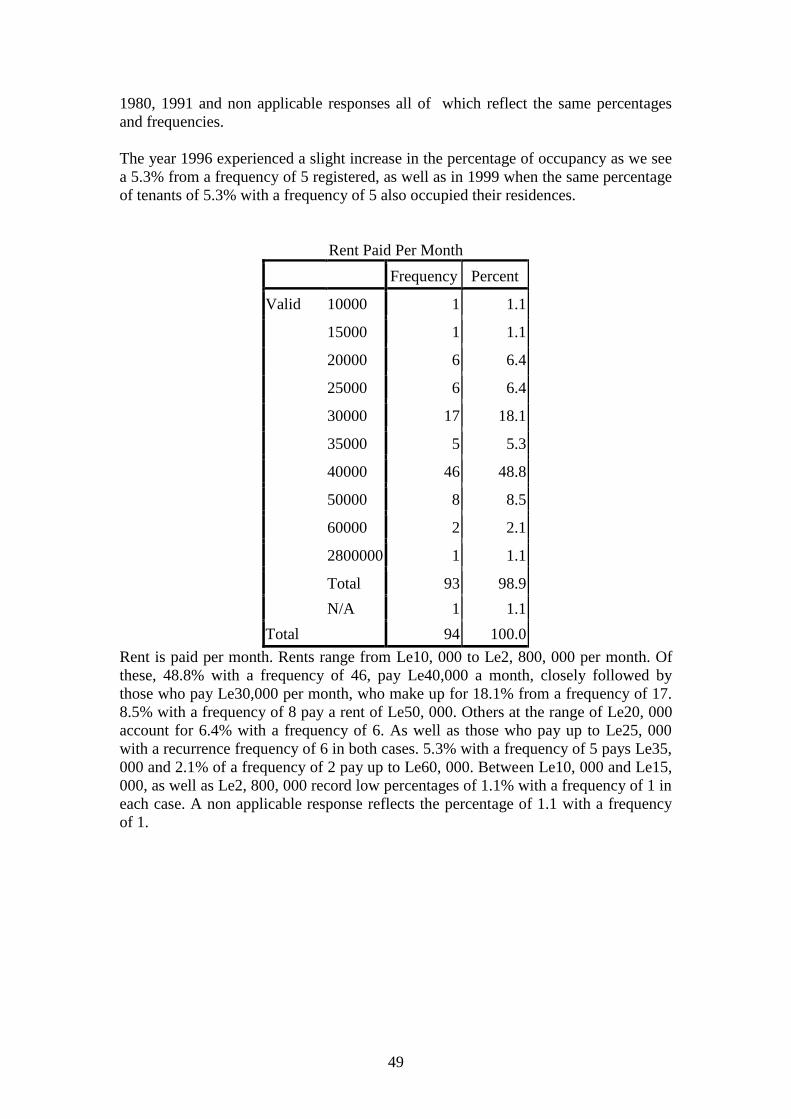
The year 1996 experienced a slight increase in the percentage of occupancy as we see
a 5.3% from a frequency of 5 registered, as well as in 1999 when the same percentage
of tenants of 5.3% with a frequency of 5 also occupied their residences.
Rent Paid Per Month
Frequency Percent
Valid 10000 1 1.1
15000 1 1.1
20000 6 6.4
25000 6 6.4
30000 17 18.1
35000 5 5.3
40000 46 48.8
50000 8 8.5
60000 2 2.1
2800000 1 1.1
Total 93 98.9
N/A 1 1.1
Total 94 100.0
Rent is paid per month. Rents range from Le10, 000 to Le2, 800, 000 per month. Of
these, 48.8% with a frequency of 46, pay Le40,000 a month, closely followed by
those who pay Le30,000 per month, who make up for 18.1% from a frequency of 17.
8.5% with a frequency of 8 pay a rent of Le50, 000. Others at the range of Le20, 000
account for 6.4% with a frequency of 6. As well as those who pay up to Le25, 000
with a recurrence frequency of 6 in both cases. 5.3% with a frequency of 5 pays Le35,
000 and 2.1% of a frequency of 2 pay up to Le60, 000. Between Le10, 000 and Le15,
000, as well as Le2, 800, 000 record low percentages of 1.1% with a frequency of 1 in
each case. A non applicable response reflects the percentage of 1.1 with a frequency
of 1.

50
Frequencies of Analysis: Section 6 Utilities and Amenities
Main Source of Drinking Water
Frequency Percent
Valid NA 2 2.1
PUBLIC STAND PIPE 53 56.5
RIVER/PONDS
SPRINGS 5 5.3
WATER WELL WITH
PUMP 7 7.4
WATER WELL
WITHOUT PUMP 27 28.7
Total 94 100.0
Within the Communities in Freetown, many areas have not had the opportunity of
enjoying pipe born water supply. Tenants in this Community are equally at pains to
access water, especially water for drinking purposes. Many of them therefore depend
on various sources of water supply.
Result of the study manifests that 56.5% with a frequency of 53 receive water from
public stand Water Pipes in the Community, which reflects the highest percentage
recording. 28.7% with a frequency of 27 depend on Water from Wells without Pumps.
Yet, 7.4% in a frequency 7 have the opportunity to receive Water from wells with
pumps, a percentage of 5.3 of frequency of 5, get water from flowing Rivers, Ponds
and little Springs beneath the hills and rocks. Non available responses indicate a
percentage of 2.1 with a frequency of 2.

51
Distance from Source of Water Supply
Frequency Percent
Valid 19 METRE 1 1.1
1 METRE 2 2.1
1 MILE 1 1.1
10 METRE 3 3.2
100
METRE 13 13.8
15 METRE 6 6.4
150
METRE 7 7.4
20 METRE 7 7.4
200
METRE 7 7.4
210
METRE 1 1.1
25 METRE 4 4.3
250
METRE 2 2.1
30 METRE 5 5.3
300
METRE 3 3.2
35 METRE 1 1.1
40 METRE 3 3.2
5 METRE 4 4.3
50 METRE 12 12.7
70 METRE 3 3.2
75 METRE 1 1.1
NA 8 8.5
Total 94 100.0
Although water is purchased, it is however noted that distances from sources of Water
are not too far to cover. 13.8% of frequency of 13 are within a distance of 100 meters
and 12.7% of a frequency of 12 are within 50 meters.

52
Whereas, 7.4% cover distances from 150 meters to 200 and 210 meters with the same
frequencies of 7 in each case. 6.4% of frequencies of 6 cover a distance of 15 meters.
Also, 5.3% in a frequency of 5 covers distances of 30 meters
Those who cover distances of 5 and 25 meters stand at 4.3% of a frequency of 4. In a
similar situation, those who cover distances from 10 meters, 40 meters, 70 meters and
300 meters also account for 3.2% in a frequency of 3.
Other who also cover distances of 1 meter only and 250 meters record 2.1% from a
frequency of 2. The rest who lie within 19 meters, 75 meters, 1 Mile, 210 meters and
35 meters show only 1.1% from frequency of 1, which is the lowest. Non applicable
responses show a percentage of 8.5 from a frequency 8.
Purchase of Water
Frequency Percent
Valid NA 22 23.4
NO 12 12.8
YES 60 63.8
Total 94 100.0
However, whether it is pipe borne water or otherwise, a huge percentage of 63.8%
with a frequency of 60 of the tenants purchase Water from people in the Community,
considering that a small number of 12.8% with a frequency of 12 do not purchase
water. Non applicable responses are registered with a percentage of 23.4 from a
frequency of 22.
Sources of Light into Dwellings
Frequency Percent
Valid ELECTRICITY 67 71.3
GAS lamp 1 1.1
GENERATOR 1 1.1
KEROSENE 18 19.1
NA 2 2.1
TORCH
LIGHT 3 3.2
WOOD 2 2.1
Total 94 100.0

53
Today, with the coming of the Hydro Electrification, Electricity is a major source of
light for the majority of the people in Freetown. It is therefore not suprising that
71.3% with a frequency of 67, of the tenants depend on electricity for light. A
percentage of 19.1% from a frequency of 18 still use Kerosene.
The percentage of those using Generators and Gas has fallen to a low ebb of 1.1% in a
frequency of 1. However, 3.2% which reflect a frequency of 3 use torches 2.1% of a
frequency of 2 still rely on Wood for Light. No responses were available for a
percentage of 2.1 and a frequency of 2.
Fuel Used by Household for Cooking
Frequency Percent
Valid CHARCOAL 83 88.2
ELECTRICIT
Y 1 1.1
FIREWOOD 3 3.2
KEROSENE 3 3.2
NA 4 4.3
Total 94 100.0
Inspite of the constant electricity supply now available, only 1.1% of a frequency of 1,
utilize electricity for cooling. The highest of their member of 88.2% of a frequency of
83 use charcoal for cooking. 3.2% depend on fire Wood and Kerosene which shows a
frequency of 2. Non applicable responses show a frequency of 4 with 4.3%.
3.4 Average Income Levels of Asset Owners
Estimate of Average Income Generation per month (Asset Owner)
Area No. Ave. Income (Le) Eq. ($) US Dollar
Congo Town 6 561,666.67 152
Tengbeh Town 8 561,250.00 152
Wilberforce 2 550,000.00 149
Red Pump 3 426,666.67 115
Hill Cut 2 725,000.00 196
Mount Carmel 5 490,000.00 132.4
Sumaila Town 2 850,000.00 230
Leicester Road 4 555,000.00 150
Mount Aureol 6 616,666.67 167
Blackhall Road 6 613,333.33 166
Total 44 5,949,583.33 1, 609.4
Average income levels of Asset Owners per month range from $52 Dollars which is
the lowest to $230 which is so far the highest.
54
Such an income leaves little or no room to manouvere in meeting the needs of their
households. The single bread winner syndrome among grass root Sierra Leoneans
imposes heavy burden on the shoulders of the head of the households or squarely on
the women in circumstances where the head is unemployed or without any
professional skills to earn a living.
Some sections of the communities are slumps situated along the edge of the Congo
river and mountain tops from the main improved settlements of the city. Where
business is generally dormant. Much of the population in such areas are self reliant.
Congo Town is one such area which occupies either side of the Congo River. There
are hardly any Motor Roads or other social amenities to complement for the size of
the population of the settlement. Present Asset Owners had obviously taken advantage
of the relaxed and inattentive situation of the Government to construct structures and
settle down, over a long period to the present. Apparently, these areas are now
recognised settlements with political representation at the local Government and
parliamentary levels. Today, one could also find community leaders (Traditional
Chiefs), Tribal Head Men and Women leaders.
Although they might be engaged in diverse income generation activities, statistics
point to the fact that average income levels per month are considerably low. The
amount of an average income of the entire Community of Congo Town among
affected Asset Owners records a figure of Le561,666,67 (Leones) which is equivalent
to $152 U.S. Dollars a month.
The Community of Tengbeh Town is just adjacent to that of Congo Town, as well as
Red Pump and Wilberforce all of which share the same situation. It could be seen
from the table that their average income levels per month flow along similar lines.
Here, Tengbeh Town records an average income of $170 Dollars per month whilst
Wilberforce records $105 and Red Pump $110. These are communities which have
sprung up on and along the rugged low line debris of the Congo River and the sloping
Hill sides from Wilberforce. Invariably, these are areas that lack every aspect of
development, and quite unattractive to any form of investment as already portrayed by
their average income levels
The rest from Hill Cut, Mount Camel, Mount Aureol, Sumaila Town, Leicester Road,
Black Hall Road are communities that as situated at the mountain tops over looking
the city.
Although there are equally limited facilities, yet they are slightly better off with Motor
Roads and closer to improved areas of the city where there is more of petty trading or
retail trading. There is every likelihood also that more of the Asset Owner are enrolled
in clerical jobs and other professions where they generate higher incomes than
tenants.
It could therefore be seen that Sumaila Town which merges into the city by Pademba
Road records an average income of $230 per month which is the highest. Mount
Aureol which is only few Kilometres ahead records an average income of $167 per
month, except Leicester Road which presents an average income of $150 per month.

55
The total numbers of communities where the 44 Asset Owners are living captured in
this study reflect a total average income of $1,609.4 Dollars per month. Inspite of
such a low average income level, there is an interconnection gradually taking place
with the more advanced settlements at Hill Station, (Imatt). Whose influence is
rapidly transforming these Mountain settlements.
3.5 Average Income Levels of Tenants
Estimate of Average Income Generation per month (Tenant)
Area No. Ave. Income (Le)
Eq. ($) US
Dollar
Congo Town 21 204,523.81 55.3
Tengbeh Town 16 256,250.00 69.3
Wilberforce 3 186,666.67 50.4
Red Pump 1 140,000.00 38.0
Hill Cut 2 195,000.00 53.0
Mount Carmel 6 215,000.00 58.1
Sumaila Town 8 227,500.00 61.5
Leicester Road 7 248,571.43 67.2
Mount Aureol 20 272,500.00 74.0
Blackhall Road 10 262,000.00 71.0
Total 94 2,208,011.90 598
As expressed inter-alia, average income levels of tenants are equally as low as those
of the Asset Owners. All of them also share the same living condition in the
Communities.
In Congo Town for instance, the income flow presents an average amount of $55
Dollars whilst Tengbeh Town which is next to it records an average income of $69.
Wilberforce records $50 and Red Pump $38 of an average income level per month.
The reasons for such low earnings have already been noted in the opening paragraphs.
Equally not suprising is the fact that the mountain top Communities show higher
income levels consequent of their closeness to improved areas where there is more of
business or retail trading and where tenants who are serving in different capacities in
other professions are settled.
It could therefore be seen that whilst Mount Camel has an average income level of
$58, Sumaila Town shows an income level of $61.5 Leicester Road, which is only
few kilometres ahead, records an average income of $67.5. The table also shows that
Mount Aureol records $74 with Black Hall Road of an average income of $71.
However, unlike the Asset Owners, the total numbers of Communities where the 94
tenants dwell records a far lower figure of $598 Dollars of an average income per
month.

56
The disparity of average income levels undoubtedly manifest that Asset Owners
maintain a strong financial stance than tenants. In addition to other financial
engagements, Asset Owners derive a steady income from rent, which apparently
subsidies for other expenses, and perhaps serve as savings.
However, the financial constraints on both parties are obvious. Until something
tangible is injected into the Communities to improve average income levels, the
standard of living will continue to be poor, and it will be extremely difficult to lift the
Social status of the majority of the people in the settlements.

57
3.6 Results of Statistical Analysis of Community Responses
Basic Infrastructure
Name of
Community
No. of
Household in the
Community
No. of
Churches
No. of
Mosques
Number of
Hand Dug
Cement Water
Wells (with
Pump)
Number of Hand Dug
Cement Water Wells
(without Hand Pump)
No. of Basic Water
Wells
Congo Town 110 6 5 0 5 3
Congo Bridge 40 5 3 0 0 2
Cantonment
Road 500 3 4 0 0 2
Hill Top 200 2 4 0 0 2
Hill Cut 2000 5 3 0 0 1
Sumaila Town 500 1 3 0 0 0
Leicester Road 3000 8 7 0 4 1
Mount Aureol 300 3 9 3 1 5
Blackhall Road 25 2 3 0 0 1
Total 6675 35 41 3 10 17

58
The socio-economic survey also covered various aspects of the Community. The
census conducted shows a record of 6,675 households in the present Right Of Way of
the Transmission Line. Within these Communities there are 35 churches, and 41
Mosques.
As noted in proceeding chapters, this is a Community that is devoid of motor roads
and limited access to social facilities. Much of the people walk along foot paths which
serve as outlets into the main areas of the city. Consequently, 8.1% of the Community
feel that foot paths are adequate for their movements, while a percentage of 9.7%
think that foot paths are inadequate,
Though they may have been accustomed to using foot paths, 4.8% of the Community
feels that roads are of service to them and therefore adequate. This is quite in contrast
to a percentage of 12.9% who think that roads are in adequate for their use.
Inspite of the difficulties of accessibility to social amenities, 11.3% of the community
have access to portable water network while a low percentage of 6.5% do not have
access at all.
Along the entire stretch of the Community, there are only three hand dug water wells
with pumps. Equally so, there are 10 hand dug cemented water wells but without
pumps. 17 others serve as basic water wells to the community.
Taking into consideration the type of housing, toilet facilities are to some extent
limited for the use of the people, many of whom depend on outside pit toilets
(latrines) in the community. In this regard, 14.5% accept the fact that there are outside
toilet facilities. With the commissioning of the Hydro Electric Project, electricity is
being supplied to a greater part of the city including some areas or parts of the
community in question. Even so, only 17.7% of the entire stretch has access to
electricity.
The means of transport is another significant factor that is worthy of consideration.
Although a good number of them depend on vehicles for means of transportation,
4.8% rely on boats. In the census of community 17.7% of the community now has
access to cell phone networks.

59
Health Infrastructure
Name of
Community
No. of
Community
Health
Centres
(CHC)
No. of
Community
Health
Posts
No. of
Maternal
& Child
Health
Posts
(MCHP)
No. of
Traditiona
l Health
Units
No. of
Dental
Surgery
No. of Other
Medical
Infrastructur
e
No. of
Medicine
Men/Herbalist
s
No. of
NGO
Health
Service
No. of
Pharmacie
s
No. of
Traditiona
l Birth
Attendants
Congo Town 3 1 1 0 1 3 2 0 11 8
Congo Bridge 2 0 0 0 0 0 6 0 3 10
Cantonment
Road 0 0 0 0 0 1 0 0 1 5
Hill Top 0 0 0 0 0 0 0 0 0 1
Hill Cut 0 1 0 2 0 0 0 0 0 0
Sumaila Town 1 1 0 1 0 1 0 0 1 0
Leicester Road 0 1 0 0 0 1 15 0 3 3
Mount Aureol 1 1 1 1 0 1 3 0 1 0
Blackhall Road 2 1 1 1 0 1 3 0 1 3
Total 9 6 3 5 1 8 29 0 21 30

60
According to analysis of the survey, health facilities are slightly encouraging. At this
time, there are nine health centres, five community health centres, six community
health posts, and three maternal health posts. There is also a dental surgery at the
disposal of the community. With the encouragement of traditional medicine / healing
in recent times in Western medical circles, five traditional health units have also been
established in addition to the present number of health posts. A total number of 29
herbalists also provide traditional medical services to the community. However, there
is no presence of a non-governmental organization health facility along the entire
route. All the same, Three Postnatal and Child Health Posts could also be noticed.
Additionally, there are twenty one pharmacies, with a traditional maternal birth
attendance of 30.
Educational Infrastructure
Name of
Community
No. of
Kindergarten/
Pre-Schools
No. of
Primary
Schools
No. of
Junior
Secondary
Schools
No. of
Senior
Secondary
Schools
No. of
Libaries
No. of
Koranic
Schools
No. of
Vocational/
Training
Centres
Congo Town 2 7 4 3 0 1 1
Congo Bridge 2 5 0 0 0 5 0
Cantonment
Road 1 2 1 1 0 1 0
Hill Top 1 2 1 0 0 2 0
Hill Cut 0 1 0 0 0 2 0
Sumaila Town 3 2 1 1 0 1 0
Leicester Road 1 3 0 0 0 3 0
Mount Aureol 4 7 0 0 0 9 0
Blackhall Road 1 1 0 0 0 2 0
Total 15 30 7 5 0 26 1
Although incomes are low, the significance of education has been realized by the
community. Private educationists have therefore established kindergarten and
preparatory schools. In this regard, there are already 15 Kindergarten Schools.
Primary schools now number up to thirty. Today, there are Seven Junior Secondary
schools and five senior Secondary Schools, though there are no library facilities for
students.
Quite in contrast to the number of western education schools, there is a total number
of twenty six quranic schools. Yet still, there is only one vocational centre along in the
entire community, and three youth centres.

61
Other Infrastructure
Name of
Community
No. of
Artisan
Buildings
No. of
Youth
Centres
No. of
Sport
Facilities
No. of
Football
Playing
Fields
No. of
Fire
Security
Services
No. of
Taverns/
Bars
No. of
Court
Barrie
No. of
Town
Halls
No. of
Cemeteries
Congo Town 0 0 2 5 0 13 3 1 4
Congo Bridge 0 2 2 2 0 4 1 0 0
Cantonment
Road 0 0 0 0 0 3 0 0 0
Hill Top 0 1 1 1 0 4 0 0 0
Hill Cut 0 0 0 0 0 0 0 0 0
Sumaila Town 0 0 4 0 0 2 2 0 0
Leicester
Road 0 0 5 0 0 1 4 0 0
Mount Aureol 0 0 4 0 0 1 1 0 0
Blackhall
Road 0 0 4 1 0 0 0 0 1
Total 0 3 22 9 0 28 11 1 5
Recreation has been regarded as a vehicle for social cohesion in the society. It is
therefore noted that although the community is rough, hilly and sloppy, it has not
gone without recreational facilities. In these present times, football (soccer) is not
only a form of entertainment, and income, but also a source of relief and friendship.
Not surprisingly, the community has nine football pitches or grounds, and 22 sizeable
areas for athletics and other sports. A total of twenty eight bars and taverns provide
additional entertainment to the community and recreational areas, and a town hall to
the disposal of all in the community.
In the maintenance of law and order, though there are no police posts, yet the people
rely on their traditional rulers to settle their disputes. In this regard, there are 11
traditional court Barriers. The communities however maintain five cemeteries to bury
their dead.

62
4.0 LEGAL FRAME WORK AND WORLD BANK OP 4.12
(INVOLUNTARY RESETTLEMENT)
Constitution of Sierra Leone, 1991
The Constitution includes provisions to protect the rights of individuals to private
property, and also sets principles under which citizens may be deprived of their
property in the public interest as described in Section 21. It also makes provision for
the prompt payment of adequate compensation and access to the court or other
impartial and independent authority for the determination of the land owner’s interest
or right, and the amount of any compensation to which he/she is entitled and for the
purpose of obtaining prompt payment of that compensation.
Local Government Act, 2004
The Act establishes the Local Council (LC) as the highest political authority in the
locality and confers legislative and executive powers to be exercised in accordance
with this Act. This Act in its First Schedule under Section 2 establishes the localities,
namely: districts, towns and cities. Part II of this schedule also establishes the number
of Paramount Chiefs in each LC. The Third Schedule establishes the functions
devolved to the LCs. The Fourth and Fifth Schedules establish departments under
each LC, and a Valuation List and Rate Books respectively.
National Lands Policy, 2005
As provided in the Constitution, the 2005 National Land Policy also provides for the
compulsory acquisition of land in the public interest. The principles of the land policy
include among others: The principle of land as a common national or communal
property resource held in trust for the people and which must be used in the long term
interest of the people of Sierra Leone. Such a principle only holds where it does not
violate existing rights of private ownership. Compensation to be paid for lands
acquired through compulsory government acquisition will be fair and adequate and
will be determined, among other things, through negotiations that take into
consideration government investment in the area. Local Authorities (City and District
Councils) may negotiate for land for project development purposes, but all such grants
should be properly documented and processed. No interest in or right over any land
belonging to an individual or family can be disposed of without consultation with the
owner or occupier of the land. No interest in or right over any land belonging to an
individual or family can be compulsorily acquired without payment, in reasonable
time, of fair and adequate compensation.
OP 4.12: Involuntary Resettlement
The World Bank’s safeguards policy on involuntary resettlement, OP 4.12, is to be
complied with where involuntary resettlement, impacts on livelihoods and assets,
acquisition of land or restrictions to natural resources may take place as a result of the
project. It includes requirements that:
Involuntary resettlement should be avoided where feasible, or minimized,
exploring all viable alternative project designs.
63
Where it is not feasible to avoid resettlement, resettlement activities should
be conceived and executed as sustainable development projects, providing
sufficient investment resources to enable persons displaced by the project
to share in project benefits.
Displaced persons should be meaningfully consulted and should have
opportunities to participate in planning and implementing resettlement
projects.
Displaced persons should be assisted in their efforts to improve their
livelihoods and standards of living or at least to restore them, in real terms,
to pre-displacement levels or to levels prevailing prior to the beginning of
project implementation, whichever is higher.
According to OP 4.12, the resettlement plan should include measures to ensure that
the displaced persons are:
Informed about their options and rights pertaining to resettlement.
Consulted on, offered choices among and provided with technically and
economically feasible resettlement alternatives.
Provided prompt and effective compensation at full replacement cost for
losses of assets attributed directly to the project.
If the impacts include physical relocation, the resettlement plan should include
measures to ensure that the displaced persons are:
Provided assistance (such as moving allowances) during relocation.
Provided with residential housing, or housing sites, or as required,
agricultural sites for which a combination of productive potential, location
advantages, and other factors is at least equivalent to the advantages of the
old site.
The legal framework for the final implementation of the RAP is provided in the land
commission’s Act, 2005 which provides the principal means by which the property
can be legally acquired or conveyed to the NPA, which is the Client/Buyer.
The process would require a change of name from the Seller to the Buyer, of the
property. The property is conveyed to the Buyer and registered at the Registrar
General’s Office in the Ministry of Judicial Affairs. The conveyance between the
parties is prepared and signed by a legal counsel, by which means, ownership of the
property is established according to law.
Where there is a difference between OP 4.12 and national law, OP 4.12 will prevail.

64
5.0 INSTITUTIONAL FRAME WORK
The National Power Authority is responsible for supervising and monitoring
the implementation of the RAP.
The Consultants’ team has worked in collaboration with quantity and land
surveyors from the Ministry of Lands, Housing and Country Planning. The
Ministry is responsible for conserving and managing Sierra Leone’s natural
environment. It is also responsible for addressing land acquisition and transfer,
land ownership and use, and national development in a planning capacity. It
provides advisory services to the public on land matters as well as physical
planning and management of the forestry resources.
Others involved in implementing the RAP are: PAP representatives,
independent persons from the affected communities and the Monitoring
Committee.
Survey activities are being closely monitored by the Witness NGO, whilst the
RAG Committee discusses issues from time to time which have helped to pave
the way forward. (See Organizational Chart).

65
NPA CITY COUNCIL
MINISTRY OF LANDS WITNESS NGO
COMMUNITY CHAIR PERSON
COUNSELLORS
THE RESETTLEMENT
ADVISORY GROUP (RAG)
COMMITTEE
NPA MANAGEMENT
CONSULTANT
TEAM
WITNESS NGO
MONITORING
COMMITTEE
KINGTOM CONGO TOWN
TENGBEH
TOWN
WILBERFORCE
LEICESTER
ROAD
BELAIR PARK
MOUNT AUREOL
TERRACE
BLACKHALL ROAD
66
6.0 ELIGIBILITY
Eligibility for compensation is determined by the criterion that only Project Affected
Persons whose properties have been lost to the Project, in the Right of Way (ROW)
both along the previous and recently mapped route of the Sub Transmission Line will
be compensated. The loss could be loss of land, or its use, structures or crops,
livelihoods, or a combination of all as the case may be.
Affected households had been identified in the Census Stage of the survey whose
land/properties had been selected as suitable sites to erect towers or provide access to
them. It is expected that compensation for affected properties will be proportionate to
the level of impact (mainly temporary disturbances lasting some days).
Per the requirements of World Bank OP 4.12, displaced persons include:
(a) Those who have formal legal rights to land (including customary and
traditional rights recognized under the laws of the country;
(b) Those who do not have formal legal rights to land at the time the census
begins but have a claim to such land or assets – provided that such claims are
recognized under the laws of the country or become recognized through a
process identified in the RAP; and,
(c) Those who have no recognizable legal right or claim to the land they are
occupying.
Persons under (a) and (b) are provided compensation for the land they lose, and other
assistance. Persons under (c) are provided resettlement assistance in lieu of
compensation for the land they occupy, and other assistance, as necessary, if they
occupy the project area prior to the cut-off date of March 31, 2012. Persons who
encroach on the area on the area after the cut-off date are not entitled to compensation
or any other form of resettlement assistance. All displaced persons are provided for
compensation for loss of assets other than land.
6.1 Encroachment: In March 2012, some new encroachment was identified within
the Transmission Line ROW (See Annex 1). A list of the affected households was
given to relevant agencies, including the structures where urgent actions are needed to
ensure safety along the line and prevent harmful effects on human health. The
Government of Sierra Leone compensated some of the encroachers (by assisting them
in removing structures that affect the Transmission Line and will consider
compensation for any remaining encroachers that were in the ROW up to March 31,
2012, as identified in the March 2012 report in Annex 1, with funds from the Energy
Access Project. () Any PAPs already compensated under the Power and Water project
will not receive any additional compensation. Any encroachers in the Transmission
Line ROW after March 31, 2012 will not be considered for compensation.
The Government sent a letter to the World Bank on July 18, 2012, confirming the
establishment of an Inter-Ministerial Sub-Committee comprising of representatives
from the Ministry of Land, Country Planning and Environment; Works, Housing and
Infrastructure; and Information and Communications. In addition, the letter indicated
that the Office of National Security (ONS) and the Police under Freetown City
Council have been asked to assist the committee especially throughout enforcement of
67
the regulations governing land uses inside the ROW. The GoSL also required support
towards building the capacities of the Committee, in particular of the ONS and NPA,
for monitoring the line (See Annex 2). In response, technical assistance under
Component I of the Project has been especially targeted to strengthening NPA’s
distribution network monitoring program, to reduce impacts from population
encroachments and land uses that may negatively affect the operation of distribution
facilities. The Government has also prepared a draft plan of action for building
capacities for enforcing regulation and monitoring of the ROW (See Annex 3).
6.2 Compensation sharing among household members (tenant vs. owner)
Compensation of the household is calculated by adding values of lost land, values of
lost structures, value of loss of business revenues, amount of disturbance, values of
compensation for vulnerable individuals or groups, value of lost crops or trees. The
total loss is thus established for the household.
The sharing of compensation among members of the household is established during a
meeting of the household members. All members are informed that the sharing has to
take into account the principal that every member has to be in a similar or better
situation than the one they were in prior to the relocation. They are also informed that
the compensation will be in priority and essentially in-kind compensation (land, land
title, construction material, daily construction allowance for workers, trees, seeds,
tools, etc.) All members must agree and sign the household sharing agreement.
68
7.0 COMPENSATION
A 13 km-long 11kV section line, which included the 7.6 km Blackhall Rd-Wellington
line was added during project restructuring of the old Power and Water project in
December 2007. A portion of the upgrade of 11kV transmission lines was not
finalized, and this unfinished portion of the 11kV line is the 7.5km of 11kV Blackhall
Rd-Wellington which is now included in the new project for an upgrade to 33kV.
Assessment and compensation for 95% of the original 13 km of the 11kv line was
completed in the Power and Water project.
As indicated in Annex 1, a small number of structures (up to 4 households and up to 2
gas stations) may need to be relocated, and may be eligible for compensation from
resources under the Energy Access Project, unless NPA already has resources
previously committed and available. It is anticipated that most compensation payable
from the Project would be for temporary disturbances, where applicable and as
determined by the Resettlement Advisory Group (RAG) Committee, to households
and businesses during the period of rehabilitation and construction. It should be noted
that the Contractor’s Terms of Reference include safety measures which are designed
to minimize disturbances to households and businesses.
Compensation forms the high point of the process of implementation of the
Resettlement Action Plan (RAP). Those eligible for compensation are persons
whose lands, structures, and livelihoods would be affected – permanently or
temporarily – by the project.
Payment of compensation will be made directly by the Bank. All PAPs must
have signed the acceptance declaration in acceptance of the figures quoted for
their compensations prior to the date of payment. Each PAP will also be
required to sign a conveyance and a receipt of payment form at the
compensation centre.
Additionally, each PAP should be accompanied by a witness who would also
sign the conveyance as witness on their behalf.
All claimants will be furnished with identification cards with code numbers. A
spread sheet will be prepared stipulating their names and specific amounts to
be received.
Every stage of the process will be photographed, and all PAPs will be thumb
printed (See payment procedure)

69
7.1 Land System
The land system in Sierra Leone is categorised into the following:
State land
Private land
Communal land
Family land
The state land and private land categories predominate in the Western Area. In the
Provinces, the communal and family land categories are predominant. Here the
Paramount Chief is the custodian of all lands. Although he/she may not own land, yet
he/she has considerable influence over the process of land transaction, particularly
that relating to communal land.
The land system in the provinces is quite different from the land acquisition system in
the Western Area. Here, the Government has control only over State or Public Land.
In this update of the assignment, land sites which had been valued for compensation
are mainly private properties with the exception of a few state ones in certain areas of
the route line.
It should however be expressed that prices quoted for the private lands for the project
were dissatisfactory to their owners.
However, these prices were accepted on the grounds that the project is a national
development to which they also need to make their own contributions as citizens of
the Country.
In disputed areas where negotiations could not be reached between the parties for the
acquisition of a piece of land to be utilized by the Government for a project, the
Government can take an EMINENT DOMAIN to acquire or own such property.
“In any given situation where the Government has to take EMINENT DOMAIN in
disputed areas, this will require a fairly long process. The Minister of Lands will be
70
obliged to take the issue to Cabinet, and after Cabinet’s decision, it will be published
in the gazette for three consecutive times before possession of the property can be
effected. Failure to follow the prescribed procedure will nullify the entire process”.
7.2 Valuation
The value of land per square metre is still valued at $20 in the Western Area
by the Ministry of Lands and Country Planning. This value has however
increased in Leone equivalent as a result of the exchange rate to the Dollar, but
applicable only in dealing with the Ministry in the sale of land to private and
public entities.
The cost of private land is far higher than the value stipulated above. The
transaction is normally between the Buyer and the Seller.
Although some of the land may have been reclaimed from the Congo Bay in
areas like Congo Town, compensation will be paid for private lands valued at
the present day market value negotiated for.
However, since the Project Affected Persons would not be relocated in this
instance, the value for compensation has now changed and values of the
affected lands are provided accordingly. The value of land is the total cost of
the actual value of the piece of land, the survey and baking cost, as well as the
fees for the development of the site plan. This is arrived at by using the
valuation formula in stipulating the price of the land.
Valuation Formula:
Survey and Baking Cost (SBC)
Fees for Development of Site Plan (FDSP)
Land Value (LV)
= (SBC+FDSP+LV)
7.3 Compensation under Sierra Leone Law and the NPA supplement
Compensation must comply with two sets of rules; the Sierra Leone law and
World Bank safeguard policies. The latter is potentially more advantageous to
PAPs, especially with regard to the “full replacement cost”.
In line with the compensation system which was proposed for the Power and
Water project, it is proposed to distinguish clearly two terms within the
compensation amount:

71
§ C1 will be the amount calculated under Sierra Leone law, according to
official methods of calculation, excluding the disturbance allowance.
§ C2 will be an the NPA supplement intended at fulfilling WBG requirements,
§ C is the total compensation = C1+C2
§ In the case of in-kind compensation, part of the above-mentioned terms will
be the monetary counter-value of in-kind compensation.
Disturbance allowance shall be paid on top of C1.
These terms have been explained in consultations during the implementation
of the Power and Water project and will be undertaken during implementation of this
project so that PAPs and authorities will clearly distinguish between the
amount payable under Sierra Leone law, and the additional supplement from
the NPA.
The following table is the Entitlement Matrix from the Power And Water
project and will also be used for this project, though most of the compensation
in this project will be for temporary disturbance while the works are being
done in Component I:
Lost Asset Compensation under Sierra
Leone Law (C1)
NPA Supplement to meet world
Bank Requirements (C2)
Land with title Cash valuation based upon
reasonable market value of
land
For all compensation, land for land
will be the first option
so that people will end up leaving
their home for another
home at the new site with a: 15%
disturbance
allowance.
Land with no title No compensation Replacement by equivalent land &
titles, so that people
will end up leaving their home for
another home at the
new site with a:
+ 10% disturbance allowance
Limitation of use of land
with title
Reasonable cash valuation of the
loss resulting from the limitation of
use
+ 15% disturbance allowance
Limitation of use of land
with no title
No compensation Valuation of limitation of use will
be compensated in cash
for all cases.
+ 10% disturbance allowance
Permanent houses with
land title
Valuation on a case-by-case basis,
based upon the reasonable
replacement market value
+ 15% disturbance allowance
Permanent houses with
no land title
No compensation Replacement house for those who
opt for land-for-land
compensation and for those who
wish to be relocated on
the remaining part of their plot. +
10% disturbance
allowance
Semi-permanent or non-
permanent houses or
other structures with
Valuation based upon reasonable
replacement cost of type of material
and time
+ 15% disturbance allowance

72
titles
Semi-permanent or non-
permanent houses or
other structures without
titles
No compensation Valuation based upon replacement
cost of type of
material + time + 10% disturbance
allowance
Perennial or annual crops
on lost land or
encumbered land or land
submitted to limitation of
use with titles
Valuation based on reasonable loss + 15% disturbance allowance
Perennial or annual crops
on lost land or
encumbered land or land
submitted to limitation of
use without titles
No compensation Valuation based on reasonable loss
+ 10% disturbance allowance
Business income with
title
Valuation based on reasonable loss + 15% disturbance allowance
Business income without
title
No compensation Establish access to similar
opportunities
Tenants No compensation Must be compensated whatever the
legal recognition of
their occupancy. In-kind
compensation +
disturbance allowance 10%
Cost of moving No compensation Leones 200,000 per resettled
household paid in cash +
transportation cost
7
7.4 Summary of RAP Implementation Budget
Compensation set aside for the four new structures identified for
demolition/adjustments in the RoW, per the March 2012 report, as well as the
removal of the two gas stations in the vicinity of the Wellington sub-station,
confirmed as a hazard by NPA..One of the four new structures in the March
2012 report is a cement structure located at NPA tower 45. The current cement
structure has replaced a zinc structure identified for demolition under the
original RAP, Therefore ,compensation for the current cement structure
remains to be sought first under the original RAP.
o Sub-total: $37,000
Compensation set aside for applicable temporary disturbances
o Sub-total: $39,000
Contingency
o Sub-total: $1,000
Implementation Budget $77,000

73
8.0 GRIEVANCE MECHANISM
Consequent of the fact that dissatisfactions do occur in resettlement compensation processes, a
grievance mechanism was developed at the initial stage of the update and a committee was set up
to resolve all complaints as and how they arose, in the implementation of the RAP.
The grievance committee comprised of the following representatives;
Legal Adviser
NPA Representative
Community Councillor ( from City Council)
Witness NGO – Representative
PAP Representatives
Community Elder
A Chairman and a secretary have been appointed from amongst the committee membership. All
complaints are to be received by the secretary who would inform the chairman. Meetings of the
committee are held once a month, at which all complaints or grievances are addressed.
Functions of the Grievance and Complaints Committee:
To receive all complaints from aggrieved persons;
Look into all complaints and internally resolve them amicably;
Where the aggrieved person or persons remain dissatisfied, or the matter goes beyond the
mandate of the committee, the Legal Adviser will counsel as to which action should be
taken;
Make recommendations to the implementation team and the NPA, about issues from the
RAP implementation;
Stand as a mediating force to manage all RAP conflicts;
In circumstance where the aggrieved person is still dissatisfied and wishes to seek redress
in the Court of Law, he/she could do so with the assistance of a private Lawyer at his/her
own expense. Where the NPA is implicated, the Legal Adviser will represent NPA in the
court of law;

74
Where an in-house settlement is required, Legal representatives of the aggrieved parties,
the NPA and two independent persons suggested by either party will be present to reach
an amicable settlement;
In situations where the beneficiary dies and the heir apparent is to inherit any benefit, the
Task Force with the help or presence of family members would manage the issue.
9.0 MONITORING AND EVALUATION
Monitoring and evaluation is designed to be part of the implementation process of the
assignment. Basically, it is meant to enhance the process of the assignment so as to overcome
any emerging issue during the course of the survey.
Accordingly, as it was also designed to be participatory, committees were formed by the PAPs to
take ownership of the project. The Witness NGO and a representative of the National Power
Authority were able to follow up and assess the process as it progressed from stage to stage.
In this regard two levels of monitoring and evaluation were introduced.
1. External Monitoring
External monitoring was deemed necessary to follow up and assess field activity during
the course of the survey. Monitoring indicators were noted by the various committees, the
Witness NGO and other parties. Follow up meetings were held at various stages which
climaxed into general meetings with the Project Affected Persons’ at which finishing
touches were put to the entire process.
These also included site visits by the World Bank Mission and their comments
incorporated into the main report culminating from previous ones in subsequent progress
report.
2. Internal Monitoring
This level of monitoring closely examined data collected and collated from field activity.
Draft Reports have equally been submitted and comments from the various parties have
now been incorporated into the Final Report.
This is to reflect the pattern or system of reporting to meet the standard requirement or
procedure of the World Bank.

75
10.0 EMERGING ISSUES
Key concerns raised by the PAPs include:
Their safety while living in the ROW of the Transmission Line
Encroachment issues
Delays in compensation for their properties and tenants
Amounts of compensation
Loss of income or access to households/businesses due to temporary disturbances
Education about safety and high tension electrification
Drawing on the experience of the Power and Water project, the Government has
committed to resolving compensation issues quickly and effectively, based on ongoing
consultations with the PAPs.

76
11.0 CONCLUSIONS
1. Stakeholders meetings should be continued to be convened to make all necessary
clarifications that will assure the PAPs of their continuous safety while living under the
Transmission Line.
2. Sensitization should be on-going up to the time of stringing or testing the Transmission
Line.
3. Perimeter fences should be built around the towers in the built up areas to avoid any
further encroachment. An inter-ministerial committee has been established to examine
ways in which the Government, local authorities, and communities may work together to
ensure the integrity and safety of the Transmission Line. Funding has been set aside in
the project so that this committee can undertake its Terms of Reference.
4. It will be important to resolve any of the outstanding issues regarding encroachment and
to communicate how the Government will proceed with finalizing any compensation, as
well as compensating any PAPs who are affected by the Energy Access project. As the
PAPs have already been compensated through the Power and Water project, only some
funds have been set aside for this project (mostly for temporary disturbances).

77
ANNEX 1: FIELD VISIT REPORT ON ENCROACHMENT
FIELD VISIT TO UPDATE THE COMPLETED RAP FOR THE 7.5KM 11KV OVERHEAD
DISTRIBUTION LINE BETWEEN THE SUB-STATIONS BLACKHALL RD AND WELLINGTON AND SITE
INSPECTION OF THE AREA WHERE REPLACEMENT OF AN UNDERGROUND 11 KV LINE (CABLE)
FOLLOWING EXISTING ROADS (AND RIGHT OF WAY) BETWEEN THE SUB-STATIONS BLACKHALL
RD AND WELLINGTON TAKE PLACE.
On Thursday March 23, 2012, the team consisting of Elika Dadsetan (Social Development
Consultant), Nikolay Nikolov (Senior Energy Specialist) Bernarda Perez (Social Development
Specialist), Edward Cavaly (Senior Electricity Superintendant, NPA), Crispin Pearce (Laynaa
Consultants) and Bai Bai (Laynaa Consultants) inspected the majority of the 7.5km 11kV
overhead distribution line and found that construction (under the T-line including the towers) is
still ongoing.
The purpose of the field verification was to (i) check on new encroachments in and around
towers; (ii) check if there are new structures violating the vertical clearance of 5 meters; (iii) and
check if structures made of steel or other metals may be in place close to the towers threatening
peoples live and the line's security.
3 new structures (2 under construction and one totally constructed) were identified by Laynaa
Consultants. There is one structure that can be considered new, although it replaced an already
identified structure that is included in the compensation matrix.
The name of the owner and location of the structure has been captured in the table below.
New Structures identified
Owners/occupant
s of structures
Type of Structure Type of
Demolition
Recommended
Violates Vertical
or Horizontal
Clearance?
Comments
1 A. Y. B. a HH of
10
Additionally there
are two tenants
with a total of 8
people. It was not
possible to get the
names and contact
information of the
tenants
This is a “new”
structure which
replaces a sinz
structure identified
for compensation.
The PAP upgraded
his shop (from zinc
to cement) rather
than demolishing
the zinc shop.
It was identified to
be demolished
completely by
NPA engineers,
and the team
agrees
Both. Tower 45 The cable which
holds the tower
passes through a
fire place for
cooking and
through the stairs
to the second floor.
He did not receive
the compensation
(5m LE because
instead of
demolishing the
zinc structure he
build a concrete

78
Owners/occupant
s of structures
Type of Structure Type of
Demolition
Recommended
Violates Vertical
or Horizontal
Clearance?
Comments
one.
Picture of Mr. B’s shop ( tower number 45 NPA numbering , and tower 4 Laynaas numbering)

79
Owners/occupant
s of structures
Type of Structure Type of
Demolition
Recommended
Violates Vertical
or Horizontal
Clearance?
Comments
Lowcost Junction
Owner of
Property:
2 Mr. K. B. K.
Kenema
Mr. Koroma
started the
construction of a
second floor and
the wood/cement
structure (on the
back side) is less
than a meter apart
from the conductor
of tower Number
XX
Discussion started
whether it would
be possible to
reduce the size of
the second floor
construction and
find other ways to
solve the leakage
issue.
Vertical and
Horizontal
Mr. Waffa
(Lebanese tenant
pre-financed the
construction of the
second floor by
paying a rent
advance of 2
years).
Laynna consultants
stopped the
construction at the
end of February,
although a written
notification has not
been sent.
NPA will have a
meeting to discuss
this case
Picture
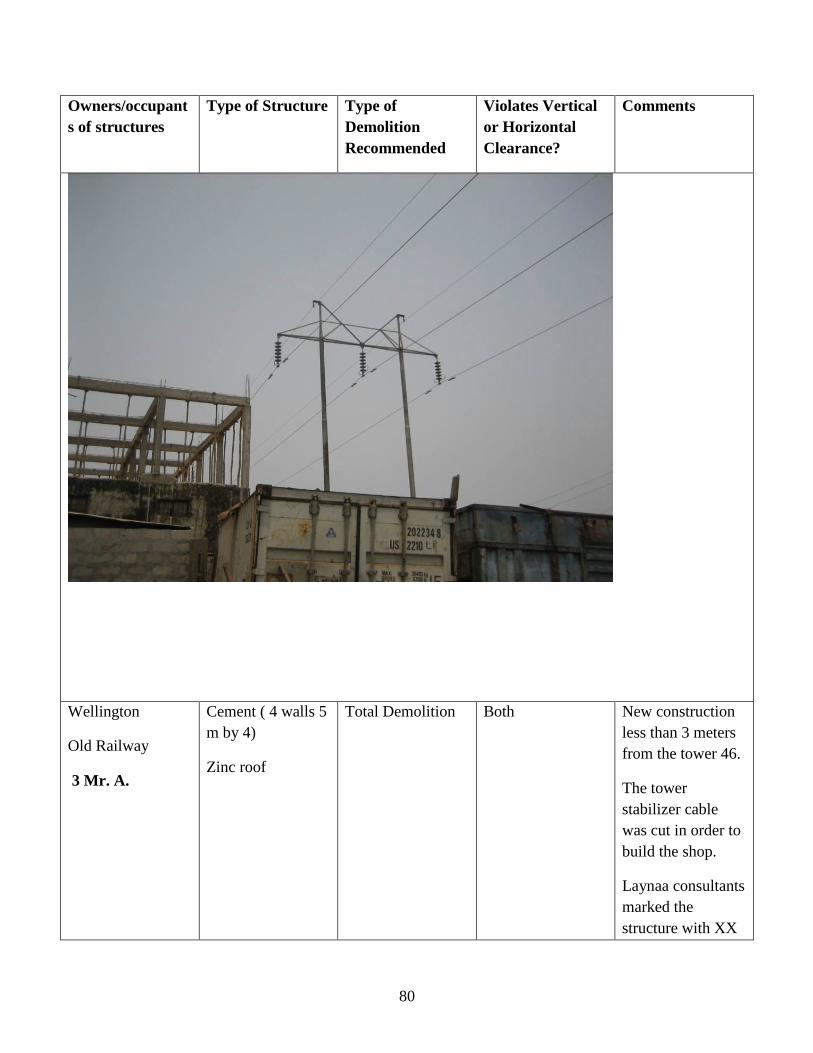
80
Owners/occupant
s of structures
Type of Structure Type of
Demolition
Recommended
Violates Vertical
or Horizontal
Clearance?
Comments
Wellington
Old Railway
3 Mr. A.
Cement ( 4 walls 5
m by 4)
Zinc roof
Total Demolition Both New construction
less than 3 meters
from the tower 46.
The tower
stabilizer cable
was cut in order to
build the shop.
Laynaa consultants
marked the
structure with XX
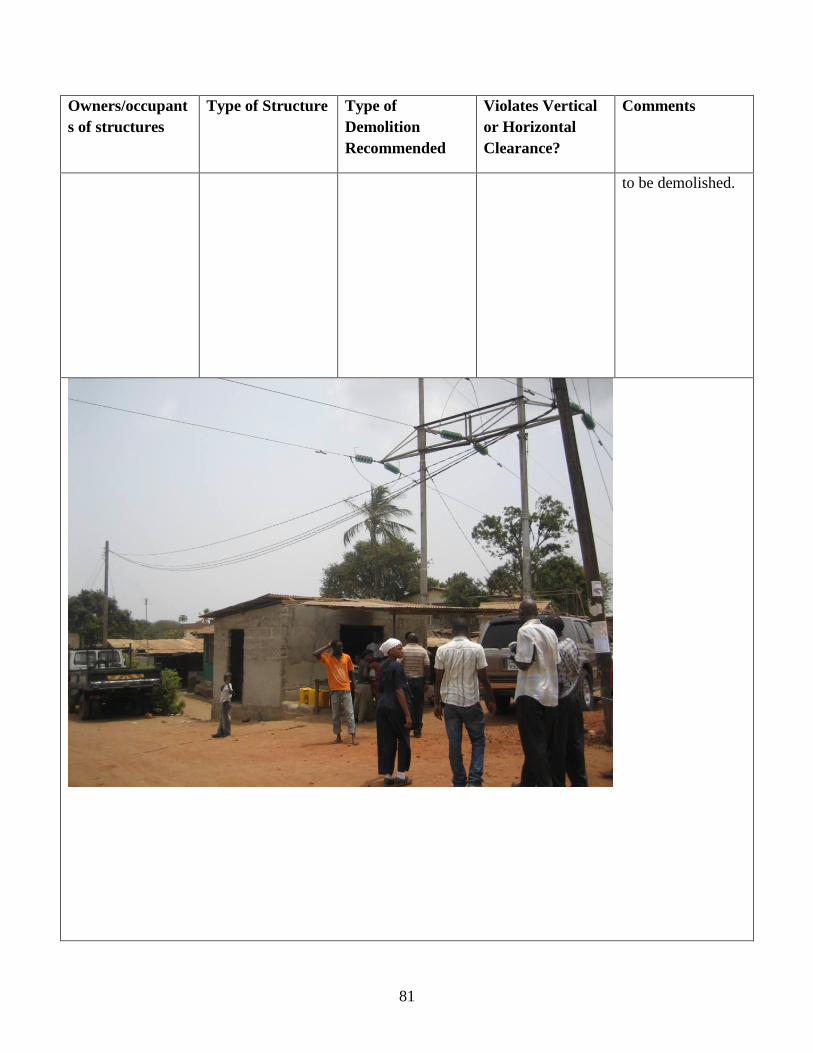
81
Owners/occupant
s of structures
Type of Structure Type of
Demolition
Recommended
Violates Vertical
or Horizontal
Clearance?
Comments
to be demolished.

82
Owners/occupant
s of structures
Type of Structure Type of
Demolition
Recommended
Violates Vertical
or Horizontal
Clearance?
Comments
Wellington
4 Not possible to
talk to the owner
Mud (4 by 4
meters)
Tower 47
To be determined
by engineers
New construction.
Laynaa consultants
marked the walls
with XX although
the owners covered
the XX and posted
posters on top.
Picture Not available

83
Findings:
4 new structures that violate the vertical clearance limit were found.
The Blackhall substation and the Wellington Substation are surrounded by a fence
therefore there is no encroachment in the compound.
There is an old (2 pumps for diesel) gas station approximately 50 m away from the
Wellington Substation. The diesel is stored underground. NPA to decide if this is a
hazard.
The demolition/partial demolition of structures which received compensation seems to be
delayed in some cases because demolition cost was not calculated in the compensation
payment, therefore some PAPS used that money to build somewhere else and do not have
any incentive to pay/work to demolish the structure. In some cases they demolish up to
the point where they take the wood, zinc and other material to reutilize and they leave it
there. In other cases, when women are the PAP it is difficult for them to demolish/clear
the rubbish after demolition (case of A. D.).
Out of the 7 critical structures only 3 have been demolished, 2 started demolition and on
the other 2 structures (compensated for total demolition around tower 2 and 25)
demolition has not been started yet.
Out of the 16 additional structures to be demolished or partially demolished only 5 have
been demolished, 2 have started demolishing and the remaining 8 structures are still there
(4 to be totally demolished and 4 to be partially demolished).
Recommendations:
Denis Garvie, manager of NPA, has sent a letter to the Office of National Security about
the violations to the right of way for some of the new structures identified. Follow up on
this matter is urgently needed, even more now that Laynaa consultant reported that Mr.
Bai reported that we was confronted by a PAP (with a knife) while reminding them that
the deadline for demolition was past due.
A random check of the second tranche of payments made to PAPs for the 11 KV is
recommended
Written notifications to be sent to owners of new structures that violate vertical and
horizontal clearance.
NPA should rely less on Laynaa consultants and may want to set up a team of people to
monitor the line on a monthly basis. The line could be divided in two segments, one to be
patrolled by the workers of Wellington Station, and the other by the workers of Blackhall
substation.
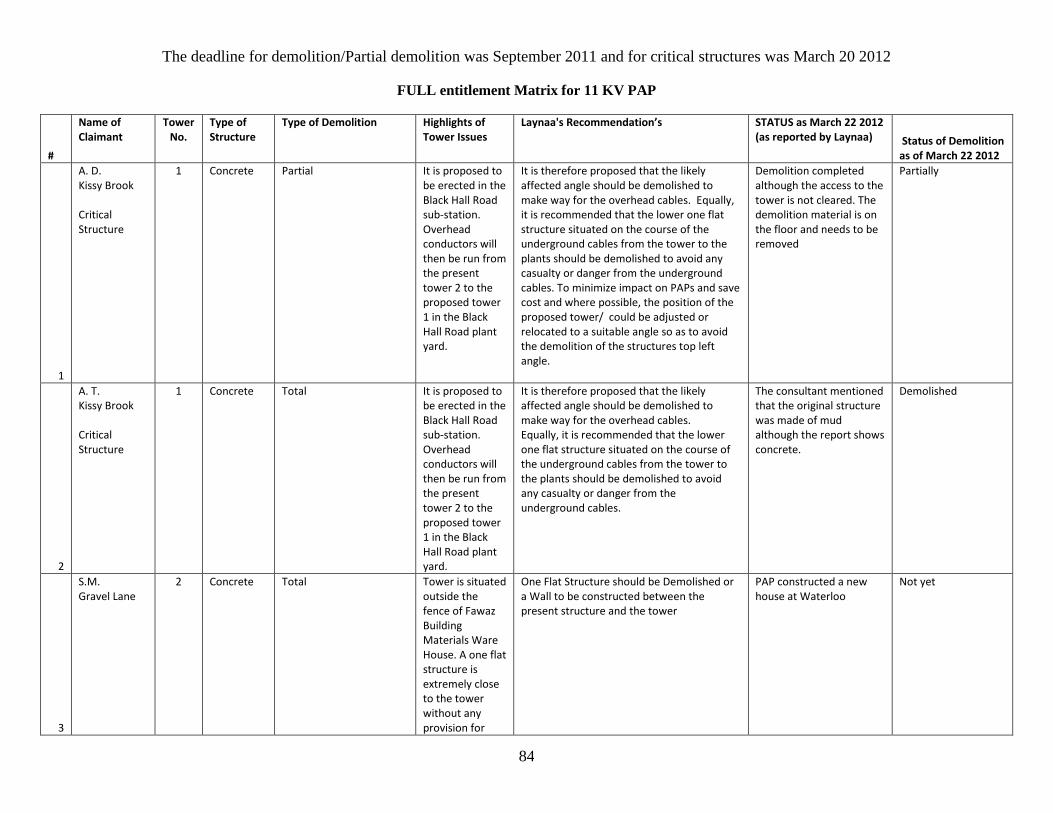
84
The deadline for demolition/Partial demolition was September 2011 and for critical structures was March 20 2012
FULL entitlement Matrix for 11 KV PAP
#
Name of Claimant
Tower No.
Type of Structure
Type of Demolition Highlights of Tower Issues
Laynaa's Recommendation’s STATUS as March 22 2012 (as reported by Laynaa) Status of Demolition
as of March 22 2012
1
A. D. Kissy Brook Critical Structure
1 Concrete Partial It is proposed to be erected in the Black Hall Road sub-station. Overhead conductors will then be run from the present tower 2 to the proposed tower 1 in the Black Hall Road plant yard.
It is therefore proposed that the likely affected angle should be demolished to make way for the overhead cables. Equally, it is recommended that the lower one flat structure situated on the course of the underground cables from the tower to the plants should be demolished to avoid any casualty or danger from the underground cables. To minimize impact on PAPs and save cost and where possible, the position of the proposed tower/ could be adjusted or relocated to a suitable angle so as to avoid the demolition of the structures top left angle.
Demolition completed although the access to the tower is not cleared. The demolition material is on the floor and needs to be removed
Partially
2
A. T. Kissy Brook Critical Structure
1 Concrete Total It is proposed to be erected in the Black Hall Road sub-station. Overhead conductors will then be run from the present tower 2 to the proposed tower 1 in the Black Hall Road plant yard.
It is therefore proposed that the likely affected angle should be demolished to make way for the overhead cables. Equally, it is recommended that the lower one flat structure situated on the course of the underground cables from the tower to the plants should be demolished to avoid any casualty or danger from the underground cables.
The consultant mentioned that the original structure was made of mud although the report shows concrete.
Demolished
3
S.M. Gravel Lane
2 Concrete Total Tower is situated outside the fence of Fawaz Building Materials Ware House. A one flat structure is extremely close to the tower without any provision for
One Flat Structure should be Demolished or a Wall to be constructed between the present structure and the tower
PAP constructed a new house at Waterloo
Not yet

85
#
Name of Claimant
Tower No.
Type of Structure
Type of Demolition Highlights of Tower Issues
Laynaa's Recommendation’s STATUS as March 22 2012 (as reported by Laynaa) Status of Demolition
as of March 22 2012
clearance limits at the back of the fence.
4
A. K. N. and M. F. Peace Market
3 Concrete Total Tower close to a small concrete store at peace market
Recommended by engineers to be demolished to give clearance for maintenance.
Not yet
5
M. F. Peace Market
3 Concrete Total Not yet
6
A. Y. B. Horse Shoe Road
4 Zinc Total It is located at the Junction to Kissy Ferry Terminal. It is close to two long stores and a zinc structure
The zinc structure and the stores close to the tower are recommended to be demolished.
PAP did not receive the compensation on time. Instead of demolishing he build a cement structure to replace the zinc structure
Not yet
7
H. Y. K. Bai Bureh Road
9 Concrete Partial Inside Alatipas compound close to the structure
Engineers need to take a second look and advice accordingly.
In process

86
#
Name of Claimant
Tower No.
Type of Structure
Type of Demolition Highlights of Tower Issues
Laynaa's Recommendation’s STATUS as March 22 2012 (as reported by Laynaa) Status of Demolition
as of March 22 2012
8
P. A. M. Old Railway Line
12 Mud Total/Partial This tower is between three structures. The structures are directly underneath the tower and the drainage of the toilet passes under the base of the tower making it difficult for engineers to access the tower.
It is advised that all three structures are demolished to provide the required standard clearance limits both vertically and horizontally.
Demolished
9
L. C. Africanus Road
13 Concrete Partial Encircled by the building
Affected part already Demolished to give aannexccess for maintenance.
Demolished
10
A. A. T. Bai Bureh Road
20 Mud Total Tower is close to a mud structure and a zinc store, and falls under the clearance limits.
The structures are recommended to be demolished since they equally breach the standard clearance limits.
Demolished
11
A. K. Bai Bureh Road
21 Mud Partial Close to a tailor shop and there is hardly access to the tower.
It is therefore recommended to be demolished to provide unimpeded access to the tower.
Not yet

87
#
Name of Claimant
Tower No.
Type of Structure
Type of Demolition Highlights of Tower Issues
Laynaa's Recommendation’s STATUS as March 22 2012 (as reported by Laynaa) Status of Demolition
as of March 22 2012
12
A. K. Bai Bureh Road Critical Structure
25 Concrete Total This tower is described as an angular tower whose position has to be strengthened with stay wires from every angle to give it support to transmit to the various angles of the line
It is therefore advised that the structure should be demolished since its present position is dangerous because it is too close to the angular tower.
Not yet
13
M. C. Power Magazine Street
26 Concrete Steps Demolished
14
F. J. Power Magazine Street
27 Zinc Partial This tower is located in a compound of three concrete structures, the steps at the back of the main house are advised to be demolished to provide access to the tower.
It is therefore strongly advised that the extension must be demolished to maintain the clearance required.
Not yet
15
M. B. Old Railway Line
29 Concrete Partial This tower is encroached by a concrete structure.
A partial demolition of that structure is recommended.
Demolished
16
S. K. Old Railway Line Critical Structure
30 Mud Partial This tower is between two houses.
The house in front is recommended to be demolished to give clearance and access to the tower for maintenance. Tower to be fenced to 5 feet height for safety.
In process

88
#
Name of Claimant
Tower No.
Type of Structure
Type of Demolition Highlights of Tower Issues
Laynaa's Recommendation’s STATUS as March 22 2012 (as reported by Laynaa) Status of Demolition
as of March 22 2012
17
A. B. M. Antana Street
32 Mud/Zinc Total It is encroached by a mud and zinc structure.
Recommended by engineers to be demolished to give clearance for maintenance.
Not yet
18
P. A. S. Old Railway Line Critical Structure
34 Concrete/Zinc
Partial Affected by a zinc structure which is very close (less than 2 meters) to the foot of the tower
Recommended by engineers to be demolished to give clearance for maintenance.
Demolished
19
A. W. J. Old Railway Line
35 Mud Total mud structure and a zinc toilet excessively encroached the 7.5m horizontal clearance from the tower.
Both structures are advised to be demolished to provide access to the tower since the structures are situated on the only access route to the tower.
In process
20
B. S. Lower Congo Water
39 Concrete Wall/Step/Kitchen
Partial The fence, steps and kitchen need to be cleared to create space for the maintenance of the tower
The fence, steps and kitchen are recommended to be demolished
Not yet
21
G. K. Lower Congo Water
40 Concrete Partial In the heart of a newly constructed structure. No clearance issues with this.
The top extension over the corridor of the newly constructed structure should be slashed off to make way for the stay wires from the tower to the ground.
Not yet
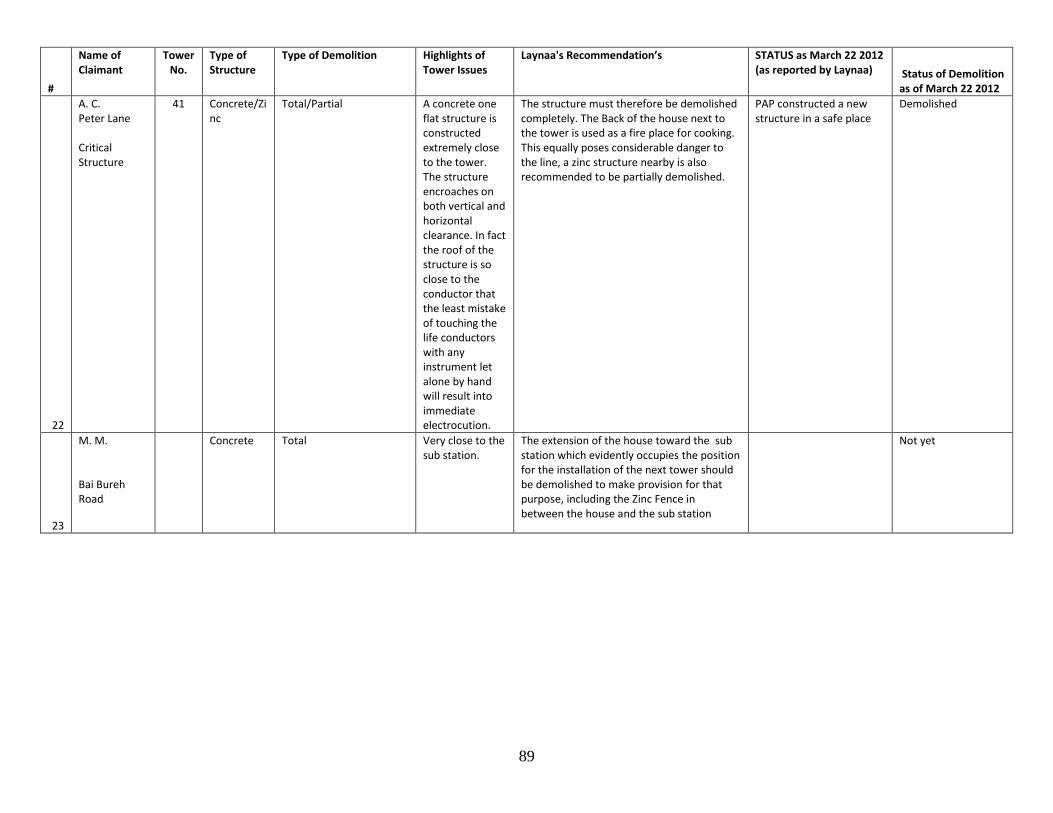
89
#
Name of Claimant
Tower No.
Type of Structure
Type of Demolition Highlights of Tower Issues
Laynaa's Recommendation’s STATUS as March 22 2012 (as reported by Laynaa) Status of Demolition
as of March 22 2012
22
A. C. Peter Lane Critical Structure
41 Concrete/Zinc
Total/Partial A concrete one flat structure is constructed extremely close to the tower. The structure encroaches on both vertical and horizontal clearance. In fact the roof of the structure is so close to the conductor that the least mistake of touching the life conductors with any instrument let alone by hand will result into immediate electrocution.
The structure must therefore be demolished completely. The Back of the house next to the tower is used as a fire place for cooking. This equally poses considerable danger to the line, a zinc structure nearby is also recommended to be partially demolished.
PAP constructed a new structure in a safe place
Demolished
23
M. M. Bai Bureh Road
Concrete Total Very close to the sub station.
The extension of the house toward the sub station which evidently occupies the position for the installation of the next tower should be demolished to make provision for that purpose, including the Zinc Fence in between the house and the sub station
Not yet
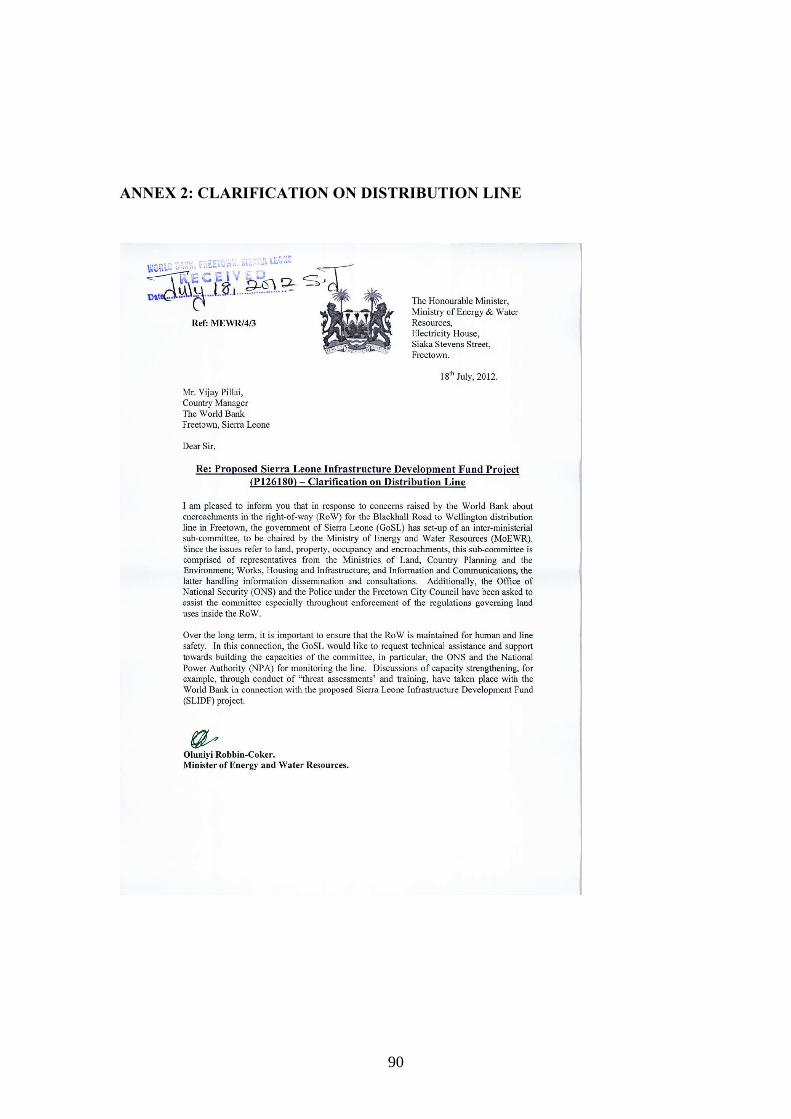
90
ANNEX 2: CLARIFICATION ON DISTRIBUTION LINE

91
ANNEX 3: MONITORING ACTION PLAN FOR DISTRIBUTION LINES IN
THE FREETOWN AREA
Government of Sierra Leone
National Power Authority
MONITORING ACTION PLAN
FOR DISTRIBUTION LINES
IN THE FREETOWN AREA
The National Power Authority
Electricity House, 4th
Floor
Siaka Stevens Street
Freetown, Sierra Leone

92
Table of Contents
I. Introduction
II. Definition of the Right of Way
III. Relocation in the Right of Way
IV. Monitoring Action Plan
1) Line Monitoring and Site Inspections
2) Monitoring Indicators
3) Capacity Building
4) Monitoring Implementation Schedule
Annex 1: Right of Way Monitoring Criteria for Sierra Leone
Annex 2: Example of a Design Clearance Standard

93
LIST OF ABBREVIATIONS
AGO Diesel oil
EHV Extra high voltage
EU European Union
FCC Freetown City Council
GoSL Government of Sierra Leone
HV High voltage
ICNRIP International Commission on Non-
Ionizing Radiation Protection
IEC International Electricity
Commission
kms kilometers
kV kilovolts
M&E Monitoring and evaluation
MFO Marine fuel oil
MLCP Ministry of Lands and Country
Planning
MoEWR Ministry of Energy and Water
Resources
MW Megawatts
NPA National Power Authority
ONS Office of National Security
PAPs Project affected persons
RAC Resettlement Advisory Committee
RAP Resettlement Action Plan
RoW Right of Way
TL Transmission line
94
I. INTRODUCTION
This report contains the key elements and procedures of the Government of Sierra
Leone’s (GoSL) Monitoring Action Plan for Distribution Lines in the Freetown Area
(hereinafter referred as the Plan). The Plan covers the electricity distribution system’s
right of way (RoW) in and around the Freetown urban and peri-urban areas. It covers
the definition of the RoW based on horizontal and vertical clearance limits that would
be acceptable in order to maintain the efficient and safe functioning of the distribution
system. The report also describes the institutional arrangements that the GoSL has set
up to protect the line and reduce damages to the line, as well as the policies and
procedures for occupancy and use of the RoW land and other assets.
The Ministry of Energy and Water Resources (MoEWR) is the main institutional arm
of the government for planning and implementing energy sector development
programs. It covers the activities of the National Power Authority (NPA) and
regulates its performance on a sector wide level. Since the civil war (1991 – 2002), its
consequences (e.g. massive destruction of infrastructure and facilities) on the network
distribution system have reduced most of the electricity operations of NPA to the
Western Area, the peninsula on which the capital Freetown is situated. Since then, the
Ministry of Energy and Water Resources (MoEWR) has supported the NPA in the
task of rehabilitating and expanding the national electricity grid.
The efficient functioning of the grid is vital since the commissioning of the 50 MW
Bumbuna hydroelectric power plant (Bumbuna) in late 2009. The dam has almost
doubled Sierra Leone’s installed capacity and changed its power generation mix.
Today, overall installed generation capacity is approximately 82.5 MW, including two
thermal power plants at Kingtom (10 MW) and Blackhall Road (16.5 MW) that
together with Bumbuna serve the Freetown Capital Western area. In addition, there is
a 6 MW feeding system in the Bo-Kenema areas. Nevertheless, current power
generation capacity remains highly inadequate to accommodate the country’s overall
power demand. Hydropower from Bumbuna is seasonal, producing less than 20 MW
during the dry season. High costs of imported fuel for the thermal power plants,
coupled with transmission and distribution bottlenecks, further reduce available
capacity. As a result, existing supply can meet approximately half the demand in
Freetown, let alone in the rest of the country.
Sierra Leone’s transmission and distribution systems are in the incipient stage and not
able to keep up with generation capacity expansion. The national transmission system
consists of only one radial 161 kilovolts (kV) transmission line extending 200 km
from the substation at Bumbuna to the Freetown substation and connected to NPA's
distribution network. Distribution capacity is severely constrained. NPA’s distribution
network suffers from high technical and non-technical losses caused by lack of
maintenance, overloading and inadequate metering, billing and revenue collection.
Overall, it is estimated that the network can evacuate no more than 35 MW of power.
As of 2011, transmission and distribution losses stand at 38 percent, largely in excess
of 9 to 12 percent. The low voltage levels in certain areas and the high level of fault
occurrence contribute to poor quality of supply. At present, black outs and load
shedding are commonplace. If not addressed, transmission and distribution
bottlenecks will constrain the expansion of generation capacity. Further, suppressed
electricity demand will increase considerably in line with continued economic growth.

95
Over the past year, NPA has taken some preliminary steps to improve its
performance. Network upgrading and a re-metering program for replacing post-paid
(credit) meters with efficient pre-paid meters are being implemented primarily with
donor support. In addition, cash collection has been outsourced to local commercial
banks. Roughly 37 percent of NPA’s customers now have pre-paid meters. In 2011,
the average collection rate has improved significantly from 67 to 76 percent. The
systematic implementation of a loss reduction program has been established as one of
the prior-actions for the next Governance Reform and Growth Credit (Budget
Support) by the World Bank. In order to access the credit, the GoSL will need to
demonstrate tangible progress in implementing the program by December 2012. Non-
technical losses can be brought to an acceptable level in the next 18-24 months. This
would relieve NPA’s fragile financial situation and contribute to reduce tariffs in the
short- to medium-term. Reducing technical losses entails extensive rehabilitation of
the distribution network and will require much more time. In the short term, the best
prospects for reducing technical losses are on the 161kV line from Bumbuna and the
primary distribution network in Freetown.
There is an urgent need to rehabilitate and upgrade distribution infrastructure in
Freetown area, which have become dilapidated during the civil war and subsequent 10
years of neglect. The scope of works will include line and substation upgrades and the
installation of a161/33kV transformer at Freetown substation. Further investments
will focus on the upgrading of other critical components of the network, including the
11kV line from Blackhall Road to Wellington substations; a 33/11kV transformer at
Wellington substation and related substation equipment at Blackhall Road,
Wellington and Wilberforce substations. The focus of these upgrades is to improve
evacuation capacity from the 16.5 MW Blackhall Road diesel power station during
times when insufficient hydropower is available from Bumbuna. Equipment
specification for installation and maintenance will be based on international quality
standards.
Presently, the only operational power plants in the Western Area are the NPA’s power
stations Kingtom (10MW) and Blackhall Road (16.5MW). The fuel oils used for
power generation at NPA are Marine Fuel Oil (MFO) and Diesel Oil (AGO). These
are imported and account for over 60 percent of NPA’s operating expenses.
However, an inspection of NPA substations and review of utility operating processes
and procedures, including assessment of application of safety standards, revealed
significant gaps and lack of human capacity. This is due partly to critical gaps in skills
especially in maintaining the line network. A lingering problem is monitoring the
RoW to ensure safety and reliability of energy distribution. More importantly, the
RoW needs to be secured in order to protect human health and safety of populations
who occupy lands in or within the vicinity of the power lines.
Institutional deficiencies represent a major obstacle to the efficient and reliable supply
and distribution of energy. While the 1982 NPA Act is intended to provide NPA with
a high degree of autonomy through an independent Board—which still lacks greater
private sector representation—the continuing lack of autonomy and sustainable
finances undermine the effectiveness of NPA’s operations. For long-term
sustainability, NPA has expressed its desire to run on a commercial basis, including

96
achieving a target rate of return. While the provisions for creating the needed reforms
towards NPA’s financial and institutional viability are being introduced, an urgent
concern continues to be the monitoring of the electricity line network RoW.
II. DEFINITION OF THE RIGHT OF WAY (RoW)
For purposes of monitoring the RoW, which is the land that covers the area
underneath the distribution line cables, conductors and towers, the legal definition in
Sierra Leone will be adopted. Generally, the land and resources in the RoW are
classified as State-owned land extending horizontally 15 m on both sides of the center
of the line and vertically as the air space 5 m from the nearest physical structure to the
conductor.
The RoW “exclusion zone” is determined on the basis of the 5 m vertical safety
clearance as defined by two geometric profiles – the longitudinal and transverse. The
longitudinal profile is defined by the sag of the conductors between adjacent towers.
The transverse profile is defined by the horizontal distance between conductors (5 m)
plus a lateral distance of 5 m to 7 m from the center line of each of the conductors.
The width of the exclusion zone is determined by the lateral distance between the two
conductors (5 m) and the minimum clearance requirement on either side. [drawing
below is not to scale]
400m
The longitudinal profile along the center line of the RoW, showing horizontal
separation of towers (about 400 m), sag of conductors (hyberbolic cosine), and
vertical exclusion zone height of 5 m – 7 m clearance plus 4 m (average height of all
structures in the RoW). The horizontal length of the exclusion zone is calculated as
220 m (55 percent of the distance between towers) based on the equation describing
the shape of the sag of the conductors. This length is a good approximation for both
horizontal and inclined surfaces.
Tower
5 m 5 m 23m Conductors
11 m
19 m
ROW = 30 m
ROW = 30 m
11m

97
The transverse profile perpendicular to the center line of the RoW includes the
separation between conductors (5 m) and setback distance (7 m) on either side of the
outer conductors. Ideally, the RoW should be demarcated as 30 m wide.
However, in reality, the RoW horizontal demarcation of lands inside the RoW
specifications is not observed. The main reason is the historical occupation of the
RoW by predominantly slum settlements. In the past, the GoSL allowed the use of
such land inside the RoW. In order to continue such occupation to occur, international
standards will be applied under the following conditions:
The presence of residential and other buildings inside the RoW is acceptable, as in
use in other countries and allowed by the International Electricity Commission (IEC)
Standards. Of course, the specified clearances (vertical and horizontal) to conductors
must be complied with, at maximum specified conductor operation temperature of 65
degrees C, with the catenary vertical as well as displaced by the action of strong wind
pressure up to 30 degrees. Design and operation precautions minimize the risk of
conductor breakage or fall-down over buildings during the whole industrial life of the
T-Line including the commissioning period. Metallic roofs shall be adequately
connected to ground electrodes.
Annex 1 summarizes the salient features of the IEC standards as these apply to the
RoW, and in particular, in the context of Freetown and vicinity.
The RoW guidelines note: “If it is reported that many houses and huts have been built
under or in close proximity to the T-Line with length of approximately 1.5 kms,
compliance with the specified clearances and the other measures and precautions
need to be adopted, and will ensure safety and health preservation of people.”
On the health implications of the RoW, the guidelines note: “The exposure of people
to 50 Hz magnetic and electric fields is by far lower than the limits stipulated by the
International Commission on Non-Ionizing Radiation Protection (ICNIRP)
guidelines, by the European Union (EU) directives and lower than the more
precautionary limits stipulated by the National Standards of some industrialized
countries, as Italy.”
Allowing human settlements to continue to occupy lands inside the RoW, as applied
by GoSL, is consistent with Sierra Leone’s Constitution, as follows: “The
Constitution includes provisions to protect the rights of individuals to private
property, and also sets principles under which citizens may be deprived of their
property in the public interest as described in Section 21. It also makes provision for
the prompt payment of adequate compensation and access to the court or other
impartial and independent authority for the determination of the land owner’s interest
or right, and the amount of any compensation to which he/she is entitled and for the
purpose of obtaining prompt payment of that compensation.”

98
III. RELOCATION IN THE RIGHT OF WAY
Consistent with the “rights” established by the NPA for long-term occupants of the
RoW, the NPA approved and disclosed in 2010 a Resettlement Action Plan (RAP) to
allow occupants inside the RoW to move their structures. The RAP identified the
project affected persons (PAPs) under the World Bank financed Power and Water
Project, which closed in 2011. The RAP covered key segments of the distribution
network in the Freetown area and contained the provisions for compensation and
removal of structures that were within the vertical clearance and safety limit.
The RAP covered the distribution network from Kingtom substation, which passes
through the Kingtom Cemetery and the refuse dump or land fill into Congo Town.
The line then stretches across the street from the Congo Town Bridge, through the
rugged paths of the Congo Town settlement to the Congo Cross Bridge, from where it
continues along the edges of the slopes at Tengbeh Town. A separating point, which
is the T-off-point, starts from Tengbeh Town to Riverside Drive and to Wilberforce,
across the Military Barracks up to the NPA substation situated at the junction of Spur
Loop.
The other angle of the line route runs through Cantonment Road up to the Hill Top,
off- King Harman Road down to New England and Belair Park. The line is then
diverted straight to the top of the Hill in Sumaila Town, over looking the West End
and centre of Freetown, up to Leicester Road. At this point the line then carefully
avoids the crowded settlements of Mountain Cut. It shifts to Fourah Bay College on
Mount Aureol where it takes a steep turn to the right at the back of the Lower Faculty
of Fourah Bay College. Finally, the line runs down Mount Aureol Terrace to the top
of Blackhall Road and down to the Sanitary Department of the Ministry of Health and
Sanitation, by the Kissy Road Cemetery, and finally eases into the sub station at
Blackhall Road.
The RAP describes the RoW for the 33 kV distribution line as generally rough, rocky
and hilly. Much of the RoW runs along mountain slopes and hill tops. Most of the
RoW area is navigable by motorbike, but only to certain points. The rest of the line is
accessible on foot especially at the Eastern front from Leicester Road through Fourah
Bay College, Mount Aureol Terrace down to Black Hall Road where the NPA sub
station is located.
The 11 kV T-Line RoW is densely populated, mostly with semi-permanent and
permanent structures. There are no open lands, except for a small segment along a 500
m stretch of land. Seven structures were identified in the survey as posing threats to
line safety and human health – all of which were included in the RAP to be
compensated as they needed to be relocated.
Affected households were identified in the Census Stage of the survey. NPA sent a
notification letter to each PAP household head. This letter was followed by the
physical marking of the structure, which was observed by a local Sierra Leonian
Witness NGO and the community leader. All delineated structures that had to be

99
removed, to make way for the tower or to remove obstructions within the clearance
limit, were photographed together with the PAP household head.
During the valuation process, it was disclosed that the market value of land per square
meter was 86,360 Leones (approximately US$20) in the Western Area by the Ministry
of Lands and Country Planning (MLCP). The Resettlement Advisory Committee
(RAC) increased this value by 25 percent to reflect inflationary adjustments since
2004. This applied to almost 90 percent of PAPs who were classified by MLCP as
“urban squatters.”
Lands with documented titles or ownership were valued higher by the MLCP since
the cost of private property increased due to taxes and other payments made on the
property. The valuation also took into account the prevailing “buyer and seller” rates
within the last 6 months to one year of similar properties within the vicinity. Since
most of the land in the ROW belong to GoSL/NPA, less than 10 percent of affected
properties were privately owned.
The compensation payments were based on the value of land and structures, the
survey and baking costs, and the fees for the development of the site plan. This was
done by the MLCP survey team, and later, verified with the PAPs who had to sign a
document stating that they agreed with the valuation. If there are disputes over the
valuation process, the PAPs had the option of filing a complaint through the grievance
mechanism set up at the community level.
To date, 95 percent of PAPs in the 33 kV and 11 kV T-Line have been paid, as shown
in Table 1. The remainder of payments will be given to PAPs once complete
structures within the vertical clearance limits are removed from the RoW. A set-aside
bank account was arranged by NPA so that once the PAPs comply with the agreed
relocation schedule, the full payment will be completed.
Table 1 summarizes the RAP costs, including the compensation payments:
Table 1: Summary of RAP Affected Households and Compensation Payments Number of
Affected
Towers
Number of Project
Affected
Households
Amount of
Compensation
Payments (US$000)
Completed
Compensation
Payments (33 kV T-
Line)
26 164 74.469
Compensation Payments (11
kV T-Line)*
7 critical
structures
29 74.833
Transition and Moving
Allowances**
43*** 17.200
Sub-Total
Livelihood restoration 54 beneficiaries 31.890
Land Survey, Conveyances,
Construction of Protective
Walls, etc
4.755
TOTAL 33

100
* Pending payment upon demolition to Haya Adama Dumbaya. She received
32,742.000 Le remaining amount 10,000.400 Le
**Although their structures were not removed, the National Resettlement Advisory
Group allowed the payment of transition and moving allowances to 43 vulnerable
households who were asked to temporarily relocate during the T-Line rehabilitation
period.
*** These 43 households are included in the counting of PAPs in the 33 kV T-Line.
Throughout RAP implementation, NPA emphasized the sensitization of communities
and project affected persons (PAPs) about the safety and health impacts of the T-Line.
Sensitization was accordingly conducted from house to house, and in group meetings.
The first consultative meeting was held in November 2009 at the Presidential Lounge
at the National Stadium with all stakeholders. After extensive discussions and
consultations, some major decisions were taken to address the safety issues. These
decisions included the following:
(i) PAPs should take ownership of the project by fully participating in the relocation
implementation process, especially informing neighborhoods about safety measures;
(ii) Three implementation committees (Resettlement Advisory Committee, the
Grievance Committee, and the Monitoring Committee) were formed which would
include representatives of Government Ministries and the City Council of Freetown;
(iii) Land should be provided by the Government to resettle some of the PAPs within
the Freetown area; and
(iv) The Witness NGO and PAPs Representatives will monitor RAP

101
IV. MONITORING ACTION PLAN
The NPA organized in 2010 a Monitoring Committee, which also comprised a
Witness NGO and staff from NPA, in order to monitor the RoW, in particular,
management of land uses inside and adjacent to the RoW. This included provisions
for ensuring that the RoW vertical clearance limit (of 5 m) was respected at the
community level. Throughout the implementation period for the RAP, the committee
met only twice. Although the Monitoring Committee held some briefing meetings,
they did not specifically discuss measures for controlling illegal encroachments into
the RoW. Thus, NPA developed this Plan to ensure that there is continuity in RoW
monitoring.
Monitoring was to be accomplished by NPA through monthly site monitoring and
formulation of monthly and quarterly reports. The monitoring indicators were broadly
grouped into the following categories:
Creation of Task Force (composed of other ministries and Office of National
Security or ONS) – including the selection criteria adopted by NPA with an
outline of Task Force responsibilities under the long-term time frame;
Development of evaluation criteria for performance of NPA personnel who
will monitor the line;
Accessibility of office and information to communities overseeing the RoW;
Enforcement of a monitoring process, including the inspection of records and
impact assessment; and
Auditing of records indicating quality of monitoring.
The NPA engaged the Freetown City Council (FCC) and the ministries in charge of
the urban land reform process to better define the Plan for the RoW. The reasons for
expanding the Task Force mandate are two-fold:
The distribution line had to be secured from damage and theft to avoid
expensive network repairs; and
It was necessary to ensure human health and safety and prevent serious
accidents from occurring due to misuse of the RoW specifications resulting in
electrocution and death.
Line Monitoring and Site Inspections
The NPA would assign full time staff who would monitor the line and conduct regular
field trips and site inspections. The purposes are to identify any new encroachments,
and whenever necessary, to seek assistance from the police and ONS to stop any
further encroachments. The site visits would be conducted jointly with local officials
and community leaders, to the extent possible, in order to augment the responsibility
for securing the line RoW on a regular basis.
The results of the monthly site visits will be summarized in Quarterly Progress
Reports to the NPA officials. For example, some reports may refer to progress in
clearing the RoW from any encumbrances or obstructions. It will also contain the
status of the grievance resolution system, in case there are any complaints or problems
registered along the RoW.

102
Monitoring Indicators
NPA will adopt a set of monitoring indicators for the RoW. These indicators are
divided into responsibilities of the NPA monitoring team for: (i) quality of observance
of the clearances in the RoW by residential and business occupants; (ii) accuracy and
timeliness of the monitoring of RoW boundaries; (iii) quality of the grievance
mechanisms; (iv) quality of community participation in assisting NPA with the RoW
monitoring; and (v) extent and quality of stakeholder consultations.
Table 2: Monitoring Indicators for RoW
Indicators Rating*
1. Quality of RoW monitoring of occupancy observance of
clearances
1.1 Clarity of RoW boundaries
1.2 Clarity of understanding of the RoW boundaries
2. Accuracy and timeliness of monitoring of RoW site visits
2.1 Accuracy of RoW demarcations
2.2 Clarity of disclosure and explanation of the RoW rules
2.3 Timeliness of monitoring site visits
3. Quality of access to grievance mechanism and quality of
resolution of grievances
3.1 Accessibility of the grievance filing system
3.2 Clarity of explaining grievance mechanism
3.3 Effectiveness of grievance resolution
4. Quality of community participation in monitoring the RoW
4.1 Relevance of community leaders in assisting NPA with line
monitoring
4.2 Extensiveness of participation (role of civic leaders in monitoring
the RoW)
5. Extent and quality of stakeholder consultations
5.1 Comprehensiveness of stakeholder identification and analysis
5.2 Quality of stakeholder consultations (frequency, content,
feedback)
5.3 Quality of communications, information sharing, and disclosure
programs
*1=highly unsatisfactory; 2=moderately satisfactory; 3=satisfactory; and 4=highly
satisfactory
Capacity Building
NPA will conduct extensive capacity building for its line monitoring team. There will
be 3 staff assigned to the monitoring team. The team will be composed of three
members: (i) Team Leader, who will be in charge of assigning and scheduling the site
visits and submitting the Quarterly Monitoring Reports; (ii) Site Inspector, who will
assist the Team Leader in conducting the field and site visits on a monthly basis and
report any problems with encroachments and other forms of violations of the
clearance limits of the RoW; and (iii) Communications/Liaison Officer, who will be
assigned by NPA

103
to the Monitoring Team to strengthen the sensitization campaigns and conduct regular
consultations with community leaders and members along the RoW.
The skills to be developed would be in the following areas: (i) line security
monitoring and evaluation; (ii) community sensitization about the effects of energized
lines on human health and safety; (iii) effective policing and enforcing of RoW rules
and procedures; and (iv) communications and consultations with communities.
Proposed Implementation Schedule
The Monitoring Team will require financial assistance in order to carry out its work
while the NPA establishes a more sustainable system for longer-term line monitoring.
In the future, the NPA will be able to assign a full-time staff/unit dedicated for
ensuring that the RoW rules and procedures are enforced.
In the meantime, a short-term program for creating the foundations for such NPA line
monitoring would be implemented. The NPA will hire consultants and deploy NPA
staff to conduct site visits; ensure institutional coordination (among various ministries
and the ONS), develop effective communications programs; and promote capacity
building. The following timetable will be enforced:
Year 1 Year 2 Year 3
Establishment (including recruitment of consultants) for Monitoring
Team
X
Meetings of inter-agency monitoring committee (with ONS and FCC) X X X
Set up of monitoring office (including field sub-offices) X
Site visits and quarterly monitoring reports X X X
Evaluation reports X X X

104
ANNEX 1
Right of Way Monitoring Criteria for Sierra Leone*
The specified RoW width of 15 + 15 = 30 m should be retained, thus ensuring also
adequate clearance to trees and vegetation in conformity with the new IEC standards.
The presence of residential and other buildings inside the RoW is acceptable, as in use
in other countries and allowed by the IEC Standards. Of course, the specified
clearances (vertical and horizontal) to conductors must be complied with, at
maximum specified conductor operation temperatuire of 65 degrees C, with the
catenary vertical as well as displaced by the action of strong wind pressure up to 30
degrees. Design and operation precautions minimize the risk of conductor breakage or
fall-down over buildings during the whole industrial life of the T-Line including the
commissioning period. Metallic roofs shall be adequately connected to ground
electrodes.
Houses with non fire-resistant roofs, such as huts, should be relocated outside the
RoW, unless these comply with the clearance of 11.3 m specified by the new IEC
Standards. Replacement of roofs with fire resistant type is also acceptable.
In the few cases, if any, where the specified clearances to buildings are not complied
with, corrective measures should be applied such as: modification of building
structure; increase of height of towers and conductors; and demolition of buildings in
extreme cases.
The specified clearance above unobstructed ground, recreational areas, and main
roads should be complied with by the T-Line contractor, without exceptions.
The exposure of people to 50 Hz magnetic and electric fields is by far lower than the
limits stipulated by the International Commission on Non-Ionizing Radiation
Protection (ICNIRP) guidelines, by the European Union directives and lower than the
more precautionary limits stipulated by the National Standards of some industrialized
countries, as Italy.
Administrative and legislative measures should be enforced to forbid new residential
and public building construction anywhere within the 30 m RoW.
If it is reported that many houses and huts have been built under or in close proximity
to the T-Line with length of approximately 1.5 kms, compliance with the specified
clearances and the other measures and precautions need to be adopted, and will ensure
safety and health preservation of people.
On the other hand, high voltage (HV) and extra high voltage (EHV) T-Lines crossing
densely populated areas have a psychological impact on people, may disturb AM
radio reception, and in the long term, if people attention to safety rules were released,
there could be some risk of incident for people living under the conductors.
A drastic remedy that has been applied in many densely populated cities of developed
countries has been the replacement of the critical stretches of HV overhead TLs with

105
HV underground cables. In the last three decades the proven technology of HV cross
linked polypropylhene (XLPE) insulated cables has provided a reliable, although
expensive, solution simple for operation. With the rule of thumb, without having
inspected the site, the cost can be estimated at about 1 million Euro for the 1.5 km
long 161 kV cable line with transmission capacity equivalent to the overhead
transmission line.
A site inspection is necessary for assessing if the cable project is worth of
consideration. If justified and retained, obtainment of financing, procurement process
and project implementation would require not less than two years. During this time,
the power supply to Freetown is to be in any case performed by the overhead
transmission line, by making the checks and applying all the precautions
recommended in this report.
* The writer of this report, in his capacity of consultant to the Turkish Electricity Authority, has
engineered during the last 25 years several transformations of overhead HV and EHV TLs onto
underground cables in the major cities of Turkey, in particular in Istanbul. Projects have been generally
financed by the World Bank. However, in Turkey there are still many TLs overcrossing densely built
residential areas (e.g. a 380 kV line in Istanbul overcrossing a seven stories building!).

106
ANNEX 2
EXAMPLE OF A DESIGN CLEARANCE STANDARD

107