Embed Size (px)
Citation preview

2015 SECOND QUARTER REPORT
Q2For the three and six months ended June 30, 2015
BRITISH COLUMBIA
ALBERTA
SASKATCHEWAN
Calgary
C A N A D A
1
2
4
9
39
39
40
41
42
43
58
Highlights
Report to Shareholders
Management’s Discussion and Analysis
Condensed Consolidated Financial Statements
Condensed Consolidated Balance Sheets
Condensed Consolidated Statements of Comprehensive Income
Condensed Consolidated Statements of Shareholders’ Equity
Condensed Consolidated Statements of Cash Flows
Notes to the Condensed Consolidated Financial Statements
Corporate Information
AECO a storage and pricing hub for Canadian natural gas markets/d per dayboe barrels of oil equivalent (6 mcf of natural gas = 1 barrel of oil equivalent)bbl or bbls barrelsGORR gross overriding royaltymboe thousand boemcf thousand cubic feetmmboe million barrels of oil equivalentmmbtu million British thermal unitsmmcf million cubic feetNGL natural gas liquids (ethane, propane, butane, and condensate)WTI West Texas Intermediate, a benchmark crude oil used for pricing comparisonNI 51-101 National Instrument 51-101
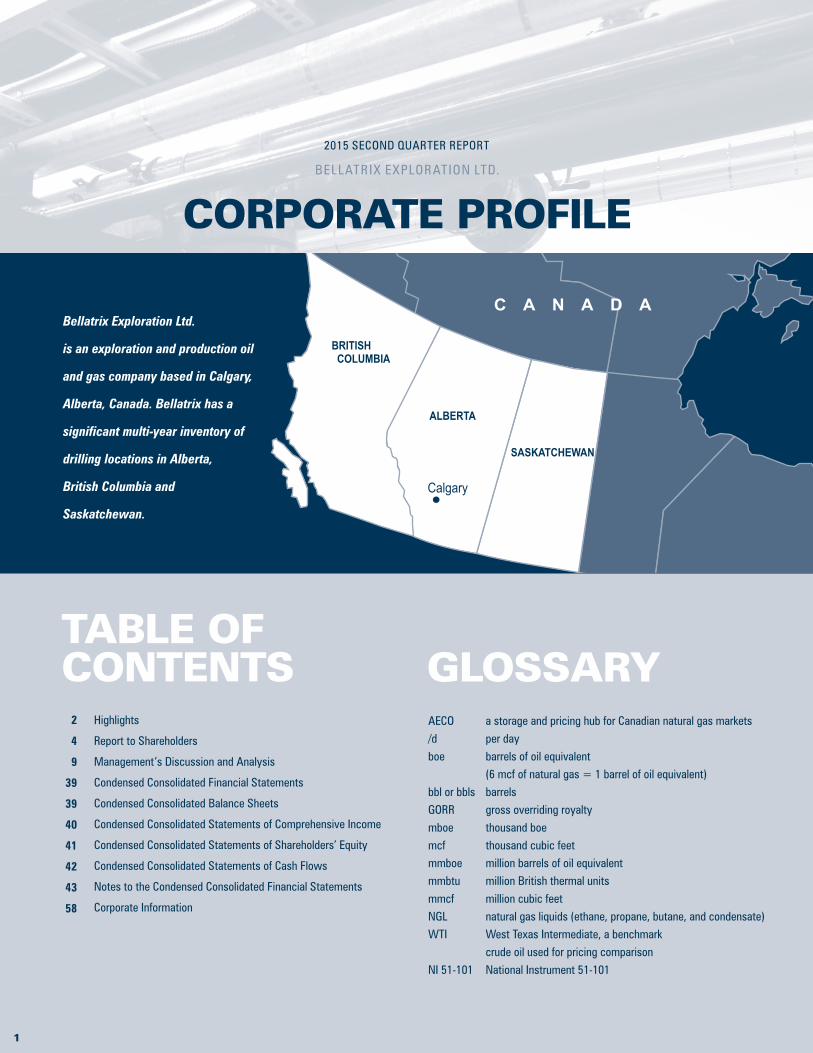
Bellatrix Exploration Ltd.
is an exploration and production oil
and gas company based in Calgary,
Alberta, Canada. Bellatrix has a
significant multi-year inventory of
drilling locations in Alberta,
British Columbia and
Saskatchewan.
CORPORATE PROFILE
GLOSSARYTABLE OF CONTENTS
BELLATRIX EXPLORATION LTD.
2015 SECOND QUARTER REPORT
2
HIGHLIGHTSBELLATRIX EXPLORATION LTD.
Forward-Looking StatementsThis financial report, including the report to shareholders, contains forward-looking statements. Please refer to our cautionary language on forward-looking statements and the other matters set forth at the beginning of the management's discussion and analysis (the “MD&A”) attached to this financial report.
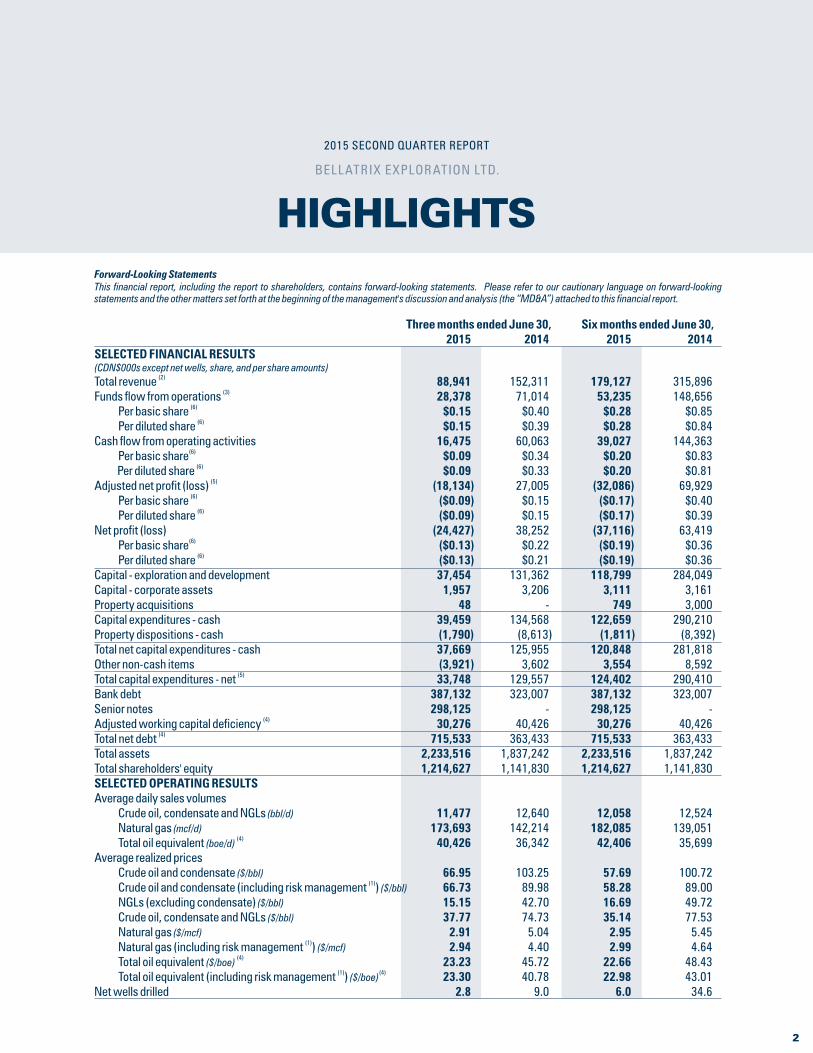
Three months ended June 30, Six months ended June 30, 2015 2014 2015 2014SELECTED FINANCIAL RESULTS (CDN$000s except net wells, share, and per share amounts)
(2)Total revenue 88,941 152,311 179,127 315,896(3)Funds flow from operations 28,378 71,014 53,235 148,656
(6) Per basic share $0.15 $0.40 $0.28 $0.85(6) Per diluted share $0.15 $0.39 $0.28 $0.84
Cash flow from operating activities 16,475 60,063 39,027 144,363 (6) Per basic share $0.09 $0.34 $0.20 $0.83
(6) Per diluted share $0.09 $0.33 $0.20 $0.81(5)Adjusted net profit (loss) (18,134) 27,005 (32,086) 69,929
(6) Per basic share ($0.09) $0.15 ($0.17) $0.40(6) Per diluted share ($0.09) $0.15 ($0.17) $0.39
Net profit (loss) (24,427) 38,252 (37,116) 63,419 (6) Per basic share ($0.13) $0.22 ($0.19) $0.36
(6) Per diluted share ($0.13) $0.21 ($0.19) $0.36Capital - exploration and development 37,454 131,362 118,799 284,049Capital - corporate assets 1,957 3,206 3,111 3,161Property acquisitions 48 - 749 3,000Capital expenditures - cash 39,459 134,568 122,659 290,210Property dispositions - cash (1,790) (8,613) (1,811) (8,392)Total net capital expenditures - cash 37,669 125,955 120,848 281,818Other non-cash items (3,921) 3,602 3,554 8,592
(5)Total capital expenditures - net 33,748 129,557 124,402 290,410Bank debt 387,132 323,007 387,132 323,007Senior notes 298,125 - 298,125 -
(4)Adjusted working capital deficiency 30,276 40,426 30,276 40,426(4)Total net debt 715,533 363,433 715,533 363,433
Total assets 2,233,516 1,837,242 2,233,516 1,837,242Total shareholders' equity 1,214,627 1,141,830 1,214,627 1,141,830SELECTED OPERATING RESULTS Average daily sales volumes Crude oil, condensate and NGLs (bbl/d) 11,477 12,640 12,058 12,524 Natural gas (mcf/d) 173,693 142,214 182,085 139,051
(4) Total oil equivalent (boe/d) 40,426 36,342 42,406 35,699Average realized prices Crude oil and condensate ($/bbl) 66.95 103.25 57.69 100.72
(1) Crude oil and condensate (including risk management ) ($/bbl) 66.73 89.98 58.28 89.00 NGLs (excluding condensate) ($/bbl) 15.15 42.70 16.69 49.72 Crude oil, condensate and NGLs ($/bbl) 37.77 74.73 35.14 77.53 Natural gas ($/mcf) 2.91 5.04 2.95 5.45
(1) Natural gas (including risk management ) ($/mcf) 2.94 4.40 2.99 4.64(4) Total oil equivalent ($/boe) 23.23 45.72 22.66 48.43
(1) (4) Total oil equivalent (including risk management ) ($/boe) 23.30 40.78 22.98 43.01Net wells drilled 2.8 9.0 6.0 34.6
2015 SECOND QUARTER REPORT
3
BELLATRIX EXPLORATION LTD.
HIGHLIGHTS
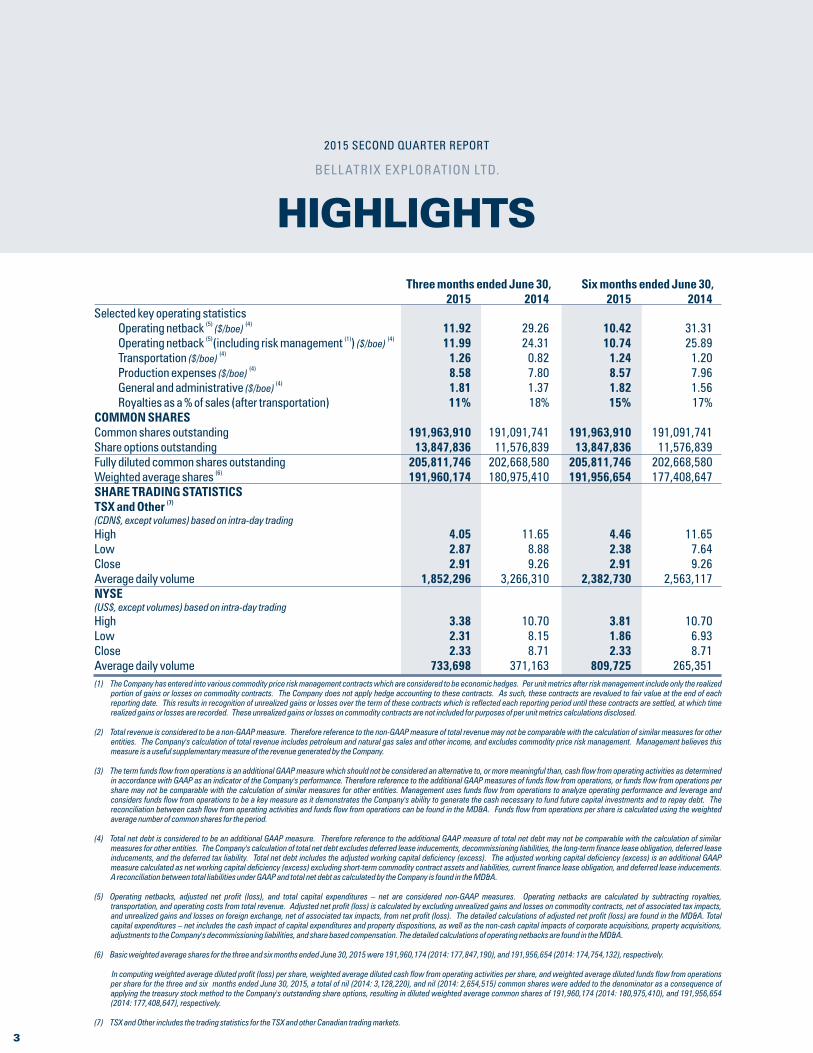
Three months ended June 30, Six months ended June 30, 2015 2014 2015 2014Selected key operating statistics
(5) (4) Operating netback ($/boe) 11.92 29.26 10.42 31.31(5) (1) (4) Operating netback (including risk management ) ($/boe) 11.99 24.31 10.74 25.89
(4) Transportation ($/boe) 1.26 0.82 1.24 1.20(4) Production expenses ($/boe) 8.58 7.80 8.57 7.96
(4) General and administrative ($/boe) 1.81 1.37 1.82 1.56 Royalties as a % of sales (after transportation) 11% 18% 15% 17%COMMON SHARES Common shares outstanding 191,963,910 191,091,741 191,963,910 191,091,741Share options outstanding 13,847,836 11,576,839 13,847,836 11,576,839Fully diluted common shares outstanding 205,811,746 202,668,580 205,811,746 202,668,580
(6)Weighted average shares 191,960,174 180,975,410 191,956,654 177,408,647SHARE TRADING STATISTICS
(7)TSX and Other (CDN$, except volumes) based on intra-day trading High 4.05 11.65 4.46 11.65Low 2.87 8.88 2.38 7.64Close 2.91 9.26 2.91 9.26Average daily volume 1,852,296 3,266,310 2,382,730 2,563,117NYSE (US$, except volumes) based on intra-day trading High 3.38 10.70 3.81 10.70Low 2.31 8.15 1.86 6.93Close 2.33 8.71 2.33 8.71Average daily volume 733,698 371,163 809,725 265,351(1) The Company has entered into various commodity price risk management contracts which are considered to be economic hedges. Per unit metrics after risk management include only the realized
portion of gains or losses on commodity contracts. The Company does not apply hedge accounting to these contracts. As such, these contracts are revalued to fair value at the end of each reporting date. This results in recognition of unrealized gains or losses over the term of these contracts which is reflected each reporting period until these contracts are settled, at which time realized gains or losses are recorded. These unrealized gains or losses on commodity contracts are not included for purposes of per unit metrics calculations disclosed.
(2) Total revenue is considered to be a non-GAAP measure. Therefore reference to the non-GAAP measure of total revenue may not be comparable with the calculation of similar measures for other entities. The Company's calculation of total revenue includes petroleum and natural gas sales and other income, and excludes commodity price risk management. Management believes this measure is a useful supplementary measure of the revenue generated by the Company.
(3) The term funds flow from operations is an additional GAAP measure which should not be considered an alternative to, or more meaningful than, cash flow from operating activities as determined in accordance with GAAP as an indicator of the Company's performance. Therefore reference to the additional GAAP measures of funds flow from operations, or funds flow from operations per share may not be comparable with the calculation of similar measures for other entities. Management uses funds flow from operations to analyze operating performance and leverage and considers funds flow from operations to be a key measure as it demonstrates the Company's ability to generate the cash necessary to fund future capital investments and to repay debt. The reconciliation between cash flow from operating activities and funds flow from operations can be found in the MD&A. Funds flow from operations per share is calculated using the weighted average number of common shares for the period.
(4) Total net debt is considered to be an additional GAAP measure. Therefore reference to the additional GAAP measure of total net debt may not be comparable with the calculation of similar
measures for other entities. The Company's calculation of total net debt excludes deferred lease inducements, decommissioning liabilities, the long-term finance lease obligation, deferred lease inducements, and the deferred tax liability. Total net debt includes the adjusted working capital deficiency (excess). The adjusted working capital deficiency (excess) is an additional GAAP measure calculated as net working capital deficiency (excess) excluding short-term commodity contract assets and liabilities, current finance lease obligation, and deferred lease inducements. A reconciliation between total liabilities under GAAP and total net debt as calculated by the Company is found in the MD&A.
(5) Operating netbacks, adjusted net profit (loss), and total capital expenditures – net are considered non-GAAP measures. Operating netbacks are calculated by subtracting royalties, transportation, and operating costs from total revenue. Adjusted net profit (loss) is calculated by excluding unrealized gains and losses on commodity contracts, net of associated tax impacts, and unrealized gains and losses on foreign exchange, net of associated tax impacts, from net profit (loss). The detailed calculations of adjusted net profit (loss) are found in the MD&A. Total capital expenditures – net includes the cash impact of capital expenditures and property dispositions, as well as the non-cash capital impacts of corporate acquisitions, property acquisitions, adjustments to the Company's decommissioning liabilities, and share based compensation. The detailed calculations of operating netbacks are found in the MD&A.
(6) Basic weighted average shares for the three and six months ended June 30, 2015 were 191,960,174 (2014: 177,847,190), and 191,956,654 (2014: 174,754,132), respectively.
In computing weighted average diluted profit (loss) per share, weighted average diluted cash flow from operating activities per share, and weighted average diluted funds flow from operations per share for the three and six months ended June 30, 2015, a total of nil (2014: 3,128,220), and nil (2014: 2,654,515) common shares were added to the denominator as a consequence of applying the treasury stock method to the Company's outstanding share options, resulting in diluted weighted average common shares of 191,960,174 (2014: 180,975,410), and 191,956,654 (2014: 177,408,647), respectively.
(7) TSX and Other includes the trading statistics for the TSX and other Canadian trading markets.
2015 SECOND QUARTER REPORT
4
REPORT TO SHAREHOLDERS
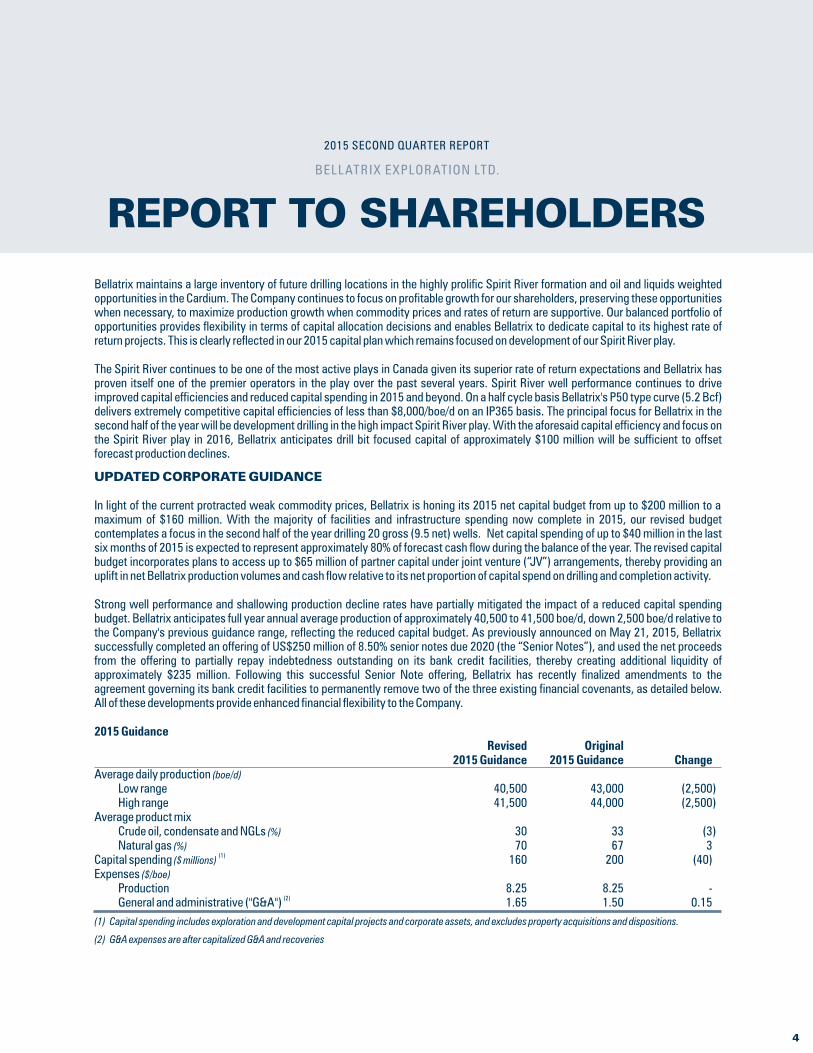
Bellatrix maintains a large inventory of future drilling locations in the highly prolific Spirit River formation and oil and liquids weighted opportunities in the Cardium. The Company continues to focus on profitable growth for our shareholders, preserving these opportunities when necessary, to maximize production growth when commodity prices and rates of return are supportive. Our balanced portfolio of opportunities provides flexibility in terms of capital allocation decisions and enables Bellatrix to dedicate capital to its highest rate of return projects. This is clearly reflected in our 2015 capital plan which remains focused on development of our Spirit River play.
The Spirit River continues to be one of the most active plays in Canada given its superior rate of return expectations and Bellatrix has proven itself one of the premier operators in the play over the past several years. Spirit River well performance continues to drive improved capital efficiencies and reduced capital spending in 2015 and beyond. On a half cycle basis Bellatrix's P50 type curve (5.2 Bcf) delivers extremely competitive capital efficiencies of less than $8,000/boe/d on an IP365 basis. The principal focus for Bellatrix in the second half of the year will be development drilling in the high impact Spirit River play. With the aforesaid capital efficiency and focus on the Spirit River play in 2016, Bellatrix anticipates drill bit focused capital of approximately $100 million will be sufficient to offset forecast production declines.
UPDATED CORPORATE GUIDANCE
In light of the current protracted weak commodity prices, Bellatrix is honing its 2015 net capital budget from up to $200 million to a maximum of $160 million. With the majority of facilities and infrastructure spending now complete in 2015, our revised budget contemplates a focus in the second half of the year drilling 20 gross (9.5 net) wells. Net capital spending of up to $40 million in the last six months of 2015 is expected to represent approximately 80% of forecast cash flow during the balance of the year. The revised capital budget incorporates plans to access up to $65 million of partner capital under joint venture (“JV”) arrangements, thereby providing an uplift in net Bellatrix production volumes and cash flow relative to its net proportion of capital spend on drilling and completion activity.
Strong well performance and shallowing production decline rates have partially mitigated the impact of a reduced capital spending budget. Bellatrix anticipates full year annual average production of approximately 40,500 to 41,500 boe/d, down 2,500 boe/d relative to the Company's previous guidance range, reflecting the reduced capital budget. As previously announced on May 21, 2015, Bellatrix successfully completed an offering of US$250 million of 8.50% senior notes due 2020 (the “Senior Notes”), and used the net proceeds from the offering to partially repay indebtedness outstanding on its bank credit facilities, thereby creating additional liquidity of approximately $235 million. Following this successful Senior Note offering, Bellatrix has recently finalized amendments to the agreement governing its bank credit facilities to permanently remove two of the three existing financial covenants, as detailed below. All of these developments provide enhanced financial flexibility to the Company.
2015 Guidance Revised Original 2015 Guidance 2015 Guidance ChangeAverage daily production (boe/d) Low range 40,500 43,000 (2,500) High range 41,500 44,000 (2,500)Average product mix Crude oil, condensate and NGLs (%) 30 33 (3) Natural gas (%) 70 67 3
(1) Capital spending ($ millions) 160 200 (40)Expenses ($/boe) Production 8.25 8.25 -
(2) General and administrative ("G&A") 1.65 1.50 0.15(1) Capital spending includes exploration and development capital projects and corporate assets, and excludes property acquisitions and dispositions.
(2) G&A expenses are after capitalized G&A and recoveries
BELLATRIX EXPLORATION LTD.
2015 SECOND QUARTER REPORT
5
SUCCESSFUL COMPLETION OF PHASE 1 OF THE BELLATRIX ALDER FLATS DEEP-CUT GAS PLANT
The second quarter marked the successful completion of construction of Phase 1 of the Bellatrix O'Chiese Nees-Ohpawganu'ck deep-cut gas plant in the Alder Flats area of Alberta (“Bellatrix Alder Flats Plant” or the “Plant”) ahead of schedule and on budget. Completion of the Plant represents a significant milestone for the Company and highlights the culmination over the last 3 years work of planning, design, and construction. The construction, commissioning and start-up phases of this major project were safely performed with zero lost time incidents. Initial Plant start-up commenced on May 22, 2015, followed by first delivery of natural gas volumes to sales. Subsequent to Plant start-up, Bellatrix successfully increased volume throughput at the Plant, ultimately achieving inlet gas volumes of over 110 MMcf/d by mid-June with overall Plant reliability over the last month at approximately 98%. Performance testing of the Plant confirmed design rate recoveries for ethane, propane, and butane. The Plant design capacity has also been tested during a trial with an inlet rate of 125 MMcf/d.
The benefits of the Plant are threefold. Firstly, the Plant is the most modern and efficient plant in our greater core West Central Alberta area, thus it enhances overall operational reliability and control of natural gas processing. Secondly, the Plant provides an estimated 64% reduction in the operating costs attributed to net Bellatrix natural gas volumes relative to volumes processed at third party facilities in the greater Ferrier region. Finally, the Plant was designed with enhanced NGL recovery capability providing greater revenue capture from our significant resource base.
With Phase 1 of the Plant now completed, Bellatrix has unfettered processing capability to grow company volumes to approximately 60,000 boe/d without material capital spending on infrastructure over the near term. Reduced facility capital spending is anticipated to enhance overall corporate capital efficiencies, and reduce total finding and development costs. With significant pre-build and flexibility for Phase 2 already incorporated into our design and footprint at Alder Flats, Bellatrix remains committed to construction of Phase 2 with an expected on-stream date in mid-2017. Remaining capital spending over the next two fiscal years for Phase 2 net to Bellatrix's interest is estimated at approximately $50 million. Phase 2 will double the base design capacity of the Plant to 220 MMcf/d and provide further growth potential to Bellatrix of up to a total of 80,000 boe/d.
ALDER FLATS PLANT PROVIDES ENHANCED OPERATIONAL CONTROL AND EXPECTED RELIABILITY
The industry continued to face natural gas takeaway constraints in West Central Alberta during the second quarter as work continued on various laterals, compressor maintenance, and ongoing improvements on the Canadian mainline natural gas transmission system. At times during the second quarter interruptible takeaway capacity was entirely restricted with additional limitations on producers to approximately 90% of firm takeaway capacity. Additional transmission system maintenance and restrictions are expected during the summer, however, with the Bellatrix Alder Flats Plant now fully operational, the Company expects to meaningfully realize improvements in operational control and reliability of processing during the second half of the year which we expect will mitigate impacts from third party facility downtime and potential negative impacts from ongoing maintenance on the Canadian mainline gas transmission system. In addition Bellatrix added approximately 110 MMcf/d of firm takeaway capacity on the Canadian mainline gas transmission system upon completion of the Plant, thereby providing more than sufficient capacity for existing net volumes and providing room for future growth. With completion of the Plant, and incremental firm service capacity, Bellatrix has seen a significant improvement in operational reliability and reduced impact from system constraints and curtailments during July.
PROACTIVE FINANCIAL MANAGEMENT THROUGH THE CURRENT COMMODITY PRICE ENVIRONMENT
Proactive management of the balance sheet and financial position continued in the second quarter of 2015. Subsequent to the early negotiation of covenant relief from our syndicate of lenders in the first quarter, on May 21, 2015 the Company completed a US$250 million offering of 8.50% senior unsecured notes due 2020 thereby providing Bellatrix enhanced liquidity and increased financial flexibility to successfully navigate the current commodity price environment. In addition, the semi-annual review of the borrowing base under the Company's revolving credit facilities was approved at $600 million in June 2015. At June 30, 2015, the Company had $212.9 million of undrawn capacity on its credit facility, excluding outstanding letters of credit of $5.7 million that reduce the amount otherwise available to be drawn on the facility.
REPORT TO SHAREHOLDERSBELLATRIX EXPLORATION LTD.
2015 SECOND QUARTER REPORT
6
More recently, and subsequent to the end of the second quarter, Bellatrix's syndicate of lenders have approved elimination of two of the three financial covenants contained in the agreement governing its bank credit facilities. Specifically, the syndicate has agreed to remove both the Total Debt to EBITDA and EBITDA to interest expense covenants leaving only one financial covenant being a maximum consolidated Senior Debt to EBITDA ratio of 3.5 to 1, stepping down to 3.0 to 1 for the quarter ending June 30, 2017 but including thereafter an expander of 0.5 times for the two quarters immediately following a material acquisition (for details of how Total Debt, EBITDA and Senior Debt are defined under the agreement governing the credit facilities see "Long Term Debt" in the MD&A). As part of the agreement to remove these financial covenants, the Company agreed that any further issuances of subordinated indebtedness (but excluding refinancing of the existing Senior Notes) will require majority lender approval. All other aspects of the facilities including the borrowing base and the next redetermination on November 30, 2015 remain unchanged. The amended agreement provides further financial flexibility to the Company.
Additionally, during the second quarter, Bellatrix enhanced its risk management program with the addition of longer term risk management contracts in 2016 and 2017 through a mix of fixed price and basis swap hedging contracts. Bellatrix has begun adding longer term risk management contracts as part of its strategy to mitigate natural gas price volatility and exposure, and to provide increased predictability of revenue and cash flow beyond the current calendar year. By employing both fixed price and basis swap risk management contracts, Bellatrix maintains fixed price protection on a portion of its forecast natural gas volumes, and retains upside potential on US dollar natural gas prices in the future while mitigating potential adverse movements in the AECO basis differential over the 2016 to 2017 timeframe. Bellatrix's hedging program is part of its overall risk management strategy focused on providing reduced price risk volatility, and greater assurance of future revenue and cash flow which drive the capital and reinvestment decisions within our business.
CONTINUED FOCUS ON COST REDUCTION AND ACTIVITY OPTIMIZATION EFFORTS
In addition to the aforementioned bank credit facility covenant amendment and added liquidity created by terming up a portion of the Company's bank debt, Bellatrix continues to work diligently to ensure balance sheet stability. The Company spends capital in three principal areas: capital and project expenditures, G&A costs, and operating costs. Service cost deflation and efficiency gains have resulted in average capital expenditure costs reduced by approximately 10% year over year. A continued focus on G&A reductions and other internal cost reduction initiatives also remains ongoing across all departments with full year G&A costs (before recoveries) expected to be reduced by approximately $9 million year over year. Finally, operational initiatives have contributed approximately $10 million in cost savings.
JOINT VENTURE PARTNERSHIPS PROVIDE STRATEGIC BENEFITS
Bellatrix's JV strategy provides access to third party capital on promoted terms, supporting continued development of the Company's large resource base during periods of higher infrastructure capital spending. Over the past ten quarters, Bellatrix has invested over $300 million in net infrastructure and facilities capital, thus JV arrangements have provided Bellatrix access to additional capital for drilling and completion activity to facilitate production growth during this period of higher infrastructure capital outlay. Our infrastructure footprint in West Central Alberta provides significant benefits and barriers to competition.
In the second half of 2015, Bellatrix intends to access up to $65 million of partner capital under its JV arrangements, principally with Grafton Energy Co. I Ltd (“Grafton”). Capital spent under the Grafton JV enhances Bellatrix internal rate of return expectations on wells drilled relative to organic development opportunities, providing clear benefits during periods of lower commodity prices. Furthermore, JV directed capital provides an uplift in net Bellatrix production volumes and cash flow relative to its net proportion of capital spent on drilling and completion activity. Pursuant to the Grafton JV terms, Grafton contributes 82% of the drill, complete, equip and tie-in costs to earn 54% of Bellatrix's working interest before payout (being recovery of Grafton's capital investment plus an 8% internal rate of return), reverting to a 33% working interest after payout (convertible to a 17.5% gross overriding royalty). The JV arrangements provide an alternative source of funding without equity or debt dilution to shareholders.
REPORT TO SHAREHOLDERSBELLATRIX EXPLORATION LTD.
2015 SECOND QUARTER REPORT
6
OPERATIONAL AND FINANCIAL HIGHLIGHTS
Production in the second quarter 2015 averaged 40,426 boe/d (72% natural gas weighted). Second quarter 2015 production increased 11% from an average of 36,342 boe/d realized in the second quarter of 2014.
Capital spending on exploration and development activities of $37.5 million included $21.5 million on facilities and equipment as
we successfully completed construction of Phase 1 of the Bellatrix Alder Flats Plant in the second quarter of 2015. Also included in second quarter capital was approximately $4.0 million of capital spent on Phase 2 of the Plant that is expected to be on-stream in mid-2017.
Operating costs averaged $8.58/boe in the second quarter 2015. Excluding one-time adjustments related to prior periods, production expenses per boe for the six months ended June 30, 2015 were $7.99/boe, below our current full year corporate expectation.
In the second quarter of 2015, Bellatrix drilled and/or participated in 4 gross (2.8 net) Spirit River liquids-rich gas wells. Two of the
operated Spirit River liquids-rich gas wells were drilled under our Grafton JV.
As at June 30, 2015, Bellatrix had approximately 372,926 net undeveloped acres of land in Alberta, British Columbia, and Saskatchewan.
Bellatrix successfully completed a private offering of US$250 million of 8.50% Senior Notes due 2020 during the second quarter
2015. The Company used the net proceeds from the Senior Note offering to partially repay borrowings outstanding under its credit facility. The semi-annual review of the borrowing base under the Company's revolving credit facilities was approved at $600 million in June 2015 which provides continued financial flexibility and an improved liquidity position. At June 30, 2015, Bellatrix had $212.9 million of undrawn capacity on its credit facility, excluding outstanding letters of credit of $5.7 million that reduce the amount otherwise available to be drawn on the facility.
Adjusted net profit (loss) for the three and six months ended June 30, 2015 was a loss of $18.1 million and $32.1 million,
respectively. The adjusted net loss of $32.1 million incurred in the first six months of 2015 compared to an adjusted net profit of $69.9 million realized in the same period in 2014 was primarily due to the continued weak commodity price environment throughout the first half of 2015. Realized prices in the first half of 2015 decreased by 43% in crude oil and condensate, 66% in NGLs, and 46% in natural gas from the first six months of 2014.
Total revenue decreased by 42% to $88.9 million for the three months ended June 30, 2015, compared to $152.3 million realized in
the second quarter of 2014. Total crude oil, condensate, and NGL revenues contributed 44% of total revenue realized in the second quarter of 2015, compared to 56% in the second quarter of 2014. Total revenue decreased by 43% to $179.1 million for the six months ended June 30, 2015, compared to $315.9 million realized in the first six months of 2014. Total crude oil, condensate, and NGL revenues contributed 43% of total revenue realized in the first half of 2015, compared to 56% in the first half of 2014.
Funds flow from operations generated in the three months ended June 30, 2015 was $28.4 million ($0.15 per basic share), a decrease of 60% from $71.0 million ($0.40 per basic share) in the second quarter of 2014. Funds flow from operations generated in the six months ended June 30, 2015 was $53.2 million ($0.28 per basic share), a decrease of 64% from $148.7 million ($0.85 per basic share) in the first half of 2014.
The corporate operating netback realized for the three months ended June 30, 2015 decreased by 59% to $11.92/boe compared to $29.26/boe in the second quarter of 2014. After including commodity risk management contracts, the corporate operating netback for the second quarter of 2015 was $11.99/boe, compared to $24.31/boe in the second quarter of 2014.
G&A expenses net of capitalized G&A and recoveries for the three and six months ended June 30, 2015 were $6.7 million ($1.81/boe) and $14.0 million ($1.82/boe), compared to $4.5 million ($1.37/boe) and $10.1 million ($1.56/boe) in the comparative 2014 periods, respectively. G&A net costs are higher year over year given lower recoveries in 2015 related to reduced capital spending compared to 2014.
At June 30, 2015, Bellatrix had approximately $1.71 billion in tax pools available for deduction against future income.
REPORT TO SHAREHOLDERSBELLATRIX EXPLORATION LTD.
2015 SECOND QUARTER REPORT
7
OUTLOOK
With the majority of facilities and infrastructure spending now complete in 2015, we shift our focus to development drilling and leveraging joint venture capital in the high impact Spirit River play in the second half of the year. This concentrated development program is expected to enhance overall corporate operating and capital efficiencies. Bellatrix is currently operating three drilling rigs which we expect to maintain through the third quarter principally drilling wells within our JV arrangements and focused on Falher and Notikewin opportunities in the Spirit River formation.
Drill, complete, equip and tie-in costs for our Spirit River wells year to date are down approximately 10% relative to 2014 average costs. Bellatrix's low cost structure and high quality asset base position the Company to successfully navigate this protracted period of low commodity prices. The Company continues to focus on profitable growth and ultimate value maximization for its shareholders. Our unwavering focus on cost containment and capital discipline will continue through 2015 and beyond. Finally, our financial position continues to improve and we look forward to executing additional value enhancing strategies to further strengthen all aspects of our business.
Raymond G. Smith, P. Eng.President and CEO
August 4, 2015
REPORT TO SHAREHOLDERSBELLATRIX EXPLORATION LTD.
2015 SECOND QUARTER REPORT
8

August 4, 2015 – The following Management's Discussion and Analysis of financial results (“MD&A”) as provided by the management of Bellatrix Exploration Ltd. (“Bellatrix” or the “Company”) should be read in conjunction with the unaudited interim condensed consolidated financial statements of the Company for the three and six months ended June 30, 2015 and 2014, and the audited consolidated financial statements of the Company for the years ended December 31, 2014 and 2013, and the related MD&A. Disclosure which is unchanged from the MD&A for the year ended December 31, 2014 may not be repeated herein. This commentary is based on information available to, and is dated as of, August 4, 2015. The financial data presented is in Canadian dollars, except where indicated otherwise.
CONVERSION: The term barrels of oil equivalent (“boe”) may be misleading, particularly if used in isolation. A boe conversion ratio of six thousand cubic feet of natural gas to one barrel of oil equivalent (6 mcf/bbl) is based on an energy equivalency conversion method primarily applicable at the burner tip and does not represent a value equivalency at the wellhead. Given that the value ratio based on the current price of crude oil as compared to natural gas is significantly different from the energy equivalency of 6:1, utilizing a conversion on a 6:1 basis may be misleading as an indication of value. All boe conversions in this report are derived from converting gas to oil in the ratio of six thousand cubic feet of gas to one barrel of oil.
ADDITIONAL GAAP MEASURES: This MD&A contains the term “funds flow from operations” which should not be considered an alternative to, or more meaningful than “cash flow from operating activities” as determined in accordance with generally accepted accounting principles (“GAAP”) as an indicator of the Company's performance. Therefore reference to funds flow from operations or funds flow from operations per share may not be comparable with the calculation of similar measures for other entities. Management uses funds flow from operations to analyze operating performance and leverage and considers funds flow from operations to be a key measure as it demonstrates the Company's ability to generate the cash necessary to fund future capital investments and to repay debt. The reconciliation between cash flow from operating activities and funds flow from operations can be found in this MD&A. Funds flow from operations per share is calculated using the weighted average number of shares for the period.
This MD&A also contains the terms “total net debt”, “long-term debt”, and “adjusted working capital deficiency (excess)”, which also are not recognized measures under GAAP. Therefore reference to the additional GAAP measures of total net debt, long-term debt, or adjusted working capital deficiency (excess) may not be comparable with the calculation of similar measures for other entities. The Company's calculation of total net debt excludes deferred lease inducements, decommissioning liabilities, the long-term finance lease obligation, and the deferred tax liability. Total net debt includes the adjusted working capital deficiency (excess) and long-term debt. Long-term debt includes the balances of bank debt and Senior Notes. The adjusted working capital deficiency (excess) is an additional GAAP measure calculated as net working capital deficiency (excess) excluding current finance lease obligation and current deferred lease inducements. Management believes these measures are useful supplementary measures of the total amount of current and long-term debt.
NON-GAAP MEASURES: This MD&A contains the terms of “operating netbacks”, “adjusted net profit (loss)”, and “total capital expenditures – net”, which are not recognized measures under GAAP. Operating netbacks are calculated by subtracting royalties, transportation, and operating expenses from total revenue. Management believes this measure is a useful supplemental measure of the amount of total revenue received after transportation, royalties and operating expenses. The Company's calculation of total revenue includes petroleum and natural gas sales and other income, and excludes commodity price risk management. Readers are cautioned, however, that this measure should not be construed as an alternative to net profit or loss determined in accordance with GAAP as a measure of performance. Bellatrix's method of calculating this measure may differ from other entities, and accordingly, may not be comparable to measures used by other companies. Adjusted net profit (loss) is calculated by excluding the after tax effect of non-cash commodity contracts mark to market gains and losses, unrealized foreign exchange gains and losses, as applicable, impacting net profit (loss). Management believes that, in addition to net profit (loss), adjusted net profit (loss) is a useful supplemental measure as it reflects the underlying performance of Bellatrix's business activities. Total capital expenditures - net includes the cash impact of capital expenditures and property dispositions, as well as the non-cash capital impacts of corporate acquisitions, adjustments to the Company's decommissioning liabilities, and share based compensation.
JOINT ARRANGEMENTS: Bellatrix is a partner in the Grafton Joint Venture, the CNOR Joint Venture, the Daewoo and Devonian Partnership, and the Troika Joint Venture (all as defined below), which have all been separately assessed and classified under International Financial Reporting Standards (“IFRS”) as joint operations. This classification is on the basis that the arrangement is not conducted through a separate legal entity and the partners are legally obligated to pay their share of costs incurred and take their share of output produced from the various production areas, and all partners have rights to the assets and obligations for the liabilities resulting from the joint operations. The Company considered these factors as well as the terms of the individual agreements in determining the classification of a joint operation to be appropriate for each arrangement. For purposes of disclosure throughout the MD&A and financial statements, Bellatrix has referred to these arrangements by the common oil and gas industry term of joint ventures.
GRAFTON JOINT VENTURE – During the second quarter of 2014, Bellatrix announced that Grafton Energy Co I Ltd. (“Grafton”) elected to exercise an option to increase committed capital investment to the joint venture (the “Grafton Joint Venture”) with Grafton established during 2013 by an additional $50 million, for a total commitment of $250 million. The funding period of the Grafton Joint Venture was extended to the third anniversary of the program's effective date for wells relating to the exercised option. During the second quarter of 2015, the funding period of the Grafton Joint Venture for the initial and amended agreement whereby Grafton will contribute $200 million was extended to December 31, 2015. All other terms and conditions of the commitment increase are the same as the previously announced Grafton Joint Venture. The Grafton Joint Venture properties are in the Willesden Green and Brazeau areas of West-Central Alberta, whereby Grafton will contribute 82%, or $250 million, to the joint venture to participate in a Notikewin/Falher and Cardium well program. Under the agreement, Grafton will earn 54% of Bellatrix's working interest (“WI”) in each well drilled in the well program until payout (being recovery of Grafton's capital investment plus an 8% internal rate of return) on the total program, reverting to 33% of Bellatrix's WI after payout. At any time after payout of the entire program, Grafton shall have the option to elect to convert all wells from the 33% WI to a 17.5% Gross Overriding Royalty (“GORR”) on Bellatrix's pre-Grafton Joint Venture WI.
CNOR JOINT VENTURE – During the third quarter of 2014, Bellatrix announced that the Company and Canadian Non-Operated Resources Corp. ("CNOR"), a non-operated oil and gas company managed by Grafton Asset Management Inc., had completed the formation of a new multi-year joint venture arrangement (the “CNOR Joint Venture”), pursuant to which CNOR has committed $250 million in capital towards future accelerated development of a portion of Bellatrix's extensive undeveloped land holdings. Under the terms of the agreement, CNOR will pay 50% of the drilling, completion, equipping and tie-in capital expenditures associated with development plans to be proposed by Bellatrix and approved by a management committee comprised of representatives of Bellatrix and CNOR in order to earn 33% of Bellatrix's working interest before payout (being recovery of CNOR's capital investment plus an 8% return on investment) and automatically converting to a 10.67% GORR on Bellatrix's pre-joint venture working interest after payout.
MANAGEMENT’S DISCUSSION AND ANALYSIS
BELLATRIX EXPLORATION LTD.
2015 SECOND QUARTER REPORT
9
DAEWOO AND DEVONIAN PARTNERSHIP – Bellatrix has a joint venture arrangement (the “Daewoo and Devonian Partnership”) with Canadian subsidiaries of two Korean entities, Daewoo International Corporation (“Daewoo”) and Devonian Natural Resources Private Equity Fund (“Devonian”) in the Baptiste area of West-Central Alberta, whereby Daewoo and Devonian own a combined 50% of Bellatrix's WI share of producing assets, an operated compressor station and gathering system and related land acreage.
TROIKA JOINT VENTURE – Bellatrix has a joint venture (the “Troika Joint Venture”) with TCA Energy Ltd. ("TCA") in the Ferrier Cardium area of West-Central Alberta, whereby Troika will contribute 50% towards a capital program for which they will receive a 35% WI until payout (being recovery of TCA's capital investment plus a 15% internal rate of return) on the total program, and thereafter reverting to 25% of Bellatrix's WI.
Additional information relating to the Company, including the Bellatrix's Annual Information Form, is available on SEDAR at www.sedar.com and on the Company's website at www.bellatrixexploration.com. The Company's EDGAR filings and forms are available through the U.S. Securities and Exchange Commission at www.sec.gov.
FORWARD LOOKING STATEMENTS: Certain information contained herein may contain forward looking statements including management's assessment of future plans, operations and strategy, capital allocation toward high rate of return wells, the profitability of the Company's Spirit River drilling opportunities, plans to maintain the Company's position as a low cost finder and operator, expectations of year-end total net debt, expected 2015 average production, forecast third quarter 2015 and full-year capital spending, plans and expected timing related to Phase 2 of the Bellatrix Alder Flats Plant, that Phase 2 of the Bellatrix Alder Flats Plant will provide further growth potential of up to 80,000 boe/d, the competitive advantages within the Company's greater Ferrier region, the ability of the Company's strategic infrastructure assets to anchor a reduced operating cost profile, the Company's access to multiple processing facilities in addition to key receipt points along the Canadian mainline gas transmission system, the ability of the Company to have unfettered processing capacity to grow production volumes to approximately 60,000 boe/d without the need for material spending on infrastructure, the ability of the Company to reduce infrastructure related spending to approximately 20% or less of total capital spending going forward, and the ability for this reduced infrastructure investment to drive improved corporate capital efficiency metrics, finding and development costs, and result in enhanced corporate profitability going forward, the Company's ability to realize operating cost, production expense and G&A expense savings as anticipated, plans to access to joint venture capital and the expected benefits therefrom, the Company's ability to control the timing of production growth, reliability of processing capacity, and firm service transportation and processing capacity, expected enhanced natural gas liquids recovery from the Bellatrix Alder Flats Plant, the ability to profitably grow production in the years ahead, and plans to direct the majority of the Company's drilling and completion capital for the remainder of 2015 to Spirit River opportunities and continue to lever joint venture capital, and details of the Company's future strategy, the intent to explore strategies to sustain or reduce net debt, the ability to fund the Company's capital program with cash flow and bank indebtedness, the expectation that current outstanding litigation will not have a material adverse impact on the Company's financial position or results of operations and the sensitivities of funds flow from operations to changes in commodity prices and exchange rates, may constitute forward-looking statements under applicable securities laws. To the extent that any forward-looking information contained herein constitute a financial outlook, they were approved by management on August 4, 2015 and are included herein to provide readers with an understanding of the anticipated funds available to Bellatrix to fund its operations and readers are cautioned that the information may not be appropriate for other purposes. Forward-looking statements necessarily involve risks, including, without limitation, risks associated with oil and gas exploration, development, exploitation, production, marketing and transportation, loss of markets, volatility of commodity prices, currency fluctuations, imprecision of reserve estimates, environmental risks, competition from other producers, inability to retain drilling rigs and other services, incorrect assessment of the value of acquisitions, failure to realize the anticipated benefits of acquisitions, delays resulting from or inability to obtain required regulatory approvals and ability to access sufficient capital from internal and external sources. Events or circumstances may cause actual results to differ materially from those predicted, as a result of the risk factors set out and other known and unknown risks, uncertainties, and other factors, many of which are beyond the control of Bellatrix. In addition, forward looking statements or information are based on a number of factors and assumptions which have been used to develop such statements and information but which may prove to be incorrect and which have been used to develop such statements and information in order to provide shareholders with a more complete perspective on Bellatrix's future operations. Such information may prove to be incorrect and readers are cautioned that the information may not be appropriate for other purposes. Although the Company believes that the expectations reflected in such forward looking statements or information are reasonable, undue reliance should not be placed on forward looking statements because the Company can give no assurance that such expectations will prove to be correct. In addition to other factors and assumptions which may be identified herein, assumptions have been made regarding, among other things: the impact of increasing competition; the general stability of the economic and political environment in which the Company operates; the timely receipt of any required regulatory approvals; the ability of the Company to obtain qualified staff, equipment and services in a timely and cost efficient manner; drilling results; the ability of the operator of the projects which the Company has an interest in to operate the field in a safe, efficient and effective manner; the ability of the Company to obtain financing on acceptable terms; field production rates and decline rates; the ability to replace and expand oil and natural gas reserves through acquisition, development or exploration; the timing and costs of pipeline, storage and facility construction and expansion and the ability of the Company to secure adequate product transportation; future commodity prices; currency, exchange and interest rates; the regulatory framework regarding royalties, taxes and environmental matters in the jurisdictions in which the Company operates; and the ability of the Company to successfully market its oil and natural gas products. Readers are cautioned that the foregoing list is not exhaustive of all factors and assumptions which have been used. As a consequence, actual results may differ materially from those anticipated in the forward-looking statements. Additional information on these and other factors that could affect Bellatrix's operations and financial results are included in reports on file with Canadian and US securities regulatory authorities and may be accessed through the SEDAR website (www.sedar.com), through the SEC website (www.sec.gov), and at Bellatrix's website (www.bellatrixexploration.com). Furthermore, the forward looking statements contained herein are made as at the date hereof and Bellatrix does not undertake any obligation to update publicly or to revise any of the included forward looking statements, whether as a result of new information, future events or otherwise, except as may be required by applicable securities laws.
The reader is further cautioned that the preparation of financial statements in accordance with GAAP requires management to make certain judgments and estimates that affect the reported amounts of assets, liabilities, revenues and expenses. Estimating reserves is also critical to several accounting estimates and requires judgments and decisions based upon available geological, geophysical, engineering and economic data. These estimates may change, having either a negative or positive effect on net earnings as further information becomes available, and as the economic environment changes.
MANAGEMENT’S DISCUSSION AND ANALYSIS
BELLATRIX EXPLORATION LTD.
2015 SECOND QUARTER REPORT
10
OVERVIEW AND DESCRIPTION OF THE BUSINESS
Bellatrix Exploration Ltd. (“Bellatrix” or the “Company”) is a Western Canadian based growth oriented oil and gas company engaged in the exploration for, and the acquisition, development and production of oil and natural gas reserves in the provinces of Alberta, British Columbia and Saskatchewan.
Common shares of Bellatrix trade on the Toronto Stock Exchange and on the New York Stock Exchange under the symbol “BXE”.
SECOND QUARTER 2015 ACTIVITIES
SUCCESSFUL COMPLETION OF PHASE 1 OF THE BELLATRIX ALDER FLATS DEEP-CUT GAS PLANT
The second quarter marked the successful completion of construction of Phase 1 of the Bellatrix O'Chiese Nees-Ohpawganu'ck deep-cut gas plant in the Alder Flats area of Alberta (“Bellatrix Alder Flats Plant” or the “Plant”) ahead of schedule and on budget. Completion of the Plant represents a significant milestone for the Company and highlights the culmination over the last 3 years work of planning, design, and construction. The construction, commissioning and start-up phases of this major project were safely performed with zero lost time incidents. Initial Plant start-up commenced on May 22, 2015, followed by first delivery of natural gas volumes to sales. Subsequent to Plant start-up, Bellatrix successfully increased volume throughput at the Plant, ultimately achieving inlet gas volumes of over 110 MMcf/d by mid-June with overall Plant reliability over the last month at approximately 98%. Performance testing of the Plant confirmed design rate recoveries for ethane, propane, and butane. The Plant design capacity has also been tested during a trial with an inlet rate of 125 MMcf/d.
With Phase 1 of the Plant now completed, Bellatrix has unfettered processing capability to grow Company volumes to approximately 60,000 boe/d without material capital spending on infrastructure over the near term. Reduced facility capital spending is anticipated to enhance overall corporate capital efficiencies, and reduce total finding and development costs. With significant pre-build and flexibility for Phase 2 already incorporated into the design and footprint at Alder Flats, Bellatrix remains committed to construction of Phase 2 with an expected on-stream date in mid-2017. Remaining capital spending over the next two fiscal years for Phase 2 net to Bellatrix's interest is estimated at approximately $50 million. Phase 2 will double the base design capacity of the Plant to 220 MMcf/d and provide further growth potential to Bellatrix of up to a total of 80,000 boe/d.
ALDER FLATS PLANT PROVIDES ENHANCED OPERATIONAL CONTROL AND EXPECTED RELIABILITY
The industry continued to face natural gas takeaway constraints in West Central Alberta during the second quarter as work continued on various laterals, compressor maintenance, and ongoing improvements on the Canadian mainline natural gas transmission system. At times during the second quarter interruptible takeaway capacity was entirely restricted with additional limitations on producers to approximately 90% of firm takeaway capacity. Additional transmission system maintenance and restrictions are expected during the summer, however, with the Bellatrix Alder Flats Plant now fully operational, the Company expects to meaningfully realize improvements in operational control and reliability of processing during the second half of the year which Bellatrix expects will mitigate impacts from third party facility downtime and potential negative impacts from ongoing maintenance on the Canadian mainline gas transmission system.
In addition Bellatrix added approximately 110 MMcf/d of firm takeaway capacity on the Canadian mainline gas transmission system upon completion of the Plant, thereby providing more than sufficient capacity for existing net volumes and providing room for future growth. With completion of the Plant, and incremental firm service capacity, Bellatrix has seen a significant improvement in operational reliability and reduced impact from system constraints and curtailments during July.
MANAGEMENT’S DISCUSSION AND ANALYSIS
BELLATRIX EXPLORATION LTD.
2015 SECOND QUARTER REPORT
11
MANAGEMENT’S DISCUSSION AND ANALYSIS
BELLATRIX EXPLORATION LTD.
PROACTIVE FINANCIAL MANAGEMENT THROUGH THE CURRENT COMMODITY PRICE ENVIRONMENT
Proactive management of the balance sheet and financial position continued in the second quarter of 2015. Subsequent to the early negotiation of covenant relief from the syndicate of lenders in the first quarter of 2015, on May 21, 2015 the Company completed a US$250 million offering of 8.50% senior unsecured notes due 2020 (the "Senior Notes") thereby providing Bellatrix enhanced liquidity and increased financial flexibility to successfully navigate the current commodity price environment. In addition, the semi-annual review of the borrowing base under the Company's revolving credit facilities was approved at $600 million in June 2015. At June 30, 2015, the Company had $212.9 million of undrawn capacity on its credit facility, excluding outstanding letters of credit of $5.7 million that reduce the amount otherwise available to be drawn on the facility.
Subsequent to the end of the second quarter, Bellatrix's syndicate of lenders have approved elimination of two of the three financial covenants contained in the agreement governing its bank credit facilities. The removal of both the Total Debt to EBITDA and EBITDA to interest expense covenants leaves only one financial covenant being a maximum consolidated Senior Debt to EBITDA ratio of 3.5 to 1 stepping down to 3.0 to 1 for the quarter ending June 30, 2017 but including thereafter an expander of 0.5 times for the two quarters immediately following a material acquisition (for details of how Total Debt, EBITDA and Senior Debt are defined under the agreement governing the credit facilities see “Liquidity and Capital Resources” in this MD&A). As part of the agreement to remove these financial covenants, the Company agreed that any further issuances of subordinated indebtedness (but excluding refinancing of the existing Senior Notes) will require majority lender approval. All other aspects of the facilities including the borrowing base and the next redetermination on or before November 30, 2015 remain unchanged.
Additionally, during the second quarter, Bellatrix enhanced its risk management program with the addition of longer term risk management contracts in 2016 and 2017 through a mix of fixed price and basis swap hedging contracts. Bellatrix has begun adding longer term risk management contracts as part of its strategy to mitigate natural gas price volatility and exposure, and to provide increased predictability of revenue and cash flow beyond the current calendar year. By employing both fixed price and basis swap risk management contracts, Bellatrix maintains fixed price protection on a portion of its forecast natural gas volumes, and retains upside potential on US dollar natural gas prices in the future while mitigating potential adverse movements in the AECO basis differential over the 2016 to 2017 timeframe. Bellatrix's hedging program is part of its overall risk management strategy focused on providing reduced price risk volatility, and greater assurance of future revenue and cash flow which drive the capital and reinvestment decisions within the business.
CONTINUED FOCUS ON COST REDUCTION AND ACTIVITY OPTIMIZATION EFFORTS
In addition to the aforementioned bank credit facility covenant amendments and added liquidity created by terming up a portion of the Company's bank debt, Bellatrix continues to work diligently to ensure balance sheet stability. The Company spends capital in three principal areas: capital and project expenditures, general and administrative (“G&A”) costs, and operating costs. Service cost deflation and efficiency gains have resulted in average drill, complete, equip and tie-in costs reduced by approximately 10% year over year. A continued focus on G&A reductions and other internal cost reduction initiatives also remains ongoing across all departments with full year G&A costs (before recoveries) expected to be reduced by approximately $9 million year over year. Finally, operational initiatives have contributed approximately $10 million in cost savings.
JOINT VENTURE PARTNERSHIPS PROVIDE STRATEGIC BENEFITS
Bellatrix's joint venture (“JV”) strategy provides access to third party capital on promoted terms, supporting continued development of the Company's large resource base during periods of higher infrastructure capital spending. Over the past ten quarters, Bellatrix has invested over $300 million in net infrastructure and facilities capital, thus JV arrangements have provided Bellatrix access to additional capital for drilling and completion activity to facilitate production growth during this period of higher infrastructure capital outlay. Bellatrix's infrastructure footprint in West Central Alberta provides significant benefits and barriers to competition.
2015 SECOND QUARTER REPORT
12
MANAGEMENT’S DISCUSSION AND ANALYSIS
BELLATRIX EXPLORATION LTD.
In the second half of 2015, Bellatrix intends to access up to $65 million of partner capital under its JV arrangements, principally with Grafton. Capital spent under the Grafton JV enhances Bellatrix internal rate of return expectations on wells drilled relative to organic development opportunities, providing clear benefits during periods of lower commodity prices. Furthermore, JV directed capital provides an uplift in net Bellatrix production volumes and cash flow relative to its net proportion of capital spent on drilling and completion activity. Pursuant to the Grafton JV terms, Grafton contributes 82% of the drill, complete, equip and tie-in costs to earn 54% of Bellatrix's working interest before payout (being recovery of Grafton's capital investment plus an 8% internal rate of return), reverting to a 33% working interest after payout (convertible to a 17.5% gross overriding royalty). The JV arrangements provide an alternative source of funding without equity or debt dilution to shareholders.
SECOND QUARTER 2015 FINANCIAL AND OPERATIONAL RESULTS
SALES VOLUMES
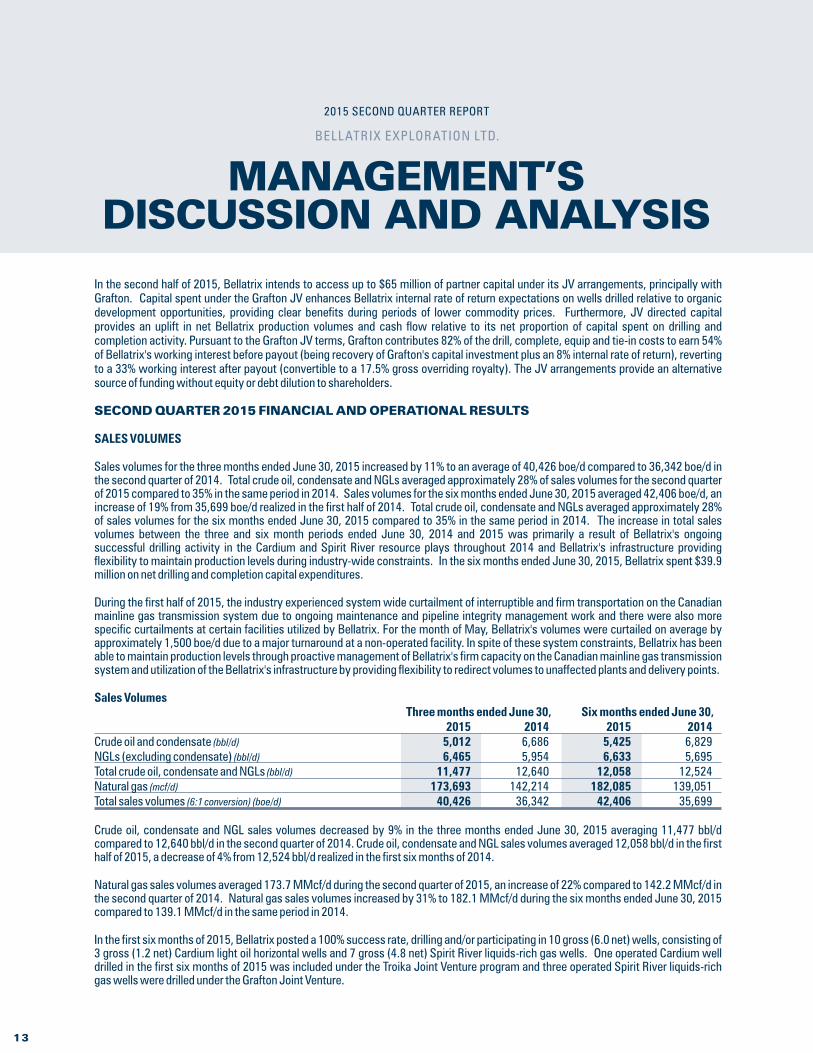
Sales volumes for the three months ended June 30, 2015 increased by 11% to an average of 40,426 boe/d compared to 36,342 boe/d in the second quarter of 2014. Total crude oil, condensate and NGLs averaged approximately 28% of sales volumes for the second quarter of 2015 compared to 35% in the same period in 2014. Sales volumes for the six months ended June 30, 2015 averaged 42,406 boe/d, an increase of 19% from 35,699 boe/d realized in the first half of 2014. Total crude oil, condensate and NGLs averaged approximately 28% of sales volumes for the six months ended June 30, 2015 compared to 35% in the same period in 2014. The increase in total sales volumes between the three and six month periods ended June 30, 2014 and 2015 was primarily a result of Bellatrix's ongoing successful drilling activity in the Cardium and Spirit River resource plays throughout 2014 and Bellatrix's infrastructure providing flexibility to maintain production levels during industry-wide constraints. In the six months ended June 30, 2015, Bellatrix spent $39.9 million on net drilling and completion capital expenditures.
During the first half of 2015, the industry experienced system wide curtailment of interruptible and firm transportation on the Canadian mainline gas transmission system due to ongoing maintenance and pipeline integrity management work and there were also more specific curtailments at certain facilities utilized by Bellatrix. For the month of May, Bellatrix's volumes were curtailed on average by approximately 1,500 boe/d due to a major turnaround at a non-operated facility. In spite of these system constraints, Bellatrix has been able to maintain production levels through proactive management of Bellatrix's firm capacity on the Canadian mainline gas transmission system and utilization of the Bellatrix's infrastructure by providing flexibility to redirect volumes to unaffected plants and delivery points.
Sales Volumes Three months ended June 30, Six months ended June 30, 2015 2014 2015 2014Crude oil and condensate (bbl/d) 5,012 6,686 5,425 6,829NGLs (excluding condensate) (bbl/d) 6,465 5,954 6,633 5,695Total crude oil, condensate and NGLs (bbl/d) 11,477 12,640 12,058 12,524Natural gas (mcf/d) 173,693 142,214 182,085 139,051Total sales volumes (6:1 conversion) (boe/d) 40,426 36,342 42,406 35,699
Crude oil, condensate and NGL sales volumes decreased by 9% in the three months ended June 30, 2015 averaging 11,477 bbl/d compared to 12,640 bbl/d in the second quarter of 2014. Crude oil, condensate and NGL sales volumes averaged 12,058 bbl/d in the first half of 2015, a decrease of 4% from 12,524 bbl/d realized in the first six months of 2014.
Natural gas sales volumes averaged 173.7 MMcf/d during the second quarter of 2015, an increase of 22% compared to 142.2 MMcf/d in the second quarter of 2014. Natural gas sales volumes increased by 31% to 182.1 MMcf/d during the six months ended June 30, 2015 compared to 139.1 MMcf/d in the same period in 2014.
In the first six months of 2015, Bellatrix posted a 100% success rate, drilling and/or participating in 10 gross (6.0 net) wells, consisting of 3 gross (1.2 net) Cardium light oil horizontal wells and 7 gross (4.8 net) Spirit River liquids-rich gas wells. One operated Cardium well drilled in the first six months of 2015 was included under the Troika Joint Venture program and three operated Spirit River liquids-rich gas wells were drilled under the Grafton Joint Venture.
2015 SECOND QUARTER REPORT
13
MANAGEMENT’S DISCUSSION AND ANALYSIS
BELLATRIX EXPLORATION LTD.
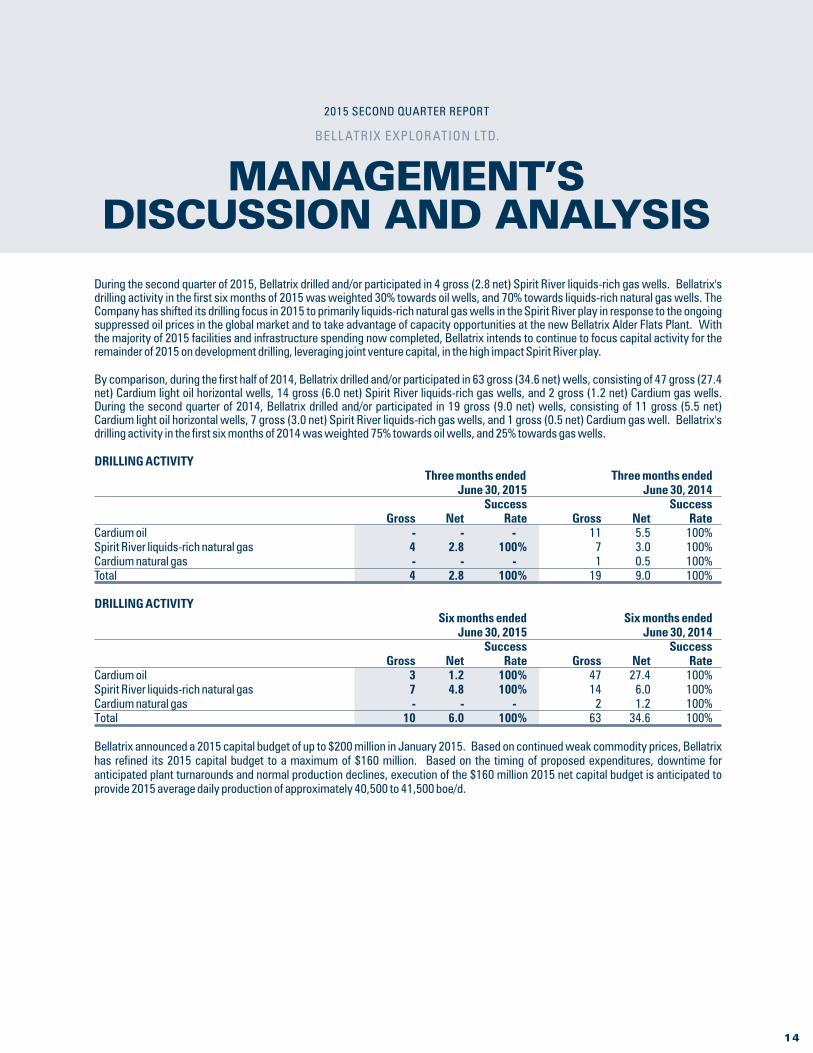
During the second quarter of 2015, Bellatrix drilled and/or participated in 4 gross (2.8 net) Spirit River liquids-rich gas wells. Bellatrix's drilling activity in the first six months of 2015 was weighted 30% towards oil wells, and 70% towards liquids-rich natural gas wells. The Company has shifted its drilling focus in 2015 to primarily liquids-rich natural gas wells in the Spirit River play in response to the ongoing suppressed oil prices in the global market and to take advantage of capacity opportunities at the new Bellatrix Alder Flats Plant. With the majority of 2015 facilities and infrastructure spending now completed, Bellatrix intends to continue to focus capital activity for the remainder of 2015 on development drilling, leveraging joint venture capital, in the high impact Spirit River play.
By comparison, during the first half of 2014, Bellatrix drilled and/or participated in 63 gross (34.6 net) wells, consisting of 47 gross (27.4 net) Cardium light oil horizontal wells, 14 gross (6.0 net) Spirit River liquids-rich gas wells, and 2 gross (1.2 net) Cardium gas wells. During the second quarter of 2014, Bellatrix drilled and/or participated in 19 gross (9.0 net) wells, consisting of 11 gross (5.5 net) Cardium light oil horizontal wells, 7 gross (3.0 net) Spirit River liquids-rich gas wells, and 1 gross (0.5 net) Cardium gas well. Bellatrix's drilling activity in the first six months of 2014 was weighted 75% towards oil wells, and 25% towards gas wells.
DRILLING ACTIVITY Three months ended Three months ended June 30, 2015 June 30, 2014 Success Success Gross Net Rate Gross Net RateCardium oil - - - 11 5.5 100%Spirit River liquids-rich natural gas 4 2.8 100% 7 3.0 100%Cardium natural gas - - - 1 0.5 100%Total 4 2.8 100% 19 9.0 100%
DRILLING ACTIVITY Six months ended Six months ended June 30, 2015 June 30, 2014 Success Success Gross Net Rate Gross Net RateCardium oil 3 1.2 100% 47 27.4 100%Spirit River liquids-rich natural gas 7 4.8 100% 14 6.0 100%Cardium natural gas - - - 2 1.2 100%Total 10 6.0 100% 63 34.6 100%
Bellatrix announced a 2015 capital budget of up to $200 million in January 2015. Based on continued weak commodity prices, Bellatrix has refined its 2015 capital budget to a maximum of $160 million. Based on the timing of proposed expenditures, downtime for anticipated plant turnarounds and normal production declines, execution of the $160 million 2015 net capital budget is anticipated to provide 2015 average daily production of approximately 40,500 to 41,500 boe/d.
2015 SECOND QUARTER REPORT
14

MANAGEMENT’S DISCUSSION AND ANALYSIS
BELLATRIX EXPLORATION LTD.
COMMODITY PRICES
Average Commodity Prices Three months ended June 30, Six months ended June 30, 2015 2014 % Change 2015 2014 % ChangeExchange rate (US$/CDN$1.00) 0.8137 0.9164 (11) 0.8101 0.9115 (11)
Crude oil: WTI (US$/bbl) 57.95 102.99 (44) 53.34 100.84 (47) Canadian Light crude blend ($/bbl) 68.88 104.14 (34) 61.08 101.95 (40)Bellatrix's average prices ($/bbl) Crude oil and condensate 66.95 103.25 (35) 57.69 100.72 (43) NGLs (excluding condensate) 15.15 42.70 (65) 16.69 49.72 (66) Total crude oil and NGLs 37.77 74.73 (49) 35.14 77.53 (55) Crude oil and condensate (including risk
(1) management ) 66.73 89.98 (26) 58.28 89.00 (35) Natural gas: NYMEX (US$/MMbtu) 2.74 4.58 (40) 2.77 4.65 (40) AECO daily index (CDN$/mcf) 2.65 4.69 (43) 2.70 5.20 (48) AECO monthly index (CDN$/mcf) 2.67 4.68 (43) 2.81 4.72 (40) Bellatrix's average price ($/mcf) 2.91 5.04 (42) 2.95 5.45 (46) Bellatrix's average price (including risk
(1) management ) ($/mcf) 2.94 4.40 (33) 2.99 4.64 (36)
(1) Per unit metrics including risk management include realized gains or losses on commodity contracts and exclude unrealized gains or losses on commodity contracts.
The overall weak global commodity price environment has continued through the first half of 2015 as oil production from OPEC and non-OPEC countries continued to climb, reaching almost 96 million barrels per day in June 2015. Shale production in the US and Canada has pushed US oil inventories to record levels despite increased refinery utilizations. Likewise, production of natural gas in North America has reached record levels as supplies more than offset the continued increase in demand for natural gas.
For crude oil and condensate, Bellatrix realized an average price of $66.95/bbl before commodity price risk management contracts during the three months ended June 30, 2015, a decrease of 35% from the average price of $103.25/bbl received in the second quarter of 2014. By comparison, the Canadian Light benchmark price decreased by 34% and the average West Texas Intermediate (“WTI”) crude oil benchmark price decreased by 44% between the second quarters of 2014 and 2015. During the six months ended June 30, 2015, Bellatrix realized an average price for crude oil and condensate of $57.69/bbl before commodity price risk management contracts, a decrease of 43% from the average price of $100.72/bbl realized during the first half of 2014. In line with the decrease in Bellatrix's realized pricing between the periods, between the first six months of 2014 and 2015, the Canadian Light benchmark price decreased by 40%, and the average WTI crude oil benchmark price decreased by 47%.
The average US$/CDN$1.00 foreign exchange rate decreased by 11% to 0.8101 for the six months ended June 30, 2015 from an average rate of 0.9115 in the first six months of 2014.
Bellatrix's average realized price for NGLs (excluding condensate) decreased by 65% to $15.15/bbl during the second quarter of 2015, compared to $42.70/bbl received in the three months ended June 30, 2014. NGL pricing in Western Canada continues to remain challenged as butane and propane were down 15% and 81%, respectively quarter over quarter. Butane pricing has been impacted by higher product supply from key US natural gas plays impacting the overall supply/demand balance. Propane pricing has also been impacted by supply/demand balance and logistic issues in Western Canada to major markets. Propane inventories remain at record levels across North America. Canadian inventories are building mainly due to the 2014 reversal of the Cochin NGL line that was a primary outlet for propane from Western Canada to Eastern markets. Bellatrix's average realized price for NGLs (excluding condensate) decreased by 66% to $16.69/bbl during the six months ended June 30, 2015, compared to $49.72/bbl received in the first half of 2014.
2015 SECOND QUARTER REPORT
15
MANAGEMENT’S DISCUSSION AND ANALYSIS
BELLATRIX EXPLORATION LTD.
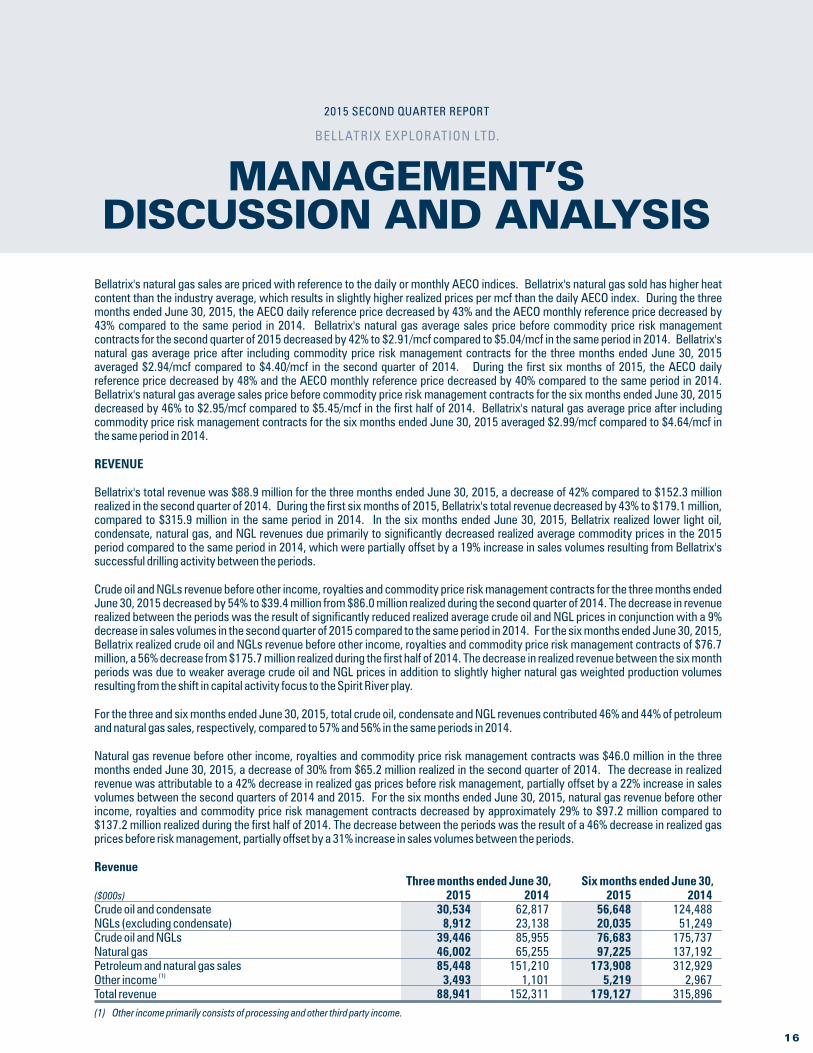
Bellatrix's natural gas sales are priced with reference to the daily or monthly AECO indices. Bellatrix's natural gas sold has higher heat content than the industry average, which results in slightly higher realized prices per mcf than the daily AECO index. During the three months ended June 30, 2015, the AECO daily reference price decreased by 43% and the AECO monthly reference price decreased by 43% compared to the same period in 2014. Bellatrix's natural gas average sales price before commodity price risk management contracts for the second quarter of 2015 decreased by 42% to $2.91/mcf compared to $5.04/mcf in the same period in 2014. Bellatrix's natural gas average price after including commodity price risk management contracts for the three months ended June 30, 2015 averaged $2.94/mcf compared to $4.40/mcf in the second quarter of 2014. During the first six months of 2015, the AECO daily reference price decreased by 48% and the AECO monthly reference price decreased by 40% compared to the same period in 2014. Bellatrix's natural gas average sales price before commodity price risk management contracts for the six months ended June 30, 2015 decreased by 46% to $2.95/mcf compared to $5.45/mcf in the first half of 2014. Bellatrix's natural gas average price after including commodity price risk management contracts for the six months ended June 30, 2015 averaged $2.99/mcf compared to $4.64/mcf in the same period in 2014.
REVENUE
Bellatrix's total revenue was $88.9 million for the three months ended June 30, 2015, a decrease of 42% compared to $152.3 million realized in the second quarter of 2014. During the first six months of 2015, Bellatrix's total revenue decreased by 43% to $179.1 million, compared to $315.9 million in the same period in 2014. In the six months ended June 30, 2015, Bellatrix realized lower light oil, condensate, natural gas, and NGL revenues due primarily to significantly decreased realized average commodity prices in the 2015 period compared to the same period in 2014, which were partially offset by a 19% increase in sales volumes resulting from Bellatrix's successful drilling activity between the periods.
Crude oil and NGLs revenue before other income, royalties and commodity price risk management contracts for the three months ended June 30, 2015 decreased by 54% to $39.4 million from $86.0 million realized during the second quarter of 2014. The decrease in revenue realized between the periods was the result of significantly reduced realized average crude oil and NGL prices in conjunction with a 9% decrease in sales volumes in the second quarter of 2015 compared to the same period in 2014. For the six months ended June 30, 2015, Bellatrix realized crude oil and NGLs revenue before other income, royalties and commodity price risk management contracts of $76.7 million, a 56% decrease from $175.7 million realized during the first half of 2014. The decrease in realized revenue between the six month periods was due to weaker average crude oil and NGL prices in addition to slightly higher natural gas weighted production volumes resulting from the shift in capital activity focus to the Spirit River play.
For the three and six months ended June 30, 2015, total crude oil, condensate and NGL revenues contributed 46% and 44% of petroleum and natural gas sales, respectively, compared to 57% and 56% in the same periods in 2014.
Natural gas revenue before other income, royalties and commodity price risk management contracts was $46.0 million in the three months ended June 30, 2015, a decrease of 30% from $65.2 million realized in the second quarter of 2014. The decrease in realized revenue was attributable to a 42% decrease in realized gas prices before risk management, partially offset by a 22% increase in sales volumes between the second quarters of 2014 and 2015. For the six months ended June 30, 2015, natural gas revenue before other income, royalties and commodity price risk management contracts decreased by approximately 29% to $97.2 million compared to $137.2 million realized during the first half of 2014. The decrease between the periods was the result of a 46% decrease in realized gas prices before risk management, partially offset by a 31% increase in sales volumes between the periods.
Revenue Three months ended June 30, Six months ended June 30,($000s) 2015 2014 2015 2014Crude oil and condensate 30,534 62,817 56,648 124,488NGLs (excluding condensate) 8,912 23,138 20,035 51,249Crude oil and NGLs 39,446 85,955 76,683 175,737Natural gas 46,002 65,255 97,225 137,192Petroleum and natural gas sales 85,448 151,210 173,908 312,929
(1)Other income 3,493 1,101 5,219 2,967Total revenue 88,941 152,311 179,127 315,896(1) Other income primarily consists of processing and other third party income.
2015 SECOND QUARTER REPORT
16
MANAGEMENT’S DISCUSSION AND ANALYSIS
BELLATRIX EXPLORATION LTD.
COMMODITY PRICE RISK MANAGEMENT
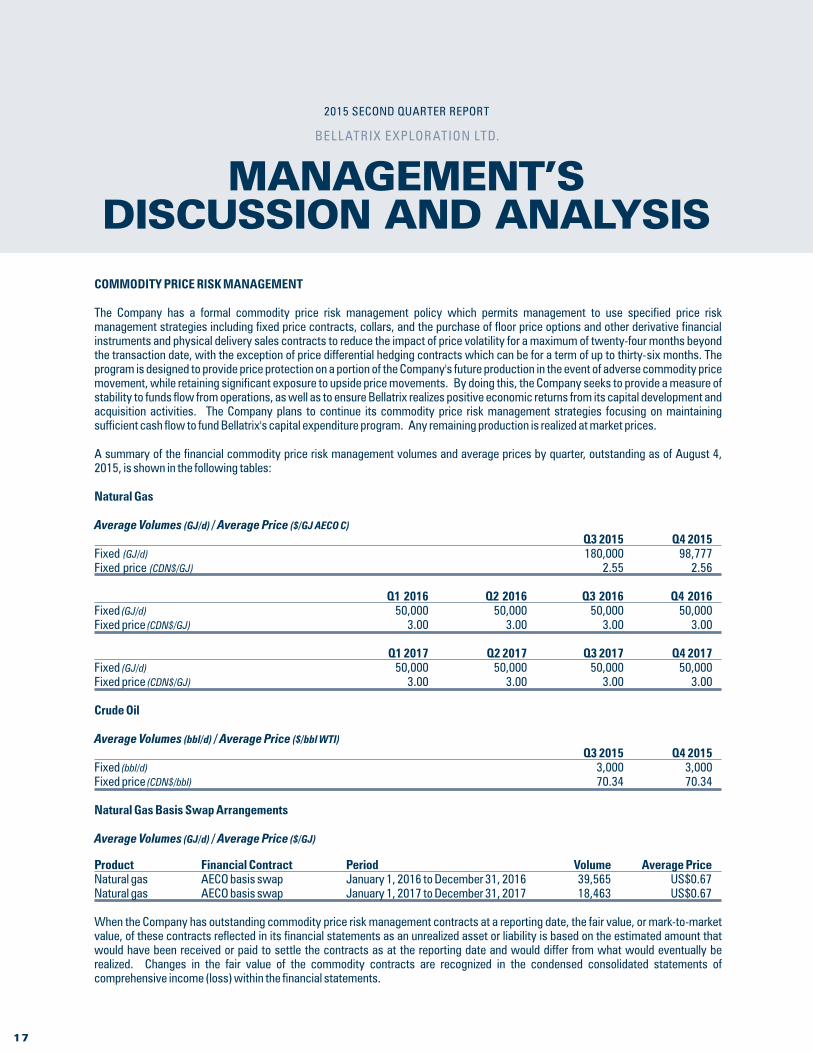
The Company has a formal commodity price risk management policy which permits management to use specified price risk management strategies including fixed price contracts, collars, and the purchase of floor price options and other derivative financial instruments and physical delivery sales contracts to reduce the impact of price volatility for a maximum of twenty-four months beyond the transaction date, with the exception of price differential hedging contracts which can be for a term of up to thirty-six months. The program is designed to provide price protection on a portion of the Company's future production in the event of adverse commodity price movement, while retaining significant exposure to upside price movements. By doing this, the Company seeks to provide a measure of stability to funds flow from operations, as well as to ensure Bellatrix realizes positive economic returns from its capital development and acquisition activities. The Company plans to continue its commodity price risk management strategies focusing on maintaining sufficient cash flow to fund Bellatrix's capital expenditure program. Any remaining production is realized at market prices.
A summary of the financial commodity price risk management volumes and average prices by quarter, outstanding as of August 4, 2015, is shown in the following tables:
Natural Gas Average Volumes (GJ/d) / Average Price ($/GJ AECO C) Q3 2015 Q4 2015Fixed (GJ/d) 180,000 98,777Fixed price (CDN$/GJ) 2.55 2.56
Q1 2016 Q2 2016 Q3 2016 Q4 2016Fixed (GJ/d) 50,000 50,000 50,000 50,000Fixed price (CDN$/GJ) 3.00 3.00 3.00 3.00
Q1 2017 Q2 2017 Q3 2017 Q4 2017Fixed (GJ/d) 50,000 50,000 50,000 50,000Fixed price (CDN$/GJ) 3.00 3.00 3.00 3.00
Crude Oil Average Volumes (bbl/d) / Average Price ($/bbl WTI) Q3 2015 Q4 2015Fixed (bbl/d) 3,000 3,000Fixed price (CDN$/bbl) 70.34 70.34
Natural Gas Basis Swap Arrangements
Average Volumes (GJ/d) / Average Price ($/GJ)
Product Financial Contract Period Volume Average PriceNatural gas AECO basis swap January 1, 2016 to December 31, 2016 39,565 US$0.67Natural gas AECO basis swap January 1, 2017 to December 31, 2017 18,463 US$0.67
When the Company has outstanding commodity price risk management contracts at a reporting date, the fair value, or mark-to-market value, of these contracts reflected in its financial statements as an unrealized asset or liability is based on the estimated amount that would have been received or paid to settle the contracts as at the reporting date and would differ from what would eventually be realized. Changes in the fair value of the commodity contracts are recognized in the condensed consolidated statements of comprehensive income (loss) within the financial statements.
2015 SECOND QUARTER REPORT
17
MANAGEMENT’S DISCUSSION AND ANALYSIS
BELLATRIX EXPLORATION LTD.
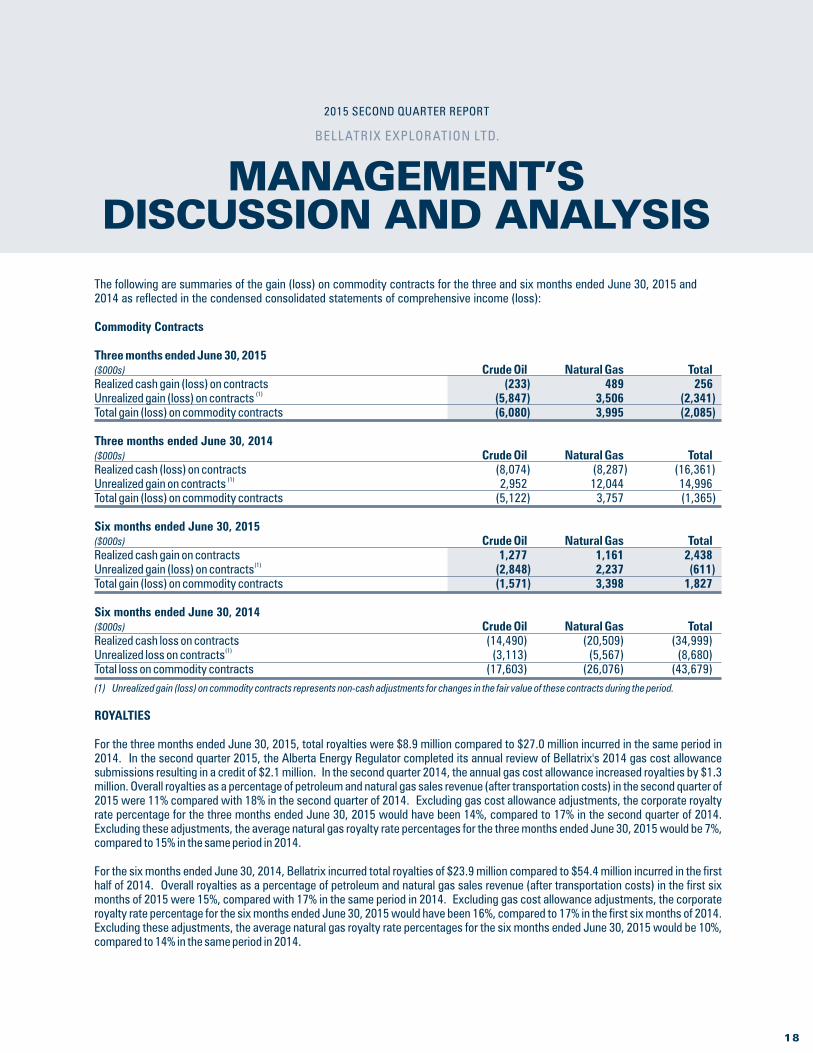
The following are summaries of the gain (loss) on commodity contracts for the three and six months ended June 30, 2015 and 2014 as reflected in the condensed consolidated statements of comprehensive income (loss):
Commodity Contracts
Three months ended June 30, 2015($000s) Crude Oil Natural Gas TotalRealized cash gain (loss) on contracts (233) 489 256
(1)Unrealized gain (loss) on contracts (5,847) 3,506 (2,341)Total gain (loss) on commodity contracts (6,080) 3,995 (2,085)
Three months ended June 30, 2014($000s) Crude Oil Natural Gas TotalRealized cash (loss) on contracts (8,074) (8,287) (16,361)
(1)Unrealized gain on contracts 2,952 12,044 14,996Total gain (loss) on commodity contracts (5,122) 3,757 (1,365)
Six months ended June 30, 2015($000s) Crude Oil Natural Gas TotalRealized cash gain on contracts 1,277 1,161 2,438
(1)Unrealized gain (loss) on contracts (2,848) 2,237 (611)Total gain (loss) on commodity contracts (1,571) 3,398 1,827
Six months ended June 30, 2014($000s) Crude Oil Natural Gas TotalRealized cash loss on contracts (14,490) (20,509) (34,999)
(1)Unrealized loss on contracts (3,113) (5,567) (8,680)Total loss on commodity contracts (17,603) (26,076) (43,679)(1) Unrealized gain (loss) on commodity contracts represents non-cash adjustments for changes in the fair value of these contracts during the period.
ROYALTIES
For the three months ended June 30, 2015, total royalties were $8.9 million compared to $27.0 million incurred in the same period in 2014. In the second quarter 2015, the Alberta Energy Regulator completed its annual review of Bellatrix's 2014 gas cost allowance submissions resulting in a credit of $2.1 million. In the second quarter 2014, the annual gas cost allowance increased royalties by $1.3 million. Overall royalties as a percentage of petroleum and natural gas sales revenue (after transportation costs) in the second quarter of 2015 were 11% compared with 18% in the second quarter of 2014. Excluding gas cost allowance adjustments, the corporate royalty rate percentage for the three months ended June 30, 2015 would have been 14%, compared to 17% in the second quarter of 2014. Excluding these adjustments, the average natural gas royalty rate percentages for the three months ended June 30, 2015 would be 7%, compared to 15% in the same period in 2014.
For the six months ended June 30, 2014, Bellatrix incurred total royalties of $23.9 million compared to $54.4 million incurred in the first half of 2014. Overall royalties as a percentage of petroleum and natural gas sales revenue (after transportation costs) in the first six months of 2015 were 15%, compared with 17% in the same period in 2014. Excluding gas cost allowance adjustments, the corporate royalty rate percentage for the six months ended June 30, 2015 would have been 16%, compared to 17% in the first six months of 2014. Excluding these adjustments, the average natural gas royalty rate percentages for the six months ended June 30, 2015 would be 10%, compared to 14% in the same period in 2014.
2015 SECOND QUARTER REPORT
18

MANAGEMENT’S DISCUSSION AND ANALYSIS
BELLATRIX EXPLORATION LTD.
Royalties by Commodity Type Three months ended June 30, Six months ended June 30,($000s, except where noted) 2015 2014 2015 2014Crude oil, condensate, and NGLs 8,064 16,198 17,064 34,982 $/bbl 7.72 14.08 7.82 15.43 Average crude oil, condensate and NGLs royalty rate (%) 21 19 23 20
Natural gas 844 10,817 6,834 19,420 $/mcf 0.05 0.84 0.21 0.77 Average natural gas royalty rate (%) 2 17 8 14 Total 8,908 27,015 23,899 54,402Total $/boe 2.42 8.17 3.11 8.42Average total royalty rate (%) 11 18 15 17
Royalties by Type Three months ended June 30, Six months ended June 30,($000s) 2015 2014 2015 2014Crown royalties 1,728 9,524 7,168 18,072IOGC royalties 1,755 6,419 7,449 10,587Freehold & GORR 5,425 11,072 9,282 25,743Total 8,908 27,015 23,899 54,402
The Company's light crude oil, condensate and NGLs, and natural gas royalties are impacted by lower royalties on more recent wells in their early years of production under the Alberta royalty incentive program. This is offset by increased royalty rates on wells coming off initial royalty incentive rates and wells drilled on Ferrier lands with higher combined Indian Oil and Gas Commission ("IOGC") and GORR royalty rates.
EXPENSES Three months ended June 30, Six months ended June 30,($000s) 2015 2014 2015 2014Production 31,581 25,799 65,801 51,428Transportation 4,613 2,721 9,487 7,758Royalties 8,908 27,015 23,899 54,402General and administrative 6,676 4,536 14,006 10,061
(1)Interest and financing charges 9,260 4,866 15,485 8,593Share-based compensation 3,315 2,328 3,689 4,837(1) Excludes financing charges in relation to the Company's accretion of decommissioning liabilities, unrealized foreign exchange gain (loss), and realized foreign
exchange gain (loss).
2015 SECOND QUARTER REPORT
19
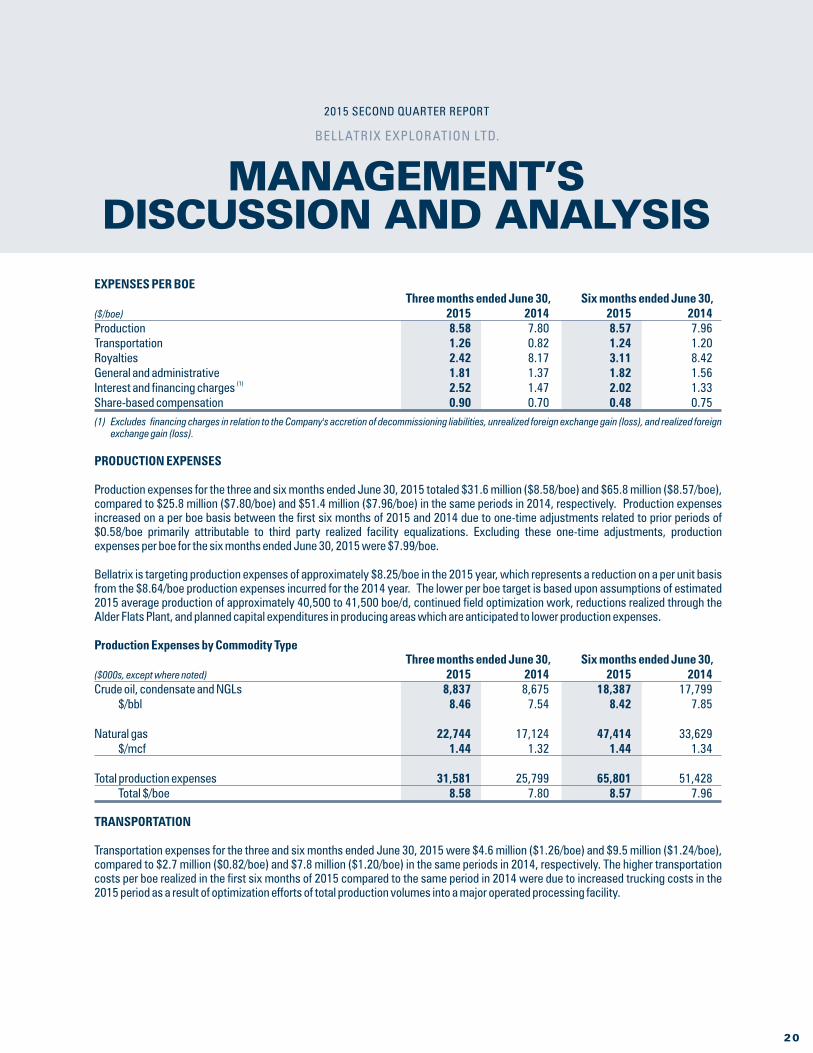
MANAGEMENT’S DISCUSSION AND ANALYSIS
BELLATRIX EXPLORATION LTD.
EXPENSES PER BOE Three months ended June 30, Six months ended June 30,($/boe) 2015 2014 2015 2014Production 8.58 7.80 8.57 7.96Transportation 1.26 0.82 1.24 1.20Royalties 2.42 8.17 3.11 8.42General and administrative 1.81 1.37 1.82 1.56
(1)Interest and financing charges 2.52 1.47 2.02 1.33Share-based compensation 0.90 0.70 0.48 0.75(1) Excludes financing charges in relation to the Company's accretion of decommissioning liabilities, unrealized foreign exchange gain (loss), and realized foreign
exchange gain (loss).
PRODUCTION EXPENSES
Production expenses for the three and six months ended June 30, 2015 totaled $31.6 million ($8.58/boe) and $65.8 million ($8.57/boe), compared to $25.8 million ($7.80/boe) and $51.4 million ($7.96/boe) in the same periods in 2014, respectively. Production expenses increased on a per boe basis between the first six months of 2015 and 2014 due to one-time adjustments related to prior periods of $0.58/boe primarily attributable to third party realized facility equalizations. Excluding these one-time adjustments, production expenses per boe for the six months ended June 30, 2015 were $7.99/boe.
Bellatrix is targeting production expenses of approximately $8.25/boe in the 2015 year, which represents a reduction on a per unit basis from the $8.64/boe production expenses incurred for the 2014 year. The lower per boe target is based upon assumptions of estimated 2015 average production of approximately 40,500 to 41,500 boe/d, continued field optimization work, reductions realized through the Alder Flats Plant, and planned capital expenditures in producing areas which are anticipated to lower production expenses.
Production Expenses by Commodity Type Three months ended June 30, Six months ended June 30,($000s, except where noted) 2015 2014 2015 2014Crude oil, condensate and NGLs 8,837 8,675 18,387 17,799 $/bbl 8.46 7.54 8.42 7.85 Natural gas 22,744 17,124 47,414 33,629 $/mcf 1.44 1.32 1.44 1.34 Total production expenses 31,581 25,799 65,801 51,428 Total $/boe 8.58 7.80 8.57 7.96 TRANSPORTATION
Transportation expenses for the three and six months ended June 30, 2015 were $4.6 million ($1.26/boe) and $9.5 million ($1.24/boe), compared to $2.7 million ($0.82/boe) and $7.8 million ($1.20/boe) in the same periods in 2014, respectively. The higher transportation costs per boe realized in the first six months of 2015 compared to the same period in 2014 were due to increased trucking costs in the 2015 period as a result of optimization efforts of total production volumes into a major operated processing facility.
2015 SECOND QUARTER REPORT
20
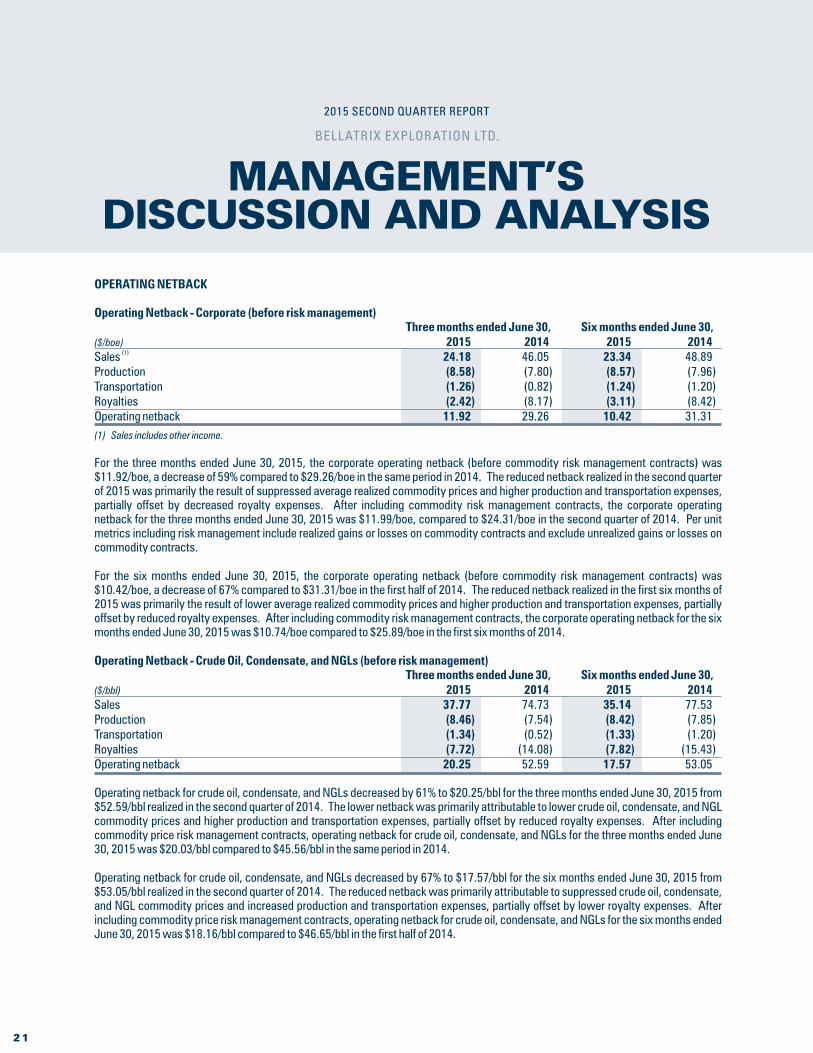
MANAGEMENT’S DISCUSSION AND ANALYSIS
BELLATRIX EXPLORATION LTD.
OPERATING NETBACK
Operating Netback - Corporate (before risk management) Three months ended June 30, Six months ended June 30,($/boe) 2015 2014 2015 2014
(1)Sales 24.18 46.05 23.34 48.89Production (8.58) (7.80) (8.57) (7.96)Transportation (1.26) (0.82) (1.24) (1.20)Royalties (2.42) (8.17) (3.11) (8.42)Operating netback 11.92 29.26 10.42 31.31(1) Sales includes other income.
For the three months ended June 30, 2015, the corporate operating netback (before commodity risk management contracts) was $11.92/boe, a decrease of 59% compared to $29.26/boe in the same period in 2014. The reduced netback realized in the second quarter of 2015 was primarily the result of suppressed average realized commodity prices and higher production and transportation expenses, partially offset by decreased royalty expenses. After including commodity risk management contracts, the corporate operating netback for the three months ended June 30, 2015 was $11.99/boe, compared to $24.31/boe in the second quarter of 2014. Per unit metrics including risk management include realized gains or losses on commodity contracts and exclude unrealized gains or losses on commodity contracts.
For the six months ended June 30, 2015, the corporate operating netback (before commodity risk management contracts) was $10.42/boe, a decrease of 67% compared to $31.31/boe in the first half of 2014. The reduced netback realized in the first six months of 2015 was primarily the result of lower average realized commodity prices and higher production and transportation expenses, partially offset by reduced royalty expenses. After including commodity risk management contracts, the corporate operating netback for the six months ended June 30, 2015 was $10.74/boe compared to $25.89/boe in the first six months of 2014.
Operating Netback - Crude Oil, Condensate, and NGLs (before risk management) Three months ended June 30, Six months ended June 30,($/bbl) 2015 2014 2015 2014Sales 37.77 74.73 35.14 77.53Production (8.46) (7.54) (8.42) (7.85)Transportation (1.34) (0.52) (1.33) (1.20)Royalties (7.72) (14.08) (7.82) (15.43)Operating netback 20.25 52.59 17.57 53.05
Operating netback for crude oil, condensate, and NGLs decreased by 61% to $20.25/bbl for the three months ended June 30, 2015 from $52.59/bbl realized in the second quarter of 2014. The lower netback was primarily attributable to lower crude oil, condensate, and NGL commodity prices and higher production and transportation expenses, partially offset by reduced royalty expenses. After including commodity price risk management contracts, operating netback for crude oil, condensate, and NGLs for the three months ended June 30, 2015 was $20.03/bbl compared to $45.56/bbl in the same period in 2014.
Operating netback for crude oil, condensate, and NGLs decreased by 67% to $17.57/bbl for the six months ended June 30, 2015 from $53.05/bbl realized in the second quarter of 2014. The reduced netback was primarily attributable to suppressed crude oil, condensate, and NGL commodity prices and increased production and transportation expenses, partially offset by lower royalty expenses. After including commodity price risk management contracts, operating netback for crude oil, condensate, and NGLs for the six months ended June 30, 2015 was $18.16/bbl compared to $46.65/bbl in the first half of 2014.
2015 SECOND QUARTER REPORT
21
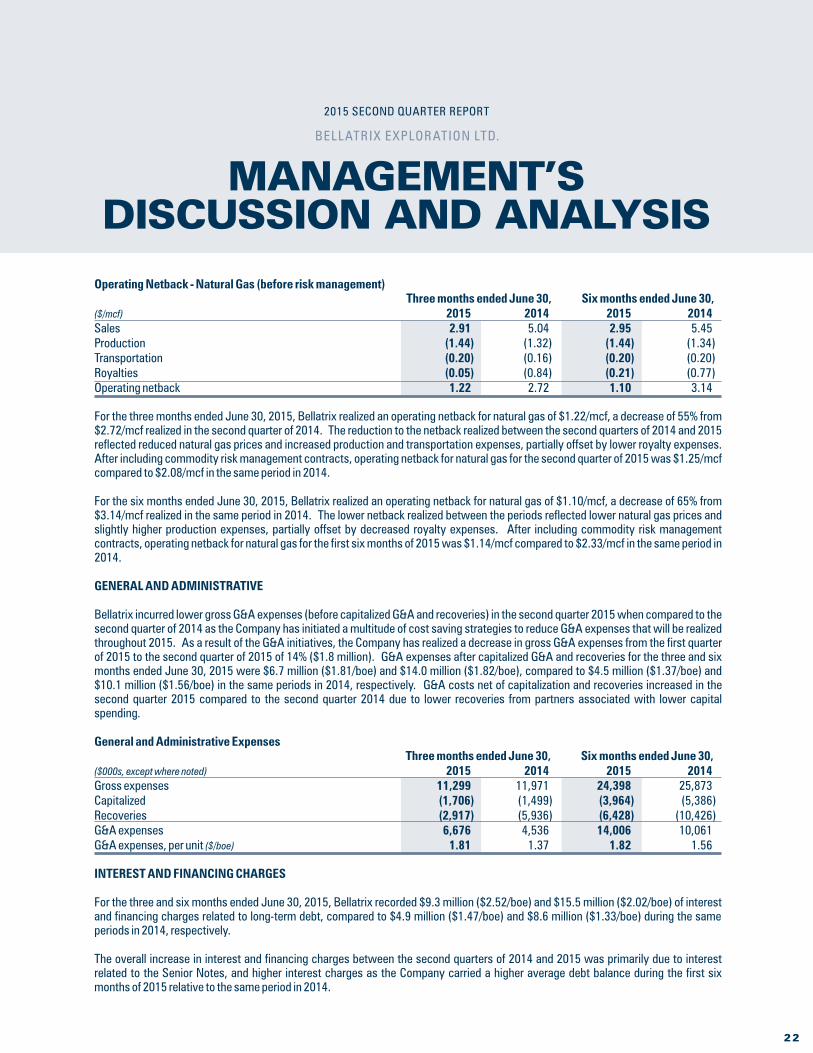
MANAGEMENT’S DISCUSSION AND ANALYSIS
BELLATRIX EXPLORATION LTD.
Operating Netback - Natural Gas (before risk management) Three months ended June 30, Six months ended June 30,($/mcf) 2015 2014 2015 2014Sales 2.91 5.04 2.95 5.45Production (1.44) (1.32) (1.44) (1.34)Transportation (0.20) (0.16) (0.20) (0.20)Royalties (0.05) (0.84) (0.21) (0.77)Operating netback 1.22 2.72 1.10 3.14
For the three months ended June 30, 2015, Bellatrix realized an operating netback for natural gas of $1.22/mcf, a decrease of 55% from $2.72/mcf realized in the second quarter of 2014. The reduction to the netback realized between the second quarters of 2014 and 2015 reflected reduced natural gas prices and increased production and transportation expenses, partially offset by lower royalty expenses. After including commodity risk management contracts, operating netback for natural gas for the second quarter of 2015 was $1.25/mcf compared to $2.08/mcf in the same period in 2014.
For the six months ended June 30, 2015, Bellatrix realized an operating netback for natural gas of $1.10/mcf, a decrease of 65% from $3.14/mcf realized in the same period in 2014. The lower netback realized between the periods reflected lower natural gas prices and slightly higher production expenses, partially offset by decreased royalty expenses. After including commodity risk management contracts, operating netback for natural gas for the first six months of 2015 was $1.14/mcf compared to $2.33/mcf in the same period in 2014. GENERAL AND ADMINISTRATIVE
Bellatrix incurred lower gross G&A expenses (before capitalized G&A and recoveries) in the second quarter 2015 when compared to the second quarter of 2014 as the Company has initiated a multitude of cost saving strategies to reduce G&A expenses that will be realized throughout 2015. As a result of the G&A initiatives, the Company has realized a decrease in gross G&A expenses from the first quarter of 2015 to the second quarter of 2015 of 14% ($1.8 million). G&A expenses after capitalized G&A and recoveries for the three and six months ended June 30, 2015 were $6.7 million ($1.81/boe) and $14.0 million ($1.82/boe), compared to $4.5 million ($1.37/boe) and $10.1 million ($1.56/boe) in the same periods in 2014, respectively. G&A costs net of capitalization and recoveries increased in the second quarter 2015 compared to the second quarter 2014 due to lower recoveries from partners associated with lower capital spending.
General and Administrative Expenses Three months ended June 30, Six months ended June 30,($000s, except where noted) 2015 2014 2015 2014Gross expenses 11,299 11,971 24,398 25,873Capitalized (1,706) (1,499) (3,964) (5,386)Recoveries (2,917) (5,936) (6,428) (10,426)G&A expenses 6,676 4,536 14,006 10,061G&A expenses, per unit ($/boe) 1.81 1.37 1.82 1.56
INTEREST AND FINANCING CHARGES
For the three and six months ended June 30, 2015, Bellatrix recorded $9.3 million ($2.52/boe) and $15.5 million ($2.02/boe) of interest and financing charges related to long-term debt, compared to $4.9 million ($1.47/boe) and $8.6 million ($1.33/boe) during the same periods in 2014, respectively.
The overall increase in interest and financing charges between the second quarters of 2014 and 2015 was primarily due to interest related to the Senior Notes, and higher interest charges as the Company carried a higher average debt balance during the first six months of 2015 relative to the same period in 2014.
2015 SECOND QUARTER REPORT
22
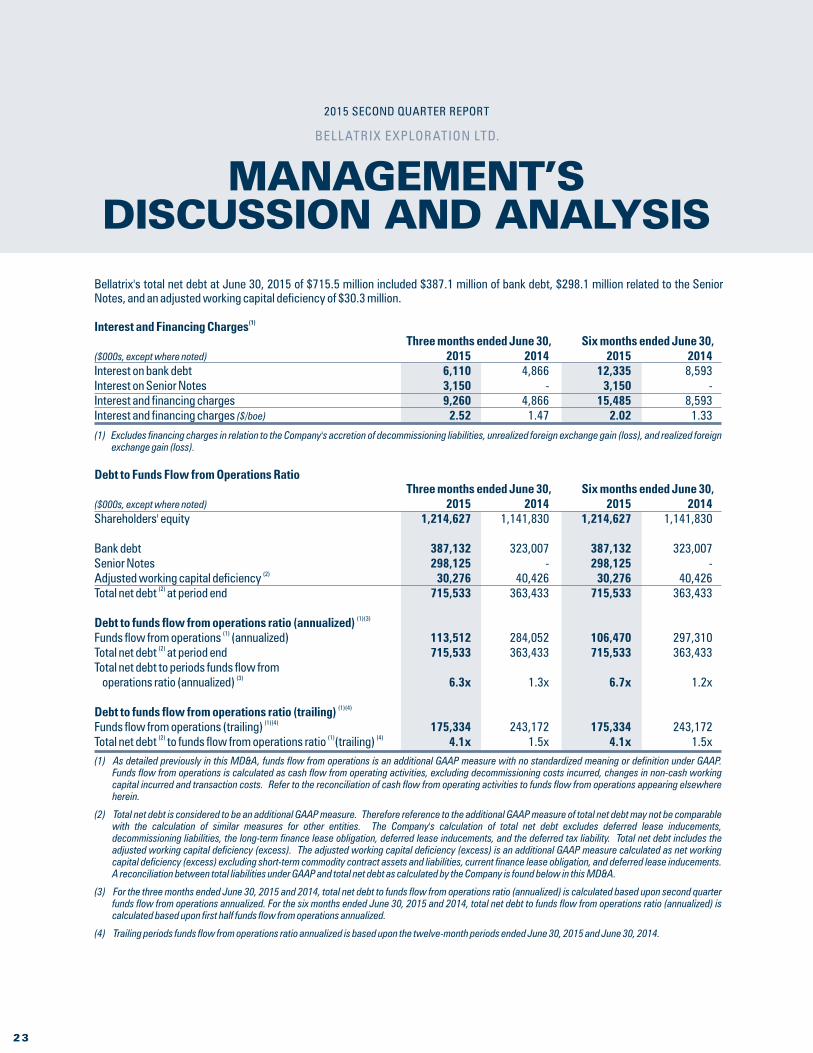
MANAGEMENT’S DISCUSSION AND ANALYSIS
BELLATRIX EXPLORATION LTD.
Bellatrix's total net debt at June 30, 2015 of $715.5 million included $387.1 million of bank debt, $298.1 million related to the Senior Notes, and an adjusted working capital deficiency of $30.3 million.
(1)Interest and Financing Charges Three months ended June 30, Six months ended June 30,($000s, except where noted) 2015 2014 2015 2014Interest on bank debt 6,110 4,866 12,335 8,593Interest on Senior Notes 3,150 - 3,150 -Interest and financing charges 9,260 4,866 15,485 8,593Interest and financing charges ($/boe) 2.52 1.47 2.02 1.33
(1) Excludes financing charges in relation to the Company's accretion of decommissioning liabilities, unrealized foreign exchange gain (loss), and realized foreign exchange gain (loss).
Debt to Funds Flow from Operations Ratio Three months ended June 30, Six months ended June 30,($000s, except where noted) 2015 2014 2015 2014Shareholders' equity 1,214,627 1,141,830 1,214,627 1,141,830 Bank debt 387,132 323,007 387,132 323,007Senior Notes 298,125 - 298,125 -
(2)Adjusted working capital deficiency 30,276 40,426 30,276 40,426(2)Total net debt at period end 715,533 363,433 715,533 363,433
(1) (3) Debt to funds flow from operations ratio (annualized)
(1)Funds flow from operations (annualized) 113,512 284,052 106,470 297,310(2)Total net debt at period end 715,533 363,433 715,533 363,433
Total net debt to periods funds flow from (3) operations ratio (annualized) 6.3x 1.3x 6.7x 1.2x
(1) (4)Debt to funds flow from operations ratio (trailing) (1) (4) Funds flow from operations (trailing) 175,334 243,172 175,334 243,172
(2) (1) (4)Total net debt to funds flow from operations ratio (trailing) 4.1x 1.5x 4.1x 1.5x(1) As detailed previously in this MD&A, funds flow from operations is an additional GAAP measure with no standardized meaning or definition under GAAP.
Funds flow from operations is calculated as cash flow from operating activities, excluding decommissioning costs incurred, changes in non-cash working capital incurred and transaction costs. Refer to the reconciliation of cash flow from operating activities to funds flow from operations appearing elsewhere herein.
(2) Total net debt is considered to be an additional GAAP measure. Therefore reference to the additional GAAP measure of total net debt may not be comparable with the calculation of similar measures for other entities. The Company's calculation of total net debt excludes deferred lease inducements, decommissioning liabilities, the long-term finance lease obligation, deferred lease inducements, and the deferred tax liability. Total net debt includes the adjusted working capital deficiency (excess). The adjusted working capital deficiency (excess) is an additional GAAP measure calculated as net working capital deficiency (excess) excluding short-term commodity contract assets and liabilities, current finance lease obligation, and deferred lease inducements. A reconciliation between total liabilities under GAAP and total net debt as calculated by the Company is found below in this MD&A.
(3) For the three months ended June 30, 2015 and 2014, total net debt to funds flow from operations ratio (annualized) is calculated based upon second quarter funds flow from operations annualized. For the six months ended June 30, 2015 and 2014, total net debt to funds flow from operations ratio (annualized) is calculated based upon first half funds flow from operations annualized.
(4) Trailing periods funds flow from operations ratio annualized is based upon the twelve-month periods ended June 30, 2015 and June 30, 2014.
2015 SECOND QUARTER REPORT
23
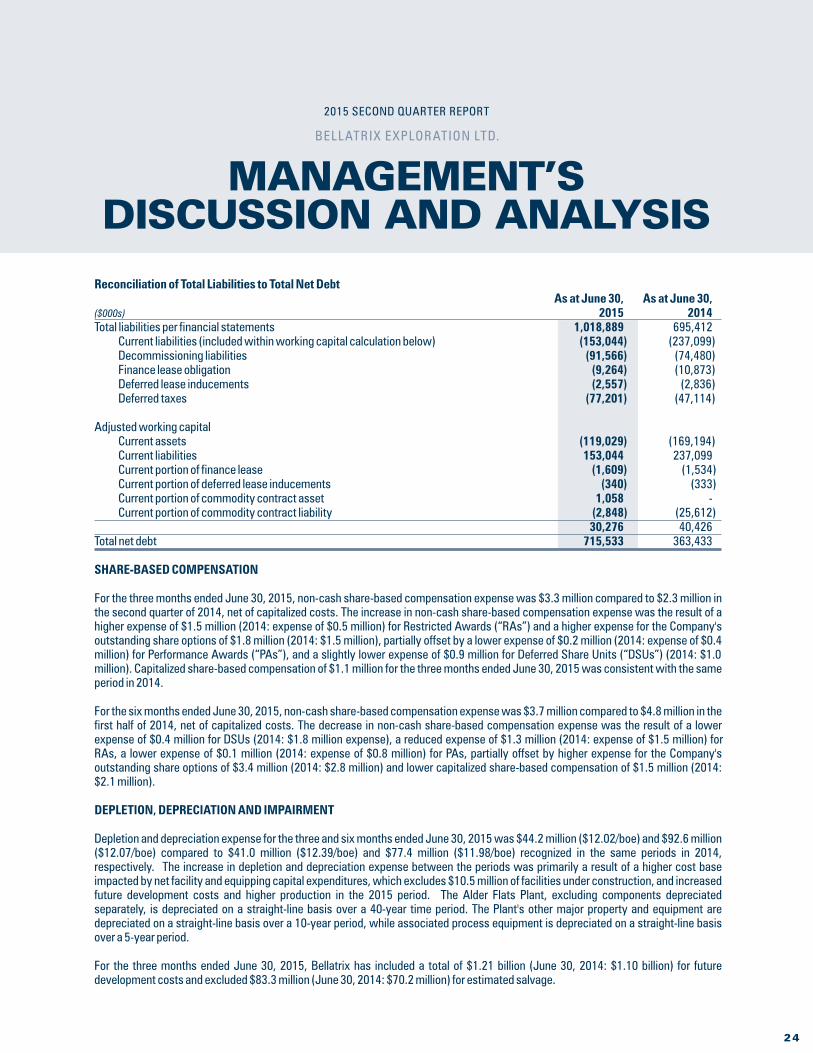
MANAGEMENT’S DISCUSSION AND ANALYSIS
BELLATRIX EXPLORATION LTD.
Reconciliation of Total Liabilities to Total Net Debt As at June 30, As at June 30,($000s) 2015 2014Total liabilities per financial statements 1,018,889 695,412 Current liabilities (included within working capital calculation below) (153,044) (237,099) Decommissioning liabilities (91,566) (74,480) Finance lease obligation (9,264) (10,873) Deferred lease inducements (2,557) (2,836) Deferred taxes (77,201) (47,114) Adjusted working capital Current assets (119,029) (169,194) Current liabilities 153,044 237,099 Current portion of finance lease (1,609) (1,534) Current portion of deferred lease inducements (340) (333) Current portion of commodity contract asset 1,058 - Current portion of commodity contract liability (2,848) (25,612) 30,276 40,426Total net debt 715,533 363,433
SHARE-BASED COMPENSATION
For the three months ended June 30, 2015, non-cash share-based compensation expense was $3.3 million compared to $2.3 million in the second quarter of 2014, net of capitalized costs. The increase in non-cash share-based compensation expense was the result of a higher expense of $1.5 million (2014: expense of $0.5 million) for Restricted Awards (“RAs”) and a higher expense for the Company's outstanding share options of $1.8 million (2014: $1.5 million), partially offset by a lower expense of $0.2 million (2014: expense of $0.4 million) for Performance Awards (“PAs”), and a slightly lower expense of $0.9 million for Deferred Share Units (“DSUs”) (2014: $1.0 million). Capitalized share-based compensation of $1.1 million for the three months ended June 30, 2015 was consistent with the same period in 2014.
For the six months ended June 30, 2015, non-cash share-based compensation expense was $3.7 million compared to $4.8 million in the first half of 2014, net of capitalized costs. The decrease in non-cash share-based compensation expense was the result of a lower expense of $0.4 million for DSUs (2014: $1.8 million expense), a reduced expense of $1.3 million (2014: expense of $1.5 million) for RAs, a lower expense of $0.1 million (2014: expense of $0.8 million) for PAs, partially offset by higher expense for the Company's outstanding share options of $3.4 million (2014: $2.8 million) and lower capitalized share-based compensation of $1.5 million (2014: $2.1 million).
DEPLETION, DEPRECIATION AND IMPAIRMENT
Depletion and depreciation expense for the three and six months ended June 30, 2015 was $44.2 million ($12.02/boe) and $92.6 million ($12.07/boe) compared to $41.0 million ($12.39/boe) and $77.4 million ($11.98/boe) recognized in the same periods in 2014, respectively. The increase in depletion and depreciation expense between the periods was primarily a result of a higher cost base impacted by net facility and equipping capital expenditures, which excludes $10.5 million of facilities under construction, and increased future development costs and higher production in the 2015 period. The Alder Flats Plant, excluding components depreciated separately, is depreciated on a straight-line basis over a 40-year time period. The Plant's other major property and equipment are depreciated on a straight-line basis over a 10-year period, while associated process equipment is depreciated on a straight-line basis over a 5-year period.
For the three months ended June 30, 2015, Bellatrix has included a total of $1.21 billion (June 30, 2014: $1.10 billion) for future development costs and excluded $83.3 million (June 30, 2014: $70.2 million) for estimated salvage.
2015 SECOND QUARTER REPORT
24
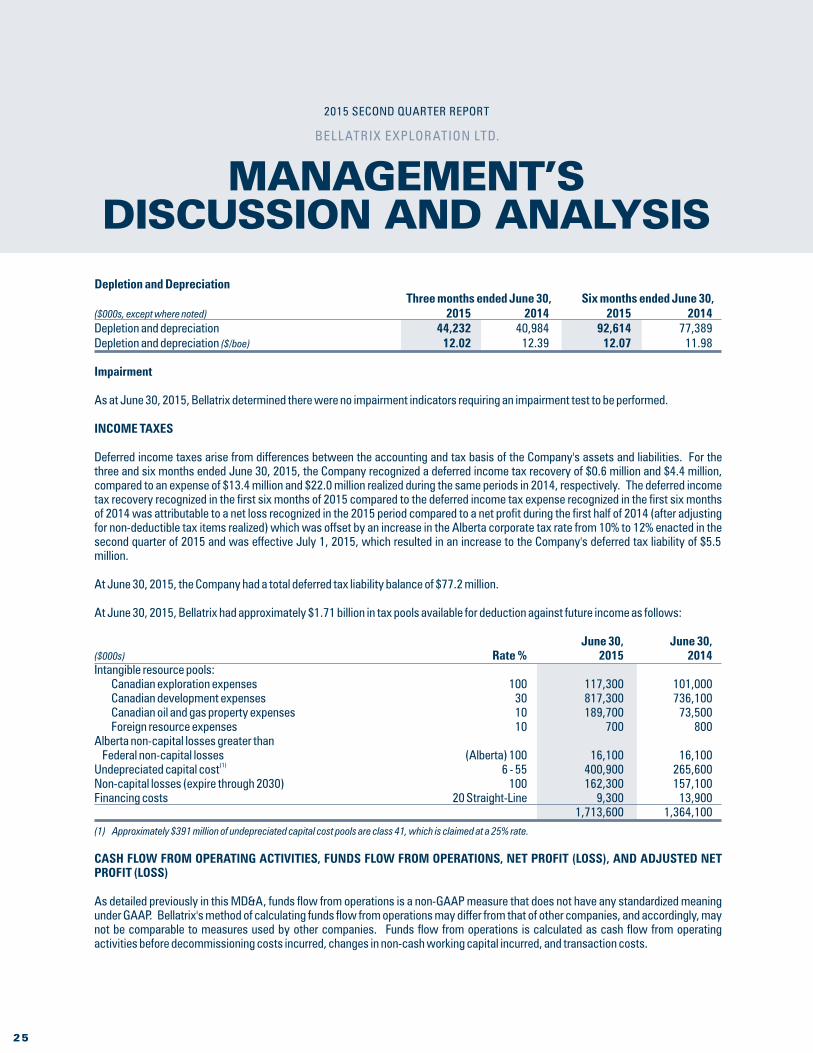
MANAGEMENT’S DISCUSSION AND ANALYSIS
BELLATRIX EXPLORATION LTD.
Depletion and Depreciation Three months ended June 30, Six months ended June 30,($000s, except where noted) 2015 2014 2015 2014Depletion and depreciation 44,232 40,984 92,614 77,389Depletion and depreciation ($/boe) 12.02 12.39 12.07 11.98
Impairment
As at June 30, 2015, Bellatrix determined there were no impairment indicators requiring an impairment test to be performed.
INCOME TAXES
Deferred income taxes arise from differences between the accounting and tax basis of the Company's assets and liabilities. For the three and six months ended June 30, 2015, the Company recognized a deferred income tax recovery of $0.6 million and $4.4 million, compared to an expense of $13.4 million and $22.0 million realized during the same periods in 2014, respectively. The deferred income tax recovery recognized in the first six months of 2015 compared to the deferred income tax expense recognized in the first six months of 2014 was attributable to a net loss recognized in the 2015 period compared to a net profit during the first half of 2014 (after adjusting for non-deductible tax items realized) which was offset by an increase in the Alberta corporate tax rate from 10% to 12% enacted in the second quarter of 2015 and was effective July 1, 2015, which resulted in an increase to the Company's deferred tax liability of $5.5 million.
At June 30, 2015, the Company had a total deferred tax liability balance of $77.2 million.
At June 30, 2015, Bellatrix had approximately $1.71 billion in tax pools available for deduction against future income as follows:
June 30, June 30,($000s) Rate % 2015 2014Intangible resource pools: Canadian exploration expenses 100 117,300 101,000 Canadian development expenses 30 817,300 736,100 Canadian oil and gas property expenses 10 189,700 73,500 Foreign resource expenses 10 700 800Alberta non-capital losses greater than Federal non-capital losses (Alberta) 100 16,100 16,100
(1)Undepreciated capital cost 6 - 55 400,900 265,600Non-capital losses (expire through 2030) 100 162,300 157,100Financing costs 20 Straight-Line 9,300 13,900 1,713,600 1,364,100(1) Approximately $391 million of undepreciated capital cost pools are class 41, which is claimed at a 25% rate.
CASH FLOW FROM OPERATING ACTIVITIES, FUNDS FLOW FROM OPERATIONS, NET PROFIT (LOSS), AND ADJUSTED NET PROFIT (LOSS)
As detailed previously in this MD&A, funds flow from operations is a non-GAAP measure that does not have any standardized meaning under GAAP. Bellatrix's method of calculating funds flow from operations may differ from that of other companies, and accordingly, may not be comparable to measures used by other companies. Funds flow from operations is calculated as cash flow from operating activities before decommissioning costs incurred, changes in non-cash working capital incurred, and transaction costs.
2015 SECOND QUARTER REPORT
25
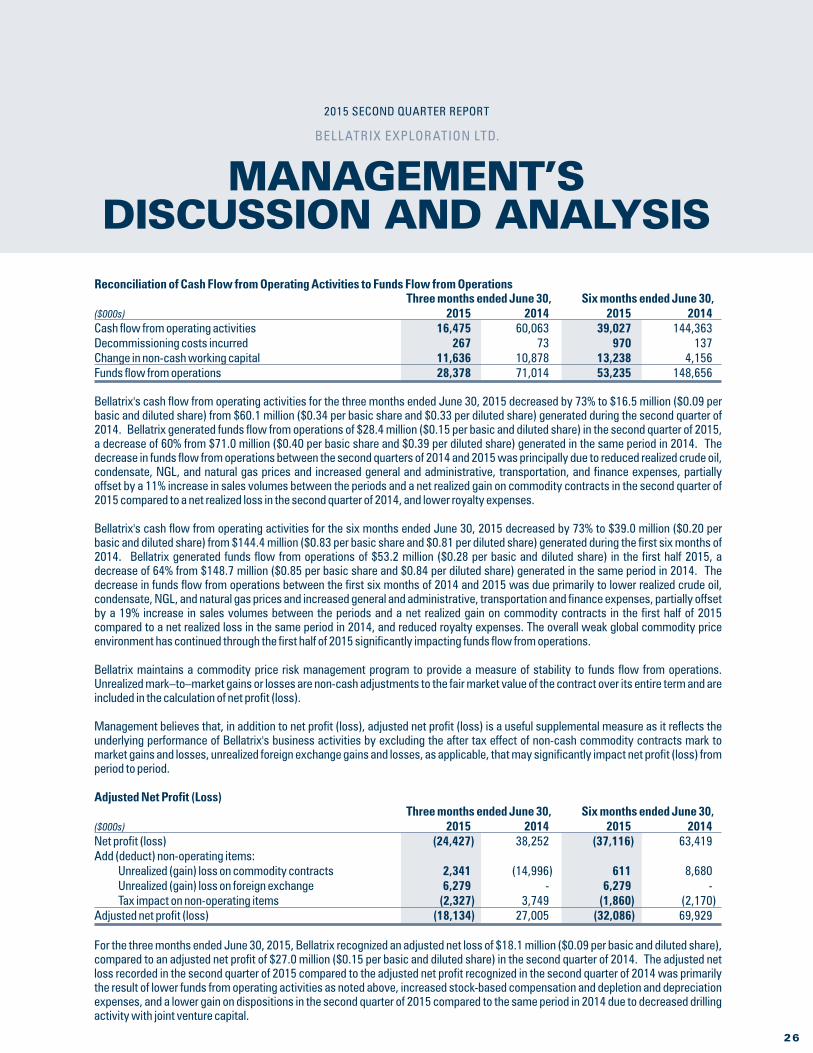
MANAGEMENT’S DISCUSSION AND ANALYSIS
BELLATRIX EXPLORATION LTD.
Reconciliation of Cash Flow from Operating Activities to Funds Flow from Operations Three months ended June 30, Six months ended June 30,($000s) 2015 2014 2015 2014Cash flow from operating activities 16,475 60,063 39,027 144,363Decommissioning costs incurred 267 73 970 137Change in non-cash working capital 11,636 10,878 13,238 4,156Funds flow from operations 28,378 71,014 53,235 148,656
Bellatrix's cash flow from operating activities for the three months ended June 30, 2015 decreased by 73% to $16.5 million ($0.09 per basic and diluted share) from $60.1 million ($0.34 per basic share and $0.33 per diluted share) generated during the second quarter of 2014. Bellatrix generated funds flow from operations of $28.4 million ($0.15 per basic and diluted share) in the second quarter of 2015, a decrease of 60% from $71.0 million ($0.40 per basic share and $0.39 per diluted share) generated in the same period in 2014. The decrease in funds flow from operations between the second quarters of 2014 and 2015 was principally due to reduced realized crude oil, condensate, NGL, and natural gas prices and increased general and administrative, transportation, and finance expenses, partially offset by a 11% increase in sales volumes between the periods and a net realized gain on commodity contracts in the second quarter of 2015 compared to a net realized loss in the second quarter of 2014, and lower royalty expenses.
Bellatrix's cash flow from operating activities for the six months ended June 30, 2015 decreased by 73% to $39.0 million ($0.20 per basic and diluted share) from $144.4 million ($0.83 per basic share and $0.81 per diluted share) generated during the first six months of 2014. Bellatrix generated funds flow from operations of $53.2 million ($0.28 per basic and diluted share) in the first half 2015, a decrease of 64% from $148.7 million ($0.85 per basic share and $0.84 per diluted share) generated in the same period in 2014. The decrease in funds flow from operations between the first six months of 2014 and 2015 was due primarily to lower realized crude oil, condensate, NGL, and natural gas prices and increased general and administrative, transportation and finance expenses, partially offset by a 19% increase in sales volumes between the periods and a net realized gain on commodity contracts in the first half of 2015 compared to a net realized loss in the same period in 2014, and reduced royalty expenses. The overall weak global commodity price environment has continued through the first half of 2015 significantly impacting funds flow from operations.
Bellatrix maintains a commodity price risk management program to provide a measure of stability to funds flow from operations. Unrealized mark–to–market gains or losses are non-cash adjustments to the fair market value of the contract over its entire term and are included in the calculation of net profit (loss).
Management believes that, in addition to net profit (loss), adjusted net profit (loss) is a useful supplemental measure as it reflects the underlying performance of Bellatrix's business activities by excluding the after tax effect of non-cash commodity contracts mark to market gains and losses, unrealized foreign exchange gains and losses, as applicable, that may significantly impact net profit (loss) from period to period.
Adjusted Net Profit (Loss) Three months ended June 30, Six months ended June 30,($000s) 2015 2014 2015 2014Net profit (loss) (24,427) 38,252 (37,116) 63,419Add (deduct) non-operating items: Unrealized (gain) loss on commodity contracts 2,341 (14,996) 611 8,680 Unrealized (gain) loss on foreign exchange 6,279 - 6,279 - Tax impact on non-operating items (2,327) 3,749 (1,860) (2,170)Adjusted net profit (loss) (18,134) 27,005 (32,086) 69,929
For the three months ended June 30, 2015, Bellatrix recognized an adjusted net loss of $18.1 million ($0.09 per basic and diluted share), compared to an adjusted net profit of $27.0 million ($0.15 per basic and diluted share) in the second quarter of 2014. The adjusted net loss recorded in the second quarter of 2015 compared to the adjusted net profit recognized in the second quarter of 2014 was primarily the result of lower funds from operating activities as noted above, increased stock-based compensation and depletion and depreciation expenses, and a lower gain on dispositions in the second quarter of 2015 compared to the same period in 2014 due to decreased drilling activity with joint venture capital.
2015 SECOND QUARTER REPORT
26
MANAGEMENT’S DISCUSSION AND ANALYSIS
BELLATRIX EXPLORATION LTD.
After including a net unrealized foreign exchange loss and an unrealized loss of commodity contracts in the second quarter (compared to a net unrealized gain in the 2014 period), Bellatrix recognized a net loss of $24.4 million ($0.13 per basic and diluted share) for the three months ended June 30, 2015, compared to a net profit of $38.3 million ($0.22 per basic share and $0.21 per diluted share) in the second quarter of 2014.
For the six months ended June 30, 2015, Bellatrix recognized an adjusted net loss of $32.1 million ($0.17 per basic and diluted share), compared to an adjusted net profit of $69.9 million ($0.40 per basic share and $0.39 per diluted share) in the same period in 2014. The overall weak global commodity price environment has continued through the first half of 2015 significantly impacting funds flow from operations and adjusted net profit of the Company. The adjusted net loss recorded in the first six months of 2015 compared to the adjusted net profit recognized in the first six months of 2014 was primarily the result of lower funds from operating activities as noted above, increased depletion and depreciation expenses, and a lower gain on dispositions in the first six months of 2015 compared to the same period in 2014 due to decreased drilling activity with joint venture capital. These negative impacts were partially offset by a lower stock-based compensation expense recognized in the first six months of 2015.
After incorporating an unrealized loss on foreign exchange realized during the 2015 period, and a lower unrealized loss on commodity contracts, Bellatrix recognized a net loss of $37.1 million ($0.19 per basic and diluted share) for the six months ended June 30, 2015, compared to a net profit of $63.4 million ($0.36 per basic and diluted share) in the same period in 2014.
Funds Flow from Operations, Cash Flow from Operating Activities, Adjusted Net Profit (Loss), and Net Profit (Loss) Three months ended June 30, Six months ended June 30,($000s, except per share amounts) 2015 2014 2015 2014Funds flow from operations 28,378 71,014 53,235 148,656 Basic ($/share) 0.15 0.40 0.28 0.85 Diluted ($/share) 0.15 0.39 0.28 0.84Cash flow from operating activities 16,475 60,063 39,027 144,363 Basic ($/share) 0.09 0.34 0.20 0.83 Diluted ($/share) 0.09 0.33 0.20 0.81Adjusted net profit (loss) (18,134) 27,005 (32,086) 69,929 Basic ($/share) (0.09) 0.15 (0.17) 0.40 Diluted ($/share) (0.09) 0.15 (0.17) 0.39Net profit (loss) (24,427) 38,252 (37,116) 63,419 Basic ($/share) (0.13) 0.22 (0.19) 0.36 Diluted ($/share) (0.13) 0.21 (0.19) 0.36
CAPITAL EXPENDITURES
Bellatrix invested $118.8 million in exploration and development capital projects, excluding property acquisitions and dispositions during the six months ended June 30, 2015, compared to $284.0 million in the first six months of 2014. In the second quarter 2015, the Company closed an arrangement to transfer ownership of a constructed pipeline to a third party at project cost.
2015 SECOND QUARTER REPORT
27
MANAGEMENT’S DISCUSSION AND ANALYSIS
BELLATRIX EXPLORATION LTD.
Capital Expenditures Three months ended June 30, Six months ended June 30,($000s) 2015 2014 2015 2014Lease acquisitions and retention (289) 4,264 2,067 6,737Geological and geophysical 24 931 627 1,676Drilling and completion costs 16,183 51,159 39,884 151,539Facilities and equipment 30,175 75,008 84,860 124,097Property transfers - cash (8,639) - (8,639) -
(1) Capital - exploration and development 37,454 131,362 118,799 284,049(2)Capital - corporate assets 1,957 3,206 3,111 3,161
Property acquisitions 48 - 749 3,000 Total capital expenditures - cash 39,459 134,568 122,659 290,210Property dispositions - cash (1,790) (8,613) (1,811) (8,392) Total net capital expenditures - cash 37,669 125,955 120,848 281,818
(3)Other - non-cash (3,921) 3,602 3,554 8,592(4)Total capital expenditures - net 33,748 129,557 124,402 290,410
(1) Excludes capitalized costs related to decommissioning liabilities expenditures incurred during the period.
(2) Capital - corporate assets includes office leasehold improvements, furniture, fixtures and equipment before recoveries realized from landlord lease inducements.
(3) Other includes non-cash adjustments for the current period's decommissioning liabilities and share based compensation.
(4) Total capital expenditures – net is considered to be a non-GAAP measure. Total capital expenditures – net includes the cash impact of capital expenditures and property dispositions, as well as the non-cash capital impacts of corporate acquisitions, property acquisitions, adjustments to the Company's decommissioning liabilities, and share based compensation.
Capital spending on exploration and development activities of $37.5 million included $21.5 million on facilities and equipment as Bellatrix successfully completed construction of Phase 1 and the related pipelines of the Bellatrix Alder Flats Plant in the second quarter of 2015. The start-up of Phase 1 of the Plant commenced on May 22, 2015, followed by first delivery of natural gas volumes to sales. Bellatrix successfully completed the 110 MMcf/d Plant Phase 1 ahead of schedule and on budget. The Plant has been developed in two phases with a combined sales capacity of 220 MMcf/d. Total net spending on the Plant (including Phase 1, Phase 2 and related pipelines) in the first half of 2015 was $56.8 million. With significant pre-build and flexibility for Phase 2 already incorporated into the design and footprint at Alder Flats, Bellatrix remains committed to construction of Phase 2 with an expected on-stream date in mid-2017. Remaining capital spending over the next two fiscal years for Phase 2 of the Plant net to Bellatrix's interest is estimated at approximately $50 million.
Based on the current economic conditions and Bellatrix's operating forecast for 2015, the Company has set its 2015 capital budget of up to $160 million, the remainder of which is expected to be directed primarily towards horizontal drilling and completions activities in the Spirit River formations.
Joint Venture Dispositions
In the three and six months ended June 30, 2015, total net gains on dispositions of $1.9 million and $8.0 million (2014: $9.4 million and $28.5 million), respectively, were recognized relating to gains on wells drilled under the Grafton Joint Venture and the Troika Joint Venture which were completed and tied-in during the first three and six months of 2015 and adjustments for wells completed and tied in during prior quarters. A gain on disposition for each well is recognized to account for the disposal of the pre-payout working interest earned by the joint venture partner on the well, which results from the difference between the percentage of all capital costs contributed for the drilling, completion, equipping and tie-in of the well by the joint venture partner and the pre-payout working interest allocated to the joint venture partner by the Company. The gain on disposition for a well is recognized during the quarter in which the well was completed and tied-in.
2015 SECOND QUARTER REPORT
28
MANAGEMENT’S DISCUSSION AND ANALYSIS
BELLATRIX EXPLORATION LTD.
Under the Grafton Joint Venture, Grafton contributes 82% of the total capital costs required for each well and in return earns 54% of Bellatrix's WI in each well drilled in the well program until payout.
Under the Troika Joint Venture, Troika contributes 50% of the total capital costs required for each well and in return earns 35% of Bellatrix's WI in each well drilled in the well program until payout.
DECOMMISSIONING LIABILITIES
At June 30, 2015, Bellatrix recorded decommissioning liabilities of $91.6 million compared to $88.6 million at December 31, 2014, for future abandonment and reclamation of the Company's properties. During the six months ended June 30, 2015, decommissioning liabilities increased by a net $3.0 million as a result of $2.0 million incurred in relation to development activities, $0.1 million resulting from changes in estimates, and $0.9 million as a result of charges for the unwinding of the discount rates used for assessing liability fair values. The $0.1 million increase as a result of changes in estimates was primarily due to reduced market interest rates which resulted in decreases to discount rates applied to the valuation of liabilities between December 31, 2014 and June 30, 2015.
LIQUIDITY AND CAPITAL RESOURCES
As an oil and gas business, Bellatrix has a declining asset base and therefore relies on ongoing development and acquisitions to replace production and add additional reserves. Future oil and natural gas production and reserves are highly dependent upon the success of exploiting the Company's existing asset base and in acquiring additional reserves. To the extent Bellatrix is successful or unsuccessful in these activities, cash flow could be increased or decreased.
Bellatrix is focused on growing oil and natural gas production from its diversified portfolio of existing and emerging resource plays in Western Canada. Bellatrix remains highly focused on key business objectives of maintaining financial strength and optimizing capital investments which it seeks to attain through a disciplined approach to capital spending, a flexible investment program and financial stewardship. Natural gas prices are primarily driven by North American supply and demand, with weather being the key factor in the short term. Bellatrix believes that natural gas represents an abundant, secure, long-term supply of energy to meet North American needs. Bellatrix's results are affected by external market and risk factors, such as fluctuations in the prices of crude oil and natural gas, movements in foreign currency exchange rates and inflationary pressures on service costs.
Bellatrix is actively engaged in exploring several capital funding alternatives designed to sustain or reduce year-end net debt in 2015 when compared to 2014 year-end net debt of $637.7 million, while maintaining delivery of the 2015 full year average production guidance of 40,500 to 41,500 boe/d, representing 8% year over year average production growth.
Even though the Company experienced continual operational success in 2014, volatility in oil and gas prices has resulted in a challenging environment for the energy sector. In response to this volatility and to preserve liquidity and capital resources, Bellatrix's Board of Directors approved a reduction to its 2015 net capital budget to not exceed $160 million on August 4, 2015. This represents a 69% reduction from actual 2014 capital spending. Bellatrix has the ability to fund its 2015 capital program by utilizing cash flow and to the extent necessary, bank indebtedness. Bellatrix anticipates annual 2015 production growth of approximately 8% relative to the 2014 average production despite this reduced capital spending program. Bellatrix continues to focus on management of all aspects of capital, operating and general and administrative cost structures and commitment to ongoing risk management efforts to protect future cash flows and capital programs.
Liquidity risk is the risk that Bellatrix will not be able to meet its financial obligations as they become due. Bellatrix actively manages its liquidity through daily and longer-term cash, debt and equity management strategies. Such strategies encompass, among other factors: having adequate sources of financing available through its bank credit facilities, estimating future cash generated from operations based on reasonable production and pricing assumptions, analysis of economic risk management opportunities, and maintaining sufficient cash flows for compliance with its credit facility financial covenants. Bellatrix was fully compliant with all of its credit facility covenants as at June 30, 2015.
2015 SECOND QUARTER REPORT
29
MANAGEMENT’S DISCUSSION AND ANALYSIS
BELLATRIX EXPLORATION LTD.
Bellatrix generally relies upon its operating cash flows and its credit facilities to fund capital requirements and provide liquidity. Future liquidity depends primarily on cash flow generated from operations, existing credit facilities and the ability to access debt and equity markets. From time to time, the Company accesses capital markets to meet its additional financing needs and to maintain flexibility in funding its capital programs. There can be no assurance that future debt or equity financing, or cash generated by operations will be available or sufficient to meet these requirements or for other corporate purposes or, if debt or equity financing is available, that it will be on terms acceptable to Bellatrix.
Credit risk is the risk of financial loss to Bellatrix if a customer or counterparty to a financial instrument fails to meet its contractual obligations, and arises principally from Bellatrix's trade receivables from joint venture partners, petroleum and natural gas marketers, and financial derivative counterparties.
A substantial portion of Bellatrix's accounts receivable are with customers and joint interest partners in the petroleum and natural gas industry and are subject to normal industry credit risks. Bellatrix currently sells substantially all of its production to ten primary purchasers under standard industry sale and payment terms. The most significant 60 day exposure to a single counterparty is approximately $15.4 million. Purchasers of Bellatrix's natural gas, crude oil and natural gas liquids are subject to a periodic internal credit review to minimize the risk of non-payment. Bellatrix has continued to closely monitor and reassess the creditworthiness of its counterparties, including financial institutions. This has resulted in Bellatrix mitigating its exposures to certain counterparties by obtaining financial assurances or reducing credit where it is deemed warranted and permitted under contractual terms.
Bellatrix may be exposed to third party credit risk through its contractual arrangements with its current or future partners and joint venture partners, marketers of its petroleum and natural gas production, derivative counterparties and other parties. In the event such entities fail to meet their contractual obligations to Bellatrix, such failures may have a material adverse effect on the Company's business, financial condition, results of operations and prospects. In addition, poor credit conditions in the industry and of joint venture partners may impact a joint venture partner's willingness to participate in Bellatrix's ongoing capital program, potentially delaying the program and the results of such program until Bellatrix finds a suitable alternative partner.
As at June 30, 2015, the Company has the ability to offer to sell up to an additional $577.4 million in securities under its $750 million Shelf Prospectus.
Total net debt levels of $715.5 million at June 30, 2015 increased by $77.8 million from $637.7 million at December 31, 2014. The increase to total net debt was primarily due to capital expenditures for made as the Company executed its $122.7 million capital program for the first six months of 2015. Total net debt levels at June 30, 2015 include bank debt, Senior Notes, and the net balance of an adjusted working capital deficiency of $30.3 million, which incorporated $58.9 million in advances from joint venture partners, the majority of which represents drilling obligations predominantly under the Company's joint venture obligations with TCA and Grafton, and under the Daewoo and Devonian Partnership. Total net debt excludes unrealized commodity contract assets and liabilities, deferred taxes, finance lease obligations, deferred lease inducements and decommissioning liabilities.
Funds flow from operations provided 43% of the funding requirements for Bellatrix's net capital expenditures for the six months ended June 30, 2015.
2015 SECOND QUARTER REPORT
30
MANAGEMENT’S DISCUSSION AND ANALYSIS
BELLATRIX EXPLORATION LTD.
Long Term Debt
Senior NotesOn May 21, 2015, the Company completed a private offering of US$250 million of 8.50% Senior Notes due May 15, 2020. Interest is payable on the Senior Notes semi-annually and the Senior Notes are redeemable at the Company's option, in whole or in part, commencing on May 15, 2017 at specified redemption prices. The Senior Notes are redeemable at the following redemption prices (expressed as a percentage of the principal amount of the Senior Notes): 2017 at 104.250%, 2018 at 102.125%, 2019 and thereafter at 100.000%. Prior to May 15, 2017, some or all of the Senior Notes may be redeemed at a price equal to 100% of the principal amount plus a make-whole premium. Additionally, up to 35% of the Senior Notes may be redeemed prior to May 15, 2017 at a redemption price equal to 108.500%, with an amount of cash not greater than the net cash proceeds of certain equity offerings. The indenture governing the Senior Notes does not contain any maintenance financial covenants. The Senior Notes are carried at amortized cost, net of debt issuance costs of $7.7 million. The Senior Notes were initially recognized at fair value, net of transaction costs, and have subsequently been carried at amortized cost.
A company that is controlled by a Director of Bellatrix acquired, through a fund managed or advised by it, US$15 million in aggregate principal amount of the Senior Notes pursuant to the offering which was conducted on an arm's length basis.
Bank DebtIn June 2015, the semi-annual review of the borrowing base under the Company's revolving credit facilities was approved at $600 million. As of June 30, 2015, the Company's credit facilities are available on an extendible revolving term basis and consist of a $75 million operating facility provided by a Canadian bank and a $525 million syndicated facility provided by nine financial institutions, subject to a borrowing base test.
Amounts borrowed under the credit facilities will bear interest at a floating rate based on the applicable Canadian prime rate, U.S. base rate, CDOR rate or LIBOR margin rate, plus between 0.8% to 4.75%, depending on the type of borrowing and the Company's senior debt to EBITDA ratio. A standby fee is charged of between 0.405% and 1.06875% on the undrawn portion of the credit facilities, depending on the Company's senior debt to EBITDA ratio. The credit facilities are secured by a $1 billion debenture containing a first ranking charge and security interest. Bellatrix has provided a negative pledge and undertaking to provide fixed charges over its properties in certain circumstances.
The credit facilities currently mature on (and are fully revolving until) May 30, 2017. An extension request may be made each year, provided that the term after extension may not exceed 3 years. Should the facility not be extended, the outstanding balance is due upon maturity. The borrowing base will be subject to re-determination on or before May 31 and November 30 in each year prior to maturity, with the next semi-annual redetermination occurring on or before November 30, 2015. The borrowing base can also be re-determined if the lenders consider that a material adverse change has occurred which is reasonably attributable to a change in the Company's oil and gas properties.
Financial Covenants
The Company's credit facilities contain market standard terms and conditions, and include, for instance, restrictions on asset dispositions and hedging.
The credit facilities are subject to a number of covenants, all of which were met as at June 30, 2015. Bellatrix calculates its financial covenants quarterly. The calculation for each financial covenant is based on specific definitions, are not in accordance with IFRS and cannot be readily replicated by referring to Bellatrix's condensed consolidated financial statements. Failing a financial covenant may result in cancellation of the credit facilities and/or all or any part of the outstanding loans with all accrued and unpaid interest to be immediately due and payable.
2015 SECOND QUARTER REPORT
31
MANAGEMENT’S DISCUSSION AND ANALYSIS
BELLATRIX EXPLORATION LTD.
As at June 30, 2015, the major financial covenants were: Position at June 30, 2015
(1) (2)Total Debt must not exceed 4.75 times EBITDA for the last four fiscal quarters 3.55x(3)Senior Debt must not exceed 4.75 times EBITDA for the last four fiscal quarters 2.09x
EBITDA must not be less than 3.5 times interest expense for the last four fiscal quarters 7.50x(1) “Total Debt” is defined as the sum of the bank loan, the principal amount of long-term debt and certain other liabilities defined in the agreement governing the
credit facilities.
(2) “EBITDA” refers to earnings before interest, taxes, depreciation and amortization. EBITDA is calculated based on terms and definitions set out in the agreement governing the credit facilities which adjusts net income for financing costs, certain specific unrealized and non-cash transactions, and acquisition and disposition activity and is calculated based on a trailing twelve month basis.
(3) “Senior Debt” is defined as Total Debt, excluding any unsecured or subordinated debt.
Effective August 4, 2015, the Company's banking syndicate agreed to amend the agreement governing the credit facilities with the removal of the Total Debt to EBITDA and EBITDA to interest expense financial covenants. At the same time, Bellatrix and the banking syndicate agreed to modify the Senior Debt to EBITDA financial covenant so that it must not exceed 3.5 times for the fiscal quarters ending on or before March 31, 2017. Commencing with the second quarter of 2017, the maximum Senior Debt to EBITDA covenant will return to 3.0 times (3.5 times for the two fiscal quarters immediately following a material acquisition).
During June 2015, Bellatrix issued an additional $4.7 million in letters of credit relating to monthly transportation costs on the Canadian mainline gas transmission system. Excluding $5.7 million of outstanding letters of credit that reduce the amount otherwise available to be drawn on the syndicated facility as at June 30, 2015, approximately $212.9 million or 35% of unused and available bank credit under its credit facilities was available to fund Bellatrix's ongoing capital spending and operational requirements.
Bellatrix currently has commitments associated with its credit facilities outlined above and the commitments outlined under the “Commitments” section. COMMITMENTS
As at June 30, 2015, Bellatrix committed to drill 7 gross (2.2 net) wells pursuant to farm-in agreements. Bellatrix expects to satisfy these drilling commitments at an estimated net cost of approximately $8.2 million.
In addition, Bellatrix entered into a joint operating agreement during the 2011 year which includes a minimum commitment for the Company to drill a specified number of wells each year over the term of the agreement. The details of the agreement are provided in the table below:
Joint Operating Agreement Feb. 1, 2011Commitment term 2011 to 2015Minimum wells per year (gross and net) 3Minimum total wells (gross and net) 15Estimated total cost ($ millions) $ 56.3Remaining wells to drill at June 30, 2015 2Remaining estimated total cost ($ millions) $ 7.5
Bellatrix also has certain drilling commitments relating to the Grafton Joint Venture, the Daewoo and Devonian Partnership, and the Troika Joint Venture. In meeting the drilling commitments under these agreements, Bellatrix will satisfy some of the drilling commitments under the joint operating agreements described above.
2015 SECOND QUARTER REPORT
32
MANAGEMENT’S DISCUSSION AND ANALYSIS
BELLATRIX EXPLORATION LTD.
Daewoo and (2)(3) (4)Agreement Grafton Devonian Troika
Commitment term 2013 to 2016 2013 to 2016 2013 to 2015 (1)Minimum total wells (gross) 85 70 63
(1)Minimum total wells (net) 16.9 30.4 31.5(1)Estimated total cost ($millions) (gross) $ 305.0 $ 200.0 $ 240.0
(1)Estimated total cost ($millions) (net) $ 55.0 $ 100.0 $ 120.0(1)Remaining wells to drill at June 30, 2015 (gross) 28 23 6
(1)Remaining wells to drill at June 30, 2015 (net) 6 12 3(1)Remaining estimated total cost ($millions) (gross) $ 123.6 $ 93.4 $ 24.6
(1)Remaining estimated total cost ($millions) (net) $ 25.1 $ 46.7 $ 12.3(1) Gross and net estimated total cost values and gross and net minimum estimated total wells for the Troika and Grafton Joint Ventures represent Bellatrix's total
capital and well commitments pursuant to the Troika and Grafton joint venture agreements. Gross and net minimum total wells for the Daewoo and Devonian Partnership represent Bellatrix's total well commitments pursuant to the Daewoo and Devonian Partnership agreement. Gross and net estimated total cost values for the Daewoo and Devonian Partnership represent Bellatrix's estimated cost associated with its well commitments under the Daewoo and Devonian Partnership agreement. Remaining estimated total cost (gross) for the Daewoo and Devonian Partnership is based on initial Daewoo and Devonian Partnership gross capital divided by initial total gross capital including third parties.
(2) During April 2014, Grafton elected to exercise an option to increase committed capital investment to the Grafton Joint Venture established during 2013 by an additional $50 million, for a total commitment of $250 million. The funding period of the Grafton Joint Venture was extended to the third anniversary of the program's effective date for wells relating to the exercised option. All other terms and conditions of the commitment increase are the same as the previously announced Grafton Joint Venture.
(3) The funding period of the Grafton Joint Venture for the initial and amended agreement whereby Grafton will contribute $200 million was extended to December 31, 2015.
(4) The commitment term of the Troika Joint Venture has been extended to 2015 for the wells remaining to be drilled.
During September 2014, the CNOR Joint Venture was formed with CNOR a non-operated oil and gas company managed by Grafton Asset Management Inc. Through the joint venture, CNOR has committed $250 million in capital towards future accelerated development of a portion of Bellatrix's undeveloped land holdings. Bellatrix is not currently subject to any formal well or cost commitments in relation to the CNOR Joint Venture.
The Company had the following liabilities as at June 30, 2015: More than Liabilities ($000s) Total < 1 Year 1-3 Years 3-5 Years 5 years
(1)Accounts payable and accrued liabilities $ 89,321 $ 89,321 $ - $ - $ -Advances from joint venture partners 58,926 58,926 - - -
(2)Bank debt - principal 387,132 - 387,132 - -(3)Senior Notes 298,125 - - 298,125 -
(4)Decommissioning liabilities 91,566 - 748 3,743 87,075Finance lease obligation 10,873 1,609 2,972 1,277 5,015Deferred lease inducements 2,897 340 680 680 1,197Total $ 938,840 $ 150,196 $ 391,532 $ 303,825 $ 93,287
(1) Includes $0.7 million of accrued interest payable in relation to the bank credit facilities and $2.9 million related to interest on the Senior Notes are included in accounts payable and accrued liabilities.
(2) Bank debt is based on a three year facility, fully revolving until maturity, and extendable annually at the Company's option (subject to lender approval), provided that the term after any extension would not be more than three years. Interest due on the bank credit facility is calculated based upon floating rates.
(3) Senior Notes mature in 2020, but may be redeemed by Bellatrix at any time on or after May 15, 2017 at specified redemption prices.
(4) Amounts represent the inflated, discounted future abandonment and reclamation expenditures anticipated to be incurred over the life of the Company's properties (between 2018 and 2065).
2015 SECOND QUARTER REPORT
33
MANAGEMENT’S DISCUSSION AND ANALYSIS
BELLATRIX EXPLORATION LTD.
Off-Balance Sheet Arrangements
The Company has certain fixed-term lease agreements, including primarily office space leases, which were entered into in the normal course of operations. All leases have been treated as operating leases whereby the lease payments are included in operating expenses or G&A expenses depending on the nature of the lease. The lease agreements do not currently provide for early termination. No asset or liability value has been assigned to these leases in the balance sheet as of June 30, 2015.
BUSINESS PROSPECTS AND OUTLOOK
In light of the current protracted weak commodity prices, Bellatrix is honing its 2015 net capital budget from up to $200 million to a maximum of $160 million. With the majority of facilities and infrastructure spending now complete in 2015, the revised budget contemplates a focus in the second half of the year drilling 20 gross (9.5 net) wells. Net capital spending of up to $40 million in the last six months of 2015 is expected to represent approximately 80% of forecast cash flow during the balance of the year. The revised capital budget incorporates plans to access up to $65 million of partner capital under joint venture arrangements, thereby providing an uplift in net Bellatrix production volumes and cash flow relative to its net proportion of capital spend on drilling and completion activity.
Strong well performance and shallowing production decline rates have partially mitigated the impact of a reduced capital spending budget. Bellatrix anticipates full year annual average production of approximately 40,500 to 41,500 boe/d, down 2,500 boe/d relative to the Company's previous guidance range, reflecting the reduced capital budget. Bellatrix successfully completed the Senior Notes offering and used the net proceeds from the offering to partially repay indebtedness outstanding on its bank credit facilities, thereby creating additional liquidity of approximately $235 million. Following this successful Senior Note offering, Bellatrix has recently finalized amendments to the agreement governing its bank credit facilities to permanently remove two of the three existing financial covenants, as detailed in the MD&A. All of these developments provide enhanced financial flexibility to the Company.
2015 Guidance Revised Original 2015 Guidance 2015 Guidance ChangeAverage daily production (boe/d) Low range 40,500 43,000 (2,500) High range 41,500 44,000 (2,500)Average product mix Crude oil, condensate and NGLs (%) 30 33 (3) Natural gas (%) 70 67 3
(1) Capital spending ($ millions) 160 200 (40)Expenses ($/boe) Production 8.25 8.25 -
(2) General and administrative 1.65 1.50 0.15(1) Capital spending includes exploration and development capital projects and corporate assets, and excludes property acquisitions and dispositions.
(2) G&A expenses are after capitalized G&A and recoveries.
With the majority of facilities and infrastructure spending now complete in 2015, Bellatrix is shifting its focus to development drilling and leveraging joint venture capital in the high impact Spirit River play in the second half of the year. This concentrated development program is expected to enhance overall corporate operating and capital efficiencies. Bellatrix is currently operating three drilling rigs which Bellatrix expects to maintain through the third quarter principally drilling wells within Bellatrix's JV arrangements and focused on Falher and Notikewin opportunities in the Spirit River formation.
Drill, complete, equip and tie-in costs for the Spirit River wells year to date are down approximately 10% relative to 2014 average costs. Bellatrix's low cost structure and high quality asset base position the Company to successfully navigate this protracted period of low commodity prices. The Company continues to focus on profitable growth and ultimate value maximization for its shareholders. Bellatrix's unwavering focus on cost containment and capital discipline will continue through 2015 and beyond. Finally, the Company's financial position continues to improve and it looks forward to executing additional value enhancing strategies to further strengthen all aspects of the business.
2015 SECOND QUARTER REPORT
34
MANAGEMENT’S DISCUSSION AND ANALYSIS
BELLATRIX EXPLORATION LTD.
CRITICAL ACCOUNTING ESTIMATES AND ACCOUNTING POLICIES
The reader is advised that the critical accounting estimates, policies, and practices described in the Company's MD&A for the year ended December 31, 2014 continue to be critical in determining Bellatrix's unaudited financial results as of June 30, 2015. There were no changes in accounting policies during the six months ended June 30, 2015 except for property, plant and equipment.
With the completion of Phase 1 of the Bellatrix Alder Flats Plant during the three months ended June 30, 2015, Bellatrix began depreciating the associated costs of the Phase 1 of the Plant as the asset is now available for use.
Depreciation is recognized to expense the cost of significant components of assets less their residual values over their useful lives.
Bellatrix's Plant and associated equipment are depreciated using the straight-line method over estimated useful lives as follows:
- General plant and processing equipment - 40 years - Other properties and equipment - 10 years - Turnarounds - 5 years
Depreciation methods, useful lives and residual values are reviewed at each reporting date and, if necessary, any changes would be accounted for prospectively.
A summary of future accounting pronouncements is found in the Company's MD&A for the year ended December 31, 2014. A copy of the Company's MD&A for the year ended December 31, 2014 is available at www.sedar.com or as part of the Company's annual report on Form 40-F for the year ended December 31, 2014, which may be found at www.sec.gov.
LEGAL, ENVIRONMENTAL REMEDIATION AND OTHER CONTINGENT MATTERS
The Company is involved in various claims and litigation arising in the normal course of business. While the outcome of these matters is uncertain and there can be no assurance that such matters will be resolved in the Company's favor, the Company does not currently believe that the outcome of adverse decisions in any pending or threatened proceeding related to these and other matters or any amount which it may be required to pay by reason thereof would have a material adverse impact on its financial position or results of operations.
The Company reviews legal, environmental remediation and other contingent matters to both determine whether a loss is probable based on judgment and interpretation of laws and regulations and determine that the loss can reasonably be estimated. When the loss is determined, it is charged to earnings. The Company's management monitors known and potential contingent matters and makes appropriate provisions by charges to earnings when warranted by the circumstances.
With the above risks and uncertainties the reader is cautioned that future events and results may vary substantially from that which Bellatrix currently foresees. CONTROLS AND PROCEDURES
Disclosure Controls and Procedures
The Company's President and Chief Executive Officer and Executive Vice President and Chief Financial Officer have designed, or caused to be designed under their supervision, disclosure controls and procedures to provide reasonable assurance that: (i) material information relating to the Company is made known to the Company's President and Chief Executive Officer and Executive Vice President and Chief Financial Officer by others, particularly during the period in which the annual and interim filings are being prepared; and (ii) information required to be disclosed by the Company in its annual filings, interim filings or other reports filed or submitted by it under securities legislation is recorded, processed, summarized and reported within the time period specified in securities legislation.
2015 SECOND QUARTER REPORT
35

MANAGEMENT’S DISCUSSION AND ANALYSIS
BELLATRIX EXPLORATION LTD.
Internal Control over Financial Reporting
The Company's President and Chief Executive Officer and Executive Vice President and Chief Financial Officer have designed, or caused to be designed under their supervision, internal control over financial reporting to provide reasonable assurance regarding the reliability of the Company's financial reporting and the preparation of financial statements for external purposes in accordance with GAAP.
The Company is required to disclose any changes herein in the Company's internal control over financial reporting that occurred during the period April 1, 2015 and ended on June 30, 2015 that has materially affected, or is reasonably likely to materially affect the Company's internal control over financial reporting based on the criteria described in “Internal Control – Integrated Framework (2013)” issued by the Committee of Sponsoring Organizations of the Treadway Commission. No material changes in the Company's internal control over financial reporting were identified during such period that has materially affected, or are reasonably likely to materially affect, the Company's internal control over financial reporting.
It should be noted that a control system, including the Company's disclosure and internal controls and procedures, no matter how well conceived, can provide only reasonable, but not absolute, assurance that the objectives of the control system will be met and it should not be expected that the disclosure and internal controls and procedures will prevent all errors or fraud. SENSITIVITY ANALYSIS
The table below shows sensitivities to funds flow from operations as a result of product price, exchange rate, and interest rate changes. This is based on actual average prices received for the second quarter of 2015 and average production volumes of 40,426 boe/d during that period, as well as the same level of debt outstanding as at June 30, 2015. Diluted weighted average shares are based upon the second quarter of 2015. These sensitivities are approximations only, and not necessarily valid under other significantly different production levels or product mixes. Commodity price risk management activities can significantly affect these sensitivities. Changes in any of these parameters will affect funds flow as shown in the table below:
(1) (1) Funds Flow from Operations Funds Flow from Operations (Annualized) (Per Diluted Share)Sensitivity Analysis ($000s) ($/share)
(2)Change of US $1/bbl 4,100 0.02 (2)Change of $0.10/mcf 6,200 0.03
Change in prime rate of 1% 3,900 0.02Change of $0.01 CDN/US exchange rate 1,000 0.01(1) The term “funds flow from operations” should not be considered an alternative to, or more meaningful than cash flow from operating activities as determined
in accordance with GAAP as an indicator of the Company's performance. Therefore reference to additional GAAP measures of funds flow from operations or funds flow from operations per diluted share may not be comparable with the calculation of similar measures for other entities. Management uses funds flow from operations to analyze operating performance and leverage and considers funds flow from operations to be a key measure as it demonstrates the Company's ability to generate the cash necessary to fund future capital investments and to repay debt. The reconciliation between cash flow from operating activities and funds flow from operations can be found elsewhere herein. Funds flow from operations per share is calculated using the weighted average number of common shares for the period.
(2) Commodity price risk management activities are excluded from funds flow from operations sensitivity calculations.
Given a $0.01 change in the CAD/USD exchange rate, the interest expense on the Senior Notes would change by $0.1 million on an annualized basis, while the long-term debt balance would change by $2.4 million.
2015 SECOND QUARTER REPORT
36
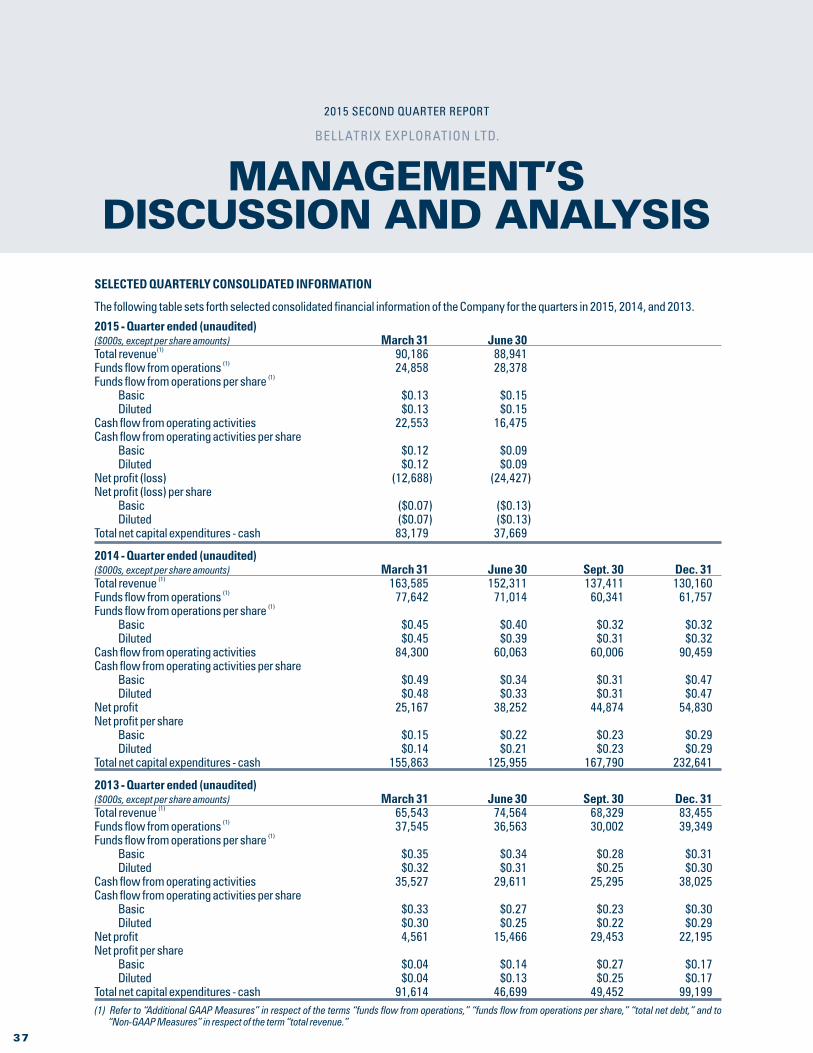
MANAGEMENT’S DISCUSSION AND ANALYSIS
BELLATRIX EXPLORATION LTD.
SELECTED QUARTERLY CONSOLIDATED INFORMATION
The following table sets forth selected consolidated financial information of the Company for the quarters in 2015, 2014, and 2013.
2015 - Quarter ended (unaudited)($000s, except per share amounts) March 31 June 30
(1)Total revenue 90,186 88,941 (1)Funds flow from operations 24,858 28,378
(1)Funds flow from operations per share Basic $0.13 $0.15 Diluted $0.13 $0.15 Cash flow from operating activities 22,553 16,475 Cash flow from operating activities per share Basic $0.12 $0.09 Diluted $0.12 $0.09 Net profit (loss) (12,688) (24,427) Net profit (loss) per share Basic ($0.07) ($0.13) Diluted ($0.07) ($0.13) Total net capital expenditures - cash 83,179 37,669
2014 - Quarter ended (unaudited)($000s, except per share amounts) March 31 June 30 Sept. 30 Dec. 31
(1)Total revenue 163,585 152,311 137,411 130,160(1)Funds flow from operations 77,642 71,014 60,341 61,757
(1)Funds flow from operations per share Basic $0.45 $0.40 $0.32 $0.32 Diluted $0.45 $0.39 $0.31 $0.32Cash flow from operating activities 84,300 60,063 60,006 90,459Cash flow from operating activities per share Basic $0.49 $0.34 $0.31 $0.47 Diluted $0.48 $0.33 $0.31 $0.47Net profit 25,167 38,252 44,874 54,830Net profit per share Basic $0.15 $0.22 $0.23 $0.29 Diluted $0.14 $0.21 $0.23 $0.29Total net capital expenditures - cash 155,863 125,955 167,790 232,641
2013 - Quarter ended (unaudited)($000s, except per share amounts) March 31 June 30 Sept. 30 Dec. 31
(1)Total revenue 65,543 74,564 68,329 83,455(1)Funds flow from operations 37,545 36,563 30,002 39,349
(1)Funds flow from operations per share Basic $0.35 $0.34 $0.28 $0.31 Diluted $0.32 $0.31 $0.25 $0.30Cash flow from operating activities 35,527 29,611 25,295 38,025Cash flow from operating activities per share Basic $0.33 $0.27 $0.23 $0.30 Diluted $0.30 $0.25 $0.22 $0.29Net profit 4,561 15,466 29,453 22,195Net profit per share Basic $0.04 $0.14 $0.27 $0.17 Diluted $0.04 $0.13 $0.25 $0.17Total net capital expenditures - cash 91,614 46,699 49,452 99,199(1) Refer to “Additional GAAP Measures” in respect of the terms “funds flow from operations,” “funds flow from operations per share,” “total net debt,” and to
“Non-GAAP Measures” in respect of the term “total revenue.”
2015 SECOND QUARTER REPORT
37
MANAGEMENT’S DISCUSSION AND ANALYSIS
BELLATRIX EXPLORATION LTD.
During the second quarter of 2015, Bellatrix successfully completed Phase 1 of the Bellatrix Alder Flats Plant. In addition, Bellatrix closed a private offering of US$250 million of 8.50% Senior Notes due 2020 during the second quarter 2015. In the three months ended June 30, 2015, the Company incurred $37.7 million of net cash capital expenditures, compared to $126.0 million in the second quarter of 2014, and drilled and/or participated in 4 gross (2.8 net) wells, compared to 19 gross (9.0 net) wells in the same period in 2014. Bellatrix achieved sales volumes of 40,426 boe/d, an 11% increase from 36,342 boe/d realized in the second quarter of 2014. Bellatrix's total revenue generated in the second quarter of 2015 was impacted by the overall weak global community price environment, resulting in a decrease of 42% to $88.9 million compared to $152.3 million in the second quarter of 2014. Second quarter 2015 results are compared in detail to second quarter 2014 results throughout this MD&A.
Bellatrix's first quarter 2015 results were impacted by a weak global commodity price environment which continued from the fourth quarter of 2014 through the first quarter of 2015. The negative impacts of the first quarter 2015 pricing environment were partially offset by a 27% increase in production over the first quarter of 2014, which resulted from the success of Bellatrix's first quarter 2015 drilling program and Bellatrix's ongoing successful drilling activity in the Cardium and Spirit River resource plays throughout 2014.
In the fourth quarter of 2014, Bellatrix increased its borrowing base and credit facilities by $100 million to $725 million from $625 million. In the three months ended December 31, 2014, Bellatrix's net cash capital expenditures totaled $232.6 million, compared to $99.2 million in the fourth quarter of 2013. The Company drilled and/or participated in 12 gross (7.1 net) wells in the fourth quarter of 2014, compared to 35 gross (21.4 net) wells in the comparative 2013 quarter. Sales volumes increased by 79% to 42,945 boe/d from 23,968 boe/d between the fourth quarters of 2013 and 2014. Bellatrix's total revenue increased by 56% to $130.2 million in the fourth quarter of 2014 from $83.5 million in the comparative quarter in 2013 as a result of the increase in sales volumes between the quarters, in conjunction with higher realized natural gas commodity prices.
During the third quarter of 2014, Bellatrix completed several asset acquisitions including a tuck-in acquisition of working interests. In the third quarter of 2014, the Company incurred $167.8 million of net cash capital expenditures, compared to $49.5 million in the third quarter of 2013, and drilled and/or participated in 35 gross (17.5 net) wells, compared to 19 gross (8.6 net) wells in the third quarter of 2013. Bellatrix realized a 73% increase in sales volumes from 21,852 boe/d in the third quarter of 2013 to 37,838 boe/d in the comparative 2014 period. Bellatrix's total revenue increased by 101% to $137.4 million in the third quarter of 2014 from $68.3 million in the comparative quarter in 2013 as a result of the increase in sales volumes between the quarters, in conjunction with higher natural gas prices which were partially offset by reduced crude oil and NGL commodity prices realized in the 2014 third quarter.
In the second quarter of 2014, Grafton elected to exercise an option to increase committed capital under the Grafton Joint Venture by $50 million, resulting in a total commitment of $250 million at the end of that quarter. In addition to the expansion of the Grafton Joint Venture, the Company experienced additional successes through the $172.6 million bought deal financing, the expansion of its borrowing base and credit facilities to $625 million from $500 million, and the commissioning of the Blaze Pipeline on April 1, 2014. Bellatrix's net cash capital spending in the second quarter of 2014 totaled $134.6 million, compared to $46.7 million during the comparative 2013 period. During the second quarter of 2014, the Company drilled and/or participated in 19 gross (9.0 net) wells, compared to 5 gross (5.0 net) wells in the same quarter of 2013 and realized a 64% increase in sales volumes to 36,342 boe/d in the second quarter of 2014 from 22,102 boe/d in the second quarter of 2013. The Company realized total revenue of $152.3 million in the second quarter of 2014, an increase of 104% from $74.6 million in the comparative quarter in 2013. The increased revenue was the result of the increase in sales volumes between the second quarters of 2013 and 2014, in conjunction with higher realized natural gas, crude oil and NGL prices realized in the second quarter of 2014 compared to the second quarter of 2013.
During the first quarter of 2014, Bellatrix's net cash capital expenditures totaled $155.6 million, compared to $91.6 million in the first quarter of 2013. The Company drilled and/or participated in 44 gross (25.6 net) wells in the first quarter of 2014, compared to 21 gross (17.1 net) wells in the comparative 2013 quarter. Sales volumes increased by 81% to 35,049 boe/d from 19,343 boe/d between the 2013 and 2014 first quarters. The Company's total revenue increased by 150% to $163.6 million in the first quarter of 2014 from $65.5 million in the comparative quarter in 2013 as a result of the increase in sales volumes between the quarters, in conjunction with higher realized crude oil, NGL, and natural gas commodity prices.
2015 SECOND QUARTER REPORT
38

CONDENSED CONSOLIDATEDBALANCE SHEETS
(unaudited, expressed in Canadian dollars)
BELLATRIX EXPLORATION LTD.
June 30, December 31, ($000s) 2015 2014 ASSETS Current assets Restricted cash $ 17,512 $ 25,504 Accounts receivable (note 14) 90,296 110,118 Deposits and prepaid expenses 10,163 6,926 Current portion of commodity contract asset (note 14) 1,058 - 119,029 142,548Commodity contract asset (note 14) 1,179 -Exploration and evaluation assets (note 3) 119,245 123,639Property, plant and equipment (note 4) 1,994,063 1,947,298Total assets $ 2,233,516 $ 2,213,485 LIABILITIES Current liabilities Accounts payable and accrued liabilities $ 89,321 $ 154,094 Advances from joint venture partners 58,926 76,388 Current portion of finance lease obligation 1,609 1,574 Current portion of deferred lease inducements 340 340 Current portion of commodity contract liability (note 14) 2,848 - 153,044 232,396 Bank debt (note 5) 387,132 549,792Senior notes (note 5) 298,125 -Finance lease obligation 9,264 10,063Deferred lease inducements 2,557 2,727Decommissioning liabilities 91,566 88,605Deferred taxes (note 9) 77,201 81,585Total liabilities 1,018,889 965,168 SHAREHOLDERS' EQUITY Shareholders' capital (note 6) 1,000,100 1,000,041 Contributed surplus 47,669 44,302 Retained earnings 166,858 203,974Total shareholders' equity 1,214,627 1,248,317Total liabilities and shareholders' equity $ 2,233,516 $ 2,213,485 COMMITMENTS (note 13)
See accompanying notes to the condensed consolidated financial statements.
2015 SECOND QUARTER REPORT
39
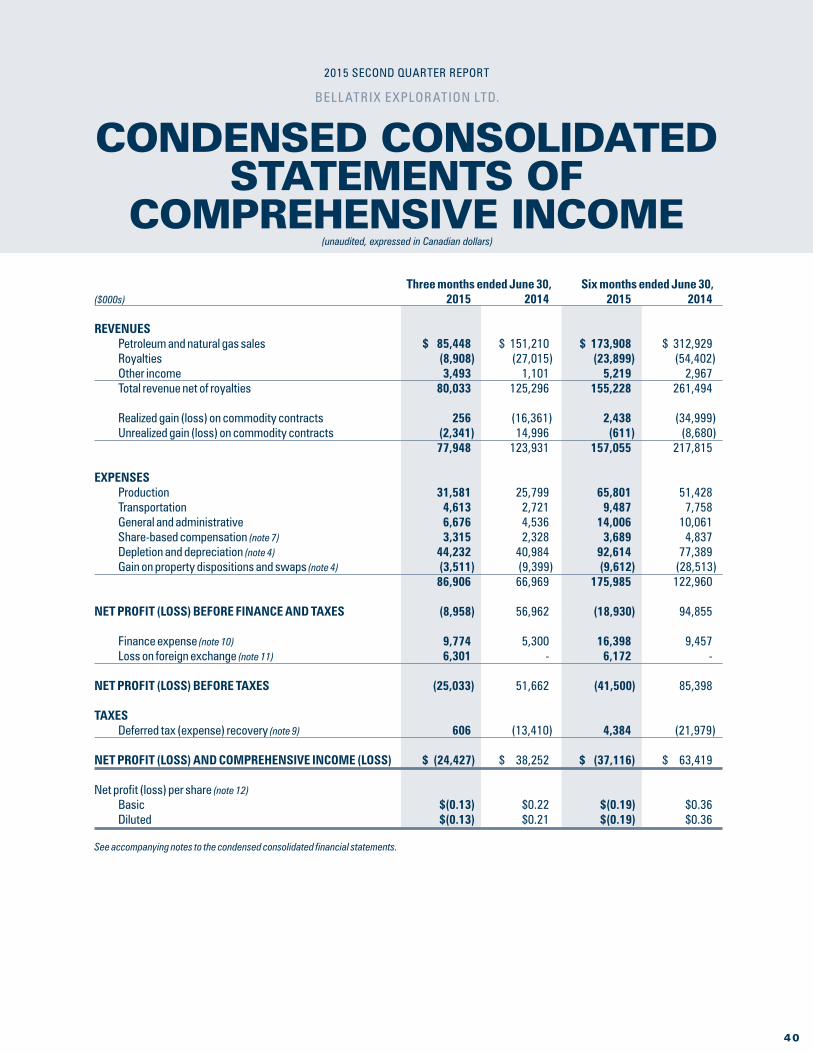
CONDENSED CONSOLIDATED STATEMENTS OF
COMPREHENSIVE INCOME
BELLATRIX EXPLORATION LTD.
2015 SECOND QUARTER REPORT
(unaudited, expressed in Canadian dollars)
Three months ended June 30, Six months ended June 30,($000s) 2015 2014 2015 2014 REVENUES Petroleum and natural gas sales $ 85,448 $ 151,210 $ 173,908 $ 312,929 Royalties (8,908) (27,015) (23,899) (54,402) Other income 3,493 1,101 5,219 2,967 Total revenue net of royalties 80,033 125,296 155,228 261,494 Realized gain (loss) on commodity contracts 256 (16,361) 2,438 (34,999) Unrealized gain (loss) on commodity contracts (2,341) 14,996 (611) (8,680) 77,948 123,931 157,055 217,815 EXPENSES Production 31,581 25,799 65,801 51,428 Transportation 4,613 2,721 9,487 7,758 General and administrative 6,676 4,536 14,006 10,061 Share-based compensation (note 7) 3,315 2,328 3,689 4,837 Depletion and depreciation (note 4) 44,232 40,984 92,614 77,389 Gain on property dispositions and swaps (note 4) (3,511) (9,399) (9,612) (28,513) 86,906 66,969 175,985 122,960 NET PROFIT (LOSS) BEFORE FINANCE AND TAXES (8,958) 56,962 (18,930) 94,855 Finance expense (note 10) 9,774 5,300 16,398 9,457 Loss on foreign exchange (note 11) 6,301 - 6,172 - NET PROFIT (LOSS) BEFORE TAXES (25,033) 51,662 (41,500) 85,398 TAXES Deferred tax (expense) recovery (note 9) 606 (13,410) 4,384 (21,979) NET PROFIT (LOSS) AND COMPREHENSIVE INCOME (LOSS) $ (24,427) $ 38,252 $ (37,116) $ 63,419 Net profit (loss) per share (note 12) Basic $(0.13) $0.22 $(0.19) $0.36 Diluted $(0.13) $0.21 $(0.19) $0.36
See accompanying notes to the condensed consolidated financial statements.
40
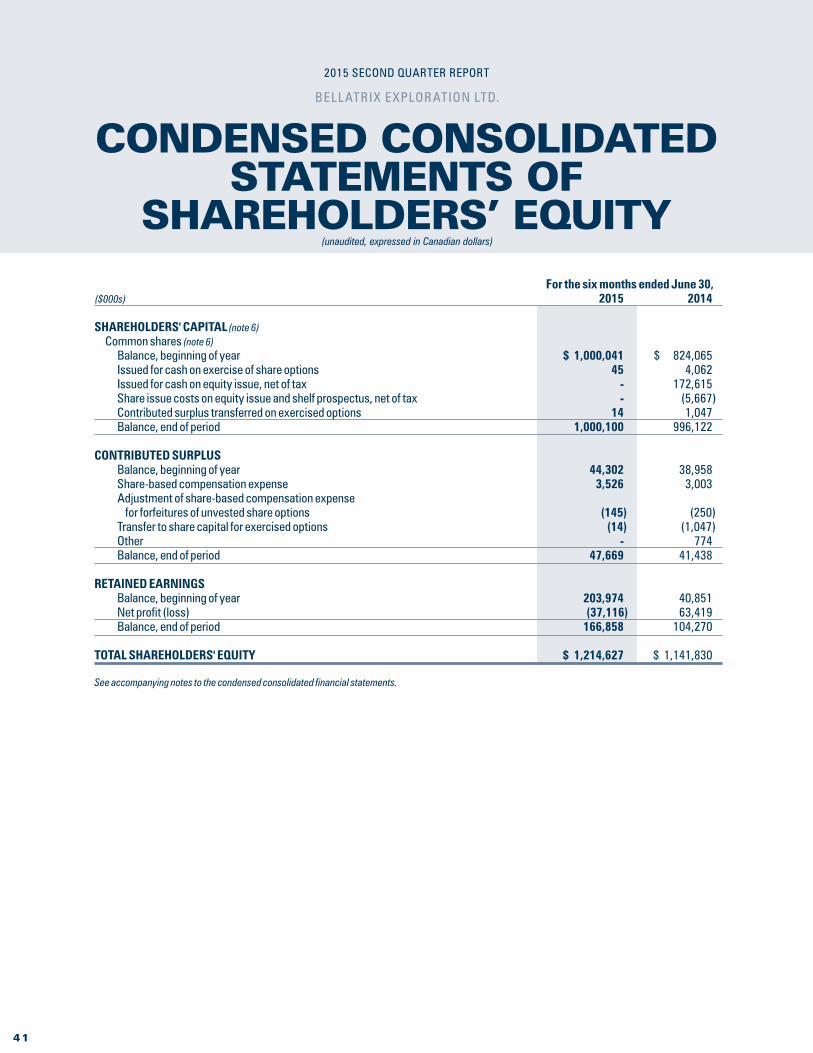
CONDENSED CONSOLIDATED STATEMENTS OF
SHAREHOLDERS’ EQUITY
BELLATRIX EXPLORATION LTD.
(unaudited, expressed in Canadian dollars)
For the six months ended June 30, ($000s) 2015 2014 SHAREHOLDERS' CAPITAL (note 6) Common shares (note 6) Balance, beginning of year $ 1,000,041 $ 824,065 Issued for cash on exercise of share options 45 4,062 Issued for cash on equity issue, net of tax - 172,615 Share issue costs on equity issue and shelf prospectus, net of tax - (5,667) Contributed surplus transferred on exercised options 14 1,047 Balance, end of period 1,000,100 996,122
CONTRIBUTED SURPLUS Balance, beginning of year 44,302 38,958 Share-based compensation expense 3,526 3,003 Adjustment of share-based compensation expense for forfeitures of unvested share options (145) (250) Transfer to share capital for exercised options (14) (1,047) Other - 774 Balance, end of period 47,669 41,438
RETAINED EARNINGS Balance, beginning of year 203,974 40,851 Net profit (loss) (37,116) 63,419 Balance, end of period 166,858 104,270 TOTAL SHAREHOLDERS' EQUITY $ 1,214,627 $ 1,141,830 See accompanying notes to the condensed consolidated financial statements.
2015 SECOND QUARTER REPORT
41
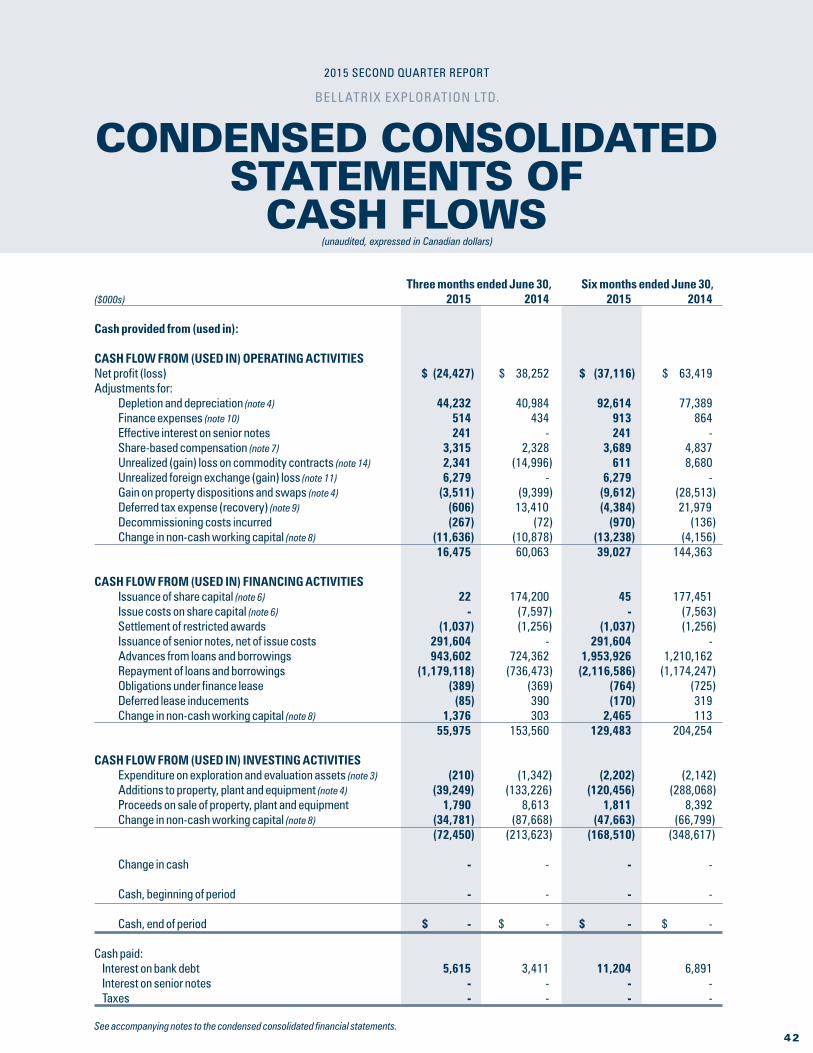
CONDENSED CONSOLIDATED STATEMENTS OF
CASH FLOWS
BELLATRIX EXPLORATION LTD.
(unaudited, expressed in Canadian dollars)
Three months ended June 30, Six months ended June 30,($000s) 2015 2014 2015 2014 Cash provided from (used in):
CASH FLOW FROM (USED IN) OPERATING ACTIVITIES Net profit (loss) $ (24,427) $ 38,252 $ (37,116) $ 63,419Adjustments for: Depletion and depreciation (note 4) 44,232 40,984 92,614 77,389 Finance expenses (note 10) 514 434 913 864 Effective interest on senior notes 241 - 241 - Share-based compensation (note 7) 3,315 2,328 3,689 4,837 Unrealized (gain) loss on commodity contracts (note 14) 2,341 (14,996) 611 8,680 Unrealized foreign exchange (gain) loss (note 11) 6,279 - 6,279 - Gain on property dispositions and swaps (note 4) (3,511) (9,399) (9,612) (28,513) Deferred tax expense (recovery) (note 9) (606) 13,410 (4,384) 21,979 Decommissioning costs incurred (267) (72) (970) (136) Change in non-cash working capital (note 8) (11,636) (10,878) (13,238) (4,156) 16,475 60,063 39,027 144,363 CASH FLOW FROM (USED IN) FINANCING ACTIVITIES Issuance of share capital (note 6) 22 174,200 45 177,451 Issue costs on share capital (note 6) - (7,597) - (7,563) Settlement of restricted awards (1,037) (1,256) (1,037) (1,256) Issuance of senior notes, net of issue costs 291,604 - 291,604 - Advances from loans and borrowings 943,602 724,362 1,953,926 1,210,162 Repayment of loans and borrowings (1,179,118) (736,473) (2,116,586) (1,174,247) Obligations under finance lease (389) (369) (764) (725) Deferred lease inducements (85) 390 (170) 319 Change in non-cash working capital (note 8) 1,376 303 2,465 113 55,975 153,560 129,483 204,254 CASH FLOW FROM (USED IN) INVESTING ACTIVITIES Expenditure on exploration and evaluation assets (note 3) (210) (1,342) (2,202) (2,142) Additions to property, plant and equipment (note 4) (39,249) (133,226) (120,456) (288,068) Proceeds on sale of property, plant and equipment 1,790 8,613 1,811 8,392 Change in non-cash working capital (note 8) (34,781) (87,668) (47,663) (66,799) (72,450) (213,623) (168,510) (348,617) Change in cash - - - - Cash, beginning of period - - - - Cash, end of period $ - $ - $ - $ - Cash paid: Interest on bank debt 5,615 3,411 11,204 6,891 Interest on senior notes - - - - Taxes - - - - See accompanying notes to the condensed consolidated financial statements.
2015 SECOND QUARTER REPORT
42

NOTES TO THE CONDENSED CONSOLIDATED
FINANCIAL STATEMENTS(unaudited, expressed in Canadian dollars)
BELLATRIX EXPLORATION LTD.
1. CORPORATE INFORMATION
Bellatrix Exploration Ltd. (the “Company” or “Bellatrix”) is a growth oriented, publicly traded exploration and production oil and gas company.
Bellatrix was incorporated in Canada and the Company's registered office and principal place of business is located at 1920, 800 – 5th Avenue SW, Calgary, Alberta, Canada T2P 3T6. 2. BASIS OF PREPARATION
a. Statement of Compliance
These condensed consolidated financial statements (“interim financial statements”) were authorized by the Board of Directors on August 4, 2015. The Company prepared these interim financial statements in accordance with IAS 34 Interim Financial Reporting. The interim financial statements do not include all information and disclosures normally provided in annual financial statements and should be read in conjunction with the Company's year ended December 31, 2014 audited consolidated financial statements, available at www.sedar.com and through the U.S. Securities and Exchange Commission at www.sec.gov. The Company has prepared these interim financial statements using the same accounting policies and critical accounting estimates applied in the Company's year ended December 31, 2014 audited consolidated financial statements, except for property plant and equipment.
With the completion of Phase 1 of the Bellatrix Alder Flats Plant (the “Plant”) during the three months ended June 30, 2015, Bellatrix began depreciating the associated costs of the Phase 1 of the Plant as the asset is now available for use.
Depreciation is recognized to expense the cost of significant components of assets less their residual values over their useful lives.
Bellatrix's Plant and associated equipment are depreciated using the straight-line method over estimated useful lives as follows:
- General plant and processing equipment - 40 years - Other properties and equipment - 10 years - Turnarounds - 5 years
Depreciation methods, useful lives and residual values are reviewed at each reporting date and, if necessary, any changes would be accounted for prospectively.
b. Basis of Measurement
The interim financial statements are presented in Canadian dollars, the Company's functional currency, and have been prepared on the historical cost basis except for derivative financial instruments and liabilities for cash-settled share-based payment arrangements measured at fair value. The interim financial statements have, in management's opinion, been properly prepared using careful judgment and reasonable limits of materiality. These interim financial statements are prepared within the framework of the same significant accounting policies, critical judgments, accounting estimates, accounting policies and methods of computation as the consolidated financial statements for the fiscal year ended December 31, 2014. The interim financial statement note disclosures do not include all of those required by International Financial Reporting Standards (“IFRS”) as issued by the International Accounting Standards Board (“IASB”) applicable for annual financial statements. Accordingly, the interim financial statements should be read in conjunction with the consolidated financial statements and notes thereto as at and for the year ended December 31, 2014.
2015 SECOND QUARTER REPORT
43
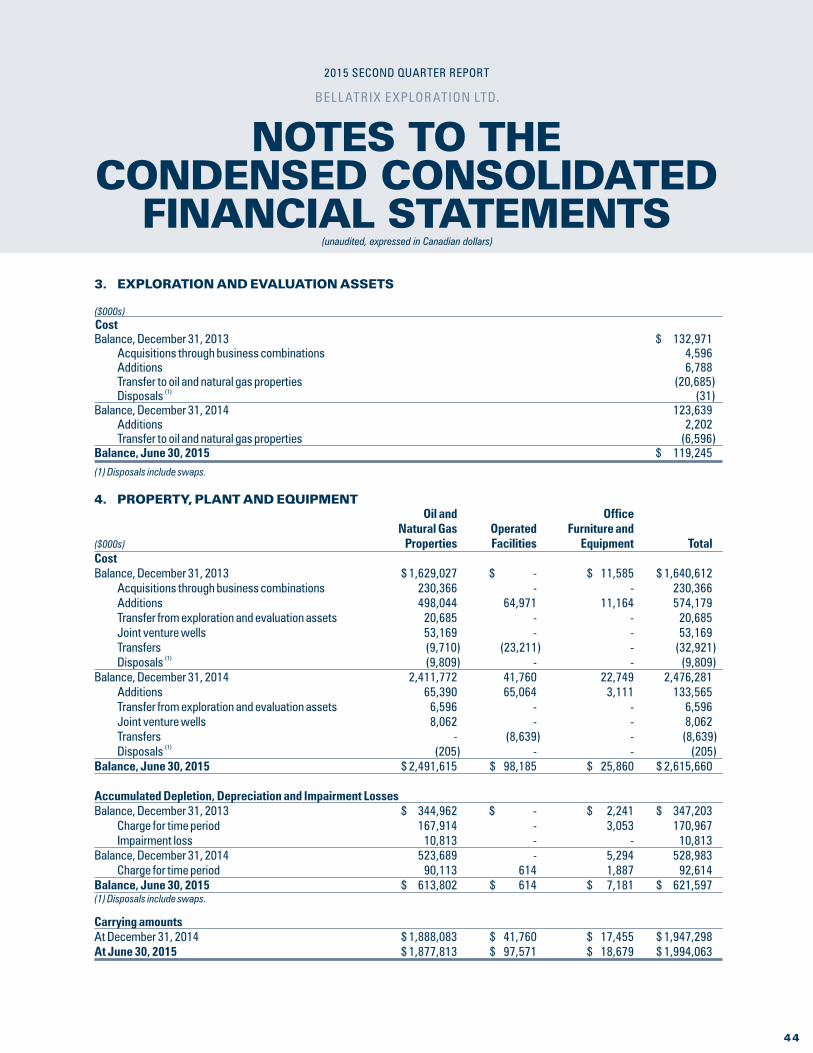
NOTES TO THE CONDENSED CONSOLIDATED
FINANCIAL STATEMENTS(unaudited, expressed in Canadian dollars)
BELLATRIX EXPLORATION LTD.
44
3. EXPLORATION AND EVALUATION ASSETS
($000s) Cost Balance, December 31, 2013 $ 132,971 Acquisitions through business combinations 4,596 Additions 6,788 Transfer to oil and natural gas properties (20,685)
(1) Disposals (31)Balance, December 31, 2014 123,639 Additions 2,202 Transfer to oil and natural gas properties (6,596)Balance, June 30, 2015 $ 119,245(1) Disposals include swaps.
4. PROPERTY, PLANT AND EQUIPMENT Oil and Office Natural Gas Operated Furniture and($000s) Properties Facilities Equipment Total Cost Balance, December 31, 2013 $ 1,629,027 $ - $ 11,585 $ 1,640,612 Acquisitions through business combinations 230,366 - - 230,366 Additions 498,044 64,971 11,164 574,179 Transfer from exploration and evaluation assets 20,685 - - 20,685 Joint venture wells 53,169 - - 53,169 Transfers (9,710) (23,211) - (32,921)
(1) Disposals (9,809) - - (9,809)Balance, December 31, 2014 2,411,772 41,760 22,749 2,476,281 Additions 65,390 65,064 3,111 133,565 Transfer from exploration and evaluation assets 6,596 - - 6,596 Joint venture wells 8,062 - - 8,062 Transfers - (8,639) - (8,639)
(1) Disposals (205) - - (205)Balance, June 30, 2015 $ 2,491,615 $ 98,185 $ 25,860 $ 2,615,660
Accumulated Depletion, Depreciation and Impairment Losses Balance, December 31, 2013 $ 344,962 $ - $ 2,241 $ 347,203 Charge for time period 167,914 - 3,053 170,967 Impairment loss 10,813 - - 10,813Balance, December 31, 2014 523,689 - 5,294 528,983 Charge for time period 90,113 614 1,887 92,614Balance, June 30, 2015 $ 613,802 $ 614 $ 7,181 $ 621,597(1) Disposals include swaps.
Carrying amounts At December 31, 2014 $ 1,888,083 $ 41,760 $ 17,455 $ 1,947,298At June 30, 2015 $ 1,877,813 $ 97,571 $ 18,679 $ 1,994,063
2015 SECOND QUARTER REPORT
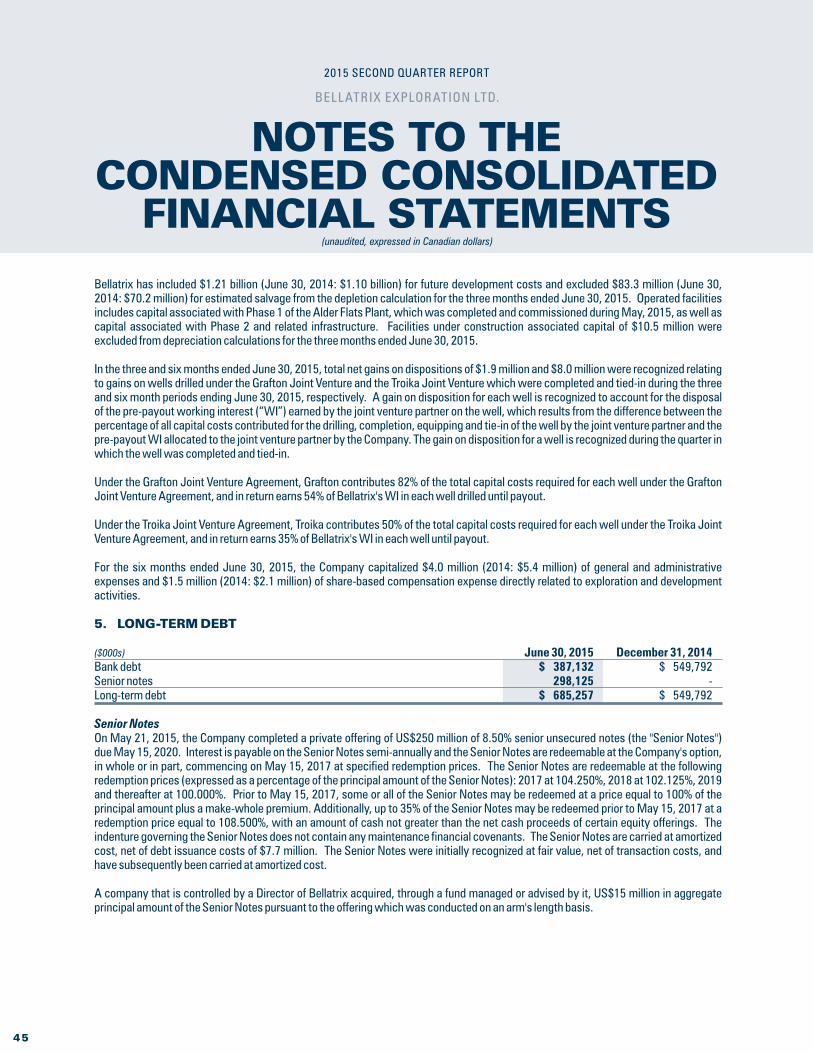
Bellatrix has included $1.21 billion (June 30, 2014: $1.10 billion) for future development costs and excluded $83.3 million (June 30, 2014: $70.2 million) for estimated salvage from the depletion calculation for the three months ended June 30, 2015. Operated facilities includes capital associated with Phase 1 of the Alder Flats Plant, which was completed and commissioned during May, 2015, as well as capital associated with Phase 2 and related infrastructure. Facilities under construction associated capital of $10.5 million were excluded from depreciation calculations for the three months ended June 30, 2015.
In the three and six months ended June 30, 2015, total net gains on dispositions of $1.9 million and $8.0 million were recognized relating to gains on wells drilled under the Grafton Joint Venture and the Troika Joint Venture which were completed and tied-in during the three and six month periods ending June 30, 2015, respectively. A gain on disposition for each well is recognized to account for the disposal of the pre-payout working interest (“WI”) earned by the joint venture partner on the well, which results from the difference between the percentage of all capital costs contributed for the drilling, completion, equipping and tie-in of the well by the joint venture partner and the pre-payout WI allocated to the joint venture partner by the Company. The gain on disposition for a well is recognized during the quarter in which the well was completed and tied-in.
Under the Grafton Joint Venture Agreement, Grafton contributes 82% of the total capital costs required for each well under the Grafton Joint Venture Agreement, and in return earns 54% of Bellatrix's WI in each well drilled until payout.
Under the Troika Joint Venture Agreement, Troika contributes 50% of the total capital costs required for each well under the Troika Joint Venture Agreement, and in return earns 35% of Bellatrix's WI in each well until payout.
For the six months ended June 30, 2015, the Company capitalized $4.0 million (2014: $5.4 million) of general and administrative expenses and $1.5 million (2014: $2.1 million) of share-based compensation expense directly related to exploration and development activities.
5. LONG-TERM DEBT
($000s) June 30, 2015 December 31, 2014Bank debt $ 387,132 $ 549,792Senior notes 298,125 -Long-term debt $ 685,257 $ 549,792
Senior NotesOn May 21, 2015, the Company completed a private offering of US$250 million of 8.50% senior unsecured notes (the "Senior Notes") due May 15, 2020. Interest is payable on the Senior Notes semi-annually and the Senior Notes are redeemable at the Company's option, in whole or in part, commencing on May 15, 2017 at specified redemption prices. The Senior Notes are redeemable at the following redemption prices (expressed as a percentage of the principal amount of the Senior Notes): 2017 at 104.250%, 2018 at 102.125%, 2019 and thereafter at 100.000%. Prior to May 15, 2017, some or all of the Senior Notes may be redeemed at a price equal to 100% of the principal amount plus a make-whole premium. Additionally, up to 35% of the Senior Notes may be redeemed prior to May 15, 2017 at a redemption price equal to 108.500%, with an amount of cash not greater than the net cash proceeds of certain equity offerings. The indenture governing the Senior Notes does not contain any maintenance financial covenants. The Senior Notes are carried at amortized cost, net of debt issuance costs of $7.7 million. The Senior Notes were initially recognized at fair value, net of transaction costs, and have subsequently been carried at amortized cost.
A company that is controlled by a Director of Bellatrix acquired, through a fund managed or advised by it, US$15 million in aggregate principal amount of the Senior Notes pursuant to the offering which was conducted on an arm's length basis.
NOTES TO THE CONDENSED CONSOLIDATED
FINANCIAL STATEMENTS(unaudited, expressed in Canadian dollars)
BELLATRIX EXPLORATION LTD.
45
2015 SECOND QUARTER REPORT
NOTES TO THE CONDENSED CONSOLIDATED
FINANCIAL STATEMENTS(unaudited, expressed in Canadian dollars)
BELLATRIX EXPLORATION LTD.
46
Bank DebtIn June 2015, the semi-annual review of the borrowing base under the Company's revolving credit facilities was approved at $600 million. As of June 30, 2015, the Company's credit facilities are available on an extendible revolving term basis and consist of a $75 million operating facility provided by a Canadian bank and a $525 million syndicated facility provided by nine financial institutions, subject to a borrowing base test.
Amounts borrowed under the credit facilities will bear interest at a floating rate based on the applicable Canadian prime rate, U.S. base rate, CDOR rate or LIBOR margin rate, plus between 0.8% to 4.75%, depending on the type of borrowing and the Company's senior debt to EBITDA ratio. A standby fee is charged of between 0.405% and 1.06875% on the undrawn portion of the credit facilities, depending on the Company's senior debt to EBITDA ratio. Bellatrix's credit facilities are secured against all of the assets of the Corporation by a $1 billion debenture containing a first ranking floating charge and security interest. The Corporation has provided a negative pledge and undertaking to provide fixed charges over major petroleum and natural gas reserves in certain circumstances.
The credit facilities currently mature on (and are fully revolving until) May 30, 2017. An extension request may be made each year, provided that the term after extension may not exceed 3 years. Should the facility not be extended, the outstanding balance is due upon maturity. The borrowing base will be subject to re-determination on or before May 31 and November 30 in each year prior to maturity, with the next semi-annual redetermination occurring on or before November 30, 2015. The borrowing base can also be re-determined if the lenders consider that a material adverse change has occurred which is reasonably attributable to a change in the Company's oil and gas properties.
Financial Covenants
The credit facilities are subject to a number of covenants, all of which were met as at June 30, 2015. Bellatrix calculates its financial covenants quarterly. The calculation for each financial covenant is based on specific definitions, are not in accordance with IFRS and cannot be readily replicated by referring to Bellatrix's condensed consolidated financial statements. Failing a financial covenant may result in cancellation of the credit facilities and/or all or any part of the outstanding loans with all accrued and unpaid interest to be immediately due and payable. As at June 30, 2015, the major financial covenants were:
Position at June 30, 2015 (1) (2)Total Debt must not exceed 4.75 times EBITDA for the last four fiscal quarters 3.55x
(3)Senior Debt must not exceed 4.75 times EBITDA for the last four fiscal quarters 2.09xEBITDA must not be less than 3.5 times interest expense for the last four fiscal quarters 7.50x(1) “Total Debt” is defined as the sum of the bank loan, the principal amount of long-term debt and certain other liabilities defined in the agreement governing the
credit facilities.
(2) “EBITDA” refers to earnings before interest, taxes, depreciation and amortization. EBITDA is calculated based on terms and definitions set out in the agreement governing the credit facilities which adjusts net income for financing costs, certain specific unrealized and non-cash transactions, and acquisition and disposition activity and is calculated based on a trailing twelve month basis.
(3) “Senior Debt” is defined as Total Debt, excluding any unsecured or subordinated debt.
Effective August 4, 2015, the Company's banking syndicate agreed to amend the agreement governing the credit facilities to remove the Total Debt to EBITDA and EBITDA to interest expense financial covenants. At the same time, Bellatrix and the banking syndicate agreed to modify the Senior Debt to EBITDA financial covenant so that it must not exceed 3.5 times for the fiscal quarters ending on or before March 31, 2017. Commencing with the second quarter of 2017, the maximum Senior Debt to EBITDA covenant will return to 3.0 times but including thereafter an expander of 0.5 times for the two quarters immediately following a material acquisition. As part of the agreement to remove these financial covenants, the Company agreed that any further issuances of subordinated indebtedness (but excluding refinancing of the existing Senior Notes) will require majority lender approval.
During June 2015, Bellatrix issued an additional $4.7 million in letters of credit relating to monthly transportation costs on the Canadian mainline gas transmission. Excluding $5.7 million of outstanding letters of credit that reduce the amount otherwise available to be drawn on the syndicated facility, as at June 30, 2015, approximately $212.9 million or 35% of unused and available bank credit under its credit facilities was available to fund Bellatrix's ongoing capital spending and operational requirements.
2015 SECOND QUARTER REPORT
NOTES TO THE CONDENSED CONSOLIDATED
FINANCIAL STATEMENTS(unaudited, expressed in Canadian dollars)
BELLATRIX EXPLORATION LTD.
47
6. SHAREHOLDER'S CAPITAL
Bellatrix is authorized to issue an unlimited number of common shares. All shares issued are fully paid and have no par value. The common shareholders are entitled to dividends declared by the Board of Directors; no dividends were declared by the Board of Directors during the six months ended June 30, 2015. June 30, 2015 June 30, 2014 Number Amount Number Amount ($000s) ($000s)Common shares, opening balance 191,950,576 $ 1,000,041 170,990,605 $ 824,065Issued for cash on equity issue - - 18,170,000 172,615Share issue costs on equity issue and shelf prospectus, net of tax effect of $1.9 million - - - (5,667) Cancellation of shares - - (137,486) -Shares issued for cash on exercise of options 13,334 45 2,068,622 4,062Contributed surplus transferred on exercised options - 14 - 1,047Balance, end of period 191,963,910 $ 1,000,100 191,091,741 $ 996,122
7. SHARE-BASED COMPENSATION PLANS
The following table provides a summary of the Company's share-based compensation plans for the three and six months ended June 30, 2015: Share Deferred Restricted Performance ($000s) Options Share Units Awards Awards TotalExpense for the three months ended
(1) June 30, 2015 $ 1,287 $ 868 $ 1,007 $ 153 $ 3,315Expense for the six months ended
(2) June 30, 2015 $ 2,346 $ 372 $ 854 $ 117 $ 3,689Liability balance, June 30, 2015 $ - $ 3,130 $ 848 $ 1,216 $ 5,194(1) The expense for share options is net of capitalization of $0.5 million. The expense for restricted awards is net of capitalization of $0.5 million. The recovery for
performance awards is net of capitalization of $0.1 million.
(2) The expense for share options is net of adjustments for forfeitures of $0.1 million, and capitalization of $1.0 million. The expense for restricted awards is net of adjustments for forfeitures of $0.1 million and capitalization of $0.4 million. The recovery for performance awards is net of capitalization of $0.1 million.
The following table provides a summary of the Company's share-based compensation plans for the three and six months ended June 30, 2014: Share Deferred Restricted Performance ($000s) Options Share Units Awards Awards TotalExpense (recovery) for the three months
(1) ended June 30, 2014 $ 828 $ 971 $ 272 $ 257 $ 2,328Expense (recovery) for the six months
(2) ended June 30, 2014 $ 1,641 $ 1,839 $ 854 $ 503 $ 4,837Liability balance, June 30, 2014 $ - $ 5,884 $ 1,191 $ 1,276 $ 8,351
(1) The expense for share options is net of adjustments for forfeitures of $0.2 million, and capitalization of $0.6 million. The expense for restricted awards is net of capitalization of $0.3 million. The expense for performance awards is net of capitalization of $0.2 million.
(2) The expense for share options is net of adjustments for forfeitures of $0.3 million, and capitalization of $1.1 million. The expense for restricted awards is net of adjustments for forfeitures of $0.1 million and capitalization of $0.6 million. The expense for performance awards is net of capitalization of $0.3 million.
2015 SECOND QUARTER REPORT

NOTES TO THE CONDENSED CONSOLIDATED
FINANCIAL STATEMENTS(unaudited, expressed in Canadian dollars)
BELLATRIX EXPLORATION LTD.
48
a. Share Option Plan
During the three and six months ended June 30, 2015, Bellatrix granted 4,295,500 (2014: 2,718,000) and 4,398,500 (2014: 2,946,000) share options, respectively. The fair values of all share options granted are estimated on the date of grant using the Black-Scholes option-pricing model. The weighted average fair market value of share options granted during the three months ended June 30, 2015 and 2014, and the weighted average assumptions used in their determination are as noted below: 2015 2014 Inputs: Share price $ 3.75 $ 9.26 Exercise price $ 3.75 $ 9.26 Risk free interest rate (%) 0.6 1.2 Option life (years) 2.8 2.8 Option volatility (%) 52 44 Results: Weighted average fair value of each share option granted $ 1.27 $ 2.79
Bellatrix calculates volatility based on historical share price. Bellatrix incorporates an estimated forfeiture rate between 3% and 10% (2014: 3% to 10%) for stock options that will not vest and adjusts for actual forfeitures as they occur. The weighted average trading price of the Company's common shares on the Toronto Stock Exchange (“TSX”) for the three and six months ended June 30, 2015 was $3.50 (2014: $9.92) and $3.33 (2014: $9.39), respectively.
The following tables summarize information regarding Bellatrix's Share Option Plan:
Share Options Continuity Weighted Average Exercise Price NumberBalance, December 31, 2014 $ 6.30 10,913,337Granted $ 3.74 4,398,500Exercised $ 3.39 (13,334)Forfeited $ 6.31 (312,667)Expired $ 3.89 (1,138,000) Balance, June 30, 2015 $ 5.69 13,847,836
As of June 30, 2015, a total of 19,196,391 common shares were reserved for issuance on exercise of share options, leaving an additional 5,348,555 available for future share option grants.
2015 SECOND QUARTER REPORT
NOTES TO THE CONDENSED CONSOLIDATED
FINANCIAL STATEMENTS(unaudited, expressed in Canadian dollars)
BELLATRIX EXPLORATION LTD.
49
Share Options Outstanding, June 30, 2015
Outstanding Exercisable Weighted Average Weighted Remaining At Average Contractual Life At Exercise Price June 30, 2015 Exercise Price (years) June 30, 2015 Exercise Price$ 3.07 - $ 3.74 1,574,668 $ 3.35 2.0 1,325,334 $ 3.38 $ 3.75 - $ 3.84 4,267,500 $ 3.75 4.9 - - $ 3.85 - $ 5.22 1,344,168 $ 4.19 3.4 416,665 $ 4.48 $ 5.23 - $ 7.24 1,788,500 $ 5.68 1.4 1,527,154 $ 5.47 $ 7.25 - $ 7.87 941,000 $ 7.59 3.5 273,299 $ 7.59 $ 7.88 - $ 9.16 1,537,500 $ 8.08 3.5 507,654 $ 8.07 $ 9.17 - $10.04 2,394,500 $ 9.25 4.0 752,452 $ 9.24 $ 3.07 - $10.04 13,847,836 $ 5.69 3.6 4,812,558 $ 5.80
b. Deferred Share Unit Plan
During the six months ended June 30, 2015, the Company granted 352,807 (2014: 113,610) Deferred Share Units (“DSUs”), and had 1,006,325 DSUs outstanding as at June 30, 2015 (2014: 646,516). A total of $3.1 million (December 31, 2014: $2.8 million) was included in accounts payable and accrued liabilities as at June 30, 2015 in relation to the DSUs.
c. Incentive Plan
On August 7, 2013, the Board of Directors of Bellatrix approved an Incentive Plan where the Company may grant Restricted Awards (“RAs”) and Performance Awards (“PAs”) to officers, employees, and other service providers. Unless approved by the TSX (or such other stock exchange on which the common shares may be listed) and the shareholders, the Incentive Plan does not provide for the issuance of common shares to holders of PAs or RAs, but rather RAs and PAs are settled in cash in lieu of such common shares.
During the six months ended June 30, 2015, the Company granted 1,377,350 (2014: 572,850) RAs, settled 295,192 (2014: 158,265) RAs, and had 1,831,209 RAs outstanding as at June 30, 2015 (2014: 899,085). A total of 14,000 RAs were forfeited during the six months ended June 30, 2015 (2014: 26,000). A total of $0.9 million (December 31, 2014: $0.6 million) was included in accounts payable and accrued liabilities as at June 30, 2015 in relation to the RAs.
During the six months ended June 30, 2015, the Company granted 530,650 (2014: 411,150) PAs, and had 1,282,100 PAs outstanding as at June 30, 2015 (2014: 863,850). A total of nil PAs were forfeited during the six months ended June 30, 2015 (2014: 18,000). A total of $1.2 million (December 31, 2014: $1.1 million) was included in accounts payable and accrued liabilities as at June 30, 2015 in relation to the PAs.
2015 SECOND QUARTER REPORT
NOTES TO THE CONDENSED CONSOLIDATED
FINANCIAL STATEMENTS(unaudited, expressed in Canadian dollars)
BELLATRIX EXPLORATION LTD.
50
8. SUPPLEMENTAL CASH FLOW INFORMATION
Change in Non-cash Working Capital Three months ended June 30, Six months ended June 30,($000s) 2015 2014 2015 2014Changes in non-cash working capital items: Restricted cash $ 4,395 $ (4,685) $ 7,992 $ 13,720 Accounts receivable 21,178 (31,273) 19,822 (54,649) Deposits and prepaid expenses (1,808) 4,688 (3,237) 190 Accounts payable and accrued liabilities (71,127) (52,877) (65,551) 2,335 Advances from joint venture partners 2,321 (14,096) (17,462) (32,438) $ (45,041) $ (98,243) $ (58,436) $ (70,842)Changes related to: Operating activities $ (11,636) $ (10,878) $ (13,238) $ (4,156) Financing activities 1,376 303 2,465 113 Investing activities (34,781) (87,668) (47,663) (66,799) $ (45,041) $ (98,243) $ (58,436) $ (70,842)
9. INCOME TAXES
Bellatrix is a corporation as defined under the Income Tax Act (Canada) and is subject to Canadian federal and provincial taxes. Bellatrix is subject to provincial taxes in Alberta, British Columbia, and Saskatchewan as the Company operates in those jurisdictions.
Deferred taxes reflect the tax effects of differences between the carrying amounts of assets and liabilities for financial reporting purposes and the amounts reported for tax purposes. The Alberta corporate tax rate increased from 10% to 12%, enacted in the second quarter of 2015 and was effective July 1, 2015. As at June 30, 2015, Bellatrix had approximately $1.71 billion in tax pools available for deduction against future income. Included in this tax basis are estimated non-capital loss carry forwards of approximately $162 million that expire in years through 2030.
10. FINANCE INCOME AND EXPENSES Three months ended June 30, Six months ended June 30,($000s) 2015 2014 2015 2014Interest on bank debt $ 6,110 $ 4,866 $ 12,335 $ 8,593
(1)Interest on Senior Notes 3,150 - 3,150 -Accretion on decommissioning liabilities (non-cash) 514 434 913 864Finance expense $ 9,774 $ 5,300 $ 16,398 $ 9,457
(1) Includes amortized costs related to the issuance of the Senior Notes.
2015 SECOND QUARTER REPORT
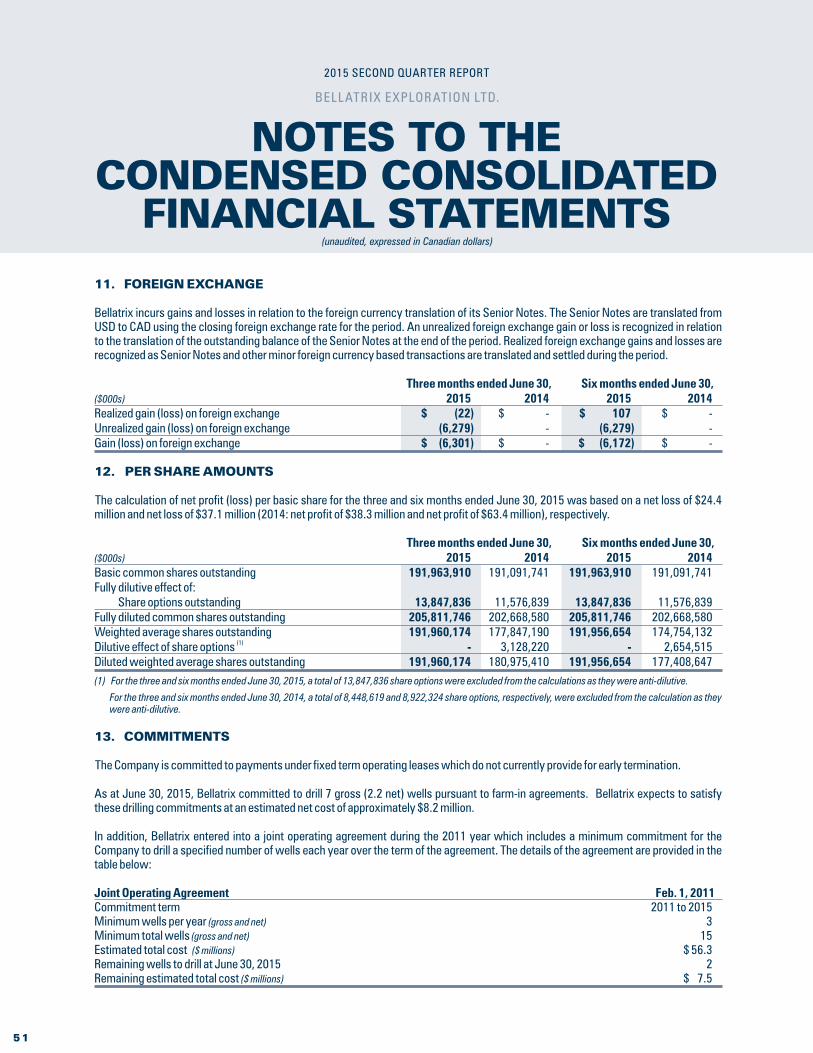
NOTES TO THE CONDENSED CONSOLIDATED
FINANCIAL STATEMENTS(unaudited, expressed in Canadian dollars)
BELLATRIX EXPLORATION LTD.
11. FOREIGN EXCHANGE
Bellatrix incurs gains and losses in relation to the foreign currency translation of its Senior Notes. The Senior Notes are translated from USD to CAD using the closing foreign exchange rate for the period. An unrealized foreign exchange gain or loss is recognized in relation to the translation of the outstanding balance of the Senior Notes at the end of the period. Realized foreign exchange gains and losses are recognized as Senior Notes and other minor foreign currency based transactions are translated and settled during the period. Three months ended June 30, Six months ended June 30,($000s) 2015 2014 2015 2014Realized gain (loss) on foreign exchange $ (22) $ - $ 107 $ -Unrealized gain (loss) on foreign exchange (6,279) - (6,279) -Gain (loss) on foreign exchange $ (6,301) $ - $ (6,172) $ -
12. PER SHARE AMOUNTS
The calculation of net profit (loss) per basic share for the three and six months ended June 30, 2015 was based on a net loss of $24.4 million and net loss of $37.1 million (2014: net profit of $38.3 million and net profit of $63.4 million), respectively.
Three months ended June 30, Six months ended June 30,($000s) 2015 2014 2015 2014Basic common shares outstanding 191,963,910 191,091,741 191,963,910 191,091,741Fully dilutive effect of: Share options outstanding 13,847,836 11,576,839 13,847,836 11,576,839Fully diluted common shares outstanding 205,811,746 202,668,580 205,811,746 202,668,580Weighted average shares outstanding 191,960,174 177,847,190 191,956,654 174,754,132
(1)Dilutive effect of share options - 3,128,220 - 2,654,515Diluted weighted average shares outstanding 191,960,174 180,975,410 191,956,654 177,408,647(1) For the three and six months ended June 30, 2015, a total of 13,847,836 share options were excluded from the calculations as they were anti-dilutive.
For the three and six months ended June 30, 2014, a total of 8,448,619 and 8,922,324 share options, respectively, were excluded from the calculation as they were anti-dilutive.
13. COMMITMENTS
The Company is committed to payments under fixed term operating leases which do not currently provide for early termination. As at June 30, 2015, Bellatrix committed to drill 7 gross (2.2 net) wells pursuant to farm-in agreements. Bellatrix expects to satisfy these drilling commitments at an estimated net cost of approximately $8.2 million.
In addition, Bellatrix entered into a joint operating agreement during the 2011 year which includes a minimum commitment for the Company to drill a specified number of wells each year over the term of the agreement. The details of the agreement are provided in the table below:
Joint Operating Agreement Feb. 1, 2011Commitment term 2011 to 2015Minimum wells per year (gross and net) 3Minimum total wells (gross and net) 15Estimated total cost ($ millions) $ 56.3Remaining wells to drill at June 30, 2015 2Remaining estimated total cost ($ millions) $ 7.5
2015 SECOND QUARTER REPORT
51
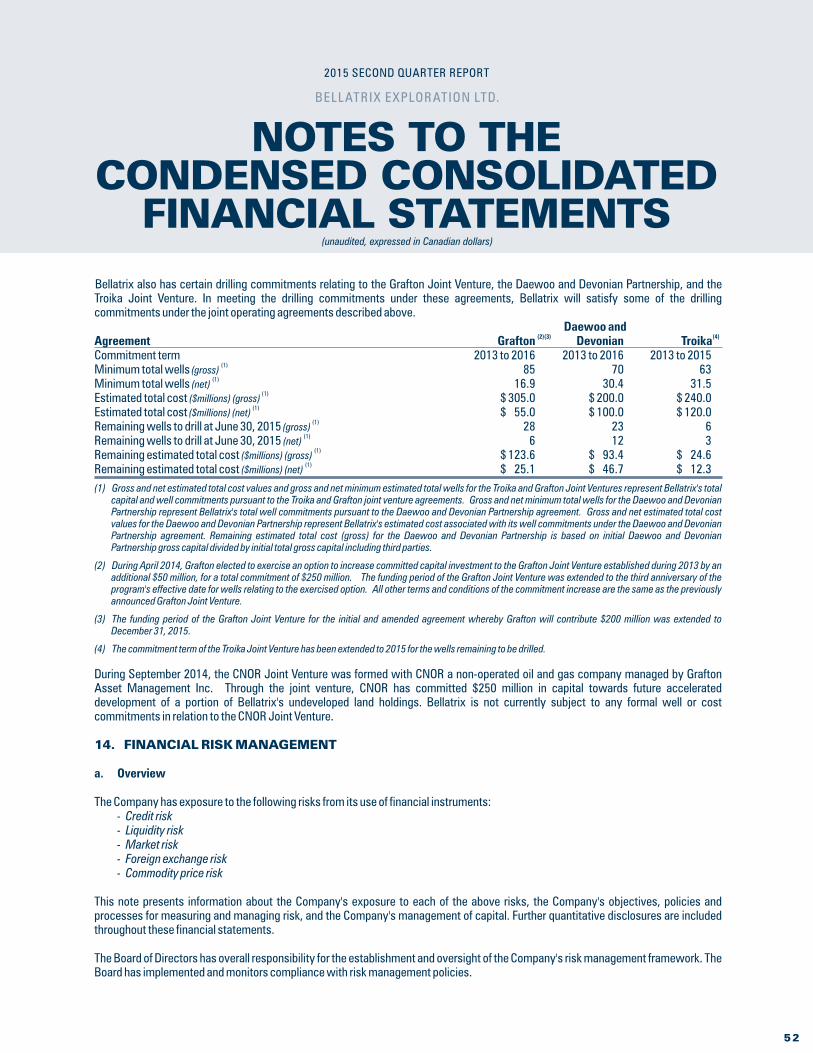
NOTES TO THE CONDENSED CONSOLIDATED
FINANCIAL STATEMENTS(unaudited, expressed in Canadian dollars)
BELLATRIX EXPLORATION LTD.
Bellatrix also has certain drilling commitments relating to the Grafton Joint Venture, the Daewoo and Devonian Partnership, and the Troika Joint Venture. In meeting the drilling commitments under these agreements, Bellatrix will satisfy some of the drilling commitments under the joint operating agreements described above. Daewoo and
(2)(3) (4)Agreement Grafton Devonian TroikaCommitment term 2013 to 2016 2013 to 2016 2013 to 2015
(1)Minimum total wells (gross) 85 70 63(1)Minimum total wells (net) 16.9 30.4 31.5
(1)Estimated total cost ($millions) (gross) $ 305.0 $ 200.0 $ 240.0(1)Estimated total cost ($millions) (net) $ 55.0 $ 100.0 $ 120.0
(1)Remaining wells to drill at June 30, 2015 (gross) 28 23 6(1)Remaining wells to drill at June 30, 2015 (net) 6 12 3
(1)Remaining estimated total cost ($millions) (gross) $ 123.6 $ 93.4 $ 24.6(1)Remaining estimated total cost ($millions) (net) $ 25.1 $ 46.7 $ 12.3
(1) Gross and net estimated total cost values and gross and net minimum estimated total wells for the Troika and Grafton Joint Ventures represent Bellatrix's total capital and well commitments pursuant to the Troika and Grafton joint venture agreements. Gross and net minimum total wells for the Daewoo and Devonian Partnership represent Bellatrix's total well commitments pursuant to the Daewoo and Devonian Partnership agreement. Gross and net estimated total cost values for the Daewoo and Devonian Partnership represent Bellatrix's estimated cost associated with its well commitments under the Daewoo and Devonian Partnership agreement. Remaining estimated total cost (gross) for the Daewoo and Devonian Partnership is based on initial Daewoo and Devonian Partnership gross capital divided by initial total gross capital including third parties.
(2) During April 2014, Grafton elected to exercise an option to increase committed capital investment to the Grafton Joint Venture established during 2013 by an additional $50 million, for a total commitment of $250 million. The funding period of the Grafton Joint Venture was extended to the third anniversary of the program's effective date for wells relating to the exercised option. All other terms and conditions of the commitment increase are the same as the previously announced Grafton Joint Venture.
(3) The funding period of the Grafton Joint Venture for the initial and amended agreement whereby Grafton will contribute $200 million was extended to December 31, 2015.
(4) The commitment term of the Troika Joint Venture has been extended to 2015 for the wells remaining to be drilled.
During September 2014, the CNOR Joint Venture was formed with CNOR a non-operated oil and gas company managed by Grafton Asset Management Inc. Through the joint venture, CNOR has committed $250 million in capital towards future accelerated development of a portion of Bellatrix's undeveloped land holdings. Bellatrix is not currently subject to any formal well or cost commitments in relation to the CNOR Joint Venture.
14. FINANCIAL RISK MANAGEMENT
a. Overview
The Company has exposure to the following risks from its use of financial instruments: - Credit risk - Liquidity risk - Market risk - Foreign exchange risk - Commodity price risk
This note presents information about the Company's exposure to each of the above risks, the Company's objectives, policies and processes for measuring and managing risk, and the Company's management of capital. Further quantitative disclosures are included throughout these financial statements.
The Board of Directors has overall responsibility for the establishment and oversight of the Company's risk management framework. The Board has implemented and monitors compliance with risk management policies.
2015 SECOND QUARTER REPORT
52
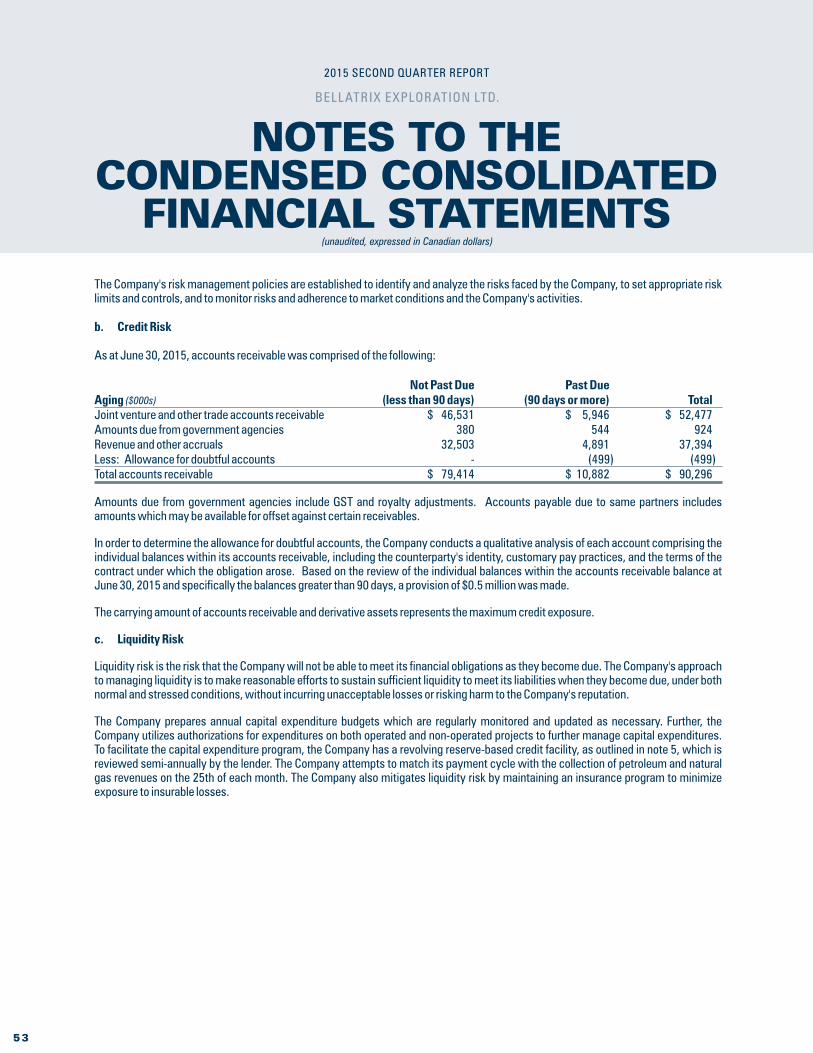
NOTES TO THE CONDENSED CONSOLIDATED
FINANCIAL STATEMENTS(unaudited, expressed in Canadian dollars)
BELLATRIX EXPLORATION LTD.
The Company's risk management policies are established to identify and analyze the risks faced by the Company, to set appropriate risk limits and controls, and to monitor risks and adherence to market conditions and the Company's activities.
b. Credit Risk
As at June 30, 2015, accounts receivable was comprised of the following:
Not Past Due Past Due Aging ($000s) (less than 90 days) (90 days or more) TotalJoint venture and other trade accounts receivable $ 46,531 $ 5,946 $ 52,477Amounts due from government agencies 380 544 924Revenue and other accruals 32,503 4,891 37,394Less: Allowance for doubtful accounts - (499) (499)Total accounts receivable $ 79,414 $ 10,882 $ 90,296
Amounts due from government agencies include GST and royalty adjustments. Accounts payable due to same partners includes amounts which may be available for offset against certain receivables.
In order to determine the allowance for doubtful accounts, the Company conducts a qualitative analysis of each account comprising the individual balances within its accounts receivable, including the counterparty's identity, customary pay practices, and the terms of the contract under which the obligation arose. Based on the review of the individual balances within the accounts receivable balance at June 30, 2015 and specifically the balances greater than 90 days, a provision of $0.5 million was made.
The carrying amount of accounts receivable and derivative assets represents the maximum credit exposure.
c. Liquidity Risk
Liquidity risk is the risk that the Company will not be able to meet its financial obligations as they become due. The Company's approach to managing liquidity is to make reasonable efforts to sustain sufficient liquidity to meet its liabilities when they become due, under both normal and stressed conditions, without incurring unacceptable losses or risking harm to the Company's reputation.
The Company prepares annual capital expenditure budgets which are regularly monitored and updated as necessary. Further, the Company utilizes authorizations for expenditures on both operated and non-operated projects to further manage capital expenditures. To facilitate the capital expenditure program, the Company has a revolving reserve-based credit facility, as outlined in note 5, which is reviewed semi-annually by the lender. The Company attempts to match its payment cycle with the collection of petroleum and natural gas revenues on the 25th of each month. The Company also mitigates liquidity risk by maintaining an insurance program to minimize exposure to insurable losses.
2015 SECOND QUARTER REPORT
53
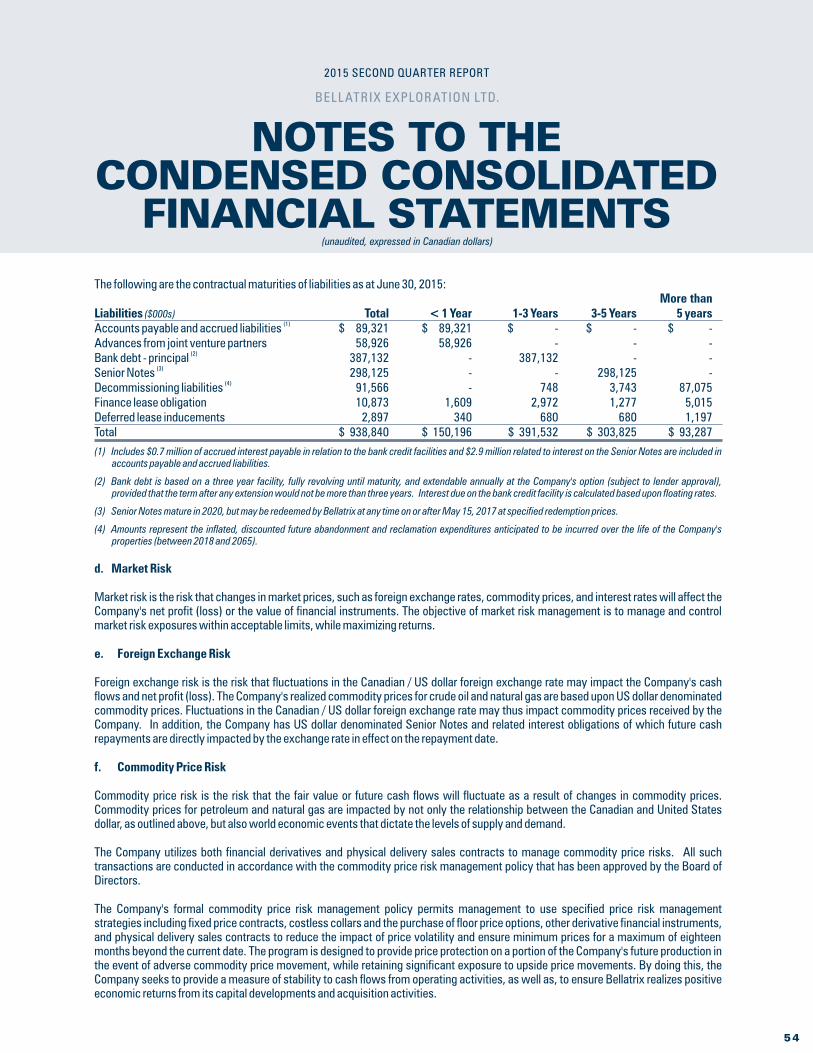
NOTES TO THE CONDENSED CONSOLIDATED
FINANCIAL STATEMENTS(unaudited, expressed in Canadian dollars)
BELLATRIX EXPLORATION LTD.
The following are the contractual maturities of liabilities as at June 30, 2015: More than Liabilities ($000s) Total < 1 Year 1-3 Years 3-5 Years 5 years
(1)Accounts payable and accrued liabilities $ 89,321 $ 89,321 $ - $ - $ -Advances from joint venture partners 58,926 58,926 - - -
(2)Bank debt - principal 387,132 - 387,132 - -(3)Senior Notes 298,125 - - 298,125 -
(4)Decommissioning liabilities 91,566 - 748 3,743 87,075Finance lease obligation 10,873 1,609 2,972 1,277 5,015Deferred lease inducements 2,897 340 680 680 1,197Total $ 938,840 $ 150,196 $ 391,532 $ 303,825 $ 93,287
(1) Includes $0.7 million of accrued interest payable in relation to the bank credit facilities and $2.9 million related to interest on the Senior Notes are included in accounts payable and accrued liabilities.
(2) Bank debt is based on a three year facility, fully revolving until maturity, and extendable annually at the Company's option (subject to lender approval), provided that the term after any extension would not be more than three years. Interest due on the bank credit facility is calculated based upon floating rates.
(3) Senior Notes mature in 2020, but may be redeemed by Bellatrix at any time on or after May 15, 2017 at specified redemption prices.
(4) Amounts represent the inflated, discounted future abandonment and reclamation expenditures anticipated to be incurred over the life of the Company's properties (between 2018 and 2065).
d. Market Risk
Market risk is the risk that changes in market prices, such as foreign exchange rates, commodity prices, and interest rates will affect the Company's net profit (loss) or the value of financial instruments. The objective of market risk management is to manage and control market risk exposures within acceptable limits, while maximizing returns.
e. Foreign Exchange Risk
Foreign exchange risk is the risk that fluctuations in the Canadian / US dollar foreign exchange rate may impact the Company's cash flows and net profit (loss). The Company's realized commodity prices for crude oil and natural gas are based upon US dollar denominated commodity prices. Fluctuations in the Canadian / US dollar foreign exchange rate may thus impact commodity prices received by the Company. In addition, the Company has US dollar denominated Senior Notes and related interest obligations of which future cash repayments are directly impacted by the exchange rate in effect on the repayment date.
f. Commodity Price Risk
Commodity price risk is the risk that the fair value or future cash flows will fluctuate as a result of changes in commodity prices. Commodity prices for petroleum and natural gas are impacted by not only the relationship between the Canadian and United States dollar, as outlined above, but also world economic events that dictate the levels of supply and demand.
The Company utilizes both financial derivatives and physical delivery sales contracts to manage commodity price risks. All such transactions are conducted in accordance with the commodity price risk management policy that has been approved by the Board of Directors.
The Company's formal commodity price risk management policy permits management to use specified price risk management strategies including fixed price contracts, costless collars and the purchase of floor price options, other derivative financial instruments, and physical delivery sales contracts to reduce the impact of price volatility and ensure minimum prices for a maximum of eighteen months beyond the current date. The program is designed to provide price protection on a portion of the Company's future production in the event of adverse commodity price movement, while retaining significant exposure to upside price movements. By doing this, the Company seeks to provide a measure of stability to cash flows from operating activities, as well as, to ensure Bellatrix realizes positive economic returns from its capital developments and acquisition activities.
2015 SECOND QUARTER REPORT
54

NOTES TO THE CONDENSED CONSOLIDATED
FINANCIAL STATEMENTS(unaudited, expressed in Canadian dollars)
BELLATRIX EXPLORATION LTD.
As at June 30, 2015, the Company has entered into commodity price risk management arrangements as follows:
Type Period Volume Price Floor Price Ceiling IndexOil fixed February 1, 2015 to Dec. 31, 2015 2,000 bbl/d $ 70.27 CDN $ 70.27 CDN WTIOil fixed February 1, 2015 to Dec. 31, 2015 1,000 bbl/d $ 70.48 CDN $ 70.48 CDN WTINatural gas fixed April 1, 2015 to October 31, 2015 20,000 GJ/d $ 2.50 CDN $ 2.50 CDN AECONatural gas fixed April 1, 2015 to October 31, 2015 20,000 GJ/d $ 2.50 CDN $ 2.50 CDN AECONatural gas fixed April 1, 2015 to October 31, 2015 2,500 GJ/d $ 2.53 CDN $ 2.53 CDN AECONatural gas fixed April 1, 2015 to October 31, 2015 15,000 GJ/d $ 2.50 CDN $ 2.50 CDN AECONatural gas fixed April 1, 2015 to October 31, 2015 5,000 GJ/d $ 2.80 CDN $ 2.80 CDN AECONatural gas fixed April 1, 2015 to October 31, 2015 20,000 GJ/d $ 2.53 CDN $ 2.53 CDN AECONatural gas fixed April 1, 2015 to October 31, 2015 10,000 GJ/d $ 2.54 CDN $ 2.54 CDN AECONatural gas fixed April 1, 2015 to October 31, 2015 10,000 GJ/d $ 2.59 CDN $ 2.59 CDN AECONatural gas fixed April 1, 2015 to October 31, 2015 10,000 GJ/d $ 2.59 CDN $ 2.59 CDN AECONatural gas fixed April 1, 2015 to October 31, 2015 10,000 GJ/d $ 2.58 CDN $ 2.58 CDN AECONatural gas fixed March 1, 2015 to December 31, 2015 20,000 GJ/d $ 2.56 CDN $ 2.56 CDN AECONatural gas fixed March 1, 2015 to December 31, 2015 20,000 GJ/d $ 2.58 CDN $ 2.58 CDN AECONatural gas fixed March 1, 2015 to December 31, 2015 17,500 GJ/d $ 2.56 CDN $ 2.56 CDN AECONatural gas fixed January 1, 2016 to Dec. 31, 2017 50,000 GJ/d $ 3.00 CDN $ 3.00 CDN AECO
Natural Gas Swap Arrangements
Average Volumes (GJ/d) / Average Price ($/GJ)
Product Financial Contract Period Volume Average PriceNatural gas AECO basis swap January 1, 2016 to December 31, 2016 39,565 US$0.67Natural gas AECO basis swap January 1, 2017 to December 31, 2017 18,463 US$0.67
g. Capital Management
The Company's policy is to maintain a strong capital base so as to maintain investor, creditor and market confidence and to sustain the future development of the business. The Company manages its capital structure and makes adjustments to it in the light of changes in economic conditions and the risk characteristics of the underlying petroleum and natural gas assets. The Company considers its capital structure to include shareholders' equity, Senior Notes, bank debt, and working capital. In order to maintain or adjust the capital structure, the Company may from time to time issue common shares, issue high-yield or other debt instruments, adjust its capital spending, and/or dispose of certain assets to manage current and projected debt levels.
The Company monitors capital based on the ratio of total net debt to annualized funds flow from operations (the "ratio"). This ratio is calculated as total net debt, defined as outstanding bank debt and Senior Notes, plus or minus working capital (excluding commodity contract assets and liabilities, the current portion of finance lease obligations and deferred lease inducements, and deferred tax assets or liabilities), divided by funds flow from operations (cash flow from operating activities before changes in non-cash working capital and deductions for decommissioning costs) for the most recent calendar quarter, annualized (multiplied by four). The total net debt to annualized funds flow from operations ratio may increase at certain times as a result of acquisitions, fluctuations in commodity prices, timing of capital expenditures and other factors. In order to facilitate the management of this ratio, the Company prepares annual capital expenditure budgets which are reviewed and updated as necessary depending on varying factors including current and forecast prices, successful capital deployment and general industry conditions. The annual and updated budgets are approved by the Board of Directors. Bellatrix does not pay dividends.
2015 SECOND QUARTER REPORT
55
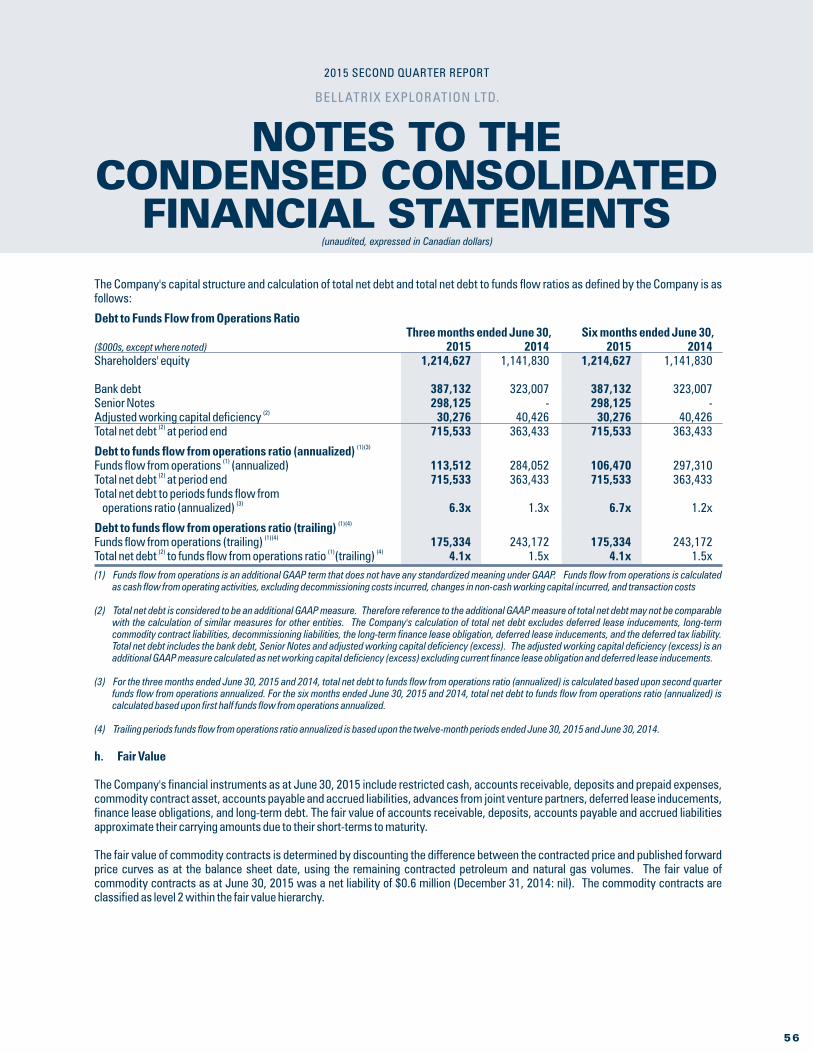
NOTES TO THE CONDENSED CONSOLIDATED
FINANCIAL STATEMENTS(unaudited, expressed in Canadian dollars)
BELLATRIX EXPLORATION LTD.
The Company's capital structure and calculation of total net debt and total net debt to funds flow ratios as defined by the Company is as follows:
Debt to Funds Flow from Operations Ratio Three months ended June 30, Six months ended June 30,($000s, except where noted) 2015 2014 2015 2014Shareholders' equity 1,214,627 1,141,830 1,214,627 1,141,830 Bank debt 387,132 323,007 387,132 323,007Senior Notes 298,125 - 298,125 -
(2)Adjusted working capital deficiency 30,276 40,426 30,276 40,426(2)Total net debt at period end 715,533 363,433 715,533 363,433
(1) (3) Debt to funds flow from operations ratio (annualized)
(1)Funds flow from operations (annualized) 113,512 284,052 106,470 297,310(2)Total net debt at period end 715,533 363,433 715,533 363,433
Total net debt to periods funds flow from (3) operations ratio (annualized) 6.3x 1.3x 6.7x 1.2x
(1) (4)Debt to funds flow from operations ratio (trailing) (1) (4) Funds flow from operations (trailing) 175,334 243,172 175,334 243,172
(2) (1) (4)Total net debt to funds flow from operations ratio (trailing) 4.1x 1.5x 4.1x 1.5x(1) Funds flow from operations is an additional GAAP term that does not have any standardized meaning under GAAP. Funds flow from operations is calculated
as cash flow from operating activities, excluding decommissioning costs incurred, changes in non-cash working capital incurred, and transaction costs
(2) Total net debt is considered to be an additional GAAP measure. Therefore reference to the additional GAAP measure of total net debt may not be comparable with the calculation of similar measures for other entities. The Company's calculation of total net debt excludes deferred lease inducements, long-term commodity contract liabilities, decommissioning liabilities, the long-term finance lease obligation, deferred lease inducements, and the deferred tax liability. Total net debt includes the bank debt, Senior Notes and adjusted working capital deficiency (excess). The adjusted working capital deficiency (excess) is an additional GAAP measure calculated as net working capital deficiency (excess) excluding current finance lease obligation and deferred lease inducements.
(3) For the three months ended June 30, 2015 and 2014, total net debt to funds flow from operations ratio (annualized) is calculated based upon second quarter funds flow from operations annualized. For the six months ended June 30, 2015 and 2014, total net debt to funds flow from operations ratio (annualized) is calculated based upon first half funds flow from operations annualized.
(4) Trailing periods funds flow from operations ratio annualized is based upon the twelve-month periods ended June 30, 2015 and June 30, 2014.
h. Fair Value
The Company's financial instruments as at June 30, 2015 include restricted cash, accounts receivable, deposits and prepaid expenses, commodity contract asset, accounts payable and accrued liabilities, advances from joint venture partners, deferred lease inducements, finance lease obligations, and long-term debt. The fair value of accounts receivable, deposits, accounts payable and accrued liabilities approximate their carrying amounts due to their short-terms to maturity.
The fair value of commodity contracts is determined by discounting the difference between the contracted price and published forward price curves as at the balance sheet date, using the remaining contracted petroleum and natural gas volumes. The fair value of commodity contracts as at June 30, 2015 was a net liability of $0.6 million (December 31, 2014: nil). The commodity contracts are classified as level 2 within the fair value hierarchy.
2015 SECOND QUARTER REPORT
56
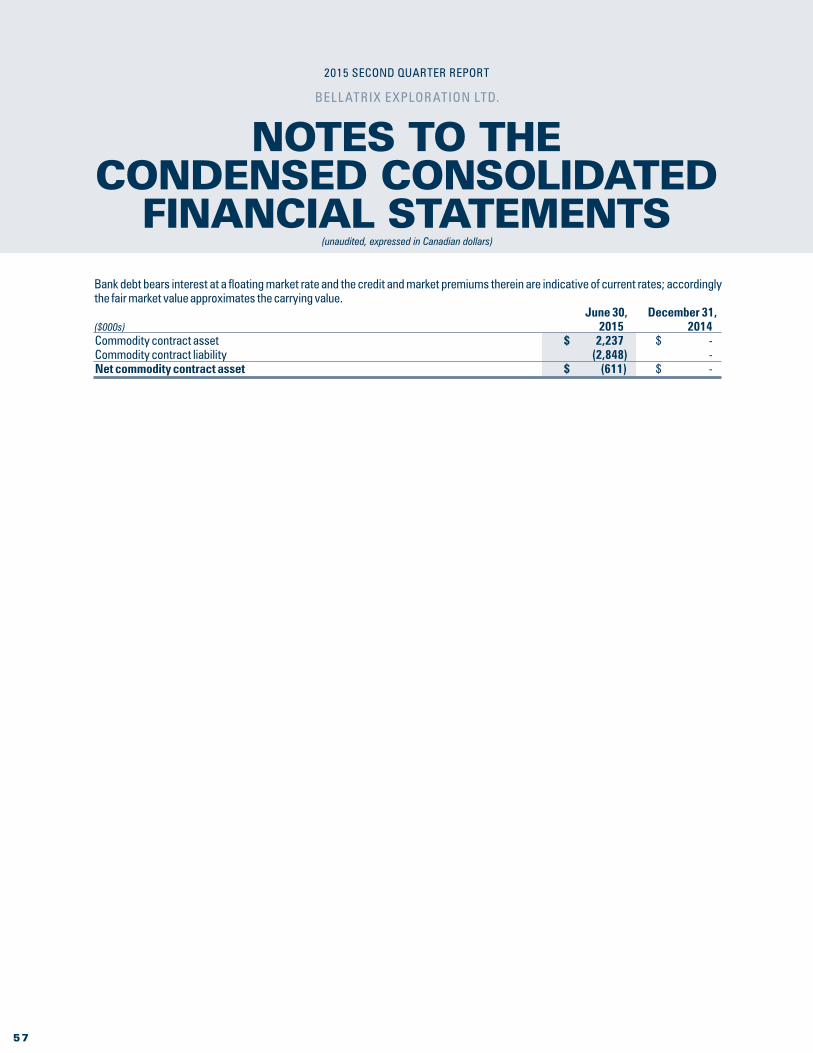
57
NOTES TO THE CONDENSED CONSOLIDATED
FINANCIAL STATEMENTS(unaudited, expressed in Canadian dollars)
BELLATRIX EXPLORATION LTD.
Bank debt bears interest at a floating market rate and the credit and market premiums therein are indicative of current rates; accordingly the fair market value approximates the carrying value. June 30, December 31,($000s) 2015 2014 Commodity contract asset $ 2,237 $ - Commodity contract liability (2,848) - Net commodity contract asset $ (611) $ -
2015 SECOND QUARTER REPORT

BELLATRIX EXPLORATION LTD.
2015 SECOND QUARTER REPORT
CORPORATE INFORMATIONBOARD OF DIRECTORS
W.C. (Mickey) Dunn, Chairman Independent Businessman Edmonton, Alberta
John H. Cuthbertson, Q.C. Partner, Burnet, Duckworth & Palmer LLP Calgary, Alberta
Murray B. Todd, B. Sc., P. Eng.President, Canada Hibernia Holding CorporationCalgary, Alberta
Raymond G. Smith, P. Eng.President and CEO, Bellatrix Exploration Ltd. Calgary, Alberta
Murray L. CobbeChairman, Trican Well Service Ltd.Calgary, Alberta
Doug N. Baker, FCAIndependent BusinessmanCalgary, Alberta
Daniel S. Lewis, B.Sc. Managing Partner, Orange Capital LLCNew York City, New York Keith E. Macdonald, CAIndependent BusinessmanCalgary, Alberta
Steven J. Pully, Esq., CPA, CFA Independent BusinessmanDallas, Texas
Melvin M. Hawkrigg, BA, FCA, LL.D (Hon.)Chairman, Orlick Industries LimitedWaterdown, Ontario
Robert A. Johnson, P. Geol.Independent BusinessmanCalgary, Alberta
Keith S. Turnbull, B.Sc., CAIndependent BusinessmanCalgary, Alberta
OFFICERS
Raymond G. Smith, P. Eng.President and CEO
Edward J. Brown, CA Executive Vice President, Finance and CFO
Brent A. Eshleman, P. Eng.Executive Vice President and COO
Timothy A. BlairVice President, Land
Chris D. Curry, CAVice President and Controller
Leanne K. Gress-Blue, CAVice President, Finance
Charles R. Kraus, Esq.Vice President, General Counsel and Corporate Secretary
David R. LaingVice President, Production
Kelly M. NicholVice President,Business Development
Russell G. Oicle, P. Geol.Vice President, Exploration
Mark L. Stephen, P. Eng.Vice President, Operations
Steve G. Toth, CFAVice President, Investor Relations
Garrett K. Ulmer, P. Eng.Vice President, Engineering
STOCK EXCHANGE LISTING
The Toronto Stock ExchangeTrading symbol: BXE
The New York Stock ExchangeTrading symbol: BXE
LEGAL COUNSEL
Burnet, Duckworth & Palmer LLP
AUDITORS
KPMG LLP
BANKERS
National Bank of CanadaAlberta Treasury BranchesHSBC Bank CanadaCanadian Imperial Bank of CommerceThe Bank of Nova ScotiaBank of MontrealThe Toronto-Dominion BankUnion Bank, Canada BranchWells Fargo Bank, N.A., Canadian Branch
EVALUATION ENGINEERS
Sproule Associates Limited
REGISTRAR AND TRANSFER AGENT
Computershare Trust Company of Canada
HEAD OFFICE
1920, 800 - 5th Avenue S.W. Calgary, Alberta, Canada T2P 3T6 Phone: (403) 266-8670 Fax: (403) 264-8163 Email: [email protected]: www.bellatrixexploration.com
58
1920, 800 - 5th Avenue S.W.
Calgary, Alberta, Canada T2P 3T6
Phone: (403) 266-8670
Fax: (403) 264-8163
www.bellatrixexploration.com