Embed Size (px)
Citation preview
c' ; f
N A S A C O N T R A C T 0
R E P O R T
N rn N c I
e u
FORCE-PENETRATION CHARACTERISTICS OF A SAND HORIZONTALLY PENETRATED BY PLATES, CONES, AND SPHERICAL SEGMENTS
by Paul A. Hustdd and WiZZidm R. Cox
Prepared by THE UNIVERSITY OF TEXAS AT AUSTIN Austin, Texas
for
NATIONAL AERONAUTICS AND SPACE ADMINISTRATION 0 WASHINGTON, D. C. JANUARY 1 9 6 9

NASA CR-1252
FORCE-PENETRATION CHARACTERISTICS OF A SAND HORIZONTALLY
PENETRATED BY PLATES, CONES, AND SPHERICAL SEGMENTS
By Paul A. Hustad and William R. Cox
Distribution of this report is provided in the interest of information exchange. Responsibility for the contents resides in the author or organization that prepared it.
Prepared under Grant No. NsG-604 by THE UNIVERSITY OF TEXAS AT AUSTIN
Austin, Texas
for Langley Research Center
NATIONAL AERONAUTICS AND SPACE ADMINISTRATION
For sa le by the Clearinghouse for Federal Scientific and Technical Information Springfield, Virginia 22151 - CFSTl price $3.00


ABSTRACT
D u r i n g t h i s i n v e s t i g a t i o n , t h e f o r c e - p e n e t r a t i o n c h a r a c t e r i s t i c s o f
a cohes ion le s s s and were s t u d i e d u s i n g s e v e r a l d i f f e r e n t g e o m e t r i c a l l y s h a p e d
mode l s t ha t were p e n e t r a t e d i n t o t h e s a n d i n a h o r i z o n t a l d i r e c t i o n . A n a t -
tempt was made t o d e t e r m i n e t h e i n f l u e n c e o f time upon t h e f o r c e - p e n e t r a t i o n
c h a r a c t e r i s t i c s o f t h e s a n d b y v a r y i n g t h e v e l o c i t y a t w h i c h t h e m o d e l s p e n e -
t r a t e d i n t o t h e b a c k f i l l s .
The i n v e s t i g a t i o n was compr ised of th ree separa te phases o f l abora-
t o r y t e s t i n g . The f i r s t p h a s e c o n s i s t e d o f d e s i g n i n g a t e s t s e t u p and perform-
i n g p j l o t t e s t s t h a t s i m u l a t e d t h e c l a s s i c a l p l a n e - s t r a i n e a r t h - p r e s s u r e p r o -
blem. The t e s t s e t u p c o n s i s t e d o f a box i n which a movable wall 1 f t h i g h
and 3 f t long was p l aced . The w a l l was p e n e t r a t e d i n t o t h e s a n d b a c k f i l l i n
a h o r i z o n t a l d i r e c t i o n a n d t h e h o r i z o n t a l a n d v e r t i c a l s o i l r e a c t i o n s d e v e l o p -
ed on t h e c e n t e r 1 f t s e c t i o n o f t h e w a l l w e r e m e a s u r e d . C o u l o m b ' s p a s s i v e
e a r t h - p r e s s u r e t h e o r y was used a s a b a s i s f o r e v a l u a t i n g t h e p e r f o r m a n c e o f
t h e s e t u p .
The s e c o n d p h a s e u t i l i z e d much t h e same t y p e o f l o a d i n g a p p a r a t u s a s
t h a t u s e d i n P h a s e I. Two h e i g h t s o f w a l l s , 1 f t and 1 .5 f t , were pene t ra ted
a t v a r i o u s c o n s t a n t v e l o c i t i e s i n t o l o o s e a n d d e n s e b a c k f i l l s . F o r t h e r a n g e
o f v e l o c i t i e s t h a t were u t i l i z e d , t h e o b s e r v a t i o n s showed t h a t t h e time e f f e c t s
were n e g l i g i b l e . The r e s u l t s d i d show t h a t C o u l o m b ' s p a s s i v e e a r t h - p r e s s u r e
theo ry may b e u s e d t o c a l c u l a t e t h e maximum d e v e l o p e d e a r t h p r e s s u r e w i t h a
r easonab le deg ree o f accu racy . The p e n e t r a t i o n n e c e s s a r y t o d e v e l o p t h e maxi-
mum e a r t h p r e s s u r e was found no t t o be a l i n e a r f u n c t i o n of t h e w a l l h e i g h t ,
a s i s normally assumed i n p r a c t i c e .
The t h i r d a n d f i n a l p h a s e u t i l i z e d two s izes o f r i g h t - c i r c u l a r c o n e s
and spherical segments. These models were p e n e t r a t e d i n t o b a c k f i l l s w h i c h
iii

were h o r i z o n t a l l y s u p p o r t e d by p o l y e t h y l e n e membranes. The cones had apex
a n g l e s o f 60 degrees and base d iameters o f 3 . 5 4 and 7.08 i n c h e s . The s p h e r i -
ca l s egmen t s had base d i ame te r s o f 4 . 3 3 and 8.66 i n . a n d s p h e r i c a l d i a m e t e r s
o f 5 .0 and 10.0 i n . r e s p e c t i v e l y . T h e r a t e a n d v e r t i c a l d e p t h b e l o w t h e s o i l
s u r f a c e a t w h i c h t h e m o d e l s p e n e t r a t e d t h e l o o s e a n d d e n s e b a c k f i l l s w e r e
v a r i e d d u r i n g t h i s s e r i e s o f tests. The same g e n e r a l r a n g e o f v e l o c i t i e s a s
were used in Phase I1 w e r e u t i l i z e d i n t h i s p h a s e and i t was f o u n d t h a t t h e
t i m e e f f e c t s w e r e n e g l i g i b l e . E q u a t i o n s a r e p r e s e n t e d t h a t p r o v i d e a means
o f p r e d i c t i n g t h e maximum h o r i z o n t a l and v e r t i c a l s o i l r e a c t i o n s o n t h e m o d e l s
t h a t were u t i l i z e d i n t h i s i n v e s t i g a t i o n .
iv

I" -
PREFACE
T h i s s t u d y was sponsored under Grant NsG-604, An I n v e s t i g a t i o n o f
So i l Mode l ing P rob lems Re la t ed t o Impac t S tud ie s , f rom the Na t iona l Aero-
naut ics and Space Adminis t ra t ion , Langley Research Center , Hampton, V i r g i n i a .
Mr. M. E. Hathaway of Langley Research Center was t echn ica l mon i to r o f t he
Grant .
The s t u d y b e g a n i n J u n e , 1 9 6 5 u n d e r t h e s u p e r v i s i o n o f D r . Will iam R.
Cox. C. V . G i r i j a v a l l a b h a n was r e s p o n s i b l e f o r d e s i g n o f t h e t e s t i n g a p p a r -
a t u s and the conduc t ing o f tests dur ing the per iod f rom June to September , 1965.
D u r i n g t h i s time h e was a s s i s t e d by t h e a u t h o r . From September, 1965 to Febru-
a r y , 1 9 6 6 I s s a Oweis was a s s i g n e d t h e p r i m e r e s p o n s i b i l i t y o f c o n d u c t i n g t h e
l a b o r a t o r y t e s t i n g . D u r i n g t h i s time h e was a s s i s t ed by J ames F. Horadam.
From February to September, 1966 James F. Horadam was r e s p o n s i b l e f o r t h e
l a b o r a t o r y i n v e s t i g a t i o n .
Mr. Harold H . Dalrymple, Research Engineer Associate, and M r . Olen
L . Hudson, T e c h n i c a l S t a f f A s s i s t a n t , p r o v i d e d much o f t h e t e c h n i c a l know-
l e d g e t h a t was n e c e s s a r y f o r t h e d e s i g n o f t h e t e s t s e t u p s . D r . Clyde E .
Lee of The Universi ty of Texas designed the load c e l l s u s e d i n t h i s i n v e s t i -
ga t ion .
V


TABLE O F CONTENTS
P a g e
ABSTRACT. . . . . . . . . . . . . . . . . . . . . . . . . . . . . . . . iii
PREFACE . . . . . . . . . . . . . . . . . . . . . . . . . . . . . . . . V
LIST OF FIGURES . . . . . . . . . . . . . . . . . . . . . . . . . . . . xi
LIST OF TABLES . . . . . . . . . . . . . . . . . . . . . . . . . . . . . xvii
NOTATION . . . . . . . . . . . . . . . . . . . . . . . . . . . . . . . . xix
CHAPTER I. INTRODUCTION . . . . . . . . . . . . . . . . . . . . . . . . 1
OBJECTIVE . . . . . . . . . . . . . . . . . . . . . . . . . . . . . 1
SCOPE OF INVESTIGATION . . . . . . . . . . . . . . . . . . . . . . 2
CHAPTER 11. PASSIVE EARTH-PRESSURE THEORY . . . . . . . . . . . . . . . 4
PLASTIC EQUILIBRIUM . . . . . . . . . . . . . . . . . . . . . . . . 4
R a n k i n e ' s T h e o r y of P a s s i v e E a r t h P r e s s u r e . . . . . . . . . . . . 9
C o u l o m b ' s T h e o r y of P a s s i v e E a r t h P r e s s u r e . . . . . . . . . . . . 9
W a l l F r i c t i o n . . . . . . . . . . . . . . . . . . . . . . . . 1 2
D e f o r m a t i o n R e q u i r e m e n t s . . . . . . . . . . . . . . . . . . . 14
ERRORS INVOLVED WITH APPLICATION OF PASSIVE EARTH-PRESSURE THEORY . 1 6
C o u l o m b ' s T h e o r y . . . . . . . . . . . . . . . . . . . . . . . 1 6
L o g a r i t h m i c S p i r a l M e t h o d of C a l c u l a t i n g P a s s i v e E a r t h P r e s s u r e . . . . . . . . . . . . . . . . . . . . . . . . . . . 18
CHAPTER 111. TESTING APPARATUS . . . . . . . . . . . . . . . . . . . . . 2 1
PHASE I APPARATUS . . . . . . . . . . . . . . . . . . . . . . . . . 22
P l a t e D e s i g n . . . . . . . . . . . . . . . . . . . . . . . . . . . 22
Load Cell S u p p o r t s a n d L o c a t i o n s . . . . . . . . . . . . . . . . . 2 4
L o a d i n g s y s t e m . . . . . . . . . . . . . . . . . . . . . . . . . . 28
I n s t r u m e n t a t i o n . . . . . . . . . . . . . . . . . . . . . . . . . . 28
Force Measurement . . . . . . . . . . . . . . . . . . . . . . 30
P e n e t r a t i o n M e a s u r e m e n t . . . . . . . . . . . . . . . . . . . 30
vii
P a g e
PHASE IT. APPARATUS . . . . . . . . . . . . . . . . . . . . . . . . 32
P l a t e D e s i g n . . . . . . . . . . . . . . . . . . . . . . . . . . . 32
Load Cell S u p p o r t s a n d L o c a t i o n s . . . . . . . . . . . . . . . . . 38
L o a d i n g s y s t e m . . . . . . . . . . . . . . . . . . . . . . . . . . 39
I n s t r u m e n t a t i o n . . . . . . . . . . . . . . . . . . . . . . . . . . 4 1
F o r c e M e a s u r e m e n t . . . . . . . . . . . . . . . . . . . . . . 4 1
P e n e t r a t i o n M e a s u r e m e n t . . . . . . . . . . . . . . . . . . . 4 1
B a l a n c i n g a n d C a l i b r a t i o n U n i t . . . . . . . . . . . . . . . . 4 3
A m p l i f i e r s . . . . . . . . . . . . . . . . . . . . . . . . . . 44
R e c o r d i n g O s c i l l o g r a p h . . . . . . . . . . . . . . . . . . . . 4 4
PHASE I11 APPARATUS . . . . . . . . . . . . . . . . . . . . . . . . 44
Model Des ign . . . . . . . . . . . . . . . . . . . . . . . . . . . 44
L a t e r a l s o i l S u p p o r t . . . . . . . . . . . . . . . . . . . . . . . 45
L o a d i n g s y s t e m . . . . . . . . . . . . . . . . . . . . . . . . . . 45
I n s t r u m e n t a t i o n . . . . . . . . . . . . . . . . . . . . . . . . . . 48
F o r c e M e a s u r e m e n t s . . . . . . . . . . . . . . . . . . . . . . 48
P e n e t r a t i o n M e a s u r e m e n t s . . . . . . . . . . . . . . . . . . . 50
CHAPTER I V . TEST PROCEDURES AND DATA REDUCTION . . . . . . . . . . . . . 51
PHASE I PROCEDURE . . . . . . . . . . . . . . . . . . . . . . . . . 5 1
PHASE I DATA REDUCTION . . . . . . . . . . . . . . . . . . . . . . 53
PHASE I1 PROCEDURE . . . . . . . . . . . . . . . . . . . . . . . . 53
PHASE I1 DATA REDUCTION . . . . . . . . . . . . . . . . . . . . . . 57
PHASE I11 PROCEDURE . . . . . . . . . . . . . . . . . . . . . . . . 57
PHASE I11 DATA REDUCTION . . . . . . . . . . . . . . . . . . . . . 58
CHAPTER V. SOIL PROPERTIES . . . . . . . . . . . . . . . . . . . . . . . 6 2
Angle o f I n t e r n a l F r i c t i o n Measurement . . . . . . . . . . . . . . 62
viii

Page
A n g l e o f Wall F r i c t i o n . . . . . . . . . . . . . . . . . . . . . . . 65
D e n s i t y D e t e r m i n a t i o n . . . . . . . . . . . . . . . . . . . . . . . 66
P h a s e I D e n s i t y . . . . . . . . . . . . . . . . . . . . . . . . 66
P h a s e I I D e n s i t y . . . . . . . . . . . . . . . . . . . . . . . 68
P h a s e I11 D e n s i t y . . . . . . . . . . . . . . . . . . . . . . . 70
CHAPTER V I , PHASE I TEST RESULTS AND DISCUSSION . . . . . . . . . . . . . 7 1
EARTH PRESSURE DEVELOPMENT . . . . . . . . . . . . . . . . . . . . . 71
WALL FRICTION ANALYSIS . . . . . . . . . . . . . . . . . . . . . . . 73
COMPARISON BETWEEN MEASURED AND CALCULATED EARTH-PRESSURE FACTORS . 79
DEVELOPED ANGLE OF INTERNAL FRICTION . . . . . . . . . . . . . . . . 82
CENTER OF PRESSURE LOCATIONS . . . . . . . . . . . . . . . . . . . . 82
FAILURE SURFACE ORIENTATION . . . . . . . . . . . . . . . . . . . . 95
CHAPTER V I I , PHASE I1 TEST RESULTS AND DISCUSSION . . . . . . . . . . . . 97
EFFECT OF WALL PENETRATION VELOCITY O N EARTH PRESSURE . . . . . . . 99
COMPARISON BETWEEN MEASURED A N D CALCULATED EARTH-PRESSURE FACTORS . 99
T w e l v e I n c h Wall ( L o o s e T e s t s ) . . . . . . . . . . . . . . . . 104
T w e l v e I n c h Wall ( D e n s e T e s t s ) . . . . . . . . . . . . . . . . 104
E i g h t e e n I n c h Wall ( L o o s e T e s t s ) . . . . . . . . . . . . . . . 107
E i g h t e e n I n c h Wall ( D e n s e T e s t s ) . . . . . . . . . . . . . . . 108 COMPARISON BETWEEN MEASURED AND CALCULATED ORIENTATIONS OF THE FAILURE SURFACE . . . . . . . . . . . . . . . . . . . . . . . . . . 108
CENTER OF PRESSURE LOCATIONS . . . . . . . . . . . . . . . . . . . . 116
AVERAGE EARTH PRESSURE DATA . . . . . . . . . . . . . . . . . . . . 116
CHAPTER VIII. PHASE I11 TEST RESULTS AND DISCUSSION . . . . . . . . . . . 123 EFFECT OF MODEL PENETRATION VELOCITY ON EARTH PRESSURE . . . . . . . 123 HORIZONTAL FORCE-PENETRATION CURVES . . . . . . . . . . . . . . . . 123
C o n e T e s t s . . . . . . . . . . . . . . . . . . . . . . . . . . 124 S p h e r e T e s t s . . . . . . . . . . . . . . . . . . . . . . . . . 129
MAXIMUM HORIZONTAL FORCE ANALYSIS . . . . . . . . . . . . . . . . . . . . 134
ix
Maximum F o r c e P r e d i c t i o n . . . . . . . . . . . . . . . . . . . RESULTANT VERTICAL FORCE- PENETRATION CURVES . . . . . . . . . . . .
Cone Tests . . . . . . . . . . . . . . . . . . . . . . . . . . Sphere Tests . . . . . . . . . . . . . . . . . . . . . . . . .
MAXIMUM RESULTANT VERTICAL FORCE ANALYSIS . . . . . . . . . . . . . Maximum F o r c e P r e d i c t i o n . . . . . . . . . . . . . . . . . . .
CHAPTER I X . SUMMARY OF CONCLUSIONS AND RECOMMENDATIONS . . . . . . . . . PHASE I CONCLUSIONS . . . . . . . . . . . . . . . . . . . . . . . . PHASE I RECOMMENDATIONS . . . . . . . . . . . . . . . . . . . . . . PHASE I1 CONCLUSIONS . . . . . . . . . . . . . . . . . . . . . . . PHASE I1 RECOMMENDATIONS . . . . . . . . . . . . . . . . . . . . . PHASE I11 CONCLUSIONS . . . . . . . . . . . . . . . . . . . . . . . PHASE I11 RECOMMENDATIONS . . . . . . . . . . . . . . . . . . . . .
APPENDIX A. COMPUTER PROGRAM PASSIV . . . . . . . . . . . . . . . . . . C a l c u l a t i o n of P a s s i v e E a r t h P r e s s u r e . . . . . . . . . . . . . . . C a l c u l a t i o n of P a s s i v e E a r t h - P r e s s u r e F a c t o r s . . . . . . . . . . . C a l c u l a t i o n of t h e C e n t e r o f P r e s s u r e . . . . . . . . . . . . . . . C a l c u l a t i o n s Based on Coulomb's Theory . . . . . . . . . . . . . . General Flow Diagram for Program PASSIV . . . . . . . . . . . . . . FORTRAN L i s t i n g . . . . . . . . . . . . . . . . . . . . . . . . . . Example Data Input . . . . . . . . . . . . . . . . . . . . . . . . Discuss ion o f Data Input . . . . . . . . . . . . . . . . . . . . . D a t a I n p u t F o r m . . . . . . . . . . . . . . . . . . . . . . . . . . Example Data Output . . . . . . . . . . . . . . . . . . . . . . . .
APPENDIX B y EXPERIMENTAL EXAMPLE DATA . . . . . . . . . . . . . . . . . APPENDIX C. EXPERIMENTAL EXAMPLE DATA . . . . . . . . . . . . . . . . . REFERENCES . . . . . . . . . . . . . . . . . . . . . . . . . . . . . . .
Page
139
143
144
149
149
159
162
162
163
164
165
166
166
168
168
170
170
170
1 7 3
174
181
182
183
184
188
193
198
X

1.
2 .
3 .
4 .
5.
6.
7 .
8 .
9 .
10.
11.
12.
LIST OF FIGURES
Page
Mohr’s Theory of R u p t u r e f o r a n I d e a l l y P l a s t i c a n d
C o h e s i o n l e s s S o i l . . . . . . . . . . . . . . . . . . . . . . . 5
S t r e s s e s a t t h e B o u n d a r i e s o f a P r i s m a t i c Column o f S o i l
Located Within a Semi - In f in i t e Cohes ion le s s Mass of
S o i l i n a S t a t e of Rest . . . . . . . . . . . . . . . . . . . . 7
S t r e s s e s a t t h e B o u n d a r i e s o f a Column o f So i l Loca ted
Within a Semi - In f in i t e Cohes ion le s s Mass of S o i l i n a
R a n k i n e s t a t e . . . . . . . . . . . . . . . . . . . . . . . . . 7
G r a p h i c R e p r e s e n t a t i o n o f t h e S t a t e s o f S t r e s s on the Base
o f t h e S o i l Column i n F i g . 2 and F ig . 3 . . . . . . . . . . . . 8
O r i e n t a t i o n o f t h e S u r f a c e s o f S l i d i n g f o r a S e m i - I n f i n i t e
Mass o f S o i l i n a Rank ine S t a t e . . . . . . . . . . . . . . . . 8
Passive Rankine Zone Behind an Inwardly Advancing Wall . . . . . . . 10
D i s t r i b u t i o n of P a s s i v e S o i l Stresses on t h e Smooth,
I n f i n i t e l y Long Wall Shown i n F i g . 6 . . . . . . . . . . . . . . 10
Forces Acting on the Wall and the Assumed Coulomb F a i l u r e Wedge . . 11
Equi l ibr ium Force Polygon for the Assumed F a i l u r e Wedge i n
F i g . 8 . . . . . . . . . . . . . . . . . . . . . . . . . . . . . 11
S h a p e o f t h e S u r f a c e o f S l i d i n g i f t h e W a l l F r i c t i o n 6
i s P o s i t i v e . . . . . . . . . . . . . . . . . . . . . . . . . . 13
Shape of t h e S u r f a c e o f S l i d i n g i f t h e Wall F r i c t i o n 6
is Negat ive . . . . . . . . . . . . . . . . . . . . . . . . . . 13
P o r t i o n o f B a c k f i l l T r a n s f o r m e d i n t o a Rank ine S t a t e , due t o T i l t i n g
o f a Smooth, I n f i n i t e l y Long Wall About i t s Lower I n n e r Edge . . 15
xi
\

Page
13 .
14 .
15 . 16 . 17 . 18 .
19 . 20 . 21 . 22 . 23 . 24 . 25 . 26 . 27 .
28 . 29 . 30 . 31 .
E f f e c t o f Wall F r i c t i o n o n t h e C o e f f i c i e n t of P a s s i v e
E a r t h P r e s s u r e . . . . . . . . . . . . . . . . . . . . L o g a r i t h m i c S p i r a l Method fo r De te rmin ing Pass ive
E a r t h P r e s s u r e . . . . . . . . . . . . . . . . . . . . S i d e V i e w o f t h e Test Setup Used During Phase I . . . . . Cente r P l a t e Des ign . Phase I . . . . . . . . . . . . . . S i d e P l a t e D e s i g n . Phase I . . . . . . . . . . . . . . . V i e w o f t h e Eye Bol t Connect ions and P la te Counterba lance
Weights . Phase I . . . . . . . . . . . . . . . . . . Block Diagram of Force Measurement Circui t . Phase I . . . Detai ls o f T y p i c a l Load C e l l . . . . . . . . . . . . . . . A General V i e w o f Test Equipment . Phase I1 . . . . . . . V i e w of Loading Frame and Plate Supports . Phase I1 . . . C e n t e r P l a t e D e s i g n , 1 2 I n . x 1 2 I n . . Phase I1 . . . . . S i d e P l a t e D e s i g n . 1 2 I n . x 1 2 I n . . Phase I1 . . . . . . C e n t e r P l a t e D e s i g n , 1 2 I n . x 18 I n . . Phase I1 . . . . . S i d e P l a t e D e s i g n . 1 2 I n . x 18 I n . . Phase I1 . . . . . . Deta i l V i e w o f Load ing F rame Res t r a in t and Def l ec t ion
Transducer Mountings . Phase I1 . . . . . . . . . . . Block Diagram o f In s t rumen ta t ion Se tup . Phase I1 . . . . Aluminum R i g h t - C i r c u l a r Cone Design . Phase 111 . . . . . Aluminum Spherical Segment Design . Phase I11 . . . . . . V i e w of Models , Sampling Tubes. and Lateral Soi l Support .
Phase I11 . . . . . . . . . . . . . . . . . . . . . . V i e w o f In s t rumen ted Sha f t and Sphe r i ca l Segmen t i n
I n i t i a l T e s t P o s i t i o n s . Phase 111 . . . . . . . . .
. . . . . 19
. . . . . 23
. . . . . 25
. . . . . 26
. . . . . 27
. . . . . 31
. . . . . 33
. . . . . 33
. . . . . 34
. . . . . 36
. . . . . 3 7
. . . . . 40
. . . . . 42
. . . . . 46
. . . . . 46
. . . . . 47
xi i

33 . 34 . 35 . 36 .
37 .
38 . 39 . 40 .
41 . 42 . 43 . 44 . 45 . 46 . 47 . 48 . 49 . 50 . 51 . 52 .
53 .
54 .
Page
Detail V i e w o f Model P e n e t r a t i o n Assembly . Phase I11 . . . . . . . 49
Typica l Ca l ib ra t ion Da ta Ou tpu t . Phase I1 . . . . . . . . . . . . . 55
Typical Load Cel l and Displacement Transducer Output . Phase I1 . . 56
Sketch Showing the Depths of Soi l Used i n Model Tests .
Phase I11 . . . . . . . . . . . . . . . . . . . . . . . . . . . 59
Sketch Showing the Notat ion Used i n C a l c u l a t i n g
S o i l R e a c t i o n s . Phase I11 . . . . . . . . . . . . . . . . . . . 61
Mechanical Analysis Grain Size Accumulat ive Curve . . . . . . . . . 63
Angles o f S l id ing F r i c t ion fo r Co lo rado R ive r Sand on S t ee l . . . . 67
Plan V i e w o f the Sandbox Showing the Loca t ions a t Which Dens i ty
Samples were Taken . Phase I1 . . . . . . . . . . . . . . . . . 69
P a s s i v e E a r t h P r e s s u r e V e r s u s P e n e t r a t i o n . . . . . . . . . . . . . 7 2
Wall Fr ic t ion Development Curves . Dense Case . . . . . . . . . . . 74
Wall Fr ic t ion Development Curves . Dense Case . . . . . . . . . . . 7 5
Wall Friction Development Curves . Loose Case . . . . . . . . . . . 76
Constructed Wall Fr ic t ion Curves for Loose and Dense Cases . . . . . 78
Ear th -Pres su re Fac to r Curves . Loose Case . . . . . . . . . . . . . 83
Ear th -Pres su re Fac to r Curves . Loose Case . . . . . . . . . . . . . 84
Ear th -Pres su re Fac to r Curves . Dense Case . . . . . . . . . . . . . 85
Ear th-Pressure Fac tor Curves . Dense Case . . . . . . . . . . . . . 86
I n t e r n a l F r i c t i o n Development Curves . Loose Case . . . . . . . . . 87
In t e rna l F r i c t ion Deve lopmen t Curves . Dense Case . . . . . . . . . 88
V a r i a t i o n s i n t h e L o c a t i o n o f t h e C e n t e r o f P r e s s u r e .
Loose Case . . . . . . . . . . . . . . . . . . . . . . . . . . . 89
V a r i a t i o n s i n t h e L o c a t i o n of t he Cen te r o f P re s su re .
Dense Case . . . . . . . . . . . . . . . . . . . . . . . . . . . 9 1
V a r i a t i o n s i n t h e L o c a t i o n o f t h e C e n t e r o f P r e s s u r e .
Dense Case . . . . . . . . . . . . . . . . . . . . . . . . . . . 92 xiii

Page
55. V a r i a t i o n s i n t h e L o c a t i o n o f t h e C e n t e r o f P r e s s u r e - Dense Case . . . . . . . . . . . . . . . . . . . . . . . . . . . 93
98 56. Cons t ruc ted Wal l Fr ic t ion Curves for Loose and Dense Cases . . . . . 57. Typ ica l Pas s ive Ea r th P res su re Deve lopmen t fo r 12 and 18 in. Walls -
Loose Case . . . . . . . . . . . . . . . . . . . . . . . . . . . 100
58 . Typ ica l Pas s ive Ea r th P res su re Ver sus Pene t r a t ion fo r 12 and 18 i n . W a l l - D e n s e c a s e . . . . . . . . . . . . . . . . . . . . . . . . 101
102
103
59. Maximum Ear th -P res su re Fac to r Ver sus Ve loc i ty . Loose Case . . . . . 60. Maximum Ear th -P res su re Fac to r Ver sus Ve loc i ty . Dense Case . . . . . 61. V i e w o f I n t e r s e c t i o n o f F a i l u r e S u r f a c e w i t h S u r f a c e o f
B a c k f i l l - 12 in. Wall , Dense Test . . . . . . . . . . . . . . . 1 1 7
62. V i e w o f I n t e r s e c t i o n o f F a i l u r e S u r f a c e w i t h S u r f a c e o f B a c k f i l l - 18 in. Wall, Dense Test . . . . . . . . . . . . . . . 1 1 7
63. E f f e c t of Wall P e n e t r a t i o n o n t h e L o c a t i o n o f t h e C e n t e r o f P r e s s u r e - 1 2 in . Wall , Loose Case . . . . . . . . . . . . . . 118
64. E f fec t o f Wal l Pene t r a t ion on t he Loca t ion of the Center o f P r e s s u r e - 1 2 in . Wal l , Dense Case . . . . . . . . . . . . . . . 119
65 . Hor izonta l Force Versus Penet ra t ion for Mul t ip le Overburden Depths . 3.54 in. Dia Cone, Loose Case . . . . . . . . . . . . . 125
66. Hor i zon ta l Fo rce Ver sus Pene t r a t ion fo r Mul t ip l e Overburden Depths - 3.54 In. Dia Cone, Dense Case . . . . . . . . . . . . . 126
67 . Hor izonta l Force Versus Penet ra t ion for Mul t ip le Overburden Depths - 7.08 In. Dia Cone, Loose Case . . . . . . . . . . . . . 127
68. Hor i zon ta l Fo rce Ver sus Pene t r a t ion fo r Mul t ip l e Overburden Depths - 7.08 In. Dia Cone, Dense Case . . . . . . . . . . . . . 128
69 . Hor izonta l Force Versus Penet ra t ion for Mul t ip le Overburden Depths - 4.33 In . Dia Spherical Segment , Loose Case . . . . . . . 130
70. Horizontal Force Versus Penetrat ion €or Mult iple Overburden Depths - 4.33 I n . Dia Spherical Segment , Dense Case . . . . . . . 131
7 1 . Hor i zon ta l Fo rce Ver sus Pene t r a t ion fo r Mul t ip l e Overburden Depths - 8.66 In . Dia Spherical Segment , Loose Case . . . . . . . 132
72. Hor i zon ta l Fo rce Ver sus Pene t r a t ion fo r Mul t ip l e Overburden Depths - 8.66 In. Dia Spherical Segment, Dense Case . . . . . . . 133
xiv

Page
73. Ef fec t o f Overburden Depth on the Maximum Developed H o r i z o n t a l F o r c e - Loose Case . . . . . . . . . . . . . . . . . . 136
74. Effect of Overburden Depth on t h e Maximum Developed H o r i z o n t a l F o r c e - Loose Case . . . . . . . . . . . . . . . . . . 137
75. E f fec t o f Overburden Dep th on t he Maximum Developed H o r i z o n t a l F o r c e - Dense Case . . . . . . . . . . . . . . . . . . 138
76. F ron t V i e w o f Tes t Setup Before Model P e n e t r a t i o n . . . . . . . . . 142
77. F ron t V i e w o f Test S e t u p A f t e r Model P e n e t r a t i o n . . . . . . . . . . 142
78. R e s u l t a n t Vertical Force Ver sus Pene t r a t ion fo r Mul t ip l e Overburden Depths - 3.54 In. Dia Cone, Loose and D e n s e c a s e s . . . . . . . . . . . . . . . . . . . . . . . . . . . 145
79 . Resu l t an t Ver t i ca l Fo rce Ver sus Pene t r a t ion fo r Mul t ip l e Overburden Depths - 7.08 In. Dia Cone, Loose Case . . . . . . . . 147
80 . Resu l t an t Ver t i ca l Fo rce Ver sus Pene t r a t ion fo r Mul t ip l e Overburden Depths - 7.08 In. Dia Cone, Dense Case . . . . . . . . 148
81. R e s u l t a n t V e r t i c a l F o r c e V e r s u s P e n e t r a t i o n f o r M u l t i p l e Overburden Depths - 4.33 In. Dia Spherical Segment , Loose and Dense Cases . . . . . . . . . . . . . . . . . . . . . . 150
8 2 . R e s u l t a n t V e r t i c a l F o r c e V e r s u s P e n e t r a t i o n f o r M u l t i p l e Overburden Depths - 8.66 In . Dia Spherical Segment , Loose Case . . . . . . . . . . . . . . . . . . . . . . . . . . . 151
83 . Resu l t an t Ver t i ca l Fo rce Ver sus Pene t r a t ion fo r Mul t ip l e Overburden Depths - 8.66 In . Dia Spherical Segment , Dense Case . . . . . . . . . . . . . . . . . . . . . . . . . . . 152
84. Effect of Overburden Depth on t h e Maximum Developed R e s u l t a n t V e r t i c a l F o r c e . Dense Case . . . . . . . . . . . . . . 153
85. Effect of Overburden Depth on the Maximum Developed R e s u l t a n t V e r t i c a l F o r c e - Loose Case . . . . . . . . . . . . . . 154
86. Effect of Overburden Depth on the Maximum Developed R e s u l t a n t V e r t i c a l F o r c e . Dense Case . . . . . . . . . . . . . . 155
8 7 . Ef fec t o f Overburden Depth on the Maximum Developed R e s u l t a n t V e r t i c a l F o r c e - Loose Case . . . . . . . . . . . . . . 156
88. Effect of Overburden Depth on the Maximum Developed R e s u l t a n t V e r t i c a l F o r c e . Dense Case . . . . . . . . . . . . . . 157

89 .
90 . 91 . 92 .
93 .
94 .
95 .
96 .
97 .
98 .
99 .
100 .
Forces Necessary for Equilibrium of the Wall Formed by the Steel Plates . . . . . . . . . . . . . . . . . . . . . . . 169
Position of Load-Cell Reactions on the Center Plate . . . . . . . . 169
Passive Failure Wedge Behind a Retaining Wall . . . . . . . . . . . 171
Equilibrium Force Polygon for the Failure Wedge Shown in Fig . 91 . . . . . . . . . . . . . . . . . . . . . . . . 171
Horizontal Force Versus Penetration . 3.54 in . Dia Cone. Dense Case . . . . . . . . . . . . . . . . . . . . . . . . . . . 189
Horizontal Force Versus Penetration . 7.08 in . Dia Cone. Dense Case . . . . . . . . . . . . . . . . . . . . . . . . . . . 190
Horizontal Force Versus Penetration . 4.33 in . Dia Spherical Segment. Dense Case . . . . . . . . . . . . . . . . . . . . . . . 191
Horizontal Force Versus Penetration . 8.66 in . Dia Spherical Segment. Dense Case . . . . . . . . . . . . . . . . . . 192
Resultant Vertical Force Versus Penetration . 3.54 in . Dia Cone. Loose Case . . . . . . . . . . . . . . . . . . 194
Resultant Vertical Force Versus Penetration . 7.08 in . Dia Cone. Dense Case . . . . . . . . . . . . . . . . . . 195
Resultant Vertical Force Versus Penetration . 4.33 in . Dia Spherical Segment. Loose Case . . . . . . . . . . . 196
Resultant Vertical Force Versus Penetration . 8.66 in . Dia Spherical Segment. Dense Case . . . . . . . . . . . 197
xvi

LIST OF TABLES
1. T r i a x i a l T e s t R e s u l t s . . . . . . . . . . . . . . . . . . . . . . . 2. Comparison Between Maximum Measured Ear th-Pressure Fac tors
a n d C a l c u l a t e d E a r t h P r e s s u r e F a c t o r s . . . . . . . . . . . . . . 3. V a l u e s o f t h e E a r t h P r e s s u r e a t - r e s t C o e f f i c i e n t a n d t h e
Cor re spond ing Cen te r o f P re s su res . . . . . . . . . . . . . . . . 4 . Comparison Between Measured and Calculated Orientat ions of
t h e F a i l u r e S u r f a c e a t Maximum Measured Ear th Pressures . . . . . 5. Comparison Between Maximum Measured Earth-Pressure Factors and
C a l c u l a t e d E a r t h - P r e s s u r e F a c t o r s f o r 1 2 i n . Wall - Loose Case . 6 . Comparison Between Maximum Measured Ear th-Pressure Fac tors
and Ca lcu la t ed Ea r th -P res su re Fac to r s fo r 1 2 i n . Wall - Dense
Case . . . . . . . . . . . . . . . . . . . . . . . . . . . . . . 7 . Comparison Between Maximum Measured Earth-Pressure Factors
and Ca lcu la t ed Ea r th -P res su re Fac to r s fo r 18 i n . Wall - Loose
Case . . . . . . . . . . . . . . . . . . . . . . . . . . . . . . 8 . Comparison Between Maximum Measured Ear th-Pressure Fac tors
a n d C a l c u l a t e d E a r t h - P r e s s u r e F a c t o r s f o r 18 i n . Wall - Dense
Page
64
80
9 4
96
105
106
109
Case . . . . . . . . . . . . . . . . . . . . . . . . . . . . . . 110
9 . Comparison Between Measured and Calculated Orientat ions
o f t h e F a i l u r e S u r f a c e f o r 1 2 i n . Wall - Loose Case . . . . . . . 111
10. Comparison Between Measured and Calculated Orientat ions
o f t h e F a i l u r e S u r f a c e f o r 1 2 i n . Wall - Dense Case . . . . . . . 112
11. Comparison Between Measured and Calculated Orientat ions
o f t h e F a i l u r e S u r f a c e f o r 18 i n . Wall - Loose Case . . . . . . . 113
mi i

Page
12 . Comparison Between Measured and Ca lcu la t ed Or i en ta t ions
o f t h e F a i l u r e S u r f a c e f o r 18 i n . Wall . Dense Case . . . . . . 114
13 . Comparison of Average Measured and Calculated Earth-Pressure Factors 120
14 . Maximum Developed Horizontal Forces . . . . . . . . . . . . . . . . 135
15 . Comparison of \ Values . . . . . . . . . . . . . . . . . . . . . . 141
16 . Maximum D e v e l o p e d R e s u l t a n t V e r t i c a l F o r c e s . . . . . . . . . . . . 158
1 7 . Comparison of Kv Values . . . . . . . . . . . . . . . . . . . . . 161
xvi i i

NOTATION
CD
F
H
5l
K
K
0
P
KV
P P
H R
RH (max)
r P
RV
Rv (max)
W
Y
2
Y
6
D
l o c a t i o n o f c e n t e r o f p r e s s u r e a b o v e b a s e o f wall
r e s u l t a n t f o r c e o n f a i l u r e s u r f a c e o f a wedge o f s o i l b e h i n d a r e t a i n i n g w a l l
h e i g h t o f r e t a i n i n g w a l l
f a c t o r w h i c h d e p e n d s u p o n d e v e l o p e d a n g l e o f i n t e r n a l f r i c t i o n , deve loped ang le o f f r i c t ion be tween so i l and membrane, and the g e o m e t r i c p r o p e r t i e s o f p e n e t r a t i n g model
c o e f f i c i e n t o f e a r t h p r e s s u r e a t - r e s t
c o e f f i c i e n t o f p a s s i v e e a r t h p r e s s u r e
f a c t o r when m u l t i p l i e d by y Z y i e l d s maximum r e s u l t a n t v e r t i c a l f o r c e
C
p a s s i v e e a r t h p r e s s u r e
h o r i z o n t a l s o i l f o r c e
maximum h o r i z o n t a l s o i l f o r c e
r a d i u s o f p r o j e c t e d c o n t a c t a r e a o f model a t i n s t a n t maximum h o r i z o n t a l s o i l f o r c e o c c u r s
r e s u l t a n t v e r t i c a l s o i l f o r c e
maximum r e s u l t a n t v e r t i c a l s o i l f o r c e
weight o f s o i l wedge developed behind an inwardly advancing r e t a i n i n g w a l l
p e n e t r a t i o n o f w a l l
v e r t i c a l d i s t a n c e b e n e a t h s o i l s u r f a c e
a n g l e b e t w e e n f a i l u r e s u r f a c e a n d h o r i z o n t a l
m e a s u r e d a n g l e b e t w e e n f a i l u r e s u r f a c e a n d h o r i z o n t a l
t h e o r e t i c a l a n g l e b e t w e e n f a i l u r e s u r f a c e a n d h o r i z o n t a l , c a l - cu la t ed u s ing Cou lomb ' s pas s ive ea r th -p res su re equa t ion
u n i t d e n s i t y o f s o i l
deve loped angle o f wall f r i c t i o n
normal stress
xix

0 P
0 1
3 0
7
'max
maximum normal stress a c t i n g on a v e r t i c a l p l a n e p a s s i n g through a mass o f s o i l which has been t ransformed into a p a s s i v e R a n k i n e s t a t e
ma jo r p r inc ipa l no rma l s t ress
minor p r inc ipa l no rma l stress
s h e a r i n g stress
developed angle o f i n t e r n a l f r i c t i o n
maximum developed angle of i n t e r n a l f r i c t i o n

CHAPTER I
INTRODUCTION
The branch of Civ i l Engineer ing known a s s o i l m e c h a n i c s i s r e l a t i v e l y
young. The l a t e d e v e l o p m e n t o f t h i s f i e l d c a n l a r g e l y b e a t t r i b u t e d t o m a n ' s
d i s i n t e r e s t i n f o u n d a t i o n e n g i n e e r i n g . P r i o r t o 1 9 0 0 , f o u n d a t i o n s were looked
upon a s a n e c e s s a r y e v i l . It was n o t u n t i l 1 9 2 3 when Kar l Te rzagh i pub l i shed
h i s work c o n c e r n i n g t h e t h e o r y of c o n s o l i d a t i o n t h a t t h e p r o b l e m s a s s o c i a t e d
wi th founda t ions began t o be approached i n a s c i e n t i f i c manner. It was
T e r z a g h i ' s work t h a t b r o u g h t o r d e r t o a n d made p o s s i b l e t h e r a t i o n a l d e v e l o p m e n t
o f so i l mechan ics ' . * S ince 1923 knowledge i n t h i s f i e ld has grown r a p i d l y and
many t h e o r i e s h a v e e v o l v e d f r o m l a b o r a t o r y e x p e r i m e n t s , f u l l s c a l e f i e l d t e s t s ,
and observa t ions . Al though many o f t h e now e x i s t i n g t h e o r i e s a r e e x t r e m e l y
c rude , they have provided a means by which t h e e n g i n e e r c a n s a f e l y d e s i g n
s t r u c t u r e s t h a t i n t e r a c t w i t h s o i l m a s s e s .
L a t e r a l e a r t h p r e s s u r e s i n s o i l i s a subjec t about which much has been
w r i t t e n . T h i s s u b j e c t h a s r e c e i v e d a g r e a t d e a l o f a t t e n t i o n b e c a u s e o f i t s
p r a c t i c a l v a l u e i n c o n n e c t i o n w i t h t h e d e s i g n o f r e t a i n i n g w a l l s , b u l k h e a d s ,
b u i l d i n g s , a n d p i l e s u p p o r t e d s t r u c t u r e s . The c a l c u l a t i o n o f t r u e l a t e r a l
e a r t h p r e s s u r e s u s i n g e x i s t i n g t h e o r i e s i s o f t e n i m p o s s i b l e a n d t h e r e f o r e i t
becomes n e c e s s a r y t o p e r f o r m f i e l d tests o r l a b o r a t o r y e x p e r i m e n t s t o o b t a i n
r e a l i s t i c v a l u e s t h a t c a n b e u s e d i n d e s i g n c o m p u t a t i o n s .
OBJECTIVE
T h i s i n v e s t i g a t i o n was u n d e r t a k e n t o o b t a i n i n f o r m a t i o n t o b e u t i l i z e d
by the Na t iona l Aeronau t i c s and Space Admin i s t r a t ion . The pr imary ob jec t ive
o f t h i s i n v e s t i g a t i o n was to de t e rmine how a c o h e s i o n l e s s s o i l r e s p o n d s t o
9 : S u p e r s c r i p t s r e f e r t o t h e l i s t o f r e f e rences on p . 198 .

various g e o m e t r i c s h a p e s h o r i z o n t a l l y p e n e t r a t i n g i t a t s e v e r a l c o n s t a n t r a t e s
o f p e n e t r a t i o n .
SCOPE OF INVESTIGATION
The scope o f t h i s i n v e s t i g a t i o n was l i m i t e d t o h o r i z o n t a l l y p e n e t r a t i n g
t h r e e g e o m e t r i c s h a p e s i n t o a d r y C o l o r a d o R i v e r s a n d a t c o n s t a n t r a t e s of
p e n e t r a t i o n . The th ree geomet r i c shapes were: (1) f l a t s t e e l p l a t e s ,
( 2 ) aluminum r i g h t - c i r c u l a r c o n e s , a n d ( 3 ) aluminum spher ica l segments .
The p l a t e t es t s w e r e d e s i g n e d t o s i m u l a t e t h e c l a s s i c a l p l a n e - s t r a i n
ea r th -p res su re p rob lem. P l a t e s hav ing he igh t s o f 12 and 18 i n . were t e s t e d .
The r a t e o f pene t r a t ion o f t he p l a t e s r anged f rom 0 .00278 t o 2 .67 i p s . During
each t e s t , d a t a was r e c o r d e d t h a t p e r m i t t e d t h e e v a l u a t i o n o f t h e h o r i z o n t a l
and v e r t i c a l r e s p o n s e o f t h e s o i l a l o n g w i t h t h e c o r r e s p o n d i n g p e n e t r a t i o n s o f
t h e p l a t e .
T h e c o n e a n d s p h e r i c a l s e g m e n t t e s t s c o n s i s t e d o f p e n e t r a t i n g t h e
s o i l w i t h two s i zes o f cones and spherical segments . The cones had an apex
a n g l e o f 60 degrees and he igh t s of 3.06 and 6 .12 inches. The spherical seg-
ments had spher ica l d iameters o f 5 .0 and 10.0 i n c h e s . P r i o r t o e a c h t e s t
t h e s o i l was s u p p o r t e d i n a h o r i z o n t a l d i r e c t i o n by a p o l y e t h y l e n e membrane.
The mode l s pene t r a t ed t he membrane and s o i l a t r a t e s v a r y i n g from 0.533 to
4.0 i p s . The dep ths be low the so i l su r f ace a t wh ich t he mode l s pene t r a t ed
were va r i ed f rom 0 .5 t o 2.5 t imes the base diameter of the model . During
each t e s t , d a t a was r e c o r d e d t h a t p e r m i t t e d t h e d e t e r m i n a t i o n o f t h e s o i l
r e a c t i o n i n a h o r i z o n t a l a n d v e r t i c a l d i r e c t i o n . H o r i z o n t a l p e n e t r a t i o n s
of the models , cor responding to the force measurements , were a l s o r e c o r d e d .
S t a n d a r d l a b o r a t o r y tests were pe r fo rmed t o de t e rmine t he eng inee r ing
p r o p e r t i e s o f t h e s o i l u s e d i n t h i s i n v e s t i g a t i o n , The e x p e r i m e n t a l r e s u l t s
2

of t h e p e n e t r a t i o n of t h e g e o m e t r i c s h a p e s i n s a n d were a n a l y z e d u s i n g e x i s t -
i n g s t a t i c e a r t h - p r e s s u r e t h e o r y . Where theo ry was n o t a p p l i c a b l e , a n em-
p i r i c a l a p p r o a c h was t aken .
3

CHAPTER I1
PASSIVE EARTH-PRESSURE THEORY
The scope of t h i s c h a p t e r i s l i m i t e d t o t h e d i s c u s s i o n of i d e a l co-
h e s i o n l e s s s o i l s w h i c h a r e s u b j e c t e d t o l a t e r a l c o m p r e s s i o n . P r o b l e m s a r e
d e a l t w i t h w h i c h i n v o l v e o n l y t h e movement o f s o i l i n two d i r e c t i o n s , s i n c e
i n t h e s e c a s e s g e n e r a l t h e o r y i s a p p l i c a b l e .
PLASTIC EQUILIBRIUM
Theory of p l a s t i c i t y , a s commonly a p p l i e d t o s o i l s , i s based o n Mohr's
t h e o r y o f r u p t u r e . T h i s t h e o r y is founded o n the fundamenta l assumpt ion tha t
t h e s o i l f a i l s by s h e a r a s soon a s t h e s h e a r i n g s t r e s s o n a n y s e c t i o n s a t i s -
f i e s Cou lomb ' s empi r i ca l equa t ion .
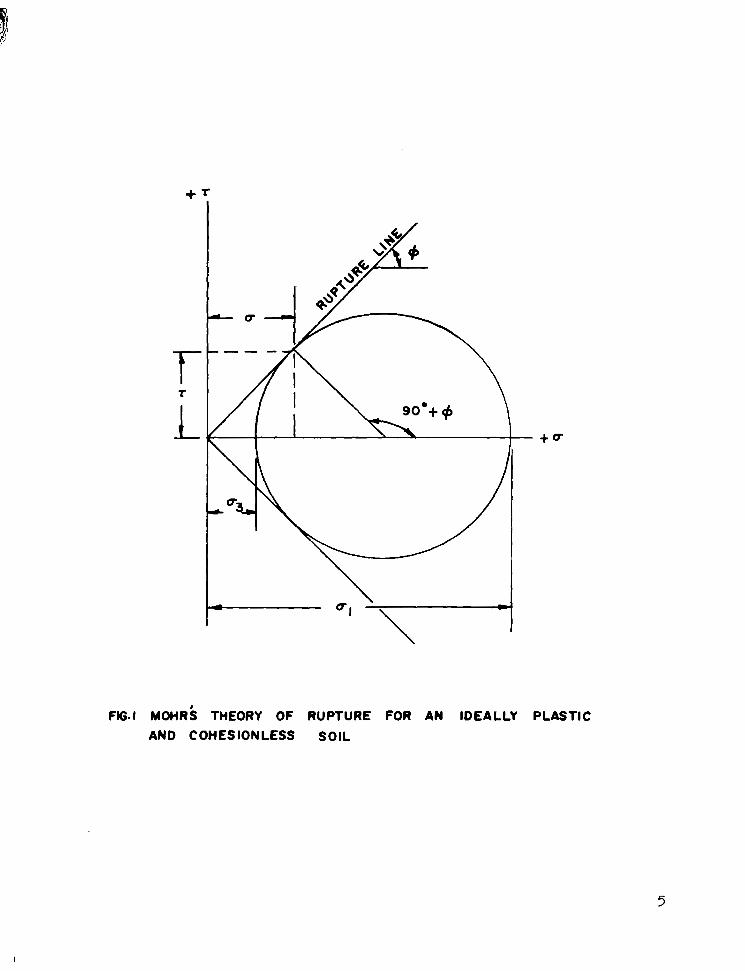
Mohr's Theory of Rupture For An I d e a l l y P l a s t i c and Cohes ionless Soi l
i s g r a p h i c a l l y p r e s e n t e d i n F i g . 1. The c i r c l e r e p r e s e n t s s t r e s s e s (u, T) a t
a p o i n t l o c a t e d w i t h i n a mass of s o i l i n a s t a t e o f p l a s t i c e q u i l i b r i u m . The
fo l lowing stress r e l a t i o n s h i p c a n b e d e r i v e d f r o m t h e Mohr diagram.
I n d e t e r m i n i n g t h e b a s i c b e h a v i o r o f a n i d e a l l y c o h e s i o n l e s s s o i l , i t
i s advan tageous t o examine t he s t a t e s of stress t h a t c a n e x i s t i n a semi-
i n f i n i t e homogeneous mass o f s o i l . C o n s i d e r a o n e u n i t s q u a r e p r i s m a t i c c o l -
umn o f s o i l l o c a t e d w i t h i n a s e m i - i n f i n i t e m a s s . The u n i t w e i g h t o f t h e s o i l
i s d e f i n e d a s y and t he he igh t o f t he co lumn i s Z , a s i s shown i n F i g . 2.
S i n c e e v e r y v e r t i c a l s e c t i o n t h r o u g h t h e mass r e p r e s e n t s a plane of symmetry,
t h e s h e a r i n g stresses on a n y v e r t i c a l a n d h o r i z o n t a l s e c t i o n a r e e q u a l t o zero.
4
T r
L - +e
FGI M O H R ~ THEORY OF RUPTURE FOR AN IDEALLY PLASTIC AND COHESIONLESS SOIL
5
I
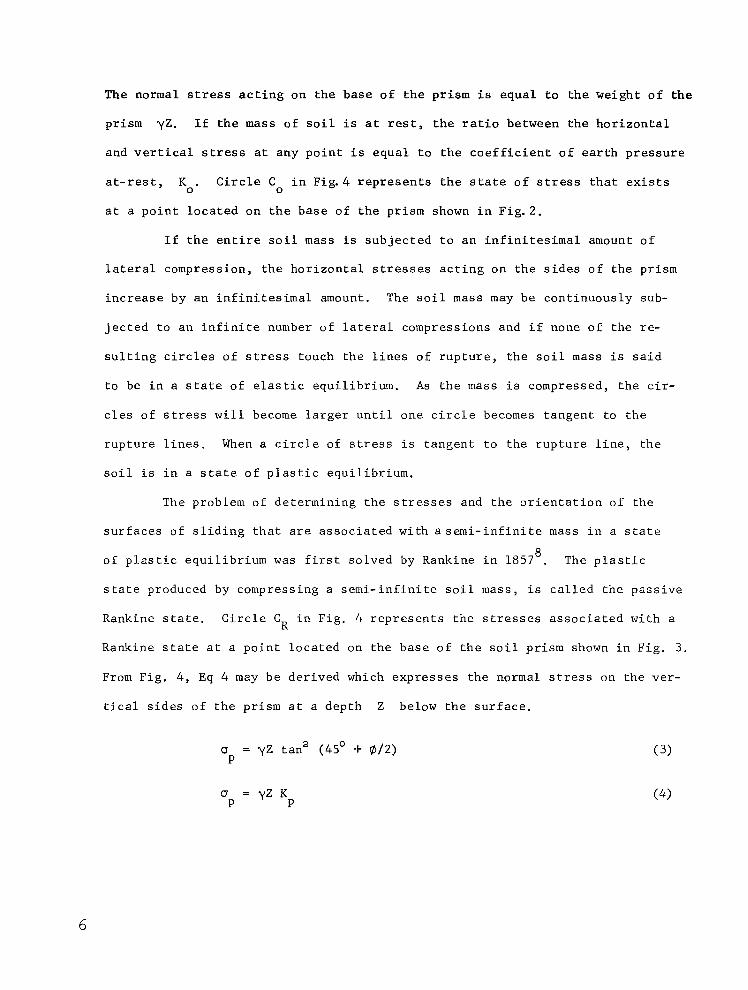
The normal stress a c t i n g o n t h e b a s e o f t h e p r i s m i s e q u a l t o t h e w e i g h t o f t h e
pr ism yZ. I f t h e m a s s o f s o i l i s a t rest , t h e r a t i o b e t w e e n t h e h o r i z o n t a l
and v e r t i c a l s tress a t a n y p o i n t i s e q u a l t o t h e c o e f f i c i e n t o f e a r t h p r e s s u r e
a t - r e s t , KO. C i r c l e C i n Fig. 4 r e p r e s e n t s t h e s t a t e o f stress t h a t exists
a t a p o i n t l o c a t e d o n t h e b a s e o f t h e p r i s m shown i n F i g . 2.
0
I f t h e e n t i r e s o i l mass i s s u b j e c t e d t o a n i n f i n i t e s i m a l amount o f
l a t e r a l c o m p r e s s i o n , t h e h o r i z o n t a l stresses a c t i n g o n t h e s i d e s o f t h e p r i s m
inc rease by an i n f in i t e s ima l amoun t . The s o i l mass may be cont inuous ly sub-
j e c t e d t o a n i n f i n i t e number o f l a t e ra l compress ions and i f none o f t he r e -
s u l t i n g c i r c l e s o f stress t o u c h t h e l i n e s o f r u p t u r e , t h e s o i l mass i s s a i d
t o be i n a s t a t e of e l a s t i c e q u i l i b r i u m . As t h e mass i s compressed , the c i r -
c l e s o f s t ress w i l l become l a r g e r u n t i l o n e c i r c l e becomes t a n g e n t t o t h e
r u p t u r e l i n e s . When a c i r c l e o f s t ress i s t a n g e n t t o t h e r u p t u r e l i n e , t h e
s o i l i s i n a s t a t e o f p l a s t i c e q u i l i b r i u m .
The problem of determining the stresses a n d t h e o r i e n t a t i o n o f t h e
s u r f a c e s o f s l i d i n g t h a t a r e a s s o c i a t e d w i t h a s e m i - i n f i n i t e mass i n a s t a t e
o f p l a s t i c e q u i l i b r i u m was f i r s t s o l v e d by Rankine i n 1857 . The p l a s t i c
s t a t e p r o d u c e d by compressing a s e m i - i n f i n i t e s o i l m a s s , i s c a l l e d t h e p a s s i v e
R a n k i n e s t a t e . C i r c l e C i n F i g . 4 r e p r e s e n t s t h e stresses a s s o c i a t e d w i t h a
R a n k i n e s t a t e a t a p o i n t l o c a t e d o n t h e b a s e o f t h e s o i l p r i s m shown i n F i g . 3.
8
R
From F ig . 4 , Eq 4 may be der ived which expresses the normal stress on t he ve r -
t i c a l s i d e s o f t h e p r i s m a t a dep th Z be low the su r f ace .
CT P = yz KP
6

FIG. 2 STRESSES AT THE BOUNDARIES OF A PRISMATIC COLUMN
OF SOIL LOCATED WITHIN A SEMI-INFINITE COHESION- LESS MASS OF SOIL I N A STATE O F REST
FIG. 3 STRESSES AT THE BOUNDARIES OF A COLUMN OF SOIL LOCATED WITHIN A SEMI-INFINITE COHESION- LESS MASS OF SOIL IN A RAN.KINE STATE
7

+U
FIG. 4 GRAPHIC REPRESENTATION OF THE STATES OF STRESS ON THE BASE OF THE SOIL COLUMN IN FIG. 2 AND FIG. 3
FIG.5 ORIENTATION OF THE SURFACES OF SLIDING FOR A SEMI-INFINITE MASS OF SOIL IN A RANKINE STATE
8

The term K is t h e c o e f f i c i e n t o f p a s s i v e e a r t h p r e s s u r e . The o r i e n t a t i o n
o f t h e s u r f a c e s o f s l i d i n g t h a t a r e a s s o c i a t e d w i t h a R a n k i n e s t a t e i s
shown i n F i g . 5.
P
Rank ine ' s Theory o f Pas s ive Ea r th P res su re
If t h e r e t a i n i n g w a l l t h a t i s shown i n F i g . 6 i s pushed toward the
b a c k f i l l , t h e s o i l r e s i s t a n c e w i l l i n c r e a s e u n t i l i t reaches an upper limit.
When t h i s u p p e r limit i s r e a c h e d t h e s o i l f a i l s by p l a s t i c f l o w . The p a s s i v e
p r e s s u r e p e r u n i t l e n g t h o f w a l l r e q u i r e d t o i n d u c e f a i l u r e i s c a l c u l a t e d by
i n t e g r a t i n g Eq 5,
p =r y Z tan" (45' + @/2) dZ P
J O
which y ie lds ,
S i n c e t h e d i s t r i b u t i o n o f p a s s i v e p r e s s u r e on t h e r e t a i n i n g w a l l i s t r i angu-
l a r , t h e c e n t e r o f p r e s s u r e i s l o c a t e d a t a d i s t a n c e o f H / 3 above the base of
t h e w a l l . A f r e e body diagram o f t h e f o r c e s a c t i n g o n t h e r e t a i n i n g w a l l i n
F ig . 6 i s shown i n F i g . 7 .
Coulomb's Theory of Pass ive Ear th Pressure
Coulomb's theory o f ear th p ressure assumes tha t when the wal l , which
i s shown i n F i g . 8 , i s t h r u s t i n t o t h e b a c k f i l l , a s o i l wedge is formed by a
p l a n e f a i l u r e s u r f a c e p a s s i n g t h r o u g h t h e l o w e r e d g e o f t h e w a l l . The f o r c e s
n e c e s s a r y t o k e e p t h e s o i l wedge i n e q u i l i b r i u m are shown i n F i g . 9 . The
p a s s i v e p r e s s u r e p e r u n i t l e n g t h of w a l l i s found by summing f o r c e s i n a d i r e c -
t i o n p e r p e n d i c u l a r t o t h e l i n e o f a c t i o n o f t h e f o r c e F a c t i n g o n t h e f a i l u r e
s u r f a c e . The summation of f o r c e s r e s u l t s i n t h e f o l l o w i n g e x p r e s s i o n f o r t h e
p a s s i v e e a r t h p r e s s u r e .
9

/ RETAINING WALL
FIG.6 PASSIVE RANKINE ZONE BEHIND AN INWARDLY ADVANCING WALL
pP
FIG.7 DISTRIBUTION OF PASSIVE SOIL STRESSES ON THE SMOOTH, INFINITELY LONG WALL SHOWN IN FIG.6
10

W
FIG. 8 FORCES ACTING ON THE WALL AND THE ASSUMED COULOMB FAILURE WEDGE
FIG.9 EQUILIBRIUM FORCE POLYGON FOR THE ASSUMED IN FIG.8
11

. . . .. ,
P = 0.5 Y H ~ r - cos @ l2 - p ‘Os 1 - J s i n @ ( s i n @ + cos @ t a n 6) J
P = 0 .5 yH2 K /COS 6 P P
I f t h e a n g l e o f f r i c t i o n b e t w e e n t h e w a l l a n d t h e s o i l mass, 6 , i s e q u a l t o
z e r o , t h e Coulomb v a l u e o f p a s s i v e e a r t h p r e s s u r e becomes equal to the Rankine
va lue .
It can be seen f rom Eq 8 t h a t t h e p r e s s u r e d i s t r i b u t i o n i s t r i a n g u l a r
a n d t h e r e f o r e t h e c e n t e r o f p r e s s u r e i s l o c a t e d a t a d i s t a n c e o f H / 3 above
the bot tom edge o f t h e wa l l .
W a l l F r i c t i o n
I n e v e r y p r a c t i c a l p a s s i v e e a r t h - p r e s s u r e c a s e a f r i c t i o n a l f o r c e
w i l l be developed a t t h e s o i l - w a l l i n t e r f a c e . The magni tude of the angle of
wa l l f r i c t ion depends upon t he roughness o f t he w a l l , t he dens i ty o f , t he back -
f i l l m a t e r i a l , a n d t h e amount of r e l a t i v e movement t h a t t a k e s p l a c e b e t w e e n t h e
wall and t h e b a c k f i l l . T h e s h e a r i n g s t r e s s e s a t t h e s o i l - w a l l i n t e r f a c e c a u s e
t h e f a i l u r e s u r f a c e t o become curved i n t h e v i c i n i t y o f t h e w a l l . L a r g e a n -
g l e s o f wall f r i c t i o n c a u s e t h e f a i l u r e s u r f a c e t o be h igh ly cu rved . Te rzagh i
n o t e d t h a t t h e s u r f a c e o f s l i d i n g i s cu rved a s shown i n F i g . 1 0 , p r o v i d e d t h e
wall t i l t s about i t s lower edge. The angle of wall f r i c t i o n i s considered pos-
i t i v e i f t h e b a c k f i l l m a t e r i a l moves i n a n upward d i r e c t i o n r e l a t i v e t o t h e
w a l l movement. I f t h e b a c k f i l l m a t e r i a l moves i n a downward d i r e c t i o n rela-
t i v e t o t h e movement o f t h e w a l l , t h e s u r f a c e o f s l i d i n g w i l l be as shown i n
F ig . 11. I n e i t h e r c a s e , t h e d i s t r i b u t i o n o f p a s s i v e e a r t h p r e s s u r e o n t h e
wal l i s t r i a n g u l a r a n d t h e c e n t e r o f p r e s s u r e i s l o c a t e d a t a d i s t a n c e o f H / 3
above the lower edge of the wall.
9
12

FIG. IO SHAPE OF THE SURFACE OF SLIDI'NG IF THE WALL FRICTION 8 IS POSITIVE
FIG.11 SHAPE OF THE SURFACE OF SLIDING IF THE WALL FRICTION 8 IS NEGATIVE

Deformation Requirements
The t r a n s f o r m a t i o n o f a b a c k f i l l m a t e r i a l , w h i c h i s i n i t i a l l y a t rest,
i n t o a s t a t e o f p l a s t i c e q u i l i b r i u m r e q u i r e s a d e f i n i t e amount o f l a t e r a l com-
press ion . The magni tude o f requi red deformat ion i s a f u n c t i o n o f t h e d e n s i t y
o f t h e s o i l , t h e d e v e l o p m e n t o f wall f r i c t i o n , t h e i n i t i a l s t a t e o f stress,
and t he dep th 2 be low the su r f ace .
E a r l i e r i n t h i s c h a p t e r i t was s t a t e d t h a t i f a s e m i - i n f i n i t e mass o f
s o i l i s l a t e r a l l y c o m p r e s s e d u n t i l t h e c i r c l e o f stress f o r e a c h p o i n t i n t h e
mass i s t a n g e n t t o t h e l i n e s of r u p t u r e , t h e m a s s o f s o i l i s i n a p a s s i v e
R a n k i n e s t a t e . However, when a s e m i - i n f i n i t e mass of s o i l i s s u b j e c t e d t o a
l a t e ra l compress ion p roduced by a body which h a s a f i n i t e h e i g h t , o n l y a por-
t i o n o f t h e b a c k f i l l i s t r ans fo rmed i n to a p a s s i v e R a n k i n e s t a t e . F i g u r e 1 2
shows t h e p o r t i o n .of t h e b a c k f i l l w h i c h i s t r ans fo rmed i n to a R a n k i n e s t a t e
d u e t o t h e t i l t i n g o f a s m o o t h , i n f i n i t e l y l o n g , r e t a i n i n g w a l l a b o u t i t s in-
n e r l o w e r e d g e . T h e r e m a i n i n g b a c k f i l l m a t e r i a l t h a t i s n o t l o c a t e d w i t h i n
t h e wedge, remains i n a s t a t e o f e l a s t i c e q u i l i b r i u m d u e t o t h e p r e s e n c e o f
h o r i z o n t a l s h e a r i n g stresses. These shea r ing stresses a r e d e v e l o p e d a s a
c o n s e q u e n c e o f t h e r e l a t i v e d e f o r m a t i o n t h a t t a k e s p l a c e b e t w e e n t h e s o i l lo -
cated above and below the lower edge of the wal l .
For a sand with a u n i f o r m d e n s i t y , t h e s t r a i n E ( E = AL/L, i n F i g . 12 )
r e q u i r e d t o t r a n s f e r t h e s o i l f r o m i t s o r i g i n a l s t a t e o f e l a s t i c e q u i l i b r i u m t o
a s t a t e o f p l a s t i c e q u i l i b r i u m i s approximately independent of depth 2 ~ Us-
i n g t h i s a p p r o x i m a t i o n , i t c a n b e s e e n t h a t i f t h e s m o o t h w a l l t i l t s about i t s
inner lower edge every e lement o f so i l loca ted wi th in the wedge w i l l be s imul-
t aneous ly t r ans fo rmed i n to a p a s s i v e R a n k i n e s t a t e . The b r o k e n l i n e p a s s i n g
t h r o u g h p o i n t b y F i g . 1 2 , r e p r e s e n t s t h e minimum d e f o r m a t i o n r e q u i r e d t o t r a n s -
f e r t h e wedge i n t o a s t a t e o f p l a s t i c e q u i l i b r i u m . I f t h e w a l l i s r o t a t e d be-
yond t h e b r o k e n l i n e , p l a s t i c f l o w w i l l occu r t h roughou t t he wedge.
8
14

I C .-
ELASTIC ZONE
RANKINE ZONE
FIG. 12 PORTION OF BACKFILL TRANSFORMED INTO A RANKINE STATE, DUE TO TILTING OF 4 SMOOTH, INFlNmLY LONG WALL ABOUT ITS LOWER INNER EDGE

ERRORS INVOLVED WITH APPLICATION OF PASSIVE EAR,TH-PRESSURE THEORY
The e a r t h - p r e s s u r e t h e o r i e s t h a t h a v e b e e n p r e v i o u s l y d i s c u s s e d i n -
vo lve many s impl i fy ing assumpt ions which are s e l d o m s a t i s f i e d i n t h e p h y s i c a l
w o r l d . A l t h o u g h m o r e r i g o r o u s s o l u t i o n s a r e a v a i l a b l e , t h e y a r e f a r t o o com-
p l i c a t e d t o b e u s e d i n e n g i n e e r i n g p r a c t i c e . A s a consequence o f t he complex-
i t i e s i n v o l v e d i n a p p l y i n g more r i g o r o u s s o l u t i o n s t o p r a c t i c a l p r o b l e m , t h e
s i m p l e r e a r t h - p r e s s u r e t h e o r i e s o f Coulomb and Rankine have become widely used.
Coulomb's Theory
As s t a t e d p r e v i o u s l y , C o u l o m b ' s t h e o r y o f p a s s i v e e a r t h p r e s s u r e i s
based on t h e s i m p l i f y i n g a s s u m p t i o n t h a t t h e f a i l u r e s u r f a c e i s p l ane . Th i s
assumption i s s t r i c t l y c o r r e c t o n l y i f t h e a n g l e o f w a l l f r i c t i o n i s equal to
ze ro . The deve lopmen t o f wa l l f r i c t ion causes t he l ower po r t ion o f t he f a i l -
u r e s u r f a c e t o b e c u r v e d . S i n c e C o u l o m b ' s t h e o r y i g n o r e s a n y c u r v a t u r e o f
t h e f a i l u r e s u r f a c e , t h e r e s u l t s o b t a i n e d by u s i n g t h i s t h e o r y a r e i n e r r o r .
F i g u r e 13 shows a graph that has been reproduced f rom Wu . The 11
d a s h e d l i n e s i n F i g . 13 r e p r e s e n t t h e r e l a t i o n s h i p s b e t w e e n t h e a n g l e o f w a l l
f r i c t i o n 6 a n d t h e p a s s i v e e a r t h - p r e s s u r e c o e f f i c i e n t K which was ca l cu -
la ted us ing Coulomb's theory . The s o l i d l i n e s r e p r e s e n t t h e r e l a t i o n s h i p s
t h a t e x i s t b e t w e e n 6 and K when K i s c a l c u l a t e d on t h e b a s i s o f a curved
f a i l u r e s u r f a c e . F i g u r e 13 shows t h a t f o r v a l u e s o f 6 less t h a n @ / 3 t h e
e r r o r i n v o l v e d i n u s i n g C o u l o m b ' s t h e o r y i s n e g l i g i b l e . When 6 i s l a r g e , t h e
e r r o r i n v o l v e d i n us.ing t h e same t h e o r y becomes e x c e s s i v e a n d i n some cases
may be 50 p e r c e n t o r more .
P Y
P P
5
The preceding d i scuss ion has been based upon the assumpt ion tha t the
d e f o r m a t i o n r e q u i r e d t o a t t a i n a s t a t e o f p l a s t i c e q u i l i b r i u m h a s b e e n a c h i e v e d .
In r e a l i t y , o f t e n t h e d e f o r m a t i o n r e q u i r e d t o t r a n s f e r t h e s o i l i n t o a s t a t e
o f p l a s t i c e q u i l i b r i u m i s n o t a t t a i n e d a n d i n t h e s e c a s e s t h e p r e v i o u s l y men-
t i o n e d a n d d i s c u s s e d t h e o r i - e s a r e n o t d i r e c t l y a p p l i c a b l e .
16

KP
AFTER Wu' l
FIG. 13 EFFECT OF WALL FRICTION ON THE COEFFICIENT
OF PASSIVE EARTH PRESSURE

L o g a r i t h m i c S p i r a l Method o f C a l c u l a t i n g P a s s i v e E a r t h P r e s s u r e
I f t h e v a l u e o f d e v e l o p e d w a l l f r i c t i o n 6 exceeds #/3, a method of
c a l c u l a t i o n t h a t t a k e s i n t o a c c o u n t t h e c u r v a t u r e o f t h e f a i l u r e s u r f a c e m u s t
b e u s e d t o o b t a i n a c c e p t a b l e r e s u l t s . Ohde has p roposed a method which approx-
i m a t e s t h e c u r v e d p o r t i o n o f t h e f a i l u r e s u r f a c e w i t h a l o g a r i t h m i c s p i r a l .
The e r r o r a s s o c i a t e d w i t h t h i s m e t h o d , when compared t o more r igorous methods,
is approx ima te ly 3 p e r c e n t . The equ i l ib r ium fo rces and geomet r i c p rope r t i e s
a s s o c i a t e d w i t h a l o g a r i t h m i c s p i r a l s o l u t i o n a r e shown i n F i g . 14.
8
The method c o n s i s t s o f a s s u m i n g s e v e r a l f a i l u r e s u r f a c e s a n d c a l c u -
l a t i n g t h e p a s s i v e e a r t h p r e s s u r e a s s o c i a t e d w i t h e a c h f a i l u r e s u r f a c e . The
v a l u e s o f p a s s i v e e a r t h p r e s s u r e a r e p l o t t e d a s o r d i n a t e s a b o v e t h e i r c o r r e s -
ponding d p o i n t s . The minimum p a s s i v e e a r t h p r e s s u r e i s then sca led f rom a
c u r v e p a s s i n g t h r o u g h t h e p l o t t e d p o i n t s .
T h e l o w e r p o r t i o n o f t h e f a i l u r e s u r f a c e , b e , i s r e p r e s e n t e d by a
l o g a r i t h m i c s p i r a l w i t h t h e e q u a t i o n
r = r e 8 t a n @ 0 Y
whose c e n t e r 0 i s l o c a t e d o n l i n e a f . In t h i s e q u a t i o n , r r e p r e s e n t s
t h e d i s t a n c e b e t w e e n t h e c e n t e r 0 o f t h e s p i r a l a n d t h e f a i l u r e s u r f a c e .
The a n g l e 8 i s t h e a n g l e b e t w e e n t h e i n i t i a l v e c t o r ob and any vector
w h i c h p a s s e s t h r o u g h t h e c e n t e r o f t h e s p i r a l a n d a l s o i n t e r s e c t s t h e s p i r a l
p o r t i o n o f t h e f a i l u r e s u r f a c e . T h e c u r v e d p o r t i o n o f t h e f a i l u r e s u r f a c e
becomes t a n g e n t t o t h e p l a n e p o r t i o n of t h e f a i l u r e s u r f a c e a t p o i n t e.
The p a s s i v e e a r t h p r e s s u r e i s found by summing moments a b o u t t h e
c e n t e r o f t h e l o g a r i t h m i c s p i r a l . The p a s s i v e e a r t h p r e s s u r e a c t s on t h e
w a l l a t a d i s t a n c e o f H / 3 above the base and i s expres sed by t he equa t ion
18

FIG, 14 LOGARITHMIC SPIRAL METHOD FOR DETERMINING PASSIVE EARTH PRESSURE

T h e w e i g h t a n d c e n t r o i d l o c a t i o n o f t h e body o f s o i l a b e d i s c a l c u l a t e d u s i n g
t h e g e o m e t r i c p r o p e r t i e s o f t h e l o g a r i t h m i c s p i r a l a n d i n c l u d e d t r i a n g u l a r
s e c t i o n s w h i c h a r e i l l u s t r a t e d i n F i g . 1 4 . S i n c e t h e body o f s o i l w i t h i n z o n e
aecd i s i n a Rankine s ta te , t h e s o i l i n z o n e d e c may be r ep laced by a pres-
s u r e Pde. The p r e s s u r e Pde a c t s a t a d i s t a n c e o f 1/3 de above po in t e
and i s e q u a l t o
It s h o u l d b e n o t e d t h a t Eq 10 does no t con ta in any expres s ions i nvo lv ing t he
f o r c e s a c t i n g o n t h e l o g a r i t h m i c s p i r a l p o r t i o n o f t h e f a i l u r e s u r f a c e . The
p r o p e r t i e s o f t h e s p i r a l a r e s u c h t h a t e v e r y r e s u l t a n t f o r c e t h a t a c t s o n t h e
f a i l u r e s u r f a c e p a s s e s t h r o u g h t h e c e n t e r o f t h e s p i r a l a n d t h e r e f o r e h a s a
moment arm o f ze ro l eng th .
-. . .. .. . "_ . . .. . . . . -. ".
CHAPTER I11
TESTING APPARATUS
I n t h e t e s t i n g p r o g r a m 3 d i f f e r e n t s y s t e m s o f t e s t i n g a p p a r a t u s were
d e s i g n e d a n d c o n s t r u c t e d . T h r e e s e p a r a t e p h a s e s o f t es t s were conducted us-
i ng t he appa ra tus wh ich i s d i s c u s s e d i n t h i s c h a p t e r .
I n t h e f i r s t p h a s e , f l a t s t e e l p l a t e s o f 1 2 i n . h e i g h t were p e n e t r a t e d
i n t o a d r y s a n d b a c k f i l l . P e n e t r a t i o n o f t h e p l a t e s was he ld a t a c o n s t a n t
r a t e o f 0.00278 i p s . T h i s r e l a t i v e l y low r a t e o f p e n e t r a t i o n a l l o w e d a l l
measu remen t s t o be r eco rded manua l ly . Hor i zon ta l and ve r t i ca l so i l f o rces
were measured with load ce l l s a n d t h e p l a t e p e n e t r a t i o n was measured with an
Ames d i a l g a g e .
The second phase was p e r f o r m e d u s i n g p l a t e s h a v i n g h e i g h t s o f 1 2 and
18 i n c h e s . T h e p l a t e s w e r e p e n e t r a t e d i n t o t h e b a c k f i l l i n a d i r e c t i o n l a t e r -
a l t o t h e p l a n e o f t h e p l a t e s . The r a t e o f p e n e t r a t i o n was h e l d c o n s t a n t
throughout a t es t , however, from t e s t t o tes t t h e r a t e was v a r i e d from 0.00667
t o 2 . 6 7 i p s . T h e s e h i g h e r r a t e s o f p e n e t r a t i o n n e c e s s i t a t e d t h e u s e o f an
o s c i l l o g r a p h t o r e c o r d t h e c o n t i n u o u s l o a d c e l l a n d d i s p l a c e m e n t t r a n s d u c e r
o u t p u t . The s o i l t y p e and the boundary cond i t ions were i den t i ca l t o t hose u sed
i n Phase I.
The t h i r d p h a s e c o n s i s t e d o f h o r i z o n t a l l y p e n e t r a t i n g c o n e s a n d s p h e r -
i c a l s e g m e n t s i n t o a s o i l i d e n t i c a l t o t h a t u s e d i n P h a s e s I and 11. The
r a t e s o f p e n e t r a t i o n a n d t h e r e c o r d i n g e q u i p m e n t were similar t o t h o s e u s e d
i n Phase 11. The h o r i z o n t a l s o i l f o r c e was measured with a l o a d c e l l . S t r a i n
gages, mounted on a 0 .75 i n . d i a m e t e r d r i v i n g s h a f t , w e r e u s e d t o o b t a i n t h e
v e r t i c a l s o i l f o r c e . S i n c e t h e m o d e l s were n o t i n i t i a l l y i n c o n t a c t w i t h t h e
s o i l , i t was n e c e s s a r y t o s u p p o r t t h e s a n d i n a h o r i z o n t a l d i r e c t i o n . A poly-
e t h y l e n e membrane s t r e t c h e d o v e r a removable frame was used t o con f ine t he s and
i n a h o r i z o n t a l d i r e c t i o n .
21
PHASE I APPARATUS
The a p p a r a t u s f o r P h a s e I w a s d e s i g n e d t o a l l o w t h e e a r t h - p r e s s u r e p r o b -
lem t o b e r e d u c e d t o two dimensions. It i s advantageous to reduce the p roblem
t o two d i m e n s i o n s b e c a u s e e x i s t i n g e a r t h - p r e s s u r e t h e o r i e s are a p p l i c a b l e t o
s t u d y i n g t h e f o r c e - p e n e t r a t i o n c h a r a c t e r i s t i c s o f t h e s o i l . A s i d e v i e w o f
t h e t e s t s e t u p i s shown i n F i g . 15.
P l a t e D e s i g n
Each tes t r e q u i r e d t h e u s e o f t h r e e s e p a r a t e p l a t e s . The p l a t e s were
p u s h e d s i m u l t a n e o u s l y i n a h o r i z o n t a l d i r e c t i o n . They were no t a l l owed t o
r o t a t e o r f r e e l y move i n a v e r t i c a l d i r e c t i o n . The plates were machined from
0 . 5 i n . t h i c k c o l d - r o l l e d s tee l p l a t e s t o c k , S t e e l was chosen because of i t s
h i g h f l e x u r a l r i g i d i t y a n d a l s o b e c a u s e i t provided a r e l a t i v e l y smooth contact
s u r f a c e w i t h t h e s a n d b a c k f i l l . I f t h e c o n t a c t s u r f a c e was f r i c t i o n l e s s ,
Cou lomb ' s t heo ry wou ld y i e ld nea r ly exac t r e su l t s when a p p l i e d t o t h e two d i -
mens iona l p l ane - s t r a in ea r th -p res su re p rob lem. When t h e t h r e e p l a t e s were
p l a c e d i n t h e i r t e s t p o s i t i o n , t h e y f o r m e d a w a l l 1 f t h i g h and 3 f t wide. A
p l a n v i e w o f t h e w a l l i n i t s t e s t p o s i t i o n i s shown i n F i g . 40 on p. 69.
O n l y t h e s o i l r e s p o n s e o n t h e c e n t e r p l a t e was measured. The main
f u n c t i o n o f t h e two s i d e p l a t e s was t o c o n f i n e t h e s a n d a n d t o m i n i m i z e t h r e e
d i m e n s i o n a l e f f e c t s o n t h e c e n t e r p l a t e . The o u t e r e d g e s o f t h e s i d e p l a t e s
were m i l l e d f l a t t o a l l o w a smoo th con tac t su r f ace be tween t he s ides o f t he
plywood box and t h e s i d e p l a t e s . A 90 d e g r e e a n g l e s l o t was m i l l e d i n t h e
i n n e r v e r t i c a l e d g e o f t h e s i d e p l a t e s . N i n e t y d e g r e e a n g l e s l o t s were a l s o
m i l l e d i n e a c h v e r t i c a l e d g e o f t h e c e n t e r p l a t e . When t h e t h r e e p l a t e s were
p l a c e d i n t h e i r t e s t p o s i t i o n , t h e s l o t s p r o v i d e d a n o p e n i n g b e t w e e n t h e c e n t e r
p l a t e a n d e a c h o f t h e s i d e p l a t e s . F l e x i b l e r u b b e r t u b i n g h a v i n g a n o u t s i d e
22

FIG. I5 SIDE VIEW OF THE TEST SETUP USED DURING PHASE I

d i a m e t e r o f 0 .5 in . and a w a l l t h i c k n e s s o f 0.125 i n . was i n s e r t e d i n t h e open-
i n g . D e t a i l s o f t h e p l a t e s a r e shown i n F i g s . 16 and 1 7 . The r u b b e r t u b i n g
a c t e d a s a f l e x i b l e c o n n e c t i o n , w h i c h s e r v e d t o m i n i m i z e l o a d t r a n s f e r a n d s a n d
l e a k a g e b e t w e e n t h e c e n t e r a n d s i d e p l a t e s . P e t r o l a t u m was a l s o a p p l i e d t o t h e
t u b i n g t o f u r t h e r r e d u c e s a n d l e a k a g e d u r i n g t h e t e s t . The chief purpose of
t he above des ign was t o s i m u l a t e t h e b o u n d a r y c o n d i t i o n s t h a t e x i s t i n a n i n -
f i n i t e l y l o n g 1 f t h i g h r e t a i n i n g w a l l . T h e c e n t e r p l a t e r e p r e s e n t e d a 1 f t
w i d e s e c t i o n c u t f r o m a n i n f i n i t e l y l o n g w a l l .
T h r e e s q u a r e s l o t s w e r e m i l l e d i n t h e r e a r f a c e o f t h e c e n t e r p l a t e
and o i l ha rdened p rec i s ion g round t oo l s t ee l i n s e r t s w e r e c e m e n t e d i n t h e s l o t s
w i th Epoxy. The hardened s t ee l i n s e r t s were i n t e n d e d t o m i n i m i z e f r i c t i o n
b e t w e e n t h e b u t t o n s o n t h e l o a d c e l l s a n d t h e c e n t e r p l a t e . Two eye bo l t s were
t h r e a d e d i n t o t h e t o p h o r i z o n t a l e d g e o f each o f t h e p l a t e s . The eye bol t
connec t ions and coun te rba lance we igh t s a r e shown i n F i g . 18.
A s t h e p l a t e s p e n e t r a t e d i n t o t h e s o i l , t h e e a r t h p r e s s u r e o n t h e s i d e s
of the sandbox increased . This caused a gap to open be tween t he s ides o f t he
box and the ou te r edges o f t he s ide p l a t e s and t he gap a l lowed s and t o f l ow
t h r o u g h . T h e r e b y c r e a t i n g u n d e s i r a b l e e x p a n s i o n s o f t h e s o i l mass which occur
i n a d i r e c t i o n p a r a l l e l t o t h e p l a n e o f t h e p l a t e s . To s t o p t h i s f l o w , a d d i -
t i o n a l t i e rods were added to the box and aluminum angles, 1.0 i n . by 0 . 7 i n . ,
hav ing a t h i c k n e s s o f 0.3125 i n . w e r e t a p e d t o t h e f r o n t f a c e s o f t h e s i d e
p l a t e s . The 0 . 7 i n . l e g o f t h e a n g l e r e s t e d a g a i n s t t h e p l a t e and t h e 1 , O i n .
l e g r e s t e d a g a i n s t t h e s i d e o f t h e box. Pe t ro l a tum was a l s o placed between
t h e a n g l e s a n d t h e s i d e s o f t h e box.
Load Ce l l Supports and Locat ions
Four load ce l l s were used t o measu re t he fo rces exe r t ed by the s and
b a c k f i l l on t h e c e n t e r p l a t e . T h r e e o f t h e l o a d c e l l s were u t i l i z e d t o m e a s u r e
24

AN 9
G LE
" " " - - - - - DRILLED AND TAPPED HARDENED
STEEL INSERTS
U
4-
FIG.16 CENTER PLATE DESIGN - PHASE I
' I 5 1514
L """""_
T HOLE FOR 10-24 DRILLED AND TAPPED
4.05 "
1 - -+
FIG.17 SIDE PLATE DESIGN- PHASE I
26

Fig. 18 View of Eye Bolt Connections and Plate Counterbalance Weights - Phase I
27
---~ --------------- ------------ -------------------------~---------------------- ---------------"

the h o r i z o n t a l s o i l f o r c e a n d t h e r e m a i n i n g c e l l measured the net upward f r ic-
t i o n a l f o r c e o n t h e c e n t e r p l a t e . The n e t f r i c t i o n a l f o r c e i s t h e a l g e b r a i c
sum o f t h e f o r c e a t t h e s o i l - p l a t e i n t e r f a c e a n d t h e f r i c t i o n a l f o r c e s b e t w e e n
t h e l o a d - c e l l b u t t o n s a n d t h e rear f a c e o f t h e p l a t e . T h e n e t f r i c t i o n a l f o r c e
i s a m e a s u r e o f t h e v e r t i c a l s o i l f o r c e o n t h e c e n t e r p l a t e . The l o c a t i o n o f
t h e p o i n t s a t w h i c h t h e t h r e e l o a d c e l l s c o n t a c t e d t h e rear s i d e o f t h e c e n t e r
p l a t e are shown by + s i g n s i n F i g . 16. The load ce l l tha t measured a p o r t i o n
o f t h e v e r t i c a l s o i l f o r c e c o n t a c t e d t h e c e n t e ' r o f t h e u p p e r e d g e o f t h e c e n -
t e r p l a t e .
The c e l l s t h a t m e a s u r e d t h e h o r i z o n t a l s o i l f o r c e w e r e h e l d i n p o s i -
t i o n by Plex ig las mount ings which were i n t u r n f a s t e n e d t o a 0 . 5 i n . t h i c k
aluminum s u p p o r t p l a t e . The aluminum p l a t e was b o l t e d t o o n e f l a n g e o f t he
3 i n . by 2 .375 i n . s t ee l I -beam shown i n F i g , 15. The general arrangement of
l o a d c e l l s a n d t h e s u p p o r t p l a t e s w i l l b e d i s c u s s e d f u r t h e r i n t h e P h a s e I1
Appara tus Sec t ion o f t h i s c h a p t e r . E a c h o f t h e s i d e s u p p o r t p l a t e s c o n t a i n e d
w i n g b o l t s f o r a l i g n m e n t o f t h e s i d e p l a t e s w i t h t h e c e n t e r p l a t e .
Loading System
The f o r c e n e c e s s a r y t o p u s h t h e p l a t e s i n t o t h e s o i l was fu rn i shed by
a screw jack. The screw jack was powered by a s i n g l e - p h a s e 4 . 3 3 HP motor
t h a t o p e r a t e d a t 1 7 2 5 RPM. The j ack pushed t he p l a t e s and l oad ing f r ame a t
a c o n s t a n t r a t e o f 0 . 0 0 2 7 8 i p s .
I n s t rumen ta t ion
The b a s i c e l e c t r i c a l components tha t were u t i l i zed dur ing the Phase I
t e s t i n g p r o g r a m c o n s i s t e d o f a s t r a i n i n d i c a t o r , s w i t c h a n d b a l a n c e u n i t , a n d
5 l o a d c e l l s . The s t r a i n i n d i c a t o r and swi tch and ba lance un i t , Model Numbers
P-350 and SB-1 , r e s p e c t i v e l y , w e r e b u i l t by Budd Ins t rumen t s D iv i s ion . A
b lock d i ag ram o f t he fo rce measu remen t c i r cu i t i s shown i n F i g . 19 .
28

1
t LOAD CELLS STRAIN
BALANCE UNlT INDICATOR SWITCH AND
i
CENTER SUPPORT PLATE
TEMPERATURE COMPENSATION LOAD CELL
FIG. 19 BLOCK DIAGRAM OF FORCE MEASUREMENT CIRCUIT - PHASE I

Force Measurement
The purpose of Phase I was t o o b t a i n f o r c e - p e n e t r a t i o n c u r v e s f o r a
r i g i d wal l p e n e t r a t i n g i n t o c o h e s i o n l e s s s o i l i n a h o r i z o n t a l d i r e c t i o n .
Load c e l l s were used to measure the force which var ied be tween 5 and 800 pounds.
The c e l l s c o n s i s t e d o f two ha lves . The bo t tom ha l f p rovided a b a s e f o r t h e t o p
h a l f a n d a n o u t l e t f o r s t r a i n g a g e wire l e a d s . T h e t o p h a l f c o n s i s t e d o f a
0.130 in . th ick diaphragm upon which an S R - 4 s p i r a l s t r a i n g a g e was bonded
wi th Epoxy- 150 cement. The s t r a i n g a g e s were o f t h e f o i l t y p e and were
manufactured by the Baldwin-Lima-Hamil ton Electronics Divis ion. The r e s i s t a n c e
of the gages were 120.0 2 0 . 2 ohms and the gage fac tors were 2 . 0 . A t y p i c a l
l o a d c e l l i s shown i n F i g . 20.
T h e l o a d c e l l s w e r e c a l i b r a t e d u s i n g a Model ULH-60 Unive r sa l Test-
ing Machine bu i l t by the Budd Ins t ruments Div is ion . A Budd s t r a i n i n d i c a t o r
t h a t p e r m i t t e d s t r a i n s t o b e r e c o r d e d t o t h e n e a r e s t m i c r o i n c h was a l so used
i n t h e c a l i b r a t i o n p r o c e d u r e . D u r i n g c a l i b r a t i o n e a c h c e l l was connected
i n a q u a r t e r b r i d g e w i t h a temperature compensat ing gage. Several loading
and un loading cyc les were per formed on each load ce l l wi th readings be ing taken
from 0 t o 1,000 lbs and from 1,000 l b s t o 0 pounds . The ca l ibra t ion curves
f o r a l l t h e l o a d c e l l s w e r e f o u n d t o b e l i n e a r , w i t h t h e u n l o a d i n g c u r v e r e -
t r a c i n g t h e p a t h o f t h e l o a d i n g c u r v e . The l o a d c e l l s h a d s e n s i t i v i t i e s t h a t
ranged from 0.64 t o 1 . 2 7 l b s p e r m i c r o i n c h .
P e n e t r a t i o n Measurement
The p e n e t r a t i o n o f t h e t o p e d g e o f t h e c e n t e r p l a t e , w h i c h i s i d e n t i -
c a l t o t h e p e n e t r a t i o n o f t h e b o t t o m e d g e o f t h e p l a t e , was measured with an
Ames d i a l g a g e t h a t c o u l d b e r e a d t o t h e n e a r e s t 0.001 inch . The procedure
u s e d i n r e a d i n g t h e d i a l g a g e a n d s t r a i n i n d i c a t o r i s g i v e n i n C h a p t e r I V on
p. 52 .

LOAD CELL-TOP HALF SECTION
k- 1.0 +
, 2.0" + LOAD CELL - BOTTOM HALF SECTION
4 0.3"
FIG. 20 DETAILS OF TYPICAL LOAD CELL

PHASE I1 APPARATUS
D u r i n g t h e f i r s t p h a s e o f t e s t i n g , some u n d e s i r a b l e f e a t u r e s were noted
i n t h e d e s i g n o f t h e t e s t i n g a p p a r a t u s . T h e f o r e m o s t l i m i t a t i o n i n t h e a p p a r a -
t u s was t h e t y p e o f r e s t r a i n t u s e d t o p r o h i b i t v e r t i c a l movement o f t h e l o a d i n g
frame. A s t h e p l a t e s p e n e t r a t e d i n t o t h e b a c k f i l l , a n upward f r i c t i o n a l f o r c e
was developed a t t h e s o i l - w a l l i n t e r f a c e a n d t h e upward f o r c e was i n t u r n
t r a n s f e r r e d t o t h e l o a d i n g f r a m e . A 2 i n . by 6 in . boa rd was f a s t e n e d t o t h e
sandbox s o t h a t t h e l o w e r e d g e o f t h e b o a r d c o n t a c t e d t h e c e n t e r s t e e l p i p e
p o r t i o n o f t h e l o a d i n g f r a m e . T h i s t y p e o f r e s t r a i n t p r o v e d t o b e u n s a t i s -
f a c t o r y b e c a u s e i t d i d n o t t o t a l l y e l i m i n a t e t h e upward movement o f t he l oad -
ing f r ame and p l a t e s .
A n o t h e r f e a t u r e o f t h e d e s i g n w h i c h was u n f a v o r a b l e t o P h a s e I1 t es t -
i n g c o n d i t i o n s , was t h e method used t o c o u n t e r b a l a n c e t h e w e i g h t s o f t h e
p l a t e s . It shou ld be no ted t ha t t h i s me thod was s a t i s f a c t o r y f o r P h a s e I;
however , for Phase I1 i t was n o t s a t i s f a c t o r y b e c a u s e t h e h i g h e r r a t e s o f
pene t r a t ion caused t he we igh t s t o swing .
Af t e r cons ide r ing t he l imi t a t ions men t ioned above and a l so t ha t
g rea t e r fo rces wou ld be deve loped du r ing Phase 11, s i n c e h i g h e r p l a t e s would
be u sed , i t was d e c i d e d t o r e d e s i g n t h e t e s t i n g a p p a r a t u s . A General V i e w o f
t h e Tes t Se tup €o r Phase I1 i s shown i n F i g . 21.
P l a t e D e s i g n
D u r i n g t h i s p h a s e o f t e s t i n g , p l a t e s 1 2 in . wide by 1 2 i n . h igh and
12 in . wide by 18 i n . h i g h were used . F igures 23 through 2ti i l l u s t r a t e t h e
p l a t e d e s i g n s . The b a s i c d i f f e r e n c e s b e t w e e n t h e s e p l a t e s a n d t h o s e u s e d
i n P h a s e I a re t h a t no ha rdened i n se r t s were u s e d i n t h e c e n t e r p l a t e s and
e a c h o f t h e s i d e p l a t e s h a d a n u t w e l d e d t o t h e rear f a c e .
32

Fig. 21 A General View of Test Equipment - Phase II
Fig. 22 View of Loading Frame and Plate Supports -Phase II
33

"- "" -t-
'DRILLED AND TAPPED HOLE FOR 10 -24
i;- "- """" I 1/32 - -
4 "L1 I"
m
c
FIG.23 CENTER PLATE DESIGN, 12 IN. X 12 IN. - PHASE R
34

I
DRILLED AND TAPPED
5/8" HEXAGONAL NUT
)-
FIG. 24 SIDE PLATE DESIGN, I2 IN. X 12 IN. - PHASE 11
35
C
12" II """" """"" +
." . - -J _t- I 7/8" "+" I
t-
I 7/8"
Y=r DRILLED AND TAPPED HOLE FOR 10-24
t - I 1/32" _t
- 8 V8" 4
FIG.25 CENTER PLATE DESIGN, 12
18 'I
IN. X
L 1 3 7 4 1
18 IN. - PHASE II
""""""""".
W8"HEXAGONAL NUT w 1 5 w; DRILLED AND TAPPED
I HOLE FOR 10-24
II I 15A6"
FIG.26 SIDE PLATE DESIGN, 12 IN. X I6 IN.- PHASE IL
37

S e v e r a l tests were p e r f o r m e d t o d e t e r m i n e t h e c o e f f i c i e n t o f f r i c t i o n
between a l o a d - c e l l b u t t o n a n d a hardened s teel i n s e r t . The c o e f f i c i e n t o f
f r i c t i o n was found to be 0.10. S e v e r a l t e s t s were a l so pe r fo rmed u s ing s t ee l
i d e n t i c a l t o t h a t f r o m w h i c h t h e p l a t e s were made, i n s t e a d o f t h e i n s e r t s t ee l ,
and i t was f o u n d t h a t t h e r e was no m e a s u r a b l e d i f f e r e n c e f o r t h e d e v e l o p e d
r a n g e o f t e s t i n g p r e s s u r e s . T h e r e f o r e , i t was concluded tha t the hardened
s t ee l in se r t s were unnecessa ry .
The n u t t h a t was w e l d e d t o t h e r e a r f a c e o f e a c h o f t h e s i d e p l a t e s
provided a means o f f a s t e n i n g t h e p l a t e s t o t h e aluminum s u p p o r t p l a t e s .
I n s t e a d o f u s ing coun te rba lance we igh t s a s were u sed in Phase I , t h e
plates were each hung by two b o l t s t h a t were i n t u r n s u p p o r t e d by ang le s
t h a t w e r e b o l t e d t o t h e aluminum s u p p o r t p l a t e s . The method used t o s u p p o r t
t h e p l a t e s i s shown i n F i g . 22 . Wing b o l t s were u s e d a s s p a c e r s f o r t h e s i d e
p l a t e s . The two b o l t s t h a t s u p p o r t e d t h e c e n t e r p l a t e p a s s e d t h r o u g h h o l e s
tha t were l a rge r t han t he shank bu t sma l l e r t han t he head o f t he bo l t . The
p l a t e was f r e e t o r e a c t a g a i n s t t h e s i n g l e l o a d c e l l when t h e f r i c t i o n a l
f o r c e a t t h e i n t e r f a c e o f t h e s o i l a n d t h e c e n t e r p l a t e r e a c h e d a v a l u e e q u a l
t o t h e w e i g h t o f t h e p l a t e p l u s t h e f r i c t i o n a l f o r c e d e v e l o p e d b e t w e e n t h e
t h r e e l o a d c e l l s a n d t h e r e a r f a c e o f t h e p l a t e .
Load-Cell Supports and Locations
The l o a d - c e l l s u p p o r t s y s t e m u t i l i z e d d u r i n g t h i s p h a s e o f t e s t i n g was
s i m i l a r t o t h a t u s e d i n P h a s e I. I n t h i s s y s t e m t h e aluminum s u p p o r t p l a t e s
were connec ted toge ther by a s e c t i o n o f 4 i n . by 4 i n . s t r u c t u r a l t u b i n g w i t h a
w a l l t h i c k n e s s o f 0.375 inches . The loading f rame and the method of res t ra in t
t h a t was used to keep the f rame f rom moving in an upward d i r e c t i o n i s shown i n
F ig . 27 .

T h e p o s i t i o n s a t w h i c h t h e l o a d c e l l s c o n t a c t e d t h e b a c k f a c e o f t h e
c e n t e r p l a t e s a r e shown by + s i g n s i n F i g s . 23 and 25.
Loading Sys tem
A c losed l oop s e rvo l oad ing sys t em, Model 900.62, manufactured by
Research Incorpora ted , Minneapol i s , Minnesota , was u s e d t o f u r n i s h t h e n e c e s -
s a r y h o r i z o n t a l t h r u s t . The s y s tern b a s i c a l l y c o n s i s t e d o f a h y d r a u l i c a c t u -
a t o r , h y d r a u l i c power supply, and a c o n t r o l c o n s o l e .
The h y d r a u l i c a c t u a t o r a s s e m b l y c o n s i s t e d o f a h y d r a u l i c c y l i n d e r , a n
aluminum manifold and an e lectrohydraul ic servo valve. The servo valve con-
t r o l l e d t h e f l o w o f f l u i d t o a n d f r o m t h e c y l i n d e r i n p r o p o r t i o n t o t h e p o l a r -
i t y a n d a m p l i t u d e o f t h e e l e c t r i c a l s i g n a l f r o m t h e e l e c t r o n i c c o n t r o l l e r .
The a c t u a t o r was capable o f deve loping 10,000 l b s and had a s t r o k e l e n g t h o f
10 inches .
The h y d r a u l i c power supp ly was c a p a b l e o f d e l i v e r i n g f l u i d f l o w s a t
a n a v e r a g e r a t e o f 5 gpm under a maximum p r e s s u r e o f 3000 p s i . The maximum
s t r o k i n g s p e e d o f t h e h y d r a u l i c c y l i n d e r was 4 i p s .
The c o n t r o l c o n s o l e was composed of a S e r v a c , c o n t r o l p a n e l , c o u n t e r
panel, and Data-Trak system. The Data-Trak provided a means o f programming
t h e h y d r a u l i c c y l i n d e r t o move a t a p r e d e t e r m i n e d r a t e . T h e d e s i r e d r a t e was
ob ta ined by e t ch ing a curve on a spec ia l p rogram char t which was i n t u r n mount-
ed on the program drum i n t h e D a t a - T r a k . The s lope o f t he cu rve and t he speed
a t which the drum r e v o l v e d s e t t h e r a t e a t w h i c h t h e h y d r a u l i c c y l i n d e r moved.
The Servac i s a s o l i d - s t a t e e l e c t r o n i c s e r v o c o n t r o l l e r t h a t was u s e d t o con-
t r o l t h e v e l o c i t y o f t h e h y d r a u l i c c y l i n d e r . The Servac rece ived two s i g n a l s :
(1) the des i red (programmed) s igna l which represented the condi t ion o f t h e
c o n t r o l l e d v a r i a b l e ( v e l o c i t y ) , and (2) t h e e x i s t i n g s i g n a l t h a t r e p r e s e n t e d
39

40
Fig. 27 Detail View of Loading Frame Restraint and Deflection Transducer Mountings
'--- '---

t h e a c t u a l c o n d i t i o n o f t h e c o n t r o l l e d v a r i a b l e . T h e s e a r e t h e c o m p o s i t e com-
mand a n d t h e t r a n s d u c e r f e e d b a c k s i g n a l s , r e s p e c t i v e l y . The f eedback s igna l
was produced by a r e c t i l i n e a r p o t e n t i o m e t e r t h a t m e a s u r e d t h e d i s p l a c e m e n t o f
t h e h y d r a u l i c c y l i n d e r . The Servac compares the composi te command s igna l and
t h e p o t e n t i o m e t e r s i g n a l , i f t h e s i g n a l s do no t ag ree t he Se rvac s ends a s i g n a l
t o t hease rvo va lve wh ich causes i t to r ead jus t and b r ing t he sys t em back i n to
e q u i l i b r i u m .
The complete loading system is shown i n F i g . 2 1 on p. 33.
I n s t r u m e n t a t i o n
The b a s i c e l e c t r i c a l componen t s u sed t o ob ta in fo rce -pene t r a t ion cu rves ,
c o n s i s t e d o f l o a d c e l l s , d i s p l a c e m e n t t r a n s d u c e r s , a b a l a n c i n g and c a l i b r a t i o n
u n i t , a m p l i f i e r s , a n d a n o s c i l l o g r a p h . A l l of t h e e x t e r n a l e l e c t r i c a l w i r i n g
was s h i e l d e d t o p r e v e n t d i s t o r t i o n o f t h e o s c i l l o g r a p h r e c o r d . A block diagram
o f t h e i n s t r u m e n t a t i o n s e t u p i s shown i n F i g . 28.
Force Measurement
The h o r i z o n t a l a n d v e r t i c a l s o i l r e a c t i o n o n t h e c e n t e r p l a t e was meas-
u red u s ing t he same l o a d c e l l s t h a t w e r e u t i l i z e d i n Phase I.
Penetrat ion Measurement
The p e n e t r a t i o n o f t h e p l a t e s was measured by two types of d i s p l a c e -
ment t r a n s d u c e r s : ( 1 ) l i n e a r v a r i a b l e d i f f e r e n t i a l t r a n s f o r m e r (LVDT), and
( 2 ) r e c t i l i n e a r p o t e n t i o m e t e r . I t was necessa ry t o u se t hese two types o f
t r a n s d u c e r s t o o b t a i n a c c u r a t e m e a s u r e m e n t s d u r i n g a l l p h a s e s o f p e n e t r a t i o n .
When the s and was p l a c e d i n i t s d e n s e s t s t a t e , t h e u l t i m a t e h o r i z o n t a l
l o a d o c c u r r e d w e l l w i t h i n t h e f i r s t 0 .5 i n . o f p e n e t r a t i o n . T h e s e r e l a t i v e l y
s m a l l p e n e t r a t i o n v a l u e s w e r e r e c o r d e d u s i n g a n LVDT t h a t h a d a maximum t r a v e l
41

, ___i
LOA D TRANSDUCERS CALIDRATION AND BALAWL UNIT
'
J
1 RECTlLl NEAR POTENTIO- METER r L
RECORDING OSCl LLOGRAPH
FIG. 28 BLOCK DIAGRAM OF INSTRUMENTATION SETUP -PHASE X
42

o f ? 0.5 in . and a maximum n o n l i n e a r i t y o f 0.5 p e r c e n t o f the f u l l - s c a l e
v o l t a g e . The t r a n s d u c e r , Model 24DCDT-550, was b u i l t by Sanborn, a d i v i s i o n
of Hewlett-Packard, Waltham, Massachusetts.
A r e c t i l i n e a r p o t e n t i o m e t e r was u t i l i z e d t o m e a s u r e p e n e t r a t i o n s g r e a t e r
t h a n 0 . 5 i n c h e s . It was t h i s t r a n s d u c e r t h a t p r o v i d e d t h e f e e d b a c k s i g n a l t o
the Servac . When t h e b a c k f i l l was p l a c e d i n i t s l o o s e s t s t a t e , p e n e t r a t i o n s
less t h a n 0 . 5 i n . were n o t n e a r l y so s i g n i f i c a n t a n d i n t h e s e tes ts o n l y t h e
r e c t i l i n e a r p o t e n t i o m e t e r was used. The t ransducer had a maximum t r a v e l o f
7 . 0 in . and a maximum n o n l i n e a r i t y o f 0 . 1 p e r c e n t o f t h e f u l l - s c a l e r e s i s t a n c e .
The t r a n s d u c e r , Model L.C.-750, was manufactured by Topp I n d u s t r i e s , I n c o r p o -
r a t e d , Los Angeles, 4 5 , C a l i f o r n i a .
Ba lanc ing and Ca l ib ra t ion Un i t
Due t o t h e p h y s i c a l c h a r a c t e r i s t i c s o f t h e s y s t e m , e a c h r e c o r d i n g
channe l exh ib i t ed a d i f f e r e n t r e s i s t a n c e . The b a l a n c i n g u n i t a l l o w e d t h e s e
r e s i s t a n c e s t o be balanced and thereby made i t p o s s i b l e f o r a l l t h e t r a c e s
t o b e p o s i t i o n e d o n t h e o s c i l l o g r a p h .
To o b t a i n a c o n t i n u o u s r e c o r d o f t h e s t r a i n s t h a t o c c u r r e d i n t h e l o a d
c e l l s , i t was n e c e s s a r y t o p r o v i d e a method o f o b t a i n i n g c a l i b r a t i o n c u r v e s
f o r e a c h o f t h e t r a c e s r e c o r d e d by t h e o s c i l l o g r a p h . T h i s was accomplished by
a u n i t t h a t p e r m i t t e d known r e s i s t a n c e s t o b e s w i t c h e d i n t o t h e e l e c t r i c a l c i r -
c u i t w h i c h c o n n e c t e d t h e l o a d c e l l s w i t h t h e r e c o r d i n g o s c i l l o g r a p h . C a l i -
b r a t i o n c u r v e s f o r . t h e d i s p l a c e m e n t t r a n s d u c e r s were obtained by moving each
t r ansduce r sha f t t h rough known d i s t a n c e s and r e c o r d i n g t h e c o r r e s p o n d i n g t r a c e
d e f l e c t i o n s t h a t o c c u r r e d .
43

Ampl i f i e r s
The e l e c t r i c a l s i g n a l s f rom the load ce l l s and displacement t rans-
duce r s were ampl i f i ed by Redcor 361404 D i f f e r e n t i a l DC Ampl i f i e r s . The ampli-
f i e r s p e r m i t t e d t h e v o l t a g e g a i n t o b e v a r i e d f r o m 10 t o 1,000 and t h e i r band-
width was 100 k i l o c y c l e s .
Record ing Osc i l lograph
The ou tput f rom the load ce l l s and t ransducers was recorded on a
Type 5-124 Recording Osci l lograph, manufactured by Consol idated Electrodynamics,
P a s a d e n a , C a l i f o r n i a . The o s c i l l o g r a p h u t i l i z e d l i g h t beam galvanometers , 0 t o
500 cps bandwid th , t ha t r eco rded t he ou tpu t f rom each t r ace on l i g h t s e n s i t i v e
paper
PHASE I11 APPARATUS
Th i s phase o f t e s t ing cons i s t ed o f pene t r a t ing sphe r i ca l s egmen t s and
cones through a f l e x i b l e membrane i n t o a s a n d b a c k f i l l . F i g u r e s 29 through 33
show the models and the t e s t s e t u p t h a t was u s e d i n t h i s p h a s e o f t e s t i n g .
Model Design
The p r imary pu rpose o f t h i s phase o f t he i nves t iga t ion was t o d e t e r -
m i n e t h e s o i l r e s p o n s e t o p e n e t r a t i n g b o d i e s o f d i f f e r e n t s i z e s a n d g e o m e t r i c
p r o p e r t i e s .
I t was dec ided to use model s i z e s t h a t c o u l d b e c o n v e n i e n t l y u t i l i z e d
i n a l a b o r a t o r y test se tup . Sphe r i ca l s egmen t s and r i gh t - c i r cu la r cones were
chosen because these bas ic geometr ic shapes approximate the shapes o f l anding
g e a r u s e d i n t h e U n i t e d S t a t e s ' s p a c e e x p l o r a t i o n p r o g r a m .
The s p h e r i c a l s e g m e n t s h a d r a d i i o f 2 .5 and 5.0 i n c h e s . The cones
had a 60 degree apex angle and base d iameters o f 3.54 and 7.08 i nches .
44

Drawings o f the smal l models a re shown i n F i g s . 29 and 30. The la rger models
are s i m i l a r t o t h e s m a l l e r m o d e l s a n d , t h e r e f o r e , a r e n o t shown.
L a t e r a l S o i l S u p p o r t
D u r i n g t h e f i r s t two p h a s e s o f t e s t i n g , l a t e r a l s u p p o r t o f t h e back-
f i l l p r i o r t o and dur ing each t e s t was n o t a problem. The t h i r d p h a s e o f test-
i n g , h o w e v e r , n e c e s s i t a t e d t h e d e s i g n o f a p p a r a t u s t h a t would l a t e r a l l y sup-
p o r t t h e b a c k f i l l a n d a t the same time p e r m i t t h e m o d e l s t o p e n e t r a t e i n t o t h e
s o i l . T h e s e r e q u i r e m e n t s were f u l f i l l e d by c o n s t r u c t i n g a wooden frame which
con ta ined a c i r c u l a r o p e n i n g 8 . 7 i n . i n d i a m e t e r . P o l y e t h y l e n e , h a v i n g a
t h i c k n e s s o f 1 nun, was s t r e t c h e d o v e r t h e o p e n i n g and a t t a c h e d t o t h e f r a m e .
S e v e r a l t e s t s were run t o de t e rmine t he fo rces deve loped a s a consequence of
t h e model p i e r c i n g t h e membrane. The f i n d i n g s from t h e s e t e s t s showed t h a t
t h e p i e r c i n g f o r c e s w e r e n e g l i g i b l e . T h e r e was no loss of sand th rough the
punctured membrane u n t i l t h e p e n e t r a t i o n e x c e e d e d t h e h e i g h t o f t h e m o d e l .
When tes ts were c o n d u c t e d t h a t u t i l i z e d t h e 5.0 in . d i a sphe r i ca l s egmen t and
t h e 3 . 5 4 i n . d i a c o n e , a 0.8 i n . t h i c k wooden r i n g was i n s e r t e d i n t h e c i r c u -
l a r f r ame open ing , t hus r educ ing t he d i ame te r o f t he open ing t o 7 .0 inches .
The frame was c o n s t r u c t e d s o i t c o u l d e a s i l y b e removed from t h e w a l l of t h e
sandbox when i t was n e c e s s a r y t o r e p l a c e a punctured membrane. The wooden
f r ame w i th an a t t ached membrane i s shown i n F i g . 31.
Loading Sys tern
The f o r c e n e c e s s a r y t o p u s h t h e m o d e l s i n t o t h e b a c k f i l l was f u r n i s h e d
by t h e same c losed l oop s e rvo l oad ing sys t em used i n Phase 11. The l o a d i n g
sha f t t o wh ich t he mode l s were connected was r e s t r a i n e d f r o m m o v i n g i n a n up-
w a r d d i r e c t i o n by t h e same r e s t r a i n t a p p a r a t u s t h a t was u s e d i n P h a s e 11.
45

FIG.29 ALUMINUM RIGHT- CIRCULAR CONE =SIGN-PHASE m
FIG.30 ALUMINUM SPHERICAL SEGMENT ESIGN -PHASE m
46

r
Fig. 31 View of Models, Sampling Tubes, and Lateral Soil Support - Phase III
Fig. 32 Rear View of Instrumented Shaft and Spherical Segment in Initial Test Position - Phase III

I n s t r u m e n t a t i o n
The e l e c t r i c a l i n s t r u m e n t a t i o n c o n s i s t e d o f a l o a d c e l l , displacement
t ransducer , bonded s t ra in gages , and the same a u x i l i a r y r e c o r d i n g e q u i p m e n t
t h a t was used i n Phase 11.
Force Measurements
The h o r i z o n t a l s o i l r e s p o n s e p r o d u c e d by t h e p e n e t r a t i o n o f t h e m o d e l s
i n t o t h e b a c k f i l l was measured using a l o a d c e l l . F i g u r e 33 i l l u s t r a t e s t h e
p o s i t i o n o f t h e l o a d c e l l . T h i s f i g u r e shows t h a t o n l y t h e t o p h a l f o f t h e
l o a d c e l l was u s e d s i n c e t h e b a s e o f t h e model a l s o s e r v e d a s a b a s e f o r t h e
c e l l . T h e t o p h a l f o f t h e c e l l i s i d e n t i c a l t o t h e t o p h a l f o f t h e t y p i c a l
l o a d c e l l shown i n F i g . 20, w i t h t h e e x c e p t i o n o f t h e d i f f e r e n c e s i n t h e c e l l
bu t tons .
S e v e r a l tes ts were conduc ted t o de t e rmine t he amount o f f r i c t i o n
developed between the 0.75 i n . d i a s h a f t a n d t h e two sets o f b a l l b e a r i n g s
which were mounted i n t h e s h a f t h o u s i n g . In a l l tests t h e amount o f f r i c t i o n
was n e g l i g i b l e .
The s h a f t h o u s i n g was designed s o i t could be used , wi thout modi f ica-
t i o n , f o r a l l model t e s t i n g .
To o b t a i n a m e a s u r e o f t h e r e s u l t a n t v e r t i c a l s o i l r e s p o n s e , f o u r
equa l ly spaced SR-4 f o i l s t r a i n g a g e s were mounted on the c i rcumference o f
t h e 0 .75 i n . d i a s h a f t . C a l i b r a t i o n c u r v e s f o r t h e f o u r g a g e s were ob ta ined
by a p p l y i n g l o a d s i n d d i r e c t i o n n o r m a l t o t h e a x i s o f t h e s h a f t a n d r e c o r d i n g
t h e r e s u l t i n g s t r a i n s . A n o t h e r se t o f c a l i b r a t i o n c u r v e s was o b t a i n e d by sub-
j e c t i n g t h e s h a f t t o a x i a l c o m p r e s s i o n l o a d s . I n e v e r y c a s e t h e c a l i b r a t i o n
curves were f o u n d t o b e l i n e a r . To i n c r e a s e t h e s t r a i n g a g e o u t p u t s , a 0 .5 i n .
d i a , 4.25 i n . d e e p h o l e was m i l l e d i n one end o f t he sha f t .
48

BONDED SR-4 STRAIN GAGES
3.54 DIA. ALUMINUM CONE
PLEXIGLAS MOUNTING FOR UlAD-CELL LEADS I
SHAFT CLAMP
75" DIA. CASE HARDENED STEEL
LOAD CELL SHAFT HOUSING
FIG.33 DETAIL VElW OF MODEL PENETRATION ASSEMBLY - PHASE IU

.... .. , , .. .. .... .. - - -
Penet ra t ion Measurements
The model p e n e t r a t i o n was measured us ing the same r e c t i l i n e a r p o t e n -
t i o m e t e r t h a t was u t i l i z e d i n P h a s e 11. The d i sp l acemen t t r ansduce r was mount-
e d o n t h e h y d r a u l i c a c t u a t o r c a s i n g a n d t h e t r a n s d u c e r s h a f t was connected to
t h e a c t u a t o r ' s c y l i n d e r . The l o c a t i o n o f the t r ansduce r and t he moun t ing con-
n e c t i o n was i d e n t i c a l t o t h e a r r a n g e m e n t shown i n F i g . 27. The d i s t a n c e be-
tween the point o f measurement and the base of t h e model was approximately
4 f e e t . The d isp lacement recorded f rom the t ransducer was assumed to be equa l
t o t h e p e n e t r a t i o n o f t h e model. The e r r o r i n v o l v e d i n t h i s a s s u m p t i o n is neg-
l i g i b l e , s i n c e t h e maximum e l a s t i c s h o r t e n i n g o f t h e 4 f t . s e c t i o n of seamless
p i p e a n d s t e e l s h a f t was l e s s t han 0 .001 i nches .

CHAPTER I V
TEST PROCEDURES AND DATA REDUCTION
The t e s t i n g p r o g r a m was composed o f t h ree s epa ra t e phases . A l though
e a c h p h a s e o f t e s t i n g was d i f f e r e n t f r o m t h e s t a n d p o i n t o f s i z e and geometry .
o f t h e h o r i z o n t a l l y p e n e t r a t i n g b o d y , t h e s o i l c o n d i t i o n s were h e l d c o n s t a n t
t h r o u g h o u t t h e i n v e s t i g a t i o n . The tests were per formed us ing a s o i l bed
composed o f a i r - d r y C o l o r a d o R i v e r s a n d t h a t h a d b e e n p r e p a r e d e i t h e r i n i t s
d e n s e s t o r l o o s e s t s t a t e s .
A l l o f t h e d a t a r e d u c t i o n a n d m a n i p u l a t i o n was performed using a h i g h
speed d ig i t a l compute r .
PHASE I PROCEDURE
T h e p r o c e d u r e f o r t h i s p h a s e o f t e s t i n g c o n s i s t e d o f :
B a l a n c i n g a l l t h e g a g e s t o r e a d z e r o ,
B a c k f i l l i n g t h e s a n d b o x ,
R e c o r d i n g i n i t i a l g a g e r e a d i n g s ,
R e c o r d i n g g a g e r e a d i n g s a s t h e p l a t e s p e n e t r a t e d t h e b a c k f i l l ,
R e c o r d i n g t h e l o c a t i o n s a t w h i c h t h e f a i l u r e s u r f a c e i n t e r s e c t e d
t h e s u r f a c e o f t h e b a c k f i l l ,
E x c a v a t i n g t h e b a c k f i l l ,
Record ing t he f i na l gage r ead ings .
P r i o r t o b a c k f i l l i n g t h e s a n d b o x , e a c h o f t h e f o u r l o a d ce l l s was
b a l a n c e d t o z e r o o n t h e s t r a i n i n d i c a t o r . The n e x t s t e p was t o b a c k f i l l t h e
box u n t i l t h e s u r f a c e o f t h e s a n d was l e v e l w i t h t h e t o p e d g e o f t h e p l a t e s .
The methods used i n b a c k f i l l i n g t h e b o x a r e d i s c u s s e d i n C h a p t e r V. I n i t i a l
l o a d c e l l r e a d i n g s were taken and a d i a l i n d i c a t o r was mounted t o p r o v i d e
p e n e t r a t i o n m e a s u r e m e n t s f o r t h e p l a t e s d u r i n g t h e t e s t . The sum of t h e
i n i t i a l s t r a i n r e a d i n g s , from t h e t h r e e ce l l s t h a t m e a s u r e d t h e h o r i z o n t a l s o i l
f o r c e r e p r e s e n t e d t h e a t - r e s t e a r t h p r e s s u r e a c t i n g o n t h e c e n t e r p l a t e .
During each t e s t , a s t h e p l a t e s p e n e t r a t e d i n t o t h e b a c k f i l l a t a con-
s t a n t r a t e o f 0.00667 i p s , s t r a i n r e a d i n g s f r o m t h e f o u r l o a d c e l l s were record-
ed f o r e v e r y 0 . 1 i n . p e n e t r a t i o n up t o 1.0 in . and every 0.2 i n . t h e r e a f t e r t o
a maximum o f 3.9 i n c h e s . S i n c e t h e c e l l r e a d i n g s were recorded manual ly , i t
was i m p o s s i b l e t o r e c o r d s i m u l t a n e o u s l y t h e o u t p u t f r o m e a c h c e l l f o r a pre-
de t e rmined amoun t o f pene t r a t ion o f t he p l a t e s . To ob ta in an accu ra t e measu re
o f t h e t o t a l h o r i z o n t a l s o i l f o r c e f o r a s p e c i f i e d amount o f p e n e t r a t i o n i t was
n e c e s s a r y t o t a k e r e a d i n g s i n t h e f o l l o w i n g m a n n e r :
(1) The output from Load Cel l 1 was r e c o r d e d f o r a p e n e t r a t i o n
o f 0 .01 i n . l e s s t h a n t h e amount s p e c i f i e d ,
( 2 ) The output f rom Load Cel l 2 was r e c o r d e d f o r t h e amount o f
p e n e t r a t i o n s p e c i f i e d ,
(3) The output f rom Load Cell 3 was r e c o r d e d f o r a p e n e t r a t i o n
o f 0 . 0 1 i n . g r e a t e r t h a n t h e amount s p e c i f i e d .
The r e l a t i v e p o s i t i o n s o f t h e l o a d c e l l s a r e shown in F ig . 16 on p . 25. From
t h i s f i g u r e i t can be s een t ha t Cells 1 and 3 a r e l o c a t e d a t e q u a l d i s t a n c e s
f rom the t op and s ide edges o f t he p l a t e . Due t o t h i s symmetry, Cells 2 and 3
were sub jec t ed t o nea r ly equa l amoun t s o f l o a d d u r i n g t h e t e s t . S i n c e Cell 1
was r e a d p r i o r t o t h e s p e c i f i e d p e n e t r a t i o n a n d Cel l 3 was r e a d a f t e r t h e spe-
c i f i e d p e n e t r a t i o n h a d o c c u r r e d , i t was assumed t h a t t h e sum o f t h e f o r c e s o n
Cells 1 and 3 r e p r e s e n t s a n a v e r a g e f o r c e a t t h e s p e c i f i e d p e n e t r a t i o n . The
output f rom Cell 2 r e p r e s e n t s t h e f o r c e Cel l 2 was s u b j e c t e d t o when t h e plates
h a d p e n e t r a t e d t h e s p e c i f i e d a m o u n t . T h e r e f o r e , t h e t o t a l h o r i z o n t a l s o i l
f o r c e a c t i n g o n t h e c e n t e r p l a t e a t a s p e c i f i e d amount o f p e n e t r a t i o n was equa l
t o t h e s u r n , o f t h e f o r c e s o n Load Cells 1, 2 and 3.

I m m e d i a t e l y a f t e r t h e o u t p u t f r o m Cell 3 was r e c o r d e d , t h e s t r a i n i n
Cell 4 was r e c o r d e d . T h i s s t r a i n r e p r e s e n t s a p o r t i o n o f t h e v e r t i c a l s o i l
f o r c e . It took approximately 30 sec t o r e a d a n d r e c o r d t h e d a t a o u t p u t .
Measurements were made t o d e s c r i b e t h e l o c a t i o n s a t w h i c h t h e f a i l u r e
s u r f a c e i n t e r s e c t e d t h e s u r f a c e o f t h e b a c k f i l l . F o l l o w i n g t h e a b o v e m e a s u r e -
m e n t s t h e b a c k f i l l was excava ted t o a dep th o f s eve ra l i nches be low the bo t -
tom e d g e s o f t h e p l a t e s a n d f i n a l c e l l r e a d i n g s were r eco rded . De ta i l s pe r -
t a i n i n g t o t h e p l a c e m e n t o f b a c k f i l l m a t e r i a l a n d m e a s u r e m e n t of t h e %
s i t u s o i l d e n s i t y are g i v e n i n C h a p t e r V.
PHASE I DATA REDUCTION
A computer p rogram, des igna ted as PASSIV, was w r i t t e n t o r e d u c e and
c o n v e r t t h e raw l o a d - c e l l d a t a t o a usable form. The program a l so ca lcu la ted
v a l u e s f o r t h e p a s s i v e e a r t h p r e s s u r e o n t h e c e n t e r p l a t e and o t h e r s i g n i f i -
c a n t q u a n t i t i e s . T h e a b o v e v a l u e s were c a l c u l a t e d u s i n g CouLomb's t heo ry o f
p a s s i v e e a r t h p r e s s u r e .
A l i s t i n g o f p r o g r a m PASSIV along with examples of input and output
d a t a a r e g i v e n i n A p p e n d i x A.
- PHASE I1 PROCEDURE
The execu t ion o f each tes t i n P h a s e I1 c o n s i s t e d o f t h e f o l l o w i n g
B a c k f i l l i n g t h e s a n d b o x ,
Ad jus t ing t he c losed l oop Se rvo l oad ing sys t em,
P o s i t i o n i n g e a c h t r a c e o n t h e o s c i l l o g r a p h c h a r t ,
C a l i b r a t i n g e a c h t r a c e ,
Record ing the load c e l l and d i sp lacement t ransducer ou tput
w i t h t h e o s c i l l o g r a p h ,
53
I

(6) R e c o r d i n g t h e l o c a t i o n s a t w h i c h t h e f a i l u r e s u r f a c e i n t e r s e c t e d
t h e s u r f a c e o f t h e b a c k f i l l ,
(7 ) Taking dens i ty samples ,
(8) R e c a l i b r a t i n g e a c h t race,
(9) E x c a v a t i n g t h e b a c k f i l l .
O p e r a t i o n s 1, 6 and 9 were per formed in accordance wi th the methods
o u t l i n e d f o r P r o c e d u r e s 2 , 5 and 6 i n P h a s e I. A d j u s t i n g t h e l o a d i n g s y s t e m
c o n s i s t e d o f : (1) s e t t i n g t h e f l u i d p r e s s u r e a n d (2) programming the Data-
T r a k s y s t e m t o o b t a i n t h e d e s i r e d r a t e s o f p e n e t r a t i o n .
Each t r a c e was p o s i t i o n e d o n t h e o s c i l l o g r a p h c h a r t by a d j u s t i n g t h e
r e s i s t a n c e o f e a c h c h a n n e l . C a l i b r a t i o n d a t a f o r e a c h l o a d - c e l l c h a n n e l was
o b t a i n e d by s w i t c h i n g known r e s i s t a n c e s i n t o e a c h c h a n n e l a n d r e c o r d i n g t h e
c o r r e s p o n d i n g t r a c e d e f l e c t i o n s . C a l i b r a t i o n d a t a f o r t h e d i s p l a c e m e n t
t r a n s d u c e r s was ob ta ined by mov ing t he t r ansduce r sha f t s t h rough known d i s -
t a n c e s a n d r e c o r d i n g t h e c o r r e s p o n d i n g t r a c e d e f l e c t i o n s . F i g u r e 34 i l l u s -
t r a t e s t y p i c a l c a l i b r a t i o n d a t a o u t p u t . E a c h s t e p o n t h e l o a d - c e l l p o r t i o n
of t h e c a l i b r a t i o n c h a r t r e p r e s e n t s a c e r t a i n number of micro inches o f
s t r a i n . C a l i b r a t i o n c u r v e s f o r t h e l o a d - c e l l c h a n n e l s were obta ined by
p l o t t i n g s t r a i n v e r s u s t r a c e d e f l e c t i o n . C a l i b r a t i o n c u r v e s f o r t h e d i s p l a c e -
ment t r a n s d u c e r s were o b t a i n e d by p l o t t i n g d i s p l a c e m e n t v e r s u s t r a c e d e f l e c t i o n .
A c t i v a t i o n of the l oad ing sys t em caused t he p l a t e s t o p e n e t r a t e i n t o
t h e b a c k f i l l . D u r i n g p e n e t r a t i o n , t h e o u t p u t f r o m e a c h c h a n n e l was r eco rded .
A typ ica l example o f t h e o u t p u t i s shown i n F i g . 35.
T h e m e t h o d s u s e d f o r m e a s u r i n g t h e i n s i t u d e n s i t y o f t h e b a c k f i l l
a r e d i s c u s s e d i n C h a p t e r V . P r i o r t o e x c a v a t i o n o f t h e b a c k f i l l m a t e r i a l ,
each record ing channel was r e c a l i b r a t e d t o c h e c k t h e c a l i b r a t i o n s t a b i l i t y .
I n a l l c a s e s , t h e two sets o f c a l i b r a t i o n c u r v e s w e r e l i n e a r a n d i n c l o s e
agreement.
54

CELL NO. 4 0
CELL NO. 3 0
CELL N0.I 0 66 - 96 - - 140
270 -
582 -
66 - 96
5 82 -
270
140
270 -
0 . 5 " -
0.4
582
0.3 'I -
63 4AY
96
140 /STRAIN ( IN/IN. X le6)
3.0 'I -
TRANSDUCER SHAFT DISPLACEMENT
/ f
1.5 'I - 140
96 - 6%-
CELL NO. 2 0 TRACE DEFLECTION
LVDT 0 'I
RECTILINEAR POTENTIOMETER 0 It
FIG.34 TYPICAL CALIBRATION DATA OUTPUT -PHASE JI

I
CELL N0.4
CELL NO. 3
PO
FIG.35 TYPICAL LOAD CELL AND DISPLACEMENT TRANSDUCER OUTPUT-PHASE II

PHASE I1 DATA REDUCTION
The r e d u c t i o n a n d m a n i p u l a t i o n o f t h e raw d a t a was accomplished using
a computer program which was s i m i l a r t o t h e p r o g r a m u t i l i z e d d u r i n g P h a s e I.
The b a s i c d i f f e r e n c e s i n t h e p r o g r a m s were t h e m e t h o d s u s e d t o c a l c u l a t e t h e
m a g n i t u d e o f l o a d c a r r i e d by e a c h l o a d c e l l a n d t h e amount o f p e n e t r a t i o n o f
t h e p l a t e s . I n t h e P h a s e I1 program loads were c a l c u l a t e d u s i n g
H o r i z o n t a l Load = (TD) (SC) (SL) (12)
where,
TD = T r a c e D e f l e c t i o n ( i n . ) ,
SC = S l o p e o f c a l i b r a t i o n c u r v e f o r l o a d c e l l s ; o b t a i n e d f r o m
o s c i l l o g r a p h c h a r t ( m i c r o i n c h e s / i n . o f t r a c e d e f l e c t i o n ) ,
SL = S l o p e o f c a l i b r a t i o n c u r v e f o r l o a d c e l l s ( l b s / m i c r o i n c h ) .
The p e n e t r a t i o n s w e r e c a l c u l a t e d u s i n g
P e n e t r a t i o n = (TD) (SC)
where ,
TD = T r a c e D e f l e c t i o n ( i n . ) ,
SC = S l o p e o f c a l i b r a t i o n c u r v e f o r d i s p l a c e m e n t t r a n s d u c e r s ;
o b t a i n e d f r o m o s c i l l o g r a p h c h a r t ( i n . / i n . o f t r a c e d e f l e c -
t i o n ) .
PHASE I11 PROCEDURE
The b a s i c p r o c e d u r e s n e c e s s a r y f o r t h e c o m p l e t i o n o f a tes t d u r i n g
Phase 111 were s i m i l a r t o t h o s e o u t l i n e d f o r P h a s e 11. During Phase 111, t h e
l o c a t i o n s a t w h i c h t h e f a i l u r e s u r f a c e s i n t e r s e c t e d t h e s u r f a c e o f t h e b a c k -
f i l l were n o t r e c o r d e d .
57

T h e d e p t h b e l o w t h e b a c k f i l l
was v a r i e d b y c h a n g i n g t h e e l e v a t i o n
d u c t e d w i t h t h e s u r f a c e o f t h e s a n d
times the base r ad ius o f each mode l .
s u r f a c e a t which the models pene t ra ted
o f t h e b a c k f i l l s u r f a c e . Tests were con-
l o c a t e d a t e l e v a t i o n s o f 1, 2, 3, and 5
The e l e v a t i o n o f t h e s u r f a c e o f t h e s a n d
was measured wi th re fe rence to the lower edge of the base o f each model . A
s k e t c h i l l u s t r a t i n g t h e e l e v a t i o n o f t h e s a n d s u r f a c e w i t h r e f e r e n c e t o t h e
p o s i t i o n o f a model i s shown i n F i g . 36.
PHASE I11 DATA REDUCTION
A computer program was u s e d f o r c o n v e r t i n g i n t o u s a b l e i n f o r m a t i o n
t h e t r a c e d e f l e c t i o n r e a d i n g s w h i c h were t a k e n o f f t h e o s c i l l o g r a p h r e c o r d .
The u s a b l e i n f o r m a t i o n c o n s i s t e d o f :
(1) Model p e n e t r a t i o n ,
(2 ) H o r i z o n t a l s o i l r e a c t i o n o n t h e m o d e l Y
( 3 ) R e s u l t a n t v e r t i c a l s o i l r e a c t i o n o n t h e model
The h o r i z o n t a l s o i l r e a c t i o n RH a n d p e n e t r a t i o n v a l u e s were c a l c u l a t e d us-
i n g E q s 1 2 and 13. The bending moment, c a u s e d b y t h e r e s u l t a n t v e r t i c a l s o i l
r e a c t i o n \, was c a l c u l a t e d u s i n g
Bending Moment = [ (TD) (SC) ?r Load/SR4 ] (SBM)
where
TD = T r a c e D e f l e c t i o n ( i n . ) ,
SC = S l o p e o f c a l i b r a t i o n c u r v e f o r l o a d c e l l ; o b t a i n e d from
o s c i l l o g r a p h c h a r t ( m i c r o i n c h e s / i n . o f t r a c e d e f l e c t i o n ) ,
Load = H o r i z o n t a l Load as determined by Eq 1 2 ( l b s ) ,
SR4 = S l o p e o f c a l i b r a t i o n c.urve f o r SR-4 s t r a i n g a g e when t h e
rod i s s u b j e c t e d t o a x i a l c o m p r e s s i o n ( l b s / m i c r o i n c h ) ,

POLYETHYLENE MEMBRANE
1 2r
"
- - - = .7 "-..I- .
. i.: . . . . . . . . - ' .:. ',".' * ._ .... -.. ......... ........ ?: . .:: ... ._.. .... .- " - 7 . . - . . - . . . . . . . . . . . . . . . . . . . . . . . . . . . . .
SOIL SURFACE
" . . . . . . . . . . . . . . . ........... . . . .- : - -. . .- 7 .. . .-p..-; .-: . 7 y y . . . . . . . . . . . . . . .. . . . . . .
I I 3r
...',. -..: .: : 2 . : .- ;-. ;z" _ " .- . : -,. .... ;;, ,:..:.- ,.: ........ . I . _ _ . . . . . . . . .,i 1 """
SAND BACKFILL
FIG.36 SKETCH SHOWING THE DEPTHS OF SOIL USED IN MODEL TESTS-PHASE III

SBM = S l o p e o f c a l i b r a t i o n c u r v e f o r SR-4 s t r a i n g a g e when the rod
is s u b j e c t e d t o b e n d i n g ( i n . - l b s / m i c r o i n c h ) .
The minus s i g n i n E q 1 4 i s used when the bend ing moment i s c a l c u l a t e d u s i n g
the ou tpu t f rom Gage 1 (F ig . 37) and t h e p l u s s i g n i s used when t h e o u t p u t
from Gage 3 i s u t i l i z e d . The r e s u l t a n t v e r t i c a l s o i l r e a c t i o n was c a l c u l a t e d
u s i n g
\ = (Bending Moment)l + (Bending Moment)a 2D (15)
where,
(Bending Moment)l = Bending moment c a l c u l a t e d u s i n g o u t p u t
from Gage 1,
(Bending Moment)s = Bending moment c a l c u l a t e d u s i n g o u t p u t
from Gage 3 ,
D = Distance between SR-4 s t r a in gages and
r e s u l t a n t v e r t i c a l s o i l r e a c t i o n .
60

LOAD CELL
r;STRAlN GAGES B O N D E D S R - 4
SECTION A - A
GAGE I
L A
i GAGE 4 GAGE 2
GAGE 3
FIG.37 SKETCH SHOW -PHASE ID
'ING THE NOTAT
L
D
/ SAND SURFACE
1 R V
ION USED IN CALCULATING SOIL REACTIONS

CHAPTER V
SOIL PROPERTIES
T h r o u g h o u t t h e i n v e s t i g a t i o n o n e s o i l t y p e was u s e d f o r t e s t i n g p u r -
poses . A sand was c h o s e n , r a t h e r t h a n a s i l t o r c l a y , b e c a u s e a s o i l bed
composed o f s and is much e a s i e r t o p r e p a r e a n d a t t h e same time m a i n t a i n a
c l o s e c o n t r o l on t h e s i g n i f i c a n t e n g i n e e r i n g p r o p e r t i e s .
The s o i l was a c l e a n , a i r - d r y C o l o r a d o R i v e r s a n d . The sand was ob-
t a i n e d l o c a l l y f r o m C a p i t o l A g g r e g a t e s , I n c . I t is l i g h t r e d d i s h brown i n
co lo r and composed o f s u b a n g u l a r g r a i n s . A mechan ica l ana lys i s was perform-
e d t o d e t e r m i n e t h e g r a i n s i z e d i s t r i b u t i o n a n d t h e s a n d was found to be o f a
medium, un i fo rm na tu re . A s e m i l o g a r i t h m i c p l o t o f t h e g r a i n s i z e d i s t r i b u t i o n
cu rve i s shown i n F i g . 3 8 .
The maximum and minimum d r y d e n s i t i e s were found to be 102.5 and
8 8 . 0 p c f , r e s p e c t i v e l y . U s i n g a v a l u e o f 2 .67 f o r t h e s p e c i f i c g r a v i t y o f
t h e s a n d , t h e maximum and minimum v o i d r a t i o s were c a l c u l a t e d t o b e 0 . 9 4
a n d 0 . 6 3 , r e s p e c t i v e l y . T h e s p e c i f i c g r a v i t y v a l u e was obta ined f rom the p re-
v i o u s work of Ghazzaly . 4
A n p l e o f I n t e r n a l F r i c t i o n M e a s u r e E e s
S t a n d a r d t r i a x i a l c o m p r e s s i o n tes ts were conducted on 1 . 4 i n . d i a
s a m p l e s t o d e t e r m i n e t h e a n g l e o f i n t e r n a l f r i c t i o n . E a c h o f t h e s a m p l e s
was prepared wi th a h e i g h t - d i a m e t e r r a t i o o f 2.0 o r g r e a t e r . The tests
were pe r fo rmed w i th t he s and i n i t s d e n s e s t a n d l o o s e s t s t a t e s . The t r i a x i a l
t e s t r e s u l t s a r e shown i n T a b l e 1.
The d e s i r e d d e n s i t y f o r e a c h s a m p l e was ob ta ined by u s ing two se t
procedures .
62

0
IO
20
30 3
40 0 m 5 50
m
60
80
90
100
SIEVE SIZES - U S STANDARD
~~ ~~
FIG.38 MECHANICAL ANALYSIS GRAIN SIZE ACCUMULATIVE CURVE

Major P r i n c i p a l
S t r e s s =1
( P s i )
40.0
10.7
23.0
5 .5
TABLE 1
TRIAXIAL TEST RESULTS
Minor Angle of Average Angle P r i n c i p a l I n t e r n a l of I n t e r n a l
S t r e s s F r i c t i o n F r i c t i o n 03 @ @
(Psi) (Degrees) (Degrees)
5 .0
1.26
51.2
52.2 51.7
5.0 40.1 39.5
1.26 38.8
Dens i t y Y
(PCf)
102.5
102.5
88.0
88.0
64

The f i r s t p r o c e d u r e c o n s i s t e d o f pour ing the sand th rough a sma l l funne l
i n t o a s tandard removable mold tha t was l i n e d w i t h a t h i n r u b b e r membrane. By
th i s p rocedure , s amples were p r e p a r e d a t t h e minimum d r y d e n s i t y . The remaining
s t e p s i n p r e p a r i n g t h e a p p a r a t u s f o r a t r i a x i a l t e s t were pe r fo rmed i n acco rd -
a n c e w i t h p r o c e d u r e s recommended by Dawson . 3
The maximum d e n s i t y was o b t a i n e d by p o u r i n g t h e s a n d i n t o t h e mold i n
f i v e e q u a l h e i g h t l a y e r s . The t r i a x i a l c e l l b a s e was p laced on a small t a b l e
v i b r a t o r a n d e a c h s u c c e s s i v e l a y e r was v i b r a t e d f o r 2 minutes . The so i l was
a l s o tamped d u r i n g v i b r a t i o n . T h e r e m a i n i n g s t e p s were pe r fo rmed i n acco rd -
ance wi th Dawson' s recommendations. 3
Angle o f Wal l F r i c t ion
Phase I and Phase I1 t e s t i n g c o n s i s t e d o f p e n e t r a t i n g f l a t p l a t e s i n t o
Co lo rado R ive r s and i n a h o r i z o n t a l d i r e c t i o n . As t h e p l a t e s p e n e t r a t e d i n t o
t h e s o i l a f r i c t i o n a l f o r c e was developed a t t h e s o i l - p l a t e i n t e r f a c e . T h i s
f r i c t i o n a l f o r c e h a s p r e v i o u s l y b e e n d e f i n e d i n C h a p t e r I a s t h e v e r t i c a l s o i l
r e sponse . T h e d e v e l o p e d a n g l e o f f r i c t i o n , o r a n g l e o f w a l l f r i c t i o n a s i t i s
more commonly c a l l e d , c a n b e c a l c u l a t e d by t a k i n g t h e a r c t a n g e n t o f t h e r a t i o
o f t h e v e r t i c a l s o i l f o r c e t o t h e h o r i z o n t a l s o i l f o r c e .
The maximum a n g l e o f w a l l f r i c t i o n t h a t c o u l d b e d e v e l o p e d a t t h e
s o i l - p l a t e i n t e r f a c e was measured using a d i r e c t s h e a r box. The shear box
c o n s i s t e d o f a top and bottom frame. The inside dimensions of each f rame
w e L e 1.0 in . deep by 2 .36 in . w ide by 2.36 in . long. The bot tom frame was
p a r t i a l l y f i l l e d w i t h s a n d a n d wax. T h i s m a t e r i a l p r o v i d e d a f i r m b a s e f o r
a 0 , 1 2 5 i n . t h i c k s teel p l a t e i n se r t wh ich occup ied t he r ema in ing po r t ion of
t h e s e c t i o n . The t o p h a l f o f t h i s box was f i l l e d w i t h C o l o r a d o R i v e r s a n d .
The method of sand placement was s i m i l a r t o t h a t u s e d i n p r e p a r i n g s a m p l e s
f o r t h e t r i a x i a l c o m p r e s s i o n tests.

S e v e r a l tests were pe r fo rmed i n wh ich t he app l i ed no rma l stress was
v a r i e d o v e r t h e r a n g e o f v a l u e s t h a t e x i s t e d i n t h e f l a t - p l a t e e a r t h - p r e s s u r e
tests. The maximum s h e a r stress co r re spond ing t o each app l i ed no rma l stress
is p l o t t e d i n F i g . 39. T h e s l o p e s o f t h e s t r a i g h t l ines p a s s i n g t h r o u g h t h e
p l o t t e d p o i n t s r e p r e s e n t t h e maximum c o e f f i c i e n t s o f f r i c t i o n d e v e l o p e d a t
t h e s t e e l - s a n d i n t e r f a c e .
Dens i ty De te rmina t ion
The a c c u r a t e d e t e r m i n a t i o n o f t h e i n s i t u d e n s i t y o f a dry cohesion-
less s o i l i s a d i f f i c u l t t a s k . Any method t h a t r e q u i r e s t h e u s e o f s a m p l i n g
t u b e s i n v o l v e s a d i s t u r b a n c e e f f e c t w h i c h a l t e r s t h e d e n s i t y o f t h e s o i l .
O t h e r t e c h n i q u e s t h a t do n o t i n v o l v e s a m p l i n g t u b e s a r e c o s t l y a n d time con-
suming.
Phase I Dens i ty
D u r i n g t h e f i r s t p h a s e o f t e s t i n g t h e i n s i t u s o i l d e n s i t y was d e t e r -
mined by an indirect method. This method involved the use o f a s t a n d a r d
p r o c t o r mold which had a v o l u m e o f o n e - t h i r t i e t h of a c u b i c f o o t . To o b t a i n
a measure of t h e minimum d e n s i t y , t h e s a n d was poured through a funne l whose
spou t was ma in ta ined 2 i n . a b o v e t h e s u r f a c e o f t h e s a n d i n t h e mold. Th i s
method of placement i s i d e n t i c a l t o t h e p r o c e d u r e u s e d i n b a c k f i l l i n g t h e
s a n d b o x p r i o r t o e a c h t e s t c o n d u c t e d w i t h t h e s a n d a t i t s minimum d e n s i t y .
The u n i t d e n s i t y o f t h e s a n d i n t h e box was assumed t o b e e q u a l t o t h e w e i g h t
o f t h e s a n d i n the mold m u l t i p l i e d by t h i r t y . The va . lues o f un i t dens i ty
ob ta ined u s ing t h i s p rocedure va r i ed be tween 86 and 90 p c f . A v a l u e o f 88
p c f was chosen t o r ep resen t t he minimum d e n s i t y o f t h e s a n d i n t h e b o x .
The maximum d e n s i t y was a l so e s t ima t ’ed u s ing a p r o c t o r mold. The
sand was p l a c e d i n t h e mold i n f i v e e q u a l h e i g h t l a y e r s . As t he s and was
66

5.0
4.c
- v) n
3.0 v) v) w k v)
a
2 2.c w v) I
1.0
0
0 - DENSITY = 102.5 PCF x - DENSITY = 88.0 PCF
1.0 2 .o 3.0 4.0 5.0 6.0 7.0 8.0 9.0 NORMAL STRESS, PSI
FIG.39 ANGLES OF SLIDING FRICTION FOR COLORADO RIVER SAND ON STEEL

p l a c e d i n t h e mold each success ive l ayer was v i b r a t e d f o r 2 min u s i n g a t a b l e
v ibra tor . This method of p lacement i s n o t i d e n t i c a l t o t h e p r o c e d u r e u s e d
i n b a c k f i l l i n g t h e s a n d b o x . P r i o r t o e a c h t e s t the box was b a c k f i l l e d by
p l ac ing t he - s and i n l aye r s app rox ima te ly 3 i n . i n h e i g h t . E a c h s u c c e s s i v e
l a y e r was v i b r a t e d w i t h a hand c o n c r e t e v i b r a t o r f o r a p p r o x i m a t e l y 10 minutes .
The r e s u l t s f rom the p roc to r mold d e t e r m i n a t i o n s r e v e a l e d t h a t t h e maximum
d e n s i t y v a r i e d b e t w e e n 102 and 103 p c f . A v a l u e of 1 0 2 . 5 pcf was c h o s e n t o
r e p r e s e n t t h e maximum d e n s i t y o f t h e s a n d i n t h e b o x .
Phase I1 Dens i ty
Two methods were u s e d t o d e t e r m i n e t h e i n s i t u s o i l bed dens i ty dur -
ing the second phase o f t e s t i n g .
The f i r s t me thod cons i s t ed o f we igh ing t he s and p l aced i n t he s andbox
d u r i n g b a c k f i l l i n g . The a v e r a g e d e n s i t y was t h e n c a l c u l a t e d by d i v i d i n g t h e
t o t a l w e i g h t o f s a n d i n t h e b o x by the vo lume t ha t i t occupied . The backf i l l -
i n g p r o c e d u r e s u s e d i n t h i s p h a s e o f t e s t i n g were i d e n t i c a l t o t h e p r o c e d u r e s
used i n P h a s e I. The r e s u l t s from t h i s method showed the ave rage dens i ty t o be
approximately 102.5 pcf when the s and was v i b r a t e d d u r i n g b a c k f i l l i n g . U s i n g
t h e same method t h e a v e r a g e d e n s i t y o f t h e b a c k f i l l was found to be approx i -
mately 88.0 pcf when the sand was p laced us ing a f u n n e l .
The s e c o n d m e t h o d u t i l i z e d s a m p l i n g t u b e s t o d e t e r m i n e t h e i n s i t u
s o i l d e n s i t y . A f t e r t h e c o m p l e t i o n o f e a c h p l a t e - p e n e t r a t i o n t e s t f o u r
dens i ty s amples were t a k e n u s i n g b r a s s s a m p l i n g t u b e s t h a t were 6 i n . i n
l eng th and had i n s ide and ou t s ide d i ame te r s of 1.4 and 1 .5 i n . r e s p e c t i v e l y .
F i g u r e 31 on p. 47 shows t h e s a m p l i n g t u b e s u s e d i n t h i s i n v e s t i g a t i o n , The
l o c a t i o n s a t w h i c h t h e s a m p l e s w e r e t a k e n a r e shown i n F i g . 40. The sampl-
i n g l o c a t i o n s m a r k e d 1 and 2 a r e i n a z o n e t h a t i s n o t a f f e c t e d by t h e
p e n e t r a t i o n o f t h e p l a t e s a n d t h e r e f o r e t h e s e s a m p l e s p r o v i d e r e s u l t s t h a t
68

T I '
I
1 1.5'
4 0.9'
I STEEL PLATE I
I
" I __c
6.5 '
FIG.40 PLAN VIEW OF THE SANDBOX SHOWING T H E LOCATIONS AT WHICH DENSITY SAMPLES WERE TAKEN- PHASE II

c a n b e u s e d i n d e t e r m i n i n g t h e pre-test so i l dens i ty . The s amples t aken f rom
l o c a t i o n s 3 and 4 p r o v i d e d a t a t h a t c a n b e u s e d i n t h e d e t e r m i n a t i o n o f t h e
p o s t - t e s t s o i l d e n s i t y w i t h i n t h e f a i l u r e wedge,
As s t a t e d e a r l i e r , t h e u s e o f s a m p l i n g t u b e s c a u s e s d i s t u r b a n c e s i n
t h e s o i l which tend to a l te r t h e d e n s i t y . S e v e r a l tests were per formed to
e v a l u a t e t h e e f f e c t o f s a m p l i n g t u b e d i s t u r b a n c e s o n t h e i n s i t u s o i l d e n s i t y .
Each t e s t c o n s i s t e d o f p r e p a r i n g a s o i l s a m p l e i n a p r o c t o r mold e i t h e r by
u s i n g a f u n n e l o r by v ib ra t ing t he s ample . The dens i ty o f t he s ample was
t h e n c a l c u l a t e d . A sampl ing tube was t h e n p u s h e d i n t o t h e s o i l s a m p l e a n d
t h e d e n s i t y o f t h e s o i l w i t h i n t h e t u b e was c a l c u l a t e d . The d i f f e r e n c e be-
t w e e n t h e d e n s i t y o f t h e s o i l i n t h e p r o c t o r mold and the s ampl ing t ube re-
p r e s e n t s t h e c h a n g e i n d e n s i t y d u e t o t h e s a m p l i n g p r o c e d u r e .
The r e s u l t s o b t a i n e d f r o m t h e tes ts desc r ibed above show the change
i n s o i l d e n s i t y t o be approximately 3.0 pc f when t h e i n s i t u d e n s i t y i s 88.0
pcf and 2.0 pcf when t h e i n s i t u i s 102 .5 pcf . The tube d i s turbance caused
t h e s a n d i n t h e l o o s e s t a t e (88.0 p c f ) t o become dense r and t he s and i n t he
d e n s e s t a t e ( 1 0 2 . 5 p c f ) t o become less dense.
Phase I11 D e 9
D u r i n g t h e t h i r d p h a s e o f t e s t i n g , s a m p l i n g t u b e s were used to measure
t h e i n s i t u d e n s i t y o f t h e s o i l bed. The sampling tubes were t h e same a s
those used dur ing Phase 11. Three samples were t a k e n a t t h e c o m p l e t i o n o f
each t e s t . The samples were t a k e n i n t h a t p o r t i o n o f t h e s o i l bed t h a t was
n o t a f f e c t e d b y t h e p e n e t r a t i o n o f t h e c o n e s a n d s p h e r i c a l s e g m e n t s a n d t h e y
t h e r e f o r e r e p r e s e n t e d t h e p r e - t e s t i n s i t u s o i l d e n s i t y .
I

CHAPTER V I
PHASE I TEST RESULTS AND DISCUSSION
The main purpose of Phase I was t o e v a l u a t e t h e p e r f o r m a n c e o f t h e
t e s t i n g a p p a r a t u s . T h e t e s t s e t u p was d e s i g n e d t o model t h e c l a s s i c a l p l a n e -
s t r a i n e a r t h - p r e s s u r e p r o b l e m . T h e e a r t h p r e s s u r e - p e n e t r a t i o n c u r v e s t h a t
were o b t a i n e d f r o m t h e l o a d - c e l l d a t a were u s e d a s b a s i s f o r e v a l u a t i n g t h e
a p p a r a t u s .
EARTH-PRESSURE DEVELOPMENT
F o u r t e e n p a s s i v e e a r t h - p r e s s u r e t es t s were c o n d u c t e d . I n e a c h t e s t
t h e p e n e t r a t i o n o f t h e w a l l was h e l d a t a c o n s t a n t r a t e o f 0.00278 ips . Four
tes ts w e r e c o n d u c t e d w i t h t h e b a c k f i l l i n a l o o s e s t a t e and 10 t e s t s were per-
formed w i t h t h e b a c k f i l l i n a dense s t a t e . P a s s i v e e a r t h p r e s s u r e as a func-
t i o n o f w a l l p e n e t r a t i o n a n d b a c k f i l l d e n s i t y i s p l o t t e d i n F i g . 41 f o r 2 tes ts .
T e r z a g h i ' ' o b s e r v e d , t h a t f o r w a l l p e n e t r a t i o n s less t h a n o r e q u a l t o t h e p e n e -
t r a t i o n n e c e s s a r y t o d e v e l o p t h e maximum e a r t h p r e s s u r e , t h e e a r t h p r e s s u r e -
p e n e t a r t i o n c u r v e was p a r a b o l i c i n s h a p e . A p a r a b o l a was f i t t e d t h r o u g h t h e
f i r s t and l a s t d a t a p o i n t o f Test L 1 and i s r e p r e s e n t e d by t h e s o l i d l i n e
w h i c h c l o s e l y f i t s t h e l o w e r s e t o f o b s e r v a t i o n s shown i n F i g . 41. A para-
b o l a was a l s o f i t t e d t h r o u g h t h e f i r s t d a t a p o i n t a n d t h e maximum measured
e a r t h - p r e s s u r e p o i n t f o r t h e u p p e r c u r v e . The s l o p e o f t h e p a r a b o l a ,
dY/dP is e q u a l t o z e r o a t t h e f i r s t p o i n t on each cu rve . The f i gu re a l so
d e m o n s t r a t e s t h e l a r g e i n f l u e n c e t h e d e n s i t y o f t h e b a c k f i l l h a s u p o n t h e
s h a p e o f t h e e a r t h p r e s s u r e - p e n e t r a t i o n c u r v e . The c u r v e s a r e similar i n
s h a p e t o t h o s e o b t a i n e d by p l o t t i n g s t r e s s - s t r a i n v a l u e s f r o m t r i a x i a l com-
p r e s s i o n tes ts conducted on loose and dense sands.
P Y

A 8/19/65 TEST 02
El 8/11/65 TEST LI
= 165.6 Y t 25
0.0 I .o 2 .o 3.0 4.0
PENETRATION, Y * IN.
FIG.41 PASSIVE EARTH PRESSURE VERSUS PENETRATION

WALL FRICTION ANALYSIS
The main purpose o f th i s series o f tests was t o d e t e r m i n e how w e l l
t h e test s e t u p a p p r o x i m a t e d p l a n e - s t r a i n l o a d i n g c o n d i t i o n s . One method of
e v a l u a t i n g t h e p e r f o r m a n c e o f t h e a p p a r a t u s i s to compare the measured resu l t s
w i t h t h o s e p r e d i c t e d by e x i s t i n g p l a n e - s t r a i n e a r t h - p r e s s u r e t h e o r y . As a
comparison, Coulomb's equat ion (7) was u s e d t o c a l c u l a t e p a s s i v e e a r t h p r e s s u r e .
One o f t h e v a r i a b l e s a p p e a r i n g i n t h i s e q u a t i o n i s 6 , t h e a n g l e o f wall
f r i c t i o n .
Test d a t a e x p r e s s i n g t h e d e v e l o p m e n t o f t h e a n g l e o f f r i c t i o n a t t h e
s o i l - w a l l i n t e r f a c e i s p l o t t e d i n F i g s . 42 through 4 4 . Average curves have
been d rawn t h rough t he da t a po in t s i n F igs . 42 and 43 w h i c h i n d i c a t e a d e f i -
n i t e t r e n d i n t h e d e v e l o p m e n t o f w a l l f r i c t i o n . The w a l l f r i c t i o n d a t a from
t h e l o o s e tes ts (F ig . 4 4 ) was much more e r r a t i c t h a n t h a t f o r t h e d e n s e t e s t s
a n d t h e r e f o r e no pronounced t rend was f o u n d t o e x i s t . The d a t a p o i n t s r e p r e -
s e n t o n l y a p o r t i o n o f t h e a n g l e of f r i c t i o n d e v e l o p e d a t t h e s o i l - w a l l i n t e r -
f a c e . The a p p a r a t u s was des igned so t h e f r i c t i o n a l f o r c e a t t h e s o i l - w a l l
i n t e r f a c e m i n u s t h e f r i c t i o n a l f o r c e d e v e l o p e d b e t w e e n t h e w a l l a n d t h e t h r e e
load ce l l s was measured.
S e v e r a l t e s t s were p e r f o r m e d t o d e t e r m i n e t h e a n g l e o f f r i c t i o n be-
tween the 3 l o a d - c e l l b u t t o n s and t h e s t ee l p l a t e . The a n g l e o f f r i c t i o n was
observed to be 5 .9 d e g r e e s f o r t h e e n t i r e r a n g e o f h o r i z o n t a l test- p r e s s u r e s .
A l t h o u g h t h e c u r v e s f o r d e n s e b a c k f i l l tests (F igs . 42 and 4 3 ) do have
a s i m i l a r i t y i n s h a p e , i t c a n b e s e e n t h a t f o r a g i v e n p e n e t r a t i o n t h e d i f f e r -
e n c e s i n t h e i n d i c a t e d v a l u e s o f w a l l f r i c t i o n a r e g r e a t . T h e s e d i f f e r e n c e s
c a n l a r g e l y b e a t t r i b u t e d t o t h e i n a d e q u a t e m e t h o d u s e d t o r e s t r a i n t h e l o a d -
ing f rame f rom moving in a v e r t i c a l d i r e c t i o n . A w a l l f r i c t i o n - p e n e t r a t i o n
curve was c o n s t r u c t e d f o r t h e d e n s e b a c k f i l l c a s e a s s u m i n g t h e e a r l y p o r t i o n
73
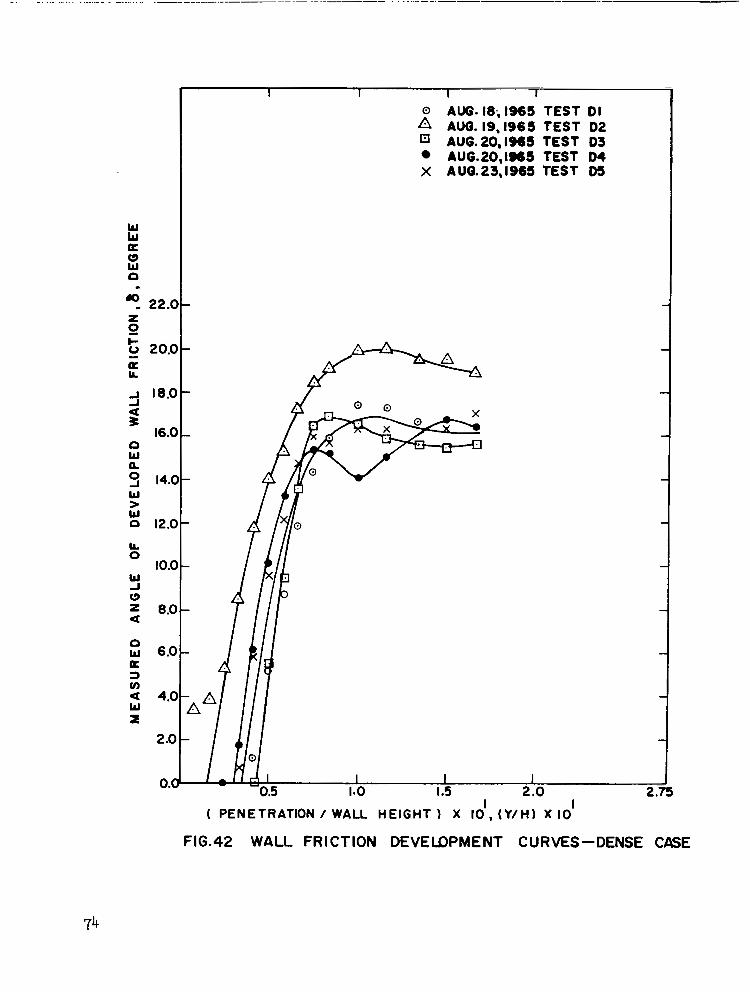
.. , . , . . . . , , , , . . . . .. - . " - .. . . .. . - -. . ... . - - ._ " - . " . .. . . " . . . . . . ." -. - . - " - ._ ".
W LJ
e W P
a
L
? 22A z I- 0 o 20.0- a - LL
18.0 - s
16.0 - n W P 3 14.0- W
W > 0 12.0-
LL 0
W -I (3
10.0 -
8.0- a n w 6.0- K
cn 3
W z a
0 AUO. 18; 1965 TEST Dl A AUO. 19,1965 TEST 02 El BUG. 20,1965 TEST D3
AUG.20,1965 TEST BS X AUO. 23,1965 TEST D5
( PENETRATION / WALL HEIGHT 1 X I O , (Y/H) X IO I 1
FIG.42 WALL FRICTION DEVELDPMENT CURVES-DENSE CASE
74

W W
5 22.0 W P
& 20.0
z e 18.0 c
I I I 1
t AUG.25.1965 TEST 06 v AUG. 26,1965 TEST D7 0 S€PT I, I965 TEST D6
SEPT. 8 , 1965 TEST 09 X SEPT 9, 1965 TEST Dl0
16.0
14.0
12.0
lox)
4.0
2.0
0.0 i I
t PENETRATION/ W A L L HEIGHT) X IO , (Y/H) X IO
5
FIG.43 WALL FRICTION DEVELOPMENT CURVES- DENSE CASE
75

W W E 11.0 I 1 I I I
' W I
P 0 JULY 17,1965 TEST L7 & 10.0- z -t AUG. 12,1965 TEST L2 t 0
AUG. It, 1965 TEST L I
A AUG. 12, 1965 TEST L3 0
F 9.0- I
(PENETRATION /WALL HEIGHT) X I O 1 , 1Y/H 1 X 10'
FIG.44 WALL FRICTION DEVELOPMENT CURVES - LOOSE CASE

o f t h e c u r v e c o u l d b e r e p r e s e n t e d by a s t r a i g h t l i n e , t h e i n t e r m e d i a t e p o r t i o n
by a p a r a b o l a , a n d t h e f i n a l p o r t i o n by a n o t h e r s t r a i g h t l i n e . A b i l i n e a r
cu rve was u s e d t o r e p r e s e n t t h e d e v e l o p m e n t o f w a l l f r i c t i o n when t h e b a c k f i l l
was i n a l o o s e s t a t e . T h e c o n f i g u r a t i o n s o f t h e c o n s t r u c t e d c u r v e s a r e i l l u s -
t r a t e d i n F i g . 45.
The tes t d a t a i n F i g s . 42 through 44 was used a s a b a s i s f o r d e v e l o p -
i n g t h e c o n s t r u c t e d wall f r i c t i o n - p e n e t r a t i o n c u r v e . Dense t e s t d a t a i n d i -
c a t e s t h a t f o r d e v e l o p e d a n g l e s o f w a l l f r i c t i o n less than 13 deg rees t he da t a
p o i n t s may be c lose ly approx ima ted by a s t r a i g h t l i n e . U s i n g a s t r a i g h t l i n e
approx ima t ion , t he ave rage s lope was found to be 444 d e g r e e s / i n . p e n e t r a t i o n /
i n . o f w a l l h e i g h t .
I t can be seen f rom Fig. 45 t h a t t h e i n i t i a l s t r a i g h t l i n e p o r t i o n o f
t he cons t ruc t ed cu rve ex tends t o a w a l l f r i c t i o n d e v e l o p m e n t o f 18.9 degrees .
The v a l u e o f 18.9 degrees was o b t a i n e d by add ing t he 5 . 9 degree ang le o f f r i c -
t ioti , which was d e v e l o p e d b e t w e e n t h e l o a d c e l l s a n d t h e p l a t e , t o t h e 1 3
d e g r e e s t h a t was ac tua l ly measu red by t h e s i n g l e l o a d c e l l . T h i s , o f c o u r s e ,
i s an approx ima t ion s ince t he t angen t o f t he sum o f two q u a n t i t i e s i s no t
e q u a l t o t h e sum o f t h e t a n g e n t s o f e a c h q u a n t i t y . However, t h e e r r o r c r e a t e d
by th i s app rox ima t ion was n o t s i g n i f i c a n t i n t h i s i n v e s t i g a t i o n .
F i g u r e 45 shows t h a t t h e s l o p e o f t h e e a r l y p o r t i o n o f t h e c u r v e h a s
been reduced from 444 t o 360 d e g r e e s / i n . p e n e t r a t i o n / i n . o f w a l l h e i g h t . The
s l o p e was reduced s o t h e l o c a t i o n o f t h e p a r a b o l i c s e c t i o n w o u l d a g r e e c l o s e r
w i th t he pos i t i on obse rved f rom the test r e s u l t s . T h e e q u a t i o n f o r t h e p a r a -
b o l i c s e c t i o n was d e r i v e d u s i n g t h r e e sets o f c o n d i t i o n s : (1) t h e b e g i n n i n g
p o i n t o n t h e c u r v e i s (0 .0525 , 18 .9 d e g r e e s ) , (2) t h e s l o p e o f t h e p a r a b o l a a t
t h e b e g i n n i n g p o i n t i s 3 6 0 d e g r e e s l i n . p e n e t r a t i o n l i n . o f w a l l h t . , a n d ( 3 ) t h e
f i n a l p o i n t on t h e p a r a b o l a is (0 .0858, 22 .9 d e g r e e s ) . The u l t i m a t e v a l u e of
77

22.9k - - - -
E
I- V
K Lr
J J
P -
a 3
0 0.0525 0.0858
PENETRATION/ HEIGHT O F WALL, Y/H
"" - 7
I
LOOSE CASE
l 1 0.291
PENETRATION/ HEIGHT OF WALL, Y/H
FIG. 45 CONSTRUCTED WALL FRICTION CURVES FOR LOOSE AND DENSE CASES

w a l l f r i c t i o n was o b t a i n e d by add ing 5.9 d e g r e e s t o a n a v e r a g e t e s t v a l u e o f
1 7 deg rees . The l e n g t h o f t h e p a r a b o l i c s e c t i o n a n d t h e v a l u e o f u l t i m a t e
w a l l f r i c t i o n were determined f rom the tes t d a t a shown i n F i g s . 42 and 43.
The development of wall f r i c t i o n was more e r r a t i c when t h e b a c k f i l l
was p l a c e d i n a l o o s e s t a t e . The s c a t t e r i n t h e test d a t a p r e v e n t e d t h e
r a t iona l deve lopmen t o f a c o n s t r u c t e d w a l l f r i c t i o n - p e n e t r a t i o n c u r v e .
COMPARISON BETWEEN MEASURED AND CALCULATED EARTH-PRESSURE FACTORS
Tab le 2 l i s t s some o f t h e r e s u l t s u s e d i n e v a l u a t i n g t h e p e r f o r m a n c e
o f t he t e s t appa ra tus . The t ab l e shows t h a t t h e l o o s e t e s t v a l u e s o f m e a s u r e d
a n d c a l c u l a t e d e a r t h - p r e s s u r e f a c t o r s a g r e e w e l l , w h i l e t h e d e n s e t e s t ag ree -
ment i s poor i n m o s t c a s e s . I n e v e r y i n s t a n c e t h e c a l c u l a t e d e a r t h - p r e s s u r e
f a c t o r i s g r e a t e r t h a n t h e m e a s u r e d q u a n t i t y . The measured ear th-pressure
f a c t o r i s expres sed by Eq 24 on p. 170. The c a l c u l a t e d e a r t h - p r e s s u r e f a c t o r s
were found using Eqs 26 and 24. The d e v e l o p e d a n g l e o f w a l l f r i c t i o n c o r r e s -
p o n d i n g t o t h e d i m e n s i o n l e s s r a t i o , P e n e t r a t i o n / W a l l H e i g h t , l i s t e d i n T a b l e 2
was f o u n d u s i n g t h e a p p r o p r i a t e c u r v e i n F i g . 4 5 , the choice o f curve depend-
i n g upon t h e d e n s i t y o f t h e b a c k f i l l . T h e d e v e l o p e d a n g l e o f i n t e r n a l f r i c -
t i o n t h a t c o r r e s p o n d e d t o t h e maximum measured ea r th -p res su re f ac to r was c a l -
cu la ted us ing Coulomb's Eq 28 appearing on p .172.
The amount of w a l l p e n e t r a t i o n r e q u i r e d t o d e v e l o p t h e maximum measured
e a r t h - p r e s s u r e f a c t o r s f o r t h e d e n s e tes ts v a r i e d g r e a t l y , a s c a n b e s e e n f r o m
the d imens ion le s s t e r m , Pene t r a t ion lWal l He igh t i n Tab le 2 . The wide varia-
t i o n o f w a l l p e n e t r a t i o n n e c e s s a r y t o c a u s e f a i l u r e was c r e a t e d by the i nade -
qua te method used to res t ra in the loading f rame f rom moving in a v e r t i c a l
d i r e c t i o n . The wooden v e r t i c a l r e s t r a i n t a n d i t s connec t ions t o t he s andbox
were r i g i d enough t o k e e p t h e l o a d i n g f r a m e m o v i n g i n a h o r i z o n t a l p l a n e when
t h e b a c k f i l l was i n a l o o s e s ta te . However, a f t e r t h e c o m p l e t i o n o f s e v e r a l
dense tests t h e wooden v e r t i c a l r e s t r a i n t s h i f t e d upward. This movement
79

Test I d e n t i f i -
c a t i o n
TABLE 2
COMPARISON BETWEEN MAXIMUM MEASURED EARTH-PRESSURE FACTORS
AND CALCULATED EARTH-PRESSURE FACTORS
P e n e t . / H t . o f Wall y /H
( i n . / i n . )
7/17/65 - L7
8/11/65 - L 1
8/12/65 - L2
8/12/65 - L3
8/18/65 - D l
8/19/65 - D2
8120165 - D3
8120165 - D4
8/23/65 - D5
8/25/65 - D6
8 126165 - D7
9/5/65 - D8
9/8/65 - D9
9/9/65 - Dl0
0.250
0.300
0.317
0.317
0.0250
0.0250
0.133
0.100
0.0833
0.0167
0.0250
0.0250
0.0500
0.0500
E a r t h - P r e s s u r e F a c t o r s M e a s u r e d C a l c u l a t e d K / c o s 6 K / c o s 6
P P
, 7 . 7 7 . 7
7.7 8 . 6
7 . 1 8 . 6
7.0 8 . 6
1 2 . 1 13.9
11.5 13.9
11.0 47.6
1 2 . 1 47.6
10 .9 46 .4
11.4 11.5
1 1 . 7 13.9
11.4 13.9
14.5 27.9
13.6 27.9
R a t i o C a l c . / Meas.
1 .0
1.1
1 .2
1 . 2
1 . 2
1 . 2
4 . 3
3.9
4 . 3
1 .0
1 . 2
1 . 2
1 . 9
2 . 1
Deve loped Ang le I n t e r n a l Wall F r i c t i o n
( D e g r e e s ) @
39.4
37.8
36.3
36.3
49.7
49.0
36.7
37.9
36.7
51.5
49.2
48.8
44.4
43.5
F r i c t i o n 6
(Degrees )
12.8
14.9
14.9
14.9
9.0
9.0
22.9
22.9
22.7
6.0
9 .0
9.0
18.0
18.0
D e n s i t y Y
(PCf)
88.0
88.0
88.0
88.0
102.5
102.5
102.5
102.5
102.5
102.5
102.5
102.5
102.5
102.5

caused a g a p t o o c c u r b e t w e e n t h e l o a d i n g f r a m e a n d v e r t i c a l r e s t r a i n t . The
gap permi t ted the wal l and loading f rame to move v e r t i c a l l y , t h e r e b y r e d u c i n g
t h e d e v e l o p m e n t o f w a l l f r i c t i o n a n d h o r i z o n t a l p r e s s u r e s d u r i n g t h e e a r l y
s t a g e s o f w a l l p e n e t r a t i o n . The v e r t i c a l movement caused t he maximum e a r t h
p r e s s u r e t o d e v e l o p a t v a l u e s o f wall p e n e t r a t i o n much l a r g e r t h a n t h o s e
no rma l ly occu r r ing unde r t he cond i t ion o f no v e r t i c a l movement.
A l t h o u g h t h e p e n e t r a t i o n n e c e s s a r y t o d e v e l o p t h e maximum measured
e a r t h - p r e s s u r e f a c t o r v a r i e d g r e a t l y b e t w e e n tes t s , t h e maximum measured
e a r t h - p r e s s u r e f a c t o r r e m a i n e d e s s e n t i a l l y c o n s t a n t . Two o f f s e t t i n g v a r i a b l e s ,
6 , and @, a r e r e s p o n s i b l e f o r t h e d e v e l o p m e n t o f n e a r l y c o n s t a n t e a r t h -
p r e s s u r e f a c t o r s . R e l a t i v e l y s m a l l w a l l d i s p l a c e m e n t s a r e r e q u i r e d f o r de-
ve lopment o f the maximum a n g l e o f i n t e r n a l f r i c t i o n . When d i sp lacemen t s
l a r g e r t h a n t h o s e n e c e s s a r y t o d e v e l o p t h e maximum a n g l e o f i n t e r n a l f r i c t i o n
o c c u r , t h e v a l u e o f i n t e r n a l f r i c t i o n d e c r e a s e s b e c a u s e t h e d e n s i t y o f t h e
b a c k f i l l m a t e r i a l d e c r e a s e s a s i t u n d e r g o e s i n c r e a s e d s h e a r i n g s t r a i n s . A s
can be seen f rom F igs . 42 through 44 , t h e a n g l e o f w a l l f r i c t i o n i n c r e a s e s
w i t h w a l l p e n e t r a t i o n .
F i v e o f t h e t e s t s t a b u l a t e d i n T a b l e 2 h a v e c a l c u l a t e d e a r t h - p r e s s u r e
f a c t o r s much g r e a t e r t h a n t h e m e a s u r e d e a r t h - p r e s s u r e f a c t o r s . The a n g l e o f
w a l l f r i c t i o n t h a t d e v e l o p e d i n t h e s e c a s e s was approximately 20 deg rees .
A s s t a t e d p r e v i o u s l y i n C h a p t e r 11, t h e e r r o r a s s o c i a t e d w i t h t h e p l a n e f a i l -
u r e s u r f a c e a s s u m p t i o n may b e a s l a r g e as 50 p e r c e n t i n c a s e s w h e r e t h e
a n g l e o f d e v e l o p e d w a l l f r i c t i o n i s l a r g e . The v a l u e o f t h e c a l c u l a t e d e a r t h -
p r e s s u r e f a c t o r i s a l so based upon t he maximum developed va lue o f i n t e r n a l
f r i c t i o n @ as measured from a t r i a x i a l test and , fo r r ea sons exp la ined p rev i -
o u s l y , t h e maximum deve loped ea r th p re s su re and maximum developed angle o f
i n t e r n a l f r i c t i o n may n o t o c c u r a t t h e same i n s t a n t .
81

The deve lopmen t o f t he ea r th -p res su re f ac to r (K /cos 6) a s t h e w a l l P
p e n e t r a t e d i n t o t h e b a c k f i l l i s shown in F i g s . 46 through 49. On ly t he va lues
o f K / cos 6 up t o a n d i n c l u d i n g t h e maximum v a l u e h a v e b e e n p l o t t e d € o r t h e
dense tes ts . The d a t a o b t a i n e d f r o m t h e l o o s e tests i s less e r r a t i c t h a n t h a t
ob ta ined f rom the dense tests.
P
DEVELOPED ANGLE OF INTERNAL FRICTION
The deve lopmen t o f i n t e rna l f r i c t ion a s t he wa l l pene t r a t ed i n to t he
b a c k f i l l i s shown i n F i g . 50 and 51 . The cu rves fo r t he l oose and dense t e s t s
a r e s i m i l a r i n s h a p e t o t h e p a s s i v e e a r t h - p r e s s u r e c u r v e s t h a t a r e shown i n
F i g . 41. The a n g l e o f d e v e l o p e d i n t e r n a l f r i c t i o n was ca l cu la t ed u s ing Cou lomb ' s
Eq 28 on p . 172 .
CENTER OF PRESSURE LOCATIONS
The d i s t r i b u t i o n o f h o r i z o n t a l s o i l p r e s s u r e o n a s e m i - i n f i n i t e r e t a i n -
ing wal l depends upon the method in which the backf i l l was p l aced and a l so
upon t h e amount and type of wall movement. I f a w a l l moves towards a cohesion-
less b a c k f i l l b y t i l t i n g a r o u n d i t s i n n e r l o w e r e d g e t h e p r e s s u r e d i s t r i b u t i o n
i s a p p r o x i m a t e l y t r i a n g u l a r . The t e s t i n g a p p a r a t u s was des igned s o t h e w a l l
moved o n l y i n a h o r i z o n t a l d i r e c t i o n . T h e r e f o r e , i t i s expec ted t ha t t he p re s -
s u r e d i s t r i b u t i o n d u r i n g t h e e a r l y s t a g e s o f p e n e t r a t i o n may be someth ing o ther
t h a n t r i a n g u l a r .
The v a r i a t i o n i n t h e l o c a t i o n o f t h e c e n t e r o f p r e s s u r e a s t h e w a l l
p e n e t r a t e d i n t o l o o s e b a c k f i l l i s shown i n F i g . 52. A l t h o u g h t h e a t - r e s t
l o c a t i o n s o f t h e c e n t e r o f p r e s s u r e s d i f f e r , t h e a g r e e m e n t b e t w e e n tes t s i s
good a f t e r a sma l l amount o f w a l l p e n e t r a t i o n h a s t a k e n p l a c e . The average
l o c a t i o n o f t h e c e n t e r o f p r e s s u r e t h r o u g h o u t t h e f o u r l o o s e tes ts i s approx-
ima te ly 0.39H a b o v e t h e b a s e o f t h e wall.
82

c I I I I I I I
El AUG. II, 1965 TEST LI
o AUG. 12,1965 TEST L 2
(PENETRATION/WALL HEIGHT) X IO', ( Y I H ) x 10'
FIG. 46 EARTH- PRESSURE FACTOR CURVES -LOOSE CASE

I I I I I 1 I i
o AUG. 12,1965 TEST L3
A JULY If , 1965 TEST L7
9.0 - - 0 0
0 u cn 8D- - \
Y 0 7.0- 0 - c
a 0 8 C - c u
-
- W a
-
-
-
0 0.5 1.0 I .5 2 .o 2.5 3.0 3.5 4.0 I
( PENETRATION / WALL HEIGHT 1 X IO', (Y /H I X IO '
FIG. 47 EARTH - PRESSURE FACTOR CURVES -LOOSE CASE
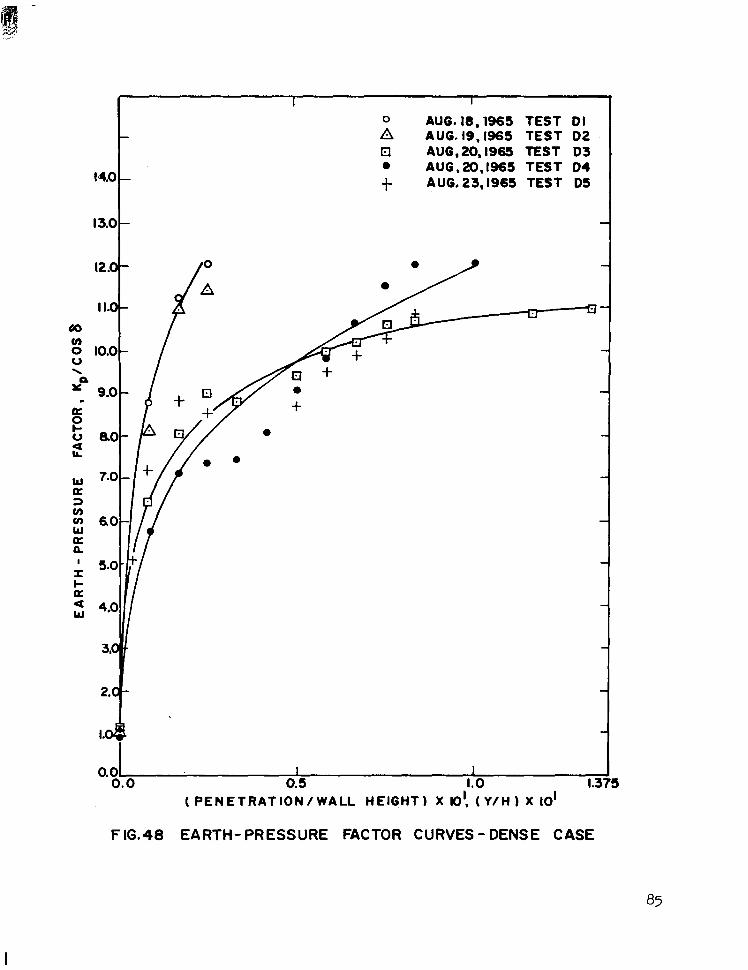
.
I I
0 AUG. 18,1965 TEST Dl - A AUG. 19,1965 TEST 02 El AUG.20, I965 TEST D3 0 AUG.20.1965 TEST 04
14.0 - f AUG. 23,1965 TEST D5
13.0 - -
-
-
-
-
0.0 I I 0.0 0.5 1.0 1.375
(PENETRATION/WALL HEIGHT) X lo', ( Y / H ) X IO'
F IG.48 EARTH- PRESSURE FACTOR CURVES - DENSE CASE
I

'.*Ol 14.0
AUG. 25, I965 TEST D6 A AUG. 26, 1965 TEST D7 0 SEPT. 5 , 1965 TEST DO t3 SEPT. 0 , 1965 TEST D 9 e SEPT,9, 1965 TEST DK)
6 I .o
0.0 I I 0.0 0.5 I .o 1.1:
( PENETRATION / WALL HEIGHT) X IO', W/H) X 10'
FIG. 49 EARTH- PRESSURE FAMOR CURVES - DENSE CASE
".I. .". ..." -"~--.-.--.. --.".In ... ".."I ..- .."" "".-."...__."_...

W W K Q
45.0 - -8 i 40.0 P
35.0 t a 30.0 -1
z a W
25.0 4
O 2(10 LL
W
Q J
2 15.0 a 0
10.0
s W
W D
> 5.0
0
4
max = 39.5. """ -+"" "=
I
- a
El AUO. I I , I965 TEST LI - 0 AUQ.12,1965 TEST L2
AUO.12,1965 TEST L3 A JULY 17, 1965 TEST L7 I
- I I I I I I I
(PENETRATtON/WALL HEIGHT) X 10' , ( Y / H ) X IO' 0.5 1.0 1.5 2 0 2.5 3.0 3.5 4.0
FIG. 50 INTERNAL FRICTION DEVELOPMENT CURVES - LOOSE CASE

55.0 1 I I 4 max = 5 1 . 7 O
""U""""""""" t 40.0
35.0 A Y h
30.0
250
M O
15.0
10.0
5.0
0 AUO.18,1966 TEST Dl A AUO. 19,1966 TEST 02
AUQ.20J965 TEST 03 AUG.20,1965 TEST D4
O b I I I
0.5 I .o 1.5 3
(PENETRATION/WALL HEIGHT) X IO1 , (Y /H) X IO1 FIG.51 INTERNAL FRICTION DEVELOPMENT CURVES - DENSE CASE

I
-
-
"""""""" 3.33- _. - - I
-i
\ W a 2 2.0 - - W Q)
P a
k A JULY 17,1965 TEST L7 El AUO. II, 1965 TEST L I 0 AUO. 12,1965 TEST L2 W
I= W 0
a 1.0
AUG. 12,1966 TEST L3 z - -
Y
O6 I I I I I I I
0.5 1.0 1.5 .2.0 2.5 3 .O 3.5 4.
(PENETRATION/WALL HElOHT 1 X 10' , (Y/H ) X 10'
FIG.52 VARIATIONS IN THE LOCATION OF THE CENTER OF PRESSURE - LOOSE CASE

The d a t a r e l a t i n g t o t h e l o c a t i o n o f t h e c e n t e r of e a r t h p r e s s u r e f o r
t h e d e n s e tests i s shown in F igs . 53 th rough 55 . A l l o f t h e tests, except D3,
e x h i b i t a s h a r p i n i t i a l upward s h i f t i n t h e l o c a t i o n o f t h e c e n t e r o f p r e s s u r e .
T h i s i n i t i a l s h i f t i s fol lowed by a downward s h i f t which i s i n t u r n f o l l o w e d
by a s l i g h t i n c r e a s e i n t h e l o c a t i o n o f t h e c e n t e r o f p r e s s u r e . The i n i t i a l
upward s h i f t was p roduced by ve r t i ca l movement of the wal l and loading f rame.
The upward movement o f t h e w a l l g r e a t l y r e d u c e d t h e h o r i z o n t a l e a r t h p r e s s u r e
nea r t he base o f t he wa l l , t hus p roduc ing an upward s h i f t o f t h e c e n t e r o f
p re s su re . Once the l oad ing f r ame made c o n t a c t w i t h t h e wooden r e s t r a i n t , t h e
w a l l moved a p p r o x i m a t e l y i n a h o r i z o n t a l d i r e c t i o n . T h i s h o r i z o n t a l movement
c a u s e d t h e c e n t e r o f p r e s s u r e t o s h i f t downward. The g radua l r ise i n t h e lo-
c a t i o n o f t h e c e n t e r o f p r e s s u r e n e a r t h e f i n a l s t a g e s o f e a c h test may have
been caused by the increased depth o f backf i l l mater ia l loca ted wi th in the
p l a s t i c f a i l u r e r e g i o n . The i n c r e a s e o f s o i l d e p t h i n t h e v i c i n i t y o f t h e
w a l l i s shown i n F i g . 18 on p. 27. The f i n a l s t a g e s o f Test D9 a r e r e p r e s e n t e d
by t h e b r o k e n l i n e i n F i g . 55. The f i n a l p o r t i o n o f t h e c u r v e i s r ep resen ted
d i f f e r e n t l y b e c a u s e t h e l o a d c e l l s were p o s i t i o n e d s o c e n t e r o f p r e s s u r e l o -
ca t ions be low 0.25H could not be measured. Hence, th is port ion of the curve
may n o t r e f l e c t t h e t r u e l o c a t i o n . The method t h a t was u s e d t o c a l c u l a t e t h e
l o c a t i o n o f t h e c e n t e r o f p r e s s u r e i s described on p. 170.
V a l u e s o f a t - r e s t c o e f f i c i e n t s o f e a r t h p r e s s u r e K and corresponding
l o c a t i o n s o f t h e c e n t e r o f p r e s s u r e s a r e shown i n T a b l e 3. Average values of
a t - r e s t c o e f f i c i e n t s , KO, for loose and dense s ta tes a r e 0 . 3 5 and 1.17 respect-
i v e l y . The co r re spond ing ave rage l oca t ions o f t he cen te r o f p re s su re fo r t he
l o o s e a n d d e n s e s t a t e s a r e 0 . 3 6 and 0 .33 respec t ive ly .
0

1 I I I I 1 I
0 AU6.lO, lSM TEST Dl A AUQ. 19, I965 TEST 02 El AUQ. 20,1966 TEST 03 0 AU6.23,1966 TE3T 04
I I I I I 1 I 0.2 5 0.5 0.15 1.0 1.25 1.s 1.15
(PENETRATION/ WALL HEleHT ) X IO', (Y/H) X 10'
FIG.53 VARIATIONS IN THE LOCATION OF THE CENTER OF PRESSURE - DENSE CASE

FIG.54 VARIATIONS IN THE LOCATION OF THE CENTER OF PRESSURE-DENSE CASE

11 I I I I I I I
4.5
Q) SEPT. 5,1965 TEST D8 SEPT. 8,1963 TEST D 9
0 SEPT. 9,1965 TEST Dl0 -
- - - -" - - - - - " -333- - - - - - - - -
-
2.5c -
2.0 I I I I I I
(PENETRATION /WALL HElQHT) X 10' , ( Y / H ) X 10' 0 0.25 0.50 0.75 ' 1.0 1.25 1.50 1.7 5 2s
I
FIG.55 VARIATIONS IN THE LOCATION OF THE CENTER OF PRESSURE - DENSE CASE
D

T e s t I d e n t i f i c a t i o n
TABLE 3
VALUES OF THE EARTH PRESSURE AT-REST COEFFICIENT
AND THE CORRESPONDING CENTER OF PRESSURES
Ear th P r e s s u r e A t - R e s t C o e f f i c i e n t
KO
C e n t e r o f P r e s s u r e / H e i g h t o f Wall
CD/H ( i n . / i n . )
7/17/65 - L7 8/11/67 - L 1 8/12/65 - L2 8/12/'65 - L 3 8/18/65 - D l 8/19/65 - D2 8/20/65 - D3 8/20/65 - D4 8/23/65 - D5 8/25/65 - D6 8/26/65 - D7 9/5/65 - D8 9/8/65 - D9 9/9/65 - D l 0
0 .31 0.57 0.27 0.24 0 . 9 9 1.00 1.11 0 .89 1.01 1 . 7 8 1 .50 1.07 1.30 1.08
0.46 0.30 0 .42 0 .25 0 .25 0 .37 0 . 4 5 0.33 0.26 0 .38 0 .42 0 .27 0 .36 0.25
94

FAILURE SURFACE ORIENTATION
The measu red and ca l cu la t ed o r i en ta t ion o f t he f a i lu re su r f ace fo r
each tes t a r e l i s t e d i n T a b l e 4 . The o r i e n t a t i o n o f t h e f a i l u r e s u r f a c e
was assumed t o b e p l a n e i n a l l c a s e s . The measured o r i e n t a t i o n o f t h e f a i l u r e
plane, @,(Fig. 8, p. ll), was found using
where ,
H = Wall Height,
DM = Measured hor izonta l d i s tance be tween the upper inner edge
o f t h e w a l l a n d t h e i n t e r s e c t i o n o f t h e f a i l u r e s u r f a c e and
t h e s u r f a c e o f t h e b a c k f i l l .
C a l c u l a t e d o r i e n t a t i o n s were found using Eq 26 on p . 172 . In every in -
s tance the measured angle was g r e a t e r t h a n t h e c a l c u l a t e d a n g l e . I f t h e w a l l
were p e r f e c t l y smooth t h e c a l c u l a t e d a n g l e w o u l d b e e q u a l t o (45’ - @/2) , o r
2 5 . 3 d e g r e e s f o r t h e l o o s e s t a t e a n d 1 9 . 2 d e g r e e s f o r t h e d e n s e s t a t e .
95

TABLE 4
COMPARISON BETWEEN MEASURED AND CALCULATED ORIENTATIONS
OF THE FAILURE SURFACE AT MAXIMUM MEASURED EARTH PRESSURES
P e n e t r a t i o n / F a i l u r e S u r f a c e O r i e n t a t i o n s Test H t . o f Wall Meas. Angle Calc. Angle
I d e n t i f i - Y /H Bm B T Rat io ca t ion ( i n . / i n . ) (Degree ) (Degree ) Ca lc . heas .
7/17/65 - L7 8/11/65 - L 1 8/12/65 - L2 8/12/65 - L3 8/18/65 - D l 8 /19/65 - D2 8/20/65 - D3 8/20/65 - D4 8/23/65 - D5 8/25/65 - D6 8/26/65 - D7 9/5/65 - D 8 9/8/65 - D9 9/9/65 - Dl0
0.250 0.300 0.317 0.317 0.0250 0.0250 0.133 0,100 0.0833 0.0167 0.0250 0.0250 0.0500 0.0500
25.7 24.8 21.8 23.0 24.5 23.3 21.8 22.5 21.3
21.3 18.0
20.0
”
”
18.0 17.0 16.9 16.9 14.2 14.2
7.0 7 .0 7.5
15 .9 14.2 14.2 9 .8 9 .8
0.7 0 . 7 0 .8 0.7 0 . 6 0 .6 0 . 3 0 . 3 0 . 4
0.7 0 .8
0 .5 -
96

CHAPTER VI1
PHASE I1 TEST RESULTS AND DISCUSSION
This phase o f t e s t ing u t i l i zed 12 and 18 i n . h i g h p l a t e s . U n l i k e
Phase I t h e r a t e o f wall p e n e t r a t i o n was var ied f rom test t o t e s t , a l though ,
t h e r a t e was h e l d c o n s t a n t d u r i n g a n y o n e tes t . A s prev ious ly no ted , t he
loading appara tus used dur ing Phase I c o n t a i n e d s e v e r a l u n d e s i r a b l e f e a t u r e s
wh ich had t o be co r rec t ed be fo re t he s econd phase o f t e s t ing cou ld be unde r -
taken . The changes tha t were made a r e d i s c u s s e d i n C h a p t e r 111. S i n c e t h e
r a t e s o f p e n e t r a t i o n u s e d d u r i n g t h i s p h a s e o f t e s t i n g were g r e a t e r t h a n t h e
r a t e o f p e n e t r a t i o n u s e d i n P h a s e I, ano the r method was u t i l i z e d t o s u p p o r t
t h e p l a t e s i n a v e r t i c a l d i r e c t i o n . However, t h i s method r e t a r d e d t h e meas-
urement o f deve loped wal l f r ic t ion . Before a f r i c t i o n a l f o r c e was i n d i c a t e d
by the load c e l l , t h e upward f o r c e on t h e f r o n t f a c e o f t h e w a l l h a d t o o v e r -
come the we igh t o f t he cen te r p l a t e and t he f r i c t iona l fo rce deve loped be tween
t h e t h r e e h o r i z o n t a l l o a d m e a s u r i n g ce l l s and t h e r e a r f a c e o f t h e p l a t e .
The re fo re , i t was n e c e s s a r y t o u s e t h e w a l l f r i c t i o n d a t a t h a t was ob ta ined
dur ing Phase I.
The da ta p re sen ted i n F ig . 44 i nd ica t e s t ha t t he measu red deve lopmen t
o f w a l l f r i c t i o n , when t h e b a c k f i l l was p l a c e d i n a l o o s e s t a t e , was e r r a t i c .
Hence, a c u r v e i d e n t i c a l t o t h e c o n s t r u c t e d c u r v e shown i n F i g . 4 5 was used
f o r t h e a n a l y s i s o f t h e l o o s e t e s t d a t a f o r P h a s e 11. The dense t e s t d a t a
p r e s e n t e d i n F i g s . 4 2 . a n d 4 3 i n d i c a t e s t h a t t h e a v e r a g e s l o p e o f t h e e a r l y
p o r t i o n o f t h e c u r v e is 4 4 4 d e g r e e s / i n . p e n e t r a t i o d i n . o f w a l l h e i g h t .
The sma l l amount o f wal l f r ic t ion da ta ob ta ined f rom the Phase I1 dense tests
i n d i c a t e d t h a t t h e maximum v a l u e o f d e v e l o p e d w a l l f r i c t i o n was approximately
28 degrees . Us ing the above in format ion the wal l f r ic t ion-penet ra t ion curves
shown i n F i g , 56 were cons t ruc t ed . The curve cons is t s o f two l i n e a r p o r t i o n s
97

PENETRATION / HEIGHT OF WALL, Y/H
LOOSE CASE
0 0.29 I PENETRATION /HEIGHT O F WALL, Y/H
FIG. 56 CONSTRUCTED WALL FRICTION CURVES FOR LOOSE AND DENSE CASES
a n d a n i n t e r m e d i a t e p a r a b o l i c p o r t i o n .
Dur ing th i s phase of t e s t i n g , at-rest ear th p ressure measurements were
not recorded. The at-rest c o e f f i c i e n t s l i s t e d i n T a b l e 3 were u s e d a s a b a s i s
f o r s e l e c t i n g a t - r e s t c o e f f i c i e n t s f o r t h e b a c k f i l l i n i t s loose and dense
s t a t e s . A value of 0 .27 was c h o s e n f o r t h e l o o s e s t a t e a n d a v a l u e of 1.0
f o r t h e d e n s e s ta te .
The p r i n c i p a l p u r p o s e o f t h i s p h a s e of t e s t i n g was t o d e t e r m i n e t h e
r e l a t i o n b e t w e e n t h e r a t e o f wall p e n e t r a t i o n a n d t h e maximum developed
p a s s i v e e a r t h p r e s s u r e . T y p i c a l e a r t h p r e s s u r e - p e n e t r a t i o n c u r v e s f o r l o o s e
and dense tests a r e shown i n F i g s . 57 and 58 r e s p e c t i v e l y . The upper curve
i n e a c h f i g u r e was ob ta ined u s ing an 18 in . wa l l and t he l ower cu rves re-
p r e s e n t d a t a p l o t t e d f r o m 1 2 i n . w a l l tes ts .
EFFECT OF WALL PENETRATION VELOCITY ON EARTH PRESSURE
Tests were conduc ted u s ing wa l l pene t r a t ion ve loc i t i e s o f 0 .00667 ,
0 .0133, 0 .0333, 0 .133, 0 .533, and 2 .67 i p s . S e m i l o g a r i t h m i c p l o t s o f t h e
Maximum Ear th -P res su re Fac to r ve r sus Ve loc i ty a r e shown i n F i g s . 59 and 60
f o r t h e l o o s e a n d d e n s e s t a t e s r e s p e c t i v e l y . The p l o t s i n d i c a t e t h a t t h i s
r a n g e o f w a l l p e n e t r a t i o n v e l o c i t i e s h a s a n e g l i g i b l e i n f l u e n c e upon t h e
maximum d e v e l o p e d e a r t h p r e s s u r e . However, t h e e x a c t n a t u r e o f t h e r e l a -
t i onsh ip has been obscu red by t h e s c a t t e r i n t h e e x p e r i m e n t a l d a t a . Examina-
t i o n o f c o m p l e t e e a r t h p r e s s u r e - p e n e t r a t i o n c u r v e s showed o n c e a g a i n t h a t t h e
r e l a t i o n s h i p b e t w e e n t h e r a t e o f w a l l p e n e t r a t i o n a n d d e v e l o p e d e a r t h p r e s s u r e
was obscured by s c a t t e r i n t h e d a t a .
COMPARISON BETWEEN MEASURED AND CALCULATED EARTH-PRESSURE FACTORS
S i n c e t h e ra te o f w a l l p e n e t r a t i o n d i d n o t h a v e a s i g n i f i c a n t e f f e c t
upon t h e d e v e l o p e d e a r t h p r e s s u r e , t h e m e a s u r e d e a r t h - p r e s s u r e r e s u l t s were
99
p IIIIIIII IIIII I 1

ua v) a n 0 6/21/66 TEST L2 18 IN. WALL
o 4/23/66 TEST L3 12 IN. W A L L
0 I I 1
1.0 2 .o 3.0 PENETRATION , Y , IN.
1 4.0
FlG.57 TYPICAL PASSIVE EARTH PRESSURE DEVELOPMENT FOR 12IN. AND 18 IN. WALLS - LOOSE CASE

o 5/9/66 TEST Dl 18 IN. WALL 4/12/66 TEST 03 121N. WALL
-
-
-
0 I I I I I 0.0 0. I 0.2 0.3 0.4 0.5
PENETRATION, Y, IN.
FIG. 58 TYPICAL PASSIVE EARTH PRESSURE VERSUS PENETRATION FOR 12 AND 18 IN. WALLS - DENS E CASE
101
I

9.0 - 00 v) 0 0 \
Y - 80- - a
8!
0 I- o
7.0 - W K 3 v) v) W a
6.0-
I- I a a W
x I 3 50- - X
I a
0
A V 0 t
18 IN. WALL 12 IN. WALL 18 IN. WALL AVE. AVE. OF 12 AND 18 IN. WALL VALUES 12 IN. WALL AVE.
A
0 A
n 0
4.0 I I I l l 1 I I I 1 1 I I I 1 1 I 1 0.001 0.0 I 0. I I .o 5.0
VELOCITY, IN./SEC (LOG SCALE)
FIG. 59 MAXIMUM EARTH - PRESSURE FACTOR VERSUS VELOCITY -LOOSE CASE

20.0 - Go v) 0
A V 0
x" 18.0- 4-
+ 0
0
Y
rr'
s
51,
X
I 4
le IN. WALL
12 IN. WALL 18 IN. WALL AVE. AVE. OF 12 AND 18 IN. WALL VALUES 12 IN. WALL AVE. o * TEST VALUES NOT USED IN COMPUTING AVERAGES
0 *
A *
A a
A 8 A +\$/J
A
A a A
A A A
10.01 I I I 1 1 0 1 I I I I I I I I 1 I I 1 0.00 I .o I 0. I 1.0 5.0
V E LO C ITY , IN. /SEC (LOG SCALE 1
FIQ.60 MAXIMUM EARTH- PRESSURE FACTOR VERSUS VELOCITY -DENSE CASE

once again compared with Coulomb's theory of p a s s i v e e a r t h p r e s s u r e . A l l of
t h e terms t h a t a r e p r e s e n t e d i n t h i s s e c t i o n are d e f i n e d i n C h a p t e r V I .
Twelve Inch Wall (Loose Tests)
The r e s u l t s o b t a i n e d from t h e l o o s e tests w i t h t h e 1 2 i n . w a l l a r e
l i s t e d i n T a b l e 5. The l i s t i n g i n d i c a t e s t h e c a l c u l a t e d e a r t h - p r e s s u r e f a c t o r s
a r e g r e a t e r t h a n t h e m e a s u r e d f a c t o r s . The d i f f e r e n c e i n v a l u e s stems mainly
from t h e method used t o e v a l u a t e t h e d e v e l o p e d a n g l e o f w a l l f r i c t i o n . The
p r e d i c t i o n o f p a s s i v e e a r t h p r e s s u r e u s i n g C o u l o m b ' s e q u a t i o n i s extremely
s e n s i t i v e t o v a r i a t i o n s i n t h e a n g l e o f w a l l f r i c t i o n . It was n o t p o s s i b l e t o
use a r a t i o n a l - a p p r o a c h i n c o n s t r u c t i n g a w a l l f r i c t i o n - p e n e t r a t i o n c u r v e f o r
a b a c k f i l l p l a c e d i n a l o o s e s t a t e a n d i t i s , t h e r e f o r e , e x p e c t e d t h a t some
e r r o r would e x i s t .
Table 5 a l s o i n d i c a t e s t h a t t h e d e v e l o p e d a n g l e s o f i n t e r n a l f r i c t i o n
are much below t h e 39.5 d e g r e e s o b t a i n e d f r o m t r i a x i a l tes ts . This d i screpancy
i s a s s o c i a t e d w i t h t h e e r r o r i n v o l v e d i n u s i n g t h e w a l l f r i c t i o n - p e n e t r a t i o n
c u r v e f o r t h e l o o s e c a s e shown i n F i g . 56 on p. 98. The developed angle of
i n t e r n a l f r i c t i o n i s c a l c u l a t e d u s i n g t h e m e a s u r e d e a r t h p r e s s u r e and t h e
co r re spond ing deve loped ang le o f wa l l f r i c t ion a s p red ic t ed by t he cons t ruc t ed
cu rve . These va lues a r e i n se r t ed i n Cou lomb ' s equa t ion and t he va lue o f i n -
t e r n a l f r i c t i o n @ i s v a r i e d u n t i l a va lue o f @ i s f o u n d w h i c h s a t i s f i e s
t he equa t ion .
Twelve Inch Wall (Dense Tests)
The r e s u l t s from t h i s series of tes ts are t a b u l a t e d i n T a b l e 6. I n
e v e r y i n s t a n c e t h e m e a s u r e d e a r t h - p r e s s u r e f a c t o r s a r e g r e a t e r t h a n t h e
c a l c u l a t e d f a c t o r s . A l t h o u g h t h e r e i s some d iscrepancy , the agreement i s good.
S i n c e a l l t h e m e a s u r e d e a r t h - p r e s s u r e f a c t o r s a r e g r e a t e r t h a n t h e c a l c u l a t e d
104
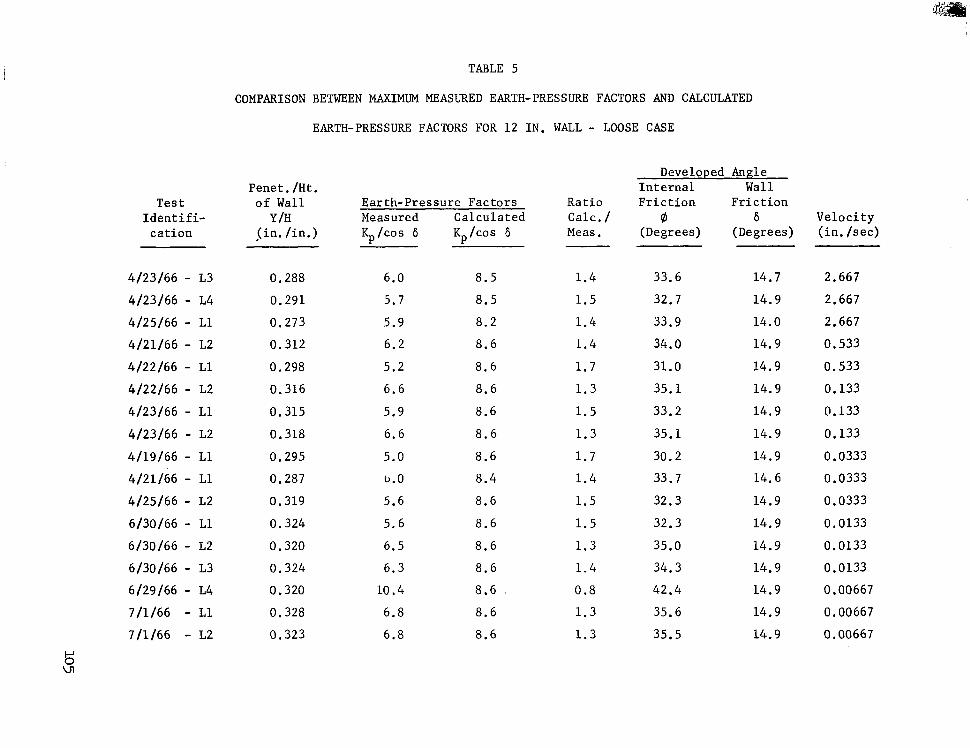
Test I d e n t i f i-
ca t ion
4/23/66 - L3
4/23/66 - L4
4/25/66 - L 1
4/21/66 - L2
4/22/66 - L1
4/22/66 - L2
4/23/66 - L 1
4/23/66 - L2
4/19/66 - L l
4/21/66 - L 1
4/25/66 - L2
6130166 - L 1
6130166 - L2
6130166 - L3
6/29/66 - L4
7/1/66 - L 1
7/1/66 - L2
TABLE 5
COMPARISON BETWEEN MAXIMUM MEASURED EARTH-PRESSURE FACTORS AND CALCULATED
EARTH-PRESSURE FACTORS FOR 12 IN. WALL - LOOSE CASE
Penet . / H t . o f Wall Y /H
{ in . / in . )
0.288
0.291
0.273
0.312
0.298
0.316
0.315
0.318
0.295
0.287
0.319
0.324
0.320
0.324
0.320
0.328
0.323
Earth-Pressure Factors Measured Calculated %/cos 6 Kp/cos 6
6.0 8.5
5.7 8.5
5.9 8.2
6 . 2 8.6
5.2 8.6
6.6 8.6
5.9 8.6
6.6 8.6
5.0 8.6
b.0 8 .4
5.6 8.6
5.6 8.6
6.5 8.6
6 .3 8 .6
10.4 8.6
6.8 8.6
6.8 8.6
Rat io Calc. / Meas.
1 .4
1 .5
1.4
1.4
1 . 7
1 .3
1 .5
1 .3
1 . 7
1 .4
1 .5
1 .5
1 .3
1 . 4
0.8
1 .3
1 . 3
Developed Angle Wall I n t e r n a l
F r i c t i o n @
(Degrees)
33.6
32.7
33.9
34.0
31.0
35.1
33.2
35.1
30.2
33.7
32.3
32.3
35.0
34.3
42.4
35.6
35.5
F r i c t ion 6
(Degrees)
14.7
14.9
14.0
14.9
14.9
14.9
14.9
14.9
14.9
14.6
14.9
14.9
14.9
14.9
14.9
14.9
14.9
Veloc i ty ( in . / sec)
2.667
2.667
2.667
0.533
0.533
0.133
0.133
0.133
0.0333
0.0333
0.0333
0,0133
0.0133
0.0133
0.00667
0.00667
0.00667

TABLE 6
COMPARISON BETWEEN MAXIMUM MEASURED EARTH-PRESSURE FACTORS AND CAZCULATED
EARTH-PRESSURE FACTORS FOR 1 2 I N . WALL - DENSE CASE
Penet . / H t . Developed Angle
I n t e r n a l Wall Tes t o f Wal l Ea r th -P res su re Fac to r s Ra t i o F r i c t ion F r i c t ion
I d e n t i f i - Y /H Measured Calculated Calc. / Q, 6 Ve loc i ty c a t i o n ( i n . /in.) g l c o s 6 g / c o s 6 Meas. (Degrees) (Degrees) ( in, /sec)
.- - 6/29/66 - D l 6/29/66 - D2 4/13/66 - D l 4/14/66 - D l 4/6/66 - D l 4/12/66 - D2 4/12/66 - D3 6/24/66 - D2 6/28/66 - D l 4/4/66 - D l 4/26/66 - D l 4/26/66 - D2 6/24/66 - D l 6/24/66 - D 3 3/29/66 - D l 3/29/66 - D2 3130166 - D l 6/23/66 - D2 6/23/66 - D3 6/23/66 - D4 4/4/66 - D2 4/5/66 - D 2 6/22/66 - D2 6/22/66 - D3 4/5/66 - D3 6/22/66 - D l 6/23/66 - D l
0.0177 0.0180 0.00692 0.0117 0.00992 0.00920 0.0115 0.0184 0.0163 0.0107 0.00833 0.00833 0.00790 0.00795 0.00960 0.00710 0.00749 0.0110 0.0103 0.0194 0.00940 0.00817 0.0100 0.0129 0.00805 0.0137 0.00836
18.4 15.9 12.8 12.6 12.4 11.5 1 2 . 7 14.6 13.0 12.4 11. b 11.3 13.0 1 2 . 1 12.7 11.3 12.2 1 1 . 7 1 1 . 2 14.1 10.7 11.0 13.7 13.0 12.0 15.0 12.4
12.9 13.0
9.7 11.0 10.5 10 .3 10.9 13.1 12 .4 10.7 10.0 10.0 10.0 10.0 10.4 9.8 9 .9
10.8 10.6 13.5 10.4 10.0 10.5 11.3 10.0 11.6 10.1
0.7 0 .8 0 .8 0.9 0 .8 0.9 0.9 0.9 1.0 0 .9 0 .9 0.9 0 .8 0.9 0.8 0 .9 0.8 0 .9 0 .9 1 .0 1.0 0.9 0.8 0.9 0.8 0 .8 0.8
56.3 54.4 55.9 53.8 54.2 53.4 53.9 53.1 52.4 53.8 53.9 53.4 55.7 54.6 54.7 54.0 54.9 52.9 52.5 52.3 52.2 53.1 55.7 53.7 54.5 55.4 54.8
7.9 8.0 3 . 7 5.2 4.4 4 .1 5 .1 8 .2 7.2 4.8 3 . 7 3 .7 3.5 3 . 5 4 .3 3.2 3 . 3 4.9 4.6 8 .6 4.2 3.6 4 . 4 5.7 3 .6 6 . 1 3.7
2.667 2.667 2.667 2.667 0.533 0.533 0.533 0.533 0.533 0.133 0.133 0.133 0.133 0.133 0.0333 0.0333. 0.0333 0.0333 0.0333 0.0333 0.0133 0.0133 0.0133 0.0133 0.00667 0.00667 0.00667

f a c t o r s , t h e d e v e l o p e d a n g l e o f i n t e r n a l f r i c t i o n @ was found t o b e g r e a t e r
t han the 51.7 d e g r e e v a l u e o b t a i n e d f r o m t r i a x i a l tests. However, i t has been
shown by C o r n f o r t h 2 t h a t t h e maximum va lue o f @ obtained from a t r i a x i a l tes t
i s 0.5 t o 4.0 degrees less t h a n t h a t o b t a i n e d i n a p l a n e s t r a i n t e s t . The
a b o v e s t a t e m e n t p e r t a i n s t o r e s u l t s o b t a i n e d f r o m tests using Brasted sand.
The 0 .5 d e g r e e v a l u e c o r r e s p o n d s t o a loose sand condi t ion and the 4.0 degree
v a l u e c o r r e s p o n d s t o a d e n s e s a n d c o n d i t i o n . I f t h e t r i a x i a l v a l u e o f @
were a d j u s t e d t o c o n f o r m t o a p l a i n s t r a i n 4 v a l u e , t h e c a l c u l a t e d e a r t h -
p r e s s u r e f a c t o r s f o r d e n s e tests would most l i k e l y a g r e e b e t t e r w i t h t h e
major i ty o f the measured va lues . .
The developed angle o f w a l l f r i c t i o n , 6 , i s i n e v e r y c a s e much less
than @ / 3 . It can a l so be s een , by compar ing t he d imens ion le s s quan t i t i e s
( P e n e t r a t i o n / H e i g h t o f W a l l ) l i s t e d i n T a b l e s 2 and 6 , t h a t t h e amount o f
p e n e t r a t i o n r e q u i r e d t o d e v e l o p t h e maximum e a r t h - p r e s s u r e f a c t o r s a r e much
less f o r t h e P h a s e I1 series of t e s t s . T h e d i f f e r e n c e s i n t h e d i m e n s i o n l e s s
q u a n t i t i e s i s a t t r i b u t e d t o t h e v e r t i c a l w a l l movement wh ich t ook p l ace i n t he
Phase I s e r i e s of tes ts . The upward movement c a u s e d t h e h o r i z o n t a l e a r t h pres-
s u r e s t o b e r e d u c e d i n e a r l y s t a g e s of p e n e t r a t i o n . Once the wal l s topped mov-
i n g i n a v e r t i c a l d i r e c t i o n t h e p r e s s u r e s b e g a n t o i n c r e a s e more r a p i d l y . How-
e v e r , t h i s i n c r e a s e i n p r e s s u r e o c c u r r e d a t p e n e t r a t i o n s g r e a t e r t h a n t h e pene-
t r a t i o n r e q u i r e d t o p r o d u c e f a i l u r e i n t h e b a c k f i l l when p e n e t r a t e d by t h e
wall moving s t r i c t l y i n a h o r i z o n t a l d i r e c t i o n .
Eighteen Inch Wall (Loose Tests)
Th i s series of tests is similar t o t h e l o o s e tests conducted us ing the
12 i n . w a l l . The b a s i c d i f f e r e n c e s i n t h e two series of tests were t h e h e i g h t
a n d l o c a t i o n o f t h e w a l l . The top and bo t tom edges o f t he 18 i n . w a l l were

l o c a t e d 3 in . above and be low the top and bo t tom of the 12 in . wal l . Al though
the bo t tom edge of 18 i n . w a l l was 3 i n . c l o s e r t o t h e b o t t o m o f the sandbox,
i t i s f e l t t h a t t h i s change i n d i s t a n c e d o e s n o t s i g n i f i c a n t l y c h a n g e t h e bound-
a r y c o n d i t i o n s .
The r e s u l t s l i s t e d i n T a b l e 7 a g r e e well w i t h t h e r e s u l t s o b t a i n e d from
t h e 12 i n . w a l l tests. The measured and c a l c u l a t e d 18 i n . w a l l e a r t h - p r e s s u r e
f a c t o r s a r e g e n e r a l l y l o w e r t h a n t h e 12 i n . w a l l v a l u e s . The r e s u l t s would have
ag reed c lose r had t he d imens ion le s s r a t io (Pene t r a t ion /He igh t o f Wal l ) va lues
been equal for each series of tes ts . It s h o u l d b e n o t e d t h a t t h e same con-
s t r u c t e d w a l l f r i c t i o n c u r v e was used for the 12 and 18 i n . w a l l t e s t s .
Eighteen Inch Wall (Dense Tests)
Test r e s u l t s f o r t h i s series of t es t s a r e s i m i l a r t o t h e v a l u e s l i s t e d
i n T a b l e 6. T h e m e a s u r e d a n d c a l c u l a t e d e a r t h - p r e s s u r e f a c t o r s l i s t e d i n T a b l e 8
a re bo th gene ra l ly h ighe r t han t hose f rom the 12 i n . w a l l tes ts . Comparison of
t h e two t a b l e s a l s o i n d i c a t e s t h a t t h e d i m e n s i o n l e s s r a t i o ( P e n e t r a t i o n / H e i g h t
of Wall) values obtained f rom the 18 i n . w a l l t es t s a r e l a r g e r t h a n t h e 1 2 i n .
wal l va lues . Hence , the deve loped angles o f wal l f r ic t ion a re a l so l a rger ,
s i n c e t h e same c o n s t r u c t e d w a l l f r i c t i o n c u r v e was u s e d f o r b o t h s e r i e s o f t e s t s .
COMPARISON BETWEEN MEASURED AND CALCULATED ORIENTATIONS ~~~ OF ~ THE - FAILURE - ~ - . SURFACE . . . -
The measu red and ca l cu la t ed o r i en ta t ions o f t he f a i lu re su r f ace fo r
each series o f t es t s a r e l i s t e d i n T a b l e s 9 through 12 . The methods used i n
m e a s u r i n g a n d c a l c u l a t i n g t h e o r i e n t a t i o n s o f t h e f a i l u r e s u r f a c e s a r e s i m i l a r
t o t h o s e u s e d i n o b t a i n i n g t h e P h a s e I re su l t s . These me thods a r e d i scussed
i n C h a p t e r V I and Appendix A. Examinat ion of each tab le shows t h a t i n e v e r y c a s e
t h e c a l c u l a t e d a n g l e @T i s smal le r than the measured angle Bm. N e a r l y a l l t h e
108

TABLE 7
COMPARISON BETWEEN M A X I M U M MEASURED EARTH-PRESSURE FACTORS AND CLCULATED
EARTH-PRESSURE FACTORS FOR 18 I N . WALL - LOOSE CASE
Developed Angle Pene t . / H t . I n t e r n a l Wall
T e s t o f Wall E a r t h - P r e s s u r e F a c t o r s R a t i o F r i c t i o n F r i c t i o n I d e n t i f i - Y /H Measured Calcu la ted Calc . / @ 6 V e l o c i t y
c a t i o n ( i n . / i n . ) K /cos 6 K / cos 6 Meas. (Degrees) (Degrees) ( in. /sec) P P
6/15/66 - L1 6/15/66 - L2 6/16/66 - L 1 6/8/66 - L1 6/8/66 - L2 6/8/66 - L3 6/16/66 - L2 6/16/66 - L 3 6/16/66 - L4 6/20/66 - L3 6120166 - L4 6120166. - L5 6/17/66 - L 1 6/17/66 - L2 6/21/66 - L2 6/17/66 - L3 6/20/66 - L1 6/20/66 - L2 6/21/66 - L3
0.196 0.207 0.210 0.209 0.199 0.228 0.199 0.216 0.212 0.216 0.208 0.223 0.215 0.214 0.208 0.210 0.212 0.215 0.211
5.2 5 . 4 5.7 4.9 5.1 5 .5 5.7 6.0 6.0 6 . 5 5.7 6 . 1 6.0 6 .1 5.8 6 .1 6 . 1 6.2 5 .6
6 .8 6.9 7.0 7 .0 6 . 8 7 .3 6.8 7 . 1 7.0 7 . 1 6.9 7.2 7 . 1 7.0 6.9 7.0 7.0 7 . 1 7 .0
1.3 1 .3 1.2 1.4 1 . 3 1.3 1 .2 1.2 1 . 2 1.1 1 .2 1.2 1 . 2 1.1 1 . 2 1.1 1.1 1.1 1 . 3
34.7 34.8 35.8 33.0 33.9 34.5 36.2 36.5 36.8 38.0 35.7 36.5 36.5 36.9 36.2 37.0 36.8 37.1 35.5
10.0 10.6 10.7 10.7 10.2 11.6 10 .1 11.0 10.8 11.0 10.6 11.4 11.0 10.9 10.6 10.7 10.8 11.0 10.8
2.667 2.667 2.667 0.533 0.533 0.533 0.133 0.133 0.133 0.0333 0.0333 0.0333 0.0133 0.0133 0.00667 0,00667 0.00667 0.00667 0.00667
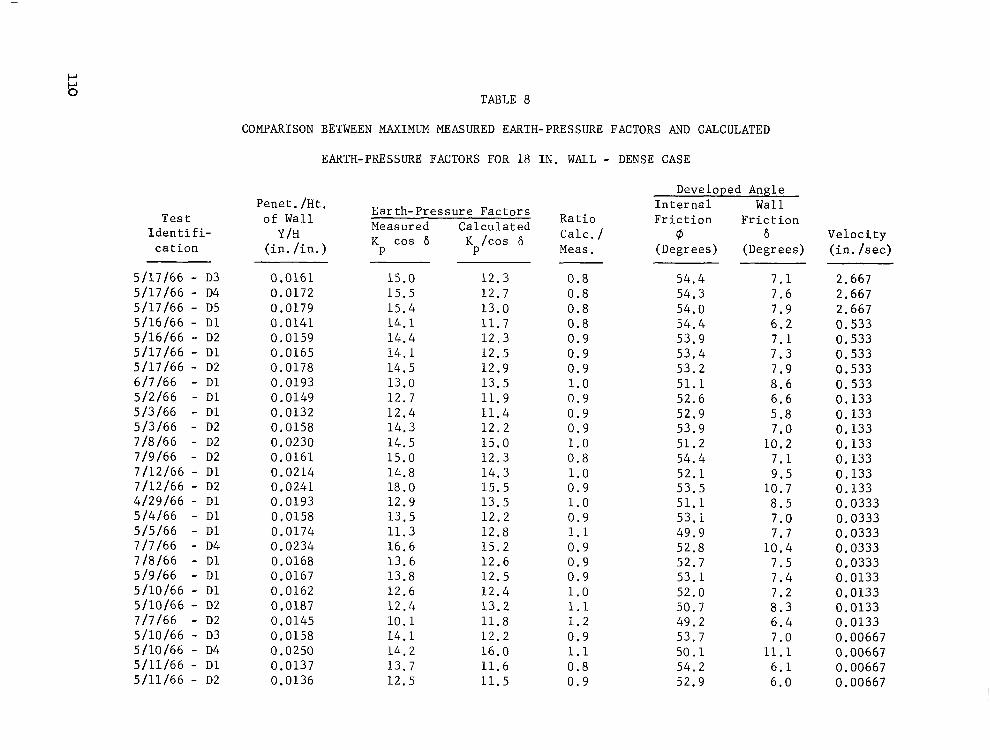
T e s t I d e n t i f i -
c a t i o n
5/17/66 - D3 5/17/66 - D4 5/17/66 - D5 5/16/66 - D l 5/16/66 - D2 5/17/66 - D l 5/17/66 - D2 6/7/66 - D l 5/2/66 - D l 5/3/66 - D l 5/3/66 - D2 7/8/66 - D2 7/9/66 - D2 7/12/66 - D l 7 /12 /66 - D2 4/29/66 - D l 5 /4/66 - D l 5/5/66 - D l 7/7/66 - D4 7/8/66 - D l 5/9/66 - D l 5110166 - D l 5110166 - D2 7/7/66 - D 2 5110166 - D3 5/10/66 - D4 5/11/66 - D l 5/11/66 - D2
TABLE 8
COMPARISON BETWEEN MAXIMUM MEASURED EARTH-PRESSURE FACTORS AND CALCULATED
EARTH-PRESSURE FACTORS FOR 18 I N . WALL - DENSE CASE
Developed Angle I n t e r n a l Wall Penet . / H t .
of Wall y /H
( i n . / i n . ) P P Meas. (Degrees) (Degrees)
Earth-Pressure Factors Measured Calculated K cos 6 K /cos 6
Rat io F r i c t i o n F r i c t i o n Calc. / @ 6 Ve loc i ty
( i n . /sec)
0.0161 0.0172 0.0179 0.0141 0.0159 0.0165 0.0178 0.0193 0.0149 0.0132 0,0158 0,0230 0.0161 0.0214 0.0241 0.0193 0.0158 0.0174 0.0234 0.0168 0.0167 0.0162 0.0187 0.0145 0.0158 0.0250 0.0137 0.0136
15.0 15.5 15 .4 14.1 14.4 1 4 . 1 14.5 13.0 1 2 . 7 12 .4 14 .3 14.5 15.0 14.8 18.0 12.9 13.5 11 .3 16.6 13.6 13.8 1 2 . 6 12 .4 1 0 . 1 14.1 14.2 13.7 12.5
12.3 1 2 . 7 13.0 1 1 . 7 12 .3 12.5 12.9 13.5 11.9 11.4 1 2 . 2 15.0 12 .3 14 .3 15.5 13.5 1 2 . 2 12.8 15.2 1 2 . 6 12.5 12 .4 13.2 11.8 1 2 . 2 16.0 11 .6 11.5
0.8 0 .8 0.8 0 .8 0 .9 0 .9 0 .9 1 . 0 0 .9 0 . 9 0 .9 1 . 0 0 .8 1 . 0 0 .9 1 . 0 0 . 9 1.1 0 .9 0 .9 0.9 1 . 0 1.1 1 . 2 0 .9 1.1 0 .8 0 .9
54.4 54.3 54.0 54.4 53.9 53.4 53.2 51 .1 52.6 52.9 53.9 51.2 54.4 52.1 53.5 51.1 53.1 49.9 52.8 52.7 53.1 52.0 50.7 49.2 53.7 50 .1 54.2 52.9
7 . 1 7.6 7 . 9 6 . 2 7 . 1 7 .3 7 . 9 8 .6 6.6 5.8 7.0
10.2 7 . 1 9 .5
10.7 8 .5 7.0 7 . 7
10.4 7 . 5 7.4 7.2 8 . 3 6 . 4 7.0
11.1 6 . 1 6 .0
2.667 2.667 2.667 0.533 0.533 0.533 0.533 0.533 0.133 0.133 0.133 0.133 0.133 0.133 0.133 0.0333 0.0333 0,0333 0.0333 0.0333 0.0133 0.0133 0.0133 0.0133 0,00667 0.00667 0.00667 0.00667

TABLE 9
COMPARISON BETWEEN MEASURED AND CALCULATED ORIENTATIONS
OF THE FAILURE SURFACE FOR 1 2 I N . WALL - LOOSE CASE
T e s t I d e n t i f i -
c a t i o n
4/23/66 - L3 4 /23/66 - L4 4/25/66 - L 1 4 /21/66 - L2 4/22/66 - L1 4/22/66 - L2 4 /23/66 - L 1 4/23/66 - L2 4/19/66 - L1 4/21/66 - L1 4 /25/66 - L2 6/30/66 - L1 6/30/66 - L2 6/30/66 - L3 6/29/66 - L4 7/1/66 - L1 7/1/66 - L2
P e n e t r a t i o n / H t . o f Wall
Y /H ( i n . / i n . )
0.288 0 . 2 9 1 0.273 0.312 0.298 0.316 0.315 0.318 0.295 0.287 0.319 0.324 0.320 0.324 0.320 0.328 0 .323
zz F a i l u r e S u r f a c e O r i e n t a t i o n s Meas. Angle Calc. Angle
(Degree) (Degree) k n B T
21.8 21.8 24.8 21.4
22.8 24.0
2 6 . 1 24.4 24.0 20.6 22.1 20.6 21.8 21.8 21.8
”
“
17.0 16.9 17.3
16 .9 16 .9 16.9 16.9 i 6 . 9 1 7 .O 16.9 16 .9 16.9 16.9 16.9 16 .9 16.9
i 6 . 9
R a t i o Calc. /Meas.
0 . 8 0 .8 0.7 0 . 8
0 . 7 0 . 7
0 . 6 0 . 7 0.7 0 . 8 0.8 0 . 8 0 .8 0 . 8 0 . 8
-
-
111
n

TABLE 10
COMPARISON BETWEEN MEASURED AND CALCULATED ORIENTATIONS
OF THE FAILURE SURFACE FOR 12 I N . WALL - DENSE CASE
Test I d e n t i f i-
c a t i o n
6/29/66 - D l 6/29/66 - D2 4/13/66 - D l 4/14/66 - D l 4/6/66 - D l 4 /12/66 - D2 4/12/66 - D3 6/24/66 - D 2 6/28/66 - D l 4/4/66 - D l 4/26/66 - D l 4/26/66 - D2 6/24/66 - D l 6/24/66 - D 3 3/29/66 - D l 3/29/66 - D2 3/30/66 - D l 6/23/66 - D2 6/23/66 - D 3 6/23/66 - D4 4/4/66 - D2 4/5/66 - D2 6/22/b6 - D2 6/22/66 - D 3 4/5/66 - D 3 6/22/66 - D l 6/23/66 - D l
P e n e t r a t i o n / H t . o f Wall
Y /H ( i n . / i n . )
0.0177 0.0180 0.00692 0.0117 0.00992 0.00920 0.0148 0.0184 0.0163 0.0107 0.00833 0.00833 0.00790 0.00795 0.00960 0.00710 0.00749 0.0110 0.0103 0.0194 0.00940 0.00817 0.0100 0.0129 0.00805 0.0137 0.0130
F a i l u r e S u r f a c e O r i e n t a t i o n s Meas. Angle Calc. Angle
8, (Degree)
19.4 20.6 20.0 19 .2
19.4 21.4 21.8 20.0 21.4 21.4 18.4 23.2 18.4
-
I - -
18.4 21.2 22.1 18.4 19.4 20.6 23.5 1 7 . 3 17.6 18.9
BT (Degree)
14.9 14.9 17.2 16.2 16.8 16.9 16.2 14.8 15.2 16.2 1 7 . 1 1 7 . 1 17.2 1 7 . 2 16 .8 17.2 17.2 16.2 1 6 . 2 14 .2 16.9 17.2 16.7 l o . 1 17.2 15.9 16.0
R a t i o Calc. /Meas.
0.8 0.7 0 .9 0.8
0 .9 0 .8 0 .7 0 .8 0 .8 0 .8 0.9 0.7 0 . 9
-
- - -
0.9 0 .8 0 . 6 0 .9 0 .9 0 .8 0 .7 1.0 0 .9 0 .8

" .
TABLE 11
COMPARISON BETWEEN MEASURED AND CALCULATED ORIENTATIONS
OF THE FAILURE SURFACE FOR 18 I N . WALL - LOOSE CASE
P e n e t r a t i o n / Test H t . of Wall
I d e n t i f i - Y /H c a t i o n ( i n . / i n . )
6/15/66 - Ll 0.196 6/15/66 - L2 0.207 6/16/66 - L 1 0.210 6 /8 /66 - L 1 0.209 6/8/66 - L2 0 .199 6 /8 /66 - L3 0 .228 6/16/66 - L2 0 , 1 9 9 6/16/66 - L 3 0.216 6/16/66 - L4 0.212 6/20/66 - L 3 0.216 6120166 - L4 0 .208 6120166 - L5 0 . 2 2 3 6/17/66 - L 1 0 .215 6/17/66 - L2 0.214 6 /21 /66 - L2 0.208 6 /17 /6b - L 3 0 .210 6/20/66 - L 1 0.212 6 / 2 0 / 6 6 - L2 0 .215 b/21/66 - L3 0.211
F a i l u r e S u r f a c e O r i e n t a t i o n s Meas. Angle Calc . Angle
(Degree) (Degree) 8, B T
25.1 24.8 "
"
"
"
24.2 24.8 24.2
22.7 23.8
"
"
"
"
"
"
"
"
19.3 1 9 . 1 19.0 1 9 . 1 19 .3 18.3 1 9 . 3 18.9 19.0 18.9 1 9 . 1 18.3 18 .9 18.9 1 9 . 1 19 .0 19.0 1 9 . 0 1 9 . 0
R a t i o Ca 1 c. /Meas.
0.8 0.8 - - - -
0.8 0 . 8 0.8
0.8 0.8
-
- - - - - - -
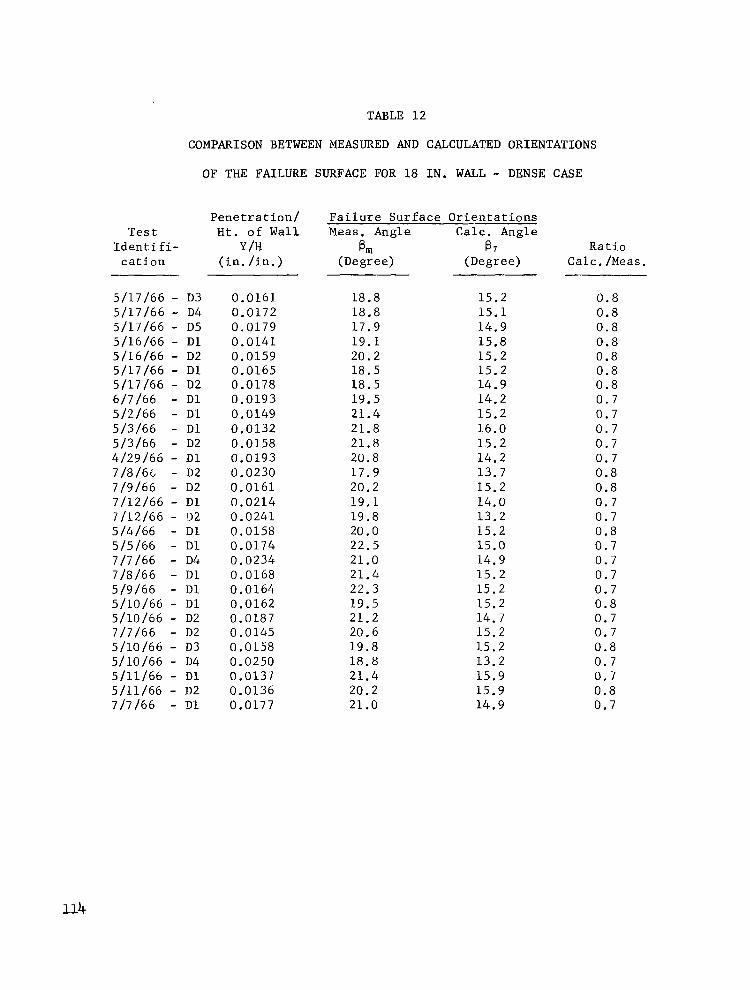
TABLE 12
T e s t
COMPARISON BETWEEN MEASURED AND CAJXULATED ORIENTATIONS
OF THE FAILURE SURFACE FOR 18 I N . WALL - DENSE CASE
P e n e t r a t i o n / F a i l u r e S u r f a c e O r i s n t a t i o n s H t . o f Wall Meas. Ang le Calc. Ang le
I d e n t i f i- y /H Bin B T R a t i o c a t i o n ( i n . / i n . ) (Degree) (Degree ) Calc. /Meas. -
5/17/66 - D 3 5/17/66 - D4 5/17/66 - D5 5/16/66 - D l 5/16/66 - D2 5/17/66 - D l 5/17/66 - D2 6/7/66 - D l 5/2/66 - D l 5/3/66 - D l 5 /3/66 - D2 4/29/66 - D l 7 /8 /6 t - D2 7/9/66 - D2 7/12/66 - D l 7/12/66 - D2 5/4/66 - D l 5/5/66 - Dl 7/7/66 - D4 7/8/66 - D l 5/9/66 - D l 5/10/66 - D l 5/10/66 - D2 7/7/66 - D2 5/10/66 - D3 5/10/66 - D4 5/11/66 - D l 5/11/66 - D2 7/7/66 - D l
0.0161 0.0172 0.0179 0.0141 0.0159 0.0165 0.0178 0.0193 0.0149 0.0132 0.0158 0.0193 0.0230 0.0161 0.0214 0.0241 0.0158 0.0174 0.0234 0.0168 0.0164 0.0162 0.0187 0.0145 0.0158 0.0250 0.0137 0.0136 0.0177
18.8 18.8 17.9 1 9 . 1 20.2 18.5 18.5 19.5 21.4 21.8 21 .8 20.8 17.9 20.2 19 .1 19.8 20.0 22.5 21.0 21.4 2 2 . 3 19.5 2 1 . 2 20.6 19 .8 18.8 21.4 20.2 21.0
15.2 15.1 14.9 15.8 15.2 15.2 14.9 14.2 15.2 16.0 15.2 14.2 13 .7 15.2 14.0 13.2 15.2 15.0 14.9 15 .2 15.2 15.2 14.7 15.2 15.2 1 3 . 2 15.9 15.9 14.9
0 . 8 0 .8 0 .8 0 .8 0.8 0.8 0 . 8 0 .7 0.7 0 . 7 0.7 0.7 0 .8 0.8 0.7 0.7 0.8 0 . 7 0.7 0.7 0 .7 0 .8 0 . 7 0 .7 0 .8 0.7 0 . 7 0 .8 0.7

va lues o f pm a g r e e well w i t h t h e o r e t i c a l v a l u e s o f Pr which were calculated
f o r t h e z e r o w a l l f r i c t i o n case. These values of $T are 25.3 d e g r e e s f o r t h e
loose s t a t e and 19 .2 deg rees fo r t he dense s t a t e .
The d i screpancy be tween measured and ca lcu la ted angles can bas ica l ly be
a t t r i b u t e d t o two f a c t o r s , t h e f i r s t f a c t o r b e i n g t h e i n h e r e n t e r r o r i n v o l v e d
i n t h e method used to ob ta in the ca lcu la ted and measured angles . These methods
are based upon Coulomb's assumption of a p l a n e f a i l u r e s u r f a c e , w h e r e a s , i n
r e a l i t y t h e f a i l u r e s u r f a c e is cu rved nea r t he base o f t he wa l l . However,
Rowe has shown t h a t t h e c u r v a t u r e i s s l i g h t f o r d e v e l o p e d w a l l f r i c t i o n v a l -
ues less than 10 degrees . It can be s een f rom the p rev ious t ab l e s t ha t t he
m a j o r i t y o f d e v e l o p e d w a l l f r i c t i o n v a l u e s a t f a i l u r e , f o r t h e d e n s e s t a t e s ,
a r e less t h a n 1 0 d e g r e e s . A l t h o u g h t h e a c t u a l o r i e n t a t i o n o f t h e f a i l u r e s u r -
f a c e is n o t g r e a t l y i n f l u e n c e d by sma l l ang le s o f wa l l f r i c t ion , t he ca l cu la t ed
o r i e n t a t i o n o f t h e f a i l u r e s u r f a c e i s c o m p a r a t i v e l y s e n s i t i v e t o d e v e l o p e d v a l -
u e s o f w a l l f r i c t i o n . It s h o u l d a l s o b e n o t e d t h a t t h e m e a s u r e d o r i e n t a t i o n s
6
o f t h e f a i l u r e s u r f a c e s h a v e n o t b e e n r e c o r d e d a t t h e i n s t a n t t h e maximum pas-
s i v e e a r t h p r e s s u r e was deve loped , bu t immedia te ly upon comple t ion of the t e s t .
T h i s a p p r o x i m a t i o n d o e s n o t i n v o l v e s i g n i f i c a n t e r r o r , s i n c e t h e o r i e n t a t i o n
o f t he measu red ang le depends on ' t he d i s t ance , DM, between the inner edge of
t h e w a l l a n d t h e f a i l u r e s u r f a c e o u t c r o p and t h i s d i s t a n c e was found to remain
e s s e n t i a l l y c o n s t a n t t h r o u g h o u t a t e s t , once a su r face ou tc rop has deve loped .
The s econd f ac to r has been d i scussed by Tay lo r i n connec t ion w i th I
t r i a x i a l c o m p r e s s i o n tes ts . The t h e o r e t i c a l a n g l e b e t w e e n t h e f a i l u r e s u r f a c e
and t he minor p r inc ipa l p l ane , o f a c y l i n d r i c a l t r i a x i a l s a m p l e , i s e q u a l t o
(45' - @ / 2 ) . T a y l o r s t a t e d t h a t i t has been , found by observa t ion tha t the
measured angle i s , i n t h e m a j o r i t y o f c a s e s , g r e a t e r t h a n t h e t h e o r e t i c a l
a n g l e . F a i l u r e a l o n g p l a n e s o t h e r t h a n t h o s e p r e d i c t e d by theo ry , may be
h

d u e t o stress concen t r a t ions . It seems r a t i o n a l t o a s s u m e t h a t t h e f a i l u r e cond-
i t i o n s e x i s t i n g i n a t r i a x i a l s p e c i m e n may a p p r o x i m a t e t h e f a i l u r e c o n d i t i o n s
which ex is t i n a h o r i z o n t a l l y c o m p r e s s e d b a c k f i l l ; s i n c e t h e t r i a x i a l compres-
s i o n t e s t i s no th ing more than a p a s s i v e t y p e o f e a r t h - p r e s s u r e t es t .
It was n o t p o s s i b l e t o o b t a i n t h e m e a s u r e d o r i e n t a t i o n o f t h e f a i l u r e
s u r f a c e i n many o f t h e 18 i n , w a l l l o o s e tes ts b e c a u s e t h e i n t e r s e c t i o n of t h e
f a i l u r e s u r f a c e w i t h t h e b a c k f i l l s u r f a c e was no t c l ea r ly de f ined . F igu res
61 and 62 show t h e r a i s e d p o r t i o n of t h e b a c k f i l l w h i c h h a s f a i l e d d u e t o
p e n e t r a t i o n o f t h e r e t a i n i n g w a l l .
CENTER OF PRESSURE LOCATIONS
V a r i a t i o n s i n t h e l o c a t i o n o f t h e c e n t e r o f p r e s s u r e a s t h e w a l l p e n e -
t r a t e d i n t o t h e b a c k f i l l are shown i n F i g s . 63 and 64. The test d a t a shown
i n t h e s e f i g u r e s is r e p r e s e n t a t i v e o f a l l t h e d a t a t h a t was obtained f rom the
1 2 and 18 i n . w a l l tests. It s h o u l d b e n o t e d t h a t f o r s m a l l p e n e t r a t i o n s ,
t he da t a ob ta ined du r ing Phases I and I1 d i f f e r s i g n i f i c a n t l y . The r e s u l t s
d i f f e r s i n c e t h e v e r t i c a l r e s t r a i n t t h a t was used dur ing Phase I1 performed
much more s a t i s f a c t o r i l y t h a n t h e r e s t r a i n t u s e d d u r i n g P h a s e I . These re-
s u l t s , l i k e t h o s e o f Phase I , show h ighe r cen te r of p r e s s u r e l o c a t i o n s when
t h e b a c k f i l l i s p l a c e d i n a l o o s e s t a t e .
AVERAGE EARTH-PRESSURE DATA
A summary of s i g n i f i c a n t e a r t h - p r e s s u r e d a t a o b t a i n e d d u r i n g t h e
second phase o f t e s t ing i s t a b u l a t e d i n T a b l e 13. The numer ica l va lues l i s ted
i n T a b l e 13, e x c e p t f o r t h o s e a p p e a r i n g i n t h e C e n t e r o f P r e s s u r e Column,
r e p r e s e n t v a l u e s o b t a i n e d by a v e r a g i n g t h e d a t a l i s t e d i n p r e v i o u s t a b l e s .
The v a l u e s i n t h e C e n t e r o f P r e s s u r e Column are average va lues ob ta ined f rom
each series o f tes ts . The l o c a t i o n o f t h e c e n t e r o f p r e s s u r e f o r e a c h t e s t
116

Fi g . 61 View of Inte r section of Failur e Surface with Surfa c e of Backfill - 12 in. Hi gh Wa l l, Dense Test
JULY 9, 19(,G 30 :lee.
Fig. 62 Vi ew of Intersection of Failure Surface with Surface of Backfill - 18 in. Hi gh Wall, Dense Test
117

3.33 """"""""""_
0 APRIL 21,1966 TEST L 2 El APRIL 23,1966 TEST L 3 0 JUNE 30,1966 TEST L3
I I 1 0 0. I 0.2 0.3
(PENETRATION/WALL HEIGHT) X IO1 , (Y/H) X IO1
FIG.63 EFFECT OF WALL PENETRATION ON THE LOCATION OF THE CENTER OF PRESSURE - 12 IN WALL , LOOSE CASE

I
0 4/12/66 TEST 03 0 6/23/66 TEST 02
o 6/24/66 TEST D 3
\PENETRATION/WALL HEIGHT) X 10'. (Y/H 1 X 10'
FIG.64 EFFECT OF WALL PENETRATION ON THE LOCATION OF THE CENTER OF PRESSURE- 12 IN. WALL, DENSE CASE

Test C o n d i t i o n s
Pene t . / H t . o f Wall
Y /H ( i n . / i n . )
12 i n . Wall Dense Back- f i l l
18 i n . Wall Dense Back- f i l l
1 2 i n . Wall Loose Back- f i l l
18 i n . Wall Loose Back- f i l l
0.0113
0.0175
0.309
0.211
TABLE 13
COMPARISON OF AVERAGE MEASURED AND CALCULATED
EARTH-PRESSURE FACTORS
Developed Measured Calcu la ted Center
E a r t h - P r e s s u r e F a c t o r Measured Calcu la ted K /cos 6 K / cos 6
I n t e r n i l F a i l u r e F a i l u r e o f F r i c t i o n P 1 . O r i e n t . P 1 . O r i e n t . P r e s s u r e
0 B T CD IH P P (Degrees) (Degrees) (Degrees) ( i n . / i n . )
1 2 . 6 10.9 54.1 20.1 16.4 0.332
13.8 1 2 . 9
6 . 0 8 .6
5.8 7.0
52.7
33.6
35.9
20.1 14.9
2 2 . 7 16 .9
24.2 19.0
0.332
0.396
0.388

has n o t b e e n r e p o r t e d . T h e l i s t e d v a l u e s r e p r e s e n t t h e a v e r a g e l o c a t i o n s o f
t h e c e n t e r o f e a r t h p r e s s u r e a t t h e time o f f a i l u r e , w h i c h i s def ined by develop-
ment o f t h e maximum e a r t h p r e s s u r e .
Table 13 i l l u s t r a t e s t h e good agreement obtained between the 1 2 and 18
i n . w a l l tests. T h e a v e r a g e o r i e n t a t i o n o f t h e f a i l u r e s u r f a c e f o r t h e d e n s e
1 2 and 18 i n . w a l l tests i n d i c a t e s t h a t t h e g e o m e t r i c s o f t h e h i g h l y s t r e s s e d
s o i l masses a r e s imi l a r . I n o the r words , t he d i s t ances f rom the f ace o f t he
18 i n . w a l l t o t h e f a i l u r e s u r f a c e were approximately 1 .5 times g r e a t e r t h a n
t h e c o r r e s p o n d i n g d i s t a n c e s i n t h e 12 i n . w a l l tes ts . Therefore, assuming
t h a t u n i f o r m s o i l c o n d i t i o n s e x i s t b e t w e e n t h e 1 2 and 18 i n . w a l l t e s t s , t h e
amount o f p e n e t r a t i o n r e q u i r e d t o p r o d u c e f a i l u r e i n t h e 18 i n . w a l l t e s t s ,
should be approximately 1 .5 times g r e a t e r t h a n t h e 1 2 i n . w a l l p e n e t r a t i o n
t h a t i s requi red to p roduce a s i m i l a r s t a t e o f f a i l u r e . I f t h e a b o v e i s t r u e ,
t he d imens ion le s s r a t io (Pene t r a t ion /He igh t o f Wal l ) shou ld have t he same
v a l u e f o r t h e 1 2 and 18 i n . w a l l t e s t s . I n s p e c t i o n o f Table 13 shows t h a t t h e
va lue o f the d imens ion ra t io (Penet ra t ion /Height o f Wal l ) requi red to p roduce
f a i l u r e w i t h i n a d e n s e b a c k f i l l i s l a r g e r f o r t h e 18 in . wa l l t es t s . For any
p a r t i c u l a r s e t o f s o i l a n d b o u n d a r y c o n d i t i o n s , t h e p a s s i v e e a r t h p r e s s u r e i s
a f u n c t i o n o f t h e d e v e l o p e d i n t e r n a l f r i c t i o n a n d t h e d e v e l o p e d w a l l f r i c t i o n .
The development of these two p a r a m e t e r s , a t a n y p o i n t w i t h i n t h e b a c k f i l l , i s
a func t ion o f t he ove rburden p re s su re . The i n c r e a s e d c o n f i n i n g p r e s s u r e s t h a t
e x i s t e d i n t h e 18 i n . w a l l tes ts may have caused t he d i sc repancy i n t he dimen-
s i o n l e s s r a t i o ( P e n e t r a t i o n / H e i g h t o f W a l l ) v a l u e s .
Comparison of the dimensionless ra t io , Y/H, va lues fo r t he two s e r i e s
o f l oose tests i n d i c a t e s t h a t t h e 18 i n . w a l l r a t i o i s less than t he 1 2 i n .
w a l l r a t i o . The d i sc repancy ex i s t s because o f t he manner i n which the tes ts
were conducted. Each of the wal ls was p e n e t r a t e d i n t o t h e b a c k f i l l a p p r o x i m a t e l y
121
3 . 8 i n . The shape of developed earth pressure-penetration curve for a loose
b a c k f i l l , was such tha t the maximum ea r th pressure nearly always occurred at
the maximum amount of penetrat ion. Therefore , had the 18 in . wal l pene t ra ted
i n t o t h e b a c k f i l l a d i s t ance of 5.5 i n . t h e r a t i o Y/H would have been nearly
the same and the measured ear th-pressure fac tors may have agreed closer.
122

CHAPTER V I 1 1
PHASE I11 TEST RESULTS AND DISCUSSION
Phase I11 u t i l i z e d c o n i c a l and spher ica l models . Two s i z e s of each
model were t e s t e d . The ra te and v e r t i c a l d e p t h b e n e a t h t h e b a c k f i l l s u r f a c e
a t which the models penetrated were a l s o v a r i e d . D e t a i l s p e r t a i n i n g t o t h e
model designs and the test s e t u p are shown i n C h a p t e r s 111 and I V . Over 200
u s a b l e tests were o b t a i n e d d u r i n g t h i s p h a s e .
~~~- EFFECT OF MODEL .PENETRATION VELOCITY ON EARTH PRESSURE
T h e m o d e l s p e n e t r a t e d t h e b a c k f i l l a t t h e c o n s t a n t r a t e s o f 4 .0 , 2.667
and 0.533 i p s . As found i n P h a s e 11, t h e s c a t t e r i n t h e d a t a f r o m t h e s e tes ts
obscured any fo rce -ve loc i ty r e l a t ionsh ips wh ich may h a v e e x i s t e d . S e v e r a l
f o r c e - p e n e t r a t i o n p l o t s f o r v a r i o u s r e p r e s e n t a t i v e t es t s a r e shown i n Appen-
d i x B. It c a n b e s e e n f r o m t h e s e p l o t s t h a t t h e sca t te r i s not abnormal for
tes ts c o n d u c t e d u s i n g s o i l a s a p e n e t r a t i o n medium. Only the force-penet ra -
t i o n c u r v e s f o r t h e 4.0 i p s t es t s have been presented , s ince no a d d i t i o n a l
i n fo rma t ion i s a t t a i n e d from t h e t e s t s a t o t h e r r a t e s .
It shou ld be po in t ed ou t t ha t i t was known p r i o r t o t h e b e g i n n i n g o f
t h i s s t u d y , t h a t f o r low r a t e s o f p e n e t r a t i o n t h e s t r a i n r a t e e f f e c t s would
be small. However, i t was f e l t t h a t t h e t es t d a t a would r e f l e c t some t r ends
t h a t would be more pronounced a t h i g h e r p e n e t r a t i o n v e l o c i t i e s .
HORIZONTAL . FORCE-PENETRATION CURVES
T h e m a g n i t u d e o f t h e h o r i z o n t a l f o r c e t h a t i s developed, during model
p e n e t r a t i o n , i s a func t ion o f t he fo l lowing pa rame te r s :
(1) Geometry o f t he con tac t su r f ace be tween t he back f i l l and t he
pene t r a t ing mode l ,
(2) R a t e o f p e n e t r a t i o n ,

(3) Amount o f p e n e t r a t i o n ,
( 4 ) Vertical d e p t h a t w h i c h t h e model p e n e t r a t e s t h e b a c k f i l l ,
(5) Angle of i n t e r n a l f r i c t i o n of t h e b a c k f i l l ,
(6) Ang le o f f r i c t ion be tween so i l and po lye thy lene membrane,
(7) B a c k f i l l d e n s i t y .
During each t e s t t h a t u t i l i z e d a sphe r i ca l s egmen t mode l , a l l o f t hese pa ra -
meters, except 2 , var ied s imul taneous ly . Only parameters 3 , 4 , 5, 6 and 7
v a r i e d d u r i n g a cone tes t , s ince the contac t geometry o f the cones remained
cons t an t . A l though t he ve r t i ca l d i s t ance be tween t he geomet r i c cen te r o f
t h e model a n d t h e i n i t i a l s u r f a c e o f t h e b a c k f i l l r e m a i n e d c o n s t a n t , t h e e f f e c t
o f t he ove rburden dep th i s con t inuous ly chang ing a s t he con tac t a r ea be tween
t h e model and t h e s o i l i n c r e a s e s . The s imul t aneous va r i a t ions i n pa rame te r s
c r e a t e s a complex s i t u a t i o n t o which there i s no e x i s t i n g r i g o r o u s s o l u t i o n .
Cone Tests
I t i s e s s e n t i a l t h a t t h e a b o v e d i s c u s s i o n b e k e p t i n mind when observ-
i n g t h e f o r c e - p e n e t r a t i o n c u r v e s t h a t a r e shown on the fo l lowing pages . The
force-penet ra t ion curves which were obta ined f rom the tests t h a t u t i l i z e d c o n e
shaped models are shown i n F i g s . 65 through 68. Each graph contains a fami ly
of curves which were ob ta ined by drawing average curves through sets of d a t a
po in t s ob ta ined f rom th ree o r more i d e n t i c a l tes ts . Appendix B con ta ins r ep re -
s en ta t Jve p lo t s o f t he da t a po in t s , t h rough wh ich t he ave rage cu rves were drawn.
Each of the average curves i s denoted by a Z va lue , .wh ich i nd ica t e s t he ve r t i -
ca l d i s t ance be tween t he l owes t po in t on t he model and the su r f ace o f t he back -
f i l l . Examples o f t he ve r t i ca l d i s t ances , 2, are shown i n F i g . 36 on p. 59.
F igu re 36 e x p r e s s e s t h e 2 d i s t a n c e s i n terms o f t h e b a s e r a d i u s r o f t h e
model. The b a c k f i l l m a t e r i a l was p l a c e d e i t h e r i n i t s d e n s e s t s t a t e (102.0 pc f )
o r l o o s e s t s t a t e (88.0 pc f ) .

1 ~~ I 1.0 2.0 3.0 35
". . .. ~ ~~
PENETRATION, Y, IN.
FlG.65 HORIZONTAL FORCE VERSUS PENETRATION FOR MULTIPLE OVERBURDEN DEPTHS-3.54 IN. DIA CONE, LOOSE CASE

PENETRATION, Y, IN.
F IG.66 HORIZONTAL FORCE VERSUS PENETRATION FOR MULTIPLE OVERBURDEN DEPTHS - 3.54 IN. DIA CONE, DENSE CASE
126

PENETRATION ,Y, IN.
FIG. 67 HORIZONTAL FORCE VERSUS PENETRATION FOR MULTIPLE OVERBUREN DEPTHS-7.08 IN. DIA CONE, LOOSE CASE

I- 7. O
PENETRATION, Y , IN.
FlG.68 HORrZONTAL FORCE VERSUS PENETRATION FOR MULTIPLE OVERBURDEN DEPTHS -708 IN. DIA CONE, DENSE CASE
128

A l l of the average curves , except those ob ta ined f rom the 3.54 i n .
d i a c o n e l o o s e - t e s t d a t a , a r e c o n c a v e u p w a r d , T h i s s h a p e i s to be expec ted
s i n c e t h e i n c r e a s i n g c o n t a c t a r e a o f t h e c o n e a s i t p e n e t r a t e s i n t o t h e b a c k -
f i l l i s desc r ibed by an equat ion which i s also concave upward when p l o t t e d .
T h e s e g r a p h s d e m o n s t r a t e t h e l a r g e i n f l u e n c e t h e d e n s i t y o f t h e b a c k f i l l
m a t e r i a l h a s u p o n t h e h o r i z o n t a l f o r c e s d e v e l o p e d o n t h e p e n e t r a t i n g c o n e .
The e a r l y p o r t i o n o f t h e f a m i l y o f c u r v e s shown i n F i g . 65 was not ob ta ined
b e c a u s e t h e m e a s u r i n g l o a d c e l l was n o t s e n s i t i v e enough t o p r o v i d e r e c o r d a b l e
ou tpu t fo r t h i s deve loped r ange o f l oads .
Sphere Tests
F igu res 69 through 7 2 i l l u s t r a t e t h e a v e r a g e f o r c e - p e n e t r a t i o n c u r v e s
o b t a i n e d f o r t h e 4 . 3 3 and 8 .66 in . d ia spher ica l segments . From t h e s e f i g u r e s
i t can be seen tha t the t e s t cond i t ions have an apprec i ab le e f f ec t upon t h e
shape o f t he cu rves . The curves obtained f rom the 4 .33 i n . d i a s p h e r i c a l
segment, loose t e s t s a re s imi l a r i n shape t o t hose ob ta ined f rom the 3 .54 i n .
d i a c o n e , l o o s e t e s t s . The c u r v e s i n F i g . 70 a r e s i m i l a r i n s h a p e t o t h e
pas s ive ea r th p re s su re -pene t r a t ion cu rves ob ta ined f rom Phase I o r I1 t e s t
r e s u l t s . The t e s t d a t e f o r t h e 8 . 6 6 i n . d i a s p h e r i c a l s e g m e n t i n d i c a t e s t h a t
f o r low ove rburden dep ths and l oose back f i l l cond i t ions t he cu rves a r e s imi l a r
in shape to those ob ta ined f rom the cone da ta .
Only the por t ions o f the curve which cor respond to pene t ra t ions approxi -
mate ly equal to and less than t he pene t r a t ion r equ i r ed t o comple t e ly bu ry t he
model have been presented . Informat ion concern ing the deve loped hor izonta l
fo rces wh ich co r re spond t o pene t r a t ions g rea t e r t han t he he igh t o f t he mode l s
i s des i rab le ; however , the behavior o f the membrane precluded meaningful
force measurements. A s t h e model p e n e t r a t e d i n t o t h e b a c k f i l l t h e membrane

I I
PENETRATION , Y , IN.
FIG.69 HORIZONTAL FORCE VERSUS PENETRATION FOR MULTIPLE OVERBURDEN DEPTHS - 4.33 IN. DIA SPHERICAL SEGM ENT, LOOSE CASE

I I I
0.5 1.0 PENETRATION, Y, IN.
3
FlG.70 HORIZONTAL FORCE VERSUS PENETRATION FOR MULTIPLE OVERBURDEN DEPTHS-4.33 IN. DIA SPHERICAL SEGMENT, DENSE CASE

4 1.0 2.0
PENETRATION, Y , IN. 3 .O
FIG.71 HORIZONTAL FORCE VERSUS PENETRATION FOR MULTIPLE OVERBURDEN DEPTHS- 8.66 IN. DIA SPHERICAL SEGMENT, LOOSE CASE

35c
30C
m J_20(
a I
W 0
0 lL
a
-J
I- 4
z 0 N a IO( 0 I
C
PENETRATION , Y , IN.
FlG.72 HORIZONTAL FORCE VERSUS PENETRATION FOR MULTIPLE OVERBURDEN DEPTHS -8.66 IN. DIA SPHERICAL SEGMENT, DENSE CASE

deformed t o accommodate the geometry of the model. However, when t h e model
p e n e t r a t e d a d i s t a n c e g r e a t e r t h a n i t s h e i g h t , t h e membrane a l lowed sand to
f l o w t h r o u g h t h e h o l e i n t h e membrane which was c r e a t e d by the previous pene-
t r a t i o n . T h i s s a n d l e a k a g e c a u s e d t h e h o r i z o n t a l f o r c e s t o b e g r e a t l y r e d u c e d ,
thereby making the forces recorded meaningless .
MAXIMUM HORIZONTAL FORCE ANALYSIS
Genera l ly , t he fo rce -pene t r a t ion cu rves t ha t were p re sen ted p rev ious ly
i n d i c a t e t h a t t h e h o r i z o n t a l f o r c e c o n t i n u e s t o i n c r e a s e w i t h i n c r e a s i n g
pene t r a t ion . Th i s i s t r u e f o r a l l t e s t s , excep t t he 4 . 3 3 i n . d i a s p h e r i c a l
s e g m e n t , d e n s e t e s t s . S i n c e i n s u f f i c i e n t d a t a was o b t a i n e d f o r p e n e t r a t i o n
va lues g rea t e r t han t he he igh t s o f t he mode l s , t he maximum h o r i z o n t a l f o r c e
was d e f i n e d a s t h e f o r c e w h i c h o c c u r r e d a t t h e i n s t a n t t h e model p e n e t r a t i o n
was e q u a l t o t h e h e i g h t o f t h e m o d e l . I f t h e maximum f o r c e o c c u r r e d b e f o r e
t h e model had penetrated i t s f u l l h e i g h t , t h i s f o r c e was r eco rded a s t he
maximum.
Table 14 l i s t s maximum fo rce va lues ob ta ined f rom the fo rce -pene t r a t ion
curves .
p l o t s show t h a t t h e maximum h o r i z o n t a l f o r c e i s approximately a l i n e a r f u n c t i o n
of the overburden depth squared . The s t ra ight l ine d rawn th rough the da ta
p o i n t s i n F i g . 7 3 has a f o r c e i n t e r c e p t . T h i s i n t e r c e p t i s due to membrane
r e s i s t ance wh ich was c r e a t e d d u r i n g model pene t r a t ion . S ince deve loped fo rces
f o r t h i s c a s e were r e l a t i v e l y s m a l l , t h e membrane r e s i s t ance canno t be cons id -
e red negl ig ib le . The membrane r e s i s t ance can be e l imina ted f rom F ig . 7 3 by
c o n s t r u c t i n g a s t r a i g h t l i n e which passes through the or igin and i s p a r a l l e l
t o t h e e x i s t i n g s t r a i g h t l i n e . A l t h o u g h t h e g e o m e t r i c s o f t h e two models
d i f f e r v a s t l y , t h e maximum h o r i z o n t a l f o r c e s may be represented by t h e same
r e l a t i o n s h i p .
'lots of %<ma,> ve r sus Z2 a r e shown i n F i g s . 7 3 through 7 5 . The

TABLE 14
MAXIMUM DEVELOPED HORIZONTAL FORCES
Penetration Model Type (in. )
3.54 in. dia cone
7.08 in. dia cone
4 .33 in. dia spherical
s egment
8.66 in. dia spherical segment
3 . 0 6 3.06 3.06 3 .06 3.06 3.06 3.06 3 .06
6.12 6 .12 6 .12 6.12 6.12
1 .25 1 .25 1.25 1.25 1 .25 0 .80 0.50 0 . 3 5
2 .50 2.50 2.50 2.50 2.50
Maximum Horizontal Force ( l b )
5 .5 7.5
12.0 25.0 10.5 36 .0 63.0
165.0
30 .0 69.0
127.5 79.0
211.5
6.0 11 .5 17.0 36.5 16.0 43.0
125.0 326.0
18.0 7 1 . 0 41.0 57.5
277.5
Depth of Overburden
(in.)
1 . 7 7 3 .54 5.31 8.85 1 . 7 7 3 .54 5 .31 8 .85
3.54 7.08
10.62 3.54 7.08
2.16 4.33 6.49
10.83 2.16 4.33 6.49
10.83
4 .33 8.66
12.99 4.33 8 .66
Density (FC f \
88 .0 88 .0 88 .0 88 .0
102.5 102.5 102.5 102 .5
8 8 . 0 88 .0 88 .0
102 .5 102 .5
88 .0 88 .0 88.0 88 .0
102.5 102.5 102 .5 102.5
8 8 . 0 88.0 88 .0
102.5 102.5

” I I I I
SEGMENT
FlG.73 EFFECT OF OVERBURDEN DEPTH ON THE MAXI- MUM DEVEIBPED HORIZONTAL FORCE -LOOSE CASE

A
1.08 IN. DIA CONE
A 8.66 IN. DIA SPHERICAL SEGMENT
A
0 50 ' O 0 2 2 2 I50 ( DEPTH OF OVERBURDEN 1 , 2 , IN.
FIG.74 EFFECT OF OVERBURDEN DEPTH ON THE MAXIMUM DEVELOPED HORIZONTAL FORCE - LOOSE CASE

0 3.54 IN. DIA CONE
7.08 IN. DIA CONE o 4.33 IN. DIA SPHERICAL SEGMENT
A 8.66 IN. DIA SPHERICAL SEGMENT
0 25 so 1 0 0 125 (DEPTH OF OVERBURDEN), 2 , I N 2
75 2 2
FIG.75 EFFECT OF OVERBURDEN DEPTH ON THE MAXIMUM DEVELOPED HORIZONTAL FORCE - DENSE CASE

Two r e l a t i o n s h i p s a r e r e q u i r e d t o r e p r e s e n t t h e maximum forces develop-
ed on t he l a rge cone and l a rge sphe r i ca l s egmen t when t h e y a r e p e n e t r a t e d i n t o
a b a c k f i l l i n a l o o s e s t a t e . T h e d e v e l o p e d h o r i z o n t a l s o i l f o r c e s on the cone
were h i g h e r t h a n t h e s o i l f o r c e s a c t i n g o n t h e s p h e r i c a l s e g m e n t .
The maximum h o r i z o n t a l f o r c e d a t a o b t a i n e d f r o m t h e tes ts conducted
when t h e b a c k f i l l was p l a c e d i n a d e n s e s t a t e is p l o t t e d i n F i g . 75. The
maximum forces deve loped on t h e l a r g e m o d e l s a r e g r e a t e r t h a n t h e f o r c e s
developed on the small models , which i s to be expec ted .
Maximum F o r c e P r e d i c t i o n
It has been shown t h a t t h e maximum developed force i s a l i nea r func -
t i on o f t he ove rburden dep th squa red . The e x i s t i n g p a s s i v e e a r t h - p r e s s u r e
equat ions which were de r ived a s suming t ha t p l ane - s t r a in ea r th -p res su re cond i t ions
e x i s t e d , a l s o i n d i c a t e t h e same r e l a t i o n s h i p . It i s d e s i r a b l e t o wr i te an
e x p r e s s i o n f o r
e e r i n g p r o p e r t i e s o f t h e s o i l .
%<max> which involves the geometry of the model and the engin-
Equat ion 18 i s p r o p o s e d t o f u l f i l l t h e s e d e s i r a b l e r e q u i r e m e n t s .
The terms a p p e a r i n g i n t h e a b o v e e q u a t i o n a r e d e f i n e d a s f o l l o w s :
RH(max) = Maximum h o r i z o n t a l f o r c e ,
y = U n i t d e n s i t y o f t h e b a c k f i l l m a t e r i a l ,
r = The r a d i u s of t h e p r o j e c t e d c o n t a c t a r e a a t t h e P
i n s t a n t t h e maximum h o r i z o n t a l f o r c e o c c u r s ,
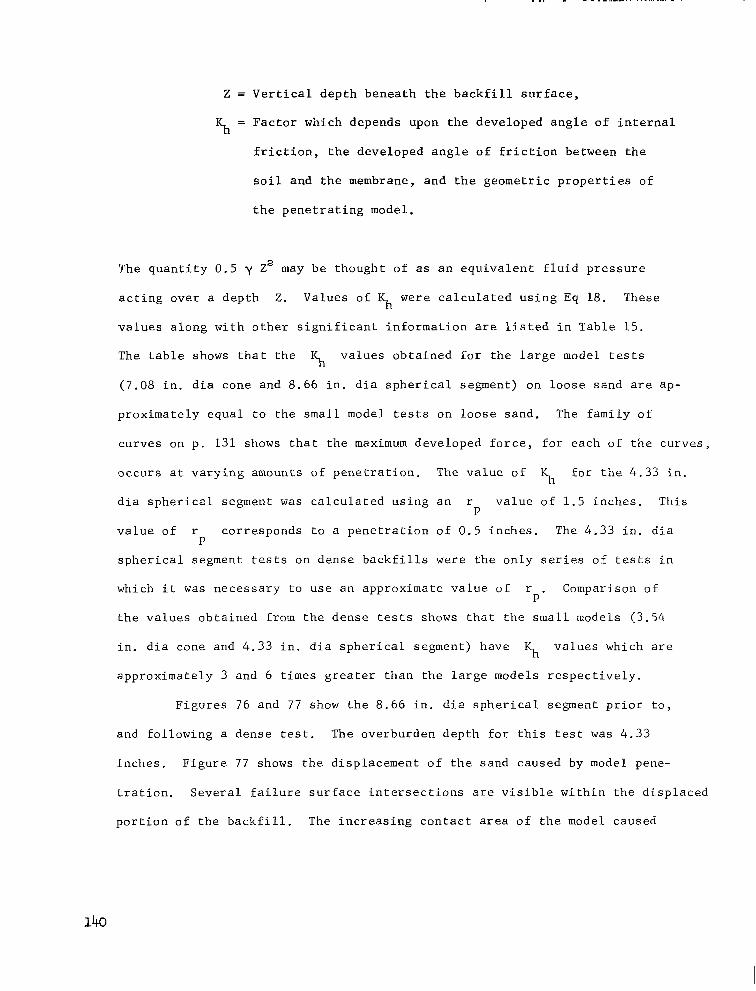
Z = Vert ical d e p t h b e n e a t h t h e b a c k f i l l s u r f a c e ,
5 = Fac to r wh ich depends upon t he deve loped ang le o f i n t e rna l
f r i c t i o n , t h e d e v e l o p e d a n g l e of f r i c t i o n b e t w e e n t h e
s o i l and t he membrane , and the geometr ic p roper t ies o f
t h e p e n e t r a t i n g model.
The q u a n t i t y 0 .5 y Z" may be thought of as a n e q u i v a l e n t f l u i d p r e s s u r e
a c t i n g o v e r a depth Z. Values of \ were c a l c u l a t e d u s i n g E q 18. These
v a l u e s a l o n g w i t h o t h e r s i g n i f i c a n t i n f o r m a t i o n a re l i s t e d i n T a b l e 15.
The t a b l e shows t h a t t h e \ v a l u e s o b t a i n e d f o r t h e l a r g e model t e s t s
(7 .08 i n . d i a cone and 8 .66 i n . d i a sphe r i ca l s egmen t ) on l oose s and a r e ap -
p rox ima te ly equa l t o t he small model t e s t s on loose sand . The fami ly o f
curves on p. 131 shows t h a t t h e maximum deve loped fo rce , fo r each o f t he cu rves ,
o c c u r s a t v a r y i n g a m o u n t s of p e n e t r a t i o n . T h e v a l u e o f \ f o r t h e 4 .33 i n .
d i a sphe r i ca l s egmen t was c a l c u l a t e d u s i n g a n r v a l u e o f 1.5 i nches . Th i s
va lue o f r c o r r e s p o n d s t o a p e n e t r a t i o n o f 0 .5 inches . The 4.33 i n . d i a
spher ica l segment t e s t s o n d e n s e b a c k f i l l s w e r e t h e o n l y s e r i e s o f t e s t s i n
which i t was necessa ry t o use an approximate va lue o f r . Comparison of
t he va lues ob ta ined f rom the dense t es t s shows t h a t t h e small models (3 .54
in . d ia cone and 4.33 i n . d i a s p h e r i c a l s e g m e n t ) h a v e 5 va lues wh ich a r e
approximate ly 3 and 6 t i m e s g r e a t e r t h a n t h e l a r g e m o d e l s r e s p e c t i v e l y .
P
P
P
F igu res 76 and 77 show t h e 8 . 6 6 i n . d i a s p h e r i c a l s e g m e n t p r i o r t o ,
and fo l lowing a dense t e s t . The ove rburden dep th fo r t h i s t e s t was 4 .33
i nches . F igu re 77 shows the d i sp lacement o f the sand caused by model pene-
t r a t i o n . S e v e r a l f a i l u r e s u r f a c e i n t e r s e c t i o n s a r e v i s i b l e w i t h i n t h e d i s p l a c e d
p o r t i o n o f t h e b a c k f i l l . T h e i n c r e a s i n g c o n t a c t a r e a o f t h e model caused

Model Type
TABLE 15
COMPARISON OF \ VALUES
3 .54 i n . d i a c o n e
3.54 i n . d i a c o n e
7.08 i n . d i a c o n e
7 .08 i n . d i a c o n e
4 .33 i n . d i a s p h e r i c a l segment
4 .33 i n . dia s p h e r i c a l segment
8 .66 i n . d i a s p h e r i c a l segment
8.66 i n . d i a s p h e r i c a l segment
3.3
30 .5
4 .1
10.5
2.2
42 .5
1 . 9
7 . 0
Rat io of Kh Values Dens i ty €0 r Y
Dense and Loose States (PCf ) -
9.3
2 .6
88 .0
102.5
88 .0
102.5
88 .0 19 .3
102.5
3.7 88.0
102.5
141

l---- -
142
Fig. 7b Front View of Test Setup Before Model Penetration
Fig. 77 Front View of Test Setup After Model Penetration
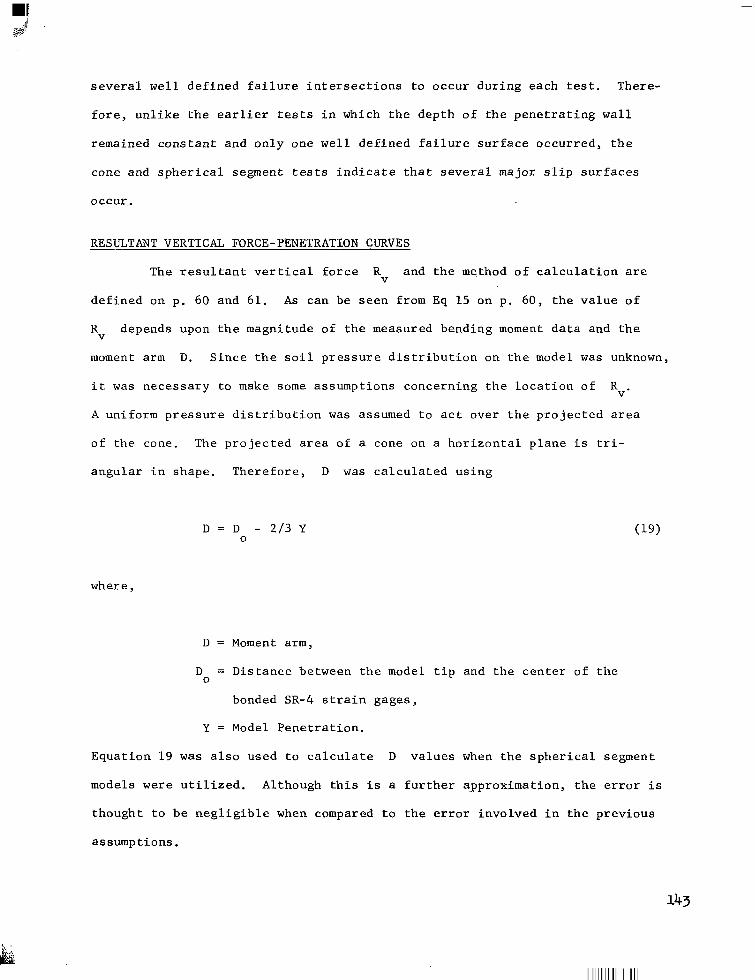
s e v e r a l well d e f i n e d f a i l u r e i n t e r s e c t i o n s t o o c c u r d u r i n g e a c h tes t . There-
f o r e , u n l i k e t h e e a r l i e r tests i n which t h e d e p t h o f t h e p e n e t r a t i n g w a l l
remained constant and only one w e l l d e f i n e d f a i l u r e s u r f a c e o c c u r r e d , t h e
cone and spherical segment tests i n d i c a t e t h a t s e v e r a l m a j o r s l i p s u r f a c e s
occur .
” RESULTANT VERTICAL FORCE-PENETRATION CURVES
The r e s u l t a n t v e r t i c a l f o r c e Rv a n d t h e m e t h o d o f c a l c u l a t i o n a r e
defined on p. 60 and 61. A s can be seen from Eq 15 on p . 60, the value of
Rv depends upon the magnitude of the measured bending moment d a t a and t h e
moment arm D. S i n c e t h e s o i l p r e s s u r e d i s t r i b u t i o n o n t h e model was unknown,
i t was necessa ry t o make some as sumpt ions conce rn ing t he l oca t ion o f . A u n i f o r m p r e s s u r e d i s t r i b u t i o n was assumed t o a c t o v e r t h e p r o j e c t e d a r e a
of the cone . The pro jec ted a rea o f a cone on a h o r i z o n t a l p l a n e i s t r i -
a n g u l a r i n s h a p e . T h e r e f o r e , D was c a l c u l a t e d u s i n g
RV
D = D - 2 / 3 Y 0
where,
D = Moment arm,
D = Dis tance be tween the model t ip and the cen ter of t h e 0
bonded SR-4 s t r a i n g a g e s ,
Y = Model P e n e t r a t i o n .
Equat ion 19 was a l s o u s e d t o c a l c u l a t e D v a l u e s when the sphe r i ca l s egmen t
models were u t i l i z e d . A l t h o u g h t h i s i s a f u r t h e r a , p p r o x i m a t i o n , t h e e r r o r i s
t h o u g h t t o b e n e g l i g i b l e when compared t o t h e e r r o r i n v o l v e d i n t h e p r e v i o u s
assumptions .
143
l l l l l I l l l l l l l I l l I l l l l l I I I I I
P l o t s o f t h e d e v e l o p m e n t o f t h e r e s u l t a n t v e r t i c a l f o r c e a s t h e model
p e n e t r a t e d i n t o t h e b a c k f i l l a r e i l l u s t r a t e d i n F i g s . 78 through 83. Each
graph conta ins a family of curves which were ob ta ined by drawing average
curves through sets o f d a t a p o i n t s t a k e n f r o m t h r e e o r more i d e n t i c a l tests.
Appendix C c o n t a i n s r e p r e s e n t a t i v e p l o t s o f t h e d a t a p o i n t s , t h r o u g h w h i c h
the average curves were drawn.
Cone Tests
The r e s u l t a n t v e r t i c a l f o r c e - p e n e t r a t i o n c u r v e s a r e s i m i l a r i n s h a p e
t o t h e h o r i z o n t a l f o r c e - p e n e t r a t i o n c u r v e s t h a t were p r e s e n t e d p r e v i o u s l y i n
t h i s chap te r . Examina t ion o f t he uppe r g raph i n F ig . 78 shows t h a t t h e meas-
u r e d r e s u l t a n t v e r t i c a l f o r c e i s independent of the depth of overburden 2 .
This curve was obtained f rom tes t r e s u l t s t h a t were acquired f rom the pene-
t r a t i o n o f t h e 3 .54 i n . d i a c o n e i n t o a l o o s e b a c k f i l l . The curves shown i n
the l ower g raph were ob ta ined f rom the pene t r a t ion o f t he same cone in to a
d e n s e b a c k f i l l . However, t he l ower g raph demons t r a t e s t ha t t he r e su l t an t
v e r t i c a l f o r c e i s a f u n c t i o n of t he ove rburden dep th Z . When . t h e model pene-
t r a t e d i n t o t h e b a c k f i l l a p o r t i o n o f t h e s o i l was d i s p l a c e d t o accommodate
t h e model . The displacement can occur , e i ther by the model forcing the soi l
t o b e d i s p l a c e d a t t h e s u r f a c e o f t h e b a c k f i l l o r by l o c a l d e n s i f i c a t i o n o f
t h e s o i l i n t h e v i c i n i t y o f t h e model.
When t h e b a c k f i l l i s i n i t i a l l y i n a d e n s e s t a t e t h e m a j o r p o r t i o n of
t h e s o i l d i s p l a c e m e n t o c c u r s a t t h e s u r f a c e o f t h e b a c k f i l l . T h i s d i s p l a c e m e n t
i s i l l u s t r a t e d i n F i g . 37 on p . 61. Displacement o f t h e s o i l i s r e s i s t e d by
downward fo rces wh ich a r e due t o t he we igh t o f t he so i l above t he model
and shear forces which a re deve loped a t the boundar ies be tween the d i sp laced
s o i l and t he su r round ing back f i l l ma te r i a l . The upward f o r c e on the
144

w 0 a
4 - LOOSE CASE
a -J
13 > I- z 4
3 v) W
2-
3
a 0
70-
J 1.0 2.0 3.06
PENETRATION Y , IN. m J
L
='SO - - W V
IL 0 a
a 40-
i DENSE CASE
W > I- 5 20- 3 3 v) W a
0 J 0 I .o 2.0 3.06
PENETRATION Y , IN.
FIG. 78 RESULTANT VERTICAL FORCE VERSUS PENETRATION FOR MULTIPLE OVERBURDEN DEPTHS-3.54 IN. DIA CONE I
LOOSE, AND DENSE CASES
145

model i s c r e a t e d b y t h e s o i l w h i c h i s conf ined benea th t he l ower s ide o f t he
m o d e l . S i n c e t h e s o i l i s i n i t i a l l y i n i t s d e n s e s t p o s s i b l e s ta te p r a c t i c a l l y
no d i s p l a c e m e n t o f t h e s o i l o c c u r s i n t h e downward d i r e c t i o n , b u t t h e s o i l
i s f o r c e d t o f l o w i n a n upward d i r e c t i o n . T h e l o w e r g r a p h i n F i g . 78 shows
t h a t as t h e d e p t h o f o v e r b u r d e n i n c r e a s e s , t h e upward f o r c e s o n t h e model
i n c r e a s e a t a f a s t e r ra te t h a n do t h e r e s i s t i n g downward f o r c e s .
P e n e t r a t i o n o f t h e model i n t o a l o o s e b a c k f i l l c a u s e s t h e s o i l t o
d e n s i f y i n t h e v i c i n i t y o f t h e m o d e l , t h e r e b y c r e a t i n g a d d i t i o n a l s p a c e t o
accommodate t h e p e n e t r a t e d p o r t i o n of t h e m o d e l . T h e b a c k f i l l m a t e r i a l was
p laced by a l l o w i n g t h e s o i l t o f a l l t h r o u g h a funne l . Th i s t ype of placement
c r e a t e s a n o v e r a l l u n s t a b l e c o n d i t i o n t h r o u g h o u t t h e b a c k f i l l . S l i g h t v i b r a -
t i o n s o r m i n o r d i s t u r b a n c e s w i l l c a u s e t h e b a c k f i l l t o d e n s i f y t o a more
s t a b l e c o n d i t i o n . The upward displacement o f t h e l o o s e - b a c k f i l l s u r f a c e ,
due t o mode l pene t r a t ion , was s l i g h t when compared t o t h e d i s p l a c e m e n t w h i c h
t o o k p l a c e when t h e b a c k f i l l was i n a d e n s e s t a t e .
Both t es t r e s u l t s a n d v i s u a l o b s e r v a t i o n s c o n f i r m t h a t t h e r e i s a
s i g n i f i c a n t d i f f e r e n c e b e t w e e n t h e b e h a v i o r o f t h e b a c k f i l l i n a loose and
d e n s e s t a t e . The l a r g e c o n e t e s t r e s u l t s a r e shown i n F i g s . 79 and 80. The
l a r g e c o n e , l o o s e - b a c k f i l l t e s t s show t h a t t h e r e s u l t a n t v e r t i c a l f o r c e i s a
func t ion o f t he ove rburden dep th fo r dep ths less t h a n 7.08 inches. The t e s t s
t h a t were performed a t a Z depth o f 10.62 i n . i n d i c a t e t h a t t h e r e s u l t a n t
v e r t i c a l f o r c e s a r e of t h e same magni tudes as those ob ta ined f rom the t es t s
conducted a t a Z d e p t h o f 7.08 i n c h e s . T h i s i n d i c a t e s t h a t t h e i n c r e a s e d
upward v e r t i c a l f o r c e s were n u l l i f i e d by t h e i n c r e a s e d downward r e s i s t a n c e
t h a t was a f f o r d e d b y t h e 3 .54 i n . o f a d d e d b a c k f i l l m a t e r i a l ,
146

35
X)
m 23 A - > K
L
I I I I I
PENETRATION, Y , IN.
FIG. 79 RESULTANT VERTICAL FORCE VERSUS PENETRATION FOR 'MULTIPLE OVERBURDEN DEPTHS - 7.08 IN. DIA CONE, LOOSE CASE
147
p

PENETRATION Y IN,
FIG.80 RESULTANT VERTICAL FORCE VERSUS PENETRATION FOR MULTIPLE OVERBURDEN DEPTHS-108 IN. DIA CONE, DENSE CASE
148
Sphere Tests
The r e s u l t a n t v e r t i c a l f o r c e - p e n e t r a t i o n c u r v e s t h a t were ob ta ined
f rom the sphe re tests a r e shown i n F i g s . 8 1 through 8 3 . The 4.33 i n . d i a
spher ica l segment tests on loose sand show t h a t t h e r e s u l t a n t v e r t i c a l f o r c e
Rv i s no t a f u n c t i o n o f t h e o v e r b u r d e n d e p t h . I d e n t i c a l tests were perform-
ed on dense back f i l l s and t hese tes ts r e v e a l e d t h a t Rv is a f u n c t i o n o f t h e
overburden depth . These f ind ings agree wi th the 3 .54 i n . d i a c o n e r e s u l t s .
The p rev ious d i scuss ion of t he sma l l cone t e s t r e s u l t s a l s o a p p l i e s t o t h e
smal l spher ica l segment t e s t r e s u l t s .
The smal l and la rge spher ica l segment tests o n d e n s e b a c k f i l l s i n d i -
c a t e t h a t Rv i s a l i n e a r f u n c t i o n o f p e n e t r a t i o n . The t e s t r e s u l t s i n d i -
ca t e t ha t t he deve lopmen t o f ve r t i ca l fo rces on t he mode l s i s governed by
the complex behavior of the soi l which i s a func t ion of the geometry o f
t he pene t r a t ing body , t he ove rburden dep th , and t he eng inee r ing p rope r t i e s
o f t h e b a c k f i l l .
M A X I M U M RESULTANT VERTICAL FORCE ANALYSIS
A l l o f t h e t es t s , excep t t he sma l l model t e s t s o n l o o s e b a c k f i l l s ,
i n d i c a t e t h a t t h e r e s u l t a n t v e r t i c a l f o r c e R, i s a f u n c t i o n o f the overburden
depth 2 . The purpose o f t h i s a n a l y s i s i s to p rov ide a means o f p r e d i c t i n g
t h e maximum r e s u l t a n t v e r t i c a l s o i l r e s p o n s e ,
t h e p r e v i o u s tes ts , S ince
to be a func t ion o f t he ove rburden dep th 2 i t was conven ien t and l og ica l t o
expres s
Rv (max) 9 t h a t o c c u r r e d d u r i n g
Rv (max) i n t h e m a j o r i t y o f t h e tests was found
Rv (max) i n terms o f 2 .
P l o t s o f Rv<max) v e r s u s Zc a r e shown i n F i g s . 8 4 through 8 8 . The
Rv (max) v a l u e was d e f i n e d a s t h e r e s u l t a n t v e r t i c a l f o r c e w h i c h o c c u r r e d a t
t h e i n s t a n t the model p e n e t r a t i o n was e q u a l t o t h e h e i g h t o f t h e m o d e l . The
overburden exponent c i s a c o n s t a n t whose value depends on the type of model

- LOOSE CASE
E W 't 5 " '0 - I I 1
0.5 I 1.5 2:o rn W K
"
PENETRATION, Y , IN.
/ DENSE CASE
"4 k 4 w
9 ; 90- a
0 75- a
J 60- a
c
W DENSE CASE
w >
I 0 0.5 I .o 13 2.0
-
>
0 0.5 I .o 13 PENETRATION, Y , IN.
=I 2.0
FIG.81 RESULTANT VERTICAL FORCE VERSUS PENETRATION FOR MULTIPLE OVER - BURDEN DEPTHS - 4.33 IN. DIA SPHERICAL SEGMENT, LOOSE AND DENSE CASES

0
FIG. 82
1.0 PENETRATION, Y , I N.
RESULTANT VERTICAL FORCE FOR MULTIPLE OVERBURDEN SPHERICAL SEGMENT, LOOSE
2.0
V E RSUS DEPTHS- CAS E
PENETRATION 8.66 IN. DIA
3.0

I 1 :._. , "
K
PENETRATION, Y, IN.
FIG.83 RESULTANT VERTICAL FORCE VERSUS PENETRATION FOR MULTIPLE OVERBURDEN DEPTHS - 8.66 IN. DIA SPHERICAL SEGMENT, DENSE CASE

80.0
7QO -
60.0 -
9 50.0 - I
x U I >
K
W 0 K
- 40.0 -
2 J U 2 30.0- i-
W > a
i- z 2 20.0 3 v) W K t
/ t 3.54 IN. DIA CONE 0 4.33 IN. DIA SPHERICAL
I 3 10.0 X
I
- k" SEGMENT a
O O 1 I
2.0 4.0 6.0 8.0 10.0 OVERBURDEN DEPTH, 2, IN.
FlG.84 EFFECT OF OVERBURDEN DEPTH ON THE MAXIMUM DEVELOPED RESULTANT VERTICAL FORCE-DENSE CASE
153

0 7.08 IN. DIA CONE
0 2 .o 4.0 6.0 0.0 10.0 11.0
OVERBURDEN DEPTH , Z, IN.
FIG. 85 EFFECT OF OVERBURDEN DEPTH ON THE MAXIMUM DEVELOPED RESULTANT VERTICAL FORCE-LOOSE CASE

b-
1-
3 -
3 -
3 -
3 -
0 -
I I 1 0.0 4 .O 8 .o 12.0 16.0 i
- 1
1.5 L5 1.5 (OVERBURDEN DEPTH), 2 , IN.
.O
FlG.86 EFFECT OF OVERBURDEN DEPTH ON THE MAXI- MUM DEVELOFED RESULTANT VERTICAL FORCE - DENSE CASE

12.0
m J =I 0.c
5: 3
K
W
K
c
86
P J a t,
F a 6.C W > I- z
-
5 v) 4.c 3
K W
I 3 I - 2.0 a x
z
0
FI
1 I I 1 I
0
0 8.66 IN. DIA SPHERICAL SEGMENT
87
3 .O 6.0 9.0 12.0 15.0
OVERBURDEN DEPTH, 2 , IN.
EFFECT OF OVERBIJRDEN DEPTH ON THE MAXIMUM DEVELOPED RESULTANT VERTICAL FORCE- LOOSE CASE

I lO.O,f I I 1 I I I I
0.0 20.0 40 .O 60.0 t2QO 140.0 160.0 943 $35 23 O (OVERBURDEN DEPTH 1 , ,IN.
FIG.88 EFFECT OF OVERBURDEN DEPTH ON THE MAXIMUM DEVEIDPED RESULTANT VERTICAL FORCE - DENSE CASE

7.08 i n . d i a cone
4 .33 i n . d i a s p h e r i c a l
segment
8 .66 i n . d i a s p h e r i c a l
segment
TABLE 16
MAXIMUM DEVELOPED RESULTANT VERTICAL FORCES
P e n e t r a t i o n Model Type ( i n . )
3.06 3.06 3.06
3.54 i n . d i a 3.06 cone 3.06
3.06 3.06 3.06
6.12 6.12 6.12 6.12 6 .12
1 .25 1 .25 1.25 1.25 1 .25 1.25 1.25
2 .5 2 .5 2.5 2.5 2.5
Maximum R e s u l t a n t V e r t i c a l F o r c e
(1b )
4 . 2 4 .2 4 .2 4.2 7.5
23.0 35.0 61.0
15.3 31.3 31 .3 47.0
127.0
1 . 8 1 . 8 1.8 8 . 3
22.5 47.0 73.5
2 . 9 6 .4
10 .4 21.0
107,O
Depth of Overburden
( i n . )
1 . 7 7 3 .54 5 .31 8.85 1 . 7 7 3 .54 5 .31 8 .85
3.54 7.08
10.62 3 .54 7.08
4 .33 6.49
10.83 2.16 4 .33 6.49
10.83
4 .33 8.66
12.99 4.33 8 .66
D e n s i t y ( P C 0
88.0 88 .0 88 .0 88 .0
102.5 102.5 102.5 102" 5
88.0 88.0 88 .0
102.5 102 .5
88 .0 88 .0 88.0
102.5 102.5 102.5 102.5
88 .0 88.0 88 .0
102.5 102.5

and s o i l c o n d i t i o n s . T a b l e 1 6 l i s ts t h e Rv(max) v a l u e s t h a t w e r e - o b t a i n e d
from Figs. 78 through 8 3 . Figure 8 4 shows that development o f maximum r e s u l -
t a n t v e r t i c a l f o r c e s o n t h e 3.54 i n . d i a cone and t he 4.33 i n . d i a s p h e r i c a l
segment may be r ep resen ted by a s i n g l e l i n e a r r e l a t i o n s h i p . It i s i n t e r e s t i n g
t o n o t e t h a t f o r t h e same series of tests the developed
a l so c lose ly approx ima ted by a s i n g l e r e l a t i o n s h i p .
%<,ax> va lues were
The l a r g e model test r e s u l t s , which a r e p l o t t e d i n F i g s . 85 through
8 8 , i n d i c a t e t h a t t h e l o o s e - c a s e t e s t r e s u l t s may be r ep resen ted by l i n e a r
a p p r o x i m a t i o n s t h a t r e l a t e
t h a t a s i m p l e l i n e a r r e l a t i o n s h i p b e t w e e n
I n F i g s . 86 and 88 Rv(max) was p l o t t e d a s a l i n e a r f u n c t i o n o f the overbur-
den depth Z r a i s e d t o some cons t an t power c . S ince test r e s u l t s from only
two overburden depths were o b t a i n e d , t h e v a l i d i t y o f a n e x p o n e n t i a l r e l a t i o n -
s h i p e x i s t i n g b e t w e e n
This mode o f r e p r e s e n t a t i o n was chosen because i t i s c o n s i s t e n t w i t h p r e v i o u s
modes.
Rv (max) and Z. The dense test r e s u l t s i n d i c a t e
Rv (max) and Z d o e s n o t e x i s t .
Rv (max) and Z i s not confirmed by t h e t e s t d a t a .
Maximum F o r c e P r e d i c t i o n
F igu res 85 through 88 i n d i c a t e t h a t i t i s p o s s i b l e t o w r i t e a s i n g l e
e x p r e s s i o n t o c a l c u l a t e t h e a p p r o x i m a t e v a l u e o f t h e maximum developed resu l -
t a n t v e r t i c a l s o i l f o r c e
c a l c u l a t i n g
Rv (max) . Equat ion 20 i s p roposed a s a method f o r
Rv (max) . C
Rv (max) = y Z Kv ( 2 0 )
The terms a p p e a r i n g i n t h e a b o v e e q u a t i o n a r e d e f i n e d a s f o l l o w s :
= Maximum r e s u l t a n t v e r t i c a l f o r c e , Rv (max)
y = U n i t d e n s i t y o f t h e b a c k f i l l m a t e r i a l ,
Z = V e r t i c a l d e p t h b e n e a t h t h e b a c k f i l l s u r f a c e ,
c = Overburden depth exponent ,

K = A f ac to r wh ich when m u l t i p l i e d by y Zc y i e l d s t h e maximum V
r e s u l t a n t v e r t i c a l f o r c e .
Values o f Kv were c a l c u l a t e d u s i n g E q 20. These values a long with
o t h e r s i g n i f i c a n t i n f o r m a t i o n a r e l i s t e d i n T a b l e 1 7 . It should be noted
t h a t t h e Kv v a l u e s a p p e a r i n g i n t h i s t a b l e a r e v a l i d f o r o n l y t h e t e s t
condi t ions under which they were ob ta ined .
160

TABLE 1 7
COMPARISON OF Kv VALUES
Overburden Depth Exponent
Model Type Kv C
8 2 . 5 i n 3
110.0 i n " 3.54 i n . d i a cone
0
1.0
8 7 . 4 in"f: 1 .0
115 .5 i n ' ' 5 1 . 5 7 . 0 8 i n . d i a c o n e
3 5 . 4 i n 3 4 . 3 3 i n . d i a s p h e r -
i c a l s e g m e n t 110.0 in'
0
1 .0
1 4 . 7 i n " 1 . 0 8 . 6 6 i n . d i a s p h e r i c a l
segment 11 . 3 i ,o . r; i., 2 . 3 5
D e n s i t y Y
(PCf)
8 8 . 0
1 0 2 . 5
8 8 . 0
1 0 2 . 5
8 8 . 0
1 0 2 . 5
3 8 . 0
1 0 2 . 5
>';This K v a l u e i s v a l i d f o r o v e r b u r d e n d e p t h s less t h a n 7 . 0 8 i n c h e s . V
S e e F i g . 8 5 .
161

CHAPTER I X
SUMMARY OF CONCLUSIONS AND RECOMMENDATIONS
The pu rpose o f t h i s chap te r i s t o p r e s e n t a b r i e f summary o f t he
p e r t i n e n t i n f o r m a t i o n o b t a i n e d f r o m t h i s i n v e s t i g a t i o n .
PHASE I CONCLUSIONS
1. The e a r t h p r e s s u r e - p e n e t r a t i o n c u r v e s o b t a i n e d f r o m t h e t e s t s o n
l o o s e b a c k f i l l s are p a r a b o l i c i n s h a p e . The t e s t s on dense back-
f i l l s i n d i c a t e t h a t , f o r p e n e t r a t i o n v a l u e s less t h a n , o r e q u a l t o ,
t h e p e n e t r a t i o n n e c e s s a r y t o o b t a i n f a i l u r e , t h e e a r t h p r e s s u r e -
p e n e t r a t i o n c u r v e i s a l s o p a r a b o l i c .
2 . The d e n s i t y o f t h e b a c k f i l l m a t e r i a l h a s a l a r g e i n f l u e n c e
upon t h e p a s s i v e e a r t h p r e s s u r e d e v e l o p e d . The measured earth-
p r e s s u r e f a c t o r (K / cos 6 ) was approximate ly 7 f o r tes ts per-
formed on l o o s e b a c k f i l l s a n d 1 2 f o r tes ts o n d e n s e b a c k f i l l s . P
3. The r a t e and magn i tude o f t he deve lopmen t o f pas s ive ea r th p re s su re
i s e x t r e m e l y s e n s i t i v e t o t h e t y p e o f wal l movement which occurs.
P u r e l y h o r i z o n t a l p e n e t r a t i o n of t h e w a l l c a u s e s maximum e a r t h
p r e s s u r e s t o b e d e v e l o p e d a t minimum p e n e t r a t i o n ; f o r walls which
unde rgo bo th ho r i zon ta l and upward ve r t i ca l movement lesser e a r t h
p r e s s u r e s are developed a t g r e a t e r p e n e t r a t i o n s .
4 . Combined h o r i z o n t a l and upward movement o f t h e wal l caused the
c e n t e r o f e a r t h p r e s s u r e t o s h i f t s h a r p l y upward.
5. The c e n t e r o f e a r t h p r e s s u r e a t f a i l u r e was approximate ly 0.39H
f o r t es t s o n l o o s e b a c k f i l l s a n d 0.33H f o r t es t s o n d e n s e b a c k f i l l s .
.
162

6.
7.
8.
9 .
The c o e f f i c i e n t o f e a r t h p r e s s u r e a t - r e s t K was approximate ly 0 .3
When t h e b a c k f i l l was p l a c e d i n a l o o s e s t a t e a n d 1 . 0 w i t h t h e
b a c k f i l l i n a d e n s e s t a t e . V i g o r o u s v i b r a t i o n of t h e b a c k f i l l
may c a u s e t h e a t - r e s t c o e f f i c i e n t t o b e a s l a r g e as 1 .78 .
The measured angle Bm t h a t t h e f a i l u r e s u r f a c e made w i t h t h e
h o r i z o n t a l was i n e v e r y i n s t a n c e g r e a t e r t h a n t h e f 3 ~ va lue
ca l cu la t ed u s ing Cou lomb ' s equa t ion fo r pas s ive ea r th p re s su re .
The amount and r a t e o f w a l l f r i c t i o n . d e v e l o p m e n t is a func t ion
o f t h e d e n s i t y o f t h e b a c k f i l l m a t e r i a l .
The t e s t s e t u p a d e q u a t e l y s i m u l a t e d t h e c l a s s i c a l p l a n e s t r a i n
ear th-pressure p roblem, a l though, the wal l was not completely
r e s t r i c t e d from moving i n a v e r t i c a l d i r e c t i o n .
0
PHASE I RECOMMENDATIONS
1.
2.
The wooden v e r t i c a l r e s t r a i n t t h a t was u s e d t o c o n s t r a i n t h e
load ing appa ra tus from moving i n a v e r t i c a l d i r e c t i o n d i d n o t
func t ion p rope r ly . A r i g i d l y mounted s t ee l r e s t r a i n t would be
more s a t i s f a c t o r y .
The measu remen t o f wa l l f r i c t ion u s ing t h i s t e s t s e t u p was
u n s a t i s f a c t o r y f o r o b t a i n i n g t h e e a r l y p o r t i o n o f t h e w a l l
f r i c t ion -pene t r a t ion cu rve . The f r i c t iona l fo rce deve loped be tween
t h e t h r e e l o a d c e l l s a n d t h e r e a r f a c e of t h e w a l l p r e c l u d e d f r i c -
t ional measurements below a w a l l f r i c t i o n a n g l e o f 5 .9 degrees .
Th i s d i sadvan tage cou ld be e l imina ted by i n se r t ing s eve ra l s t ee l
bars , which have a kni fe edge on each end , in be tween the wal l
and a b e a r i n g p l a t e . The n e c e s s a r y h o r i z o n t a l t h r u s t would b e
t r ansmi t t ed f rom the l oad cel ls in to t he bea r ing p l a t e wh ich wou ld
i n t u r n t r a n s m i t t h e l o a d t o t h e b a r s . S t r u c t u , r a l l y , t h e b a r s
r e p r e s e n t s t ee l columns which a r e p i n n e d a t e a c h e n d .

PHASE I1 CONCLUSIONS
1.
2.
3 .
4 .
5.
6 .
Wall p e n e t r a t i o n v e l o c i t i e s less than 2.667 i p s h a d n e g l i g i b l e
e f f e c t s u p o n t h e f o r c e - p e n e t r a t i o n c h a r a c t e r i s t i c s o f t h e s a n d
b a c k f i l l .
Coulomb's theory o f pass ive ear th p ressure , on the average ,
p r e d i c t e d t h e maximum measured ear th-pressure fac tor wi th in 15 per
c e n t f o r t e s t s conduc ted on dense back f i l l s . The p red ic t ion accu -
r acy was p o o r e r f o r t h e t e s t s c o n d u c t e d o n l o o s e b a c k f i l l s . On
t h e a v e r a g e , t h e p r e d i c t e d v a l u e s f o r t h e 1 2 a n d 18 in . wal l loose-
tes ts were 43.4 a n d 2 0 . 7 p e r c e n t r e s p e c t i v e l y , g r e a t e r t h a n t h e
measured values .
Us ing the average Y/H v a l u e s l i s t e d i n T a b l e 13 on p . 120, the
wall p e n e t r a t i o n a t which the maximum p a s s i v e e a r t h p r e s s u r e
occurred may be expressed by Y = 0.0113H1'15; t h i s e q u a t i o n i s
v a l i d o n l y f o r d e n s e b a c k f i l l s y s t e m s .
The maximum deve loped ang le s o f i n t e rna l f r i c t ion were on t he
average approximately 2 degrees higher and 5 degrees lower than
t h e maximum v a l u e s p r e d i c t e d f r o m t r i a x i a l t e s t s o n C o l o r a d o R i v e r
s a n d i n i t s d e n s e s t a n d l o o s e s t s t a t e s r e s p e c t i v e l y .
The average loca t ion of the cen ter p ressure , above the bo t tom of
t h e w a l l , a t f a i l u r e was 0.33H and approximately 0.39H for dense
a n d l o o s e b a c k f i l l s t a t e s r e s p e c t i v e l y .
The o r i e n t a t i o n o f t h e f a i l u r e s u r f a c e , @r , as found from Eq 26
on p . 172 i s on the average approximate ly 5 degrees lower than the
m e a s u r e d o r i e n t a t i o n B . T h e o b s e r v e d o r i e n t a t i o n o f t h e f a i l u r e
s u r f a c e i s p r e d i c t e d w i t h much b e t t e r a c c u r a c y i f t h e w a l l i s
assumed t o be smooth thereby making BT e q u a l t o (45' - @/2) .
m
164

PHASE I1 RECOMMENDATIONS
1. Tes ts should be per formed a t g r e a t e r w a l l p e n e t r a t i o n v e l o c i t i e s
t o d e t e r m i n e t h e s t r a i n rate e f f e c t s upon t h e f o r c e - p e n e t r a t i o n
c h a r a c t e r i s t i c s o f t h e b a c k f i l l m a t e r i a l .
2. Much needed information could be obtained by performing tests
u s i n g v a r i o u s t y p e s o f s o i l s . It is a l so d e s i r a b l e t o v a r y t h e
d e n s i t y o f t h e b a c k f i l l m a t e r i a l t o o b t a i n t h e f u l l r a n g e o f f o r c e -
p e n e t r a t i o n c u r v e s f o r a p a r t i c u l a r s o i l t y p e . The roughness o f
t h e w a l l h a s a g r e a t i n f l u e n c e upon the magni tude o f the deve loped
e a r t h p r e s s u r e s a n d i t is t h e r e f o r e a d v i s a b l e t o p e r f o r m tes t s us-
i n g walls o f va r ious deg rees o f roughness .
3 . Tes t s shou ld be pe r fo rmed u s ing s eve ra l wa l l he igh t s . Th i s s tudy
has shown t h a t t h e p e n e t r a t i o n n e c e s s a r y t o o b t a i n t h e maximum
d e v e l o p e d p a s s i v e e a r t h p r e s s u r e i s no t a l i n e a r f u n c t i o n o f t h e
wal l h e i g h t , a s i t i s normally assumed, and i t i s the re fo re sug -
g e s t e d t h a t l a r g e r w a l l h e i g h t s b e t e s t e d t o o b t a i n d a t a t h a t
c o u l d b e u s e d i n p r e d i c t i n g f o r c e - p e n e t r a t i o n c h a r a c t e r i s t i c s o f
l a r g e r wal ls .
4 . The t e s t s e t u p d i d n o t p r o v i d e a s a t i s f a c t o r y means of obtaining
w a l l f r i c t i o n - p e n e t r a t i o n c u r v e s , The f r i c t i o n a l r e s i s t a n c e
be tween t he ho r i zon ta l t h rus t sys t em and t he r ea r f ace o f t he wa l l
can be e l imina ted by u s ing t he p rocedure ou t l i ned unde r t he Phase I
Recommendations, point 2. The weight of the w a l l should be counter -
ba lanced by a system which w i l l move h o r i z o n t a l l y a s t h e wall pene-
t r a t e s i n t o t h e b a c k f i l l . The counterba lance sys tem should be
i n s t r u m e n t e d t o o b t a i n a m e a s u r e o f t h e f r i c t i o n a l f o r c e d e v e l o p e d
a t t h e s o i l - w a l l i n t e r f a c e .

PHASE I11 CONCLUSIONS
1.
2 .
3 .
Model p e n e t r a t i o n v e l o c i t i e s less than 4.0 i p s h a d n e g l i g i b l e
e f f e c t s upon t h e f o r c e - p e n e t r a t i o n c h a r a c t e r i s t i c s o f t h e s a n d
b a c k f i l l .
The maximum h o r i z o n t a l s o i l r e a c t i o n R o n e i t h e r s i z e o f
cone o r sphe r i ca l s egmen t was d i r e c t l y p r o p o r t i o n a l t o t h e o v e r -
burden depth 2 squared.
The p r e d i c t i o n o f t h e maximum r e s u l t a n t v e r t i c a l s o i l r e a c t i o n
Rv (max)
d i c t i o n o f t h e
b a c k f i l l s i n d i c a t e d t h a t
small model tes ts o n d e n s e b a c k f i l l s i n d i c a t e d t h a t
d i r e c t l y p r o p o r t i o n a l t o 2. The l a r g e model tests on loose back-
f i l l s showed t h a t R was d i r e c t l y p r o p o r t i o n a l t o 2. The
l a r g e model t e s t s on d e n s e b a c k f i l l s showed t h a t R was
d i r e c t l y p r o p o r t i o n a l t o Z r a i s e d t o some power g r e a t e r t h a n
one.
H (max)
on each model i s considerably more complex than the pre-
% (max) va lue . The sma l l model tes ts on loose
i s not a f u n c t i o n Z. The Rv (max)
Rv (max) i s
v (max)
v (max)
PHASE I11 RECOMMENDATIONS
1. The d e s i g n o f t h i s t e s t s e t u p n e c e s s i t a t e d t h e u s e o f a f l e x i b l e
membrane which was u s e d t o c o n f i n e t h e b a c k f i l l i n a h o r i z o n t a l
d i r e c t i o n . As t h e b a c k f i l l was p l aced , t he membrane d e f l e c t e d
under the hor izonta l forces p roduced by the weight o f the sand .
The i n i t i a l membrane d e f l e c t i o n i n c r e a s e d r a p i d l y a s t h e d e p t h
of overburden was inc reased . Model pene t r a t ion caused t he po r -
t i o n o f t h e membrane i n c o n t a c t w i t h t h e model to be pushed in-
ward t owards t he back f i l l wh i l e t he r ema in ing po r t ions of t h e
166

~ PHASE I11 RECOMMENDATIONS (Continued) '
1. (Continued)
membrane d e f l e c t e d o u t w a r d u n d e r t h e i n c r e a s e d h o r i z o n t a l s o i l
stresses. Hence , l oca l i zed po r t ions o f t h e b a c k f i l l were moving
i n t h e d i r e c t i o n o f model p e n e t r a t i o n and o t h e r p o r t i o n s were mov-
i n g i n a n o p p o s i t e d i r e c t i o n . The deve loped ver t ica l and hor i -
z o n t a l s o i l r e a c t i o n s a r e t h e r e f o r e n o t s o l e l y f u n c t i o n s o f t h e
model geometry and the properties o f t h e b a c k f i l l , b u t a r e a l s o
g r e a t l y i n f l u e n c e d by t h e i n t e r a c t i o n b e t w e e n t h e b a c k f i l l and
t h e membrane. T h i s i n t e r a c t i o n c o u l d b e e l i m i n a t e d by pos i t i on -
i n g t h e model w i t h i n t h e b a c k f i l l . The h o r i z o n t a l t h r u s t s h a f t
would pass through an outer casing which would keep the instru-
m e n t e d t h r u s t - s h a f t f r e e f r o m t h e b a c k f i l l m a t e r i a l . I t would
f i r s t be necessa ry t o p l ace t he model and s h a f t h o u s i n g i n t h e
backf i l l con ta ine r and t hen p l ace t he s and a round t he a s sembly .
2 . Valuab le i n fo rma t ion cou ld be ob ta ined by performing tests on
s e v e r a l t y p e s o f s o i l tha t had been p laced us ing vary ing degrees
o f d e n s i f i c a t i o n .
3. The r e l a t i v e i n f l u e n c e o f model geometry could be obtained by
us ing cones , sphe r i ca l s egmen t s , and f l a t p l a t e s . A minimum of
t h r e e s i z e s o f e a c h model should be tes ted.
APPENDIX A
COMPUTER PROGRAM PASSIV
Program PASSIV was w r i t t e n t o r e d u c e a n d c o n v e r t t h e raw l o a d - c e l l
s t r a i n d a t a t o a usable form. The program a l so ca lcu la ted va lues o f deve loped
p a s s i v e e a r t h p r e s s u r e , p a s s i v e e a r t h - p r e s s u r e f a c t o r s , l o c a t i o n o f c e n t e r o f
p r e s s u r e s , o r i e n t a t i o n o f f a i l u r e s u r f a c e s , and deve loped angles o f in te rna l
f r i c t i o n a n d w a l l f r i c t i o n f o r e a c h tes t performed during Phase I .
C a l c u l a t i o n o f P a s s i v e E a r t h P r e s s u r e
The h o r i z o n t a l f o r c e r e q u i r e d t o p u s h t h e w a l l i n t o t h e b a c k f i l l
was measured by Load C e l l s 1, 2 , and 3 . A p o r t i o n o f t h e f r i c t i o n a l f o r c e
developed a t t h e s o i l - w a l l i n t e r f a c e was measured by Load C e l l 4 . The
deve loped pas s ive ea r th p re s su re may be expressed as
- - 'Horiz 'p cos 6
where ,
'Horiz = P, + P2 + P3.
F igu re 89 shows a s k e t c h o f t h e f o r c e s n e c e s s a r y t o k e e p t h e w a l l i n an
e q u i l i b r i u m s t a t e . F o r c e s PI , P2, and P3 were ca lcu la ted by
where ,
R . = S t r a i n r e c o r d e d f o r Load C e l l i , 1
(R ) . = Zero c o r r e c t i o n due t o c e l l d r i f t d u r i n g t h e t e s t , 0 1
S . = S l o p e o f c a l i b r a t i o n c u r v e f o r Load Cell i. 1
168

I - - . S A N D
.
FlG.89 FORCES NECESSARY FOR EQUILIBRIUM O F THE WALL FORMED BY THE STEEL PLATES
FIG.90 POSlTlQN O F LOAD--CELL REACTIONS ON THE CENTER PLATE

T h e v a l u e s o f wall f r i c t i o n 6 were o b t a i n e d f r o m t h e e q u a t i o n w t i i c h ex-
p r e s s e d t h e a p p r o p r i a t e p o r t i o n o f the c u r v e s s h o w n i n F i g . 45 on p . 78 .
It s h o u l d b e n o t e d t h a t a series o f v a l u e s o f p a s s i v e e a r t h p r e s s u r e w i l l be
o b t a i n e d f o r e a c h t e s t , t h e s e v a l u e s b e i n g d e p e n d e n t u p o n t h e a m o u n t o f wa l l
p e n e t r a t i o n .
C a l c u l a t i o n o f P a s s i v e E a r t h - P r e s s u r e F a c t o r s
T h e p a s s i v e e a r t h - p r e s s u r e f a c t o r was e x p r e s s e d b y
K " -E_=+
P
c o s 6 0 . 5 y H
where ,
P = P a s s i v e e a r t h p r e s s u r e , P y = B a c k f i l l d e n s i t y ,
H = H e i g h t o f w a l l .
C a l c u l a t i o n o f t h e C e n t e r o f P r e s s u r e
T h e c e n t e r o f p r e s s u r e was found by summing moments about t h e l o w e r
e d g e o f t h e c e n t e r p l a t e . T h e c e n t r o i d a l d i s t a n c e i s expres sed by E q 25
a n d t h e c o n s t a n t s a p p e a r i n g i n t h e e q u a t i o n a r e d e f i n e d i n F i g . 90.
CD = 3P1 + 9Pa + 3P3
'Horiz
C a l c u l a t i o n s B a s e d o n C o u l o m b ' s T h e o r y
The p rog ram con ta ins a g e n e r a l e x p r e s s i o n t h a t c a l c u l a t e s t h e p a s s i v e
e a r t h p r e s s u r e b a s e d o n C o u l o m b ' s a s s u m p t i o n t h a t t h e f a i l u r e s u r f a c e i s p l a n e .
T h e p a s s i v e e a r t h p r e s s u r e n e c e s s a r y t o k e e p t h e f a i l u r e w e d g e , shown i n F i g . 9 1 ,
i n e q u i l i b r i u m i s

H
I FIG.91 PASSIVE FAILURE WEDGE BEHIND A RETAINING
WALL
FIG.92 EQUILIBRIUM FORCE POLYGON FOR THE FAILURE WEDGE SHOWN IN FIG.91

w h e r e t h e w e i g h t o f t h e f a i l u r e wedge i s
W = 1 / 2 y H 2 S i n (a + i ) s i n (180' - CY - 8) S i n ( 8 - i ) S i n 2 CY
A l l o f t h e p a r a m e t e r s a p p e a r i n g i n E q s 26 and 2 7 a r e known e x c e p t f o r
t h e a n g l e @. The angle @ i s v a r i e d u n t i l t h e minimum p a s s i v e e a r t h p r e s s u r e
i s found. It s h o u l d b e n o t e d t h a t a n e x p r e s s i o n f o r P c a n b e d e v e l o p e d , i n
which fl d o e s n o t a p p e a r a n d b y t h e d i r e c t s u b s t i t u t i o n o f known p a r a m e t e r s ,
P
t h e maximum v a l u e o f t h e p a s s i v e e a r t h p r e s s u r e i s obtained. However , by
e x p r e s s i n g t h e p a s s i v e e a r t h p r e s s u r e a s shown i n Eq 2 6 , o n e n o t o n l y o b t a i n s
t h e v a l u e o f e a r t h p r e s s u r e , b u t a l s o t h e o r i e n t a t i o n o f t h e f a i l u r e s u r f a c e .
Values o f K / c o s 6 were o b t a i n e d u s i n g Eq 24. P
T h e d e v e l o p e d a n g l e o f i n t e r n a l f r i c t i o n was c a l c u l a t e d u s i n g
Eq 28.
V a l u e s o f P were o b t a i n e d f r o m Eq 2 1 , a n d t h e s e v a l u e s a l o n g w i t h y ,
H , 6 , Cy, and i v a l u e s were s u b s t i t u t e d i n t o Eq 28 . The developed @
v a l u e s were then found by u s ing a t r i a l a n d e r r o r s u b s t i t u t i o n p r o c e d u r e .
E q u a t i o n 28 r e d u c e s t o Eq 7 on p . 1 2 i f i i s s e t e q u a l t o z e r o a n d Cy i s s e t
e q u a l t o 90 d e g r e e s .
P
T h e f o l l o w i n g p a g e s c o n t a i n a f l o w d i a g r a m , l i s t i n g , e x a m p l e d a t a
i n p u t , d i s c u s s i o n o f d a t a i n p u t , d a t a i n p u t f o r m , a n d e x a m p l e d a t a o u t p u t
fo r P rogram PASSIV.

GENERAL FLDW DIAGRAM FOR PROGRAM PASSIV
INPUT
- -
A 1I
f \
\ TERM I NATlO
I I I
PROGRAM INPUT
1 D O 5 I= I,N
I
L
I
L SUBROUTINE
c
COULOMB
RATIOS
PROGRAM OUTPUT
I
GO To I00
1 w CALCULATION
I +OF” 1 CALCULATION ---= RETURN

FORTRAN L i s t i n g
PASSIV~l~100~130000~4O~CE694527~HUSTAD. QXX(RUN*G) Q X X ( P A S S I V 1 -
PROGRAM PASSIV ( INPUT*OUTPUT) RUN N GAMMA DELMAX
DELTA
P H I M A X F I SH I ALPHA SCN
CNZERO
DEFL CELLN
FLOADN
RELOAD PEPM PEPT BETA
P KM
A VARIABLE USED TO READ AND PRINT PROGRAM I D E N T I F I C A T I O N
THE UNIT DENSITY OF THE S O I L ( PCF 1 THE MAXIMUM VALUE OF F R I C T I O N AT THE S O I L - WALL INTERFACE (OEGREES I THE ANGLE OF F R I C T I O N DEVELOPED A T THE S O I L - WALL INTERFACE THE MAXIMUM VALUE OF INTERNAL FRICTION (DECREES) SLOPE OF THE BACKFILL MATERIAL (DEGREES 1 SLANT HEIGHT OF THE WALL ( FEET 1 ANGLE BETWEEN THE WALL AND THE HORIZ. (DEGREES) WHERE N VARIES FROM 1 T O 4 THESE VARIABLES REPRESENT'THE SLOPE OF THE CALIBRATION CURVES FOR EACH OF THE LOAD CELLS ( L B S . / MICRO-INCH) WHERE N VARIES FROM 1 TO 4 THESE VARIBLES REPRESENT THE ZERO CORRECTION MEASUREMENT FOR EACH LOAD CELL (MICRO-INCHES) HORIZONTAL PENETRATION OF THE WALL ( INCHES 1 WHERE N VARIES FROM 1 TO 4 THESE VARIABLES REPRESENT THE LOAD CELL READINGS M I CRO- I NCHES ) WHERE N VARIES FROM 1 TO 4 THESE VARIABLES REPRESENT THE FORCE MEASURED BY EACH LOAD CELL I LBS. 1 THE RESULTANT HORIZONTAL FORCE ( LBS. 1 PASSIVE EARTH PRESSURE OBTAINED FROM TEST MEASUREMENTS
THE NO. OF DEFLECTION VALUES INPUT
THE PASSIVE EARTH PRESSURE OBTAINED USING COULOMBS THEORY ANGLE THAT THE FAILURE PLANE MAKES WITH THE HORIZONTAL U N I T S --- (DEGREES 1 COEFFICIENT OF PASSIVE EARTH PRESSURE THAT I S CALCULATED USING TEST RESULTS

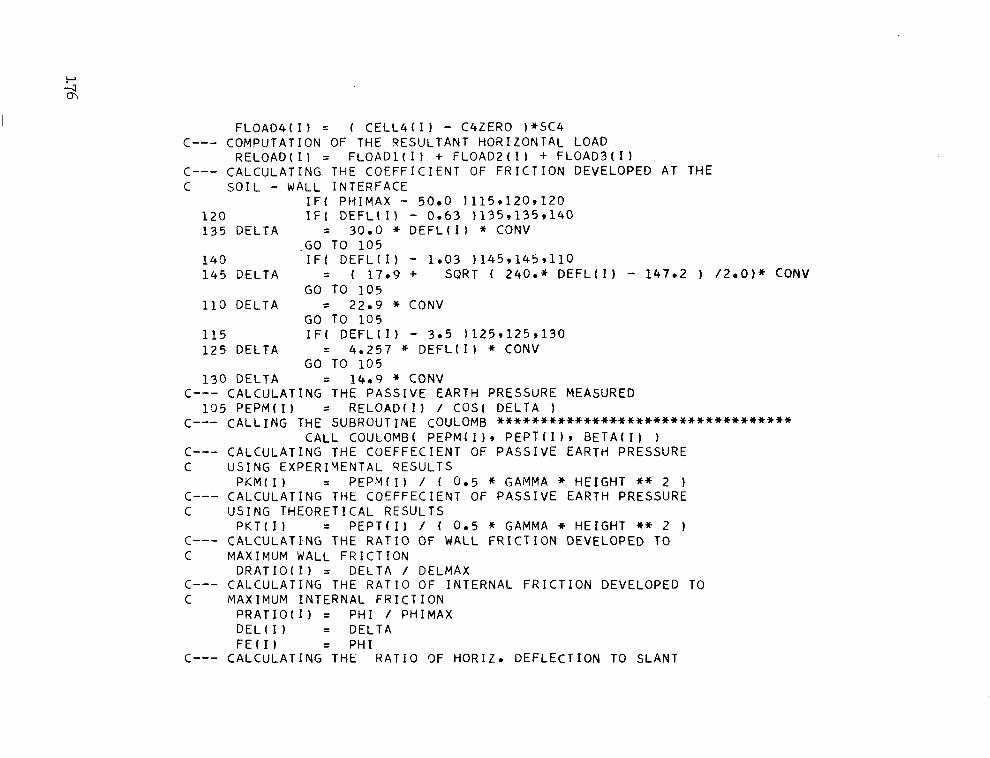
F L O A D 4 ( 1 ) = ( C E L L b ( 1 ) - C4ZERO )*SC4
R E L O A D ( 1 ) = F L O A D l ( 1 ) + F L O A D Z ( 1 ) + F L O A D 3 ( 1 ) C -" COMPUTATION OF THE RESULTANT HORIZONTAL LOAD
C"- CALCULATING THE COEFFICIENT OF FRICTION DEVELOPED A T THE C S O I L - WALL INTERFACE
I F ( PHIMAX - 50.0 )115 ,120 ,120 1 2 0 I F ( D E F L ( I 1 - 0.63 1135,135,140 135 DELTA = 30.0 * D E F L ( 1 ) * CONV
1 4 0 I F ( D E F L ( 1 ) - 1.03 ) 1 4 5 , 1 4 5 9 1 1 0 145 DELTA = ( 17.9 + SQRT ( 2 4 0 . * D E F L ( 1 ) - 147.2 ) l 2 . 0 ) " CONV
,GO TO 1 0 5
GO T O 1 0 5
GO T O 1 0 5 110 DELTA = 22.9 * CONV
1 1 5 I F ( D E F L ( 1 ) - 3.5 ) 1 2 5 , 1 2 5 , 1 3 0 125 DELTA = 4.257 * D E F L ( I 1 * CONV
130 DELTA = 16.9 * CONV C-" CALCULATING THE PASSIVE EARTH PRESSURE
1 3 5 P E P M ( 1 ) = R E L O A D ( 1 ) / COS( DELTA 1
GO TO 1 0 5
MEASURE D
C--- C A L L I N G THE SUBROUTINE COULOMB . . . . . . . . . . . . . . . . . . . . . . . . . . . . . . . . . . CALL COULOMB( P E P M ( I 1 , P E P T ( I ) , B E T A ( 1 ) 1
C"- CALCULATING THE COEFFECIENT OF PASSIVE EARTH PRESSURE C USING EXPERIMENTAL RESULTS
PKM( I) = P E P M ( 1 ) / ( 0.5 * GAMMA * HEIGHT ** 2 ) C-" CALCULATING THE COEFFECIENT OF PASSIVE EARTH PRESSURE C USING THEORETICAL RESULTS
P K T ( I ) = P E P T ( 1 ) / ( 0.5 * G A M M A * HEIGHT ** 2 ) C"- CALCULATING THE RATIO OF WALL FRICTION DEVELOPED TO C MAXIMUM WALL F R I C T I O N
C-" CALCULATING THE R A T I O OF INTERNAL FRICTION DEVELOPED T O C MAXIMUM INTERNAL FRICTION
P R A T I O I I ) = P H I / PHIMAX D E L ( I ) = DELTA F E ( I ) = P H I
D R A T I O ( 1 ) = DELTA / DELMAX
C-" CALCULATING THE R A T I O ' IF HORIZ. DEFLECTION TO SLANT
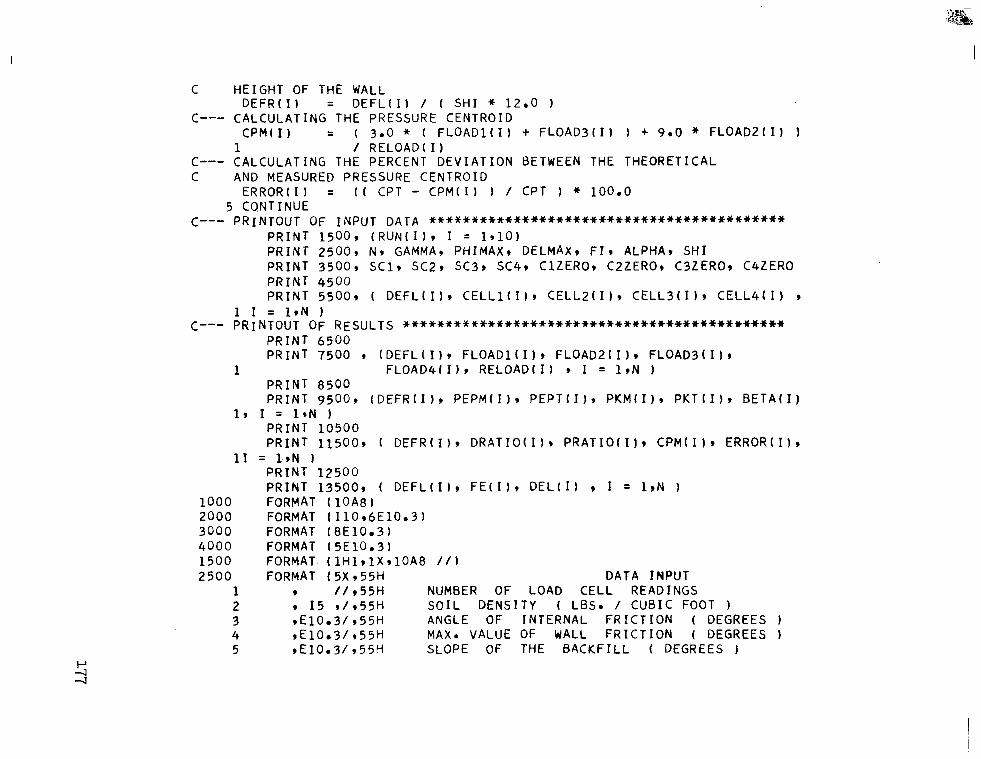
C HEIGHT OF THE WALL
C”- CALCULATING THE PRESSURE CENTROID D E F R ( I 1 = D E F L ( 1 ) / ( S H I * 12.0 1
CPM( I ) = ( 3.0 * ( F L O A D l ( 1 ) + F L O A D 3 ( 1 1 1 + 9.0 * F L O A D Z ( I 1 1 1 / R E L O A D I I )
C”- CALCULATING THE PERCENT DEVIAT ION BETWEEN THE THEORETICAL C AND MEASURED PRESSURE CENTROID
ERROR(1) = ( ( CPT - C P M ( I 1 1 / CPT 1 * 100.0 5 CONTINUE
C--- PRINTOUT OF INPUT DATA ++++++t********+***+*****~****************
P R I N T 1 5 0 0 , ( R U N ( I 1 , I = 1,101 PRINT 2500 , N, GAMMA, PHIMAX, DELMAX, F I , ALPHA, S H I PRINT 3500 , SC l r SC29 SC39 SC4, ClZERO, C2ZER0, C3ZEROv C4ZERO PRINT 4500 PRINT 5500, ( D E F L ( I 1 , C E L L l ( I 1 9 C E L L Z ( I 1 , C E L L 3 ( I ) , C E L L 4 ( I ) 9
C”- 1 r = I,N 1 PRINTOUT OF RESULTS . . . . . . . . . . . . . . . . . . . . . . . . . . . . . . . . . . . . . . . . . . . . .
P R I N T 6 5 0 0 P R I N T 7 5 0 0 9 ( D E F L ( I ) , F L O A D l ( I 1 , F L O A D 2 ( I ) , F L O A D 3 ( 1 ) 9
P R I N T 8 5 0 0 1 FLOAD4f I ) * RELOAD( I ) * I = 1,N 1
PRINT 9 5 0 0 , I D E F R ( I ) r P E P M ( I ) , P E P T ( I 1 , P K M ( I 1 , P K T ( I ) , B E T A ( 1 ) 1, I = 1,N 1
P R I N T 1 0 5 0 0 P R I N T 1 1 5 0 0 , ( D E F R ( I 1 , D R A T I O ( I 1 , P R A T I O ( I 1 , C P M ( I 1 , E R R O R ( I 1 ,
PRINT 12500 11 = l.,N 1
PRINT 13500, ( D E F L ( I 1 , F E ( I ) , D E L ( I 1 9 I = 1,N ) 1 0 0 0 FORMAT ( 1 0 A 8 1 2 0 0 0 FORMAT (110,6E10.3) 3000 FORMAT (8E10 .3 ) 4 0 0 0 FORMAT (5E10 .3 ) 1 5 0 0 FORMAT. ( l H l , l X , l O A 8 / / I 2 5 0 0 FORMAT ( 5X 9 55H DATA INPUT
1 9 / / 955H NUMBER OF LOAD CELL READINGS 2 9 I 5 r / r 5 5 H SOIL DENSITY ( LBS. / CUBIC FOOT 1 3 ,E1003/ ,55H ANGLE OF INTERNAL FRICTION ( DEGREES 1 4 ,E10.3/ 955H MAX. VALUE OF WALL F R I C T I O N ( DEGREES 1 5 ,E lOe3/ ,55H SLOPE OF THE BACKFILL ( DEGREES 1

6 ,E10.3/,55H ANGLE BETWEEN WALL AND HORIZ. ( DEGREES 1 7 rE10.3/ 955H SLANT HEIGHT OF THE WALL ( FEET )
8 r E 1 0 . 3 r / / )
1 ,E10.3/ 955H SLOPE OF CAL. CURVE FOR CELL NO. 2 (LBS./ INC 2H 1 ,E10.3 /+55H SLOPE OF CAL. CURVE FOR CELL NO. 3 ( L B S * / I N C 3H 1 , E l O e 3 / 9 5 5 H SLOPE OF CAL. CURVE FOR CELL NO. 4 (LBS. / INC 4 H 1 ,E10.3/ t 5 5 H ZERO BALANCE CORR. FOR CELL NO. 1 (MICRO-IN
3 5 0 0 FORMAT (5X950HSLOPE OF CAL. CURVE FOR CELL NO. 1 (LBS. / INCHI
5 C H ) ~ E 1 0 . 3 / 9 5 5 H ZERO BALANCE CORR. FOR CELL NO. 2 (MICRO-IN 6CH) ,E10.3/,55H ZERO BALANCE 'CORR. FOR CELL NO. 3 (MICRO-IN 7CY) ,E10.3/ 955H ZERO BALANCE CORR. FOR CELL NO. 4 (MICRO-IN 8CH) ,E10.3/ / 1
4 5 9 0 FORMAT (60H DEFLECTION AND LOAD CELL STRAIN READ 1 INGS / / 965H DEFLECTION CELL NO. 1 CELL NO. 2 CELL NO. 3 2 CELL NO. 4 ,/,65H INCHES (""""-""" M I CRO- I NCHES 3"""""""" 1 , / / I
5 5 0 0 FORMAT ( 5 X ~ E 1 ~ . 3 ~ 3 X ~ E 1 0 . 3 ~ 2 X , E 1 0 . 3 , 2 X 1 E 1 0 1 3 , 2 X , E ~ O ~ 3 ) 6 5 0 0 FORMAT I l H 1 , / / , 5 C H OUTPUT INFORMATIO
1N 9 1 ~ 7 5 H DEFLECTION CELL NO. 1 CELL NO. 2 CELL NO. 2 3 CELL NO. 4 RESULTANT 3
,/
4"""""" "_""" 75H INCHES (--------- --------------- LBS. e
7 5 0 0 8 5 0 0 FORMAT ( / / / 9 6 8 H DEFR P EPM
- 1 ? / / 1 FORMAT ( l X , E 1 0 . 3 , 5 ( 2 X ~ E 1 0 . 3 ) )
1 PKT B E T A * / r 7 0 H U N I T L E S S ( LBS. / L I N . FT. ) ( - 2"- UNI TLESS ----
PEPT PKM
1 DEGREES 9 / / ) 9 5 0 0 FORMAT ( l X , E 1 0 . 3 ~ 5 ( 2 X ~ E 1 0 . 3 ) )
1 0 5 0 0 FORMAT 1 / / / 960H DEFR DRAT10 PRAT I O 1 ERROR 9 / 9 6 OH ( ----*----- UNITLESS --------- 2 PERCENT q / / )
C PM I INCHES
1 1 5 0 0 FORMAT ( lX ,E10.394(2X,E10.3) ) 1 2 5 0 0 FORMAT (////,72H DEFLECTION INTERNAL FRICTION DEVELOPED
1 WALL F R I C T I O N DEVELOPED , / r 6 5 INCHES DEGREES 2 DEGREES
1 3 5 0 0 FORMAT ( 5 X + E 1 0 . 3 ~ 1 0 X , E 1 0 . 3 , 1 9 X ~ E l O ~ 3 ) C"- GOING BACK T O READ ANOTHER SET OF DATA
GO T O 1 0 0 9 9 9 9 9 CONTINUE
END

C“- T H I S IS THE END OF THE MAIN PROGRAM . . . . . . . . . . . . . . . . . . . . . . . . . . . . . SUBROUTINE COULOMB( PEMI PET* BETA )
COMMON GAMMA, DELTA, PHI, PHIMAX, F I I SHIs ALPHA, CONV, HEIGHT KCASE = o F I NC = 1.0
I F ( DELTA - 0.314 185*85 ,90 C”- G I V I N G BETA AN I N I T I A L VALUE (RANKINE STATE
8 5 BETA = ( 45.0 - PHIMAX I 2.0 1 * CONV GO TO 9 5
C-“ G I V I N G BE.TA AN I N I T I A L VALUE 90 BETA = 10.0 * CONV
C-” CONVERTING ANGLES I N DEGREES TO RADIANS 9 5 F I = FI * CONV
PH I MAX = PHIMAX * CONV ALPHA = ALPHA * CONV HE IGHT = S H I * S I N ( ALPHA 1 J = o
C-” CALCULATING THE LENGTH OF THE FAILURE PLANE 10 S L I P = S I N ( ALPHA + F I 1 * S H I / S I N (
(FROM LAW OF SINES BETA - F I 1
C”- CALCULATING THE VOLUME OF S O I L W I T H I N THE FAILURE WEDGE VOL = 0.5 * ( S L I P * S H I * S I N ( 180.0 * CONV - ( ALPHA
WE I GHT = VOL * GAMMA THETA = DELTA + ALPHA
1 BETA) 1 1 +
C”- CALCULATING THE PASSIVE-EARTH PRESSURE USING COULOMBS ASSUMPTION C OF A PLANE RUPTURE SURFACE
PET = WEIGHT * S I N ( BETA + PHIMAX) / S I N ( 180.0 * CONV - 1 (THETA + BETA + P H I M A X I )
C-” CHECKING TO SEE IF A PREVIOUS VALUE OF PASSIVE EARTH PRESSURE C ( PEPP) HAS BEEN CALCULATED
C-” CHECKING TO SEE IF THIS VALUE OF PASSIVE EARTH PRESSURE rs GREATER
C THAN THE PREVIOUS VALUE (PEPPI
I F ( J.GT.0)15,20
1 5 I F ( PEToGToPEPP 125920 20 EETAP = BETA
C”- DECREASING BETA BY EITHER 1 OR 0.1 DEGREES BETA = BETA - F I N C * CONV PEPP = PET J = 1

GO TO 10 C"- CHECKING TO SEE I F F I N C HAS BEEN REDUCED TO 0.1
2 5 I F ( KCASE.GT.0 135930 30 F I N C = 0.1
BETA = BETAP KCASE = 1
GO TO 10 3 5 BETA = BETAP / CONV
PET = PEPP
KCASE = o F I NC = 1.0
P H I = F I N C * CONV P I E = 180.0 * CONV
GAMH I = 0.5 * GAMMA * HEIGHT ** 2
C"- BEGINNING OF CALCULATIONS FOR DEVELOPED INTERNAL FRICTION *******
C-" G I V I N G P H I AN I N I T I A L VALUE OF 1 DEGREE
C"- CALCULATING THE MINIMUM VALUE OF PASSIVE EARTH PRESSURE POSSIBLE
C"- CHECKING TO SEE I F THE PASSIVE EARTH PRESSURE IS GREATER THAN THE C MINIMUM VALUE
C-" CALCULATING PASSIVE EARTH PRESSURE FOR A VALUE OF DEVELOPED C INTERNAL FRICTION
I F ( PEM - GAMHI 170970940
40 FNUM = S I N ( P I E + P H I - ALPHA 1 / S I N ( P I E - ALPHA 1 " - FDEN = SQRT ( S I N ( P I E - ALPHA - DELTA 1 1 - SQRT ( S I N ( P H I
1 + DELTA 1 * S I N ( P H I + F I 1 / S I N ( P I E - ALPHA -FI)) P = GAMHI * ( FNUM / FDEN 1 ** 2
I F ( P - PEM 145950950 45 P H I P = P H I
C-" INCREASING PHI BY EITHER 1 OR 0.1 DEGREES P H I = P H I + F I N C * CONV
GO TO 40 5 0 I F ! KCASE.GT.0 160955 5 5 F I N C = 0.1
P H I = P H I P KCASE = 1
GO TO 40 70 P H I = 0.0
GO TO 80 C"- CONVERTING ANGLES BACK TO DEGREES

6 0 P H I = P H I P / CONV 8 0 PHIMAX = PHIMAX / CONV
DELTA = DELTA / CONV F I = F I / CONV ALPHA = ALPHA / CONV
RETURN END -
Example Data Input
SEPT. 99 1 9 6 5 TEST NO. D l 0 EARTH PRESSURE T E S T ON COLORADO R I V E R SAND 16 102.5 28.0 51.7 0.0 1.0 90.0
0.664 1.275 0,640 0.644 0.0 0.0 0.0 0.0 0.0 47. 0 . 38 0 . 0.1 190. 88. 200 . 0 . 0.2 256 e 102. 252. 0 . 0.3 296 e 8 6 300. 0. 0.4 365 67 356 26 0.5 415. 53 . 4 2 0 1 1 0 . 0.6 455 . 4 4 . 4 7 4 . 1 4 4 . 0.7 4 7 2 3 3 . 450 1 5 3 . 0.8 460 22 . 402 1 5 8 . 0.9 408 14 . 346 1 6 1 1.0 363. 1 8 . 3 0 6 1 6 3 1.2 283. 1 6 . 2 6 3 . 158 1.4 247 24. 236 1 3 8 . 1.6 228. 27 . 218. 1 3 4 . 1.8 2 2 1 . 30 s 217. 121. 2.0 218. 24 . 228 7 4 .

Discuss ion of Data Input
The da ta i npu t fo r one p rob lem cons i s t s o f a minimum of 4 cards and
a maximum of 53 ca rds . The f i r s t c a r d i s a p r o b l e m i d e n t i f i c a t i o n h a v i n g
an a lphanumeric format of 10A8. The second ca rd con ta ins t he number of
s t r a i n r e a d i n g s i n p u t a n d a l s o p h y s i c a l p r o p e r t i e s o f t h e s o i l a n d w a l l . T h i s
card has an 110, 6E10.3 format . The t h i r d c a r d c o n t a i n s s l o p e c o n s t a n t s and
z e r o c o r r e c t i o n s f o r e a c h l o a d c e l l , ( 8 E 1 0 . 3 f o r m a t ) . T h e l a s t c a r d o r s e r i e s
o f c a r d s c o n s i s t s o f d e f l e c t i o n and s t r a i n r e a d i n g s , (5E10.3 format ) . This
completes a s e t o f d a t a . Any number of problems may be read with only one
compi l a t ion o f t he sou rce deck . To te rmina te the p rogram i t i s necessary to
pu t two b l a n k c a r d s a f t e r t h e l a s t s e t o f d a t a .
182

DATA INPUT FORM
IBM CARD COLUMN I 10 20 30 40 50 60 70 80
T T T T -I- T T I I I I
PROBLEM IDENTIFICATION ( ONE C A R D 1
N GAMMA DELMAX PHIMAX FI SHI ALPHA
S C I s c 2 sc 3 s c 4 C I ZERO CEZERO C3ZERO C 4 ZERO
I I I I
DEFL (1) CELL I (I) CELL2 (I) CELL 3 (1) CELL4 (I) 1 I 1 1 - N CARDS PER SET

Example Data O u t p u t
S E P T . 9 9 19h5 T E S T NO. TI19 E A R T H P R E S S U R E T E S T ON C O L O R A D O K I V E R SA'JD
D A T A I N P U T
N U M B E R O F L O A D C E L L R E A D I N G S l h S O I L @ E P \ I S I T Y ( L B S . / C U B I C F G O T 1 l . O 2 5 E + 0 2 A N G L E OF I N T E R N A L F R I C T I O N ( D E G R E E S 1 5 . 1 7 0 E + 0 1
S L O P E O F T H E B A C K F I L L ( D E G R E E S 1 0. A N G L E B E T W E E N WALL A N D H O K I Z . ( D E G R E E S 1 9 . 0 0 0 E + O l S L A N T H E I G H T O F T H E N A L L ( F E E T 1 1 000E+00
M A X . V A L U E O F W A L L F R I C T I O N ( D E G R E E S 1 2 . 8 0 0 E + 0 1
S L O P E OF C A L . C I J R V E FOK C E L L N O . 1 ( L B S . / I N C H ) 6 o 6 4 0 E - 0 1 S L O P E OF C A L . C U R V E F O R C E L L NO. 2 ( L H S . / I Y C H ) 1 . 2 7 5 E + 0 0 S L O P E 17F C A L . C U R V E FOK C E L L NO. 3 ( L B S o I I N C H ) 6 . 4 0 0 E - 0 1 S L O P E O F C 4 L . C U R V E F O R C E L L NO. 4 ( L B S . / I N C H ) 6.440E-01 ZERO B A L A N C E C O R R . FCIR C E L L NU. 1 ( M I C R O - I N C H ) 0. Z E R O D 4 L A N C E C O R R . F O R C E L L NO. 2 ( M I C R O - I N C H ) 0. Z E R f l B A L A N C E C D R R . F O R C E L L NO. 3 ( M I C R O - I N C H ) 0. Z E R O H A L A N C E C O R R . F O R C E L L NO. 4 ( M I C R O - I N C H ) 0.
D E F L E C T I O N A N D L O A D C E L L S T R A I N R E A D I N G S
0. 4 . 7 0 0 E + 0 1 0 . 3. R O O E + 0 1 0 . 1 . 0 0 O E - 0 1 1 .9n0~+02 ~ . ~ o o E + o ~ Z . O O O E + O Z 0 . 2 . 0 0 0 E - 0 1 2 . 5 6 D E + 0 2 1 . 0 2 0 E + 0 2 2 . 5 2 0 E + 0 2 0 .

3.OOOE-01 4.000E-01 5.000E-01 6.000E-01 7.000E-01 8.OC)OE-'31 9.000E-01 1.000E+00 1.201)E+00 1.40UE+03 1.600E+00 1.800E+W 2.0GOE+UO
3. O O O E +02 3.56OE+02 4.200€+02 4.740E+02 4.500€+02 4.020E+02 3.460E+02 3.060E+02 2.630€+02 2.360Et02 2.180€+02 2.170€+02 2.280E+02
0. 2 . 600E+01 1.100Et02 1.440E+02 1 . 530E+02 1.580E+02 1.610E+02 1 . 630E+02 1.580€+02 1.380€+02 1.340€+02 1.210E+02 7.400E+O1
0. 1.000E-0 1 2.000E-01 3 000E-0 1 4.000E-01 5.000E-0 1 60000E-0 1 7 000E-0 1 8.000E-01 9.000E-0 1 1.000E+00
1.400€+00 1.600€+00 1.800E+00 2 . 000E+00
1 200E+00
3.121E+01 1.262E+02 1 . 700 E+02 1.965E+02 2.424E+02 2.756E+O2 3.02 1 E+02 3 134E+02 3.054E+02
2.410E+O? 1 .879t+02 1.640E+02 1.514E+02
1.44RE+02
2.7U9E+02
1.467E+02
0. 0. 0. 0. 1*674E+01 7.084E+01 9.274E+01 9.853E+01 1.018E+02 1.037E+02 1.050Et02 10018E+02 8.887Et01 8*630E+Ol 7.792E+01 4 .766EtOl
5.553EtOl 3.664€+02 4.613€+02 4.982€+02 5.556E+02 6.119E+02
6.435E+02 60616Et02
5.908E+02 5.102E+02 4.598E+02 3.766€+02 3.456Et02 3.253E+32 3.239E+02 3.213€+02

DEFR U V I T L E S S
0 .
1 667E-02 2.500E-02 3.333E-02 4.167E-02
8 . 3 3 3 ~ 0 3
5.000E-02
6.667E-02 5 833E-02
7.500E-02 8.333E-02 1 000E-0 1 1 .167E-01 l o 3 3 3 E - 0 1 1 S O O E - 0 1 1 667E-0 1
DEFK
P E P M ( LHS. /
5.553E+01 3.669 E+02 4.639E+02
5.680 E + 0 2 6.335E+02 5.956E+02 6.856E+02 6.339E+02 5.505E+02 4.985E+02 4.089E+02 3.752E+02
5 044E+O2
3.532€+02 3.5166+02 3.488 E+02
DRAT IO (""""" UNITLESS
0. 0.
L.667E-02 2.143E-01
3.333E-02 4 . 2 8 6 f - 0 1 4.167E-02 5.357E-01 5.000E-02 6.429E-01
a . 3 3 3 ~ - 0 3 1 . 0 7 1 ~ - 0 1
2.500E-02 3.214E-01
P E P T LINm FT. 1
4.250E+02 4 .972€+02 5 e 8 9 1E+02 7.OY8E+02
1 .099€+03
1 .779€+03 2 .001€+03 2.193E+03
8.722E+02
1.431E+03
2.3782+03 2.441E+03 2.441E+03 2 .441€+03 2.441E+03 2 .441€+03
P R A T IO """̂ " 1
5.833E-02 7.207f-01 P.027E-01
P K M P K T ( "" U N I T L E S S ---- 1
CP M INCHES
E R R O R PERCENT
BETA DEGRE E S
1.915E+01 1.715€+31 1.585E+01
1 . 2 7 5 € + 0 1 1.115E+01
1.415E+01
9.800E+00 8 .800€+00 8.000€+ 00 7.900€+00 7o500€+00 7.000E+00 7 .000€+00 7 .000€+00 7.000E+00 7.000E+00

DEFLECT1 ON
0. 1.000E-(’1 2.000E-01 3.000E-01 4.000E-Ul 5.000f-01 6.000E-01 7.000E-01 8.000E-01 9.000E-01 1.000E+00 1.200E+03 1.4OOF+OO I. 60OE+C!0 1.800E+00 20000E+03
INTERVAL FRICTION DEVELOPED
2.203E+0@ 4.640E+01 4.790E+01 4.6hOE+01 4.590E+01 4.480E+01 4.350C+01 4.150E+01 3.9hOE+01 3.700E+01 3.510E+01 3.210E+01 3.070E+Ol 2.9bOE+01 2 .970 t+01 7.960E+01
1.78RE+01 1.975E+01 1.751 E+01 1.688€+01 1.172E+01 Y.128€+00 7.285E+00 1.071E+01
WALL F R I C T I O N DEVELOPED
00 3.000E+00 6 . 000E+00 90000E+00 1*200E+01 1 50OE+01 1*800E+01 2*018E+01 2.125E+01 2*205E+01 2*272E+01 2.290E+01 2*290E+01 2.290E+01 2.290E+01 2.290E+01

APPENDIX B
EXPERIMENTAL EXAMPLE DATA
T h i s a p p e n d i x c o n t a i n s r e p r e s e n t a t i v e p l o t s o f e x p e r i m e n t a l d a t a
p o i n t s t h a t were o b t a i n e d f r o m t h e P h a s e I11 series o f t e s t s . The graphs on
t h e f o l l o w i n g p a g e s r e p r e s e n t t h e d e v e l o p m e n t o f h o r i z o n t a l f o r c e s w h i c h a c t e d
on t he mode l s as t h e y p e n e t r a t e d i n t o s a n d b a c k f i l l s . T h e p u r p o s e o f t h e s e
g r a p h s i s t o q u a l i f y t h e a v e r a g e c u r v e s p r e s e n t e d i n C h a p t e r V I I I .
As s t a t e d i n C h a p t e r VIII, tests were p e r f o r m e d u s i n g t h r e e ra tes
o f m o d e l p e n e t r a t i o n ; t h e r e s u l t s i n d i c a t e d t h a t f o r t h e s e ra tes o f p e n e t r a t i o n
no m e a s u r a b l e d i f f e r e n c e e x i s t e d . S i n c e no a d d i t i o n a l i n f o r m a t i o n c o u l d b e
a t t a i n e d by p r e s e n t i n g t h e r e s u l t s f rom each s e r i e s o f t e s t s , o n l y t h e r e s u l t s
f r o m t h e 4.0 i p s s e r i e s o f t es t s h a v e b e e n p r e s e n t e d i n t h i s a p p e n d i x a n d
C h a p t e r V I I I .
188
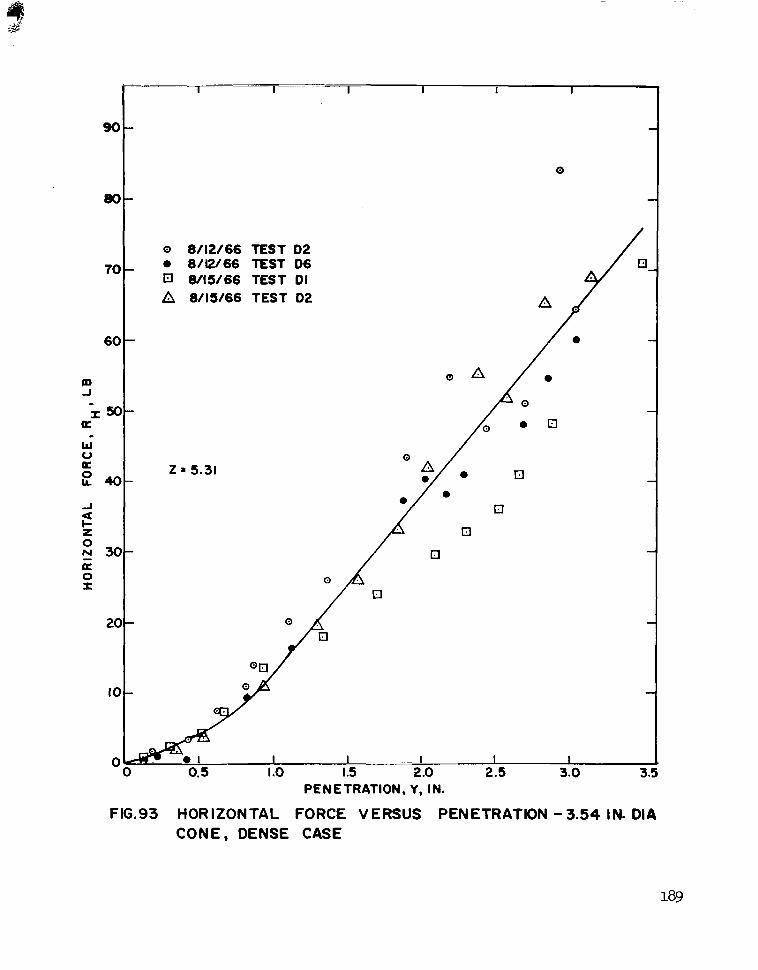
0
I I I I I I
90-
80-
70 -
60 -
a 0 I
0 8/12/66 TEST 02 0 8/12/66 TEST 06 El 8/15/66 TEST 01 h 8/15/66 TEST 02
2 = 5.31
PENETRATION, Y, IN.
FIG.93 HORIZONTAL FORCE VERSUS PENETRATION -3.54 IN. DIA CONE, DENSE CASE

Q 8/31/66 TEST 08 0 8/31/66 TEST 09
8/31/66 TEST Dl1
A 8/31/66 TEST 012
PENETRATIONI Y I IN.
FIG.94 HORIZONTAL FORCE VERSUS PENETRATION - 7.08 IN. DIA CONE, DENSE CASE

120 -
100 -
eo- m A c
a X
w 0
0 u.
- 60- a
2 = 6.49
+ 8/29/66 TEST D5 A 8/29/66 TEST D 6 0 8/29/66 TEST D7 0 8 /29 /66 TEST 08
0
PENETRATION, Y , IN.
FIG.95 HORIZONTAL FORCE VERSUS PENETRATION - 4.33 IN. DIA SPHERICAL SEGMENT, DENSE CASE

21 0 I
180 - Q 9/15/66 TEST L6
A 9/15/66 TEST L7
Z = 12.99
01 1 1 ~ 1 " 1 0 1.0 2.0 3.0
PENETRATION, Y, IN.
FIG.96 HORIZONTAL FORCE VERSUS PENETRATION-8,66 IN. DIA SPHERICAL SEGMENT, DENSE CASE
APPENDIX C
EXPERIMENTAL EXAMPLE DATA
T h i s a p p e n d i x c o n t a i n s r e p r e s e n t a t i v e p l o t s o f e x p e r i m e n t a l d a t a p o i n t s
t h a t were o b t a i n e d f r o m t h e P h a s e 111 ser ies o f tes ts . T h e g r a p h s o n t h e
f o l l o w i n g p a g e s r e p r e s e n t t h e d e v e l o p m e n t o f r e s u l t a n t v e r t i c a l f o r c e s w h i c h
a c t e d o n t h e m o d e l s as t h e y p e n e t r a t e d i n t o s a n d b a c k f i l l s . The purpose o f
t h e s e g r a p h s i s t o q u a l i f y t h e a v e r a g e c u r v e s p r e s e n t e d i n C h a p t e r V I I I .
As s t a t e d i n C h a p t e r V I I I , t e s t s were p e r f o r m e d u s i n g t h r e e r a t e s o f
m o d e l p e n e t r a t i o n ; t h e r e s u l t s i n d i c a t e d t h a t f o r t h e s e r a t e s o f p e n e t r a t i o n
no m e a s u r a b l e d i f f e r e n c e e x i s t e d . S i n c e no a d d i t i o n a l i n f o r m a t i o n c o u l d b e
a t t a i n e d b y p r e s e n t i n g t h e r e s u l t s f r o m e a c h s e r i e s o f t e s t s , o n l y t h e r e s u l t s
f r o m t h e 4 .0 i p s se r ies o f t e s t s h a v e b e e n p r e s e n t e d i n t h i s a p p e n d i x a n d
C h a p t e r V I I I .

~
7 -
6 -
m 5 - 4
a > -
W
a 0 4-
2 a u 4
I-
> E 3-
I I
A 9/2/66, Z=I.?7, TESTS L3,L4, L5, L6
0 9/6/66,2=3.54, TESTS L5,L6, L7, LB -t 9/7/66, t = 5.31, TESTS L 4 . U . L6, L7 0 9/7/66,2 =S.8dlTESTS L16,L17,LI8,U9
@ A
0
0
A. 0
t At / +e .
A J I PENETRATION , Y , IN.
FIG.97 RESULTANT VERTICAL FORCE VERSUS PENETRATION - 3.54 IN. D I A CONE, LOOSE CASE
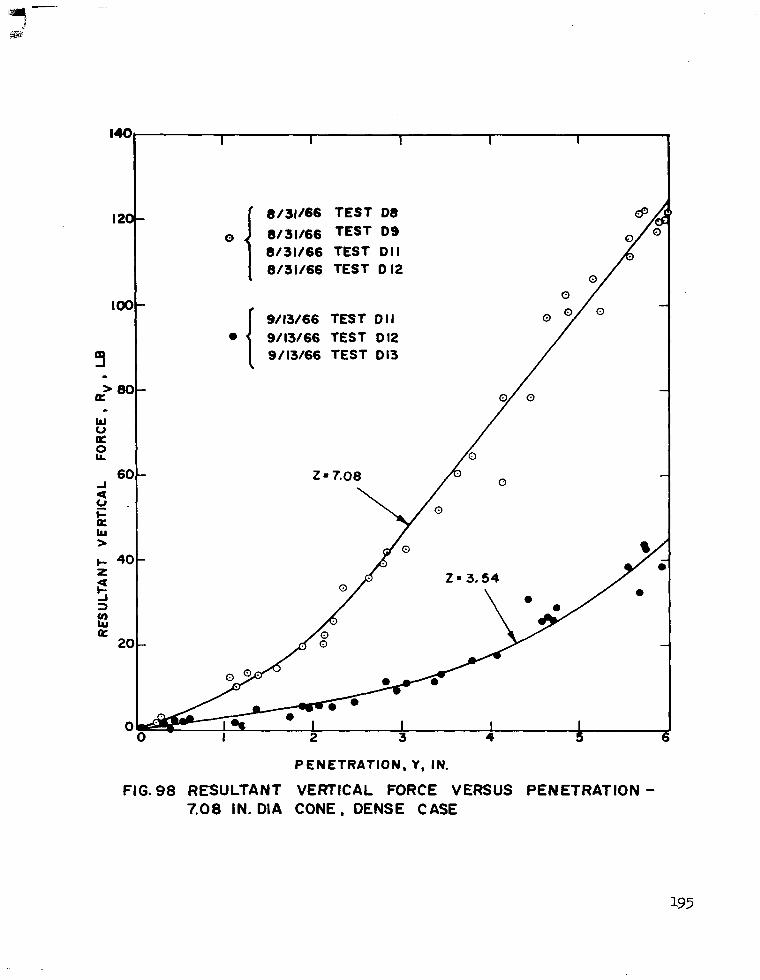
8/31/66 TEST DO 8/31/66 TEST D 9 8/31/66 TEST Dl1 8/31/66 TEST 012
9/13/66 TEST Dl1 9/13/66 TEST Dl2 9/13/66 TEST Dl3
PENETRATION, Y, IN.
FIG. 98 RESULTANT VERTICAL FORCE VERSUS PENETRATION - 7.08 IN. DIA CONE, DENSE CASE

m -1
L
> a
0 4- a
L
W
0 LL
-I
0 a
a F 3- bl >
v) W a
I I
9/8/66, 284.33, TESTS L19., L20, L21, U2 ' 9/9/66, 2.6.49, TESTS L I , L8, Le, LIO + 9/9/66, 2. 10.83,TESTS L19. L2OlL2!,L22
t
9 0 $a e ,I e. I
i I I
PENETRATION , Y, IN.
FIG.99 RESULTANT VERTICAL FORCE VERSUS PENETRATION -4.33 IN. DIA SPHERICAL SEGMENT, LOOSE CASE
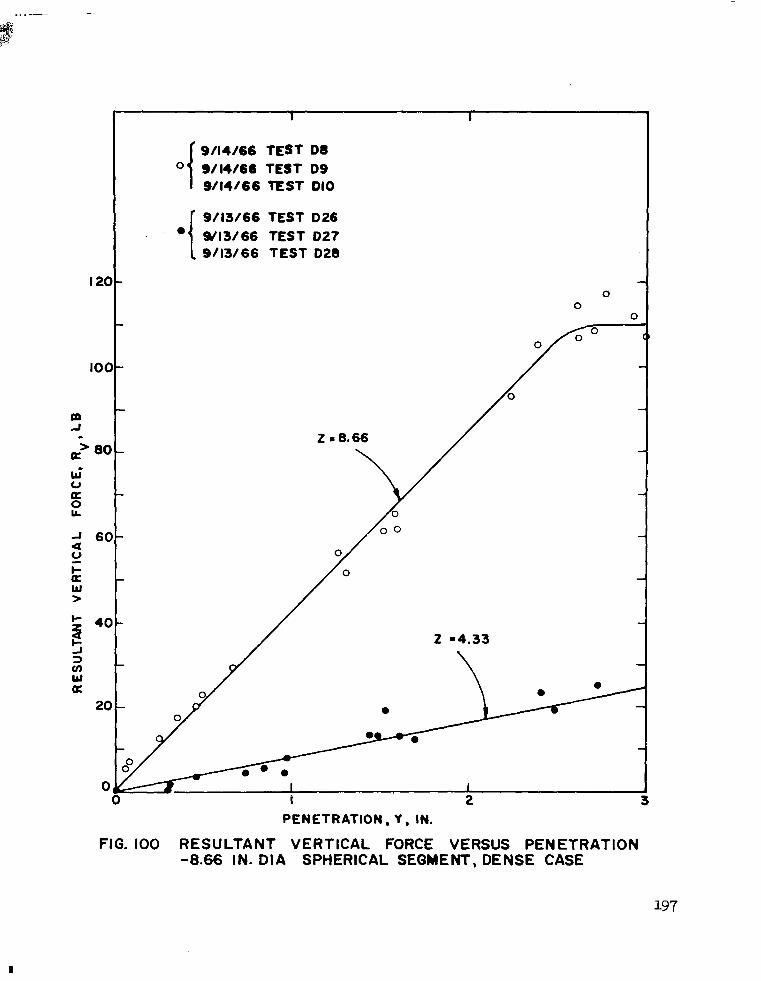
9/14/66 TEST DO 9/14/66 TEST 09 9/14/66 TEST Dl0
9/13/66 TEST D26 4/13/66 TEST D27 9/13/66 TEST D2b
- 0
0 0
PENETRATION, Y , IN.
FIG. 100 RESULTANT VERTICAL FORCE VERSUS PENETRATION -8.66 IN. DIA SPHERICAL SEGMENT, DENSE CASE
I

REFERENCES
1. Bjer rum, L . , Casagrande , A. , Peck , R. B. , and Skempton, A. W . , From T h e o r y t o P r a c t i c e i n S o i l M e c h a n i c s , J o h n W i l e y & S o n s , I n c . , N e w York, 1960.
2 , C o r n f o r t h , D. H . , "Some E x p e r i m e n t s o n t h e I n f l u e n c e of S t r a i n C o n d i t i o n s o n t h e S t r e n g t h o f S a n d , " G e o t e c h n i q u e , L o n d o n , E n g l a n d , V o l . 1 4 , No. 2, 1964, pp. 143- 167.
3. Dawson, R . F . , m o r a t o r y Manual i n S o i l M e c h a n i c s , 2nd Ed, Pitman P u b l i s h i n g C o . , N e w York, 1959, pp. 157-162.
4 . Ghazza ly , 0. I . , and Dawson, R . F . , " L a b o r a t o r y S t r e s s - D e f o r m a t i o n C h a r a c t e r i s t i c s o f S o i l s U n d e r S t a t i c L o a d i n g , " a r e p o r t f r o m D e p a r t - m e n t o f C i v i l E n g i n e e r i n g , T h e U n i v e r s i t y of T e x a s , t o N a t i o n a l A e r o - n a u t i c s a n d S p a c e A d m i n i s t r a t i o n , L a n g l e y R e s e a r c h C e n t e r , H a m p t o n , V i r g i n i a , NASA C o n t r a c t o r R e p o r t CR-571, October 1966, p . 42.
5 . Hansen , J. B. , E a r t h P r e s s u r e C a l c u l a t i o n , T h e D a n i s h T e c h n i c a l Press, Copenhagen, 1953, p . 26.
6 . Rowe, P. W . , " P a s s i v e E a r t h P r e s s u r e M e a s u r e m e n t s , " G e o t e c h n i q u e , L o n d o n , England , Vol . 15 , No. 1, 1965, pp. 57-78.
7 . T a y l o r , D. W. , "A Compar i son o f Resu l t s o f Direct S h e a r a n d C y l i n d r i c a l Compression Tests ," Symposium on S h e a r T e s t i n g o f S o i l s , P r o c e e d i n g s o f t h e A m e r i c a n S o c i e t y f o r T e s t i n g Mater ia ls , 1939, p . 1058.
8 . T e r z a g h i , K . , T h e o r e t i c a l S o i l M e c h a n i c s , J o h n W i l e y & S o n s , I n c . , N e w York, 1943.
9 . T e r z a g h i , K . , "Genera l Wedge T h e o r y o f E a r t h P r e s s u r e , " T r a n s a c t i o n s o f t h e A m e r i c a n S o c i e t y o f C i v i l E n g i n e e r s , V o l . 1 0 6 , 1 9 4 1 , p . 7 0 .
10. T e r z a g h i , K . , " O l d E a r t h - P r e s s u r e T h e o r i e s a n d N e w Tes t R e s u l t s , " E n g i n e e r - ing News-Record , Vol . 85 , No. 14 , p . 636 .
11. Wu, T . H . , S o i l M e c h a n i c s , A l l y n & Bacon , Inc . , Bos ton , 1966 , p . 277 .
NASA-Langley, 1968 - 18 CR-1252