Embed Size (px)
Citation preview

Forecasting Obesity to 2010 Paola Zaninotto, Heather Wardle, Emmanuel Stamatakis, Jennifer Mindell and Jenny Head Prepared for the Department of Health Revised July 2006
Joint Health Surveys Unit National Centre for Social Research Department of Epidemiology and Public Health at the Royal Free and University College Medical School

1 INTRODUCTION.......................................................................................1 1.1 Report Structure ......................................................................................1 1.2 Measures of obesity.................................................................................1 1.3 Non-response weighting ..........................................................................1 1.4 Weighting children’s data.........................................................................2
2 PREVALENCE AND NUMBERS OVERWEIGHT AND OBESE IN 2003.2 2.1 Introduction ..............................................................................................2 2.2 Prevalence and number of adults overweight and obese, 2003..............2 2.3 Prevalence and numbers of children overweight and obese ...................5
3 PREVALENCE AND NUMBERS OVERWEIGHT AND OBESE, 2003 AND 2010 ...............................................................................................10 3.1 Background............................................................................................10 3.2 Method of analysis.................................................................................10 3.3 Methodological issues ...........................................................................10 3.4 Prevalence and number of adults overweight and obese, 2003 and 2010
...............................................................................................................11 3.5 Prevalence and number of children overweight and obese, by age and
sex .........................................................................................................13
4 PREVALENCE AND NUMBER OF OVERWEIGHT AND OBESITY, 2003 AND 2010, BY SOCIO-DEMOGRAPHIC FACTORS .............................14 4.1 Introduction ............................................................................................14 4.2 Interpretation of forecast modelling .......................................................14 4.3 Prevalence and numbers of adults overweight and obese, 2003 and
2010, by socio-demographic factors......................................................15 4.4 Prevalence and number of children obese, 2003 and 2010, by socio-
demographic factors ..............................................................................20
APPENDIX: EXTRPOLATION OF TRENDS...............................................26

1 INTRODUCTION
1.1 Report Structure The focus of this report is to forecast what levels of obesity in England may be in 2010 if current trends in obesity prevalence continue unchanged. The report is split into three main sections. Section 2 looks at the current picture of overweight and obesity prevalence among children and adults, using data from the Health Survey for England 2003 (HSE 2003).1 The results present both the prevalence of obesity among the population and also the estimated number of people within the population who are obese. Section 3 uses trend data from HSE to project discernible trends forward to 2010 and analyses these in relation to mid-population estimates for 2010 to forecast the number and proportion of the population predicted to be obese and overweight. Section 4 looks at the estimated number and proportion of adults and children who may be obese in 2010 within different socio-demographic groups.
1.2 Measures of obesity For both adults and children, Body Mass Index (BMI) has been used as the measure of obesity. Among adults, the following categories have been used to indicate overweight and obese: Description BMI (kg/m2) Not overweight/obese 25 or less Overweight Over 25 to 30 Obese Over 30 Among children, this report has used the UK National Body Mass Index (BMI) percentile classification to describe childhood overweight and obesity among children aged 2-15: Description BMI centile for child’s exact age Not overweight/obese 85th centile or below Overweight Over 85th to 95th centile Obese Over 95th centile
1.3 Non-response weighting In 2003, the Health Survey for England introduced non-response weighting for the first time. Non-response occurs when selected individuals or households decline to take part in the study. This can introduce bias as some groups are more likely to decline than others. Non-response weighting is a statistical calculation that improves the precision of survey estimates, giving greater confidence that the estimate presented is reflective of the population. As this report is concerned with estimating the actual number of people within the English population who are overweight or
1 This report was first produced for the Department of Health in September 2005. At that time, data from HSE 2003 were the most recent available.
1

obese, HSE 2003 estimates that are weighted for non-response have been presented throughout.
1.4 Weighting children’s data When interviewing children for HSE, it is standard protocol that only two children per household are eligible for interview. This means that in households with more than two children, a random selection is made to identify which two children should be interviewed. In households where there is only one child or a maximum of two children per household, these children would always be selected for interview. This protocol makes children’s probability of selection for interview uneven. As such, since 1995, all child data has been weighted to take into account these different selection probabilities. Therefore all HSE 2003 estimates for children presented in this report have been weighted to account for both non-response bias and selection probability bias.
2 PREVALENCE AND NUMBERS OVERWEIGHT AND OBESE IN 2003
2.1 Introduction This section presents the current picture of overweight and obesity among children and adults, using data from HSE 2003. The results presented show the proportions of adults and children who are overweight, obese, and overweight including obese, within a variety of socio-demographic groups. These prevalence data have then been applied to the 2003 mid population estimates to give an estimated number of people within each group who are overweight, obese, and overweight including obese. Within the tables, the prevalence and the population numbers have been presented side by side for ease of reference.
2.2 Prevalence and number of adults overweight and obese, 2003
2.2.1 Prevalence and number of adults overweight and obese, by age and sex
Figures 1 and 2 show the distribution of overweight and obesity with the adult population.
2
Desirable/underweight
35%
Overweight43%
Obese22%
Figure 1 Men’s BMI statusBase: All aged 16 and over with valid BMI
Desirable/underweight
44%
Overweight33%
Obese23%
Figure 2 Women’s BMI statusBase: All aged 16 and over with valid BMI

• Using HSE 03 prevalence data and applying this to the 2003 mid population
levels, it is estimated that in 2003, around 8,403,365 men aged 16 and over within the English population were overweight. A further 4,302,588 were obese.
• For women, it is estimated that approximately 6,772,757 were overweight and
4,754,080 obese. Table 1
2.2.2 Prevalence and number of adults overweight and obese, by ethnic group and sex
• Within non-white ethnic groups, it is estimated that in 2003 around 225,519 men
and 334,431 women were obese (15% of men and 20% of women in non-white ethnic groups respectively)
Table 2
2.2.3 Prevalence and number of adults overweight and obese, by social class and sex
• All HSE informants aged 16 and over are asked about their current or former
occupation. From this information they can then be classified into different categories ranging from professional occupations to unskilled manual occupations. For the following analysis, these groups have been combined into two categories: manual and non-manual.
• Figure 2 shows the estimated number of men and women who were obese
within manual and non-manual social classes. Looking at the population distribution of obesity among women shows that of all women classified as obese, a greater number are from non-manual social classes than manual social classes. Among men, the reverse is true. However, it is important to note that the
0
300
600
900
1200
1500
1800
2100
2400
2700
3000
Men Women
Nu
mbe
r of
peo
ple
('00
0's)
Figure 3Number of people obese, by social class and sexBase: Aged 16 and over with valid BMI
Col1
Col2
Non-manual
Manual
3

number of obese people depends both on prevalence in a subgroup and the total number of people (or the proportion of the population) who are in that subgroup: among women, obesity prevalence is higher among those in manual social classes (28%) than those in non-manual social classes (19%).
Table 3
2.2.4 Prevalence and number of adults overweight and obese, by Government Office Region and sex
Desirable/underweight
41%
Overweight41%
Obese18%
Figure 4aLondon : Men's BMI statusBase: Aged 16 and over with valid BMI
Desirable/underweight
34%
Overweight41%
Obese25%
Figure 4bYorkshire and the Humber: Men's BMI status:Base: Aged 16 and over with valid BMI
• Figures 4a and 4b show how obesity prevalence among men varied within two different regions. In HSE 03, 18% of men living in London were classified as obese (approximately 519,146 men) compared with 25% of men living in Yorkshire and the Humber (approximately 483,872 men).
Desirable/underweight
38%
Overweight33%
Obese29%
Figure 5aWest Midlands: Women's BMIBase: Aged 16 and over with valid BMI
Desirable/underweight
49%
Overweight32%
Obese19%
Figure 5bSouth East: Women's BMI statusBase: Aged 16 and over with valid BMI
• Figures 5a and 5b show similar regional variations among women. 29% of women living in the West Midlands were classified as obese (approximately
4
619,847 women) compared with 19% living in the South East (around 641,175 women).
Tables 4, 5
2.2.5 Prevalence and number of adults overweight and obese, by levels of physical activity and sex
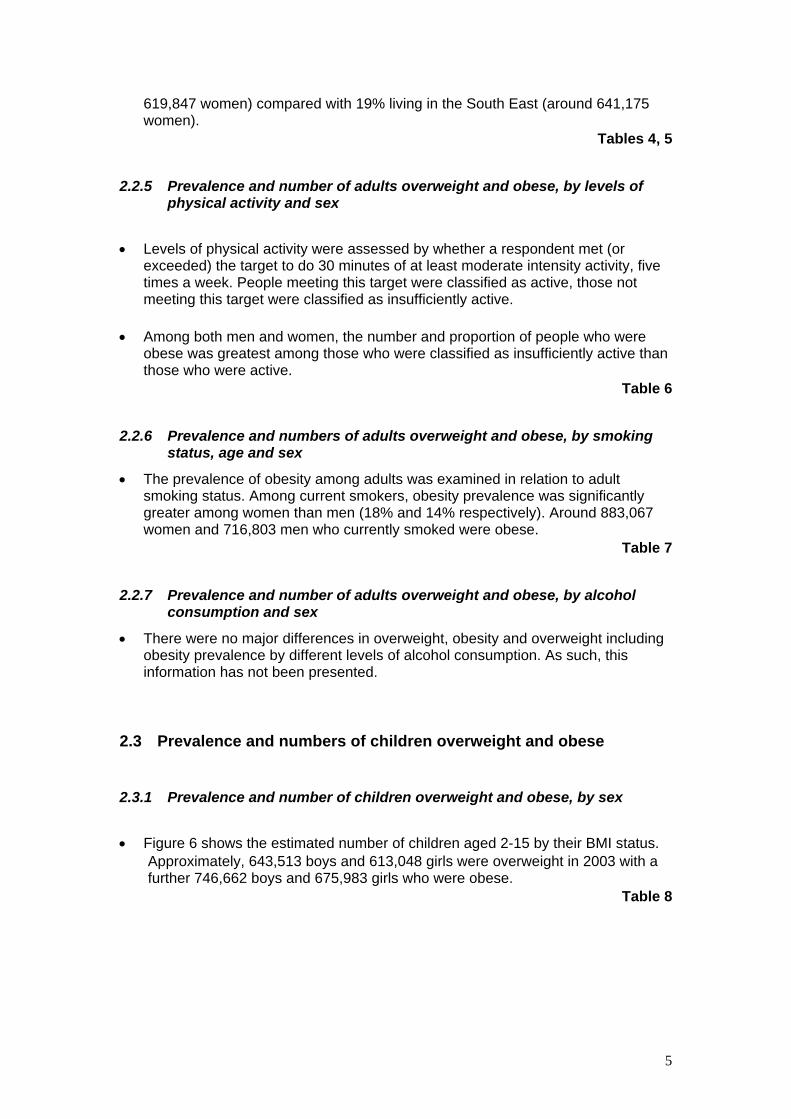
• Levels of physical activity were assessed by whether a respondent met (or
exceeded) the target to do 30 minutes of at least moderate intensity activity, five times a week. People meeting this target were classified as active, those not meeting this target were classified as insufficiently active.
• Among both men and women, the number and proportion of people who were
obese was greatest among those who were classified as insufficiently active than those who were active.
Table 6
2.2.6 Prevalence and numbers of adults overweight and obese, by smoking status, age and sex
• The prevalence of obesity among adults was examined in relation to adult smoking status. Among current smokers, obesity prevalence was significantly greater among women than men (18% and 14% respectively). Around 883,067 women and 716,803 men who currently smoked were obese.
Table 7
2.2.7 Prevalence and number of adults overweight and obese, by alcohol consumption and sex
• There were no major differences in overweight, obesity and overweight including obesity prevalence by different levels of alcohol consumption. As such, this information has not been presented.
2.3 Prevalence and numbers of children overweight and obese
2.3.1 Prevalence and number of children overweight and obese, by sex
• Figure 6 shows the estimated number of children aged 2-15 by their BMI status.
Approximately, 643,513 boys and 613,048 girls were overweight in 2003 with a further 746,662 boys and 675,983 girls who were obese.
Table 8
5

0
500
1000
1500
2000
2500
3000
3500
4000
4500
Boys Girls
Nu
mbe
rs o
f ch
ildre
n (
'00
0's
)
ObeseOverweightNot overweight
Figure 6Number of children overweight and obese within the English populationBase: All aged 2-15 with valid BMI
2.3.2 Prevalence and number of children overweight and obese, by ethnic group and sex
• Within non-white ethnic groups, it is estimated that 128,443 boys and 101,496 girls in 2003 were obese (22% and 18% of non-white ethnic groups respectively). However, caution should be taken with these figures as the base sizes for boys and girls within non-white ethnic groups were small.
Table 9
2.3.3 Prevalence and number of children overweight and obese, by social class and sex
• The prevalence of childhood obesity was examined in relation to social class, as
classified by the head of household’s occupation. In a two-parent household, the head of household is the father, in a one-parent household, it is the parent or legal guardian. The head of household’s job can be classified into different categories ranging from professional occupations to unskilled manual occupations. For the following analysis, these groups have been combined into two categories: manual and non-manual.
6

0
50
100
150
200
250
300
350
400
Boys Girls
Nu
mbe
r of
ch
ildre
n (
'00
0's
)
Non-manualManual
Figure 7Number of children obese, by social class and sexBase: All aged 2-15 with valid BMI
• Among all boys who were classified obese, a greater number lived in non-manual
households than manual households; 382,253 compared with 345,909. The reverse was true for girls, whereby a greater number who were categorised as obese lived in manual rather than non-manual households (337,199 and 328,365 respectively). It is also important to note that the proportion of girls who were obese was significantly higher among those from manual households (19%) than non-manual households (14%). Among boys, no significant difference was detected.
Table 10
2.3.4 Prevalence and number of children overweight and obese, by Government Office Region
• Analysis by Government Office Region has been presented for all children and
has not been presented separately by sex owing to small bases sizes.
7

0
30
60
90
120
150
180
210
240
270
NorthEast
NorthWest
Yorkshireand theHumber
EastMidlands
WestMidlands
EastEngland
London SouthEast
SouthWest
Nu
mbe
r of
ch
ildre
n (
'00
0's
)
Aged 2-15Aged 2-10
Figure 8Number of children obese, by Government Office RegionBase: All aged 2-15 with valid BMI
• Figure 8 shows the total number of children aged 2-15 and the total number of
children aged 2-10 who are obese within each Government Office Region. The estimated figures show that the North East has the lowest number of obese children aged 2-15 and 2-10 (69,975 and 25,078 children respectively) though it should be noted that the North East also has the lowest population of children out of all the regions. The highest estimated numbers of obese children aged 2-15 were observed in London (around 249,666 children). Prevalence of obesity by region varied from 13% in the South East to 20% in London. Prevalence of overweight varied from 11% in the East of England to 18% in the South East.
Table 11
2.3.5 Prevalence and number of children overweight and obese, by physical activity levels
• Children’s levels of physical activity were categorised as follows:
Active – active for at least 60 minutes per day for seven days in the last week. This group represents children who achieve the recommended levels of physical activity. Insufficiently active – active less often/shorter periods only.
• This analysis used HSE 2002 data, as this is the most recent occasion that these
questions were administered among children. Prevalence of obesity was higher among inactive children than active children in most age and sex groups. However, because the majority of children fell into the ‘active’ category, the number of children who were obese was greatest among those who were classified as active compared with those who were insufficiently active.
Table 12
2.3.6 Prevalence and number of children overweight and obese, by parental BMI status
8

• Figure 9 shows the number of children who are obese by their parents’ BMI status.
For both boys and girls, a greater number of children who lived in households where either one parent was obese or overweight were themselves obese compared with children who lived in households where neither parent was overweight or obese. However, it is important to note that the prevalence of childhood obesity was greatest among those who live in households where both parents were themselves either overweight or obese (see figure 9).
Table 13
0
50
100
150
200
250
300
350
400
450
500
No parentoverweight/obese
One parentoverweight/obese
Both parentsoverweight obese
Num
ber o
f chi
ldre
n ('0
00's
)
0
10
20
30
40
50
Perc
ent
Number of boys obese ('000's)
Number of girls obese ('000's)
Percent boys obese
Percent girls obese
Figure 9Number of children obese, by parental obesity status and sexBase: All aged 2-15 with valid BMI
9
3 PREVALENCE AND NUMBERS OVERWEIGHT AND OBESE, 2003 AND 2010
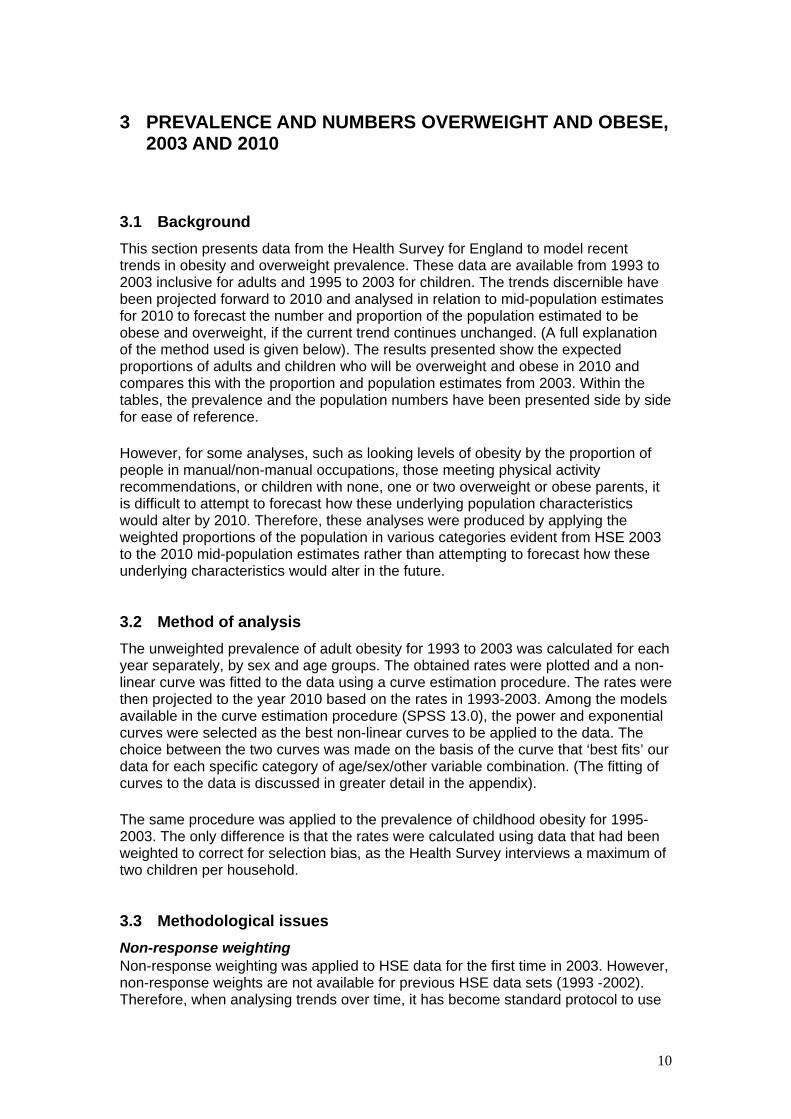
3.1 Background This section presents data from the Health Survey for England to model recent trends in obesity and overweight prevalence. These data are available from 1993 to 2003 inclusive for adults and 1995 to 2003 for children. The trends discernible have been projected forward to 2010 and analysed in relation to mid-population estimates for 2010 to forecast the number and proportion of the population estimated to be obese and overweight, if the current trend continues unchanged. (A full explanation of the method used is given below). The results presented show the expected proportions of adults and children who will be overweight and obese in 2010 and compares this with the proportion and population estimates from 2003. Within the tables, the prevalence and the population numbers have been presented side by side for ease of reference. However, for some analyses, such as looking levels of obesity by the proportion of people in manual/non-manual occupations, those meeting physical activity recommendations, or children with none, one or two overweight or obese parents, it is difficult to attempt to forecast how these underlying population characteristics would alter by 2010. Therefore, these analyses were produced by applying the weighted proportions of the population in various categories evident from HSE 2003 to the 2010 mid-population estimates rather than attempting to forecast how these underlying characteristics would alter in the future.
3.2 Method of analysis The unweighted prevalence of adult obesity for 1993 to 2003 was calculated for each year separately, by sex and age groups. The obtained rates were plotted and a non-linear curve was fitted to the data using a curve estimation procedure. The rates were then projected to the year 2010 based on the rates in 1993-2003. Among the models available in the curve estimation procedure (SPSS 13.0), the power and exponential curves were selected as the best non-linear curves to be applied to the data. The choice between the two curves was made on the basis of the curve that ‘best fits’ our data for each specific category of age/sex/other variable combination. (The fitting of curves to the data is discussed in greater detail in the appendix). The same procedure was applied to the prevalence of childhood obesity for 1995-2003. The only difference is that the rates were calculated using data that had been weighted to correct for selection bias, as the Health Survey interviews a maximum of two children per household.
3.3 Methodological issues Non-response weighting Non-response weighting was applied to HSE data for the first time in 2003. However, non-response weights are not available for previous HSE data sets (1993 -2002). Therefore, when analysing trends over time, it has become standard protocol to use
10

unweighted data for every year to ensure that prevalances and estimates are comparable. This practice has been applied to this report and trends in obesity and overweight from 1993 to 2003 have been calculated using unweighted data. The results from these trends have been modelled and applied to projected 2010 population estimates to give estimated obesity and overweight prevalence and population numbers in 2010. However, when presenting 2003 results alone (i.e. not as part of a trend table) it is best practice to present estimates that have been weighted for non-response as non-response weighting improves the precision of survey estimates, giving greater confidence that the estimate presented is reflective of the population. These general rules have been followed throughout the various stages of the obesity forecasting report. Calculating overweight trends For both children and adults, overweight prevalence varied from year to year such that there were no discernible trends between 1993 and 2003 (for adults) and 1995 and 2005 (for children). Therefore, the numbers of overweight individuals in 2010 have been estimated by applying the mean prevalence for the three years 2001-2003 to the estimated 2010 population.
3.4 Prevalence and number of adults overweight and obese, 2003 and 2010
3.4.1 Prevalence and number of adults obese, by age and sex
Figure 1 shows the estimated numbers of obese adults in 2003 and 2010.
0
1000
2000
3000
4000
5000
6000
7000
Men Women
Nu
mbe
r of
peo
ple
('00
0's
)
Figure 10Estimated number of people obese, 2003 and 2010, by sexBase: Aged 16 and over
Col1
Col2
2003
2010
• It is estimated that in 2010 around 6,658,953 men will be obese, increasing from
around 4,302,588 in 2003
11

• For women, it is estimated that a further 1,230,573 women will be obese in 2010 than in 2003.
• It is notable, based on the forecast model presented within this report, that the
number and proportion of men who are obese is predicted to be greater than the number and proportion of women in 2010. This report is based on the assumption that trends evident between 1993 and 2003 will continue to 2010. Trends analysis between 1993 and 2003 have shown a greater rate of increase in obesity among men than women (10 percentage points increase for men, 7 percentage points increase for women).2 This feature of the trend data upon which the forecast analysis is based helps to explain the prediction that in 2010 more men than women will be obese, if current increases in obesity continue unchecked.3
Table 14
2 See http://www.ic.nhs.uk/pubs/hlthsvyeng2004upd/04TrendTabs.xls/file 3 This difference may also be the result of the forecast modelling technique used. Predictions of adult obesity in 2010 were produced by applying a power curve to the obesity trend data between 1993 to 2003 and extrapolating this forward to 2010. It was a power curve that was judged to ‘best fit’ the observed trends in obesity between 1993 and 2010. However, determining the shape of obesity trend data is problematical. For example, if we isolate the period 1998 to 2003 and apply a linear trend, the prediction is that in 2010 obesity prevalence will remain to be greater among women than among men. A fuller explanation is given in the appendix.
12

3.4.2 Prevalence and number of adults overweight, 2003 and 2010, by age and sex
Figure 2 shows the estimated number of adults overweight in 2003 and 2010. • For men, the forecasted estimates were similar between the two years, with
around 152,824 more men expected to be overweight. For women, estimates in 2010 were slightly lower than in 2003, with around 294,545 fewer women expected to be overweight. This is unsurprising as the mean prevalence in 2001-2003, on which the 2010 forecast is based, was lower than the prevalence in 2003.
Figure 11, Table 14
0
1000
2000
3000
4000
5000
6000
7000
8000
9000
Men Women
Nu
mbe
r of
peo
ple
('00
0's
)
Figure 11Estimated number of people overweight, 2003 and 2010, by sexBase: Aged 16 and over
Col1
Col2
2003
2010
3.5 Prevalence and number of children overweight and obese, by age and sex
• Forecast projections showed that in 2010, a increase in the proportion and
number of boys who are obese can be expected, rising from 746,662 in 2003 to 792,321 in 2010.
• The greatest increases are expected among girls, with around a six percentage
point increase in obesity rates between 2003 and 2010. It is estimated that around 910,630 girls will be obese in 2010.
13

0
100
200
300
400
500
600
700
800
900
1000
Boys Girls
Nu
mbe
r of
ch
ildre
n (
'00
0's
)
20032010
Figure 12Estimated number of children obese, 2003 and 2010 by sexBase: All aged 2-15 with valid BMI
• Notably, the proportion and number of children likely to be overweight in 2010 are
similar to the estimates for 2003; around 610,799 boys and 586,338 girls in 2010. Again, this may be explained due to the use of the 2001-2003 average prevalence for forecasting the numbers of overweight children in 2010.
Figure 12, Table 15
4 PREVALENCE AND NUMBER OF OVERWEIGHT AND OBESITY, 2003 AND 2010, BY SOCIO-DEMOGRAPHIC FACTORS
4.1 Introduction The results presented in this section show the predicted proportions of adults and children who will be overweight and obese in 2010 within different socio-demographic groups and by other characteristics. Where possible, comparisons have been made with the proportion and population estimates from 2003 (as presented in section 2). Within the tables, the prevalence and the population numbers have been presented side by side for ease of reference. The method of analysis used to produce the forecast predictions is discussed at section 3.1.
4.2 Interpretation of forecast modelling To be able to forecast levels of obesity to 2010, ‘best fit’ curves have been applied to HSE trends. However, the type of ‘best fit’ curve that was applied to particular data can affect the accuracy of the forecasting results and, in some cases, reverse the trends seen so far. For example, when looking at men’s levels of physical activity by proportions of obesity and overweight, HSE data shows that those not meeting the
14

recommended levels of physical activity per week are more likely to be obese that those who do meet the recommended targets. However, during the forecast modelling process, it was found that a power curve was the ‘best fit’ for the trend data for those not meeting the recommended physical activity targets, whilst an exponential curve was the ‘best fit’ for trend data for those meeting the weekly physical activity targets. The result of this was that when the models were applied to the 2010 data, the estimates showed that people who met the recommended physical activity targets were more likely to be obese than those who did not meet the targets in 2010. In this particular instance, the existence of only three years’ data (1998, 1999 and 2003) on which to base the modelling made it difficult to determine the best shape for a curve, let alone the correct parameters. Given these nuances in the forecasting methods, caution should be taken when interpreting some results. This has been highlighted at the appropriate places within the commentary.
4.3 Prevalence and numbers of adults overweight and obese, 2003 and 2010, by socio-demographic factors
4.3.1 Prevalence and number of adults obese, by social class and sex
Figures 13 and 14 show the estimated numbers of obese adults in 2003 and 2010 by social class.
0
500
1000
1500
2000
2500
3000
3500
Non manual Manual
Nu
mbe
r of
peo
ple
('00
0's
)
Figure 13Estimated number of men obese, 2003 and 2010, by social classBase: Aged 16 and over
Col1
Col2
2003
2010
15

0
500
1000
1500
2000
2500
3000
Non manual Manual
Nu
mbe
r of
peo
ple
('00
0's
)
Figure 14Estimated number of women obese, 2003 and 2010, by social classBase: Aged 16 and over
Col1
Col2
2003
2010
• All HSE informants aged 16 and over are asked about their current or former
occupation. From this information they can then be classified into different categories ranging from professional occupations to unskilled manual occupations. For the following analysis, these groups have been combined into two categories: manual and non-manual.
• For men in both non-manual and manual social classes, forecast projections
showed an increase in levels of obesity between 2003 and 2010. Within both manual and non-manual social classes there is an estimated increase in obesity of six percentage points between 2003 and 2010.
• For women in non-manual and manual social classes, estimates of obesity in
2010 were very similar to estimates shown in 2003. Table 16
4.3.2 Prevalence and number of adults obese by Government Office Region.
• Caution must be taken when analysing trends by Government Office Region
(GOR). This is due to differences in the way the categories are defined. For example, in 1998, there were 10 GORs as Merseyside was presented as a separate area but from 1999 onwards, this was included within the North West region. Furthermore, administrative changes in the boundaries of each GOR over time mean that year on year, the geographic areas represented by a GOR category are not always directly comparable, which may lead to imprecisions within the trend analysis.
16

0
1000
2000
3000
4000
5000
6000
7000
8000
9000
NorthEast
NorthWest
Yorkshire& The
Humber
WestMidlands
EastMidlands
East ofEngland
London SouthEast
SouthWest
Nu
mbe
r of
peo
ple
('00
0's
)Figure 15Estimated number of men obese, 2003 and 2010, by GovernmentOffice RegionBase: Aged 16 and over
Col1
Col2
2003
2010
• For men, the forecasted estimates showed increases in obesity in the majority of Government Office Regions. The largest increase is predicted in Yorkshire and the Humber with the number of men who are obese estimated to rise from 483,872 in 2003 to around 784,073 in 2010. Within the North West the number of adults who are obese is not predicted to rise.
0
1000
2000
3000
4000
5000
6000
7000
8000
9000
NorthEast
NorthWest
Yorkshire& the
Humber
WestMidlands
EastMidlands
East ofEngland
London SouthEast
SouthWest
Nu
mbe
r of
peo
ple
('00
0's
)
Figure 16Estimated number of women obese, 2003 and 2010, by GovernmentOffice RegionBase: Aged 16 and over
Col1
Col2
2003
2010
• Among women, the pattern varied, with 2010 estimates showing an increase in obesity among some regions (such as Yorkshire and the Humber) and others showing a fall in the number of obese women (such as London and the South West).
Table 17
17

4.3.3 Prevalence and number of adults obese, by physical activity status and sex
• Levels of physical activity were assessed by whether a respondent met (or
exceeded) the target to do 30 minutes of activity, five times a week. People meeting this target were classified as active, those not meeting this target were classified as insufficiently active.
• The inset table below gives estimated figures for male and female obesity in 2010
by levels of physical activity:
Insufficiently active Active
Men % estimated to be obese in 2010 24% 29%
Women % estimated to be obese in 2010 23% 17%
• Among men, caution needs to be taken when interpreting these figures as data
from HSE was available for only three years (1998, 1999, 2003). As such, it is difficult to detect true trends over time and therefore model the forecast projections. The figures present above (using the ‘best fit’ curve most appropriate for each category) indicate that a higher proportion of men within active groups will be obese than those who are insufficiently active. This result is contrary to the trends shown by previous HSE reports that have each shown that the proportion of people who are obese is greater among those who are insufficiently active than those who are active. This contradiction is a result of the methodology used to forecast obesity in 2010 and therefore results for men have not been presented fully within this report.
• Among women, estimates for 2010 do follow the same pattern as previous HSE
reports, with a greater number of women estimated to be obese among those who are insufficiently active than among those who are active.
Table 18
4.3.4 Prevalence and number of adults obese, by drinking status and sex
Obesity and overweight prevalence were analysed in relation to levels of drinking. Levels of drinking were assessed using the recommended weekly units of alcohol consumption as thresholds. These were are follows: Men: • Consuming less than 21 units of alcohol per week • Consuming 21 units or more a week Women: • Consuming less than 14 units of alcohol per week
18
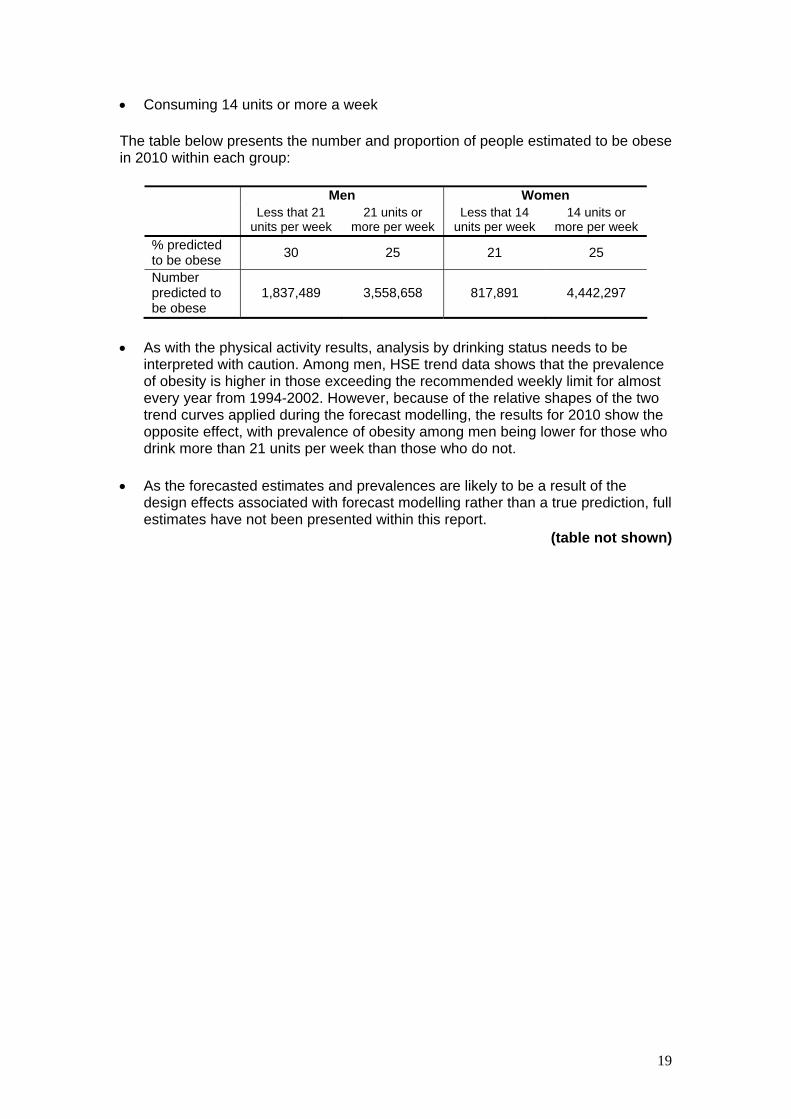
• Consuming 14 units or more a week The table below presents the number and proportion of people estimated to be obese in 2010 within each group:
Men Women Less that 21
units per week 21 units or
more per week Less that 14
units per week 14 units or
more per week % predicted to be obese 30 25 21 25
Number predicted to be obese
1,837,489 3,558,658 817,891 4,442,297
• As with the physical activity results, analysis by drinking status needs to be
interpreted with caution. Among men, HSE trend data shows that the prevalence of obesity is higher in those exceeding the recommended weekly limit for almost every year from 1994-2002. However, because of the relative shapes of the two trend curves applied during the forecast modelling, the results for 2010 show the opposite effect, with prevalence of obesity among men being lower for those who drink more than 21 units per week than those who do not.
• As the forecasted estimates and prevalences are likely to be a result of the
design effects associated with forecast modelling rather than a true prediction, full estimates have not been presented within this report.
(table not shown)
19

4.4 Prevalence and number of children obese, 2003 and 2010, by socio-demographic factors
4.4.1 Prevalence and number of children obese, by social class and sex
0
100
200
300
400
500
Non-manual Manual
Nu
mbe
r of
ch
ildre
n (
'00
0's
)
20032010
Figure 17Estimated number of boys obese, 2003 and 2010 by sexBase: All aged 2-15 with valid BMI
• In 2010, it is predicted that around 462,000 boys aged 2-15 in manual households and around 345,000 boys in non-manual households will be obese. The projected rate of increase in levels of obesity is greater among those who live in manual households than those who live in non-manual households; a two percentage point rise in prevalence between 2003 and 2010 for those in non-manual households, compared with a seven percentage point rise in prevalence for those in manual households.
20

0
100
200
300
400
500
Non-manual Manual
Nu
mbe
r of
ch
ildre
n (
'00
0's
)
20032010
Figure 18Estimated number of girls obese, 2003 and 2010 by sexBase: All aged 2-15 with valid BMI
• A similar pattern is predicted among girls. Forecast estimates show a more
pronounced rate of increase in levels of obesity among girls living in manual households than those living in non-manual households; a three percentage point increase in prevalence between 2003 and 2010 for those living in non-manual households, compared with a nine percentage point increase for those in manual households.
Table 19
4.4.2 Prevalence and number of children obese, by Government Office Region and sex
• Figures 19 and 20 show predicted numbers of children who will be obese in 2010
by Government Office Region. • As with the data for adults, caution must be exercised when examining trends by
Government Office Region (see section 4.3.2).
21

22
0
30
60
90
120
150
180
NorthEast
NorthWest
Yorkshireand theHumber
EastMidlands
WestMidlands
EastEngland
London SouthEast
SouthWest
Nu
mbe
r of
ch
ildre
n (
'00
0's
)
20032010
Figure 19Number of boys obese, by Government Office RegionBase: All aged 2-15 with valid BMI
0
30
60
90
120
150
180
NorthEast
NorthWest
Yorkshireand theHumber
EastMidlands
WestMidlands
EastEngland
London SouthEast
SouthWest
Nu
mbe
r of
ch
ildre
n (
'00
0's
)
20032010
Figure 20Number of girls obese, by Government Office RegionBase: All aged 2-15 with valid BMI
• As for adults, the pattern for children varied across each region, with some regions showing increases in obesity by 2010 and others showing either no change or potential declines. For boys, the greatest increase is predicted in London, with the number of boys who are obese rising from 143,052 to 174,218 between 2003 and 2010. For girls, the greatest increase is predicted in the North West, rising from 98,469 to 128,999.
Table 20, 21
4.4.3 Prevalence and number of children obese by levels of physical activity and sex
• Children’s levels of physical activity were categorised as follows:

Active – active for 60 minutes per day for seven days in the last week. This group represents children who achieve the recommended levels of physical activity. Insufficiently active – active less often/shorter periods only.
• Caution should be exercised with these predictions as there were only two HSE data points (1997 and 2002) which meant that it was not possible to produce trends analysis. Instead the analysis has been produced by applying the mean prevalence estimates from 1997 and 2002 to mid-year population estimates for 2010.
• In 2010 it is expected that at least 200,392 boys and 246,290 girls who are
insufficiently active will be obese. Among those who are active, it is predicted that around 421,584 boys and 335,801 girls will also be obese. The numbers are larger among the active category as the majority of children actually meet the recommended levels of physical activity per week. (In 2002, 70% of children were classified as active and 30% classified as insufficiently active). Therefore, substantive importance should not be attached to the projection that a greater number of children within the active category will be obese than those who are insufficiently active.
Table 22
4.4.4 Prevalence and number of children obese, by parental BMI status and sex
• Figures 21 and 22 show the numbers and proportions of children predicted to be
obese in 2010 by their parents’ BMI status.
23

0
50
100
150
200
250
300
350
400
450
500
No parentoverweight/obese
One parentoverweight/obese
Both parentsoverweight/obese
Num
ber o
f chi
ldre
n ('0
00's
)
0
10
20
30
40
50
Perc
ent
Number of boys obese ('000's)
Percent boys obese
Figure 21Number of boys predicted to be obese in 2010, by parental obesity status and sexBase: All aged 2-15 with valid BMI
0
100
200
300
400
500
600
700
No parentoverweight/obese
One parentoverweight/obese
Both parentsoverweight/obese
Num
ber o
f chi
ldre
n ('0
00's
)
0
10
20
30
40
50Pe
rcen
t
Number of girl obese ('000's)
Percent girls obese
Figure 22Number of girls predicted to be obese in 2010, by parental obesity status and sexBase: All aged 2-15 with valid BMI
• In 2010, around 415,844 boys and 320,727 girls who live in households where both parents are overweight or obese are themselves predicted to be obese.
24

• Whilst these figures represent a rise in obesity among this group from 2003 onwards, it is notable that projected figures show a greater rate of increase among boys than girls. For boys, forecast estimates have predicted that in 2010 a further 100,000 boys who live in households where both parents are overweight or obese will themselves be obese than in 2003 (a 10 percentage point increase in prevalence). Equivalent figures for girls show approximately 7,000 more girls within this group will be obese in 2010, representing two percentage point increase in prevalence from 2003.
• As was observed with estimates for 2003, a greater number of obese children
live in households where one parent is overweight/obese than those who live in households where both parents are overweight/obese. Similar caution should be exercised when interpreting this result as around twice as many children actually live in households where one parent is overweight/obese than those who live in households where both parents are overweight/obese. Therefore, it is important to look at the projected patterns of prevalence among these groups to get an accurate picture. Figures 21 and 22, show that whilst the number of children who are obese may be greater among those who live in households where one parent is overweight/obese, the percentage of children who are obese within each group will continue to be higher among those who live in households where both parents are overweight/obese; 18% and 34% respectively for boys, 24% and 29% respectively for girls.
Table 23
25

APPENDIX: EXTRPOLATION OF TRENDS
The forecasting method in this report makes assumptions about future changes in obesity based on past patterns of change. Analyses were based on the (unweighted) prevalence of obesity for each year from 1993 to 2003 for adults calculated separately for each age-group and sex. For children, the data were from 1995 to 2003; these were weighted for sampling selection because not all children in a household were eligible to be included. Plots of these data indicated that year to year changes in the prevalence of obesity were not always constant across the time period - rather there appeared to be some evidence that rates of increase in some groups were either accelerating or slowing down. Therefore a curve was fitted to the data to allow for this. Two curves, power and exponential, were selected as being plausible models for the data that would allow for either acceleration or slowing down in changes in prevalence of obesity. Both the exponential and the power curves were fitted to the data for each group and the best fitting curve was chosen. A projection for prevalence of obesity in 2010 was made by extrapolating the chosen fitted curve (power or exponential) for each group, and these are presented in the main report. Thus the assumption in this report is that the trends are non-linear. Other assumptions are possible. One alternative would be to extrapolate using a linear trend, and when developing the method for this report, a linear trend was also fitted to the data and alternative projections based on extrapolating the linear trend were made. Another plausible alternative scenario is that rates of change will continue in line with the trend seen for more recent years starting around 1998-2000. This could be modelled by fitting a linear trend restricted to data from more recent years. A projection based on extrapolating from a linear trend for recent years starting around 1998 would produce a forecast of prevalence of obesity in 2010 that lies between the projection given in this report and a projection based on extrapolation from a linear trend fitted to the complete set of years. Thus a comparison of the projected prevalence and numbers given in this report with the alternative projections based on a linear trend provides a sensitivity analysis that gives some indication of the range of plausible values for the forecast. The table below provides this comparison for prevalence of obesity for adult men and women and for boys and girls.
Projected prevalence and number obese in 2010
2010 (predicted)
Sex
Forecast based on extrapolation of power or
exponential trend
Forecast based on extrapolation of linear trend
% N thousands % N thousands Children aged 2-15 Boys 19b 792,321 23 966,470 Girls 22a 910,630 21 839,696 Adults aged 16+ Men 33a 6,658,953 28 5,714,475 Women 28a 5,984,653 31 6,562,471 a Exponential trend b Power trend
26

For prevalence of overweight, there were no discernible trends between 1993 and 2003 (adults) and 1995 and 2005 (children). Therefore, the predicted numbers of overweight in 2010 have been calculated by applying the mean prevalence for the three years 2001-2003 to the projected 2010 population.
27

Table 1 Prevalence and number of adults overweight and obese, by age and sex
Aged 16 and over with valid BMI status 2003
BMI Status Age group Total
16-34 35-54 55-74 75+
% Na % N % N % N % N
Men Overweight 33 2,066,211 47 3,281,310 50 2,349,520 50 706,323 43 8,403,365Obese 14 851,769 27 1,848,110 28 1,305,710 21 296,998 22 4,302,588Overweight including obese 46 2,917,981 74 5,129,420 77 3,655,231 71 1,003,321 65 12,705,953 Women Overweight 24 1,470,007 33 2,329,645 40 2,021,398 40 951,706 33 6,772,757Obese 16 980,440 24 1,695,650 29 1,455,904 26 622,087 23 4,754,080Overweight including obese 39 2,450,447 57 4,025,295 69 3,477,302 67 1,573,793 56 11,526,837 Bases (weighted) Men 2154 - 2389 - 1607 - 369 - 6519 -Women 1996 - 2362 - 1675 - 536 - 6570 -Bases (unweighted: b Men 1648 6285.1 2179 6944.1 1733 4739.1 406 1423.1 5966 19391.4Women 1876 6205.7 2594 7040.1 2004 5049.9 616 2365.2 7090 20660.9a N represents the estimated number of people within each age group who are either overweight, obese or overweight including obese b Population bases (n) are presented in thousands and use data from the 2003 mid population estimates

Table 2 Prevalence and number of adults overweight and obese, by ethnic group and sex
Aged 16 and over with valid BMI status 2003
BMI Status Age group Total
16-34 35-54 55-74 75+
% Na % N % N % N % N
Men White Overweight 33 1,787,806 48 3,008,611 49 2,104,350 49 654,702 44 7,555,468 Obese 14 749,053 27 1,738,951 28 1,190,472 21 282,494 23 3,960,969 Overweight including obese 47 2,536,858 75 4,747,562 77 3,294,822 70 937,196 66 11,516,438 Non-white Overweight 32 234,941 44 232,836 54 112,942 c c 40 580,719 Obese 12 88,810 18 93,012 21 43,697 c c 15 225,519 Overweight including obese 44 323,751 62 325,848 75 156,639 c c 55 806,238 Women White 24 1,313,875 33 2,131,736 40 1,831,290 40 933,077 33 6,209,979 Overweight 16 882,163 24 1,534,796 29 1,313,901 27 612,787 23 4,343,646 Obese 40 2,196,038 57 3,666,532 68 3,145,191 67 1,545,864 56 10,553,625 Overweight including obese Non-white 22 170,001 31 178,805 47 94,398 c c 27 443,203d
Overweight 14 107,925 26 149,241 38 77,265 c c 20 334,431 d
Obese 35 277,926 57 328,046 85 171,663 c c 48 777,635 dOverweight including obese Bases (weighted) White 1977 - 2353 - 1683 - 490 - 6503 -Men 1971 - ,406 - 1815 - 775 - 6968 -Women Non White 335 - 241 - 90 - 13 - 679 -Men 344 - 228 - 70 - 8 - 650 -Women Bases (unweighted) b White Men 1526 5416.8 2158 6330.5 1823 4265.7 539 1330.5 6046 17343.4 Women 1864 5465.1 2649 6402.3 2174 4602.1 893 2307.9 7580 18777.4 Non White Men 239 743.4 200 523.9 85 209.7 14 30.8 538 1507.8 Women 307 790.5 242 579.5 80 202.7 8 35.9 637 1608.6 a N represents the estimated number of people within each age group who are either overweight, obese or overweight including obese b Population bases (n) are presented in thousands and use data from the 2003 mid population estimates c Data not shown due to small base sizes d This total excludes those who are aged 75 and over, as the bases sizes for this group were too small to be able to calculate meaningful data

Table 3 Prevalence and number of adults overweight and obese, by Social Class, age and sex
Aged 16 and over with valid BMI status 2003
BMI Status Age group
Total
16-34 35-54 55-74 75+
% Na % N % N % N % N
Men Non-Manual Overweight 33 1,045,820 49 1,806,270 52 1,138,337 53 349,370 44 4,339,797Obese 14 454,671 26 946,084 25 558,101 18 115,875 21 2,074,731Overweight including obese 47 1,500,491 75 2,752,354 77 1,696,438 71 465,245 66 6,414,528Manual Overweight 32 983,581 45 1,467,515 47 1,201,108 46 300,408 42 3,952,612Obese 12 377,534 28 914,603 30 753,726 25 163,761 23 2,209,624Overweight including obese 44 1,361,115 73 2,382,117 77 1,954,835 70 464,169 65 6,162,236 Women Non-Manual Overweight 23 973,557 33 1,621,457 39 1,219,833 39 522,132 32 4,336,979Obese 13 556,863 20 981,367 24 741,641 25 327,521 19 2,607,392Overweight including obese 36 1,530,420 54 2,602,824 63 1,961,474 64 849,653 51 6,944,371Manual Overweight 25 491,371 32 702,917 41 795,520 42 432,834 33 2,422,643Obese 20 382,899 30 651,879 35 678,130 29 299,204 28 2,012,112Overweight including obese 45 874,271 62 1,354,797 76 1,473,650 71 732,038 61 4,434,755
Bases (weighted) Non-Manual Men 1270 - 1441 - 877 - 241 - 3829 - Women 1275 - 1561 - 1007 - 383 - 4226 - Manual Men 949 - 1111 - 876 - 259 - 3195 - Women 938 - 1016 - 844 - 351 - 3149 - Bases (unweighted) b Non-Manual Men 970 3168.0 1321 3684.4 950 2193.1 265 659.8 3506 9656.1Women 1193 4266.4 1724 4845.6 1210 3113.9 440 1326.7 4567 13517.5Manual Men 729 3117.1 1003 3256.8 941 2544.9 285 761.4 2958 9734.5Women 885 1936.2 1105 2196.5 1006 1934.1 403 1038.3 3399 7148.7a N represents the estimated number of people within each age group who are either overweight, obese or overweight including obese b Population bases (n) are presented in thousands and use data from the 2003 mid population estimates

Table 4 Prevalence and number of men overweight and obese, by Government Office Region and
age
Aged 16 and over with valid BMI status 2003
BMI status Age group Total
16-34 35-54 55-74 75+
% Na % N % N % N % N
Men North East Overweight 26 77,328 50 177,702 48 123,105 c c 42 378,134dObese 11 33,232 24 84,935 33 83,645 c c 23 201,812dOverweight including obese 37 110,560 74 262,637 81 206,750 c c 65 579,946dNorth West Overweight 32 260,673 46 433,276 47 310,992 41 76,808 42 1,081,749Obese 15 122,706 26 245,726 31 205,098 27 49,963 24 623,493Overweight including obese 46 383,379 72 679,002 78 516,090 68 126,771 66 1,705,243Yorkshire and the Humber Overweight 32 198,216 45 313,663 45 220,069 44 62,539 41 794,487Obese 15 90,388 31 215,121 29 142,689 25 35,675 25 483,872Overweight including obese 47 288,603 77 528,784 75 362,758 69 98,214 66 1,278,359East Midlands Overweight 35 178,267 51 308,040 46 196,700 65 81,789 45 764,796Obese 16 84,206 24 145,794 33 141,396 19 23,426 24 394,821Overweight including obese 51 262,473 76 453,834 79 338,096 84 105,214 69 1,159,617West Midlands Overweight 35 230,829 42 306,218 54 281,821 63 95,231 43 914,100Obese 15 100,616 28 204,078 27 143,783 19 28,314 23 476,790Overweight including obese 51 331,445 70 510,296 81 425,604 82 123,545 66 1,390,890East of England Overweight 35 228,065 46 351,304 51 277,137 49 81,321 44 937,827Obese 17 111,001 29 220,535 28 152,543 21 34,777 24 518,856Overweight including obese 52 339,066 74 571,839 79 429,680 69 116,098 68 1,456,683London Overweight 30 360,784 47 481,466 52 276,509 48 80,425 41 1,199,184Obese 12 139,100 24 247,628 20 106,179 16 26,239 18 519,146Overweight including obese 42 499,884 71 729,093 73 382,688 64 106,664 58 1,718,330South East Overweight 33 322,198 50 574,301 54 425,447 39 94,724 45 1,416,670Obese 10 96,758 27 303,463 23 176,300 20 49,306 20 625,827Overweight including obese 43 418,955 77 877,764 77 601,748 59 144,030 65 2,042,498South West Overweight 37 210,320 49 335,778 45 239,870 54 96,129 46 882,096Obese 12 67,094 26 177,601 28 150,195 20 35,124 23 430,014Overweight including obese 49 277,414 75 513,379 73 390,064 74 131,253 68 1,312,110 Bases (weighted) North East 106 - 126 - 113 - 23 - 339 -North West 282 - 379 - 242 - 61 - 878 -Yorkshire and the Humber 216 - 274 - 172 - 50 - 634 -East Midlands 210 - 219 - 158 - 48 - 591 -West Midlands 255 - 284 - 173 - 57 - 676 -East of England 274 - 262 - 214 - 65 - 755 -London 453 - 370 - 197 - 57 - 930 -South East 360 - 408 - 303 - 81 - 1052 -South West 164 - 278 - 203 - 65 663 -Bases (unweighted) b North East 96 70.3 136 357.0 139 253.9 27 71.4 368 752.6North West 233 824.8 364 939.9 268 663.0 68 185.1 849 2612.8Yorkshire and the Humber 164 617.7 236 690.5 178 483.8 53 141.9 560 1933.9East Midlands 170 516.0 212 599.3 180 425.3 55 125.6 574 1666.2West Midlands 197 656.1 265 730.0 191 523.2 65 151.3 629 2060.6East of England 224 646.8 253 768.9 238 546.7 74 167.5 728 2129.9London 299 1190.2 298 1032.7 193 527.1 59 159.6 727 2909.6South East 266 971.4 356 1144.9 313 783.2 87 243.9 930 3143.4South West 122 567.5 244 680.8 210 532.6 69 176.8 601 1957.7a N represents the estimated number of people within each age group who are either overweight, obese or overweight including obese b Population bases (n) are presented in thousands and use data from the 2003 mid population estimates c Data not shown due to small base sizes d This total excludes those who are aged 75 and over, as the bases sizes for this group were too small to be able to calculate meaningful data

Table 5 Prevalence and number of women overweight and obese, Government Office Region and age
Aged 16 and over with valid BMI status 2003
BMI status Age group Total
16-34 35-54 55-74 75+
% Na % N % N % N % N
Women North East Overweight 25 76,813 37 136,522 38 103,221 [49] [59,437] 35 375,993Obese 20 61,991 30 110,849 23 64,113 [19] [23,047] 24 260,000Overweight including obese 45 138,804 67 247,371 61 167,334 [67] [81,271] 59 634,780North West Overweight 28 230,189 37 351,660 44 310,249 36 115,000 36 1,007,098Obese 16 130,325 26 249,197 31 217,523 29 92,546 24 689,591Overweight including obese 43 360,514 63 600,858 74 527,772 64 207,546 60 1,696,690Yorkshire and the Humber Overweight 25 152,033 28 199,435 43 223,385 37 87,936 32 662,790Obese 17 107,167 25 174,888 28 147,106 33 78,668 24 507,830Overweight including obese 42 259,201 53 374,323 71 370,491 69 166,605 55 1,170,619East Midlands Overweight 26 133,206 33 197,614 37 164,405 48 114,556 33 609,781Obese 16 83,857 24 142,582 34 150,220 21 51,206 24 427,865Overweight including obese 43 217,063 56 340,195 71 314,626 69 165,763 57 1,037,646West Midlands Overweight 21 133,809 32 237,418 44 242,896 38 95,477 33 709,600Obese 28 181,854 30 220,320 30 164,860 21 52,813 29 619,847Overweight including obese 49 315,663 62 457,738 74 407,756 59 148,290 61 1,329,447East of England Overweight 29 182,381 30 234,322 40 228,797 34 90,726 33 736,226Obese 13 85,164 26 203,428 29 165,160 39 105,729 24 559,481Overweight including obese 42 267,545 56 437,751 68 393,957 73 196,455 57 1,295,707London Overweight 19 222,206 31 317,419 34 350,493 41 109,748 27 999,865Obese 11 130,618 22 232,464 33 343,921 23 59,812 20 766,816Overweight including obese 31 352,824 53 549,883 67 694,414 64 169,560 48 1,766,681South East Overweight 21 203,310 33 384,560 39 328,068 43 177,379 32 1,093,318Obese 13 128,261 19 215,385 26 216,653 20 80,876 19 641,175Overweight including obese 35 331,570 52 599,946 65 544,721 63 258,256 52 1,734,493South West Overweight 23 128,290 37 260,451 40 223,507 40 116,183 35 728,431Obese 12 68,217 21 145,311 26 147,748 30 87,207 21 448,484Overweight including obese 36 196,507 58 405,762 66 371,255 70 203,390 56 1,176,914 Bases (weighted) North East 109 - 125 - 108 - 35 - 376 -North West 268 - 342 - 222 - 69 - 901 -Yorkshire and the Humber 215 - 218 - 167 - 50 - 650 -East Midlands 168 - 208 - 150 - 56 - 582 -West Midlands 202 - 253 - 181 - 60 - 696 -East of England 228 - 252 - 191 - 65 - 735 -London 342 - 321 - 163 - 50 - 876 -South East 301 - 380 - 304 - 85 - 1071 -South West 163 - 265 - 189 - 66 - 683 -Bases (unweighted:b North East 123 306.6 157 367.2 145 273.4 43 121.3 468 1068.5North West 271 837.0 385 961.2 269 710.0 81 321.9 1006 2830.1Yorkshire and the Humber 196 618.6 224 700.2 191 519.3 56 240.3 667 2078.4East Midlands 172 508.4 248 603.8 191 443.6 67 199.6 678 1755.4West Midlands 194 646.3 292 734.2 222 551.2 70 250.2 778 2181.9East of England 224 637.2 290 775.5 235 576.6 76 267.8 825 2257.1London 282 1154.4 319 1035.2 181 577.8 55 265.5 837 3032.9South East 271 955.1 402 1158.8 351 832.4 95 408.3 1119 3354.6South West 143 550.7 277 703.9 219 565.6 73 290.2 712 2110.4a N represents the estimated number of people within each age group who are either overweight, obese or overweight including obese b Population bases (n) are presented in thousands and use data from the 2003 mid population estimates [ ] indicate that caution should be taken with these estimates due to small base sizes

Table 6 Prevalence and numbers of overweight and obesity among adults, by levels of physical activity,
age and sex
Aged 16 and over with valid BMI 2003
Level of physical activity Age group Total
16-34 35-54 55-74 75+
% Na % N % N % N % N
Men Insufficiently active Overweight 33 1,086,643 48 1,974,565 49 1,707,923 47 611,610 44 5,380,741Obese 16 514,519 29 1,199,252 29 826,234 22 278,817 25 2,818,821Overweight including obese 49 1,601,161 77 3,173,817 78 2,728,009 69 890,427 69 8,393,414Active Overweight 32 979,569 47 1,936,216 51 1,795,273 [69] [92,726] 42 4,803,784Obese 11 337,251 23 956,960 22 781,474 [15] [20,465] 18 2,096,149Overweight including obese 44 1,316,820 70 2,893,176 74 2,576,746 [84] [113,190] 60 6,899,933 Women Insufficiently active Overweight 24 101,8545 33 1,583,814 40 1,614,184 41 915,598 33 5,132,141Obese 17 755,790 27 1,284,779 32 1,284,328 27 604,459 25 3,929,356Overweight including obese 41 1,774,335 59 2,868,594 71 2,898,512 67 1,520,057 58 9,061,497Active Overweight 24 456,312 34 743,805.2 41 405,659 c c 32 1,556,977dObese 12 221,480 19 411,600 18 171,942 c c 16 780,884dOverweight including obese 36 677,792 53 115,5405 59 577,601 c c 48 2,337,861d Bases (weighted) Insufficiently active Men 1118 - 1422 - 1180 - 331 - 4051 -Women 1387 - 1623 - 1348 - 511 - 4869 -Active Men 1036 - 963 - 423 - 35 - 2458 -Women 603 - 738 - 324 - 24 - 1689 -Bases (unweighted) b Insufficiently active Men 859 3261.5 1302 8335.4 1273 3487.5 365 3430.0 3799 12068.9Women 1299 4324.9 1786 4839.7 1609 4071.6 587 2257.9 5281 15338.9Active Men 789 3023.6 874 2805.0 456 1251.6 38 134.6 2157 7322.5Women 571 1880.8 807 2200.4 391 978.3 28 107.3 1797 5322.0a N represents the estimated number of people within each age group who are either overweight, obese or overweight including obese b Population bases (n) are presented in thousands and use data from the 2003 mid population estimates c Data not shown due to small base sizes d This total excludes those who are aged 75 and over, as the bases sizes for this group were too small to be able to calculate meaningful data [ ] indicate that caution should be taken with these estimates due to small base sizes

~0628871.doc 22/08/06 14:21 Last saved by:Jones
Table 7 Prevalence and numbers of overweight and obesity among adults, by smoking status, age and
sex
Aged 16 and over with valid BMI 2003
Smoking status Age group Total
16-34 35-54 55-74 75+
% Na % N % N % N % N
Men Never smoked Cigarettes Overweight 29 891,615 46 1,333,801 48 635,703 c 157,555 39 3,018,674Obese 13 401,291 24 683,271 25 327,772 13 51,320 19 1,463,655Overweight including obese 41 1,292,906 70 2,017,073 72 963,475 54 208,875 58 4,482,328Used to smoke cigarettes Overweight 35 315,376 43 921,623 45 1,144,080 36 336,626 42 2,717,705Obese 19 173,031 32 683,054 28 703,609 18 163,837 27 1,723,531Overweight including obese 54 488,407 75 1,604,677 73 1,847,689 54 500,462 69 4,441,236Current cigarette smoker Overweight 33 735,847 40 766,574 40 349,506 c c 36 1,874,948Obese 10 226,811 17 335,734 17 151,939 c c 14 716,803Overweight including obese 43 962,658 57 1,102,309 57 501,445 c c 50 2,591,751 Women Never smoked Cigarettes Overweight 20 635,970 29 1,004,000 36 850,809 27 303,589 28 2,794,368Obese 12 383,385 21 723,044 24 569,645 18 208,147 19 1,884,220Overweight including obese 32 1,019,354 50 1,727,043 60 1,420,454 45 511,737 46 4,678,588Used to smoke cigarettes Overweight 18 214,231 31 509,834 37 635,427 30 304,229 30 1,663,721Obese 16 183,641 25 422,443 30 525,374 19 193,063 24 1,324,521Overweight including obese 34 397,872 56 932,277 67 1,160,801 49 497,292 54 2,988,241Current cigarette smoker Overweight 23 430126 30 571,984 32 310,423 20 43,387 27 1,355,920Obese 15 286905 19 372,691 21 199,017 12 24,454 18 883,067Overweight including obese 38 717031 49 944,675 53 509,440 32 67,841 45 2,238,987 Bases (weighted) Never smoked cigarettes Men 1047 - 994 - 447 - 104 - 2591 -Women 998 - 1136 - 774 - 253 - 3162 -Used to smoke cigarettes Men 306 - 725 - 859 - 241 - 2130 -Women 357 - 563 - 586 - 231 - 1736 -Current cigarette smokers Men 770 - 653 - 298 - 24 - 1746 -Women 624 - 660 - 313 - 52 - 1649 -Bases (unweighted) b Never smoked cigarettes Men 788 3120.6 913 2880.7 476 1333.9 114 387.0 2291 7711.9 Women 919 3178.9 1239 3436.6 917 2356.3 290 1130.8 3365 10103.9Used to smoke cigarettes Men 240 908.1 664 2127.9 939 2532.9 266 924.8 2109 6508.1 Women 338 1162.8 618 1669.4 706 1725.3 265 1022.0 1927 5540.0Current cigarette smokers Men 597 2256.4 586 1935.5 315 872.4 26 111.3 1524 5171.5 Women 603 1864.0 733 1934.1 378 968.4 60 212.5 1774 5016.9a N represents the estimated number of people within each age group who are either overweight, obese or overweight including obese b Population bases (n) are presented in thousands and use data from the 2003 mid population estimates c Data not shown due to small base sizes

~0628871.doc 22/08/06 14:21 Last saved by:Jones
Table 8 Prevalence and number of children overweight and obese prevalence, by age and sex
Aged 2-15 with valid BMI 2003
BMI Status Age group Total 2-10 Total 2-15
2 -5 6 -10 11-15
% Na % N % N % N % N
Boys Overweight 13 156,669 15 244,021 14 242,822 15 400,690 15 643,513Obese 12 144,195 17 266,690 20 335,777 15 410,884 17 746,662Overweight including obese 25 300,864 32 510,710 35 578,600 30 811,575 32 1,390,174 Girls Overweight 12 140,880 14 211,311 16 260,856 13 352,192 15 613,048Obese 10 116,261 14 208,041 22 351,682 12 324,302 16 675,983Overweight including obese 23 257,141 28 419,352 38 612,537 26 676,494 31 1,289,031 Bases (weighted) Boys 330 - 549 - 535 - 878 - 1452 -Girls 341 - 516 - 547 - 858 - 1393 -Bases (unweighted) b Boys 332 1183.6 532 1581.8 553 1676.8 864 2765.4 1417 4442.2Girls 336 1129.3 533 1506.8 547 1591.9 869 2636.1 1416 4228.0a N represents the estimated number of people within each age group who are either overweight, obese or overweight including obese b Bases are presented in thousands and use data from the 2003 mid population estimates

~0628871.doc 22/08/06 14:21 Last saved by:Jones
Table 9 Prevalence and number of children overweight and obese prevalence, by ethnic group, age and
sex
Aged 2-15 with valid BMI 2003
BMI Status Age group Total 2-10 Total 2-15
2-5 6-10 11-15
% Na % N % N % N % N
Boys White Overweight 15 152,006 15 216,454 15 210,628 15 368,460 15 579,088Obese 11 115,907 17 237,314 18 265,257 15 353,221 16 618,478Overweight including obese 26 267,912 32 453,769 33 475,884 30 721,681 31 1,197,566 Non White Overweight 7 11,609 14 30,407 13 26,417 11 42,017 12 69,299Obese 17 29,711 17 35,663 30 62,625 17 65,374 22 128,443Overweight including obese 23 41,320 31 66,070 44 89,043 28 107,391 34 197,742 Girls White Overweight 13 129,160 14 188,975 15 211,141 14 318,136 14 529,277Obese 10 93,924 14 190,280 21 292,533 12 284,203 16 576,736Overweight including obese 23 223,084 28 379,255 37 503,673 26 602,339 30 1,106,012 Non White Overweight [8] [14,457] 13 26,867 22 44,534 11 41,324 16 85,858Obese [16] [26,687] 11 22,194 26 52,615 13 48,881 18 101,496Overweight including obese [24] [41,144] 24 49,061 48 97,149 24 90,205 34 187,354 Bases (weighted) Boys White 272 - 480 - 500 - 752 - 1252 -Non White 58 - 67 - 74 - 125 - 199 -Girls White 296 - 448 - 463 - 745 - 1208 -Non White 44 - 68 - 72 - 112 - 184 -Bases (unweighted)b Boys White 282 1036.9 476 1405.9 492 1435.0 758 2442.8 1250 3877.8Non White 50 176.0 55 210.4 61 207.4 105 386.4 166 593.8Girls White 294 985.5 473 ,335.3 482 364.2 767 2320.9 1249 3685.1Non White 41 170.1 60 203.9 65 200.4 101 374.0 166 574.3a N represents the estimated number of people within each age group who are either overweight, obese or overweight including obese b Population bases (n) are presented in thousands and use data from the 2003 mid population estimates

~0628871.doc 22/08/06 14:21 Last saved by:Jones
Table 10 Prevalence and number of children overweight and obese prevalence, by social class, age and sex
Aged 2-15 with valid BMI 2003
BMI Status Age group Total 2-10 Total 2-15
2-5 6-10 11-15
% Na % N % N % N % N Boys Non-manual Overweight 12 81,594 16 150,033 12 109,378 15 231,627 14 341,005Obese 11 75,765 15 141,477 19 165,011 14 217,242 16 382,253Overweight including obese 24 157,359 32 291,510 31 274,389 29 448,869 30 723,258 Manual Overweight 14 73,748 16 107,909 16 127,336 15 181,657 16 308,993Obese 12 64,558 18 119,471 20 161,880 16 184,029 18 345,909Overweight including obese 27 138,307 34 227,379 36 289,216 31 365,686 33 654,903 Girls Non-manual Overweight 14 89,843 12 96,267 16 151,646 12 186,109 14 337,755Obese 8 51,067 13 108,660 18 168,638 11 159,727 14 328,365Overweight including obese 21 140,910 25 204,926 35 320,284 23 345,836 28 666,120 Manual Overweight 11 54,082 15 101,485 16 110,493 14 155,567 15 266,060Obese 14 64,525 15 101,524 26 171,150 15 166,049 19 337,199Overweight including obese 25 118,607 31 203,009 42 281,643 29 321,616 34 603,258 Bases (weighted) Boys Non-manual 167 - 285 - 280 - 451 - 731 -Manual 141 - 229 - 270 - 371 - 641 -Girls Non-manual 182 - 271 - 290 - 453 - 743 -Manual 147 - 224 - 224 - 371 - 595 -Bases (unweighted)b Boys Non-manual 176 665.0 284 913.6 287 883.5 460 1578.8 747 2460.9Manual 135 518.4 217 667.5 248 793.1 352 1186.4 600 1981.2Girls Non-manual 188 657.6 290 835.3 310 922.2 478 1492.9 788 2415.2Manual 137 472.0 222 657.0 218 670.2 359 1144.1 577 1813.8a N represents the estimated number of people within each age group who are either overweight, obese or overweight including obese b Population bases (n) are presented in thousands and use data from the 2003 mid population estimates

~0628871.doc 22/08/06 14:21 Last saved by:Jones
Table 11 Prevalence and number of children overweight and obese prevalence, by Government Office
Region and age
Aged 2-15 with valid BMI 2003
BMI Status Age group Total 2-10 Total 2-15
2-5 6-10 11-15
% Na % N % N % N % N
All children North East Overweight [21] [23,561] 15 22,428 14 23,339 18 45,989 16 69,328Obese [2] [2,095] 15 22,983 27 44,897 9 25,078 15 69,975Overweight including obese [23] [25,656] 29 45,411 41 68,236 27 71,067 32 139,303North West Overweight 10 31,923 14 59,812 17 79,736 12 91,735 14 171,471Obese 14 42,706 14 60,281 19 88,867 14 102,988 16 191,855Overweight including obese 24 74,630 28 120,093 36 168,603 26 194,723 30 363,326Yorkshire and The Humber Overweight 12 28,193 15 47,520 13 44,573 14 75,713 14 120,286Obese 8 17,774 17 53,640 26 88,344 13 71,414 18 159,758Overweight including obese 20 45,967 32 101,160 39 132,918 27 147,127 32 280,045East Midlands Overweight 8 15,424 13 32,284 16 44,904 11 50,709 13 95,613Obese 12 22,322 16 41,413 24 68,932 14 63,735 18 132,667Overweight including obese 20 37,747 29 73,697 40 113,835 26 114,444 31 198,280West Midlands Overweight 17 42,314 17 56,936 12 43,804 17 99,250 15 143,055Obese 11 28,983 17 57,242 29 105,628 15 86,225 20 191,853Overweight including obese 28 71,297 34 114,178 41 149,433 32 185,475 35 334,908East England Overweight 13 33,476 12 42,109 9 32,860 13 75,586 11 108,446Obese 9 22,002 15 51,526 17 59,491 13 73,529 14 133,020Overweight including obese 22 55,479 27 93,636 26 92,352 25 149,115 26 241,466London Overweight 12 46,198 11 47,258 17 72,370 11 93,456 13 165,826Obese 20 76,183 19 83,554 21 89,929 20 159,738 20 249,666Overweight including obese 33 122,381 29 130,812 37 162,299 31 253,193 33 415,492South East Overweight 11 39,659 20 100,764 20 105,400 17 140,423 18 245,823Obese 12 43,062 12 61,248 15 80,059 12 104,310 13 184,369Overweight including obese 22 82,721 32 162,011 36 185,459 29 244,733 31 430,192South West Overweight 16 33,781 13 38,387 17 53,820 14 72,168 15 125,988Obese 5 10,480 16 47,226 19 59,168 12 57,706 15 116,874Overweight including obese 21 44,261 29 85,613 36 112,988 26 129,874 30 242,862 Bases (weighted) North East 43 - 52 - 53 - 95 - 148 - North West 90 - 146 - 167 - 236 - 403 - Yorkshire and The Humber 67 - 107 - 102 - 174 - 176 - East Midlands 54 - 95 - 95 - 149 - 244 - West Midlands 65 - 125 - 118 - 190 - 308 - East England 71 - 114 - 136 - 186 - 321 - London 108 - 127 - 151 - 235 - 386 - South East 103 - 188 - 161 - 292 - 453 - South West 69 - 111 - 126 - 180 - 307 - Bases (unweighted)b North East 46 110.5 61 154.3 59 167.9 107 264.8 161 432.7 North West 99 313.3 165 430 177 465.6 264 743.4 449 1208.9 Yorkshire and The Humber 61 231.6 98 316.3 100 336.7 159 547.9 255 884.6 East Midlands 56 191.9 99 263.8 104 281.4 155 455.7 253 737.1 West Midlands 72 253 136 340.7 127 360.2 208 593.7 350 953.9 East England 70 256.3 117 343.5 137 350.9 187 599.8 320 950.7 London 99 374.9 110 444 124 436.2 209 818.9 340 1255.1 South East 102 374 177 502.7 149 522.4 279 876.7 438 1399.1 South West 63 214.4 102 297.3 123 315.7 165 511.7 288 827.3a N represents the estimated number of people within each age group who are either overweight, obese or overweight including obese b Population bases (n) are presented in thousands and use data from the 2003 mid population estimates [ ] Indicates caution should be taken with these estimates due to small base sizes

~0628871.doc 22/08/06 14:21 Last saved by:Jones
Table 12 Prevalence and number of children overweight and obese, by physical activity levels, age and
sex
Aged 2-15 with valid BMI 2002
BMI Status Age group Total 2-10 Total 2-15
2-5 6-10 11-15
% Na % N % N % N % N Boys Insufficiently active Overweight 10 34,350 13 60,330 16 79,072 12 94,680 13 173,753Obese 17 56,538 18 83,159 20 98,465 17 139,697 18 238,163Overweight including obese 27 90,888 30 143,489 35 177,538 29 234,378 31 411,915Active Overweight 15 125,945 14 149,835 14 161,716 14 275,779 14 437,495Obese 14 117,314 15 160,907 20 230,604 14 278,221 16 508,825Overweight including obese 29 243,259 28 310,742 33 392,320 28 554,001 30 946,321 Girls Insufficiently active Overweight 14 48,289 15 78,298 14 106,084 14 126,587 14 232,671Obese 13 46,119 18 97,553 21 158,336 16 143,673 18 302,008Overweight including obese 27 94,408 33 175,852 35 264,420 31 270,260 33 534,680Active Overweight 15 119,317 10 102,072 16 134,540 12 221,389 14 355,929Obese 11 82,819 19 183,965 18 146,232 15 266,783 16 413,016Overweight including obese 26 202,136 29 286,037 34 280,772 28 488,172 30 768,945 Bases(weighted) Boys Insufficiently active 251 - 437 - 409 - 688 - 1097 -Active 634 - 1023 - 958 - 1657 - 2615 -Girls Insufficiently active 285 - 480 - 630 - 764 - 1395 -Active 631 - 882 - 695 - 1512 - 2208 -Bases (unweighted)b Boys Insufficiently active 218 358.8 376 480.8 360 503.9 594 839.6 954 1343.5Active 554 853.5 872 1119.9 841 1159.8 1426 1973.4 2267 3133.2Girls Insufficiently active 243 366.3 402 538.7 564 754.9 645 904.9 1209 1659.8Active 559 789.2 733 985.3 610 827.1 1292 1774.6 1902 2601.7a N represents the estimated number of people within each age group who are either overweight, obese or overweight including obese b Population bases (n) are presented in thousands and use data from the 2002 mid population estimates

~0628871.doc 22/08/06 14:21 Last saved by:Jones
Table 13 Prevalence and number of overweight and obesity prevalence among children, by parental
overweight/obesity and sex
2003
BMI Status Age group Total 2-10 Total 2-15
2-5 6-10 11-15
% Na % N % N % N % N
Boys No obese/overweight parents overweight c c [13] [17,931] [7] [9,994] 12 30,481 10 40,475obese c c [4] [5,460] [7] [9,814] 5 11,835 6 21,649overweight and obese c c [16] [23,391] [14] [19,809] 17 42,315 16 62,124One overweight/obese parent overweight 15 120,377 13 133,312 14 140,636 14 253,689 14 394,352obese 11 87,216 14 137,400 23 224,325 13 244,616 17 448,941overweight and obese 26 207,593 27 270,712 38 364,961 27 478,305 31 843,266Both parents obese/overweight overweight 17 46,754 26 118,386 20 112,913 23 165,140 22 278,053obese 18 50,478 29 127,858 24 133,061 25 178,337 24 311,397overweight and obese 35 97,232 55 246,244 43 245,974 48 343,477 46 589,450 Girls No obese/overweight parents overweight [6] [9,086] [11] [13,776] 9 18,055 9 22,862 9 40,917obese [7] [10,701] [0] [-] 3 6,244 4 10,701 4 16,945overweight and obese [14] [19,787] [11] [13776] 13 24,299 13 33,563 13 57,862One overweight/obese parent overweight 9 63,468 13 124,027 15 137,312 11 187,495 13 324,808obese 10 69,892 13 131,289 22 199,593 12 201,181 16 400,774overweight and obese 19 133,361 26 255,316 37 336,905 23 388,677 28 725,582Both parents obese/overweight overweight 20 59,217 16 62,553 20 95,293 17 121,770 18 217,063obese 17 48,726 25 100,775 34 164,161 22 149,500 27 313,661overweight and obese 37 107,942 41 163,328 54 259,454 39 271,270 45 530,724 Bases (weighted) Boys No obese/overweight parents 22 - 40 - 38 - 62 - 100 -One overweight/obese parent 166 - 279 - 261 - 445 - 706 -Both parents obese/overweight 59 - 126 - 152 - 185 - 337 -Girls No obese/overweight parents 34 - 34 - 49 - 68 - 117 -One overweight/obese parent 167 - 263 - 236 - 430 - 666 -Both parents obese/overweight 70 - 108 - 124 - 178 - 302 -Bases (unweighted) b Boys No obese/overweight parents 22 100.7 39 143.8 38 147.3 61 244.5 99 391.8One overweight/obese parent 163 800.5 261 991.6 251 973.9 424 1792.1 675 2766.0Both parents obese/overweight 58 282.4 126 446.4 145 555.7 184 728.8 329 1284.4Girls No obese/overweight parents 34 146.2 32 124.2 51 201.4 66 270.3 117 471.7One overweight/obese parent 162 705.2 261 984.8 239 913.2 423 1690.0 662 2603.2Both parents obese/overweight 67 278.0 121 397.8 125 477.4 188 675.8 313 1153.1a N represents the estimated number of people within each age group who are either overweight, obese or overweight including obese b Population bases (n) are presented in thousands and use data from the 2003 mid population estimates c Percentages and estimates not presented due to small base sizes [ ] Indicates caution should be taken with these estimates due to small base sizes

~0628871.doc 22/08/06 14:21 Last saved by:Jones
Table 14 Prevalence and number of adults overweight and obese in 2003 and 2010, by age and sex
Aged 16 and over 2003, 2010 (predicted)
BMI Status Age group Totald
16-34 35-54 55-74 75+
% Na % N % N % N % N
Men Obesity 2003b 14 851,769 27 1,848,110 28 1,305,710 21 296,998 22 4,302,5882010 16 100,0442 38 2,739,197 35 1,800,426 22 355,637 33 6,658,953Overweight 2003b 33 2,066,211 47 3,281,310 50 2,349,520 50 706,323 43 8,403,3652010 32 2,066,758 46 3,311,964 47 2,410,355 42 688,703 42 8,556,189 Women Obesity 2003b 16 980,440 24 1,695,650 29 1,455,904 26 622,087 23 4,754,0802010 22 1,340,247 29 2,120,025 28 1,552,815 23 559,090 28 5,984,653Overweight 2003b 24 1,470,007 33 2,329,645 40 2,021,398 40 951,706 33 6,772,7572010 22 1,388,170 32 2,312,614 36 1,951,753 33 794,704 30 6,478,212 Bases (weighted): Men 2003 2154 - 2389 - 1607 - 369 - 6519 -Women 2003 1996 - 2362 - 1675 - 536 - 6570 -Bases (unweighted):c Men 2003 1648 6285.1 2179 6944.1 1733 4739.1 406 1423.1 5966 19391.42010 - 6382.0 - 7259.1 - 5174.9 - 1639.9 - 20455.9Women 2003 1876 6205.7 2594 7040.1 2004 5049.9 616 2365.2 7090 20660.92010 - 6225.6 - 7336.2 - 5476.8 - 2434.0 - 21472.6a N represents the estimated number of people within each age group who are either overweight or obese b 2003 prevalence estimates presented are based on data weighted for non-response. The weighted bases for these estimates are also presented. c Population bases (n) are presented in thousands. For 2003, data from the 2003 mid population estimates have been used. For 2010, forecasted mid-
year population estimates for 2010 have been applied. d For 2010 data, the total number of people either obese or overweight may differ from the cumulative total of the age groups presented. This is due to
imprecision within the forecast modelling.

~0628871.doc 22/08/06 14:21 Last saved by:Jones
Table 15 Prevalence and number of children overweight and obese in 2003 and 2010, by age and sex
Aged 2-15 2003, 2010 (predicted)
BMI Status Age group Total 2-10 d Total 2-15d
2-5 6-10 11-15
% Na % N % N % N % N
Boys Obesity 2003b 12 144,195 17 266,690 20 335,777 15 410,884 17 746,662 2010 13 159,497 19 277,657 31 479,519 17 443,604 19 792,321 Overweight 2003b 13 156,669 15 244,021 14 242,822 15 400,690 15 643,513 2010 15 173,127 14 215,147 14 221,859 15 389,113 14 610,799 Girls Obesity 2003b 10 116,261 14 208,041 22 351,682 12 324,302 16 675,983 2010 10 118,172 24 342,449 27 396,325 19 483,867 22 910,630 Overweight 2003b 12 140,880 14 211,311 16 260,856 13 352,192 15 613,048 2010 13 146,924 14 197,401 16 241,566 13 345,338 14 586,338 Bases (weighted) Boys 2003 330 - 549 - 574 - 878 - 1452 - Girls 2003 341 - 516 - 535 - 858 - 1393 - Bases (unweighted)c Boys 2003 332 1183.6 532 1581.8 553 1676.8 864 2765.4 1417 4442.2 2010 - 1186.8 - 1490.4 - 1554.3 - 2677.2 - 4231.5 Girls 2003 336 1129.3 533 1506.8 547 1591.9 869 2636.1 1416 4228.0 2010 - 1132.3 - 1427.4 - 1489.0 - 2559.7 - 4048.7 a N represents the estimated number of people within each age group who are either overweight or obese b 2003 prevalence estimates presented are based on data weighted for non-response. The weighted bases for these estimates are also presented. c Population bases (n) are presented in thousands. For 2003, data from the 2003 mid population estimates have been used. For 2010, forecasted mid-
year population estimates for 2010 have been applied. d For 2010 data, the total number of people either obese or overweight may differ from the cumulative total of the age groups presented. This is due to
imprecision within forecasting modelling.

~0628871.doc 22/08/06 14:21 Last saved by:Jones
Table 16 Prevalence and number of adults overweight and obese in 2003 and 2010, by social class and sex
Aged 16 and over 2003, 2010 (predicted)
BMI Status Social Class
Non Manual Manual
% N % NMen Obesity 2003b 21 2,074,731 23 2,209,6242010 27 2,721,283 29 2,990,515 Overweight 2003b 44 4,339,797 42 3,952,6122010 42 4,231,987 38 3,930,498 Women Obesity 2003b 19 2,607,392 28 2,012,1122010 18 2,504,559 28 2,099,698 Overweight 2003b 32 4,336,979 33 2,422,6432010 28 3,964,729 28 2,101,652 Bases (weighted) Men 2003 3829 - 3195 - Women 2003 4226 - 3149 -Bases (unweighted)c Men 2003 3506 9656.1 2958 9734.52010 - 10,186.2 - 10,269.2 Women 2003 4567 13517.5 3399 7148.72010 - 14048.5
- 7429.5
a N represents the estimated number of people within each age group who are either overweight or obese b 2003 prevalence estimates presented are based on data weighted for non-response. The weighted bases for these estimates are also presented. c Population bases (n) are presented in thousands. For 2003, data from the 2003 mid population estimates have been used. For 2010, forecasted mid-
year population estimates for 2010 have been applied.

~0628871.doc 22/08/06 14:21 Last saved by:Jones
Table 17 Prevalence and number of adults overweight and obese in 2003 and 2010, by Government Office Region and sex
Aged 16 and over 2003, 2010 (predicted)
BMI Status Government Office Region
North East North West Yorkshire and the Humber
West Midlands East Midlands East of England London South East South West
% Na % N % N % N % N % N % N % N % N
Men Obesity 2003b 23 201,812 24 623,493 25 483,872 23 476,790 24 394,821 24 518,856 18 519,146 20 625,827 23 430,014 2010 31 309,267 23 612,111 39 784,073 24 514,643 27 468,313 30 682,481 17 527,370 23 754,779 22 470,294 Overweight 2003b 42 378,134 42 1,081,749 41 794,487 43 914,100 45 764,796 44 937,827 41 1,199,184 45 1,416,670 46 882,096 2010 40 399,969 39 1,065,832 39 784,816 40 841,404 40 706,050 44 998,012 38 1,181,743 39 1,289,283 41 853,682 Women Obesity 2003b 24 260,000 24 689,591 24 507,830 29 619,847 24 427,865 24 559,481 20 766,816 19 641,175 21 448,484 2010 25 267,271 22 630,157 27 573,968 24 547,224 22 401,130 24 573,558 19 602,854 17 582,728 16 358,886 Overweight 2003b 35 375,993 36 1,007,098 32 662,790 33 709,600 33 609,781 33 736,226 27 999,865 32 1,093,318 35 728,431 2010 32 340,189 30 863,080 27 578,568 28 622,355 29 538,128 29 700,878 25 797,490 26 913,042 29 645,790 Bases (weighted) Men 2003 368 - 963 - 712 - 770 - 635 - 815 - 1077 - 1153 - 709 - Women 2003 376 - 901 - 650 - 696 - 582 - 735 - 876 - 1071 - 683 - Bases (unweighted)c Men 2003 398 752.6 933 2612.8 631 1933.9 718 2060.6 617 1666.2 789 2129.9 849 2909.6 1022 3143.4 645 1957.7 2010 - 1004.0
- 2720.4 - 2020.0 - 2125.6 - 1764.3 - 2275.10 - 3114.84 - 3334.42
- 2097.2
Women 2003 468 1068.5 1006 2830.1 667 2078.4 778 2181.9 678 1755.4 825 2257.1 837 3032.9 1119 3354.6 712 2110.4 2010 - 1075.6
- 2887.4 - 2148.2 - 2254.8 - 1847.5 - 2377.70 - 3145.04 - 3508.90
- 2227.5
a N represents the estimated number of people within each age group who are either overweight or obese b 2003 prevalence estimates presented are based on data weighted for non-response. The weighted bases for these estimates are also presented. c Population bases (n) are presented in thousands. For 2003, data from the 2003 mid population estimates have been used. For 2010, forecasted mid-year population estimates for 2010 have been applied. d Caution must be taken when interpreting trends and forecasted estimated by Government Office Region. Changes in the way the data is presented and administrative changes to GOR boundaries mean the GOR categories are not
always directly comparable year on year as they do not always represent the identical geographic areas.

~0628871.doc 22/08/06 14:21 Last saved by:Jones
Table 18 Prevalence and number of women overweight and obese in 2003 and 2010, by levels of
physical activityd
Aged 16 and over 2003, 2010 (predicted)
BMI Status Level of physical activity
Insufficiently active Active
% Na % N
Women Obesity 2003b 25 3,929,356 16 780,884d2010 23 3,662,795 17 920,674 Overweight 2003b 33 5,132,141 32 1,556,977d2010 29 4,548,293 29 1,609,305 Bases (weighted) Women 2003 4869 - 1689 -Bases (unweighted)c Women 2003 5281 15338.9 1797 5322.02010 - 15941.5 - 5531.1
a N represents the estimated number of people within each age group who are either overweight or obese b 2003 prevalence estimates presented are based on data weighted for non-response. The weighted bases for these estimates are also presented. c Population bases (n) are presented in thousands. For 2003, data from the 2003 mid population estimates have been used. For 2010, forecasted mid-year population estimates for 2010 have been applied. d Due to features of the forecast modelling it is only possible to present obesity estimates in 2010 by levels of physical activity for women. See report commentary for a full explanation about estimates for men.

~0628871.doc 22/08/06 14:21 Last saved by:Jones
Table 19 Prevalence and number of children overweight and obese in 2003 and 2010, by social class and sex
Aged 2-15 2003, 2010 (predicted)
BMI Status Social Class and Age Group
Total aged 2-10 Total aged 2-15
Non Manual Manual Non Manual Manual
% Na % N % N % N
Boys Obesity 2003b 14 217,242 16 184,029 16 382,253 18 345,909 2010 17 258,577 22 252,142 18 345,436 25 462,687Overweight 2003b 15 231,627 15 181,657 14 341,005 16 308,993 2010 14 212,505 15 174,676 16 306,830 15 280,893 Girls Obesity 2003b 11 159,727 15 166,049 14 328,365 19 337,199 2010 13 194,688 27 303,645 17 391,777 28 492,363Overweight 2003b 12 186,109 14 155,567 14 337,755 15 266,060 2010 13 184,244 15 162,748 15 336,234 15 253,739 Bases (weighted) Boys 2003 451 - 371 - 731 - 641 -Girls 2003 453 - 371 - 743 - 595 -Bases (unweighted)c Boys 2003 460 1578.8 352 1186.4 747 2460.9 600 1981.22010 - 1528.4 - 1148.5 - 2344.1 - 1887.2Girls 2003 478 1492.9 359 1144.1 788 2415.2 577 1813.82010 - 1449.6 - 1110.9 - 2312.8 - 1736.9
a N represents the estimated number of people within each age group who are either overweight or obese b 2003 prevalence estimates presented are based on data weighted for non-response. The weighted bases for these estimates are also presented. c Population bases (n) are presented in thousands. For 2003, data from the 2003 mid population estimates have been used. For 2010, forecasted mid-
year population estimates for 2010 have been applied.

~0628871.doc 22/08/06 14:21 Last saved by:Jones
Table 20 Prevalence and number of children aged 2-10 overweight and obese in 2003 and 2010, by Government Office Region and sex
Aged 2-10 2003, 2010 (predicted)
BMI Status Government Office Region
North East North West Yorkshire and the Humber
West Midlands East Midlands Eastern London South East South West
% Na % N % N % N % N % N % N % N % N
Boys Obesity 2003b 8 11,052 14 54,103 11 31,631 15 46,917 18 42,939 16 49,818 21 88,478 12 54,931 14 36,528 2010 11 14,192 13 46,073 17 44,909 15 44,768 17 37,666 19 56,754 29 122,728 16 69,237 16 39,321 Overweight 2003b 13 18,255 14 52,260 14 40,161 18 55,533 13 30,616 16 48,033 10 42,893 18 79,274 15 39,851 2010 14 17,564 14 50,815 16 41,862 16 45,474 15 34,187 13 40,140 14 60,696 14 60,066 14 35,215 Girls Obesity 2003b 10 12,596 14 49,148 15 40,819 14 42,030 9 20,758 9 25,290 17 69,016 12 50,092 9 21,599 2010 14 15,964 23 78,379 15 37,184 19 53,388 11 23,501 11 32,397 15 63,015 13 53,635 8 18,655 Overweight 2003b 21 27,742 11 41,149 14 36,287 15 44,080 10 21,092 9 27,266 13 52,153 16 68,154 12 30,927 2010 15 17,000 11 38,669 15 37,166 14 39,081 15 33,239 14 40,161 14 58,657 12 51,590 11 27,279 Bases (weighted) Boys 2003 45 - 113 - 82 - 93 - 81 - 96 - 136 - 128 - 103 - Girls 2003 49 - 122 - 92 - 97 - 68 - 90 - 99 - 164 - 77 - Bases (unweighted)c Boys 2003 54 135.7 131 381.4 71 279.7 103 234.2 82 303.6 93 307.3 112 417.8 124 450.4 94 262.1 2010 - 124.9 - 358.2 - 262.2 -
224.4- 290.7 - 301.4 -
424.9-
438.5 -
252.0 Girls 2003 53 129.1 133 362.0 88 268.2 105 221.5 73 290.1 94 292.5 97 401.1 155 426.3 71 249.5 2010 - 115.1 - 340.1 - 253.1 - 215.0 - 278.6 - 291.5 - 409.6 - 417.0 - 239.7 a N represents the estimated number of people within each age group who are either overweight or obese b 2003 prevalence estimates presented are based on data weighted for non-response. The weighted bases for these estimates are also presented. c Population bases (n) are presented in thousands. For 2003, data from the 2003 mid population estimates have been used. For 2010, forecasted mid-year population estimates for 2010 have been applied. d Caution must be taken when interpreting trends and forecast predictions by Government Office Region. Changes in the way the data is presented and administrative changes to GOR boundaries mean the GOR categories are not
always directly comparable year on year as they do not always represent the identical geographic areas.

~0628871.doc 22/08/06 14:21 Last saved by:Jones
Table 21 Prevalence and number of children aged 2-15 overweight and obese in 2003 and 2010, by Government Office Region and sex
Aged 2-15 2003, 2010 (predicted)
BMI Status Government Office Regiond
North East North West Yorkshire and the Humber
West Midlands East Midlands Eastern London South East South West
% Na % N % N % N % N % N % N % N % N
Boys Obesity 2003b 16 35,043 15 94,932 15 69,330 20 96,182 22 82,043 17 80,700 22 143,052 13 93,933 14 58,370 2010 20 39,800 12 67,276 18 73,772 26 122,038 28 99,148 21 99,764 28 174,218 12 86,230 14 58,096 Overweight 2003b 15 34,324 16 101,729 13 57,245 15 71,734 13 48,788 12 56,092 14 92,146 17 119,613 15 65,439 2010 15 30,810 14 80,508 16 65,065 14 63,992 13 48,240 13 62,794 16 101,755 15 101,725 14 56,317 Girls Obesity 2003b 15 31,477 17 98,469 21 88,963 21 98,694 14 51,453 12 54,790 17 103,883 13 89,893 16 63,113 2010 24 44,256 24 128,999 28 112,628 24 107,125 18 60,488 15 67,335 14 88,655 15 97,043 16 61,707 Overweight 2003b 17 36,111 13 73,750 15 62,943 15 71,009 14 48,559 11 50,342 12 75,294 19 129,425 15 60,655 2010 15 28,437 14 73,642 16 64,272 15 68,124 15 52,511 14 63,878 15 89,168 14 92,683 13 51,027 Bases (weighted) Boys 2003 75 - 196 - 129 - 152 - 129 - 175 - 216 - 208 - 172 - Girls 2003 73 - 207 - 147 - 156 - 115 - 147 - 169 - 245 - 134 - Bases (unweighted)c Boys 2003 86 221.6 217 619.8 115 451.9 167 379.1 133 488.2 168 486.9 174 641.2 196 719.6 161 424.8 2010 - 202.7 - 570.7 - 419.6 - 359.2 - 461.6 - 477.4 - 633.5 - 697.5 - 409.3 Girls 2003 80 211.1 224 589.1 144 432.7 168 358.0 126 465.6 156 463.7 159 613.9 232 679.5 127 402.6 2010 - 187.2 - 543.3 - 406.8 - 344.9 - 439.5 - 461.2 - 613.1 - 662.0 - 390.8 a N represents the estimated number of people within each age group who are either overweight or obese b 2003 prevalence estimates presented are based on data weighted for non-response. The weighted bases for these estimates are also presented. c Population bases (n) are presented in thousands. For 2003, data from the 2003 mid population estimates have been used. For 2010, forecasted mid-year population estimates for 2010 have been applied. d Caution must be taken when interpreting trends and forecast predictions by Government Office Region. Changes in the way the data is presented and administrative changes to GOR boundaries mean the GOR categories are not
always directly comparable year on year as they do not always represent the identical geographic areas.

~0628871.doc 22/08/06 14:21 Last saved by:Jones
Table 22 Prevalence and number of children’s overweight and obese in 2003 and 2010, by physical activity levels and sex
Aged 2-15 2002, 2010 (predicted)
BMI Status Physical activity status and age group
Total aged 2-10 Total aged 2-15
Insufficiently active Active Insufficiently active Active
% Na % N % N % N
Boys Obesity 2002b 17 139,697 14 278,221 18 238,163 16 508,8252010 14 112,251 13 237,020 16 200,392 14 421,584Overweight 2002b 12 94,680 14 275,779 13 173,753 14 437,4952010 12 96,510 14 258,092 13 163,047 14 403,346 Girls Obesity 2002b 16 143,673 15 266,783 `18 302,008 16 413,0162010 13 114,779 13 220,505 16 246,290 14 335,801Overweight 2002b 14 126,587 12 221,389 14 232,671 14 355,9292010 13 111,113 13 213,931 14 213,642 13 333,437 Bases (weighted) Boys 2002 688 - 1657 - 1097 - 2615 -Girls 2002 764 - 1512 - 1395 - 2208 -Bases (unweighted)c Boys 2002 594 839.6 1426 1973.4 954 1343.5 2267 3133.32010 - 785.1 - 1892.1 - 1250.4 - 2981.1Girls 2002 645 904.9 1292 1774.6 1209 1659.8 1902 2601.72010 - 859.4 - 1700.3 - 1567.3 - 2481.3
a N represents the estimated number of people within each age group who are either overweight or obese b 2002 prevalence estimates presented are based on data weighted for selection bias. The weighted bases for these estimates are also presented. c Population bases (n) are presented in thousands. For 2002, data from the 2002 mid population estimates have been used. For 2010, forecasted mid-
year population estimates for 2010 have been applied.

~0628871.doc 22/08/06 14:21 Last saved by:Jones
Table 23 Prevalence and number of children overweight and obese in 2003 and 2010, by parental BMI
status and sex
Aged 2-15 2003, 2010 (predicted)
BMI Status Parental BMI and Age Group
Total aged 2-10 Total aged 2-15
No parent overweight/obese
One parent overweight/obese
Both parents overweight/obese
No parent overweight/obese
One parent overweight/obese
Both parents overweight/obese
% Na % N % N % N % N % N
Boys Obesity 2003b 5 11,835 13 224,616 25 178,337 6 21,649 17 448,941 24 311,3972010 7 21,598 15 250,912 32 219,563 6 22,691 18 472,050 34 415,844Overweight 2003b 12 30,481 14 253,689 23 165,140 10 40,475 14 394,325 22 278,0582010 12 35,593 13 217,844 21 143,736 10 37,245 14 369,464 19 237,396 Girls Obesity 2003b 4 10,701 12 201,181 22 149,500 4 16,945 16 400,774 27 313,6612010 7 18,108 20 328,215 26 172,400 6 26,886 24 588,107 29 320,727Overweight 2003b 9 22,862 11 187,495 17 121,770 9 40,917 13 324,808 18 217,0632010 6 16,273 14 225,962 14 94,341 8 36,114 14 355,801 16 175,585 Bases (weighted) Boys 2003 62 - 445 - 185 - 100 - 706 - 337 -Girls 2003 68 - 430 - 178 - 117 - 666 - 302 -Bases (unweighted)c Boys 2003 61 244.5 424 1792.1 184 728.8 99 391.8 675 2766.0 329 1284.42010 - 304.0 - 1678.8 - 694.3 - 374.3 - 2625.2 - 1232.0Girls 2003 66 270.3 423 1690.0 188 675.8 117 471.7 662 2603.2 313 1153.12010 - 257.7 - 1644.0 - 658.0 - 446.3 - 2497.3 - 1105.0
a N represents the estimated number of people within each age group who are either overweight or obese b 2003 prevalence estimates presented are based on data weighted for non-response. The weighted bases for these estimates are also presented. c Population bases (n) are presented in thousands. For 2003, data from the 2003 mid population estimates have been used. For 2010, forecasted mid-year
population estimates for 2010 have been applied.