Embed Size (px)
Citation preview

Foreign Bias in Institutional Portfolio Allocation:The Role of Social Trust
WOLFGANG DROBETZ, MARWIN MÖNKEMEYER,
IGNACIO REQUEJO AND HENNING SCHRÖDER‡
This Version: May 4, 2021
Abstract
We study the effects of social trust on international asset allocation. Using a comprehensive
international sample of institutionally managed portfolios from 86 countries, we show that
institutional investors from high-trust countries are less prone to foreign bias and exhibit
superior cross-country diversification. The results suggest that the informal institution of social
trust and formal institutions are substitutes in international portfolio decisions. Using events
of exogenous variation in information asymmetry, we find support for an information-based
explanation. Our findings have additional implications at the firm-level. Most importantly,
we observe a lower cost of equity for firms with more trusting investors.
JEL: G11, G14, G15, G23, Z1
Keywords: Trust, foreign bias, institutional investors, culture, information asymmetries,
portfolio diversification, cost of equity
‡Drobetz ([email protected]), Mönkemeyer ([email protected]), andSchröder ([email protected]) are from the University of Hamburg. Requejo ([email protected])is from the University of Salamanca. He acknowledges financial support from the Spanish Ministry of Scienceand Innovation and AEI (Grant PID2019-107546GA-I00), and he is grateful to the Junta de Castilla y León andthe European Regional Development Fund (Grant CLU-2019-03) for the financial support to the Research Unitof Excellence “Economic Management for Sustainability” (GECOS). Part of this research was completed whileRequejo was a DAAD (German Academic Exchange Service) Visiting Professor at the University of Hamburg.Mönkemeyer acknowledges financial support from the State of Hamburg Graduate Funding Program. We thankWolfgang Bessler, Simon Döring, Sadok El Ghoul, Omrane Guedhami, and Christian Nostiz for helpful comments.Any remaining errors are our own. Corresponding author: [email protected].
1 Introduction
Investor preference for domestic over foreign investments is well-documented in the literature
on international portfolio allocation (French and Poterba (1991)). As a result, investors often do
not take full advantage of the considerable benefits of international diversification, and may hold
far more domestic securities than would be predicted by the relative share of their home markets
in the world market portfolio. Empirical evidence suggests that the portfolios of both private and
institutional investors tend to exhibit a significant “home bias” (Coval and Moskowitz (1999),
Ahearne et al. (2004), Chan et al. (2005), Lau et al. (2010), Wei and Zhang (2020)).1
A wide range of studies have put forward possible explanations for the home bias. Older strands
of literature address barriers to foreign investments that deterred institutions from diversifying
abroad (Cole and Obstfeld (1991), Van Wincoop (1999), Martin and Rey (2004)) or interpret
domestic equity as a hedge against home-country specific risks (Cooper and Kaplanis (1994), Lewis
(1996), Fidora et al. (2007)). More recent studies introduce behavioral biases (Amonlirdviman
and Carvalho (2010), Ke et al. (2010), Morse and Shive (2011)) or emphasize the importance
of information asymmetries in explaining investors’ preference for domestic equity (Chan et al.
(2005), Van Nieuwerburgh and Veldkamp (2010), Wei and Zhang (2020)).
The propensity to invest in domestic securities also implies that foreign markets are relatively
underweighted in investor portfolios. This deviation from the optimal allocation in a particular
foreign market is known as “foreign bias”. Although home bias and foreign bias are closely related
from a theoretical point of view, they are not necessarily mutually dependent. In fact, they are
only weakly correlated empirically. An investor may assign an optimal weight to his home country
(and show no home bias), but at the same time under- or overweight a certain foreign country
(and exhibit a positive or negative foreign bias, respectively).
Compared to the home bias, however, the foreign bias has received much less attention in
the literature (Chan et al. (2005), Bekaert and Wang (2009), Beugelsdijk and Frijns (2010),
Vanpée and De Moor (2012), Niszczota (2014)). This is largely because of the lack of high-quality
cross-border holdings data. Analyzing investors’ portfolio choices from a foreign bias perspective
is important as it enables us to disentangle the influences of home and host country determinants
on international portfolio allocation. Our paper addresses this research gap by introducing a new
factor that explains the foreign bias phenomenon: social trust (or the lack thereof). Economists1Coeurdacier and Rey (2012), Cooper et al. (2013), and Ardalan (2019) provide surveys of the literature.
2

have long recognized that a major component of social capital, the level of social trust, is
important for economic success in society (Arrow (1972), Coleman (1990), Fukuyama (1995)).
Guiso et al. (2004) argue that financial transactions depend “[...] not only on the legal enforcement
of contracts, but also on the extent to which the financier trusts the financee” (p. 527). Provided
that investors from more trusting countries tend to be less concerned about expropriation by
managers, and are more likely to find them trustworthy (Guiso et al. (2008b), they should be
more willing to invest in foreign markets where they suffer from informational disadvantages. Our
argument appeals to the subjective component of individuals’ trusting behavior. We propose
that investors from high-social trust countries exhibit lower levels of foreign bias, despite facing
the same shareholder expropriation problems in their foreign target firms as peer investors from
low-social trust countries. Our results confirm this notion: Institutional investors from high-social
trust countries are less prone to underinvesting in foreign stocks.2
In particular, we use a comprehensive global sample of almost 10,000 institutional investors
from 86 countries over the 2000 to 2017 period. We examine the hypothesis that social trust can
be a partial solution to the problem of information asymmetry when it comes to investing in
foreign stocks. Our analysis rests on two conceptual assumptions. First, people apply the level of
trustworthiness of their own compatriots to people from other countries (Glaeser et al. (2002),
Guiso et al. (2011)). Second, when making investment decisions, investors rely more heavily on
information available to them if they lack social trust. Therefore, any portfolio allocation biases
that arise from informational advantages in domestic equity or equity from some foreign markets
(compared to all other foreign markets) should be even more pronounced in low-trust countries.
This hypothesis is consistent with Guiso et al.’s (2008b) reverse argument that more knowledge
can overcome the barriers created by lack of trust. Our main results confirm that higher social
trust renders information deficiencies less important for investment decisions abroad and can
reduce institutional investors’ foreign bias.
Exploiting the heterogeneity in our international data set, we further demonstrate that the effect
of the informal institution of social trust (North (1994), Williamson (2000)) on foreign bias in
international portfolio choice depends on the quality of the host country’s institutional framework.
The negative relation between social trust and foreign bias does not hold unconditionally, but is
most pronounced when a host country is characterized by a weak formal-institutional framework.
2Extensive robustness tests confirm that our empirical results are robust and remain qualitatively unchangedwhen we exclude the largest group of investors, U.S.-based institutions, from the sample.
3
The results suggest that social trust acts as a substitute for formal institutions at the country
level (Guiso et al. (2004), Pevzner et al. (2015)). We further assess the economic implications of
our empirical results. On the one hand, at the individual investor level, social trust facilitates
portfolio diversification of those individuals who put their money in the hands of (delegated)
institutional investors. On the other hand, at the firm level, social trust among a firm’s foreign
institutional investor base is associated with lower equity financing costs.
The paper most closely related to ours is Wei and Zhang (2020), who examine the effect of social
trust on local bias. Their analysis is also based on the assumption that social trust, information
asymmetry, and portfolio allocation are closely interrelated. They find that institutional investors
located in high-trust regions in the U.S. exhibit lower local bias. The negative relation between
social trust and local bias is stronger among investors that are better able to use local knowledge,
e.g., smaller investors, those with fewer holdings, and those with shorter holding horizons.
Moreover, high-trust investors benefit from greater portfolio diversification. However, we note
that Wei and Zhang’s (2020) innovative study analyzes U.S. states rather than countries, and
adopts a home bias framework.
Our study advances the limited research to date on institutional investors’ foreign bias. We
contribute to the literature on international portfolio allocation in four key ways. First, building
on Wei and Zhang’s (2020) analysis, we fill a research gap by expanding our empirical setup to a
global sample of institutional investors. We examine the hypothesis that social trust emerges as a
partial solution to the problem of information asymmetries when it comes to investing in foreign
stocks. Exploiting the considerable cross-country variations in social trust, we are able to run
powerful tests on its effect on international portfolio decisions. To ensure this relation is robust,
we control for institutional and political determinants, and isolate trust from cultural factors,
which are shown by Beugelsdijk and Frijns (2010) to affect foreign bias.
Second, by analyzing international portfolio choices from a foreign bias perspective, we can
not only explore how trust serves as a stand-alone determinant of investment behavior, but also
observe the interplay between trust and a host country’s institutional framework (La Porta et al.
(1998), Djankov et al. (2001, 2003)). In particular, we find that social trust, as an informal
institution, is a substitute for the quality of the host country’s formal-institutional framework.
Third, we extend studies that stress the importance of information asymmetries in explaining
investor preference for domestic equity and certain foreign stocks. Based on the idea that
4

information asymmetries increase during financial crises (as defined in Laeven and Valencia
(2020)), we confirm that trust plays a more important role in opaque information environments
(Guiso et al. (2008b), e.g., when information asymmetries on equity markets are high due to
market turbulence. Therefore, we provide empirical validity for an information-based explanation
of the relation between social trust and foreign bias.
Fourth, we contribute to the literature on the impact of social trust on economic outcomes in two
different but complementary ways. From an individual investor perspective, we adopt measures of
portfolio concentration from Choi et al. (2017) and show that social trust improves international
risk sharing. In particular, it helps individual investors who delegate portfolio allocation to
institutional managers achieve greater diversification across international markets. From a firm’s
perspective, we explore whether institutional investors’ target firms likewise benefit from a high
degree of social trust among their shareholders. To this aim, we apply the models of Claus
and Thomas (2001), Gebhardt et al. (2001), Easton (2004), and Ohlson and Juettner-Nauroth
(2005) to proxy for firms’ cost of equity capital. Recognizing the possibly endogenous nature of
the relation between social trust and the cost of equity capital, we adopt instrumental variable
and difference-in-differences approaches. We find that the level of trust among a firm’s foreign
shareholders is associated with a lower cost of equity capital.
The remainder of this paper is structured as follows: In Section 2, we review the literature
and develop our testable hypotheses. In Section 3, we introduce the measures of foreign bias and
social trust used in the subsequent analyses, and provide descriptive statistics of our international
sample. We document our main empirical results in Section 4, and present several robustness
tests in Section 5. Section 6 concludes.
2 Literature Review and Hypothesis Development
2.1 Explanations for Home and Foreign Bias
There is an established literature that offers possible explanations for home and foreign bias.
First, market frictions such as regulatory barriers, taxes, and transaction costs could constrain
cross-country portfolio allocation if the associated costs exceed the profits from international
diversification. While these barriers may contribute to the existence of the home and foreign bias
(Black (1974), Cole and Obstfeld (1991), Van Wincoop (1999), Michaelides (2003), Martin and
5

Rey (2004)), they seem to be of only secondary importance for explaining them (Coën (2001),
Glassman and Riddick (2001)). Most importantly, despite the ongoing globalization process and
the associated integration of international financial markets, which have made it easier to diversify
globally, the preference for domestic equity has been persistent. In other words, equity portfolios
remain severely home biased (Kho et al. (2009), Cooper et al. (2013), Ardalan (2019)).
A second line of research follows the notion that investors deliberately overweight their home
markets in order to hedge against home-country specific risks, such as inflation risk (Cooper and
Kaplanis (1994)), exchange rate risk (Fidora et al. (2007)), and non-tradable goods risk (Lewis
(1996)). However, these concepts have also been challenged on theoretical grounds (Uppal (1993),
Cooper and Kaplanis (1994)). For example, foreign equity, as compared to domestic equity, may
be better suited as a hedge against domestic risks in some circumstances, and therefore these
explanatory approaches may even facilitate home and foreign bias (Ardalan (2019)).
A third strand of literature provides behavioral-based explanations that address familiarity
(Ke et al. (2010)), culture (Beugelsdijk and Frijns (2010), beliefs (Epstein and Miao (2003)),
patriotism (Morse and Shive (2011)), ambiguity aversion (Uppal and Wang (2003)), and loss
aversion (Amonlirdviman and Carvalho (2010)). For example, most investors tend to be overly
optimistic about the future performance of domestic securities (Shiller et al. (1996), Strong and Xu
(2003), Solnik and Zuo (2017)). Conversely, they seem to hold biased risk perceptions regarding
unfamiliar host countries, and exaggerate the risk of investing abroad (Kho et al. (2009)).
Fourth, prior work refers to information asymmetry in a general sense (Coval and Moskowitz
(1999)), and information advantages in domestic securities in particular (Ahearne et al. (2004),
Van Nieuwerburgh and Veldkamp (2010)), to explain the preference for domestic equity. The
latter strand of literature is based on the notion that investors in different countries are endowed
with different information sets both on the stocks that they can incorporate to their portfolios
and on the abilities of the professional portfolio managers in which they can delegate investment
decisions (Gehrig (1993), Kang and Stulz (1997), Dziuda and Mondria (2012)). Investors are
better informed about the payoff distributions in their home markets vis-à-vis foreign markets,
which may induce them to overweight domestic equity, while discouraging them from investing
abroad (Ahearne et al. (2004), Chan et al. (2005), Van Nieuwerburgh and Veldkamp (2010)).
Because the removal of information shortfalls is associated with costs, Kang and Stulz (1997)
show that investors’ cross-border engagements are biased toward larger firms. Apart from firm
6
size, at a country-level, accounting and corporate governance rules play a critical role in providing
better information to foreign investors (Pagano et al. (2001), Ahearne et al. (2004), Hamberg et al.
(2013)). Additional related factors are a country’s economic development (Chan et al. (2005),
Ardalan (2019)), linguistic, and cultural differences (Grinblatt and Keloharju (2001), Beugelsdijk
and Frijns (2010), Karolyi et al. (2018)).
A challenge to the information asymmetry argument and its validity to explain investment biases
is that nowadays investors, and especially professional portfolio managers, have the possibility to
learn about foreign assets, given that it is similarly costly to analyze domestic and foreign markets
(Dziuda and Mondria (2012)). If this learning options were exploited, information asymmetries
would not sustain over time. However, as argued by Van Nieuwerburgh and Veldkamp (2009),
information immobility and the ensuing investment biases persist because investors choose to
specialize in assets in which they have an initial information advantage. That is, based on their
initial information endowment about specific assets, investors decide to learn more and hold more
of those assets, rather than gathering information on assets about which they have little knowledge.
This behavior is also partly incentivized by individual investors’ more precise assessment of the
abilities of funds that specialize in assets about which they know more (i.e., domestic assets),
thus making investments in these assets more attractive (Dziuda and Mondria (2012)). Therefore,
initial differences in information endowments across investors increase rather than decrease,
leading to large, long-lasting cross-country differences in portfolio allocations. Empirical studies
use foreign direct investments and trade flows as proxies for information endowments and confirm
that differences in initial endowment of information about different countries translate into
differences in stock portfolio holdings (Andrade and Chhaochharia (2010), Karolyi et al. (2020)).
2.2 Social Trust as a Determinant of Economic Outcomes
Guiso et al. (2006) define social capital as persistent and shared beliefs and values that help
a group overcome the free-rider problem in the pursuit of socially valuable activities. Beliefs
about an opponent’s behavior are a critical determinant of the willingness to cooperate with
others. If people believe others are unfair, they may also be reluctant to grant coordination and
decision power for fear of abuse. As Guiso et al. (2011) note, mistrust can discourage people’s
willingness to invest and hamper economic success. Therefore, social trust has attracted most
of the attention of economists interested in studying the economic effects of civic capital. This
7

literature is based on Arrow’s (1972) notion that “virtually every commercial transaction has
within itself an element of trust” (p. 357). Guiso et al. (2008a) define social trust as “the set of
beliefs and values that foster cooperation” (p. 296).3
A growing empirical literature identifies social trust as a determinant of economic outcomes
and corporate decisions in a variety of contexts.4 Social trust promotes trade and economic
growth (Knack and Keefer (1997), Whiteley (2000), Zak and Knack (2001), Guiso et al. (2009));
encourages financial development and investor participation in the stock market (Guiso et al.
(2004)); and facilitates venture capital investing (Bottazzi et al. (2016)), debt financing and public
debt contracting (Duarte et al. (2012), Hasan et al. (2017), Hagendorff et al. (2019), Brockman
et al. (2020)), public equity financing (Gupta et al. (2018)), cross-border mergers and acquisitions
(Ahern et al. (2015)), and firm performance (Krishnan et al. (2006), Lins et al. (2017)). Trust also
influences the size and organizational structure of firms (Bloom et al. (2012)), firms’ accounting
reporting quality (Garrett et al. (2014)), investors’ reaction to corporate earnings announcements
(Pevzner et al. (2015)), and government regulation (Aghion et al. (2010)). Overall, these studies
suggest that social trust is crucial to establishing credibility in contracting relationships.
As documented in Guiso et al. (2011), there is a strong correlation between social trust and
economic development for countries with very high per capita GDP, and almost no correlation at
low GDP levels. One explanation could be that trust is particularly useful in more sophisticated
transactions. As these authors put it, “[...] one can effectively run a sugar plantation without much
trust, while it is difficult to engage in financial transactions without it” (p. 455). This argument
is also consistent with Guiso et al.’s (2009) hypothesis that social trust between countries is more
important in the international trading of more differentiated goods. Therefore, analyzing the
relation between social trust and foreign bias in institutional investor portfolios provides a fruitful
research setting. This is even more relevant because the time horizon of equity investments is
finite, so it is more difficult for geographically distant investors to punish managers abroad for
misbehavior.
3It is important to distinguish between personalized trust and generalized (social) trust. The former is trust in aspecific individual; the latter is trust in a generic and unknown (randomly drawn) member of a broader community,such as other compatriots or people from other countries. As explained in Guiso et al. (2011), the right measure oftrust in empirical analyses is generalized or social trust, i.e., people need to trust strangers for institutions andmarkets to work properly.
4See Guiso et al. (2006, 2011) for literature reviews on the effect of social capital and trust on economic outcomes.
8

2.3 Hypothesis Development
2.3.1 Social Trust and Foreign Bias
Social trust lowers the costs of trust-sensitive transactions, i.e., economic interactions in which
parties rely on the future actions of others (Knack and Keefer (1997), Whiteley (2000)). This idea
supports our premise that trust will affect investment decisions, given that they are characterized
by the exchange of money for future promises and require a belief in repayment (Sapienza and
Zingales (2012)). Guiso et al. (2008b) develop a model of stock market participation in which they
measure social trust as “the percentage probability of being cheated ” (p. 2571). They conclude
that a lack of trust constitutes an investment barrier that can be overcome with the help of better
information. With better knowledge, investors should need to rely less on trust when interacting
in markets about which they feel poorly informed.
Assuming that investors possess better knowledge about domestic and certain foreign securities
(Gehrig (1993), Kang and Stulz (1997)) and that they decide to specialize in assets about which
they possess an information advantage (Van Nieuwerburgh and Veldkamp (2009)), Guiso et al.’s
(2008b) line of reasoning should also have implications for international portfolio allocation. On
the one hand, investors from low-social trust countries are expected to invest predominantly
in stocks where the lack of trust is counteracted by sufficient information, which is more likely
to be the case in their home markets or in “close” foreign markets, be it geographically and/or
culturally among other possible dimensions (e.g., a German investor should have good knowledge
of Austrian securities for historical and geographical reasons, while a British investor is expected
to be more familiar with the Australian stock market due to cultural and historical links). On the
other hand, when investors are poorly informed about some segments of the global stock market,
as is likely the case for “more distant” foreign stock markets (e.g., most south-east Asian emerging
economies are likely less well-known for European investors based in Mediterranean countries like
Italy or Spain), higher levels of trust are necessary to compensate for information shortfalls.
In fact, information asymmetries should not only occur between home and foreign markets, but
also when talking about different foreign markets. The information and learning advantages of
investors shape their information endowment about individual markets and translate into great
differences in how much each investor knows about different foreign markets that are potential
targets (Gehrig (1993), Brennan and Cao (1997), Kang and Stulz (1997), Van Nieuwerburgh
9

and Veldkamp (2010)). Therefore, we emphasize that social trust not only helps to understand
differences in home bias, but it is equally useful to explain observable variations in foreign bias,
i.e., the systematic over- and underweightings across countries. In the model proposed by Van
Nieuwerburgh and Veldkamp (2009), investors face a choice in deciding about which assets to
acquire information when there are multiple risky assets in the investment opportunity set. Facing
information processing constraints, the model predicts that investors with an initial information
endowment and a learning budget exert more effort in acquiring additional information about
domestic assets, where they likely have a comparative advantage in learning, and thus have a
tendency to invest at home. Similarly, investors might also prefer to invest in foreign markets
where they have an initial information endowment, e.g., as proxied by foreign direct investments or
trade flows between the two countries (Andrade and Chhaochharia (2010), Karolyi et al. (2020)),
and avoid other foreign markets.
In our setup, this rationale might imply that investors from countries with low social trust favor
foreign assets with which they are more familiar, increasing foreign bias due to overweighting of
specific foreign assets. In contrast, independent of their initial information endowment, investors
from countries with high social trust should be more willing to invest in any kind of foreign
asset, leading to portfolio weightings closer to the optimum. Accordingly, trust not only affects
the comparison between domestic versus foreign assets (home bias), but it is also likely to have
implications for the comparison between different foreign assets (foreign bias). For example,
low-trust institutions may concentrate their foreign investments in host countries about which
they have accumulated relatively more information in the past, while high-trust institutions
might be more willing to invest in any foreign country because their higher level of trust renders
information deficiencies less important.
Pevzner et al. (2015) argue that the effect of trust on investors’ reaction to firms’ information
disclosure could also work indirectly through its influence on managerial behavior (i.e., by reducing
managers’ incentives to engage in shareholder expropriation). Such an indirect effect is quite
unlikely in our context because we analyze cross-border equity investments, involving countries
(and investors) with differing levels of social trust. Therefore, our framework is different from
those in earlier studies (including Pevzner et al. (2015)). We recognize that the level of social trust
in an investor’s home country has little or no effect on the agency incentives of managers in target
firms abroad, which in turn depend on the level of social trust in the particular host country.
10

Our argument is not that social trust relates to managerial behavior, but that investors from
more trusting countries will be less concerned about the potential for moral hazard, and more
likely to believe that managers are trustworthy (Guiso et al. (2008b)). An implicit assumption
is that investors transfer the level of trustworthiness of their own compatriots to managers of
host country firms (Glaeser et al. (2002), Guiso et al. (2011)). In other words, although investors
from two countries with different levels of social trust face the same level of expropriation threat
when investing in the same foreign country, investors from a high-social trust country are likely
to construct their portfolios of foreign stocks less influenced by how much information they have
about them and thus exhibit a lower foreign bias than those from a low-social trust country.
To summarize, if investors are informationally disadvantaged in a particular foreign market,
social trust helps reduce investment barriers and increase investment in this country’s foreign
equity. Social trust has a direct effect on investors’ portfolio choices, independent of its relation
with managerial behavior, thereby mitigating any foreign bias. This leads to our first hypothesis:
Hypothesis 1: The higher the level of social trust in an investor’s country
of domicile, the lower the investor’s foreign bias.
Economic theory suggests that the negative relation between social trust and foreign bias could
vary with country characteristics. Studies in the trust literature have shown that the informal
institution of social trust and formal institutions are substitutes (Guiso et al. (2004), Carlin
et al. (2009), Aghion et al. (2010), Pevzner et al. (2015)).5 A growing body of empirical evidence
suggests that social trust is of particular importance where formal institutions are less effective.
For example, Yu et al. (2015) analyze bilateral trade patterns among European countries, and
find that the positive effect of trust on trade is dependent on the quality of the rule of law.
Abdelsalam et al. (2020) examine the impact of major shareholders’ trust on firm market risk in
a global sample. They show that the negative relation between trust and risk is more pronounced
for firms in countries with a lack of well-functioning institutions. Using a sample of non-U.S.
firms, Brockman et al. (2020) document that the inverse relationship between Yankee bond debt
5Carlin et al. (2009) and Aghion et al. (2010) analyze how trust and local institutions evolve in equilibrium in asociety and focus on the feedback effects between the two concepts. One interpretation of these findings is thattrust cannot be directly compared across countries without accounting for the development of legal rules andinstitutions that have evolved together with trust over time. In our framework, we go a step further and propose asubstitution effect between social trust and (a lack of) formal-institutional framework.
11
covenants and social trust is more pronounced for firms in countries with weak formal institutional
frameworks, as well as for those with poor corporate governance and greater information opacity.
In our setup, we expect that a better institutional environment will make it easier to assess the
risks of investing in a particular foreign country. This should diminish investors’ reliance on trust.
Specifically, a better legal framework would attenuate the beneficial role of trust in overcoming
information-based barriers to investing in a foreign country. Therefore, and in line with Guiso
et al. (2008b), the negative relation between social trust and foreign bias does not necessarily
hold unconditionally, but it should be strongest in host countries characterized by poor quality
institutions.
Following the literature that proposes a substitution effect between social trust and the
formal-institutional framework in different contexts, we formally test our next hypothesis:
Hypothesis 2: The weaker the formal institutions in the host country,
the stronger the trust-related reduction in foreign bias.
We further extend our analysis by exploring exogenous variations in information asymmetry,
i.e., whether it moderates the relation between social trust and foreign bias. As a corollary to our
main hypotheses, and again based on Guiso et al.’s (2008b) reasoning, we conjecture that the
effect of social trust on foreign bias is strongest during times of crisis (when uncertainty is higher
and the knowledge gap between domestic and foreign equity markets should be most pronounced).
Two recent strands of literature support our information-based explanation. On the one hand,
uncertainty is strongly countercyclical. Bloom (2009) links most uncertainty periods to negative
political, social, and economic shocks. Both Bloom (2014) and Baker et al. (2016) document that
uncertainty about the distribution of stock market returns, as measured by implied volatility, is
highest during plunging stock markets. Related research finds that macroeconomic forecasts are
noisier, forecasters are less confident, and forecasts are more optimistic than actual outcomes
during recessionary periods (Bachmann and Bayer (2014), Bloom (2014), Jurado et al. (2015)).
Similar patterns are observed at the micro level. For example, Campbell et al. (2001) document
that volatility in industry- and firm-level stock returns increases during recessions. On the other
hand, there is empirical evidence in the law and finance literature that poor economic prospects
12

result in more shareholder expropriation because it becomes more difficult for shareholders to
fulfill their monitoring roles (Johnson et al. (2000a), Johnson et al. (2000b)).
Based on these arguments, we test whether the reduction in foreign bias attributable to social
trust is strongest during times of financial crisis (using crisis data from the Laeven and Valencia
(2020) database). Our third hypothesis is:
Hypothesis 3: The trust-related reduction in foreign bias is strongest
during times of financial crisis.
2.3.2 Economic Implications of Social Trust
Next, we turn to the economic implications of our main findings. As elaborated on in Cooper
et al. (2013), a lower home bias should improve international risk sharing and welfare. Therefore,
a first implication of our results is that higher social trust should improve portfolio diversification
for individual investors who invest through (delegated) institutional investors, e.g., in mutual
funds or pension funds. In contrast, institutional investors from low-social trust countries avoid
foreign stocks, about which they have insufficient knowledge. Therefore, plan sponsors and
ultimate beneficiaries are less likely to hold and benefit from internationally diversified portfolios.
The economic gains that arise from better international diversification will be shared between
institutions and their investors depending on the competitive structure of the investment industry.
Calvet et al. (2007) observe that Swedish individual investors enjoy an above-average degree of
diversification because popular Swedish investment funds exhibit high international allocation.
Bekaert et al. (2017) document that the fraction of international funds available in 401(k) plans
constitutes an important determinant of individual investors’ international portfolio diversification.
Most closely related to our analysis, Wei and Zhang (2020) provide direct support for the role
of social trust in portfolio diversification. They proxy for diversification using idiosyncratic
portfolio volatility, as well as a Herfindahl concentration measure, and show that high-trust U.S.
investors are better diversified across individual stocks. However, this observation alone does
not allow for more general conclusions about cross-country diversification, because investors may
only be diversifying through home-country stocks. In our setting, we expect social trust to help
accomplish greater international diversification in institutional investors’ portfolios. This leads to
our fourth hypothesis:
13

Hypothesis 4: The higher an investor’s level of social trust, the greater
the investor’s international portfolio diversification.
From a corporate finance perspective, a second important economic consequence of our analysis
relates to the implications social trust may have for firms’ cost of capital. To the extent that
higher social trust leads investors to reduce foreign bias, a standard risk sharing argument suggests
that firms with higher holding-weighted trust scores among their foreign investors will benefit
from a lower cost of equity capital. International asset pricing assumes either fully segmented or
fully integrated equity markets when using the CAPM to estimate the cost of equity capital (Stulz
(1999)). The fully segmented version implies that a stock’s beta should be measured against the
home equity index, while the fully integrated version proposes it should be measured against
the global index. The existence of a home and foreign bias, however, suggests that neither of
these scenarios constitutes reality (Harvey (1995), Bekaert and Harvey (1995)). Therefore, it
is important to examine the information in both types of beta in order to estimate the cost of
equity capital. With a greater portion of international investors, a firm’s assets will become more
sensitive to world events. As a result, local pricing will almost always imply a higher expected
return than global pricing.6
A growing line of research in the finance and international business literature examines how
foreign institutional investors shape corporate governance and policies (Aggarwal et al. (2009),
Aggarwal et al. (2011), Aguilera et al. (2017), Albuquerque et al. (2019), and Döring et al. (2021),
among others). These studies suggest that foreign investors export their home-country governance
practices into their host countries. As explained earlier, there are reasons to believe that foreign
investors have incentives for active monitoring and engagement, because they are less familiar
with domestic firms and their political and socioeconomic environment (Kang and Stulz (1997),
Ferreira et al. (2017)). Moreover, they are less likely to have business relationships with the
firms in which they invest, and, as a result, are more independent of firm management (Gillan
and Starks (2003), Davis and Kim (2007)). Firms have an incentive to acquiesce to information
demands from their foreign investors, e.g., by increasing the quantity and quality of financial
disclosure (Lel (2019), Kim et al. (2019)), because an improved information environment will
help them broaden their investor base and lower their cost of capital (Lambert et al. (2007)).
6However, Harris et al. (2003) conclude that the choice between domestic and world CAPM may not be practicallyimportant for estimating the cost of equity of many large U.S. firms.
14
Gupta et al. (2018) find that investors’ trust in management constitutes an important determi-
nant of target firms’ cost of equity financing. They observe an inverse relation between the cost of
equity and the level of social trust in a firm’s country of domicile. Their setup and argument differ
from ours in that trust represents a form of monitoring by society, i.e., high-trust environments
enhance the penalties for managerial misbehavior, and thus reduce the likelihood of managers
taking self-interested actions. In contrast, in our international framework, the relation between
trust within a firm’s foreign shareholders and its cost of equity is a result of improvements in
international risk sharing and welfare, as well as the special role and incentive structure of foreign
institutional investors in general. Taken together, our final hypothesis is:
Hypothesis 5: The higher the level of social trust within a firm’s foreign
shareholders, the lower the cost of equity capital.
3 Sample and Descriptive Statistics
3.1 Foreign Bias
We obtain data on international institutional equity holdings from the FactSet (LionShares)
database. For the sake of consistency in the cross-section of investors, we aggregate holdings
data at the institution-year level because both the reporting frequency (monthly to annually)
and granularity (institution-level vs. fund-level) vary across countries. In aggregating the data
from fund-level to the institution-level, we follow Ferreira and Matos (2008) and Ke et al. (2010),
and use the last holdings observation of a fund in a given year. We only consider holdings in
common and preferred stock.7 Security prices and firm-level information come from Compustat.
Local currencies are converted to 2010 constant U.S. dollars.
We note that there are different specifications of foreign bias measures commonly used in the
literature. So we follow Bekaert and Wang (2009) and Choi et al. (2017) and define our investor-
7We apply this restriction for three reasons: 1) These two issue types account for more than 94% of equityholdings’ total value in the database, 2) some issue types by nature cannot be assigned to a single country (e.g.,international exchange-traded funds), and 3) some issue types may involve misleading assumptions about theirtrue domicile, e.g., when an investment bank with U.S. headquarters issues certificates with Volkswagen AGas the underlying stock, or in the case of American Depositary Receipts (ADRs). ADRs are traded on a stockexchange on behalf of a share. These certificates are issued by American banks that have taken the underlyingstock into custody. In our setup, Volkswagen ADRs would be classified as a U.S. investment. Economically moremeaningful, however, is to classify them as a German investment because Volkswagen is headquartered in Germany.To ensure this decision does not affect our results, we perform robustness checks. Our results do not change whenwe re-estimate the main regression model using either all stock types or ordinary shares only.
15
level measure of institutional foreign bias as the difference between a country-specific optimal
benchmark less the actual portfolio weight allocated to a certain target country.8 In determining
the theoretically optimal benchmark weights, we assume a world CAPM, i.e., investors weight a
host country as per that country’s share of world market capitalization.9
Formally, following Chan et al. (2005, 2009), Bekaert and Wang (2009), Beugelsdijk and Frijns
(2010), and Choi et al. (2017), we calculate the weights for each investor-country-year combination
in our sample as:
w∗j,t =
MV∗j,t∑
i MV∗i,t
(1)
wk,i,j,t =MVk,i,j,t∑j MVk,i,j,t
, (2)
where MV∗j,t is the equity market capitalization of target country j at time t;
∑iMV∗
i,t is the
world equity market portfolio at time t; MVk,i,j,t is the market value of equity holdings in target
country j for investor k from home country i at time t; and∑
jMVk,i,j,t is the market value of
total equity holdings for investor k from country i at time t. Therefore, the foreign bias measure
(FBIASk,j,t) for investor k toward host country j at the end of year t is calculated as:
FBIASk,j,t = w∗j,t − wk,i,j,t for i 6= j, (3)
whereby the investor’s home country is defined, in line with Coval and Moskowitz (1999) and
Schumacher (2018), as the location of the institution’s corporate headquarters instead of its
country of incorporation.10 To calculate country-level market capitalization benchmark weights,
we rely on the entire Compustat stock universe, and aggregate the market value of all available
8Our baseline results remain qualitatively unchanged when we apply alternative bias measures, for example, theChan et al. (2005, 2009) measure, where foreign bias is defined as the logarithm of the ratio of the actual portfolioweight to the benchmark weight.
9Note that our foreign bias measure is defined inversely, i.e., a positive value of the foreign bias measure indicatesan underweighting of foreign equities in the institutional investor’s portfolio. Levy and Levy (2014) observe anincrease in the average correlations between international markets from 0.4 in the 1990s to 0.9 in 2010. Since thebenefits of international diversification have declined dramatically, it is not obvious that market values still reflectthe optimal level of foreign diversification. One could repeat all our analyses using alternative benchmarks, suchas the optimal country-level weights postulated by the classical Markowitz (1952) mean-variance portfolio modelinstead of the world CAPM. See Mishra (2015) for a detailed overview of alternative benchmarks.10This approach avoids overweighting offshore locations (e.g., the Cayman Islands), because the country ofincorporation is often chosen only due to preferential tax treatments or legislative environments and not dueto operational reasons (Coval and Moskowitz (1999), Schumacher (2018)). Furthermore, it seems economicallymeaningful given that the location of the headquarters identifies the location where portfolio decisions are taken(Schumacher (2018)).
16

shares (defined as the product of the closing price and the number of shares outstanding) for
each country as of the end of December.11 Consistent with our approach to determining home
countries at an investor level, we use companies’ historical headquarters locations to define their
domestic equity markets (He et al. (2019)). Because we only consider common and preferred
stock when calculating actual portfolio weights, we likewise restrict our sample to these types of
securities when calculating the benchmark weights.12
Next, we address concerns that global equity market capitalizations calculated via Compustat
might be affected by survivorship bias (Kothari et al. (1995)). To this end, we compare our values
for the country-level and global equity market capitalizations calculated from the Compustat secu-
rities files with the publicly available World Development Indicators provided by the World Bank.
These values have been used by prior studies to proxy for global equity market capitalizations
(Lau et al. (2010)). The comparison reveals minor deviations in only a few cases.13 Therefore, we
believe our results do not depend on the source of the equity market capitalization data.
3.2 Social Trust
The core variable of our analysis is social trust. We obtain data on social trust at the country
level from the Integrated Values Surveys (IVS) 1981-2014 database, which includes data from the
World Values Survey (WVS) and the European Values Study (EVS).14 To increase coverage, we
complement these data with the seventh (2020) WVS wave and the fifth (2017) EVS wave. Both
the WVS and the EVS have been extensively used in the literature (Alesina and Giuliano (2011),
Bloom et al. (2012), Pevzner et al. (2015), Wei and Zhang (2020)). For each sample country i, we
calculate the trust measure (Social Trusti,t) at year-end t as the percentage of survey participants
answering “Most people can be trusted ” to the question “Generally speaking, would you say that
most people can be trusted or that you need to be very careful in dealing with people? ” We follow
11Compustat claims to cover 90% of the world’s total market capitalization, including 95% of the European andTaiwanese market capitalization and 90% of Asian market capitalization.12We choose this approach for several reasons: 1) These two issue types account for more than 92% of the totalsample market capitalization, 2) it avoids double counting, such as, e.g., in the case of ADRs, 3) some issue typescannot be assigned to a country by their nature, and 4) some issue types involve misleading assumptions regardingtheir true domiciles.13These deviations likely occur because the World Bank does not exclusively consider ordinary and preferredshares, nor does it use headquarters locations for country classifications.14The IVS database was constructed by the World Values Survey Association and covers all six waves (1981-2014)of the World Values Survey Official Aggregate as well as the first four waves (1981-2008) of the European ValuesStudy Longitudinal Data File. WVS and EVS are large-scale, cross-national panel survey research programsthat cover a wide range of human values. The data were collected in face-to-face interviews and are based onrepresentative samples of the resident adult population of each country. Guiso et al. (2011) conclude that thissurvey-based measure of trust is the most promising indicator.
17

Wei and Zhang (2020) and use linear interpolation to estimate any missing values between data
points.
Inglehart et al. (2000) note that some demographic groups tend to be overrepresented (e.g., city
dwellers) or underrepresented (e.g., the illiterate population) in the survey samples. Therefore, we
apply weights to correct for deviations from national population parameters when constructing
our measure of country-level trust. Since both the WVS and the EVS include the original weights
reported by the participant countries in their datasets, we do not count each respondent record as
one case, but treat it as one times its corresponding weighting factor cases instead.15 Weighted
samples aim to ensure representative coverage of religions, gender, and cultural groups. However,
higher-status groups may still lack representativeness (Inglehart et al. (2000)). Given that both
the WVS and the EVS draw from different survey samples, we avoid combining observations
when constructing the country-level trust time series. Instead, we adhere to the data source that
provides the largest number of annual observations per country, allowing us to maximize data
coverage for social trust within our sample period.
3.3 Cost of Equity Estimates
To examine whether trusting shareholders lower the cost of equity capital, we construct a
measure of the implied cost of equity capital and another measure that captures the degree of
trust within a firm’s shareholder base. We follow the recent literature (Hail and Leuz (2006),
El Ghoul et al. (2011), El Ghoul et al. (2018), Gupta et al. (2018)), and proxy for a firm’s cost
of equity capital as implied by analysts’ earnings forecasts and stock prices using four models.
Following El Ghoul et al. (2018), we construct the measure of the implied cost of equity capital
(Cost of Equityf,t) ten months after the end of the fiscal year. This value is the average predicted
by the residual income valuation models of Claus and Thomas (2001) and Gebhardt et al. (2001),
and the abnormal growth models of Easton (2004) and Ohlson and Juettner-Nauroth (2005). We
provide an overview of the assumptions of the four models and state their valuation equations in
Table A3 in the appendix.
15Suppose 10% of a country’s population is illiterate (target sample), but only 5% of the survey respondents arefound to be illiterate (actual sample). To adjust for the misrepresentation of the illiterate population in the actualsample, a weighting factor of 2 (= 0.1/0.05) is provided. To obtain country-level representative trust measures ofthe target sample, we do not count each illiterate survey respondent as only one case, but as two.
18
To capture the level of trust within a firm’s shareholder base in our cost of equity analyses,
we calculate the holding-weighted residual trust score among all foreign institutional investors
of a firm (Foreign Shareholders’ Trustf,t). We exclude domestic shareholders to ensure that the
effect of shareholder trust on the cost of equity capital is not affected by the level of social trust
embedded in the society of the firm’s country of headquarters.
3.4 Control Variables
Next, we collect a comprehensive set of control variables. An overview of all the variables,
together with detailed construction principles and data sources, is in Table A1 in the appendix.
Recognizing that the quality of institutional, political, and cultural frameworks has been shown
to affect international investment choice (Chan et al. (2005), Beugelsdijk and Frijns (2010)), we
incorporate associated control variables into our dataset. Institutional variables come from La
Porta et al. (1998) and Djankov et al. (2001, 2003), and comprise a country’s law and order
tradition (Law and Orderi), the integrity of its legal system (Judicial Integrityi), the transparency
of its accounting standards (Accounting Standardsi), the risk of forced nationalization or outright
confiscation (Expropriation Riski), the efficiency of its judicial system (Judicial Efficiencyi), and
a dummy variable indicating the presence of a civil law system (Legal System Dummyi). Political
variables come from Caldara and Iacoviello (2019), and include a newspaper-based measure of
global geopolitical risk (Geopolitical Riski,t), as well as a measure of a country’s perceived level
of public sector corruption (Corruptioni,t). Our variables on a country’s cultural environment
comprise Hofstede’s (2001) cultural dimensions (Power Distancei, Individualismi, Masculinityi,
Uncertainty Avoidancei, Long-term Orientationi, and Indulgencei).
The level of familiarity between investor country and host country has also been shown to
affect institutional foreign bias (Chan et al. (2005), Bekaert and Wang (2009), Beugelsdijk and
Frijns (2010)). Therefore, we incorporate a set of bilateral country-level familiarity variables from
the Center for Research and Expertise on the World Economy into our model. They comprise the
distance between the capitals of two countries in kilometers (Geographic Distancei,j), and dummy
variables indicating whether two countries share a common official language (Common Language
Dummyi,j), are contiguous (Contiguity Dummyi,j), ever had a colonial link (Colony Dummyi,j),
and are now or were for a long period of time the same state or the same administrative entity
(Same Country Dummyi,j).
19
Following Wei and Zhang (2020), we further add a set of time-varying investor characteristics
from our holdings data. We use the natural logarithm of the dollar amount of investor portfolio
holdings to proxy for investor size (Investor Sizek,t), the number of years since the investment
entity was founded to proxy for investor expertise (Investor Agek,t), and the number of stocks
held in the investor portfolio to proxy for the degree of diversification (Number of Stocksk,t).
Against the background of our international approach, we note it is conceivable that, due
to differences in country-level characteristics, some host countries may be more attractive to
investors than others. Therefore, we take relative attractiveness of a target country into account,
and include a measure of the relative size of the stock market (Stock Market Developmentj,t)
in our baseline regression model. This measure is based on Compustat and World Bank data
(Chan et al. (2005), Bekaert and Wang (2009)). We also include a proxy for restrictions on foreign
capital transactions (Capital Controlsj,t) based on the Economic Freedom index of The Heritage
Foundation (Chan et al. (2005), Beugelsdijk and Frijns (2010)). Following Wei and Zhang (2020),
we further incorporate data on the host countries’ Gross Domestic Product per Capita (GDP per
Capitaj,t), taken from the World Bank, to proxy for economic development. Finally, as in Mishra
(2008) and Bekaert and Wang (2009), we include data on the number of internet users (Internet
Availabilityj,t) to proxy for information asymmetries and information costs. This is important,
because a host country’s internet availability eases access to financial information, which foreign
investors can use for investment decisions.
Following Beugelsdijk and Frijns (2010), we also control for the host country’s equity market
risk and return characteristics. We proxy for these by using the one-year lagged return of the
host country’s annual average stock market index (Stock Market Returnj,t) and the five-year
rolling variance of the host country’s annual average stock market returns (Stock Market Riskj,t),
respectively. To account for diversification benefits between the equity markets of the investor and
target country, we include the five-year rolling average of a country pair’s correlations of annual
average stock market returns (Diversification Potentiali,j,t). We compute these three controls
based on Bloomberg data (accessed via the World Bank Global Financial Development Database).
Finally, following El Ghoul et al. (2018) and Döring et al. (2021), in our cost of equity analyses
we use control variables that we believe are associated with the cost of equity financing and the level
of residual trust prevalent in a firm’s country of domicile. Time-varying control variables at the
country level comprise the efficiency of the stock market (Stock Market Efficiencyj,t), calculated
20
based on World Bank data, and the realized inflation rate over the next year (Inflationj,t),
calculated based on I/B/E/S and Compustat data. Time varying firm-level controls are based on
I/B/E/S, Compustat, and FactSet data, and comprise a measure of the volatility of stock returns
over the prior twelve months (Stock Return Volatilityf,t), the firm’s market value to book value of
equity (Market to Bookf,t), leverage ratio (Leveragef,t), size (Firm Sizef,t), a measure of the signed
forecast error (Signed Forecast Errorf,t), a measure of the dispersion of analyst forecasts (Analyst
Forecasts Dispersionf,t), the percentage of the firm’s equity capital held by institutional investors
(Institutional Ownershipf,t), and the firm’s capital intensity (Capital Intensityf,t). Because we
observe some apparent reporting errors in the firm-level variables drawn from Compustat, we
winsorize all of them at the 1% and 99% levels to limit outlier effects.
3.5 Descriptive Statistics
3.5.1 Investor-level Portfolio Statistics
To offer a first overview of our sample, and to better understand the investment preferences of
our institutional investors, Table I provides investor-level portfolio statistics. It presents average
investor-level equity allocations (in percentage points) for the top fifteen investor domiciles and
their investments in the top twenty target countries. The row “Other ” shows the weighted averages
for the remaining countries not listed in the table. Our final panel covers 9,811 distinct institutional
investors from 86 different countries, and it comprises 74,567 investor-year observations for which
our measure of trust is available. U.S. institutions account for the largest share, at 63.11% (6,192).
The investors from our sample allocate equity to 118 different host countries, which allows us
to analyze a comprehensive three-dimensional panel dataset consisting of more than five million
investor-target-year observations. Non-shaded fields indicate foreign investments (i 6= j), while
shaded fields indicate domestic investments (i=j), that by definition are not captured by the
foreign bias measure (see Equation (3)). To better understand the cross-sectional distribution
of foreign equity allocations, we report both the average foreign biases across all countries in
the portfolios of investors k from varying home countries i (home-country perspective), and the
average foreign biases across all investors k in our sample with respect to various host countries j
(host-country perspective). A positive value of ØFBIASk,i,t indicates that investors from domicile i,
21

on average, underweight equities across all foreign countries, while a positive value of ØFBIASk,j,t
implies that target country j is underweighted in the average global investor portfolio.16
We observe a strong preference for domestic investments across all investor domiciles. U.S.-based
investors, for example, allocate an average of 93.22% to their domestic equity market (see shaded
cell in column “USA”). The relative share of the country in the world portfolio averages only
37.40% over our sample period (not shown in Table I). This preference for domestic investments
also implies that U.S.-domiciled investors, on average, underweight foreign equity markets, leading
to an average investor-level foreign bias across all host countries of 0.53% over our sample period
(see the value of ØFBIASk,i,t in column “USA”). We note that the average investor in each of
our sample countries exhibits significant levels of foreign bias (with the exception of investors
from Luxembourg). This finding is not implausible, given that Luxembourg’s specific legislative
environment is likely to attract the headquarters of international institutional investors, who in
turn invest more internationally.
[ INSERT TABLE I ABOUT HERE ]
Taking the target-country perspective, and focusing on our measure of foreign bias as specified
in Equation (3), we find that investors are generally underweighted in foreign markets. Institutions
are underweighted in the U.S. as the target country throughout all domiciles (see non-shaded cells
in the first row). However, we also observe some exceptions, e.g., Hong Kong-domiciled investors
allocate 34.02% of their equity holdings to China and investors from Spain allocate 11.07% to the
French market.17 We recognize that each country in our sample, with the exception of Ireland
(not shown in Table I), is underweighted in the average portfolio of foreign investors (see values of
ØFBIASk,j,t). This is attributable to the fact that investors have incentives to invest in Ireland
due to its favorable tax treatment.
3.5.2 Trust Across Sample Countries
Our main variable of interest is national social trust. Trust shows considerable variation in the
cross-section of countries. To provide an overview of the distribution of the trust variable in our
sample, we present country-level boxplot diagrams of social trust across the top fifty investor
16In our empirical analyses, we focus only on the host-country perspective of investor-level foreign bias. Theaverage foreign bias from the home-country perspective serves only for better understanding of the cross-sectionaldistribution of foreign equity investments.17The relative shares of China and France in the world portfolio are 6.94% and 3.88%, on average, over our sampleperiod, respectively.
22
domiciles in Figure I. The vertical red line in a box denotes the median value, and the box’s left
and right edges denotes the 25th and 75th percentiles, respectively. Whiskers indicate variability
outside the upper and lower quartiles.
[ INSERT FIGURE I ABOUT HERE ]
Trust values in our sample range from 3.17% for the Philippines (not shown in Figure I) to
77.42% for Denmark. We use the heterogeneity of trust across countries with different cultural
and political frameworks. We analyze not only the impact of trust as an independent determinant
of investment behavior, but also the interplay between trust and other country-level factors that
have been shown to affect institutional investment biases (Chan et al. (2005)).
3.5.3 Summary Statistics
Table II provides summary statistics of the variables used in our subsequent analyses. Panel A
reports summary statistics of investor-level variables, which refer to investor k at time t. Panel B
reports summary statistics of country-level variables, which refer to either investor country i or
target country j at time t. Panel C reports summary statistics for bilateral variables on country
pairs. Bilateral country-level variables refer to both investor country i and target country j at
time t. Finally, Panel D shows summary statistics of firm-level variables, which refer to a specific
firm at time t. Because the data show no special features, we do not comment on them further for
the sake of brevity. A detailed overview of data sources and construction principles is in Table A1
in the appendix.
[ INSERT TABLE II ABOUT HERE ]
4 Empirical Results
Our main premise is that social trust is negatively related to institutional investors’ foreign
bias. To establish a causal inference on the effect of trust on foreign bias in an ideal experiment,
we would randomly assign values of trust to investors in our sample, and observe whether there
are differences in foreign bias among low and high-trust investors. Unfortunately, implementing
such an experiment with random treatment and control groups is impossible, and is a frequent
limitation in international business research (Reeb et al. (2012)). Nevertheless, in our multivariate
23

regression analyses, we attempt to isolate the relation between trust and foreign bias from
unobserved confounders, allowing us to make meaningful inferences about the treatment effect of
social trust.
4.1 Interaction of Trust, Culture, and Formal Institutions
One legitimate concern is that the relation between trust and foreign bias could be affected
by endogeneity. In our setting, endogeneity is likely to result from correlations between the
explanatory variables included in our regression models and the unobserved factors captured by
the error term. In particular, social trust may be associated with the prevailing cultural, political,
and institutional frameworks in the investor’s country of domicile. A country’s level of trust may
arise, e.g., as a consequence of an efficient judicial system. To address this possibility, and to
observe the interplay between trust and its aforementioned potential determinants, we calculate
country-level pairwise correlation coefficients.
As column (1) of Table III shows, our measure of social trust is significantly associated with a
country’s cultural, political, and institutional frameworks. We note that variables representing
formal institutions are defined negatively, i.e., a low score represents a favorable outcome for an
investor (and vice versa).18 For example, we observe significant negative correlations between
social trust and formal institutions such as the efficiency and integrity of a country’s legal
environment or the risk of expropriation. Defined as the percentage probability of being cheated
(Guiso et al. (2008b)), social trust embedded in a country’s society is likely to be determined by
both of these country-level variables. It is reasonable to assume that effective law enforcement
and stable ownership structures will limit the potential for being cheated.
[ INSERT TABLE III ABOUT HERE ]
Moreover, we observe statistically significant negative correlation coefficients for Hofstede’s
(2001) cultural dimensions, e.g., for masculinity and individualism. Societies characterized by
masculine values are competitive and focus on material success, while those characterized by
feminine values promote interpersonal relationships. It is plausible that the latter countries
achieve higher values of social trust. Similarly, collectivist countries that strongly emphasize
community goals are likely to promote trust among their members. Conversely, members of
18For example, a high score of Accounting Standardsi, indicates a low degree of transparency of the informationavailable to investors.
24

individualist societies pursue personal goals and are likely to hinder the development of high
levels of social trust, resulting in the observed negative correlation coefficients.
To address this source of endogeneity, and to isolate trust from related dimensions, we adopt
the following procedure in all our tests. First, we regress trust as a dependent variable on
our measures of institutional, political, and cultural frameworks. We tabulate the first-stage
regression estimates in Table A2 in the appendix. Second, we replace actual trust values with
the residuals from the first step, and include residual trust (Residual Trusti,t) instead of social
trust in our regression analyses. This approach not only mitigates the risk of endogeneity due to
omitted variables, but it also ensures that our results are not driven by the possibility that trust
is capturing the effects of other country-level formal and informal institutions.
4.2 Baseline Results
We perform multivariate regression analyses to examine the association between social trust and
institutional foreign bias at the investor level. We regress foreign bias (FBIASk,j,t) on the measure
of social trust we isolate from related dimensions (Residual Trusti,t), as explained in Section 4.1.
Although we already control for country-level dimensions via the construction of our residual
trust measure, our regression approach may not fully account for the omission of other important
variables. Therefore, we again incorporate all control variables introduced in Section 3.4 into our
model. To further allay any concerns about endogeneity from omitted variables that are correlated
with both residual trust and foreign bias, we exploit the panel structure of our dataset and test
different fixed effects specifications. In addition, we cluster heteroscedasticity-robust standard
errors at the investor level. More formally, to test hypothesis 1, we estimate the following baseline
regression model:
FBIASk,j,t = α0 + α1Residual Trusti,t + α2Investor Sizek,t + α3Investor Agek,t
+ α4Number of Stocksk,t + α5Stock Market Developmentj,t + α6Capital Controlsj,t
+ α7GDP per Capitaj,t + α8Internet Availabilityj,t + α9Stock Market Returnj,t
+ α10Stock Market Riskj,t + α11Diversification Potentiali,j,t
+ year, investor, target, and investor× target fixed effects+ εk,i,j,t. (4)
We present the regression estimates in Table IV. By adding year fixed effects and target country
fixed effects to all of our models, we isolate the influence of aggregate time series trends, and
25

control for all time-constant characteristics of the host country (target fixed effect). In the first
three specifications (see columns (1) to (3) of Table IV), we further control for all time-constant
differences among investor types (column (1)), for all persistent geographic characteristics of the
investor’s home country (column (2)), and for all time-constant characteristics of the investor
(column (3)) via investor-type fixed effects, domicile fixed effects, and investor fixed effects,
respectively. Subsequently, we control further for their combinations with target country fixed
effects (see columns (4) to (6) of Table IV). In our most conservative regression model (see column
(6), hereinafter referred to as the baseline specification), where we add investor × target fixed
effects, we control for all time-constant characteristics within investor-host country pairs, i.e., we
explain changes within a particular investors’ foreign bias toward a specific host country.19
[ INSERT TABLE IV ABOUT HERE ]
The estimated coefficient on residual trust is negative and statistically significant throughout all
specifications, indicating that investors domiciled in high-trust countries exhibit significantly lower
foreign bias. These results are not attributable to investor characteristics, the investor’s familiarity
with the host country, the attractiveness of the target country, or the risk and return profile.
Moreover, compared to specifications (1) to (5), we note a substantial increase in the explanatory
power of the baseline model (R2 = 0.7078), where we apply our most conservative specification
of fixed effects and control for all time-constant characteristics within investor-host pairs. The
estimated trust coefficient of −0.0142 implies that a 1-standard deviation increase in our trust
measure reduces foreign bias by 10.33% relative to the sample mean (= −0.0142× 0.0502/0.0069,
where 0.0069 is the sample mean of FBIASk,j,t). Overall, these results confirm hypothesis 1,
suggesting that the negative effect of trust on foreign bias is not only highly statistically significant
but also economically relevant.
4.3 Social Trust as a Substitute for Formal Institutions
Next, we test hypothesis 2, and disentangle whether the effect of social trust on institutional
investors’ foreign bias is conditional on target countries’ institutional quality (i.e., stronger if host-
country institutions are weak). We re-run the baseline regression model and add the interaction
effects between investor-country residual trust and the quality of the host-country institutional
19We note that the control variables on familiarity between countries are omitted in regression specifications (5)and (6) because they are time-invariant and perfectly collinear with the domicile × target fixed effects and theinvestor × target fixed effects, respectively.
26
framework (using the same variables applied for the construction of our investor-country residual
trust measure). To enable a straightforward interpretation of the interaction effects, we define
the institutional variables so that a low value represents a good outcome (and vice versa). We
normalize these variables to range from 0 to 1 in order to allow for comparisons of the interaction
effects. The results of the tests of the hypothesized substitution effect are presented in Table V.
Throughout all specifications, we observe that the stand-alone trust effect is no longer significant,
but that the interaction terms capture the negative effects at the 1% level of statistical significance.
This finding has two implications for the interplay between the informal institution of social trust
and formal-legal institutions, which we illustrate using the law and order tradition as an example
(see column (1) of Table V). If the host country provides poor institutional quality (i.e., if Law
and Orderj approaches a value of 1), the trust-related reduction in foreign bias is determined by
the magnitude of the interaction effect of −0.0672. However, if host-country institutional quality
is high (i.e., if Law and Orderj approaches 0), there is no effect of social trust on foreign bias due
to the lack of statistical significance of the stand-alone trust coefficient.
[ INSERT TABLE V ABOUT HERE ]
Our standardization process eases the interpretation of the interaction effects. Focusing on
investments in the host country with the weakest tradition of law and order in our sample (i.e.,
Law and OrderSri Lanka = 1), we observe that a 1-standard deviation (0.3234) increase in the
law and order tradition reduces foreign bias by more than twice the sample mean (−0.0672×
0.3234/0.0095 = −2.2951, where 0.0095 is the sample mean of Law and Orderj).20 We also
compare the standardized interaction estimates for the different dimensions of the host-country
formal institutional framework. We find that trust is of particular importance in countries
where shareholders are exposed to higher risk of expropriation. The estimated coefficient on
Expropriation Riskj of −0.0803 implies that a 1-standard deviation increase in the risk of
expropriation reduces foreign bias by almost three times the sample mean (−2.7449 = −0.0803×
0.3233/0.0095). In contrast, poor accounting standards enhance the trust effect considerably less,
as the coefficient estimate on Accounting Standardsj of −0.0457 results in a standardized factor
of only −0.8798 (= −0.0457× 0.2119/0.0110).
20No analogous statement about the countries with the best law and order tradition in our sample is possible(e.g., Law and OrderUnited States = 0), because the stand-alone trust coefficient is not statistically significant.
27

Overall, our tests support hypothesis 2, corroborating that trust does not reduce foreign bias
per se, but only when target countries are characterized by weak formal institutions. Observing
that the negative effect of social trust on foreign bias is conditional on the host country’s quality
of formal institutional framework, we conclude that investor trust and host-country formal
institutions substitute for each other in international portfolio allocation.
4.4 The Role of Information Asymmetries
To verify the moderating role of information asymmetries, we rely on crisis events to capture
exogenous variations in information asymmetry. We test whether the trust-related reduction
in foreign bias is strongest during times of financial crisis by drawing data from the Laeven
and Valencia (2020) database. It contains country-specific crisis dummies as well as continuous
measures for the severity of crisis events. The Crisis Dummyj,t variable indicates whether a
banking crisis was present in the host country at a given year, while the Crisis Output Lossj,t
variable captures relative output losses associated with crisis episodes. Both variables identify
opaque information environments, when the knowledge gap in domestic vis-à-vis foreign equity
markets is most pronounced. To test hypothesis 3, we re-estimate our baseline specification
(specified in Equation (4)), adding interaction effects between residual trust and the variables
related to host country crisis events. The results are in Table VI.
[ INSERT TABLE VI ABOUT HERE ]
We observe negative coefficient estimates at the 1% significance level for our stand-alone
measure of social trust, as well as for the interaction terms with the two information asymmetry
proxies. Focusing on the Residual Trusti,t × Crisis Dummyj,t interaction coefficient estimate
of −0.0130 (see column (1)), the magnitude of the trust effect increases on average by 31.78%
(= −0.0130/(−0.0279 − 0.0130)) in years where the host country’s equity market was hit by
a crisis. Furthermore, the Residual Trusti,t × Crisis Output Lossj,t coefficient of −0.0263 (see
column (2)) implies that the trust-related reduction in foreign bias almost doubles in magnitude
when measured output losses due to crisis events reach maximum levels.
Overall, our findings support hypothesis 3 and indicate that the effect of trust on foreign bias
is particularly pronounced during crisis times, i.e., when information asymmetries on the foreign
equity markets are high. This result provides additional support for our more general notion
28

that investors from countries with higher levels of social trust require less information to make
investment decisions. They therefore exhibit a higher propensity to invest in foreign markets.
4.5 Effect on Diversification
One immediate implication of our findings should be that a lower home bias, as a result of
higher social trust, improves portfolio diversification and international risk sharing. To confirm
that more trusting investor portfolios benefit from an internationally diversified portfolio, and to
test hypothesis 4, we adopt two measures of portfolio concentration with respect to host countries
from Choi et al. (2017). Global concentration is defined as half the sum of an investor’s absolute
values of the deviations from the optimal benchmark weights (as defined by Equation (2) and
Equation (3)) across all countries in our sample, including the investor’s country of domicile. In
contrast, and similar to the measure of foreign bias (as defined by Equation (3)), the measure of
foreign concentration does not take into account the investor’s home country. Therefore, foreign
concentration corresponds to half the sum of an investor’s absolute values of foreign biases across
all possible target markets. More formally, our measures of global and foreign concentration that
indicate the percentage of an investor’s portfolio to be reallocated to achieve full diversification
across global or foreign markets, are as follows:
Global Concentrationk,t =
∑j |w∗
j,t − wk,i,j,t|2
(5)
Foreign Concentrationk,t =
∑j |FBIASk,j,t|
2. (6)
Next, we regress both measures as dependent variables on residual trust and on the control
variables at the investor and country levels specified in Equation (4). We add year and investor
fixed effects and cluster heteroscedasticity-robust standard errors at the investor level. We estimate
the following model, where Concentrationk,t indicates either global or foreign concentration:
Concentrationk,t = β0 + β1Residual Trusti,t + β2Investor Sizek,t + β3Investor Agek,t
+ β4Number of Stocksk,t + β5Stock Market Developmenti,t
+ β6Capital Controlsi,t + β7GDP per Capitai,t + β8Internet Availabilityi,t
+ β9Stock Market Returni,t + β10Stock Market Riski,t
+ year and investor fixed effects+ εk,i,t. (7)
29

We present the regression results in Table VII. The estimated trust coefficients for both global
(column (1)) and foreign (column (2)) concentration are negative and statistically significant at
the 1% level. We conclude that, in support of hypothesis 4, social trust helps accomplish greater
international diversification in institutional investors’ portfolios.
[ INSERT TABLE VII ABOUT HERE ]
4.6 Effect on the Cost of Equity
In a final step, we take a corporate finance perspective, and analyze whether social trust affects
firms’ cost of equity. As developed in hypothesis 5, we expect that the documented improvements
in international risk sharing, as well as the special role of foreign institutional investors, will lead
to a reduction in firms’ cost of equity capital. To test this hypothesis, we regress our measure of
a firm’s implied cost of equity capital (Cost of Equityf,t) on foreign shareholders’ trust (Foreign
Shareholders’ Trustf,t) and on the full set of control variables. We exploit the panel structure of
our dataset, and include year fixed effects to isolate the influence of aggregate time series trends
and firm fixed effects in order to control for time-constant firm characteristics. Following El Ghoul
et al. (2018), we cluster heteroscedasticity-robust standard errors at the firm level. Formally, we
estimate the following model:
Cost of Equityf,t = γ0 + γ1Foreign Shareholders’ Trustf,t + γ2Residual Trustj,t
+ γ3GDP per Capitaj,t + γ4Stock Market Efficiencyj,t + γ5Inflationj,t
+ γ6Stock Return Volatilityf,t + γ7Market to Bookf,t + γ8Leveragef,t
+ γ9Firm Sizef,t + γ10Signed Forecast Errorf,t
+ γ11Analyst Forecasts Dispersionf,t + γ12Institutional Ownershipf,t
+ γ13Capital Intensityf,t + year and firm fixed effects+ εf,j,t (8)
The regression result is in column (1) of Table VIII. The estimated coefficient on foreign
shareholders’ trust is negative and statistically significant at the 1% level, indicating that firms
whose foreign shareholders are predominantly domiciled in high-trust countries have significantly
lower costs of equity capital. This finding confirms hypothesis 5. We further emphasize that this
is not driven by the level of social trust prevalent in a firm’s country of domicile. In line with
30
Gupta et al. (2018), we also observe negative and statistically significant estimates for that (see
Residual Trustj,t coefficient in column (1) of Table VIII).
[ INSERT TABLE VIII ABOUT HERE ]
However, endogeneity is an important potential concern in our analysis. It may affect the
interpretation of the causal relation between foreign shareholders’ trust and the implied cost of
equity capital. We interpret our finding as evidence that the level of social trust among investors
influences firms’ cost of capital. However, an alternative interpretation is that causality may
run the other way. In this case, if firms with high costs of equity are more likely to attract
low-trust than high-trust investors, we should similarly observe a negative relation between foreign
shareholders’ trust and the cost of equity capital.
To account for this reverse causality explanation, we next perform a two stage least squares
(2SLS) estimation and a difference-in-differences analysis. The results are in columns (2)-(3) and
column (4) of Table VIII, respectively. Following El Ghoul et al. (2018), in our 2SLS regression,
we use lagged values of a firm’s foreign shareholders’ trust (Foreign Shareholders’ Trustf,t−1) and
lagged values of its industry mean (Foreign Shareholders’ Industry Trustf,t−1) as instruments.
If foreign shareholders’ trust is path-dependent, we expect past foreign shareholders’ trust to
affect their contemporaneous trust. Moreover, it is likely that firm-level ownership structures, in
particular, the level of trusting foreign investors, are related to industry-level ownership structures.
Because lagged values of foreign shareholders’ trust are predetermined, i.e., they have already
been set before the contemporaneous firm’s cost of equity capital is determined, our instruments
are unlikely to directly affect concurrent firm-level cost of equity capital.
Following Aggarwal et al. (2011), El Ghoul et al. (2018) and Driss et al. (2020), we conduct
a series of tests to assess the robustness of our instrumental variables. The results are at the
bottom of Table VIII. Our instrumental variables must be highly correlated with the potentially
endogenous regressor (i.e., Foreign Shareholders’ Trustf,t), but uncorrelated with the unobservable
error term. To test whether our instrumental variables are weak, we implement Pearson correlation
tests, an F-test, and the Kleibergen-Paap rk LM test. The Pearson correlation tests reveal high
correlations between foreign shareholders’ trust and the two instruments. The null hypothesis of
the F-test, which states that a model containing both instrumental variables fits the data equally
as well as a model without them, is strongly rejected. With a value of 21.42, the F-statistic is well
above the recommended threshold of 10 (see Stock et al. (2002)), indicating that our instruments
31
are not weak and meet the relevance condition from a statistical point of view. To further check
for relevance, we perform a Kleibergen–Paap rk LM test, and find that the chi-square test statistic
strongly rejects the null hypothesis that the model is underidentified. To test for the exogeneity
of our instruments, we perform a Sargan test of overidentifying restrictions, and present robust
and firm-level clustered chi-square statistics. With a p-value of 0.2142, the Sargan test indicates
that our instrumental variables are valid, i.e., uncorrelated with the error term.
Overall, the results of these specification tests confirm that our regression model is well identified
and our instrumental variables are appropriate. Most importantly, as can be inferred from column
(3) of Table VIII, we continue to find negative coefficient estimates for instrumented foreign
shareholders’ trust, statistically significant at the 1% level. This result from the 2SLS estimation
also supports hypothesis 5.
To further address endogeneity concerns, and to identify the causal effect of foreign shareholders’
trust on the cost of equity capital, we perform a difference-in-differences test. During times of
financial turmoil, we expect predominantly foreign investors who lack sufficient trust to withdraw
from firms, with the result that the remaining foreign investors will exhibit higher average levels
of social trust. Based on this conjecture, we use the global financial mortgage crisis of 2007-2009
as a source of exogenous variation in foreign shareholders’ trust to study its impact on the firms’
cost of equity capital. Accordingly, our Treatment Dummyt variable takes a value of 1 during the
three years of the global financial crisis (2007-2009), and 0 for the three years prior to the crisis
(2004-2006).
Next, we categorize treatment and control groups to include firms that experience a strong
(top tercile) or weak (bottom tercile) increase in foreign shareholders’ trust during the crisis years,
respectively. Based on this tercile classification, we define a Treated Dummyf variable, which
takes a value of either 1 (treatment) or 0 (control). Our difference-in-differences estimator is thus
given by the interaction of the two dummy variables (Treatment Dummyt × Treated Dummyf).
We again incorporate our set of control variables, including both year and firm fixed effects, and
cluster heteroscedasticity-robust standard errors at the firm level. The difference-in-differences
estimator captures the difference in the implied cost of equity prior to and during the increase in
foreign shareholders’ trust between treatment and control groups. Formally, to provide further
support for hypothesis 5, we estimate the following difference-in-differences regression model with
32
our cost of equity measure as the dependent variable:
Cost of Equityf,t = δ0 + δ1Treatment Dummyt × Treated Dummyj + δ2Residual Trustj,t
+ δ3GDP per Capitaj,t + δ4Stock Market Efficiencyj,t + δ5Inflationj,t
+ δ6Stock Return Volatilityf,t + δ7Market to Bookf,t + δ8Leveragef,t
+ δ9Firm Sizef,t + δ10Signed Forecast Errorf,t
+ δ11Analyst Forecasts Dispersionf,t + δ12Institutional Ownershipf,t
+ δ13Capital Intensityf,t + year and firm fixed effects+ εf,j,t (9)
The results are in Table VIII.21 The estimated interaction coefficient of interest is negative and
statistically significant at the 5% level (column (4)). The model in Equation (9) already controls
for trends common to and time-invariant differences between the treatment and control groups
by including time and firm fixed effects, respectively. Therefore, the difference-in-differences
interaction coefficient (δ1) estimate captures the variation that remains after differencing out.
Most importantly, we still find evidence in support of hypothesis 5, arguing that an increase in
the level of social trust among a firm’s foreign shareholders lowers its cost of equity capital.
5 Robustness Tests
5.1 Measurement of Trust and Sample Composition
To alleviate concerns about our sample composition and the measurement of our trust variable,
we provide additional robustness tests in Table A4 in the appendix. To ensure our results are
not driven by the process of isolating trust from the related institutional, political, and cultural
frameworks described in Section 4.1, we re-estimate the baseline specification (see column (6)
of Table IV) applying the original measure of (non-residual) trust (Social Trusti,t) instead of
residual trust. The social trust coefficient estimate remains stable and statistically significant at
the 1% level, as shown in column (1) of Table A4 in the appendix. We conclude that our results
are not driven by the process of isolating social trust from related dimensions.
In our previous analysis, we used data on social trust from the WVS and the EVS, with
linear interpolation to estimate missing values between two data points. This is considered a
21We emphasize that our measure of foreign shareholders’ trust captures the holding-weighted trust scores amonga firm’s foreign investors. Because the analysis here focuses on firm-level rather than investor-level results, oursample size decreases compared to our foreign bias analyses in Tables IV-VI.
33

standard procedure in the measurement of trust (Wei and Zhang (2020)). However, despite the
fact that both WVS and EVS have been used frequently in the extant literature (Alesina and
Giuliano (2011), Bloom et al. (2012), Pevzner et al. (2015), Wei and Zhang (2020)), the surveys
were only conducted every five to seven years. To mitigate concerns over noise caused by long
interpolation periods, and considering that the majority of institutional investors in our sample
are U.S.-headquartered, we employ the General Social Survey (GSS) as a third source of trust.
The GSS is a representative survey conducted approximately every two years. It uses identical
question framing as the WVS and the EVS. However, its scheme of possible responses is not
binary, as there exists a third response option (“Depends”). We apply the same methodology as
before for calculating values of U.S. country-level trust. We re-estimate our baseline regression,
but use trust scores obtained from the GSS instead of the WVS for U.S.-domiciled investors. Our
results, reported in column (2) of Table A4 in the appendix, remain qualitatively unchanged, and
the estimated coefficient on the trust variable even increases slightly (in absolute terms). Overall,
we conclude that our main findings are robust to alternative sources and measures of social trust.
Next, we limit our sample to investors not resident in the U.S. to ensure that the trust-
related reduction in foreign bias is not driven by U.S. investors alone. We re-estimate the baseline
regression and present the results in column (3) of Table A4. Similar in magnitude when compared
to the full-sample estimate obtained in the baseline regression, we observe a standardized trust-
related reduction in foreign bias of 8.61% (= −0.0066× 0.0688/0.0053). Despite the markedly
reduced sample size, the coefficient estimate is statistically significant at the 5% level, which
indicates that the link between trust and foreign bias remains valid in an international framework
(i.e., it is not driven solely by U.S. domiciled investors).
5.2 Alternative Cost of Equity Capital Estimates
To examine whether the results of our cost of equity analyses are robust to alternative cost
of equity capital estimates, we use modified model specifications. Because we rely on analysts’
earnings forecasts to estimate the cost of equity capital, there may be concerns that analyst
forecast sluggishness is leading to biased estimates of the cost of capital (Hail and Leuz (2006)).
To tackle this concern, we follow Hail and Leuz (2006) and El Ghoul et al. (2018). We re-estimate
the cost of equity while applying the average of the four model estimates as of seven months
after the fiscal year (CoE 7mf,t) and four months after the fiscal year (CoE 4mf,t), instead of as
of ten months after the fiscal year. The results are in columns (1) and (2) of Table A5 in the
34

appendix. They show that the significant negative relation between foreign shareholders’ trust
and the cost of equity capital continues to hold and even increases slightly (compared to column
(1) in Table VIII).
As outlined in Table A3 in the appendix, the four models that we use in this study to proxy for
the implied cost of equity capital are based on a number of assumptions about earnings growth
rates. Because estimates of the cost of equity are sensitive to the underlying assumptions (Easton
et al. (2002)), we re-estimate the cost of equity financing, but use alternative growth rates. In
particular, we again follow Hail and Leuz (2006) and El Ghoul et al. (2018), and use alternative
growth assumptions. The first posits that long-term earnings growth is fixed at 3% (CoE 3pf,t).
The second posits that the perpetual growth rate equals the annual real GDP growth rate plus the
long-run inflation rate (CoE GDPf,t) when computing the cost of equity implied by the Claus and
Thomas (2001) and Ohlson and Juettner-Nauroth (2005) models.22 The results are in columns
(3) and (4) of Table A5 in the appendix. In each specification, we observe that the significant
negative relation between foreign shareholder trust and the cost of equity capital continues to
hold, i.e., trusting investors reduce the firm’s cost of equity.
6 Conclusion
In this study, we investigate the role of social trust in the equity allocations of 9,811 institutional
investors from 86 countries over the 2000-2017 period. An important feature of our data is the
extensive cross-sectional variation in the measure of social trust, allowing reliable estimates of
the effects of social trust on foreign bias in international portfolio allocation.
Our empirical analyses reveal several important findings. First, a higher level of social trust
in an investor’s country of domicile significantly reduces foreign bias in institutionally managed
portfolios. Second, the informal institution of social trust does not reduce foreign bias per se,
but only in connection with host-countries that are characterized by weak formal-institutional
frameworks. Our results thus suggest that social trust, as an informal institution, and the
quality of the host country’s formal-institutional framework, are substitutes in international
portfolio allocation. Third, using events of exogenous variation in information asymmetry, we
find support for an information-based explanation. More precisely, investors from countries with
higher levels of social trust require less information when making decisions, and they thus exhibit
22In our main analyses, we follow El Ghoul et al. (2018) and assume that the perpetual growth rate equals thefuture inflation rate when estimating the cost of equity implied by the models of Claus and Thomas (2001) andOhlson and Juettner-Nauroth (2005).
35

a higher propensity to invest in foreign markets. Fourth, our analyses provide important economic
implications: Higher social trust leads to better international risk sharing for individual investors
who delegate portfolio allocation decisions to institutional investors. In addition, higher social
trust generates welfare benefits in the form of a lower cost of equity capital for firms with a
larger portion of trusting foreign institutional investors in their shareholder base. Taken together,
our findings strongly suggest that social trust mitigates inefficiencies in cross-border portfolio
allocation created by information asymmetries.
36

References
Abdelsalam, O., A. Chantziaras, J. Batten, and A. Aysan, 2020, Major shareholders’ trust
and market risk: Substituting weak institutions with trust, Journal of Corporate Finance,
Forthcoming.
Aggarwal, R., I. Erel, M. Ferreira, and P. Matos, 2011, Does governance travel around the world?
Evidence from institutional investors, Journal of Financial Economics 100, 154–181.
Aggarwal, R., I. Erel, R. Stulz, and R. Williamson, 2009, Differences in governance practices
between U.S. and foreign firms: Measurement, causes, and consequences, Review of Financial
Studies 22, 3131–3169.
Aghion, P., Y. Algan, P. Cahuc, and A. Shleifer, 2010, Regulation and distrust, Quarterly Journal
of Economics 125, 1015–1049.
Aguilera, R., K. Desender, M. Lamy, and J. Lee, 2017, The governance impact of a changing
investor landscape, Journal of International Business Studies 48, 195–221.
Ahearne, A., W. Griever, and F. Warnock, 2004, Information costs and home bias: An analysis
of U.S. holdings of foreign equities, Journal of International Economics 62, 313–336.
Ahern, K., D. Daminelli, and C. Fracassi, 2015, Lost in translation? The effect of cultural values
on mergers around the world, Journal of Financial Economics 117, 165–189.
Albuquerque, R., L. Brandão-Marques, M. Ferreira, and P. Matos, 2019, International corporate
governance spillovers: Evidence from cross-border mergers and acquisitions, Review of Financial
Studies 32, 738–770.
Alesina, A., and P. Giuliano, 2011, Family ties and political participation, Journal of the European
Economic Association 9, 817–839.
Amonlirdviman, K., and C. Carvalho, 2010, Loss aversion, asymmetric market comovements, and
the home bias, Journal of International Money and Finance 29, 1303–1320.
Andrade, S., and V. Chhaochharia, 2010, Information immobility and foreign portfolio investment,
Review of Financial Studies 23, 2429–2463.
Ardalan, K., 2019, Equity home bias: A review essay, Journal of Economic Surveys 33, 949–967.
Arrow, K., 1972, Gifts and exchanges, Philosophy and Public Affairs 1, 343–362.
37

Bachmann, R., and C. Bayer, 2014, Investment dispersion and the business cycle, American
Economic Review 104, 1392–1416.
Baker, S., N. Bloom, and S. Davis, 2016, Measuring economic policy uncertainty, Quarterly
Journal of Economics 131, 1593–1636.
Bekaert, G., and C. Harvey, 1995, Time-varying world market integration, Journal of Finance 50,
403–444.
Bekaert, G., K. Hoyem, W. Hu, and E. Ravina, 2017, Who is internationally diversified? Evidence
from the 401 (k) plans of 296 firms, Journal of Financial Economics 124, 86–112.
Bekaert, G., and S. Wang, 2009, Home bias revisited, Working paper, Columbia Business School.
Beugelsdijk, S., and B. Frijns, 2010, A cultural explanation of the foreign bias in international
asset allocation, Journal of Banking and Finance 34, 2121–2131.
Black, F., 1974, International capital market equilibrium with investment barriers, Journal of
Financial Economics 1, 337–352.
Bloom, N., 2009, The impact of uncertainty shocks, Econometrica 77, 623–685.
Bloom, N., 2014, Fluctuations in uncertainty, Journal of Economic Perspectives 28, 153–76.
Bloom, N., R. Sadun, and J. Van Reenen, 2012, The organization of firms across countries,
Quarterly Journal of Economics 127, 1663–1705.
Bottazzi, L., M. Da Rin, and T. Hellmann, 2016, The importance of trust for investment: Evidence
from venture capital, Review of Financial Studies 29, 2283–2318.
Brennan, M., and H. Cao, 1997, International portfolio investment flows, Journal of Finance 52,
1851–1880.
Brockman, P., S. El Ghoul, O. Guedhami, and Y. Zheng, 2020, Does social trust affect international
contracting? Evidence from foreign bond covenants, Journal of International Business Studies
1–34.
Caldara, D., and M. Iacoviello, 2019, Measuring geopolitical risk, Working paper, Federal Reserve.
Calvet, L., J. Campbell, and P. Sodini, 2007, Down or out: Assessing the welfare costs of household
investment mistakes, Journal of Political Economy 115, 707–747.
38
Campbell, J., M. Lettau, M. Malkiel, and Y. Xu, 2001, Have individual stocks become more
volatile? An empirical exploration of idiosyncratic risk, Journal of Finance 56, 1–43.
Carlin, B., F. Dorobantu, and S. Viswanathan, 2009, Public trust, the law, and financial
investment, Journal of Financial Economics 92, 321–341.
Chan, K., V. Covrig, and L. Ng, 2005, What determines the domestic bias and foreign bias?
Evidence from mutual fund equity allocations worldwide, Journal of Finance 60, 1495–1534.
Chan, K., V. Covrig, and L. Ng, 2009, Does home bias affect firm value? Evidence from holdings
of mutual funds worldwide, Journal of International Economics 78, 230–241.
Choi, N., M. Fedenia, H. Skiba, and T. Sokolyk, 2017, Portfolio concentration and performance
of institutional investors worldwide, Journal of Financial Economics 123, 189–208.
Claus, J., and J. Thomas, 2001, Equity premia as low as three percent? Evidence from analysts’
earnings forecasts for domestic and international stock markets, Journal of Finance 56, 1629–
1666.
Coeurdacier, N., and H. Rey, 2012, Home bias in open economy financial macroeconomics, Journal
of Economic Literature 51, 64–115.
Cole, H., and M. Obstfeld, 1991, Commodity trade and international risk sharing: How much do
financial markets matter?, Journal of Monetary Economics 28, 3–24.
Coleman, J., 1990, Home bias in open economy financial macroeconomics, Journal of Economic
Literature 94, 64–115.
Cooper, I., and E. Kaplanis, 1994, Home bias in equity portfolios, inflation hedging, and
international capital market equilibrium, Review of Financial Studies 7, 45–60.
Cooper, I., P. Sercu, and R. Vanpée, 2013, The equity home bias puzzle: A survey, Foundations
and Trends in Finance 7.
Coval, J., and T. Moskowitz, 1999, Home bias at home: Local equity preference in domestic
portfolios, Journal of Finance 54, 2045–2073.
Coën, A., 2001, Home bias and international capital asset pricing model with human capital,
Journal of Multinational Financial Management 11, 497–513.
39
Davis, G., and E. Kim, 2007, Business ties and proxy voting by mutual funds, Journal of Financial
Economics 85, 552–570.
Djankov, S., R. La Porta, F. Lopez-de-Silanes, and A. Shleifer, 2003, Courts, Quarterly Journal
of Economics 118, 453–517.
Djankov, S., R. La Porta, F. Lopez-de-Silanes, and F. Shleifer, 2001, Legal structure and judicial
efficiency: The lex mundi project, Working paper, World Bank, Harvard University, and Yale
University.
Driss, H., W. Drobetz, S. El Ghoul, and O. Guedhami, 2020, Institutional investment horizons,
corporate governance, and credit ratings: International evidence, Journal of Corporate Finance,
Forthcoming.
Duarte, J., S. Siegel, and L. Young, 2012, Trust and credit: The role of appearance in peer-to-peer
lending, Review of Financial Studies 25, 2455–2484.
Dziuda, W., and J. Mondria, 2012, Asymmetric information, portfolio managers, and home bias,
Review of Financial Studies 25, 2109–2154.
Döring, S., W. Drobetz, S. El Ghoul, O. Guedhami, and H. Schröder, 2021, Institutional investment
horizons and firm valuation around the world, Journal of International Business Studies 52,
212–244.
Easton, P., 2004, PE ratios, PEG ratios, and estimating the implied expected rate of return on
equity capital, Accounting Review 79, 73–95.
Easton, P., G. Taylor, P. Shroff, and T. Sougiannis, 2002, Using forecasts of earnings to simulta-
neously estimate growth and the rate of return on equity investment, Journal of Accounting
Research 40, 657–676.
El Ghoul, S., O. Guedhami, H. Kim, and K. Park, 2018, Corporate environmental responsibility
and the cost of capital: International evidence, Journal of Business Ethics 149, 335–361.
El Ghoul, S., O. Guedhami, C. Kwok, and D. Mishra, 2011, Does corporate social responsibility
affect the cost of capital?, Journal of Banking and Finance 35, 2388–2406.
Epstein, L., and J. Miao, 2003, A two-person dynamic equilibrium under ambiguity, Journal of
Economic Dynamics and Control 27, 1253–1288.
40
Feltham, G., and J. Ohlson, 1995, Valuation and clean surplus accounting for operating and
financial activities, Contemporary Accounting Research 11, 689–731.
Ferreira, M., and P. Matos, 2008, The colors of investors’ money: The role of institutional
investors around the world, Journal of Financial Economics 88, 499–533.
Ferreira, M., P. Matos, J. Pereira, and P. Pires, 2017, Do locals know better? A comparison of
the performance of local and foreign institutional investors, Journal of Banking and Finance
82, 151–164.
Fidora, M., M. Fratzscher, and C. Thimann, 2007, Home bias in global bond and equity markets:
The role of real exchange rate volatility, Journal of international Money and Finance 26,
631–655.
French, K., and J. Poterba, 1991, Investor diversification and international equity markets,
American Economic Review 81, 222–226.
Fukuyama, Francis, 1995, Trust (Free Press, New York).
Garrett, J., R. Hoitash, and D. Prawitt, 2014, Trust and financial reporting quality, Journal of
Accounting Research 52, 1087–1125.
Gebhardt, W., C. Lee, and B. Swaminathan, 2001, Toward an implied cost of capital, Journal of
Accounting Research 39, 135–176.
Gehrig, T., 1993, An information based explanation of the domestic bias in international equity
investment, Scandinavian Journal of Economics 1, 97–109.
Gillan, S., and L. Starks, 2003, Corporate governance, corporate ownership, and the role of
institutional investors: A global perspective, Working paper, Weinberg Center for Corporate
Governance.
Glaeser, E., D. Laibson, and B. Sacerdote, 2002, An economic approach to social capital, Economic
Journal 112, F437–F458.
Glassman, D., and L. Riddick, 2001, What causes home asset bias and how should it be measured?,
Journal of Empirical Finance 8, 35–54.
Grinblatt, M., and M. Keloharju, 2001, How distance, language, and culture influence stockholdings
and trades, Journal of Finance 56, 1053–1073.
41
Guiso, L., P. Sapienza, and L. Zingales, 2004, The role of social capital in financial development,
American Economic Review 94, 526–556.
Guiso, L., P. Sapienza, and L. Zingales, 2006, Does culture affect economic outcomes?, Journal
of Economic Perspectives 20, 23–48.
Guiso, L., P. Sapienza, and L. Zingales, 2008a, Social capital as good culture, Journal of the
European Economic Association 6, 295–320.
Guiso, L., P. Sapienza, and L. Zingales, 2008b, Trusting the stock market, Journal of Finance 63,
2557–2600.
Guiso, L., P. Sapienza, and L. Zingales, 2009, Cultural biases in economic exchange?, Quarterly
Journal of Economics 124, 1095–1131.
Guiso, L., P. Sapienza, and L. Zingales, 2011, Civic capital as the missing link, Handbook of
Social Economics, 417–480 (Elsevier).
Gupta, A., K. Raman, and C. Shang, 2018, Social capital and the cost of equity, Journal of
Banking and Finance 87, 102–117.
Hagendorff, J., S. Lim, and D. Nguyen, 2019, Lender trust and bank loan contracts, Working
paper, University of Edinburgh, DePaul University, and King’s College London.
Hail, L., and C. Leuz, 2006, International differences in cost of equity capital: Do legal institutions
and securities regulations matter?, Journal of Accounting Research 44, 485–531.
Hamberg, M., T. Mavruk, and S. Sjoegren, 2013, Investment allocation decisions, home bias and
the mandatory IFRS adoption, Journal of International Money and Finance 36, 107–130.
Harris, R., F. Marston, D. Mishra, and T. O’Brien, 2003, Ex ante cost of equity estimates of S&P
500 firms: The choice between global and domestic CAPM, Financial Management 32, 51–66.
Harvey, C., 1995, Predictable risk and returns in emerging markets, Review of Financial Studies
8, 773–816.
Hasan, I., C. Hoi, Q. Wu, and H. Zhang, 2017, Social capital and debt contracting: Evidence from
bank loans and public bonds, Journal of Financial and Quantitative Analysis 52, 1017–1047.
42

He, Y., B. Li, Z. Liu, and J. Pittman, 2019, Does the threat of a PCAOB inspection mitigate
U.S. institutional investors’ home bias?, Working paper, City University of Hong Kong, Hong
Kong Baptist University, and Memorial University of Newfoundland.
Hofstede, G., 2001, Culture’s consequences: Comparing values, behaviors, institutions and organi-
zations across nations (Sage Publications, London).
Inglehart, R., M. Basanez, J. Diez-Medrano, L. Halman, and R. Luijkx, 2000, World values
surveys and European values surveys, 1981-1984, 1990-1993, and 1995-1997 (Inter-university
Consortium for Political and Social Research, Ann Arbor).
Johnson, S., P. Boone, A. Breach, and E. Friedman, 2000a, Corporate governance in the Asian
financial crisis, Journal of Financial Economics 58, 141–186.
Johnson, S., R. La Porta, F. Lopez-de-Silanes, and F. Shleifer, 2000b, Tunneling, American
Economic Review 90, 22–27.
Jurado, K., S. Ludvigson, and S. Ng, 2015, Measuring uncertainty, American Economic Review
105, 1177–1216.
Kang, J., and R. Stulz, 1997, Why is there a home bias? An analysis of foreign portfolio equity
ownership in japan, Journal of Financial Economics 46, 3–28.
Karolyi, G., D. Ng, and E. Prasad, 2018, The foreign investor bias and its linguistic origins,
Management Science 64, 4433–4450.
Karolyi, G., D. Ng, and E. Prasad, 2020, The coming wave: Where do emerging market investors
put their money?, Journal of Financial and Quantitative Analysis 55, 1369–1414.
Ke, D., L. Ng, and Q. Wang, 2010, Home bias in foreign investment decisions, Journal of
International Business Studies 41, 960–979.
Kho, B., R. Stulz, and F. Warnock, 2009, Financial globalization, governance, and the evolution
of the home bias, Journal of Accounting Research 47, 597–635.
Kim, J., M. Pevzner, and X. Xin, 2019, Foreign institutional ownership and auditor choice:
Evidence from worldwide institutional ownership, Journal of International Business Studies 50,
83–110.
Knack, S., and P. Keefer, 1997, Does social capital have an economic payoff? A cross-country
investigation, Quarterly Journal of Economics 112, 1251–1288.
43

Kothari, S., J. Shanken, and R. Sloan, 1995, Another look at the cross-section of expected stock
returns, Journal of Finance 50, 185–224.
Krishnan, R., X. Martin, and N. Noorderhaven, 2006, When does trust matter to alliance
performance?, Academy of Management Journal 49, 894–917.
La Porta, R., L. Lopez-de-Silanes, A. Shleifer, and R. Vishny, 1998, Bankruptcy and the collateral
channel, Journal of Political Economy 106, 1113–1155.
Laeven, L., and F. Valencia, 2020, Systemic banking crises database II, IMF Economic Review
1–55.
Lambert, R., C. Leuz, and R. Verrecchia, 2007, Accounting information, disclosure, and the cost
of capital, Journal of Accounting Research 45, 385–420.
Lau, S., L. Ng, and B. Zhang, 2010, The world price of home bias, Journal of Financial Economics
97, 191–217.
Lel, U., 2019, The role of foreign institutional investors in restraining earnings management
activities across countries, Journal of International Business Studies 50, 895–922.
Levy, H., and M. Levy, 2014, The home bias is here to stay, Journal of Banking and Finance 47,
29–40.
Lewis, K., 1996, What can explain the apparent lack of international consumption risk sharing?,
Journal of Political Economy 104, 267–297.
Lins, K., H. Servaes, and A. Tamayo, 2017, Social capital, trust, and firm performance: The value
of corporate social responsibility during the financial crisis, Journal of Finance 72, 1785–1824.
Markowitz, H., 1952, Mean-variance analysis in portfolio choice and capital markets, Journal of
Finance 7, 77–91.
Martin, P., and H. Rey, 2004, Financial super-markets: Size matters for asset trade, Journal of
International Economics 64, 335–361.
Michaelides, A., 2003, International portfolio choice, liquidity constraints and the home equity
bias puzzle, Journal of Economic Dynamics and Control 28, 555–594.
Mishra, A., 2008, Australia’s equity home bias, Australian Economic Papers 47, 53–73.
Mishra, A., 2015, Measures of equity home bias puzzle, Journal of Empirical Finance 34, 293–312.
44

Morse, A., and S. Shive, 2011, Patriotism in your portfolio, Journal of Financial Markets 14,
411–440.
Niszczota, P., 2014, Cross-country differences in personality and the foreign bias in international
equity portfolios, European Journal of Finance 20, 934–956.
North, D., 1994, Economic performance through time, American Economic Review 84, 359–368.
Ohlson, J., 1995, Earnings, book values, and dividends in equity valuation, Contemporary
Accounting Research 11, 661–687.
Ohlson, J., and B. Juettner-Nauroth, 2005, Expected EPS and EPS growth as determinants of
value, Review of Accounting Studies 10, 349–365.
Pagano, M., O. Randl, A. Röell, and J. Zechner, 2001, What makes stock exchanges succeed?
Evidence from cross-listing decisions, European Economic Review 45, 770–782.
Pevzner, M., F. Xie, and X. Xin, 2015, When firms talk, do investors listen? The role of trust in
stock market reactions to corporate earnings announcements, Journal of Financial Economics
117, 190–223.
Reeb, D., M. Sakakibara, and I. Mahmood, 2012, From the editors: Endogeneity in international
business research., Journal of International Business Studies 43, 211–218.
Sapienza, P., and L. Zingales, 2012, A trust crisis, International Review of Finance 12, 123–131.
Schumacher, D., 2018, Home bias abroad: Domestic industries and foreign portfolio choice, Review
of Financial Studies 31, 1654–1706.
Shiller, R., F. Kon-Ya, and Y. Tsutsui, 1996, Why did the Nikkei crash? Expanding the scope of
expectations data collection, Review of Economics and Statistics 156–164.
Solnik, B., and L. Zuo, 2017, Relative optimism and the home bias puzzle, Review of Finance 21,
2045–2074.
Stock, J., J. Wright, and M. Yogo, 2002, A survey of weak instruments and weak identification in
generalized method of moments, Journal of Business and Economic Statistics 20, 518–529.
Strong, N., and X. Xu, 2003, Understanding the equity home bias: Evidence from survey data,
Review of Economics and Statistics 85, 307–312.
45

Stulz, R., 1999, Globalization, corporate finance, and the cost of capital, Journal of Applied
Corporate Finance 12, 8–25.
Uppal, R., 1993, A general equilibrium model of international portfolio choice, Journal of Finance
48, 529–553.
Uppal, R., and T. Wang, 2003, Model misspecification and underdiversification, Journal of
Finance 58, 2465–2486.
Van Nieuwerburgh, S., and L. Veldkamp, 2009, Information immobility and the home bias puzzle,
Journal of Finance 64, 1187–1215.
Van Nieuwerburgh, S., and L. Veldkamp, 2010, Information acquisition and under-diversification,
Review of Economic Studies 77, 779–805.
Van Wincoop, E., 1999, How big are potential welfare gains from international risk-sharing?,
Journal of International Economics 47, 109–135.
Vanpée, R., and L. De Moor, 2012, Bond and equity home bias and foreign bias: An international
study, Working paper, Hogeschool-Universiteit Brussel, KU Leuven.
Wei, C., and L. Zhang, 2020, Trust and local bias, Journal of Financial and Quantitative Analysis
55, 2211–2245.
Whiteley, P., 2000, Economic growth and social capital, Political Studies 48, 443–466.
Williamson, O., 2000, The new institutional economics: Taking stock, looking ahead, Journal of
Economic Literature 38, 595–613.
Yu, S., S. Beugelsdijk, and J. de Haan, 2015, Trade, trust and the rule of law, European Journal
of Political Economy 37, 102–115.
Zak, P., and S. Knack, 2001, Trust and growth, Economic Journal 11, 295–321.
46

Table A1: Variable Descriptions
This appendix provides definitions and data sources for the main variables used in the study. Investor-levelvariables refer to investor k at time t. Country-level variables refer either to investor country i or host country j attime t. Country-level (dyadic) variables refer to both investor country i and host country j at time t. Firm-levelvariables refer to firm f at time t.
Variable Definition and Data Source
Investor Level:
FBIAS Measure of foreign bias as given by Equation (4). Equals the differencebetween world-CAPM-optimal and actual portfolio weights with respect to aforeign host country.Source: Authors’ calculations based on FactSet and Compustat data.
Investor Size Natural logarithm of the dollar amount of investor portfolio holdings.Source: Authors’ calculations based on FactSet data.
Investor Age Natural logarithm of the number of years since the investment entity wasfounded. Source: Authors’ calculations based on FactSet data.
Number of Stocks Natural logarithm of the number of stocks in the investor’s portfolio.Source: Authors’ calculations based on FactSet data.
Global Concentration Percentage of an investor’s entire portfolio that should be reallocated toachieve full diversification across global markets.Source: Authors’ calculations based on FactSet and Compustat data.
Foreign Concentration Percentage of an investor’s entire portfolio that should be re-allocated toachieve full diversification across foreign markets.Source: Authors’ calculations based on FactSet and Compustat data.
Country Level:
Social Trust Percentage of respondents answering "Can be trusted" to the survey question"Generally speaking, would you say that most people can be trusted or thatyou can’t be too careful in dealing with people?". Sample weights applied whenavailable. Source: Authors’ calculations based on World Values Survey andEuropean Values Study data.
Residual Trust Residual of a regression of social trust on country-level institutional, politicaland cultural variables. Source: Authors’ calculations based on World ValuesSurvey, European Values Study, La Porta et al. (1998), Djankov et al. (2001,2003), Hofstede (2001), Caldara and Iacoviello (2019), and TransparencyInternational data.
Residual Trust (GSS) Residual of a regression of social trust on country-level institutional, politicaland cultural variables where we use trust data from the General SocialSurvey instead of the World Values Survey for U.S.-domiciled investors.Source: Authors’ calculations based on European Values Study, GeneralSocial Survey, La Porta et al. (1998), Djankov et al. (2001, 2003), Hofstede(2001), Caldara and Iacoviello (2019), and Transparency International data.
Law and Order Measure of a country’s law and order tradition as measured by the risk ratingagency International Country Risk. Rankings are modified to range from 0(high tradition of law and order) to 1 (low tradition of law and order).Source: Authors’ calculations based on La Porta et al. (1998) data.
Judicial Integrity Measure of a country’s integrity of its legal system based on the Law andOrder Component from the PRS Group’s International Country Risk Guide.Rankings are modified to range from 0 (high integrity) to 1 (low integrity).Source: Authors’ calculations based on Djankov et al. (2003) data.
Accounting Standards Measure of the extent and transparency of the information available toinvestors. Prepared on the basis of an analysis of annual reports covering 90evaluation criteria. Rankings are modified to range from 0 (high informationavailability) to 1 (low information availability).Source: Authors’ calculations based on La Porta et al. (1998) data.
(continued)
47

Table A1 — continued
Variable Definition and Data Source
Expropriation Risk Measure of the risk of a "forced nationalization" or "outright confiscation" asassessed by the risk-rating agency International Country Risk. Ranges from 0(low risk) to 1 (great risk).Source: Authors’ calculations based on La Porta et al. (1998) data.
Judicial Efficiency Measure of the "efficiency and integrity of the legal environment as it affectsbusiness, particularly foreign firms" produced by the country-risk ratingagency Business International Corporation. Rankings are modified to rangefrom 0 (high efficiency) to 1 (low efficiency).Source: Authors’ calculations based on Djankov et al. (2001) data.
Legal System Dummy Dummy variable indicating whether a civil-law system is in place. Civil lawsystems usually provide less legal protection for shareholders, whilecommon-law systems offer higher protection.Source: Authors’ calculations based on La Porta et al. (1998) data.
Geopolitical Risk Measure of global geopolitical risk, based on a tally of newspaper articles thatcover geopolitical tensions. The measure is constructed by counting certainkeywords (e.g., terrorist attack) in articles published in leading Englishlanguage newspapers. Source: Caldara and Iacoviello (2019).
Corruption Measure of a country’s perceived level of public sector corruption. Based onsurveys of experts and businesspeople.Source: Authors’ calculations based on Transparency International data.
Power Distance Measures of the extent to which less powerful members of a society acceptand expect unequal power relations. In societies with low power distance,people strive for a fair distribution of power, while in high-power distancecountries, a hierarchical order is generally accepted and does not requirefurther justification. Source: Hofstede (2001).
Individualism Measure of individualism versus collectivism. Describes the extent to whichmembers of a society prefer personal goals (individualism) to communitygoals (collectivism). The high and low side of the measure indicateindividualism and collectivism, respectively. Source: Hofstede (2001).
Masculinity Measures of masculinity vs. femininity. Describes the distribution ofemotional roles between gender in a society, i.e., the degree of importance aculture attaches to stereotypically masculine (e.g., assertiveness and power)or feminine (e.g., the promotion of interpersonal relationships) values. Source:Hofstede (2001).
Uncertainty Avoidance Measure of a society’s tolerance for uncertainty and ambiguity. Cultures withhigh levels of uncertainty avoidance are less tolerant of change, and tend toreduce their fear of the unknown by implementing rigid rules, regulations andlaws. Source: Hofstede (2001).
Long-term Orientation Measures long-term orientation versus normative short-term orientation of asociety. Long-term cultures emphasize the importance of traditions, loyalty,and commitment, while short-term cultures are characterized by a normativeway of thinking, striving for equality, individuality, and creativity. Source:Hofstede (2001).
Indulgence Measure of the indulgence and restraint of a society. Describes whether aculture satisfies the immediate needs and personal wishes of its members, orregulates the satisfaction of needs by rules and laws. Source: Hofstede (2001).
Stock MarketDevelopment
Relative size of the stock market. Equals a country’s market capitalizationdivided by its Gross Domestic Product. Source: Authors’ calculations basedon Compustat and World Bank data.
Capital Controls Measure of restrictions on foreign capital transactions based on the EconomicFreedom index. Ranges from 0 (strong restrictions) to 100 (weak restrictions).Source: The Heritage Foundation.
(continued)
48

Table A1 — continued
Variable Definition and Data Source
GDP per Capita Gross domestic product per capita. Measured in 10,000 U.S. dollars.Source: World Bank.
Internet Availability Individuals using the internet as a percentage of total population.Source: World Bank.
Stock Market Return One year lagged growth rate of the annual average stock market index inpercent. The annual average stock market index is constructed by taking theaverage of the daily stock market indexes available at Bloomberg.Source: Authors’ calculations based on Bloomberg data (accessed via theWorld Bank Global Financial Development Database).
Stock Market Risk Five-year rolling variance of the yearly values of the stock market returnvariable. Source: Authors’ calculations based on Bloomberg data (accessedvia the World Bank Global Financial Development Database).
Crisis Dummy Dummy variable indicating whether a banking crisis was present in the targetcountry at a given year-end. Banking crises are defined as events that meettwo conditions. First, there are significant signs of financial distress in thebanking system. Second, there are relevant banking policy interventionmeasures in response to significant losses in the banking system.Source: Laeven and Valencia (2020).
Crisis Output Loss Measure of output losses associated with banking crisis episodes. Expressedas a percentage of trend real GDP. Source: Laeven and Valencia (2020).
Stock Market Efficiency Natural logarithm of the stock market’s ratio of the total value of sharestraded to gross domestic product times the banking sector’s overhead costs.Source: Authors’ calculations based on World Bank data.
Inflation Measure of the realized inflation rate, measured over the next year.Source: Authors’ calculations based on I/B/E/S and Compustat data.
Country Level (Dyadic):
Geographic Distance Simple distance between the capitals of two countries in kilometers.Source: Center for Research and Expertise on the World Economy.
Common LanguageDummy
Dummy variable indicating whether two countries share a common officiallanguage. Source: Center for Research and Expertise on the World Economy.
Contiguity Dummy Dummy variable indicating whether two countries are contiguous.Source: Center for Research and Expertise on the World Economy.
Colony Dummy Dummy variable indicating whether two countries ever had a colonial link.Source: Center for Research and Expertise on the World Economy.
Same Country Dummy Dummy variable indicating whether two countries were or are the same stateor the same administrative entity for a long period (25 to 50 years in the 20thcentury, 75 years in the 19th century, and 100 years before). The definitionincludes countries that have been divided or that have belonged to the sameempire or administrative colonial area.Source: Center for Research and Expertise on the World Economy.
Diversification Potential Five-year rolling average of a country pair’s correlations of yearly values ofthe stock market return variable.Source: Authors’ calculations based on Bloomberg data (accessed via theWorld Bank Global Financial Development Database).
Firm Level:
Cost of Equity Measure of the implied cost of equity capital ten months after the fiscal year.Calculated as averages of the Claus and Thomas (2001), Gebhardt et al.(2001), Easton (2004), and Ohlson and Juettner-Nauroth (2005) models.Source: Authors’ calculations based on I/B/E/S and Compustat data.
(continued)
49

Table A1 — continued
Variable Definition and Data Source
Foreign Shareholders’Trust
Holding-weighted residual trust score among all foreign institutional investorsof a firm. Source: Authors’ calculations based on FactSet, Compustat, WorldValues Survey and European Values Study data.
Stock Return Volatility Measure of the volatility of stock returns over the previous twelve months.Source: Authors’ calculations based on Compustat data.
Market to Book Market value to book value of equity.Source: Authors’ calculations based on Compustat data.
Leverage Measure of leverage ratio. Defined as the ratio of long-term debt to totalassets. Source: Authors’ calculations based on Compustat data.
Firm Size Natural logarithm of total assets in million USD.Source: Authors’ calculations based on FactSet data.
Signed Forecast Error Measure of the signed forecast error. Measured as the difference betweenone-year-ahead consensus earnings forecasts and realized earnings deflated bybeginning of period assets per share.Source: Authors’ calculations based on I/B/E/S and Compustat data.
Analyst ForecastDispersion
Measure of the dispersion of analyst forecasts. Measured by the coefficient ofvariation of one-year-ahead analyst forecasts of earnings per share.Source: Authors’ calculations based on I/B/E/S data.
Institutional Ownership Percentage of the equity capital of a company held by institutional investors.Source: Authors’ calculations based on FactSet data.
Capital Intensity Measure of capital intensity. Calculated as the ratio of capital expendituresto total assets.Source: Authors’ calculations based on FactSet data.
50

Table A2: Overlap Between Trust, Institutional, Political and Cultural Frameworks
The table reports the results of a fixed effects regression of social trust on country-level institutional, political,and cultural variables. Country-level variables refer either to country i or to country i at time t. For a detaileddescription of the data, see Table A1 in the appendix. The regression specification includes year fixed effects toisolate the influence of aggregate time-series trends. Heteroscedasticity-robust standard errors are clustered at thecountry level. t-statistics are given in parentheses. ∗∗∗,∗∗, and ∗ denote statistical significance at the 1%, 5%, and10% level, respectively.
(1)Dependent Variable: Social Trusti,t
Institutional and Political Variables:
Law and Orderi -0.0645(-0.32)
Judicial Integrityi 0.0211(0.15)
Accounting Standardsi -0.3750∗∗∗
(-3.07)
Expropriation Riski -0.0716(-0.59)
Judicial Efficiencyi -0.2440∗∗
(-2.57)
Legal System Dummyi -0.0490(-0.99)
Geopolitical Riski,t 0.0005∗
(2.02)
Corruptioni,t -0.0023(-1.47)
Hofstede’s Cultural Dimensions:
Power Distancei -0.0059∗∗∗
(-4.05)
Individualismi -0.0008(-0.68)
Masculinityi -0.0030∗∗∗
(-3.34)
Uncertainty Avoidancei -0.0003(-0.33)
Long-term Orientationi -0.0004(-0.35)
Indulgencei -0.0019(-1.60)
Year FE YAdjusted R-squared 0.8670Observations 461
51

Table A3: Cost of Equity Models
This appendix closely follows El Ghoul et al. (2018), and provides a brief overview of the four models used in thisstudy to proxy for the implied cost of equity capital. They comprise the residual income valuation models of Clausand Thomas (2001) and Gebhardt et al. (2001), as well as the abnormal growth models of Easton (2004) andOhlson and Juettner-Nauroth (2005). We start with a definition of the variables used in the four models, andstate the general assumptions on which all four are based. We then address the additional assumptions of eachmodel and provide their valuation equation.
Variable Descriptions
CoE Implied cost of equity capital.
Pt Stock price as of ten months after the end of the fiscal year.
BVt Current book value per share.
dt Expected dividend payout at time t.
it Expected perpetual earnings growth at time t.
RoEt+τ Forecasted return on equity for year t+τ.
EPSt+τ Forecasted earnings for year t+τ.
BVt+τ Forecasted book value per share for year t+τ.
LTGt Forecasted long-term earnings growth at time t.
General Assumptions
(1) We only consider firms with a positive one-year-ahead (EPSt+1) and two-year-ahead(EPSt+2) earnings forecasts available, and either a three-year-ahead forecast(EPSt+3) or a long-term growth forecast (LTGt).
(2) We impute missing three-year-ahead (EPSt+3), four-year-ahead (EPSt+4), andfive-year-ahead (EPSt+5) earnings forecasts from the previous year forecasts and thelong-term earnings growth forecast as EPSt+τ = −EPSt+τ-1(1 + LTGt).
(3) If the forecasted long-term earnings growth rate is missing, we impute it from thegrowth rate implied by the two-year-ahead (EPSt+2) and the three-year-ahead(EPSt+3) earnings forecasts as LTGt = (EPSt+3 − EPSt+2)/EPSt+2.
(4) We estimate the expected dividend payout (dt) as the average over the previous threeyears, i.e., dt = (dt−1 + dt−2 + dt−3)/3, and replace the expected dividend payoutwith the country-year median if its value is missing or outside the interval [0, 1].
(5) We approximate the expected perpetual earnings growth rate (it) by the next year’srealized inflation rate.
Model 1: Claus and Thomas (2001)
Additional Assumptions:
(1) The requirements for a clean surplus accounting are met, i.e., the clean surplusrelationship BVt+τ = BVt+τ-1 + EPSt+τ(1− dt+τ) holds (see Feltham and Ohlson(1995), Ohlson (1995)).
(2) Forecasted abnormal earnings correspond to forecast earnings less a charge for thecost of equity capital.
(3) A forecast horizon of five years is set. Thereafter, the forecast residual earnings growat the expected inflation rate.
(continued)
52

Table A3 — continued
Valuation Equation:
Pt = BVt+5∑
τ=1
EPSt+τ − CoE× BVt+τ−1
(1 + CoE)τ+
(EPSt+5 − CoE× BVt+5−1)(1 + it)(CoE− it)(1 + CoE)5
Model 2: Gebhardt et al. (2001)
Additional Assumptions:
(1) The requirements for a clean surplus accounting are met, i.e., the clean surplusrelationship BVt+τ = BVt+τ-1 + EPSt+τ(1− dt+τ) holds (see Feltham and Ohlson(1995), Ohlson (1995)).
(2) A forecast horizon of three years is set. RoEt+τ = (EPSt+τ)/BVt+τ-1 holds for thefirst three years. Thereafter, the forecast return on equity fades linearly to a targetreturn on equity by the twelfth year.
Valuation Equation:
Pt = BVt+
11∑τ=1
RoEt+τ − CoE(1 + CoE)τ
BVt+τ−1+RoEt+12 − CoECoE(1 + CoE)τ
BVt+11
Model 3: Easton (2004)
Additional Assumptions:
(1) A forecast horizon of two years is set. Thereafter, forecasted abnormal earnings growconstantly in the amount of the perpetual annuity.
Valuation Equation:
Pt =EPSt+2 − EPSt+1(1− CoE× dt+1)
CoE2
Model 4: Ohlson and Juettner-Nauroth (2005)
Additional Assumptions:
(1) A forecast horizon of one year is set. Thereafter, forecasted earnings grow at anear-term rate that converges to the perpetual annuity rate. The near-term earningsgrowth equals the average of the forecasted earnings growth from year t+1 to yeart+2 and the forecasted long-term earnings growth.
(2) The perpetual growth rate corresponds to the expected inflation rate.
Valuation Equation:
Pt =EPSt+1(
12
(EPSt+2−EPSt+1
EPSt+1+ LTGt
)− it + CoE× dt+1)
CoE(CoE− it)
53

Table A4: Robustness to Measurement of Social Trust and Sample Composition
The table reports the results of robustness tests and re-estimates the baseline regression specification (see column(6) of Table IV). In column (1), we apply a measure of (non-residual) social trust instead of residual trust. Incolumn (2), we use trust data from the General Social Survey instead of the World Values Survey for U.S.-domiciledinvestors. In column (3), we re-run the baseline regression specification but restrict our global sample to non-U.S.-domiciled investors. Investor-level variables refer to investor k at time t. Investor-country-level variablesrefer to the investor’s country of domicile i at time t. Bilateral variables on country pairs refer to the investor’scountry of domicile i as well as host country j at time t. For a detailed description of the data, see Table A1 in theappendix. All regression specifications include year fixed effects to isolate the influence of aggregate time-seriestrends, target country fixed effects to control for time-constant characteristics of the host country as well asinvestor × target fixed effects to control for time-constant characteristics within investor-target-country pairs.Heteroscedasticity-robust standard errors are clustered at the investor level. t-statistics are given in parentheses.∗∗∗,∗∗, and ∗ denote statistical significance at the 1%, 5%, and 10% levels, respectively.
(1) (2) (3)
Global Sample Global S. w/o U.S.
Dependent Variable: FBIASk,j,t
Social Trusti,t -0.0124∗∗∗
(-6.35)
Residual Trust (GSS)i,t -0.0153∗∗∗
(-7.62)
Residual Trusti,t -0.0066∗∗
(-2.11)
Investor Sizek,t 0.0001∗∗ 0.0001∗∗ 0.0003∗∗∗
(1.98) (2.14) (4.67)
Investor Agek,t -0.0000 -0.0000 0.0002(-0.76) (-0.54) (1.09)
Number of Stocksk,t 0.0000 0.0000 -0.0003∗∗∗
(0.23) (0.14) (-2.65)
Stock Market Developmentj,t 0.0045∗∗∗ 0.0045∗∗∗ 0.0039∗∗∗
(99.08) (97.63) (31.05)
Capital Controlsj,t -0.0001∗∗∗ -0.0001∗∗∗ -0.0001∗∗∗
(-48.42) (-47.92) (-12.68)
GDP per Capitaj,t 0.0000 0.0000 -0.0007∗∗∗
(0.52) (0.10) (-6.71)
Internet Availabilityj,t 0.0001∗∗∗ 0.0001∗∗∗ 0.0001∗∗∗
(24.28) (23.49) (14.14)
Stock Market Returnj,t -0.0004∗∗∗ -0.0004∗∗∗ -0.0006∗∗∗
(-11.46) (-11.84) (-6.57)
Stock Market Riskj,t 0.0009∗∗∗ 0.0009∗∗∗ 0.0010∗∗∗
(21.90) (21.06) (11.15)
Diversification Potentiali,j,t -0.0002∗∗∗ -0.0002∗∗∗ 0.0004∗∗∗
(-7.58) (-7.82) (6.49)
Year FE Y Y YInvestor FE Y Y YTarget FE Y Y YInvestor × Target FE Y Y YAdjusted R-squared 0.7183 0.7078 0.6798Observations 5,231,006 5,027,082 1,545,783

Table A5: Robustness to Alternative Cost of Equity Capital Estimates
The table reports the results of robustness tests and re-estimates the fixed effects regressions of the implied cost ofequity capital on foreign shareholders’ trust and selected control variables (see column (1) of Table VIII) usingalternative cost of equity estimates. CoE 7mf,t and CoE 4mf,t capture the average of the equity financing costsobtained from the four models developed by Claus and Thomas (2001), Gebhardt et al. (2001), Easton (2004),and Ohlson and Juettner-Nauroth (2005) as per seven months and four month after the end of the fiscal year,respectively. CoE 3pf,t and CoE GDPf,t use the assumptions that long-term growth is fixed at 3% and thatthe perpetual growth rate equals the annual real GDP growth rate plus the long-run inflation rate, respectively.Firm-level variables refer to firm f at time t. Host country-level variables refer to target country j at time t. For adetailed description of the data, see Table A1 in the appendix. All regression specifications include year fixedeffects to isolate the influence of aggregate time series trends as well as firm fixed effects to control for time-constantcharacteristics of the firm. Heteroscedasticity-robust standard errors are clustered at the firm level. t-statistics aregiven in parentheses. ∗∗∗,∗∗, and ∗ denote statistical significance at the 1%, 5%, and 10% levels, respectively.
(1) (2) (3) (4)CoE 7mf,t CoE 4mf,t CoE 3pf,t CoE GDPf,t
Foreign Shareholders’ Trustf,t -0.0343∗∗∗ -0.0312∗∗∗ -0.0259∗∗ -0.0210∗∗
(-3.47) (-3.26) (-2.45) (-1.99)
Residual Trustj,t -0.0309∗∗∗ -0.0256∗∗ -0.0297∗∗ 0.0425∗∗∗
(-2.71) (-2.28) (-2.40) (3.44)
GDP per Capitaj,t 0.0018∗∗∗ 0.0017∗∗ 0.0028∗∗∗ 0.0026∗∗∗
(2.58) (2.33) (3.37) (3.06)
Stock Market Efficiencyj,t -0.0022∗∗∗ -0.0017∗∗ -0.0023∗∗∗ 0.0022∗∗∗
(-3.21) (-2.39) (-3.37) (3.30)
Inflationj,t 0.0325∗ 0.0133 0.1056∗∗∗ 0.1203∗∗∗
(1.74) (0.73) (5.35) (6.95)
Stock Return Volatilityf,t 0.0969∗∗∗ 0.1020∗∗∗ 0.1613∗∗∗ 0.1616∗∗∗
(9.95) (11.13) (12.04) (11.44)
Market to Bookf,t -0.0023∗∗∗ -0.0033∗∗∗ -0.0018∗∗∗ -0.0020∗∗∗
(-10.47) (-15.11) (-7.55) (-7.93)
Leveragef,t 0.0224∗∗∗ 0.0299∗∗∗ 0.0219∗∗∗ 0.0175∗∗∗
(4.64) (6.29) (3.95) (3.09)
Firm Sizef,t -0.0050∗∗∗ -0.0110∗∗∗ 0.0002 0.0041∗∗∗
(-5.05) (-10.29) (0.15) (3.49)
Signed Forecast Errorf,t 0.0000∗∗∗ 0.0000∗∗∗ 0.0000 0.0000(150.48) (30.98) (0.15) (0.41)
Analyst Forecast Dispersionf,t -0.0000 0.0000 0.0001 0.0001(-0.55) (0.01) (0.75) (0.77)
Institutional Ownershipf,t -0.0269∗∗∗ -0.0070 -0.0395∗∗∗ -0.0408∗∗∗
(-5.28) (-1.37) (-6.61) (-6.69)
Capital Intensityf,t 0.0011 -0.0043 0.0238∗∗ 0.0103(0.12) (-0.51) (2.31) (1.00)
Year FE Y Y Y YInvestor FE Y Y Y YAdjusted R-squared 0.3891 0.3646 0.4278 0.3790Observations 56,996 56,462 57,398 57,399
55
Figures and Tables
56

Figure I: Social Trust Across Countries
The figure shows boxplot diagrams of social trust across countries over the sample period of 2000 through 2017, displayed for the top fifty domiciles (along the ordinate) asmeasured by the number of distinct investors in the sample (see Table I). Social trust (on the abscissa) is defined as the percentage of respondents answering "Can be trusted" tothe survey question "Generally speaking, would you say that most people can be trusted or that you can’t be too careful in dealing with people?" For a detailed description of thedata, see Table A1 of the Appendix. The vertical red middle line in the box presents the median value. The box’s left and right edges represent the 25th and 75th percentiles,respectively. Whiskers indicate variability outside the upper and lower quartiles.
57

Table I: Institutional Investor Equity Allocations
The table presents average investor-level equity allocations (in percentage points) for the top 15 investor domiciles (in columns) and the top 20 target countries (in rows) asmeasured by the number of distinct institutional investors in the sample (#Investors) for the sample period of 2000 through 2017. The row “Other ” shows the weighted averagesfor the remaining countries not listed in the table. Investor domiciles refer to country i at time t. Target countries refer to country j at time t. The gray shaded fields indicatedomestic investments (i = j), while the non-shaded fields indicate foreign investments (i 6= j). The overall sample covers a total of 86 investor domiciles and 118 target countries.We report average foreign biases by investor domicile and by host country below. ØFBIASk,i,t indicates the average foreign bias among all investors from domicile i across allforeign countries in the sample (home-country perspective). ØFBIASk,j,t expresses the average foreign bias among all investors in the sample toward a particular host country j(host-country perspective). Three-digit ISO codes are defined as follows; USA: United States, GBR: Great Britain, DEU: Germany, CHE: Switzerland, FRA: France, BRA:Brazil, CAN: Canada, ESP: Spain, SWE: Sweden, CHN: China, ZAF: South Africa, HKG: Hong Kong, AUS: Australia, ITA: Italy, LUX: Luxembourg, JPN: Japan, AUT:Austria, SGP: Singapore, IND: India, NLD: Netherlands.
Investor Country i
Domicile USA GBR DEU CHE FRA BRA CAN ESP SWE CHN ZAF HKG AUS ITA LUX#Investors 6,192 493 337 324 280 235 223 158 128 104 101 96 92 87 74
Host(T
arget)
Cou
ntryj
USA 93.22 20.98 27.68 23.54 10.19 0.34 23.31 10.18 14.37 0.08 5.98 1.47 10.76 36.20 24.92GBR 0.78 33.75 6.10 5.53 4.43 0.06 1.49 4.59 4.62 0.01 19.13 1.54 3.59 5.94 6.75DEU 0.05 4.62 34.44 8.89 7.68 0.01 0.63 9.05 2.58 0.00 1.25 0.94 0.49 11.00 14.00CHE 0.32 3.19 4.21 25.51 3.30 0.14 0.74 2.55 2.67 0.00 0.50 0.20 0.78 2.65 5.41FRA 0.02 4.29 6.08 5.67 52.39 0.01 0.69 11.07 1.95 0.00 0.28 0.48 1.56 7.15 13.04BRA 0.03 0.57 0.10 0.18 0.07 98.50 0.21 0.09 0.09 0.00 0.04 0.63 0.33 0.07 0.46CAN 2.06 2.41 3.33 4.60 1.87 0.01 66.56 0.46 0.78 0.00 0.85 0.44 0.82 1.15 3.44ESP 0.01 1.18 2.61 1.50 2.76 0.02 0.15 46.58 0.60 0.00 0.07 0.02 0.32 2.21 2.63SWE 0.02 1.26 0.68 0.83 0.52 0.00 0.13 0.45 52.50 0.00 0.06 0.02 0.10 0.55 4.23CHN 0.21 1.40 0.43 1.28 0.22 0.11 0.17 0.06 0.73 98.82 0.07 34.02 0.97 0.25 1.04ZAF 0.02 0.55 0.13 0.53 0.08 0.00 0.07 0.04 0.15 0.00 68.93 0.16 0.07 0.06 0.22HKG 0.06 1.69 0.51 1.97 0.28 0.06 0.47 0.08 0.51 0.76 0.10 25.69 1.78 0.33 0.93AUS 0.01 1.42 0.61 0.96 0.19 0.01 0.49 0.05 0.33 0.02 0.43 2.51 69.68 0.24 0.61ITA 0.01 1.60 1.79 3.37 3.45 0.01 0.16 2.96 0.59 0.00 0.08 0.09 0.56 23.76 3.31LUX 0.13 0.28 0.26 0.22 1.04 0.00 0.04 1.19 0.74 0.00 0.42 0.22 0.01 0.68 0.53JPN 0.02 4.80 2.08 4.66 1.20 0.03 1.17 1.45 1.52 0.00 0.29 5.30 2.50 1.69 3.11AUT 0.00 0.33 0.64 0.69 0.31 0.00 0.05 0.22 0.23 0.00 0.07 0.02 0.02 0.20 0.44SGP 0.08 0.50 0.12 0.60 0.03 0.00 0.10 0.02 0.16 0.01 0.02 3.54 0.65 0.09 0.25IND 0.01 0.85 0.11 0.09 0.31 0.09 0.06 0.00 0.43 0.02 0.07 4.69 0.31 0.07 0.05NLD 0.32 3.18 2.60 1.98 3.71 0.01 0.40 3.24 0.82 0.00 0.22 0.04 0.24 2.32 3.93Other 2.62 11.15 5.49 7.40 5.97 0.59 2.91 5.67 13.63 0.28 1.14 17.98 4.46 3.39 10.70
ØFBIASk,i,t 0.53 0.25 0.27 0.23 0.40 0.83 0.60 0.43 0.49 0.78 0.63 0.21 0.56 0.16 0.00ØFBIASk,j,t 18.60 3.62 1.39 0.93 2.21 1.38 1.05 0.92 0.59 7.16 0.63 1.97 1.79 0.80 0.04
58
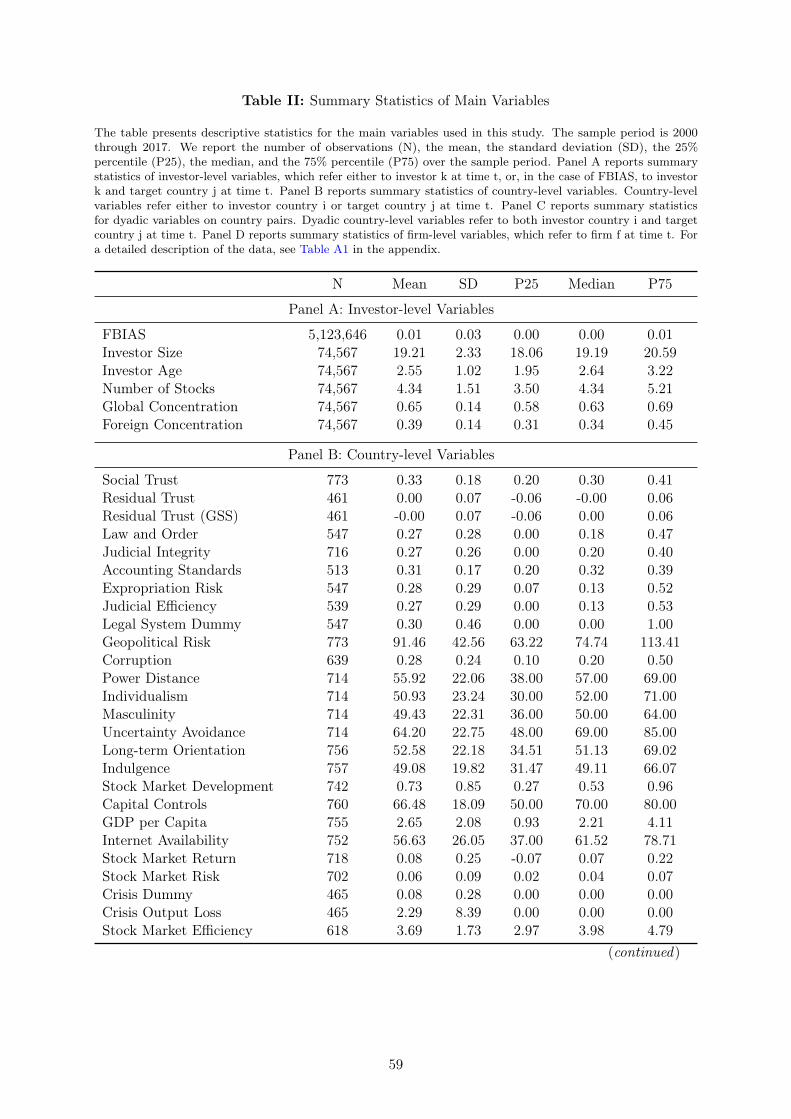
Table II: Summary Statistics of Main Variables
The table presents descriptive statistics for the main variables used in this study. The sample period is 2000through 2017. We report the number of observations (N), the mean, the standard deviation (SD), the 25%percentile (P25), the median, and the 75% percentile (P75) over the sample period. Panel A reports summarystatistics of investor-level variables, which refer either to investor k at time t, or, in the case of FBIAS, to investork and target country j at time t. Panel B reports summary statistics of country-level variables. Country-levelvariables refer either to investor country i or target country j at time t. Panel C reports summary statisticsfor dyadic variables on country pairs. Dyadic country-level variables refer to both investor country i and targetcountry j at time t. Panel D reports summary statistics of firm-level variables, which refer to firm f at time t. Fora detailed description of the data, see Table A1 in the appendix.
N Mean SD P25 Median P75
Panel A: Investor-level Variables
FBIAS 5,123,646 0.01 0.03 0.00 0.00 0.01Investor Size 74,567 19.21 2.33 18.06 19.19 20.59Investor Age 74,567 2.55 1.02 1.95 2.64 3.22Number of Stocks 74,567 4.34 1.51 3.50 4.34 5.21Global Concentration 74,567 0.65 0.14 0.58 0.63 0.69Foreign Concentration 74,567 0.39 0.14 0.31 0.34 0.45
Panel B: Country-level Variables
Social Trust 773 0.33 0.18 0.20 0.30 0.41Residual Trust 461 0.00 0.07 -0.06 -0.00 0.06Residual Trust (GSS) 461 -0.00 0.07 -0.06 0.00 0.06Law and Order 547 0.27 0.28 0.00 0.18 0.47Judicial Integrity 716 0.27 0.26 0.00 0.20 0.40Accounting Standards 513 0.31 0.17 0.20 0.32 0.39Expropriation Risk 547 0.28 0.29 0.07 0.13 0.52Judicial Efficiency 539 0.27 0.29 0.00 0.13 0.53Legal System Dummy 547 0.30 0.46 0.00 0.00 1.00Geopolitical Risk 773 91.46 42.56 63.22 74.74 113.41Corruption 639 0.28 0.24 0.10 0.20 0.50Power Distance 714 55.92 22.06 38.00 57.00 69.00Individualism 714 50.93 23.24 30.00 52.00 71.00Masculinity 714 49.43 22.31 36.00 50.00 64.00Uncertainty Avoidance 714 64.20 22.75 48.00 69.00 85.00Long-term Orientation 756 52.58 22.18 34.51 51.13 69.02Indulgence 757 49.08 19.82 31.47 49.11 66.07Stock Market Development 742 0.73 0.85 0.27 0.53 0.96Capital Controls 760 66.48 18.09 50.00 70.00 80.00GDP per Capita 755 2.65 2.08 0.93 2.21 4.11Internet Availability 752 56.63 26.05 37.00 61.52 78.71Stock Market Return 718 0.08 0.25 -0.07 0.07 0.22Stock Market Risk 702 0.06 0.09 0.02 0.04 0.07Crisis Dummy 465 0.08 0.28 0.00 0.00 0.00Crisis Output Loss 465 2.29 8.39 0.00 0.00 0.00Stock Market Efficiency 618 3.69 1.73 2.97 3.98 4.79
(continued)
59
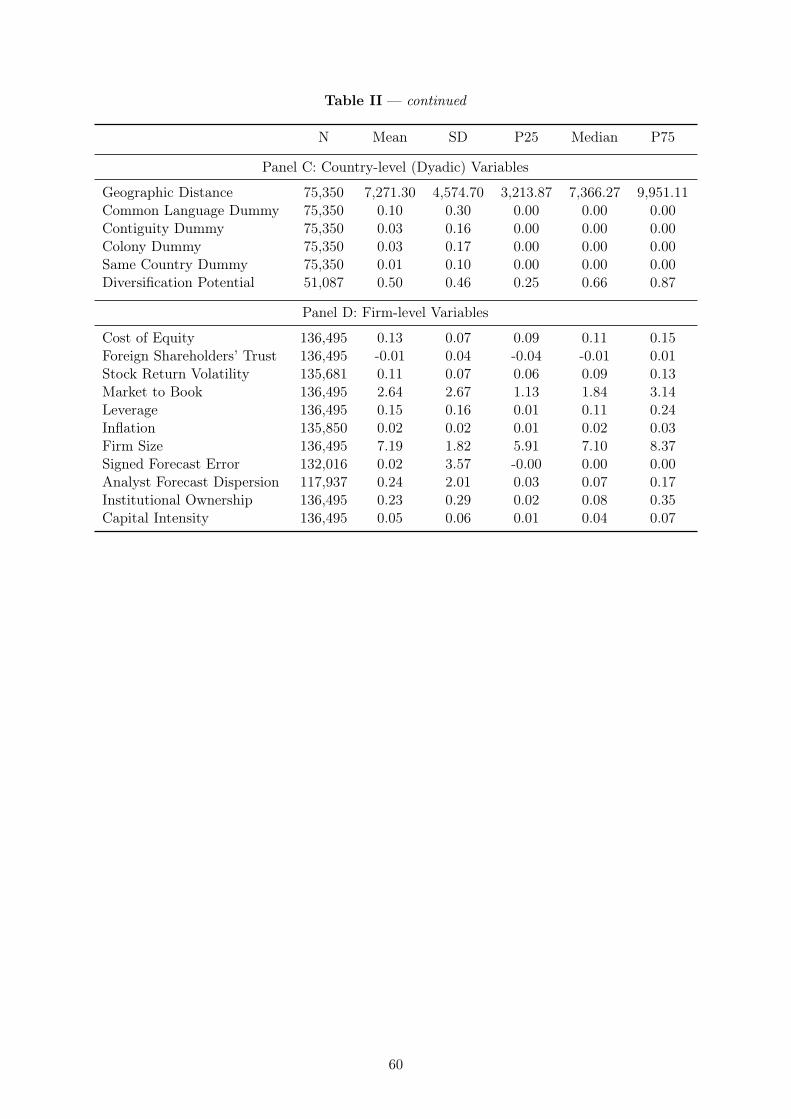
Table II — continued
N Mean SD P25 Median P75
Panel C: Country-level (Dyadic) Variables
Geographic Distance 75,350 7,271.30 4,574.70 3,213.87 7,366.27 9,951.11Common Language Dummy 75,350 0.10 0.30 0.00 0.00 0.00Contiguity Dummy 75,350 0.03 0.16 0.00 0.00 0.00Colony Dummy 75,350 0.03 0.17 0.00 0.00 0.00Same Country Dummy 75,350 0.01 0.10 0.00 0.00 0.00Diversification Potential 51,087 0.50 0.46 0.25 0.66 0.87
Panel D: Firm-level Variables
Cost of Equity 136,495 0.13 0.07 0.09 0.11 0.15Foreign Shareholders’ Trust 136,495 -0.01 0.04 -0.04 -0.01 0.01Stock Return Volatility 135,681 0.11 0.07 0.06 0.09 0.13Market to Book 136,495 2.64 2.67 1.13 1.84 3.14Leverage 136,495 0.15 0.16 0.01 0.11 0.24Inflation 135,850 0.02 0.02 0.01 0.02 0.03Firm Size 136,495 7.19 1.82 5.91 7.10 8.37Signed Forecast Error 132,016 0.02 3.57 -0.00 0.00 0.00Analyst Forecast Dispersion 117,937 0.24 2.01 0.03 0.07 0.17Institutional Ownership 136,495 0.23 0.29 0.02 0.08 0.35Capital Intensity 136,495 0.05 0.06 0.01 0.04 0.07
60
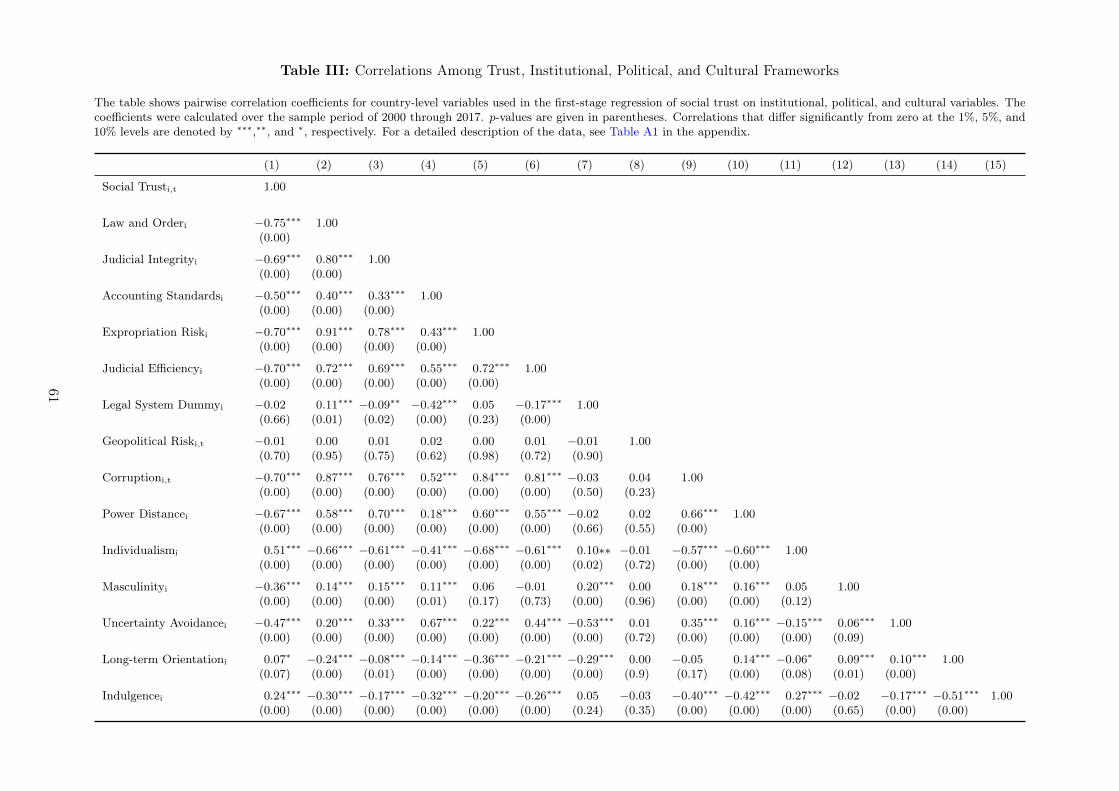
Table III: Correlations Among Trust, Institutional, Political, and Cultural Frameworks
The table shows pairwise correlation coefficients for country-level variables used in the first-stage regression of social trust on institutional, political, and cultural variables. Thecoefficients were calculated over the sample period of 2000 through 2017. p-values are given in parentheses. Correlations that differ significantly from zero at the 1%, 5%, and10% levels are denoted by ∗∗∗,∗∗, and ∗, respectively. For a detailed description of the data, see Table A1 in the appendix.
(1) (2) (3) (4) (5) (6) (7) (8) (9) (10) (11) (12) (13) (14) (15)
Social Trusti,t 1.00
Law and Orderi −0.75∗∗∗ 1.00(0.00)
Judicial Integrityi −0.69∗∗∗ 0.80∗∗∗ 1.00(0.00) (0.00)
Accounting Standardsi −0.50∗∗∗ 0.40∗∗∗ 0.33∗∗∗ 1.00(0.00) (0.00) (0.00)
Expropriation Riski −0.70∗∗∗ 0.91∗∗∗ 0.78∗∗∗ 0.43∗∗∗ 1.00(0.00) (0.00) (0.00) (0.00)
Judicial Efficiencyi −0.70∗∗∗ 0.72∗∗∗ 0.69∗∗∗ 0.55∗∗∗ 0.72∗∗∗ 1.00(0.00) (0.00) (0.00) (0.00) (0.00)
Legal System Dummyi −0.02 0.11∗∗∗ −0.09∗∗ −0.42∗∗∗ 0.05 −0.17∗∗∗ 1.00(0.66) (0.01) (0.02) (0.00) (0.23) (0.00)
Geopolitical Riski,t −0.01 0.00 0.01 0.02 0.00 0.01 −0.01 1.00(0.70) (0.95) (0.75) (0.62) (0.98) (0.72) (0.90)
Corruptioni,t −0.70∗∗∗ 0.87∗∗∗ 0.76∗∗∗ 0.52∗∗∗ 0.84∗∗∗ 0.81∗∗∗ −0.03 0.04 1.00(0.00) (0.00) (0.00) (0.00) (0.00) (0.00) (0.50) (0.23)
Power Distancei −0.67∗∗∗ 0.58∗∗∗ 0.70∗∗∗ 0.18∗∗∗ 0.60∗∗∗ 0.55∗∗∗ −0.02 0.02 0.66∗∗∗ 1.00(0.00) (0.00) (0.00) (0.00) (0.00) (0.00) (0.66) (0.55) (0.00)
Individualismi 0.51∗∗∗ −0.66∗∗∗ −0.61∗∗∗ −0.41∗∗∗ −0.68∗∗∗ −0.61∗∗∗ 0.10∗∗ −0.01 −0.57∗∗∗ −0.60∗∗∗ 1.00(0.00) (0.00) (0.00) (0.00) (0.00) (0.00) (0.02) (0.72) (0.00) (0.00)
Masculinityi −0.36∗∗∗ 0.14∗∗∗ 0.15∗∗∗ 0.11∗∗∗ 0.06 −0.01 0.20∗∗∗ 0.00 0.18∗∗∗ 0.16∗∗∗ 0.05 1.00(0.00) (0.00) (0.00) (0.01) (0.17) (0.73) (0.00) (0.96) (0.00) (0.00) (0.12)
Uncertainty Avoidancei −0.47∗∗∗ 0.20∗∗∗ 0.33∗∗∗ 0.67∗∗∗ 0.22∗∗∗ 0.44∗∗∗ −0.53∗∗∗ 0.01 0.35∗∗∗ 0.16∗∗∗ −0.15∗∗∗ 0.06∗∗∗ 1.00(0.00) (0.00) (0.00) (0.00) (0.00) (0.00) (0.00) (0.72) (0.00) (0.00) (0.00) (0.09)
Long-term Orientationi 0.07∗ −0.24∗∗∗ −0.08∗∗∗ −0.14∗∗∗ −0.36∗∗∗ −0.21∗∗∗ −0.29∗∗∗ 0.00 −0.05 0.14∗∗∗ −0.06∗ 0.09∗∗∗ 0.10∗∗∗ 1.00(0.07) (0.00) (0.01) (0.00) (0.00) (0.00) (0.00) (0.9) (0.17) (0.00) (0.08) (0.01) (0.00)
Indulgencei 0.24∗∗∗ −0.30∗∗∗ −0.17∗∗∗ −0.32∗∗∗ −0.20∗∗∗ −0.26∗∗∗ 0.05 −0.03 −0.40∗∗∗ −0.42∗∗∗ 0.27∗∗∗ −0.02 −0.17∗∗∗ −0.51∗∗∗ 1.00(0.00) (0.00) (0.00) (0.00) (0.00) (0.00) (0.24) (0.35) (0.00) (0.00) (0.00) (0.65) (0.00) (0.00)
61

Table IV: Baseline Regressions
The table reports estimation results of fixed effects regressions of foreign bias on residual trust in the investor’s country of domicile, as well as selected control variables.The panel contains only observations where investor i’s country of domicile differs from host country j (i 6= j). Investor-level variables refer to investor k at time t. Investorcountry-level variables refer to the investor’s country of domicile i at time t. Bilateral variables on country pairs refer to the investor’s country of domicile i as well as hostcountry j at time t. For a detailed description of the data, see Table A1 in the appendix. All regression specifications include year fixed effects to isolate the influence ofaggregate time series trends and target country fixed effects to control for time-constant characteristics of the host country. In column (1), we further control for time-constantdifferences within investor types via investor type fixed effects. In column (2), we further control for time-constant characteristics of the investor’s country of domicile viadomicile fixed effects. In column (3), we further control for time-constant differences among investors via investor fixed effects. In column (4), we re-run the first specificationbut control further for time-constant characteristics within the combination of investor types and host countries via investor-type × target fixed effects. In column (5), we re-runthe second specification but furthermore control for time-constant characteristics of domicile-target pairs via domicile × target fixed effects. In column (6), we re-run the thirdspecification but control further for all time-constant characteristics within investor-target-country pairs via investor × target fixed effects. Heteroscedasticity-robust standarderrors are clustered at the investor level. t-statistics are given in parentheses. ∗∗∗,∗∗, and ∗ denote statistical significance at the 1%, 5%, and 10% levels, respectively.
(1) (2) (3) (4) (5) (6)
Dependent Variable: FBIASk,j,t
Residual Trusti,t -0.0124∗∗∗ -0.0041∗ -0.0044∗∗ -0.0122∗∗∗ -0.0143∗∗∗ -0.0142∗∗∗
(-12.65) (-1.85) (-2.00) (-12.51) (-6.11) (-6.11)
Familiarity Between Countries:
Geographic Distancei,j 0.0034∗∗∗ 0.0013∗∗∗ 0.0013∗∗∗ 0.0034∗∗∗
(40.82) (10.99) (11.03) (41.21)
Common Language Dummyi,j -0.0017∗∗∗ -0.0030∗∗∗ -0.0030∗∗∗ -0.0017∗∗∗
(-8.11) (-13.88) (-13.95) (-7.86)
Contiguity Dummyi,j -0.0088∗∗∗ -0.0119∗∗∗ -0.0119∗∗∗ -0.0087∗∗∗
(-16.16) (-21.30) (-21.45) (-15.67)
Colony Dummyi,j 0.0076∗∗∗ 0.0110∗∗∗ 0.0110∗∗∗ 0.0072∗∗∗
(23.09) (30.85) (31.06) (21.52)
Same Country Dummyi,j -0.0452∗∗∗ -0.0467∗∗∗ -0.0467∗∗∗ -0.0449∗∗∗
(-7.63) (-7.78) (-7.76) (-7.76)
Investor Characteristics:
Investor Sizek,t 0.0001∗∗∗ -0.0000∗∗ 0.0001∗∗∗ 0.0001∗∗∗ -0.0000∗∗∗ 0.0001∗
(6.71) (-2.26) (2.62) (6.19) (-2.74) (1.75)
Investor Agek,t 0.0002∗∗∗ 0.0001∗∗∗ -0.0000 0.0002∗∗∗ 0.0001∗∗∗ -0.0000(5.55) (5.09) (-0.08) (5.43) (5.32) (-0.85)
Number of Stocksk,t -0.0002∗∗∗ -0.0000∗∗ 0.0000 -0.0001∗∗∗ -0.0000∗∗ 0.0000(-6.87) (-2.38) (0.02) (-6.68) (-2.32) (0.24)
(continued)
62
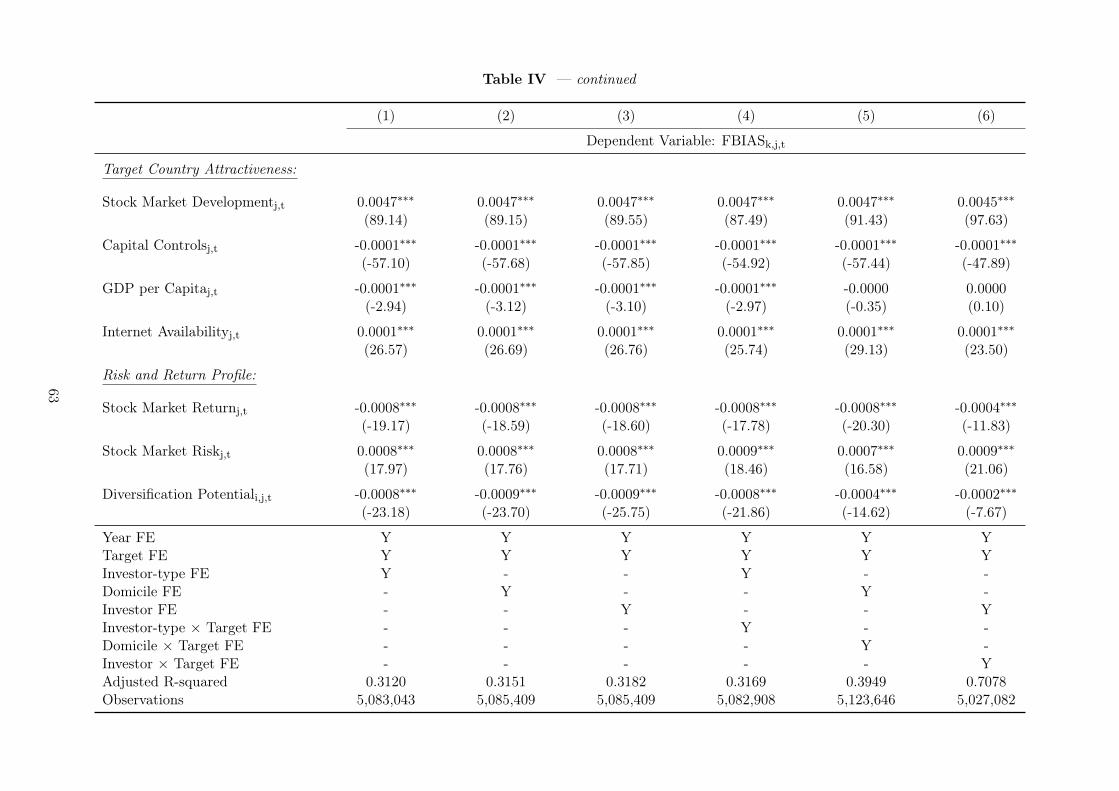
Table IV — continued
(1) (2) (3) (4) (5) (6)
Dependent Variable: FBIASk,j,t
Target Country Attractiveness:
Stock Market Developmentj,t 0.0047∗∗∗ 0.0047∗∗∗ 0.0047∗∗∗ 0.0047∗∗∗ 0.0047∗∗∗ 0.0045∗∗∗
(89.14) (89.15) (89.55) (87.49) (91.43) (97.63)
Capital Controlsj,t -0.0001∗∗∗ -0.0001∗∗∗ -0.0001∗∗∗ -0.0001∗∗∗ -0.0001∗∗∗ -0.0001∗∗∗
(-57.10) (-57.68) (-57.85) (-54.92) (-57.44) (-47.89)
GDP per Capitaj,t -0.0001∗∗∗ -0.0001∗∗∗ -0.0001∗∗∗ -0.0001∗∗∗ -0.0000 0.0000(-2.94) (-3.12) (-3.10) (-2.97) (-0.35) (0.10)
Internet Availabilityj,t 0.0001∗∗∗ 0.0001∗∗∗ 0.0001∗∗∗ 0.0001∗∗∗ 0.0001∗∗∗ 0.0001∗∗∗
(26.57) (26.69) (26.76) (25.74) (29.13) (23.50)
Risk and Return Profile:
Stock Market Returnj,t -0.0008∗∗∗ -0.0008∗∗∗ -0.0008∗∗∗ -0.0008∗∗∗ -0.0008∗∗∗ -0.0004∗∗∗
(-19.17) (-18.59) (-18.60) (-17.78) (-20.30) (-11.83)
Stock Market Riskj,t 0.0008∗∗∗ 0.0008∗∗∗ 0.0008∗∗∗ 0.0009∗∗∗ 0.0007∗∗∗ 0.0009∗∗∗
(17.97) (17.76) (17.71) (18.46) (16.58) (21.06)
Diversification Potentiali,j,t -0.0008∗∗∗ -0.0009∗∗∗ -0.0009∗∗∗ -0.0008∗∗∗ -0.0004∗∗∗ -0.0002∗∗∗
(-23.18) (-23.70) (-25.75) (-21.86) (-14.62) (-7.67)
Year FE Y Y Y Y Y YTarget FE Y Y Y Y Y YInvestor-type FE Y - - Y - -Domicile FE - Y - - Y -Investor FE - - Y - - YInvestor-type × Target FE - - - Y - -Domicile × Target FE - - - - Y -Investor × Target FE - - - - - YAdjusted R-squared 0.3120 0.3151 0.3182 0.3169 0.3949 0.7078Observations 5,083,043 5,085,409 5,085,409 5,082,908 5,123,646 5,027,082
63

Table V: Social Trust as a Substitute for Formal Institutions
The table re-estimates the extended baseline regression specification (see column (6) of Table IV) but adds interaction effects between investor-country residual trust andthe quality of formal institutional frameworks in the host country. Institutional framework variables are defined negatively, i.e., higher values imply poorer institutionalquality. The panel contains only observations where investor i’s country of domicile differs from host country j (i 6= j). Investor-level variables refer to investor k at time t.Investor-country-level variables refer to the investor’s country of domicile i at time t. Bilateral variables on country pairs refer to the investor’s country of domicile i as well ashost country j at time t. For a detailed description of the data, see Table A1 in the appendix. All regression specifications include year fixed effects to isolate the influence ofaggregate time-series trends, target country fixed effects to control for time-constant characteristics of the host country, investor fixed effects to control for time-constant investorcharacteristics as well as investor × target fixed effects to control for time-constant characteristics within investor-target-country pairs. Heteroscedasticity-robust standard errorsare clustered at the investor level. t-statistics are given in parentheses. ∗∗∗,∗∗, and ∗ denote statistical significance at the 1%, 5%, and 10% levels, respectively.
(1) (2) (3) (4) (5) (6)
Dependent Variable: FBIASk,j,t
Residual Trusti,t 0.0028 0.0048 -0.0074 0.0082 -0.0031 -0.0016(0.51) (1.23) (-1.14) (1.45) (-0.60) (-0.60)
Investor Sizek,t 0.0001∗∗ 0.0001∗ 0.0001∗∗∗ 0.0001∗∗ 0.0001∗∗ 0.0001∗∗
(2.20) (1.83) (2.61) (2.20) (2.21) (2.20)
Investor Agek,t -0.0001 -0.0001 -0.0001 -0.0001 -0.0001 -0.0001(-0.85) (-0.87) (-0.82) (-0.88) (-0.83) (-0.82)
Number of Stocksk,t -0.0000 0.0000 -0.0000 -0.0000 -0.0000 -0.0000(-0.18) (0.57) (-0.29) (-0.18) (-0.13) (-0.18)
Stock Market Developmentj,t 0.0046∗∗∗ 0.0043∗∗∗ 0.0054∗∗∗ 0.0046∗∗∗ 0.0046∗∗∗ 0.0046∗∗∗
(78.84) (89.25) (79.63) (78.27) (80.33) (74.08)
Capital Controlsj,t -0.0001∗∗∗ -0.0001∗∗∗ -0.0001∗∗∗ -0.0001∗∗∗ -0.0001∗∗∗ -0.0001∗∗∗
(-20.50) (-43.95) (-21.51) (-19.85) (-22.32) (-19.94)
GDP per Capitaj,t 0.0007∗∗∗ 0.0002∗∗∗ 0.0008∗∗∗ 0.0007∗∗∗ 0.0006∗∗∗ 0.0005∗∗∗
(12.69) (4.39) (14.08) (13.33) (12.09) (10.26)
Internet Availabilityj,t 0.0000∗∗∗ 0.0001∗∗∗ 0.0000∗∗∗ 0.0000∗∗ 0.0000∗∗∗ 0.0000∗∗∗
(2.67) (21.71) (4.37) (2.41) (5.12) (4.33)
Stock Market Returnj,t -0.0012∗∗∗ -0.0008∗∗∗ -0.0016∗∗∗ -0.0012∗∗∗ -0.0015∗∗∗ -0.0015∗∗∗
(-21.40) (-19.32) (-23.95) (-21.11) (-30.79) (-29.15)
Stock Market Riskj,t -0.0059∗∗∗ 0.0059∗∗∗ -0.0061∗∗∗ -0.0057∗∗∗ -0.0056∗∗∗ -0.0063∗∗∗
(-49.55) (29.39) (-40.65) (-46.67) (-41.47) (-46.23)
Diversification Potentiali,j,t 0.0012∗∗∗ -0.0004∗∗∗ 0.0014∗∗∗ 0.0012∗∗∗ 0.0011∗∗∗ 0.0012∗∗∗
(26.42) (-12.10) (23.54) (24.69) (27.13) (25.44)(continued)
64
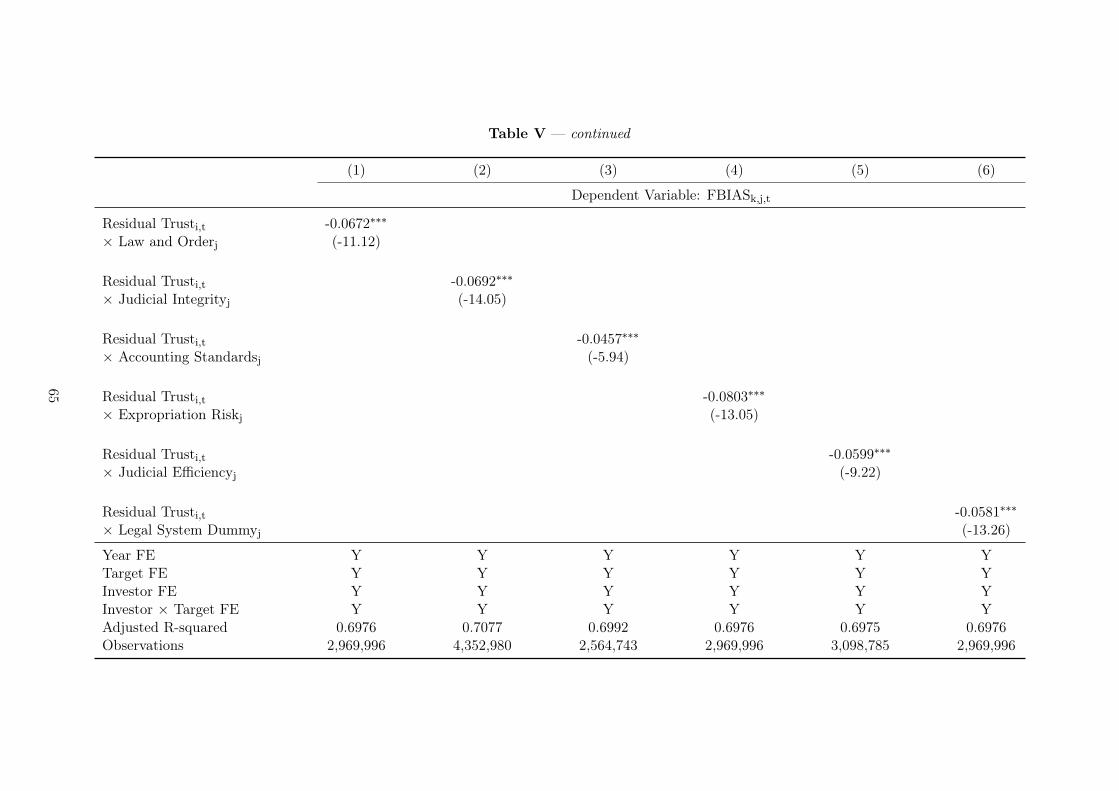
Table V — continued
(1) (2) (3) (4) (5) (6)
Dependent Variable: FBIASk,j,t
Residual Trusti,t -0.0672∗∗∗
× Law and Orderj (-11.12)
Residual Trusti,t -0.0692∗∗∗
× Judicial Integrityj (-14.05)
Residual Trusti,t -0.0457∗∗∗
× Accounting Standardsj (-5.94)
Residual Trusti,t -0.0803∗∗∗
× Expropriation Riskj (-13.05)
Residual Trusti,t -0.0599∗∗∗
× Judicial Efficiencyj (-9.22)
Residual Trusti,t -0.0581∗∗∗
× Legal System Dummyj (-13.26)
Year FE Y Y Y Y Y YTarget FE Y Y Y Y Y YInvestor FE Y Y Y Y Y YInvestor × Target FE Y Y Y Y Y YAdjusted R-squared 0.6976 0.7077 0.6992 0.6976 0.6975 0.6976Observations 2,969,996 4,352,980 2,564,743 2,969,996 3,098,785 2,969,996
65

Table VI: Social Trust During Crisis Times
The table re-estimates the extended baseline regression specification (see column (6) of Table IV) but addsinteraction effects between investor-country residual trust and host-country measures of financial crises. The panelcontains only observations where investor i’s country of domicile differs from host country j (i 6= j). For a detaileddescription of the data, see Table A1 in the appendix. All regression specifications include year fixed effectsto isolate the influence of aggregate time-series trends, target-country fixed effects to control for time-constantcharacteristics of the host country, investor fixed effects to control for time-constant investor characteristics as wellas investor × target fixed effects to control for time-constant characteristics within investor-target-country pairs.Heteroscedasticity-robust standard errors are clustered at the investor level. t-statistics are given in parentheses.∗∗∗,∗∗, and ∗ denote statistical significance at the 1%, 5%, and 10% levels, respectively.
(1) (2)
Dependent Variable: FBIASk,j,t
Residual Trusti,t -0.0279∗∗∗ -0.0282∗∗∗
(-5.83) (-5.87)
Crisis Dummyj,t -0.0023∗∗∗
(-7.99)
Residual Trusti,t × Crisis Dummyj,t -0.0130∗∗∗
(-3.27)
Crisis Output Lossj,t -0.0044∗∗∗
(-7.85)
Residual Trusti,t × Crisis Output Lossj,t -0.0263∗∗∗
(-3.12)
Investor Sizek,t 0.0002∗∗∗ 0.0002∗∗∗
(2.70) (2.67)
Investor Agek,t -0.0001 -0.0001(-0.90) (-0.90)
Number of Stocksk,t -0.0000 -0.0000(-0.11) (-0.11)
Stock Market Developmentj,t 0.0055∗∗∗ 0.0055∗∗∗
(78.72) (77.95)
Capital Controlsj,t -0.0001∗∗∗ -0.0001∗∗∗
(-16.28) (-15.90)
GDP per Capitaj,t 0.0010∗∗∗ 0.0010∗∗∗
(16.56) (16.47)
Internet Availabilityj,t 0.0000∗∗∗ 0.0000∗∗∗
(5.34) (4.47)
Stock Market Returnj,t -0.0015∗∗∗ -0.0015∗∗∗
(-18.60) (-18.14)
Stock Market Riskj,t -0.0144∗∗∗ -0.0148∗∗∗
(-38.47) (-38.98)
Diversification Potentiali,j,t 0.0016∗∗∗ 0.0016∗∗∗
(20.24) (20.73)
Year FE Y YTarget FE Y YInvestor FE Y YInvestor × Target FE Y YAdjusted R-squared 0.6981 0.6980Observations 2,120,079 2,120,079
Table VII: Social Trust and Portfolio Concentration
The table reports estimation results of fixed effects regressions of investor-level measures of portfolio concentrationon residual trust in the investor’s country of domicile, as well as selected control variables. The Global Concentrationand Foreign Concentration measures come from Choi et al. (2017). Global Concentration captures the percentage ofan investor’s entire portfolio that should be re-allocated to achieve full diversification across global markets. ForeignConcentration captures the percentage of an investor’s entire portfolio that should be reallocated to achieve fulldiversification across foreign markets. Investor-level variables refer to investor k at time t. Investor-country-levelvariables refer to the investor’s country of domicile i at time t. For a detailed description of the data, see Table A1in the appendix. All regression specifications include year fixed effects to isolate the influence of aggregatetime-series trends as well as investor fixed effects to control for time-constant characteristics of the investor.Heteroscedasticity-robust standard errors are clustered at the investor level. t-statistics are given in parentheses.∗∗∗,∗∗, and ∗ denote statistical significance at the 1%, 5%, and 10% levels, respectively.
(1) (2)
Dependent Variables: Global Concentrationk,t Foreign Concentrationk,t
Residual Trusti,t -0.5762∗∗∗ -0.1605∗∗∗
(-9.01) (-2.83)
Investor Sizek,t 0.0020∗∗ -0.0002(2.57) (-0.22)
Investor Agek,t -0.0022 -0.0012(-1.51) (-0.93)
Number of Stocksk,t -0.0292∗∗∗ -0.0266∗∗∗
(-21.15) (-21.43)
Stock Market Developmenti,t -0.0399∗∗∗ -0.0311∗∗∗
(-12.46) (-11.37)
Capital Controlsi,t 0.0003∗∗ 0.0002(2.16) (1.30)
GDP per Capitai,t -0.0046∗∗ -0.0086∗∗∗
(-2.24) (-4.84)
Internet Availabilityi,t -0.0008∗∗∗ -0.0000(-4.37) (-0.06)
Stock Market Returni,t -0.0526∗∗∗ -0.0332∗∗∗
(-6.72) (-5.04)
Stock Market Riski,t 0.0353 -0.0256(0.64) (-0.59)
Year FE Y YInvestor FE Y YAdjusted R-squared 0.8122 0.8392Observations 69,725 69,725
67
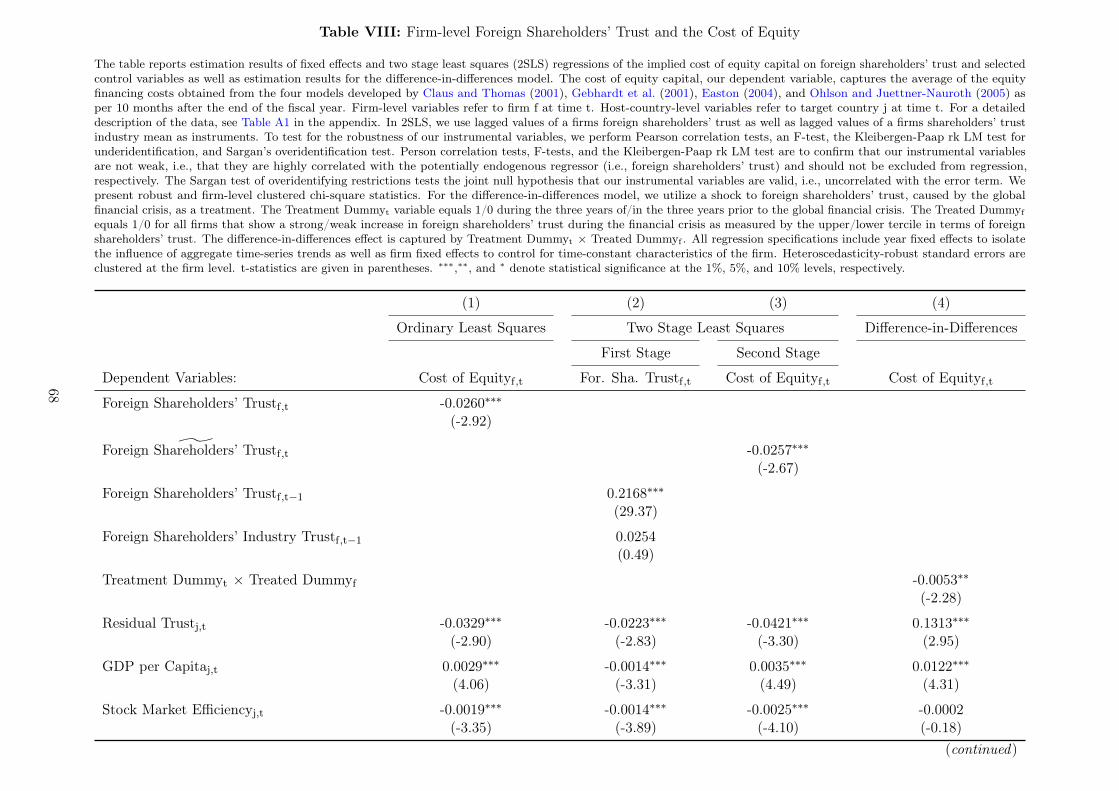
Table VIII: Firm-level Foreign Shareholders’ Trust and the Cost of Equity
The table reports estimation results of fixed effects and two stage least squares (2SLS) regressions of the implied cost of equity capital on foreign shareholders’ trust and selectedcontrol variables as well as estimation results for the difference-in-differences model. The cost of equity capital, our dependent variable, captures the average of the equityfinancing costs obtained from the four models developed by Claus and Thomas (2001), Gebhardt et al. (2001), Easton (2004), and Ohlson and Juettner-Nauroth (2005) asper 10 months after the end of the fiscal year. Firm-level variables refer to firm f at time t. Host-country-level variables refer to target country j at time t. For a detaileddescription of the data, see Table A1 in the appendix. In 2SLS, we use lagged values of a firms foreign shareholders’ trust as well as lagged values of a firms shareholders’ trustindustry mean as instruments. To test for the robustness of our instrumental variables, we perform Pearson correlation tests, an F-test, the Kleibergen-Paap rk LM test forunderidentification, and Sargan’s overidentification test. Person correlation tests, F-tests, and the Kleibergen-Paap rk LM test are to confirm that our instrumental variablesare not weak, i.e., that they are highly correlated with the potentially endogenous regressor (i.e., foreign shareholders’ trust) and should not be excluded from regression,respectively. The Sargan test of overidentifying restrictions tests the joint null hypothesis that our instrumental variables are valid, i.e., uncorrelated with the error term. Wepresent robust and firm-level clustered chi-square statistics. For the difference-in-differences model, we utilize a shock to foreign shareholders’ trust, caused by the globalfinancial crisis, as a treatment. The Treatment Dummyt variable equals 1/0 during the three years of/in the three years prior to the global financial crisis. The Treated Dummyfequals 1/0 for all firms that show a strong/weak increase in foreign shareholders’ trust during the financial crisis as measured by the upper/lower tercile in terms of foreignshareholders’ trust. The difference-in-differences effect is captured by Treatment Dummyt × Treated Dummyf . All regression specifications include year fixed effects to isolatethe influence of aggregate time-series trends as well as firm fixed effects to control for time-constant characteristics of the firm. Heteroscedasticity-robust standard errors areclustered at the firm level. t-statistics are given in parentheses. ∗∗∗,∗∗, and ∗ denote statistical significance at the 1%, 5%, and 10% levels, respectively.
(1) (2) (3) (4)
Ordinary Least Squares Two Stage Least Squares Difference-in-Differences
First Stage Second Stage
Dependent Variables: Cost of Equityf,t For. Sha. Trustf,t Cost of Equityf,t Cost of Equityf,t
Foreign Shareholders’ Trustf,t -0.0260∗∗∗
(-2.92)
˜Foreign Shareholders’ Trustf,t -0.0257∗∗∗
(-2.67)
Foreign Shareholders’ Trustf,t−1 0.2168∗∗∗
(29.37)
Foreign Shareholders’ Industry Trustf,t−1 0.0254(0.49)
Treatment Dummyt × Treated Dummyf -0.0053∗∗
(-2.28)
Residual Trustj,t -0.0329∗∗∗ -0.0223∗∗∗ -0.0421∗∗∗ 0.1313∗∗∗
(-2.90) (-2.83) (-3.30) (2.95)
GDP per Capitaj,t 0.0029∗∗∗ -0.0014∗∗∗ 0.0035∗∗∗ 0.0122∗∗∗
(4.06) (-3.31) (4.49) (4.31)
Stock Market Efficiencyj,t -0.0019∗∗∗ -0.0014∗∗∗ -0.0025∗∗∗ -0.0002(-3.35) (-3.89) (-4.10) (-0.18)
(continued)
68
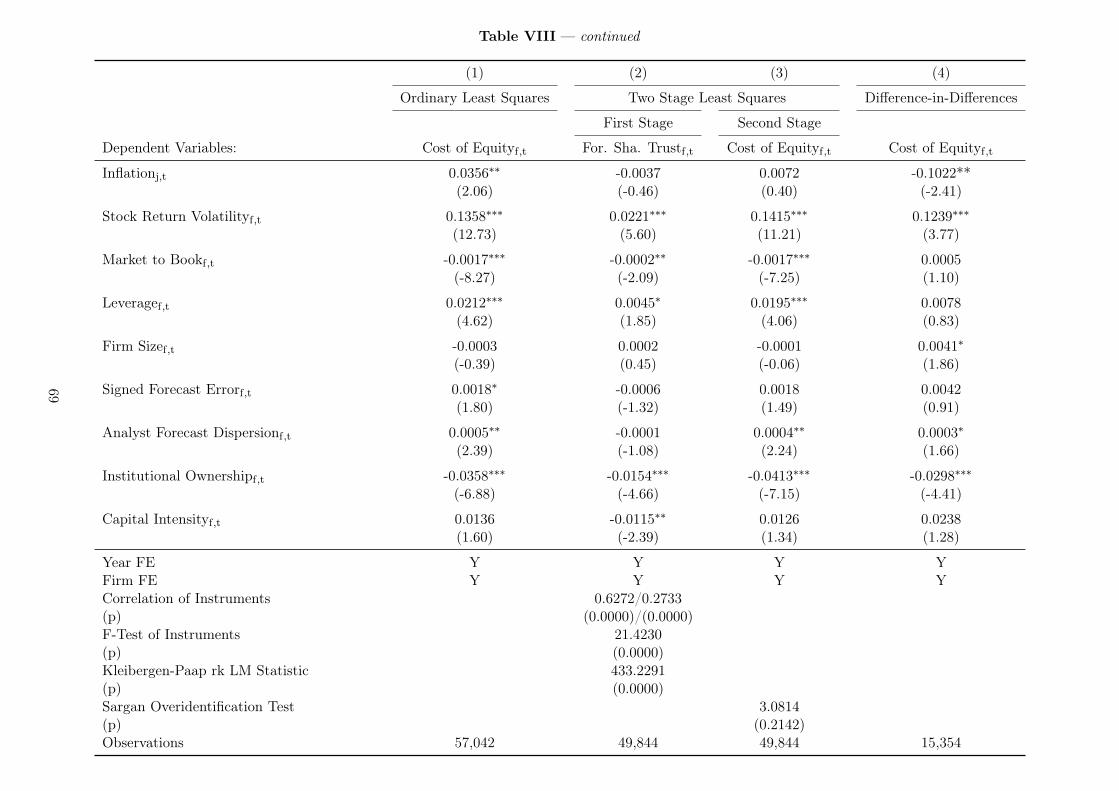
Table VIII — continued
(1) (2) (3) (4)
Ordinary Least Squares Two Stage Least Squares Difference-in-Differences
First Stage Second Stage
Dependent Variables: Cost of Equityf,t For. Sha. Trustf,t Cost of Equityf,t Cost of Equityf,t
Inflationj,t 0.0356∗∗ -0.0037 0.0072 -0.1022**(2.06) (-0.46) (0.40) (-2.41)
Stock Return Volatilityf,t 0.1358∗∗∗ 0.0221∗∗∗ 0.1415∗∗∗ 0.1239∗∗∗
(12.73) (5.60) (11.21) (3.77)
Market to Bookf,t -0.0017∗∗∗ -0.0002∗∗ -0.0017∗∗∗ 0.0005(-8.27) (-2.09) (-7.25) (1.10)
Leveragef,t 0.0212∗∗∗ 0.0045∗ 0.0195∗∗∗ 0.0078(4.62) (1.85) (4.06) (0.83)
Firm Sizef,t -0.0003 0.0002 -0.0001 0.0041∗
(-0.39) (0.45) (-0.06) (1.86)
Signed Forecast Errorf,t 0.0018∗ -0.0006 0.0018 0.0042(1.80) (-1.32) (1.49) (0.91)
Analyst Forecast Dispersionf,t 0.0005∗∗ -0.0001 0.0004∗∗ 0.0003∗
(2.39) (-1.08) (2.24) (1.66)
Institutional Ownershipf,t -0.0358∗∗∗ -0.0154∗∗∗ -0.0413∗∗∗ -0.0298∗∗∗
(-6.88) (-4.66) (-7.15) (-4.41)
Capital Intensityf,t 0.0136 -0.0115∗∗ 0.0126 0.0238(1.60) (-2.39) (1.34) (1.28)
Year FE Y Y Y YFirm FE Y Y Y YCorrelation of Instruments 0.6272/0.2733(p) (0.0000)/(0.0000)F-Test of Instruments 21.4230(p) (0.0000)Kleibergen-Paap rk LM Statistic 433.2291(p) (0.0000)Sargan Overidentification Test 3.0814(p) (0.2142)Observations 57,042 49,844 49,844 15,354
69