Embed Size (px)
Citation preview
DIIPER Development, Innovation and International Political Economy Research
Aalborg University Fibigerstraede 2-8a DK-9220 Aalborg East
Phone: +45 9940 9813 Fax: +45 9635 0044
Mail: [email protected]
DIIPER RESEARCH SERIES
WORKING PAPER NO. 7
ISSN: 1902-8679
Foreign Direct Investment and Internationalization of R&D:
The Case of BRICS Economics
Angathevar Baskaran & Mammo Muchie
© 2008 Angathevar Baskaran & Mammo Muchie Foreign Direct Investment and Internationalization of R&D: The Case of BRICS
Economics Development, Innovation and International Political Economy Research (DIIPER) Aalborg University Denmark DIIPER Research Series Working Paper No. 7 ISSN 1902-8679 Published by DIIPER & Department of History, International and Social Studies Aalborg University Distribution Download as PDF on http://www.diiper.ihis.dk/ Lay-out and word processing Cirkeline Kappel The Secretariat Development, Innovation and International Political Economy Research Fibigerstraede 2, room 99 Aalborg University DK-9220 Aalborg East Denmark Tel. + 45 9940 8310 Fax. + 45 9635 0044 E-mail: [email protected] Homepage: http://www.diiper.ihis.dk/
1
Foreign Direct Investment and Internationalization of R&D: The Case of BRICS Economies1
Angathevar Baskaran2 and Mammo Muchie3
1. Introduction Foreign direct investment (FDI) is increasingly seen as an important source for achieving greater and faster economic growth and technology accumulation in many developing countries. There has been a good number of studies over the years on different aspects of FDI such as its impact on economic growth, its contribution to technology diffusion and human capital formation in the local economy, the factors that determine different level of flow of FDI to different countries, trade and technology development, and its costs and benefits (e.g. OECD, 2002; Wei, 2005; Chakraborty and Basu, 2002; Rajan, 2005). Some of these studies suggest that not only the volume and nature of FDI flow varies greatly across the emerging and less developed economies, but also their ability to absorb and benefit from them and how effectively they use FDI to enhance their national productive systems varies greatly. In this context, what is interesting to study is the increasing trend of locating and organising R&D by foreign companies in emerging market economies through FDI, particularly in the large emerging economies in Asia such as China and India. It appears that increasingly internationalization of R&D is considered an important vehicle to maintain competitiveness in the globalised economic environment. Because of this the attitude of large multinational corporations and other businesses have been changing towards the types of R&D operations being carried out outside their home base. This is illustrated by the development in recent years particularly in China and India, and to a lesser extent in other emerging market economies. Increasingly, not only the volume of R&D has increased but also the degree of complexity and higher value added. What this may mean is that a country that has a relatively functioning NSI can attract FDI in R&D that often TNCs were not willing to engage in the past. It seems clear that FDI for R & D and knowledge transfer means that the relationship between the TNCs and the local subsidiaries is changing. This has implication for economic development. The change may not be because the TNCs have changed their main logic for moving across the world, it may be related to the new stature
1 This paper was presented at the 5th ASIALICS International Conference: “From Manufacturing to Services:
Changing Role of Innovation Systems”, April 2-4, 2008, Bangalore, India. 2 Middlesex University Business School, London, email: [email protected] 3 DIR, Aalborg University, Denmark, email: [email protected]
2
achieved by continental-sized economies such as India and China. In other words as the NIS’ in these countries are relatively stronger and becoming more mature, they are able to manage and absorb the FDI flow better for achieving their socio-economic development goals. In this paper we will examine and analyse the domestic and external factors that are contributing to the increasing volume and complexity in international R&D inflow. We would argue that the capacity to attract international R&D is directly related to the degree of functioning of an economy’s national innovation system. That is, the weakness or strength of NIS influences the nature and volume of international R&D inflow through FDI. For this, we take the case of BRICS economies – Brazil, India, China and South Africa (excluding Russia). We aim to generate comparative insights by taking into account differences in the NIS across these countries and how that impact on the nature and shape of FDI in R&D in these economies. In this paper we also attempt to examine whether there are emerging sectors that are being opened by BRICS economies with changes to regulatory arrangements and incentives to attract international R&D flow thorough FDI. Conversely, we would also attempt to examine it from the side of the companies, corporations and their home base constraints that impel them to engage in internationalization of R&D through FDI. In other words, we would attempt to understand whether FDI is playing a significant role in specific sectors such as Telecom or IT in BRICS countries, particularly in China and India contributing to a dramatic shift in the world economy. 2. National Innovation System (NIS) and FDI in R&D: A Conceptual Framework National innovation system (NIS), we would argue, is not just a tool to achieve the narrow goal of industrial/economic competitiveness, but it is about achieving a broader development and wider social benefits. Major elements of NIS can be identified as: 1. Conceptual Framing: that is, ideas, policies need to be linked to a conceptual framing of how economics and politics are co-governed and/or co-evolved. And responding to opportunities, and dealing with challenges require policies to be rooted in a conceptual framework that governs the dynamic interaction between a nation’s political and economic change. 2. Co-evolution of Institutions, Technologies, and Knowledge: This needs strong interaction, linkages, synergies, and co-ordination to achieve coherent co-
3
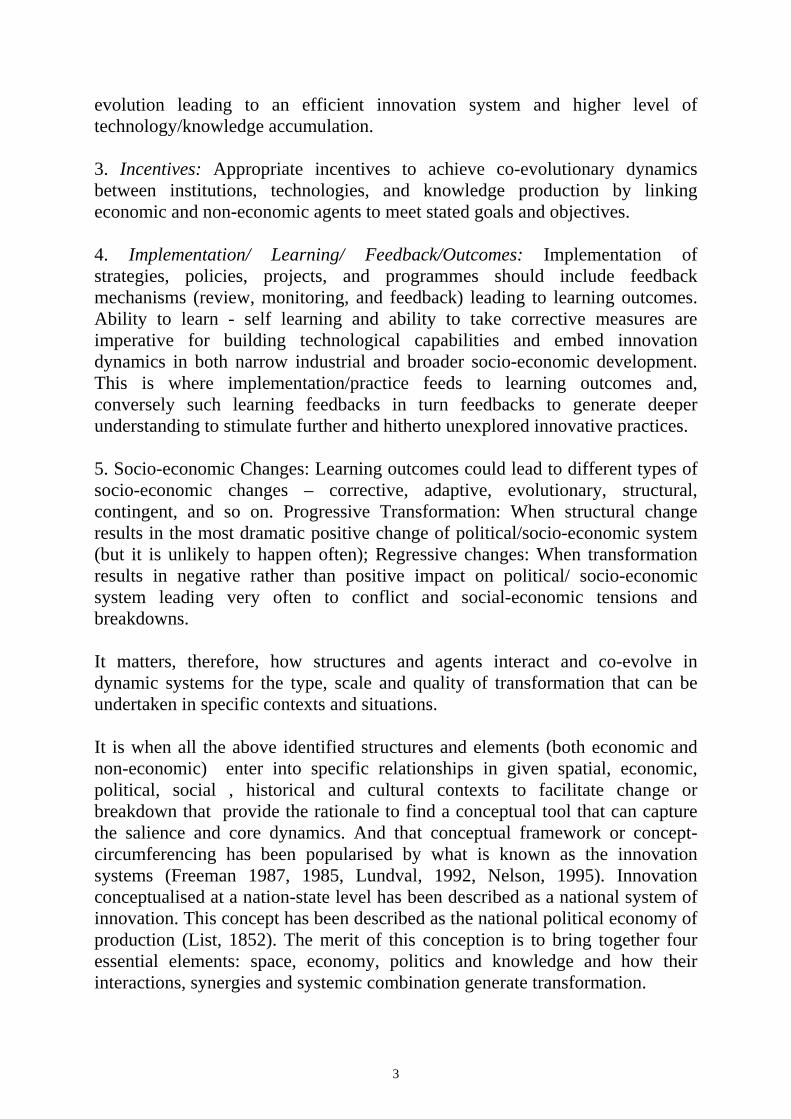
evolution leading to an efficient innovation system and higher level of technology/knowledge accumulation. 3. Incentives: Appropriate incentives to achieve co-evolutionary dynamics between institutions, technologies, and knowledge production by linking economic and non-economic agents to meet stated goals and objectives. 4. Implementation/ Learning/ Feedback/Outcomes: Implementation of strategies, policies, projects, and programmes should include feedback mechanisms (review, monitoring, and feedback) leading to learning outcomes. Ability to learn - self learning and ability to take corrective measures are imperative for building technological capabilities and embed innovation dynamics in both narrow industrial and broader socio-economic development. This is where implementation/practice feeds to learning outcomes and, conversely such learning feedbacks in turn feedbacks to generate deeper understanding to stimulate further and hitherto unexplored innovative practices. 5. Socio-economic Changes: Learning outcomes could lead to different types of socio-economic changes – corrective, adaptive, evolutionary, structural, contingent, and so on. Progressive Transformation: When structural change results in the most dramatic positive change of political/socio-economic system (but it is unlikely to happen often); Regressive changes: When transformation results in negative rather than positive impact on political/ socio-economic system leading very often to conflict and social-economic tensions and breakdowns. It matters, therefore, how structures and agents interact and co-evolve in dynamic systems for the type, scale and quality of transformation that can be undertaken in specific contexts and situations. It is when all the above identified structures and elements (both economic and non-economic) enter into specific relationships in given spatial, economic, political, social , historical and cultural contexts to facilitate change or breakdown that provide the rationale to find a conceptual tool that can capture the salience and core dynamics. And that conceptual framework or concept-circumferencing has been popularised by what is known as the innovation systems (Freeman 1987, 1985, Lundval, 1992, Nelson, 1995). Innovation conceptualised at a nation-state level has been described as a national system of innovation. This concept has been described as the national political economy of production (List, 1852). The merit of this conception is to bring together four essential elements: space, economy, politics and knowledge and how their interactions, synergies and systemic combination generate transformation.

4
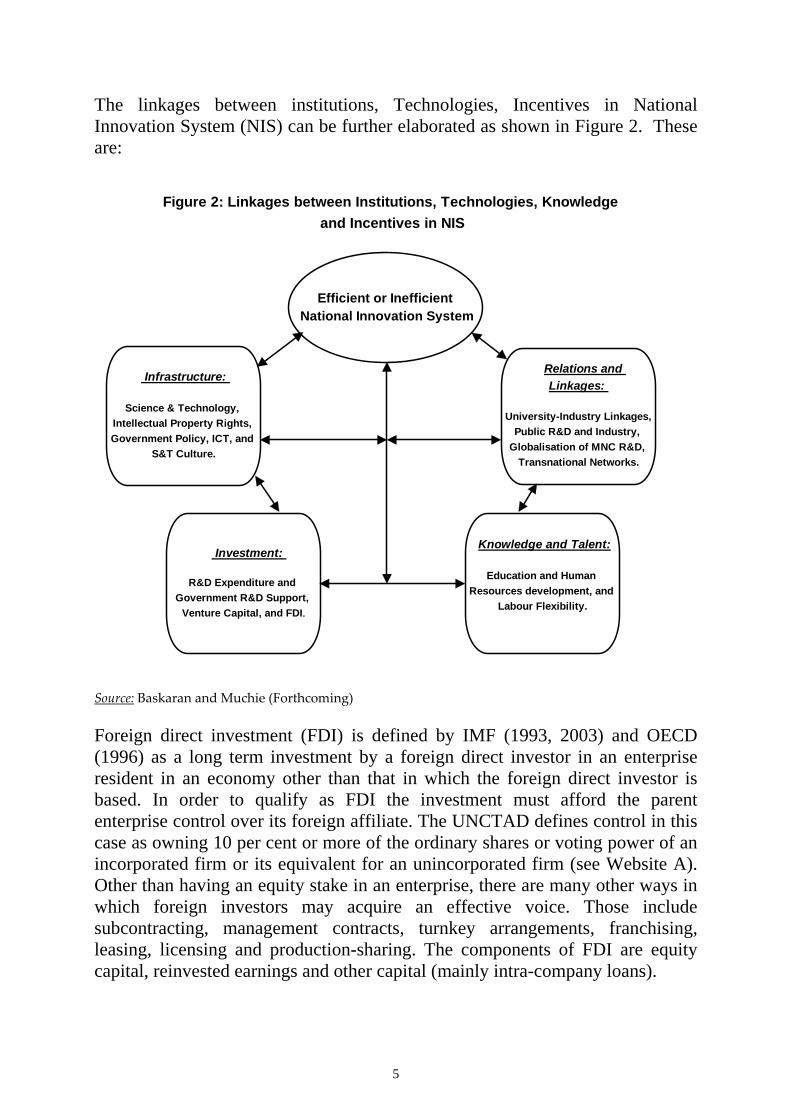
The way the elements interact in given historical contexts that nations are in can either lead to dynamic efficiencies or inefficiencies. It matters therefore how the elements are linked and co-evolved to achieve an efficient innovation system leading to higher level of technology accumulation and economic development. This is captured by Figure 1. Linkages and co-evolution that lead to inefficient national innovation system can be shown by reversing the arrow in Figure 1. Source: Baskaran and Muchie (Forthcoming) 1. Infrastructure: Science & Technology, Intellectual Property Rights, Government Policy, ICT, and Culture; 2. Investment: R&D Expenditure and Government R&D Support, Venture Capital, and FDI; 3. Knowledge and Talent: Education and Human Resources development, and Labour Flexibility; 4. Relations and Linkages: University-Industry Linkages, Public R&D and Industry, Globalisation of MNC R&D, Transnational Networks.
NIS
Conceptual Framing
Ideas, policies need to be linked to a conceptual framing of how economics and politics play out.
Institutions, Technologies, and Knowledge:
Need strong interaction, linkages, synergies, and co-ordination to achieve more efficient innovation system and
higher level of technology accumulation
Implementation/ Learning Oucomes and Changes :
Implementation of strategies, policies and programmes should include feedback
mechanisms
Ability to learn and ability to take corrective measures are imperative for building technological capabilities and imbed innovation dynamics in industrial and
socio-economic development
Learning outcomes could lead to different types of socio-economic changes –
corrective, adaptive, evolutionary, modifying, and so on (Transformation/ Regressive)
Incentives:
Appropriate incentives to institutions lead to
co-evolutionary dynamics between institution, technology,
and knowledge production by linking economic and non-economic agents.
Figure 1: Major Elements of National Innovation System (NIS)
5
The linkages between institutions, Technologies, Incentives in National Innovation System (NIS) can be further elaborated as shown in Figure 2. These are: Source: Baskaran and Muchie (Forthcoming) Foreign direct investment (FDI) is defined by IMF (1993, 2003) and OECD (1996) as a long term investment by a foreign direct investor in an enterprise resident in an economy other than that in which the foreign direct investor is based. In order to qualify as FDI the investment must afford the parent enterprise control over its foreign affiliate. The UNCTAD defines control in this case as owning 10 per cent or more of the ordinary shares or voting power of an incorporated firm or its equivalent for an unincorporated firm (see Website A). Other than having an equity stake in an enterprise, there are many other ways in which foreign investors may acquire an effective voice. Those include subcontracting, management contracts, turnkey arrangements, franchising, leasing, licensing and production-sharing. The components of FDI are equity capital, reinvested earnings and other capital (mainly intra-company loans).
Efficient or Inefficient National Innovation System
Infrastructure:
Science & Technology, Intellectual Property Rights, Government Policy, ICT, and
S&T Culture.
Investment:
R&D Expenditure and Government R&D Support,
Venture Capital, and FDI.
Relations and Linkages:
University-Industry Linkages, Public R&D and Industry,
Globalisation of MNC R&D, Transnational Networks.
Knowledge and Talent:
Education and Human Resources development, and
Labour Flexibility.
Figure 2: Linkages between Institutions, Technologies, Knowledge and Incentives in NIS
6
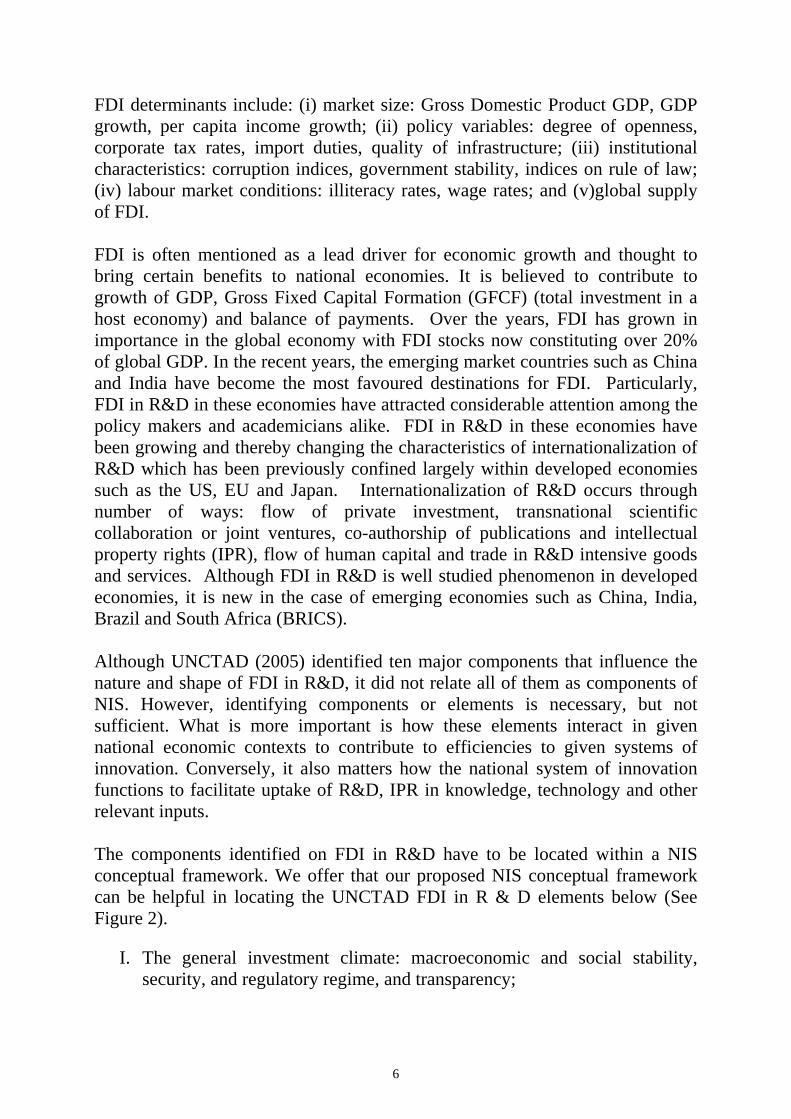
FDI determinants include: (i) market size: Gross Domestic Product GDP, GDP growth, per capita income growth; (ii) policy variables: degree of openness, corporate tax rates, import duties, quality of infrastructure; (iii) institutional characteristics: corruption indices, government stability, indices on rule of law; (iv) labour market conditions: illiteracy rates, wage rates; and (v)global supply of FDI. FDI is often mentioned as a lead driver for economic growth and thought to bring certain benefits to national economies. It is believed to contribute to growth of GDP, Gross Fixed Capital Formation (GFCF) (total investment in a host economy) and balance of payments. Over the years, FDI has grown in importance in the global economy with FDI stocks now constituting over 20% of global GDP. In the recent years, the emerging market countries such as China and India have become the most favoured destinations for FDI. Particularly, FDI in R&D in these economies have attracted considerable attention among the policy makers and academicians alike. FDI in R&D in these economies have been growing and thereby changing the characteristics of internationalization of R&D which has been previously confined largely within developed economies such as the US, EU and Japan. Internationalization of R&D occurs through number of ways: flow of private investment, transnational scientific collaboration or joint ventures, co-authorship of publications and intellectual property rights (IPR), flow of human capital and trade in R&D intensive goods and services. Although FDI in R&D is well studied phenomenon in developed economies, it is new in the case of emerging economies such as China, India, Brazil and South Africa (BRICS). Although UNCTAD (2005) identified ten major components that influence the nature and shape of FDI in R&D, it did not relate all of them as components of NIS. However, identifying components or elements is necessary, but not sufficient. What is more important is how these elements interact in given national economic contexts to contribute to efficiencies to given systems of innovation. Conversely, it also matters how the national system of innovation functions to facilitate uptake of R&D, IPR in knowledge, technology and other relevant inputs. The components identified on FDI in R&D have to be located within a NIS conceptual framework. We offer that our proposed NIS conceptual framework can be helpful in locating the UNCTAD FDI in R & D elements below (See Figure 2).
I. The general investment climate: macroeconomic and social stability, security, and regulatory regime, and transparency;
7
II. Economic structure: industrial structure, market size, natural resources, infrastructure, and culture and language;
III. Availability of scientific and engineering skills for competitive wage rates compared to developed countries;
IV. Strong educational system, particularly technical tertiary education system producing skilled and quality technical people and researchers;
V. Presence of R&D performing institutions (Private and public firms and labs, universities) and standards and quality setting institutions;
VI. Presence of institutions (universities and other) doing high level of basic research and publications;
VII. Strong links between knowledge institutions and production enterprises; VIII. Strong IPR regime, particularly to protect industries where technologies
are easy to imitate; IX. Presence of dynamic science parks that facilitates interaction between
diverse range of firms and institutions; X. Presence of diverse industrial structure with high class clusters of
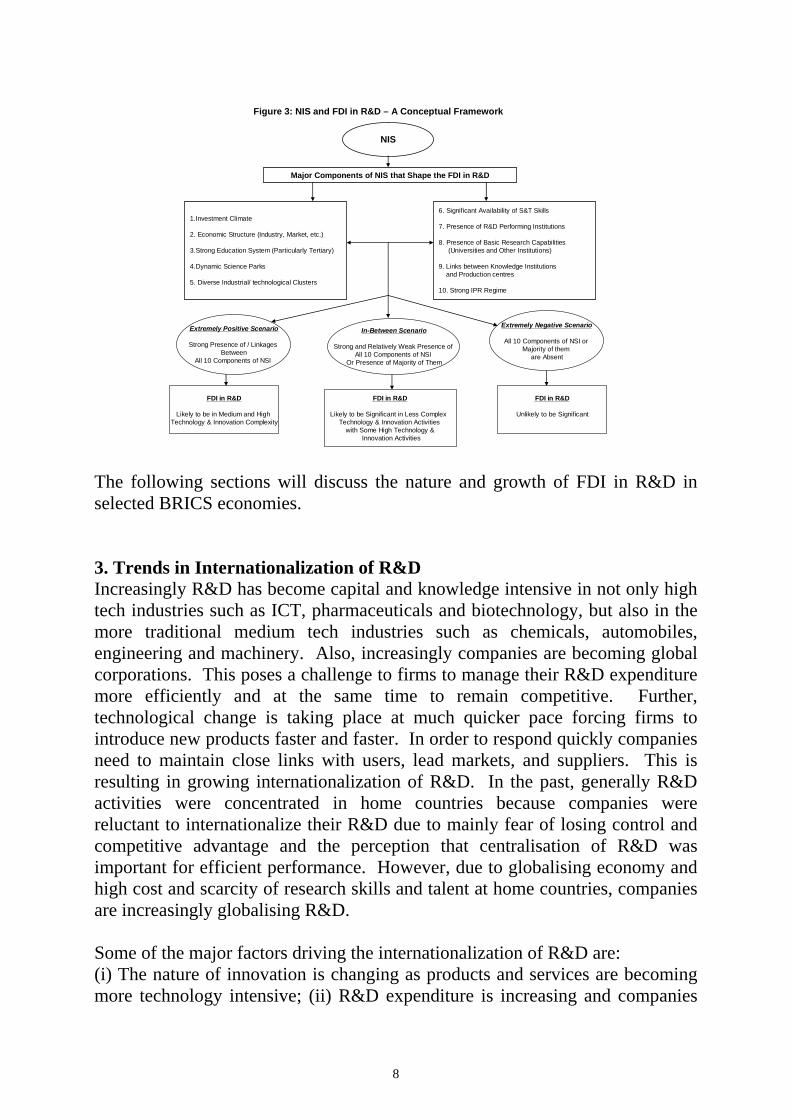
technological and industrial activity. In an extremely positive scenario, when all these ten components are strongly present in a country’s NIS, then we can argue that it is quite likely that the NIS is to be more efficient in attracting FDI in R&D at both medium and higher level of technological and innovation complexity. On the other extreme, when all these ten components or majority of them are not present in a country’s NIS, it is quite likely that the NIS will fail to attract any meaningful FDI in R&D. However, if a country’s NIS possesses majority of these elements (but not all of them), or it possesses some strong elements and some weak elements at varying degrees, then it is quite likely that it will be able to attract significant FDI in R&D related to less complex technological and innovative activities and it is also likely to attract R&D in some higher level of innovation and technological activities in selected areas. This is illustrated in Figure 3.
8
NIS
Figure 3: NIS and FDI in R&D – A Conceptual Framework
Major Components of NIS that Shape the FDI in R&D
1.Investment Climate
2. Economic Structure (Industry, Market, etc.)
3.Strong Education System (Particularly Tertiary)
4.Dynamic Science Parks
5. Diverse Industrial/ technological Clusters
6. Significant Availability of S&T Skills
7. Presence of R&D Performing Institutions
8. Presence of Basic Research Capabilities (Universities and Other Institutions)
9. Links between Knowledge Institutions and Production centres
10. Strong IPR Regime
Extremely Positive Scenario
Strong Presence of / Linkages Between
All 10 Components of NSI
Extremely Negative Scenario
All 10 Components of NSI or Majority of them
are Absent
In-Between Scenario
Strong and Relatively Weak Presence of All 10 Components of NSI
Or Presence of Majority of Them
FDI in R&D
Likely to be in Medium and High Technology & Innovation Complexity
FDI in R&D
Unlikely to be Significant
FDI in R&D
Likely to be Significant in Less Complex Technology & Innovation Activities
with Some High Technology &Innovation Activities
The following sections will discuss the nature and growth of FDI in R&D in selected BRICS economies. 3. Trends in Internationalization of R&D Increasingly R&D has become capital and knowledge intensive in not only high tech industries such as ICT, pharmaceuticals and biotechnology, but also in the more traditional medium tech industries such as chemicals, automobiles, engineering and machinery. Also, increasingly companies are becoming global corporations. This poses a challenge to firms to manage their R&D expenditure more efficiently and at the same time to remain competitive. Further, technological change is taking place at much quicker pace forcing firms to introduce new products faster and faster. In order to respond quickly companies need to maintain close links with users, lead markets, and suppliers. This is resulting in growing internationalization of R&D. In the past, generally R&D activities were concentrated in home countries because companies were reluctant to internationalize their R&D due to mainly fear of losing control and competitive advantage and the perception that centralisation of R&D was important for efficient performance. However, due to globalising economy and high cost and scarcity of research skills and talent at home countries, companies are increasingly globalising R&D. Some of the major factors driving the internationalization of R&D are: (i) The nature of innovation is changing as products and services are becoming more technology intensive; (ii) R&D expenditure is increasing and companies
9
are forced to find cost effective measures; (iii) Proximity to markets and production, that is, the need for localisation and customisation of global products; (iv) Maintaining competitiveness over rivals in lead markets; (v) Government policies and incentives, governance in host countries; (vi) Sophisticated ICT infrastructure enables and helps companies to manage R&D globally; (vii) Availability of cheap and large number of research skills and talent particularly in some merging economies; and (viii) International mobility and availability of skilled human resources (OECD, 2008, pp.17-18). Some of the main trends in internationalization of R&D are: (i) R&D investment by Transnational Corporations (TNCs) abroad is increasingly compared to the investment at their home countries; (ii) Emergence of R&D alliances with other firms and universities abroad; (iii) Establishment of R&D centres or units abroad; (iv) Recruiting researchers from anywhere in the world; (iv) Firms are ready to set up R&D centres where skills and talents are available; (v) Links between university and industrial R&D are not based on nationality of the firm and university; and (vi) R&D centres within a firm are collaborating more closely for joint product development to cut cost and speed up the development cycle (OECD, 2008, p.5).
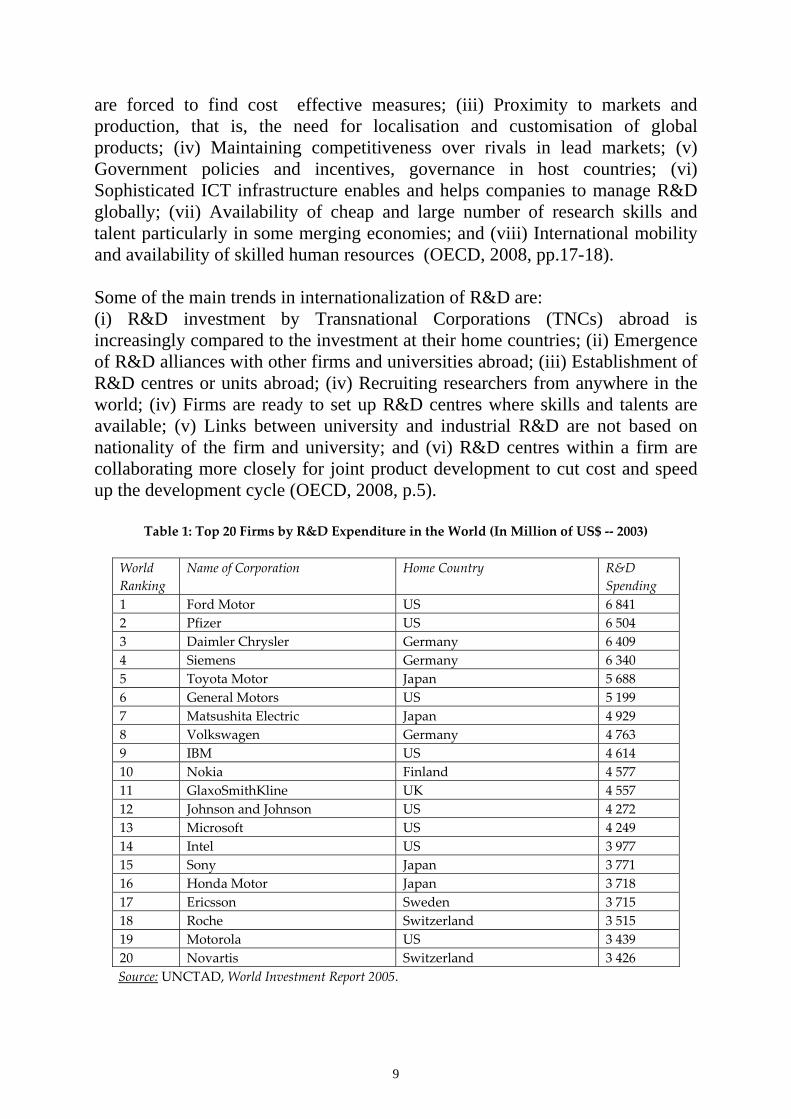
Table 1: Top 20 Firms by R&D Expenditure in the World (In Million of US$ ‐‐ 2003)
World Ranking
Name of Corporation Home Country R&D Spending
1 Ford Motor US 6 841 2 Pfizer US 6 504 3 Daimler Chrysler Germany 6 409 4 Siemens Germany 6 340 5 Toyota Motor Japan 5 688 6 General Motors US 5 199 7 Matsushita Electric Japan 4 929 8 Volkswagen Germany 4 763 9 IBM US 4 614 10 Nokia Finland 4 577 11 GlaxoSmithKline UK 4 557 12 Johnson and Johnson US 4 272 13 Microsoft US 4 249 14 Intel US 3 977 15 Sony Japan 3 771 16 Honda Motor Japan 3 718 17 Ericsson Sweden 3 715 18 Roche Switzerland 3 515 19 Motorola US 3 439 20 Novartis Switzerland 3 426
Source: UNCTAD, World Investment Report 2005.
10
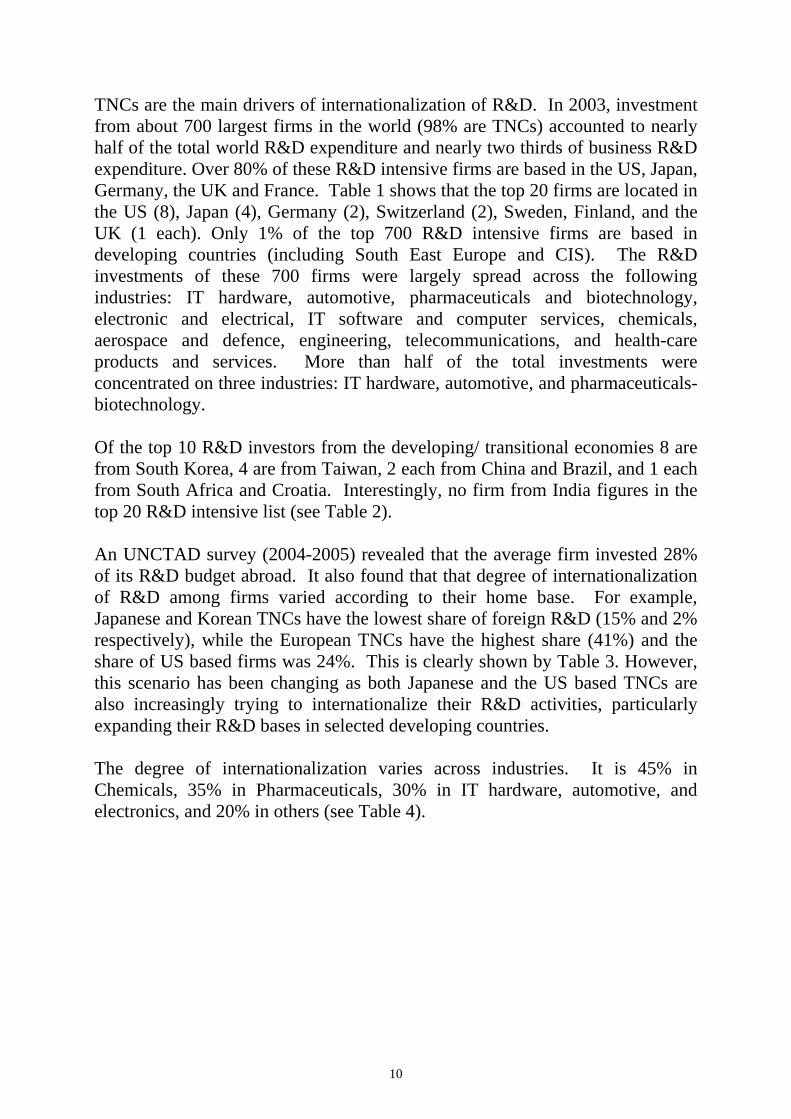
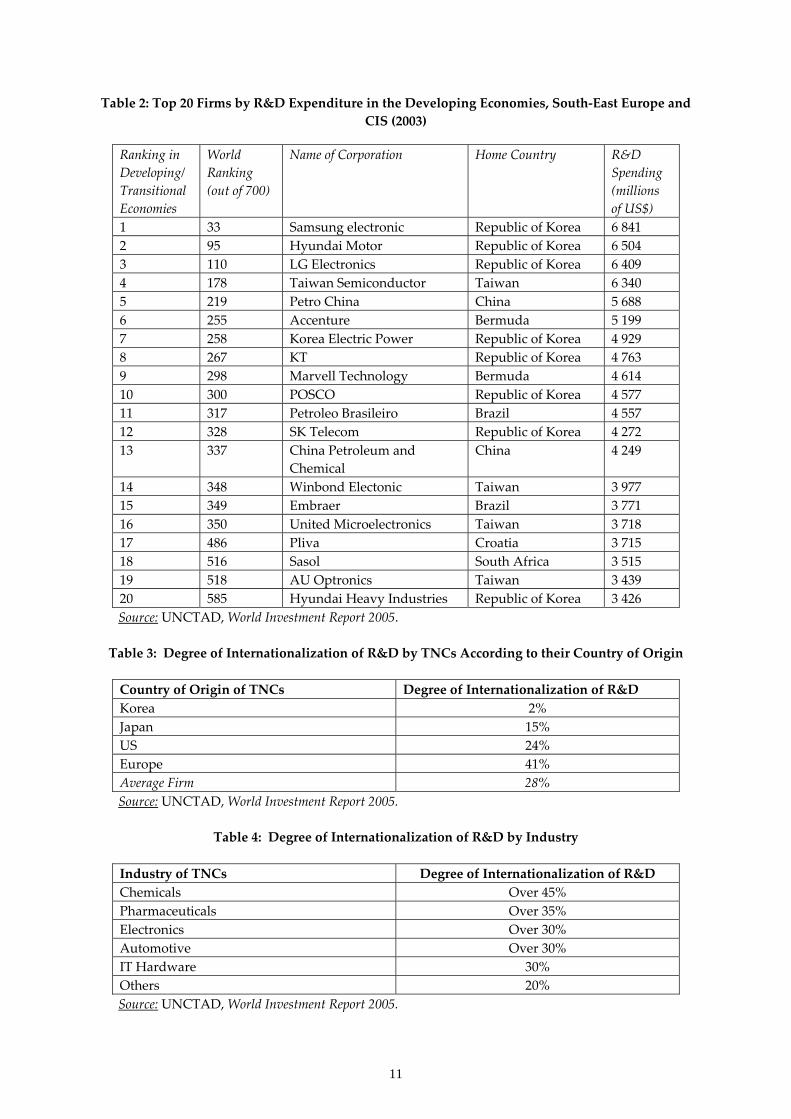
TNCs are the main drivers of internationalization of R&D. In 2003, investment from about 700 largest firms in the world (98% are TNCs) accounted to nearly half of the total world R&D expenditure and nearly two thirds of business R&D expenditure. Over 80% of these R&D intensive firms are based in the US, Japan, Germany, the UK and France. Table 1 shows that the top 20 firms are located in the US (8), Japan (4), Germany (2), Switzerland (2), Sweden, Finland, and the UK (1 each). Only 1% of the top 700 R&D intensive firms are based in developing countries (including South East Europe and CIS). The R&D investments of these 700 firms were largely spread across the following industries: IT hardware, automotive, pharmaceuticals and biotechnology, electronic and electrical, IT software and computer services, chemicals, aerospace and defence, engineering, telecommunications, and health-care products and services. More than half of the total investments were concentrated on three industries: IT hardware, automotive, and pharmaceuticals-biotechnology. Of the top 10 R&D investors from the developing/ transitional economies 8 are from South Korea, 4 are from Taiwan, 2 each from China and Brazil, and 1 each from South Africa and Croatia. Interestingly, no firm from India figures in the top 20 R&D intensive list (see Table 2). An UNCTAD survey (2004-2005) revealed that the average firm invested 28% of its R&D budget abroad. It also found that that degree of internationalization of R&D among firms varied according to their home base. For example, Japanese and Korean TNCs have the lowest share of foreign R&D (15% and 2% respectively), while the European TNCs have the highest share (41%) and the share of US based firms was 24%. This is clearly shown by Table 3. However, this scenario has been changing as both Japanese and the US based TNCs are also increasingly trying to internationalize their R&D activities, particularly expanding their R&D bases in selected developing countries. The degree of internationalization varies across industries. It is 45% in Chemicals, 35% in Pharmaceuticals, 30% in IT hardware, automotive, and electronics, and 20% in others (see Table 4).
11
Table 2: Top 20 Firms by R&D Expenditure in the Developing Economies, South‐East Europe and CIS (2003)
Ranking in Developing/ Transitional Economies
World Ranking (out of 700)
Name of Corporation Home Country R&D Spending (millions of US$)
1 33 Samsung electronic Republic of Korea 6 841 2 95 Hyundai Motor Republic of Korea 6 504 3 110 LG Electronics Republic of Korea 6 409 4 178 Taiwan Semiconductor Taiwan 6 340 5 219 Petro China China 5 688 6 255 Accenture Bermuda 5 199 7 258 Korea Electric Power Republic of Korea 4 929 8 267 KT Republic of Korea 4 763 9 298 Marvell Technology Bermuda 4 614 10 300 POSCO Republic of Korea 4 577 11 317 Petroleo Brasileiro Brazil 4 557 12 328 SK Telecom Republic of Korea 4 272 13 337 China Petroleum and
Chemical China 4 249
14 348 Winbond Electonic Taiwan 3 977 15 349 Embraer Brazil 3 771 16 350 United Microelectronics Taiwan 3 718 17 486 Pliva Croatia 3 715 18 516 Sasol South Africa 3 515 19 518 AU Optronics Taiwan 3 439 20 585 Hyundai Heavy Industries Republic of Korea 3 426
Source: UNCTAD, World Investment Report 2005.
Table 3: Degree of Internationalization of R&D by TNCs According to their Country of Origin
Country of Origin of TNCs Degree of Internationalization of R&D Korea 2% Japan 15% US 24% Europe 41% Average Firm 28%
Source: UNCTAD, World Investment Report 2005.
Table 4: Degree of Internationalization of R&D by Industry
Industry of TNCs Degree of Internationalization of R&D Chemicals Over 45% Pharmaceuticals Over 35% Electronics Over 30% Automotive Over 30% IT Hardware 30% Others 20%
Source: UNCTAD, World Investment Report 2005.

12
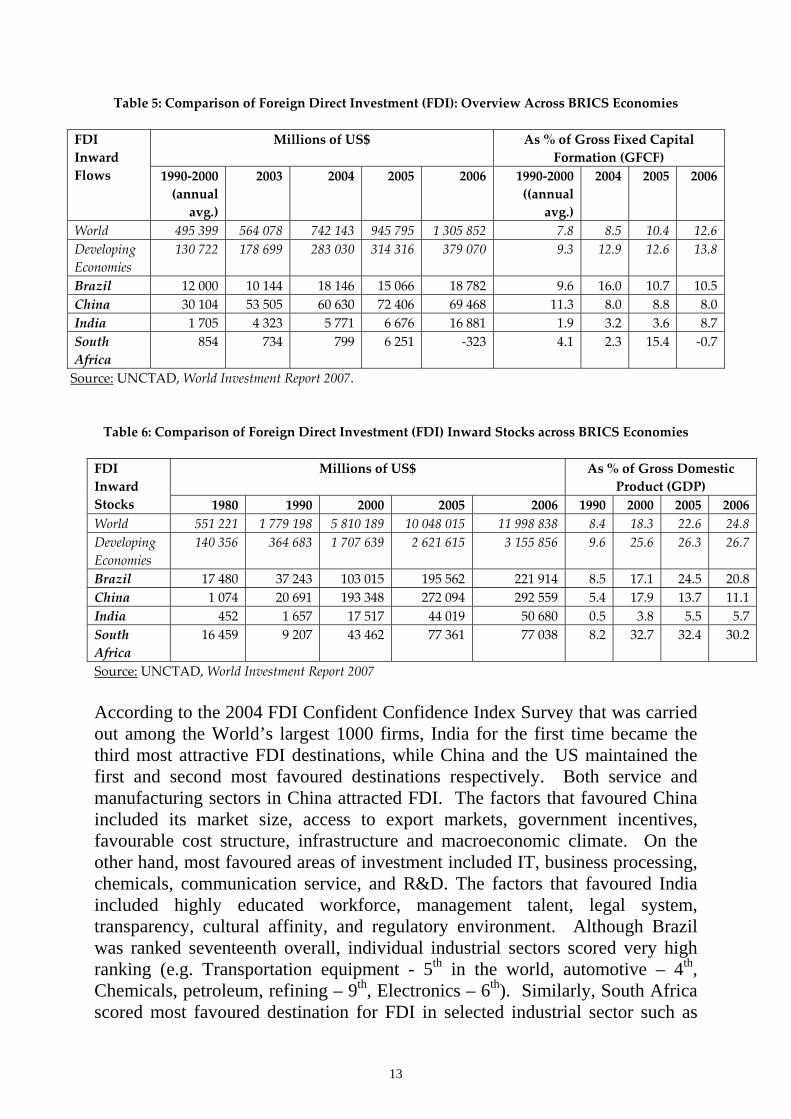
Increasingly, the foreign affiliates of TNCs are playing a major role in R&D activities in many countries, particularly in selected developing economies. Between 1993 and 2002, their investment doubled from $29 billion to $67 billion (i.e. 16% of global business R&D). However, the share of foreign affiliates in host countries varies across countries. For example, it is 47.9% in Brazil, 23.7% in China and it is less than 10% in India. For example, in the case of foreign affiliates of the US based TNCs, between 1994 and 2002, the share of R&D in developed countries declined by 8% and the share of developing countries increased by 6%. However, the R&D by foreign affiliates of US TNCs are mainly concentrated in China, Singapore, Brazil, Mexico, and South Korea in that order. Even in the case of Japan, a survey by the Japan Bank for International Cooperation (JBIC) showed that the R&D centres established by Japanese companies in developing countries have increased from 41 to 135 between 2000 and 2004. Particularly, the Japanese R&D centres in China have increased from 13 to 67 during the same period (UNCTAD, 2005, pp.129-131). 4. BRICS Economies: FDI in R&D Table 5 provides comparison of FDI annual overview across BRICS economies (between 1990 and 2006), and FDI as percentage of Gross Fixed Capital Formation (GFCF). It is clear that among the BRICS economies, China tops the annul FDI inflow, followed by Brazil, and India. However, in terms of FDI as percentage of GFCF, Brazil tops the table followed by China and India. South Africa’s annual FDI inflow and FDI as percentage of GFCF are inconsistent (this is explained later). Table 6 provides comparison of FDI inward stocks across BRICS economies and FDI inward stock as percentage of GDP. It is clear that since 2000, China emerged on the top in terms of FDI stocks inflow followed by Brazil, South Africa and India. However, in terms of FDI inward stocks as percentage of GDP, South Africa tops the list followed by Brazil, China and India. Overall, Tables 5 and 6 show that FDI inflow to BRICS economies have been growing significantly between 2004 and 2006 (with few exceptions).
13
Table 5: Comparison of Foreign Direct Investment (FDI): Overview Across BRICS Economies
Millions of US$ As % of Gross Fixed Capital Formation (GFCF)
FDI Inward Flows 1990‐2000
(annual avg.)
2003 2004 2005 2006 1990‐2000 ((annual
avg.)
2004 2005 2006
World 495 399 564 078 742 143 945 795 1 305 852 7.8 8.5 10.4 12.6 Developing Economies
130 722 178 699 283 030 314 316 379 070 9.3 12.9 12.6 13.8
Brazil 12 000 10 144 18 146 15 066 18 782 9.6 16.0 10.7 10.5 China 30 104 53 505 60 630 72 406 69 468 11.3 8.0 8.8 8.0 India 1 705 4 323 5 771 6 676 16 881 1.9 3.2 3.6 8.7 South Africa
854 734 799 6 251 ‐323 4.1 2.3 15.4 ‐0.7
Source: UNCTAD, World Investment Report 2007. Table 6: Comparison of Foreign Direct Investment (FDI) Inward Stocks across BRICS Economies
Millions of US$ As % of Gross Domestic Product (GDP)
FDI Inward Stocks 1980 1990 2000 2005 2006 1990 2000 2005 2006 World 551 221 1 779 198 5 810 189 10 048 015 11 998 838 8.4 18.3 22.6 24.8 Developing Economies
140 356 364 683 1 707 639 2 621 615 3 155 856 9.6 25.6 26.3 26.7
Brazil 17 480 37 243 103 015 195 562 221 914 8.5 17.1 24.5 20.8 China 1 074 20 691 193 348 272 094 292 559 5.4 17.9 13.7 11.1 India 452 1 657 17 517 44 019 50 680 0.5 3.8 5.5 5.7 South Africa
16 459 9 207 43 462 77 361 77 038 8.2 32.7 32.4 30.2
Source: UNCTAD, World Investment Report 2007 According to the 2004 FDI Confident Confidence Index Survey that was carried out among the World’s largest 1000 firms, India for the first time became the third most attractive FDI destinations, while China and the US maintained the first and second most favoured destinations respectively. Both service and manufacturing sectors in China attracted FDI. The factors that favoured China included its market size, access to export markets, government incentives, favourable cost structure, infrastructure and macroeconomic climate. On the other hand, most favoured areas of investment included IT, business processing, chemicals, communication service, and R&D. The factors that favoured India included highly educated workforce, management talent, legal system, transparency, cultural affinity, and regulatory environment. Although Brazil was ranked seventeenth overall, individual industrial sectors scored very high ranking (e.g. Transportation equipment - 5th in the world, automotive – 4th, Chemicals, petroleum, refining – 9th, Electronics – 6th). Similarly, South Africa scored most favoured destination for FDI in selected industrial sector such as
14
Transportation equipment (6th in the world) and automotive and among investors from particular countries (AT Kearney, 2004; 2005). In 2005, India became the second most favoured FDI destination. And Brazil moved up to 7th position in the ranking from 17th in 2004. Both India and China came to be increasingly seen as sources of innovation and attractive R&D locations, “as R&D – the least globalised corporate activity – becomes mobile” (AT Kearney, 2005, p. 2.). FDI in R&D in China has reached $4 billion and the number of foreign affiliate R&D centres reached 700 by 2004. Foreign share of R&D in the manufacturing sector (excluding FDI in independent R&D centres) was 21% in 1998 and it increased to 29% in 2004 (Lundin et al., 2007, p.11). Although it is not growing fast, China has become increasingly attractive for foreign R&D investment. Most of these centres were wholly owned by their parent companies and some are joint ventures (e.g. joint venture by Lenovo and Intel). These centres are mainly focused on adaptive innovations for the Chinese market and they also do R&D for global markets. These centres were concentrated in large cities such as Beijing and Shanghai with strong technological base and easy availability of skilled human resources. For example, about 60% of the total TNC R&D centres were located in Beijing and about 18% in Shanghai, and 6% in Shenzhen. FDI in R&D (centres) is concentrated mainly in ICT (70%), automotive (6%), bio-pharmacy (9%), chemical (11%) and other industries (4%). By 2003 the share of R&D by foreign affiliates in total manufacturing R&D amounted to over 20%. The FDI in R&D in China took following shapes: (i) independent R&D centre that functioned as a branch of global R&D network under direct management of TNCs headquarter; (ii) R&D department under business or joint venture that focused on product development and improvement for demand or market; (iii) collaboration with Chinese universities, R&D institutions and corporations. FDI in R&D in China appears to have made a number of positive impacts including (i) human resource development (highlighting training of personnel); (ii) introducing advance management practices and accumulating rich R&D management expertise; (iii) raising overall level of industrial technology. However, FDI in R&D in China also appears to have had some negative impacts such as creating shortages of talents for Chinese R&D institutions, and closure of some R&D institutions (Yuan, 2005). In the case of India, according to Technological Information forecasting and Assessment Council (TIFAC) between 1998 and 2003 R&D based FDI to India was $1.13 billion (TIFAC, 2006). More than 100 of the Fortune 500 firms have established R&D facilities or relationships in India by 2003 (Government of India, 2003). By 2007 more than 250 Fortune 500 companies have forged some R&D links with India. Of these, 150 have established global R&D centres in India (Satyanand, 2007). FDI in R&D has more than doubled since 2003 and it now amounts to 25% of the total FDI inflow. TNCs from US have invested
15
more than 70% of the total, followed by South Korea, Germany, Denmark, and the UK. A recent study by the EU revealed that most of the R&D projects from EU countries that went abroad have gone to India, followed by China and far ahead of the US and other countries (Tiwari, 2007). FDI in R&D is largely concentrated in software and IT services, but more FDI is targeting chemicals and related sectors such as molecular chemistry, biopharmaceuticals, automotive and engineering sciences. Annual FDI in drug and pharmaceuticals sector has grown from $12m in 1994 to $216m in 2006. A number of new R&D investments (in the range of $80m to $250m) were announced during 2005-2006 in the telecom and networking sector by companies such as Alcatel, Ericsson, EMC Elcoteq, Flextronics, Nokia, Samsung, and Siemens (Mitra, 2007, p.54). Types of foreign R&D in India include (i) in-house R&D by TNC affiliates; (ii) collaboration with other companies (mainly in software industry); and (iii) contracts or other forms of relationships with private entities, public laboratories and universities (e.g. biotechnology industry) (Mitra, 2007, p.56). Unlike in the past when TNCs set up R&D facilities to support their production unit, in the current phase they are opening dedicated independent R&D centres for undertaking R&D in new and emerging high tech areas. A number of TNCs such as Texas Instruments, Motorola, Intel, and Microsoft have established R&D facilities in the area of software and IC design. Intel and Cisco have announced investment of over $1 billion over the next five and three years respectively, Microsoft announced $1.7 billion and IBM $6 billion (Mrinalini and Wakdikar, 2008; Mitra, 2007). GE’s John F. Welch Technology Centre in Bangalore employs over 2200 scientists, researchers and engineers (the second largest of GE’s global research team). DuPont started establishing its research centre at ICICI Knowledge Park in Hyderabad in 2007 to focus on molecular biology, bioinformatics and polymer synthesis. Other chemical TNCs that established R&D facilities include BASF, Ciba Specialty Chemicals, and Degussa (all in and around Mumbai). In the Pharmaceuticals area Astra Zeneca, Pfizer, Bristol-Myers Squibb, Sanofi Aventis, Novartis, and GlaxoSmithKline have set up R&D facilities or entered into R&D relationships. What is interesting is that R&D units of TNCs in India are mostly stand-alone units with no production or marketing base in India. TNCs also forged non-equity based strategic partnerships with Indian research institutions (particularly in the area of pharmaceuticals and chemicals) and firms (IT industry). TNCs such as Abbott, Astra Zeneca, Pfizer, Eli Lilly, Solvay, Novartis, Merck and GlaxoSmithKline have been using contract research organisations (Festel, 2008). Another interesting development is that not only TNCs but also small and medium enterprises (SMEs) have started R &D operations in India (Mitra, 2007). Apart from the presence of large pool of science and engineering skills, a number of other factors such as existence of world class research institutions (13
16
national institutions such as IITs, IISc, BITS, NCL and 150 out of 357 universities are considered to be capable of providing quality R&D), liberalisation of FDI policies, existence of strong fundamental research base, science parks, western style management, generous incentives and tax breaks, and usage of English as business language appear to have been the pull factors in attracting increasing FDI in R&D in India. (Festel, 2008; Reddy, 2005). In the case of Brazil, FDI in R&D is driven by local market characteristics, production and technological skills of foreign affiliates, skills and capabilities in the local innovation system, and government policies. FDI in R&D is focused mainly on adaptive R&D although some TNCs have shifted their focus on a higher level of technological and innovation activities aimed at global market, particularly in the auto parts and automotive industries. For example, General Motors has assigned the responsibility for designing a new vehicle for global market (Meriva minivan) to its affiliate GM Brazil, the Tupi project (Fox) by VW Brazil, and a number of other global mandates in auto parts such as Eaton, Mahle, Sachs, Cofap/ Magnetti (Costa, 2005). Foreign R&D in the automotive sector is not an accident or spontaneous. Brazil has been making strong effort to attract FDI in the automotive sector since early 1990s. A number of incentives have been offered by both provincial and municipal governments. The incentives package offered to TNCs in the automotive sector includes both financial and fiscal incentives such as sales-tax holidays and exemptions from municipal taxes and financial incentives such as the provision and preparation of the project site and buildings, along with dedicated infrastructure. It appears that the fiscal incentives in Brazil are much larger than that of the financial incentives. These incentives attracted major TNCs and they benefited significantly from these incentives. For example, Volkswagen’s investment project (1995) in the State of Rio de Janeiro benefited from financial incentives worth about US$ 14 million (for dedicated infrastructure) and fiscal incentives worth between US$ 83 and 155 million. Renault was offered a large package of incentives by state of Paraná and the municipality of São José dos Pinhais including a capital contribution of up to US$ 300 million, interest free loans and a series of local tax breaks, donation of a 2.5 million square meter site, provision of infrastructure and utilities, electricity at a discounted price. Similarly Mercedes-Benz secured from the city of Juiz da Fora in Minas Gerais a number of incentives such as land, grants and tax breaks, extensive infrastructure development to help its plant. In 1997 General Motors signed a deal with the state of Rio Grande to build new factories near Porto Alegre and received incentives such as exception from paying state sales tax for 15 years (Christiansen et al., 2003, p.16). These incentives and active wooing of TNCs in the automotive sector appear to have succeeded in creating significant technological accumulation and R&D base.
17
On the other hand, in the power generation equipments, low level of technological and innovation activities are carried out by both long established TNC affiliates (such as ABB and Voith Siemens) and new comers (such as VA Tech). Although, Brazil has established a high level of local capabilities in pharmaceutical industry, it has not been able to attract significant FDI in R&D (Costa, 2005).
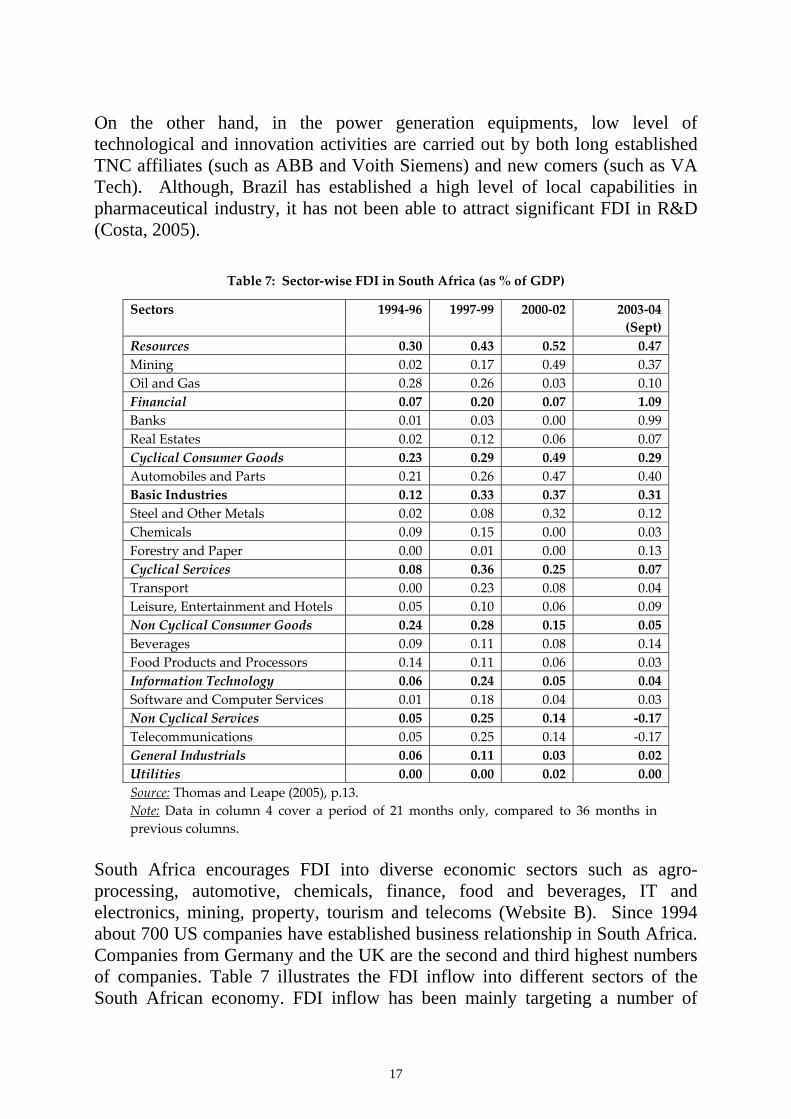
Table 7: Sector‐wise FDI in South Africa (as % of GDP)
Sectors 1994‐96 1997‐99 2000‐02 2003‐04 (Sept)
Resources 0.30 0.43 0.52 0.47 Mining 0.02 0.17 0.49 0.37 Oil and Gas 0.28 0.26 0.03 0.10 Financial 0.07 0.20 0.07 1.09 Banks 0.01 0.03 0.00 0.99 Real Estates 0.02 0.12 0.06 0.07 Cyclical Consumer Goods 0.23 0.29 0.49 0.29 Automobiles and Parts 0.21 0.26 0.47 0.40 Basic Industries 0.12 0.33 0.37 0.31 Steel and Other Metals 0.02 0.08 0.32 0.12 Chemicals 0.09 0.15 0.00 0.03 Forestry and Paper 0.00 0.01 0.00 0.13 Cyclical Services 0.08 0.36 0.25 0.07 Transport 0.00 0.23 0.08 0.04 Leisure, Entertainment and Hotels 0.05 0.10 0.06 0.09 Non Cyclical Consumer Goods 0.24 0.28 0.15 0.05 Beverages 0.09 0.11 0.08 0.14 Food Products and Processors 0.14 0.11 0.06 0.03 Information Technology 0.06 0.24 0.05 0.04 Software and Computer Services 0.01 0.18 0.04 0.03 Non Cyclical Services 0.05 0.25 0.14 ‐0.17 Telecommunications 0.05 0.25 0.14 ‐0.17 General Industrials 0.06 0.11 0.03 0.02 Utilities 0.00 0.00 0.02 0.00
Source: Thomas and Leape (2005), p.13. Note: Data in column 4 cover a period of 21 months only, compared to 36 months in previous columns.
South Africa encourages FDI into diverse economic sectors such as agro-processing, automotive, chemicals, finance, food and beverages, IT and electronics, mining, property, tourism and telecoms (Website B). Since 1994 about 700 US companies have established business relationship in South Africa. Companies from Germany and the UK are the second and third highest numbers of companies. Table 7 illustrates the FDI inflow into different sectors of the South African economy. FDI inflow has been mainly targeting a number of
18
areas such as mining, automobile, banking, and basic industries. For example, since 2000 there has been high investment in the automotive industry by EU manufacturers and significant investment from US and Japan companies. The government has formulated an incentive plan called Motor Industry Development Plan (MIDP) which links assemblers’ duty free imports to the amounts they export. In the automotive and components industry a number of TNCs are playing a major role. These include BMW, Ford, General Motors, Volkswagen, Daimler-Chrysler and Toyota. South Africa's food and beverages industry has become a global player and a number of major international agro-processing companies have a presence in South Africa. These include Unilever, Nestle, Coca-Cola, Danone, Parmalat, Kellogg, HJ Heinz, Cadbury-Schweppes, Virgin Cola, McCain Foods of Canada, Pillsbury, and Minute Maid. The chemical industry is the largest manufacturing sector in the economy, accounting for some 5% of GDP. South Africa is a world leader in the manufacture of synthetic fuel from coal. The rest of the chemical manufacturing sector consists mainly of AECI and Sentrachem. Other significant U.S. investors include: Ford, McDonalds, Levi Strauss, Minute Maid, Nike, Salem, Silicon Graphics, Microsoft, HP, Dell, Sara Lee, Caterpillar, Goodyear, Eli Lilly, Fluor and General Electric (Website F). Oil and gas sector, mining sector, steel and other metals, and paper industries have also seen significant FDI inflow over the years. According to the 2002-03 figures, the bulk of the FDI flow to South Africa comes from Europe (from EU 65.5% and non-EU countries in Europe 18.9%), followed by North America (9.1%) and the Middle East (4.6%) (Thomas and Leape, 2005, p.16). TNC affiliates are increasingly investing in R&D and significant level of R&D investment is seen particularly in automotive, aerospace, ICT, agriculture and health care industries by forging links with local institutions and universities (UNCTAD, 2005, pp.140-147; Mugabe, 2005). However, considering the extensive nature of FDI in South Africa’s economy, the degree of FDI in R&D is small. It appears to be largely adaptive R&D aimed at local and regional market, with a small share of advanced R&D in few industrial sectors aimed at global market (e.g. automotive, and aerospace). Despite actively encouraging FDI in different sectors including R&D, it appears that South Africa has not been able to attract FDI consistently (over the years and across major sectors). One of the main reasons for the small FDI flow is due to the fact that already the foreign presence in the South African economy is very strong. Other reasons appear to be its low rate of growth, the small market size, distance from the world’s large markets, and slow privatisation programme (FDI Magazine, 02 June 2006). Furthermore, according to the US Department of Commerce and the Economist Intelligence Unit: poor or unclear regulations

19
in key sectors, such as telecommunications, high start-up and input costs, stringent labor regulations, skills shortages, infrastructural limitations, the government's failure to create a single-window, direct investment facility to encourage overseas interest, problem of red tape, and problem with co-ordination and co-operation between different government departments and different tiers of government (provincial and local governments) are factors that affected the FDI flow into South Africa. A survey of managers of companies also found a number of more or less similar factors affecting South African investment climate and economy. These included shortage of or inadequate skills, relatively high cost of labor (over three and half times that of China, two and half times higher than in Brazil and 75% higher than in Malaysia). Wages are particularly high for highly skilled workers and managers (SouthAfrica.info reporter, 15 December 2005). On the other hand, a survey of 252 foreign businesses in 2004 by the London-based Control Risks Group found that South Africa had a positive business environment, with low political and security risk, and world class infrastructure. It praised government policy and business governance and considered South Africa is setting the trend for Africa. Furthermore, the government has taken steps to reduce red tape and increase regulatory transparency (Website A). 5. Incentives and Other Policy Measures in BRICS to Attract FDI in R&D One of the policy measures introduced by BRICS economies in order to increase FDI in R&D is setting requirement to undertake R&D by TNCs. For example, both India and China follow this policy. China imposes this policy on selective industries such as automotive industry. India also imposes such condition on both domestic and foreign companies. While setting such conditions, these countries also offer some financial incentives. The incentive structures such as exception from customs duties, import value-added tax, business tax, and tax holiday. India provides incentives including 100 per cent depreciation of R&D, and R&D capital. Brazil also provides similar incentives and its incentive structure is considered stronger than that of India. However, it is argued that some of the incentives have not produced the intended results (Zanatta, 2007). South Africa also has established relatively strong incentive structure to encourage both foreign and domestic R&D. This includes tax holiday up to three years, reduced import tariffs, easier exchange and repatriation of profits, 100 per cent depreciation of R&D and 25 per cent depreciation of R&D capital, direct financial support, and tax incentives. It also introduced strategic tax incentive (a tax deduction of up to 100 per cent) measures to promote employment-generating projects in manufacturing and IT (UNCTAD, 2005, pp.216-217; OECD, 2008, p.29; Website B).
20
Furthermore, strengthening of IPR regime also appears to have contributed towards increasing confidence of the TNCs in undertaking R&D in India. Patent act 1970 was amended to conform to the World Trade organization’s TRIP agreement and India’s Contract Act, similar to that of UK, provides alternative statutory protection in India for sensitive R&D data and know-how from discovery phase. As a result, patent protection (IPR) index for India has gone up from 1.51 to 2.18 from 1995 to 2000. Although this is still significantly lower than maximum index of 5 (achieved by the US in 2000) or that of South Korea (4.19 in 2000), or Singapore (4.05 in 2000), the steps to strengthen IPR regime appears to have increased confidence among TNCs and as a result there has been significant increase in patent applications from India (Belderbos, 2006, p.32). This trend can be observed in the case of China as well. Due to measures to tighten its IPR regime, its patent protection (IPR) index has gone up from 1.55 to 2.48 between 1995 and 2000. This appears to have helped the confidence level of TNCs and that in turn has reflected in significant increase in the patent applications. Another policy initiative to attract FDI in R&D is setting up science parks enabling firms, public R&D institutions and universities to forge links. The Zhongguancun science park in China is the largest with more than 14,000 high technology firms including 1,600 foreign affiliates. India has established dedicated technology parks for IT services. South Africa has established the first internationally accredited science park in Africa called ‘Innovation Hub’. To encourage and attract FDI, South Africa took some major initiatives such as Industrial Development Zones (IDZ) (purpose-built industrial estates for export-oriented industries and linked to international airports or ports), the International Headquarter Company exemption, the Small and Medium Enterprise Development Programme (SMEDP), and the Strategic Investment Project (SIP) programme. The SIP incentive is mainly targeted towards nearly all listed manufacturing activities, computer hardware and software related activities, and R&D activities (i.e. research and experimental development) in the areas of natural sciences and engineering (Maxwell, Website C). In 2003, South Africa established Cape Biotech hub in the province of Western Cape to build R&D capacity, foster commercial developments in biotechnology and to encourage FDI. The hub is supported by three universities and other tertiary institutions (Website D). Brazil has established a number of such science and technology parks since early 1980s. However, there is no concrete evidence as to the effectiveness of these parks in attracting FDI in R&D and enhancing technology accumulation. However, it is generally agreed that they strengthen the environment for R&D activities. BRICS countries also formulated industry specific policies to attract FDI in R&D. If an industry already has reached a high level of technological
21
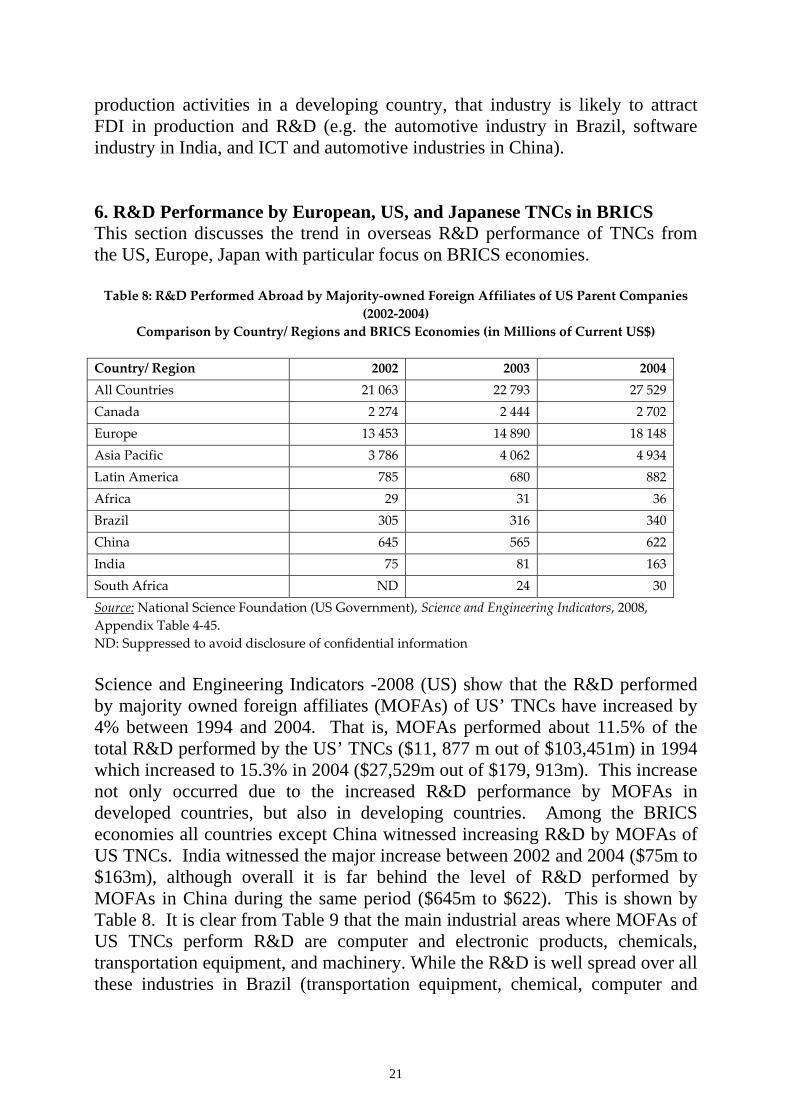
production activities in a developing country, that industry is likely to attract FDI in production and R&D (e.g. the automotive industry in Brazil, software industry in India, and ICT and automotive industries in China). 6. R&D Performance by European, US, and Japanese TNCs in BRICS This section discusses the trend in overseas R&D performance of TNCs from the US, Europe, Japan with particular focus on BRICS economies. Table 8: R&D Performed Abroad by Majority‐owned Foreign Affiliates of US Parent Companies
(2002‐2004) Comparison by Country/ Regions and BRICS Economies (in Millions of Current US$)
Country/ Region 2002 2003 2004 All Countries 21 063 22 793 27 529 Canada 2 274 2 444 2 702 Europe 13 453 14 890 18 148 Asia Pacific 3 786 4 062 4 934 Latin America 785 680 882 Africa 29 31 36 Brazil 305 316 340 China 645 565 622 India 75 81 163 South Africa ND 24 30 Source: National Science Foundation (US Government), Science and Engineering Indicators, 2008, Appendix Table 4‐45. ND: Suppressed to avoid disclosure of confidential information Science and Engineering Indicators -2008 (US) show that the R&D performed by majority owned foreign affiliates (MOFAs) of US’ TNCs have increased by 4% between 1994 and 2004. That is, MOFAs performed about 11.5% of the total R&D performed by the US’ TNCs ($11, 877 m out of $103,451m) in 1994 which increased to 15.3% in 2004 ($27,529m out of $179, 913m). This increase not only occurred due to the increased R&D performance by MOFAs in developed countries, but also in developing countries. Among the BRICS economies all countries except China witnessed increasing R&D by MOFAs of US TNCs. India witnessed the major increase between 2002 and 2004 ($75m to $163m), although overall it is far behind the level of R&D performed by MOFAs in China during the same period ($645m to $622). This is shown by Table 8. It is clear from Table 9 that the main industrial areas where MOFAs of US TNCs perform R&D are computer and electronic products, chemicals, transportation equipment, and machinery. While the R&D is well spread over all these industries in Brazil (transportation equipment, chemical, computer and
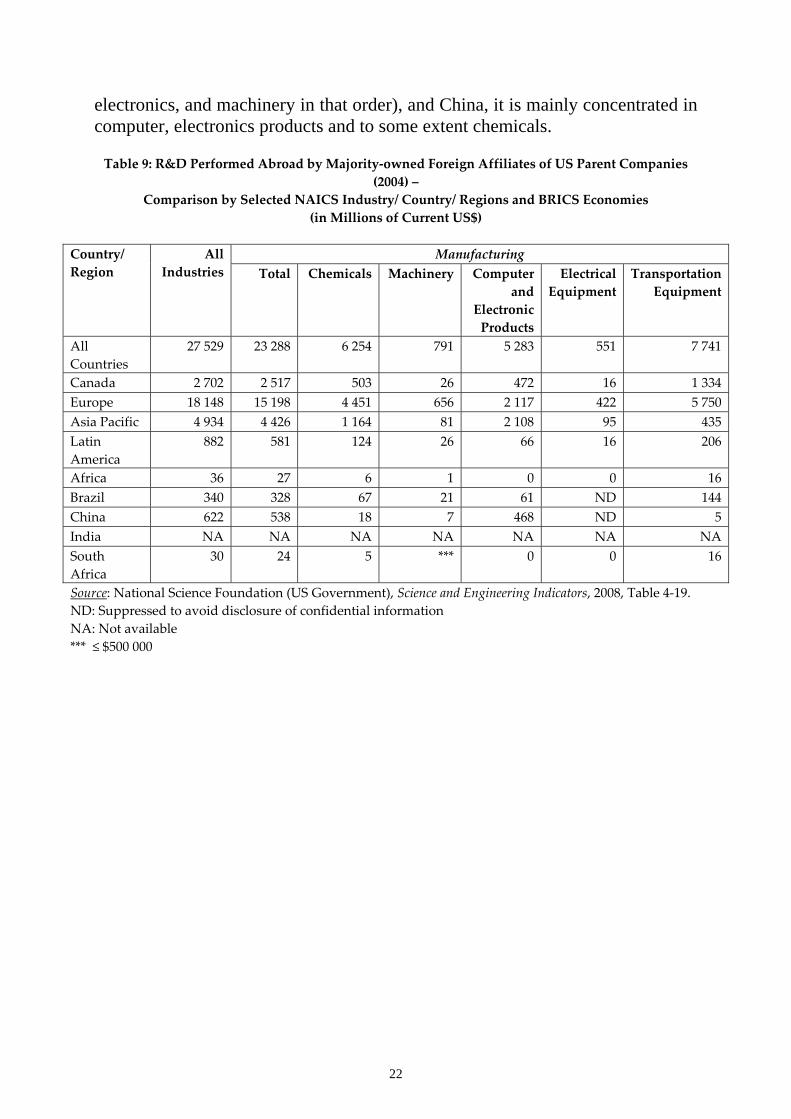
22
electronics, and machinery in that order), and China, it is mainly concentrated in computer, electronics products and to some extent chemicals. Table 9: R&D Performed Abroad by Majority‐owned Foreign Affiliates of US Parent Companies
(2004) – Comparison by Selected NAICS Industry/ Country/ Regions and BRICS Economies
(in Millions of Current US$)
Manufacturing Country/ Region
All Industries Total Chemicals Machinery Computer
and Electronic Products
Electrical Equipment
Transportation Equipment
All Countries
27 529 23 288 6 254 791 5 283 551 7 741
Canada 2 702 2 517 503 26 472 16 1 334 Europe 18 148 15 198 4 451 656 2 117 422 5 750 Asia Pacific 4 934 4 426 1 164 81 2 108 95 435 Latin America
882 581 124 26 66 16 206
Africa 36 27 6 1 0 0 16 Brazil 340 328 67 21 61 ND 144 China 622 538 18 7 468 ND 5 India NA NA NA NA NA NA NA South Africa
30 24 5 *** 0 0 16
Source: National Science Foundation (US Government), Science and Engineering Indicators, 2008, Table 4‐19. ND: Suppressed to avoid disclosure of confidential information NA: Not available *** ≤ $500 000
23
Table 10: Patent Applications by TNCs in China and India across Main Industry and their Home Origin (1996‐1999 and 2000‐2003)
Source: Belderbos, R. (2006), “R&D Activities in East Asia by Japanese, European, and US Multinationals,” Discussion Paper 100, Japan Center for Economic Research (Derived from Tables 5‐7, pp.33‐35). Table 11: Number of Patent Applications by TNCs, Originating in Selected Asian Countries (1996‐
2003) Country 1996 1997 1998 1999 2000 2001 2002 2003 Total China* 1 4 5 11 14 33 28 39 135 India 7 4 6 17 11 16 32 44 137 Malaysia 2 3 2 4 3 7 7 9 37 South Korea 4 4 6 13 17 10 31 34 119 Singapore 24 37 40 50 36 50 50 62 349 Taiwan 6 4 4 10 6 14 5 10 59 TOTAL (World) 20 723 23 890 26 211 28 705 31 985 34 601 32 397 27 489 2 26 001 Share of Asia (%)
0.2 0.3 0.3 0.4 0.3 0.4 0.5 0.7 0.4
Source: Belderbos, R. (2006), “R&D Activities in East Asia by Japanese, European, and US Multinationals,” Discussion Paper 100, Japan Center for Economic Research (Derived from Table 8, p.36). * Excluding Hong Kong.
European TNCs US TNCs Japanese TNCs China India China India China India
Industry
1996‐1999
2000‐2003
1996‐99
2000‐03
1996‐99
2000‐03
1996‐99
2000‐03
1996‐99
2000‐03
1996‐99
2000‐03
Chemicals 3 5 1 1 0 2 2 2 0 0 0 0 Pharmaceuticals 1 5 6 2 0 3 4 4 0 1 0 0 Non‐Electrical Machinery
4 9 1 0 0 0 0 1 0 0 0 0
Computing 0 16 3 14 0 2 7 12 0 3 0 1 Electrical Machinery
0 6 0 4 0 1 1 2 0 0 0 0
Communications Equipment
9 39 2 24 1 2 2 23 0 5 0 1
Precision Equipment
1 5 3 10 0 2 0 3 0 0 0 0
TOTAL 18 85 16 55 1 12 16 47 0 9 0 2
24
Table 12: TNCs Patent Applications Originating from China, India, and Asia (1996‐2003)
TNC China India Total (Asia) Thomson 28 4 105 St Microelectronics 1 32 104 Hewlett Packard 1 14 89 Siemens 3 9 63 Matsushita Electric 3 0 62 Philips 0 0 50 Nokia 18 3 33 Texas Instruments 0 20 28 Bayer 12 1 23 BASF 9 1 21 Molex 0 0 20 Astrazeneca 0 18 18 Rohm and Haas 2 0 16 Lucent Technologies 2 5 16 Johnson and Johnson 3 4 15 Ericsson 5 1 15 Motorola 2 1 14 Broadcom 0 4 13 Alcatel 12 0 13 ASM 9 0 13 AMD 0 0 12 Intel 2 5 10 Danaher 1 0 10 Asea Brown Boveri 5 1 9 Merck Kgaa 0 0 8 Toray Industries 0 0 7 Applied Materials 0 0 5 Novartis 2 1 5 Sony 0 1 4 Millennium Pharmaceuticals
0 2 2
Pfizer 0 0 1 Schering Plough 1 0 1 Mitsubishi Heavy 0 0 1 Eli Lilly 0 0 1 TOTAL 121 127 807 Source: Belderbos, R. (2006), “R&D Activities in East Asia by Japanese, European, and US Multinationals,” Discussion Paper 100, Japan Center for Economic Research (Derived from Table 10, p.38). * Excluding Hong Kong.
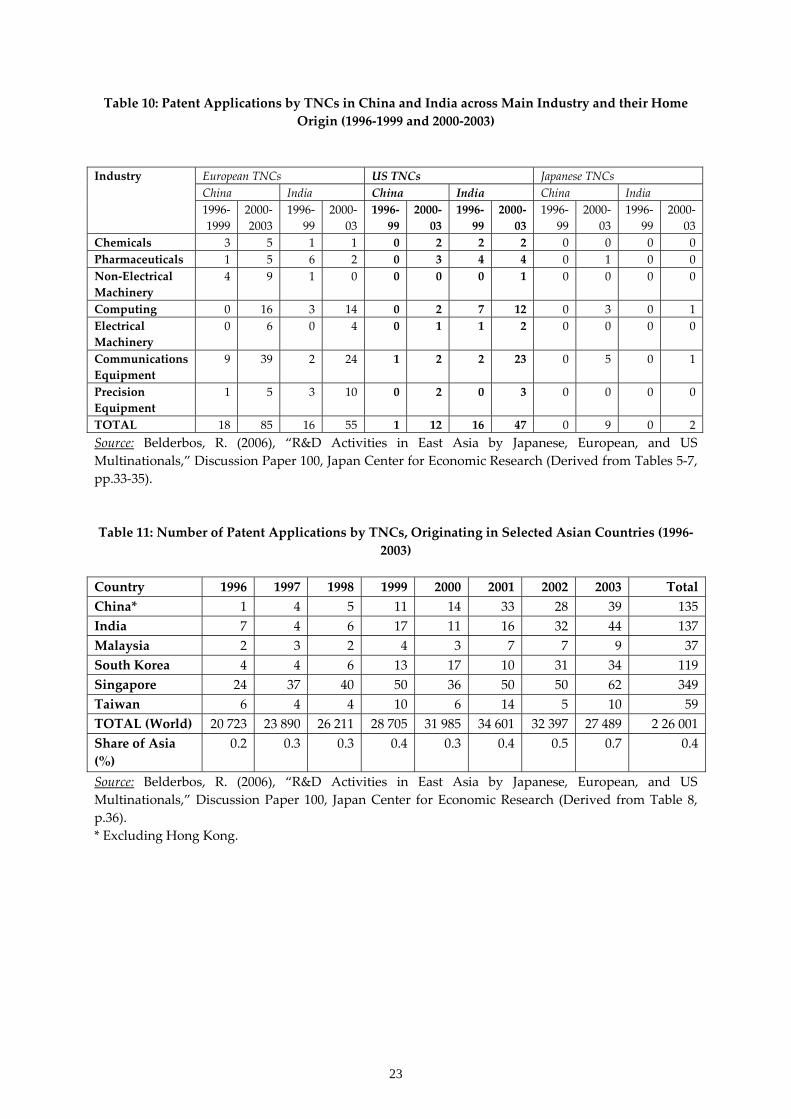
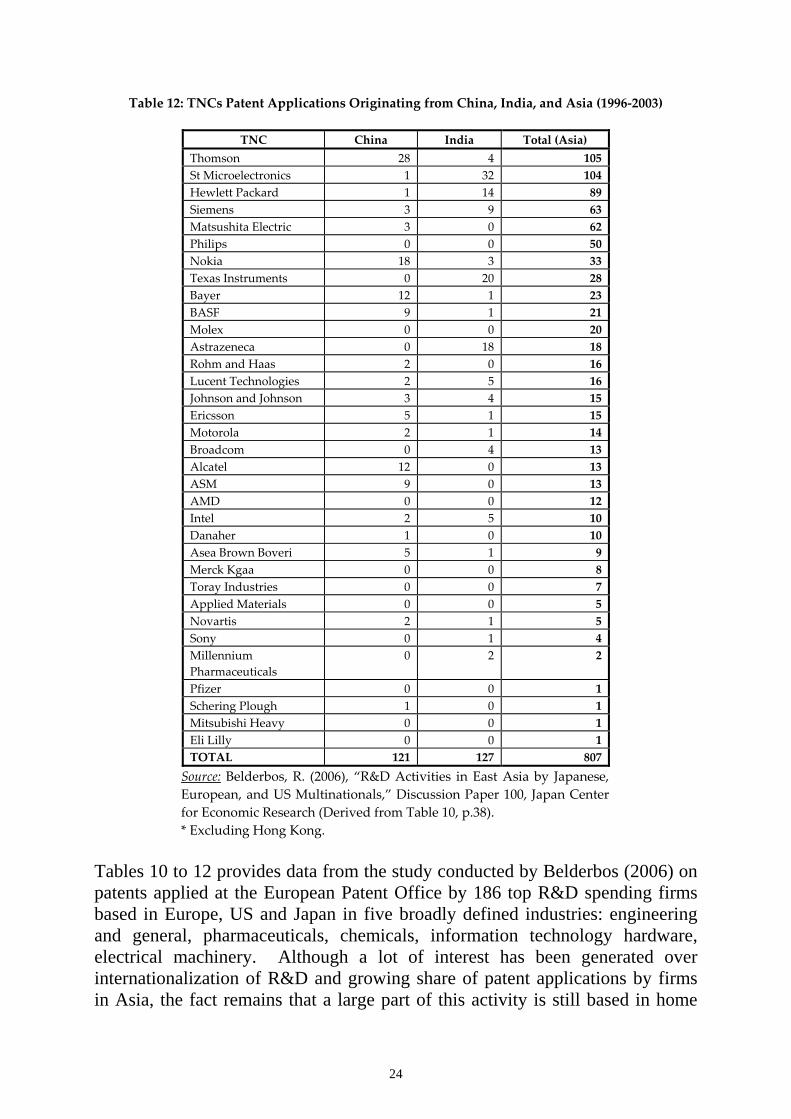
Tables 10 to 12 provides data from the study conducted by Belderbos (2006) on patents applied at the European Patent Office by 186 top R&D spending firms based in Europe, US and Japan in five broadly defined industries: engineering and general, pharmaceuticals, chemicals, information technology hardware, electrical machinery. Although a lot of interest has been generated over internationalization of R&D and growing share of patent applications by firms in Asia, the fact remains that a large part of this activity is still based in home
25
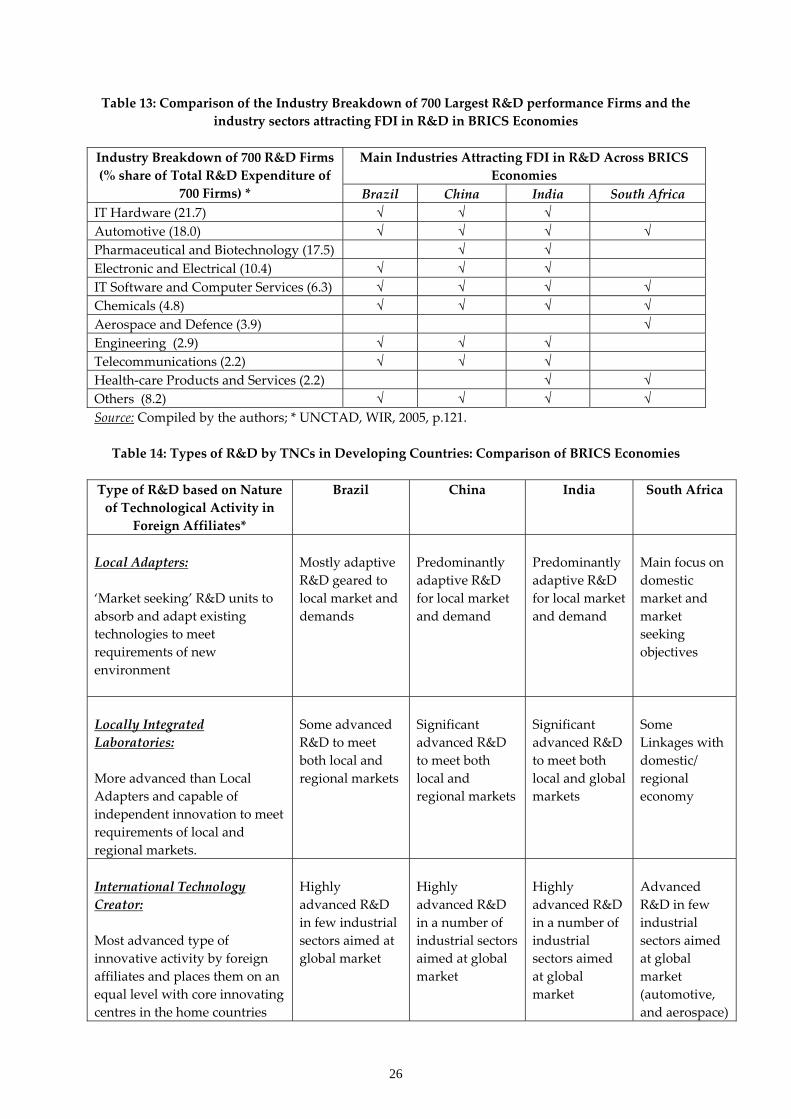
countries. This amounts to 79 per cent for US TNCs, 85 per cent for European TNCs, and 93 per cent for Japanese TNCs. Only less than 1 per cent patenting activity by these TNCs is located in Asian countries. In other words, the remainder is located in other two developed regions (e.g. the remainder of overseas R&D of European TNCs is located in North America and Japan). European firms have significant R&D operations in China, India, and South Korea (in that order), while the US firms have invested significantly in India, Singapore, China and South Korea. Japanese TNCs are the least inclined to undertake R&D abroad. They invested significantly only in Singapore. Unlike the European and the US firms, Japanese firms have not shown significant R&D interest in India. Their overall patent output from Asian countries outside Japan was less than 0.1 per cent. The study showed that both host country technological strength and its market attractiveness positively impact on R&D by foreign firms. It also argued that abundant availability of at low cost of scientists and engineers in particular in India and China is driving the foreign R&D in these countries (Belderbos, 2006). 7. Analysis Table 13 maps out the industry break down of TNCs’ R&D in BRICS economies. This is constructed using the date from Tables 9 and 10, and also from the discussions in the sections above. It clearly suggests that R&D performed by TNCs in BRICS largely follow the pattern or trend of their total R&D break down as shown in column 1. In other words, the industrial sectors in BRICS economies that are witnessing new or increased FDI in R&D reflect largely the global pattern of R&D intensive industrial sectors. This suggests that BRICS economies and other developing countries need to focus on developing those industries which have the largest or significant shares of global R&D. For this, they need develop industry specific policies and incentives apart from other necessary elements to attract FDI in R&D.
26
Table 13: Comparison of the Industry Breakdown of 700 Largest R&D performance Firms and the industry sectors attracting FDI in R&D in BRICS Economies
Main Industries Attracting FDI in R&D Across BRICS
Economies Industry Breakdown of 700 R&D Firms (% share of Total R&D Expenditure of
700 Firms) * Brazil China India South Africa IT Hardware (21.7) √ √ √ Automotive (18.0) √ √ √ √ Pharmaceutical and Biotechnology (17.5) √ √ Electronic and Electrical (10.4) √ √ √ IT Software and Computer Services (6.3) √ √ √ √ Chemicals (4.8) √ √ √ √ Aerospace and Defence (3.9) √ Engineering (2.9) √ √ √ Telecommunications (2.2) √ √ √ Health‐care Products and Services (2.2) √ √ Others (8.2) √ √ √ √ Source: Compiled by the authors; * UNCTAD, WIR, 2005, p.121. Table 14: Types of R&D by TNCs in Developing Countries: Comparison of BRICS Economies
Type of R&D based on Nature of Technological Activity in
Foreign Affiliates*
Brazil China India South Africa
Local Adapters: ‘Market seeking’ R&D units to absorb and adapt existing technologies to meet requirements of new environment
Mostly adaptive R&D geared to local market and demands
Predominantly adaptive R&D for local market and demand
Predominantly adaptive R&D for local market and demand
Main focus on domestic market and market seeking objectives
Locally Integrated Laboratories: More advanced than Local Adapters and capable of independent innovation to meet requirements of local and regional markets.
Some advanced R&D to meet both local and regional markets
Significant advanced R&D to meet both local and regional markets
Significant advanced R&D to meet both local and global markets
Some Linkages with domestic/ regional economy
International Technology Creator: Most advanced type of innovative activity by foreign affiliates and places them on an equal level with core innovating centres in the home countries
Highly advanced R&D in few industrial sectors aimed at global market
Highly advanced R&D in a number of industrial sectors aimed at global market
Highly advanced R&D in a number of industrial sectors aimed at global market
Advanced R&D in few industrial sectors aimed at global market (automotive, and aerospace)

27
and in other developed countries. Technology Scanning or Monitoring Unit: ‘Business intelligence’ function undertaken by an ‘asset seeking’ R&D Unit, i.e. where TNCs undertake R&D in technologies in which they are strong at home and where the host country also has strengths.
Selected sectors (e.g. Automotive)
Many industrial sectors
Many industrial sectors
Few sectors (automotive, and aerospace)
Source: Compiled by the authors; * Column 1 is adapted from UNCTAD, WIR 2005, p. 138. Table 14 compares the types of R&D performed by TNCs in BRICS economies by employing the classification scales of technological activities as defined by UNCTAD. It suggests that despite a lot of attention generated by recent discussions on FDI in R&D in developing economies, the type of R&D performed by TNCs even in large economies such as India and China predominantly remains adaptive R&D geared towards local market conditions and demands. However, it is also clear that while some R&D by TNCs are undertaken in selected industrial sectors in Brazil and South Africa, advanced R&D activities are undertaken in many sectors in India and China. However, the volume of such activities is small compared to the total volume of global level R&D in these sectors. What is interesting is that TNCs are increasingly willing to locate significant volume of complex technological and innovative activities (aimed at global market) across different industrial sectors in developing countries, particularly BRICS.
28
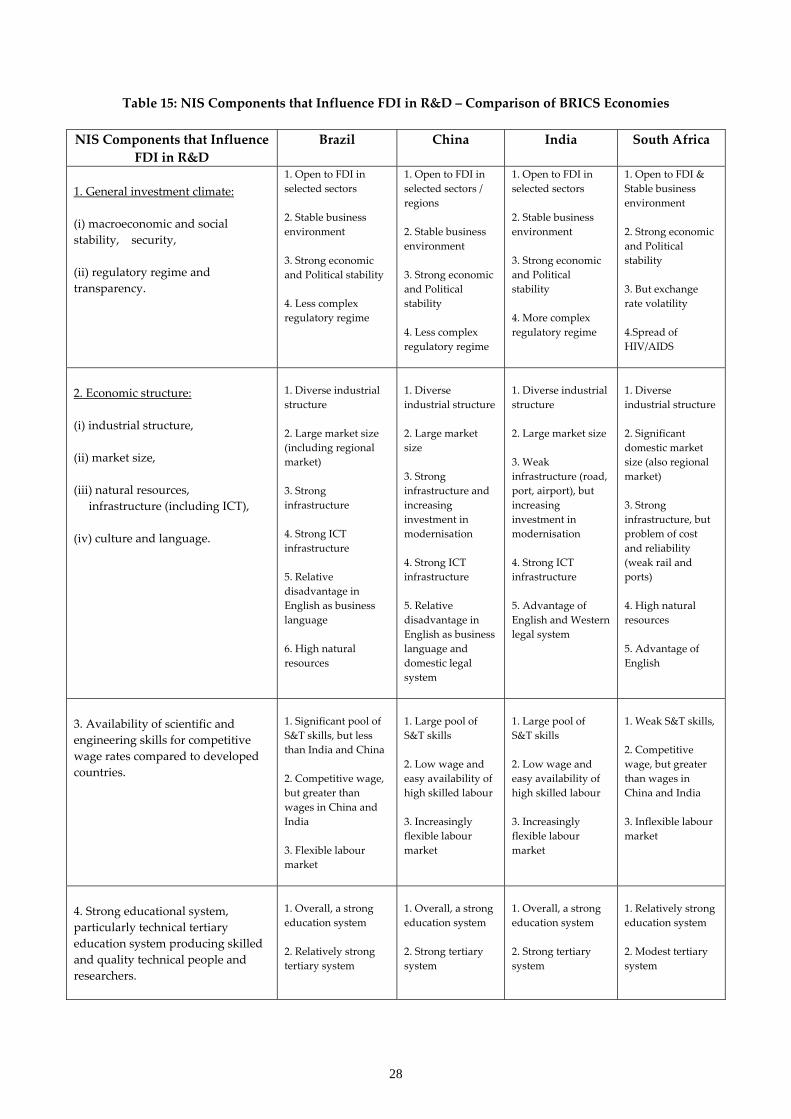
Table 15: NIS Components that Influence FDI in R&D – Comparison of BRICS Economies
NIS Components that Influence FDI in R&D
Brazil China India South Africa
1. General investment climate: (i) macroeconomic and social stability, security, (ii) regulatory regime and transparency.
1. Open to FDI in selected sectors 2. Stable business environment 3. Strong economic and Political stability 4. Less complex regulatory regime
1. Open to FDI in selected sectors / regions 2. Stable business environment 3. Strong economic and Political stability 4. Less complex regulatory regime
1. Open to FDI in selected sectors 2. Stable business environment 3. Strong economic and Political stability 4. More complex regulatory regime
1. Open to FDI & Stable business environment 2. Strong economic and Political stability 3. But exchange rate volatility 4.Spread of HIV/AIDS
2. Economic structure: (i) industrial structure, (ii) market size, (iii) natural resources, infrastructure (including ICT), (iv) culture and language.
1. Diverse industrial structure 2. Large market size (including regional market) 3. Strong infrastructure 4. Strong ICT infrastructure 5. Relative disadvantage in English as business language 6. High natural resources
1. Diverse industrial structure 2. Large market size 3. Strong infrastructure and increasing investment in modernisation 4. Strong ICT infrastructure 5. Relative disadvantage in English as business language and domestic legal system
1. Diverse industrial structure 2. Large market size 3. Weak infrastructure (road, port, airport), but increasing investment in modernisation 4. Strong ICT infrastructure 5. Advantage of English and Western legal system
1. Diverse industrial structure 2. Significant domestic market size (also regional market) 3. Strong infrastructure, but problem of cost and reliability (weak rail and ports) 4. High natural resources 5. Advantage of English
3. Availability of scientific and engineering skills for competitive wage rates compared to developed countries.
1. Significant pool of S&T skills, but less than India and China 2. Competitive wage, but greater than wages in China and India 3. Flexible labour market
1. Large pool of S&T skills 2. Low wage and easy availability of high skilled labour 3. Increasingly flexible labour market
1. Large pool of S&T skills 2. Low wage and easy availability of high skilled labour 3. Increasingly flexible labour market
1. Weak S&T skills, 2. Competitive wage, but greater than wages in China and India 3. Inflexible labour market
4. Strong educational system, particularly technical tertiary education system producing skilled and quality technical people and researchers.
1. Overall, a strong education system 2. Relatively strong tertiary system
1. Overall, a strong education system 2. Strong tertiary system
1. Overall, a strong education system 2. Strong tertiary system
1. Relatively strong education system 2. Modest tertiary system

29
5. Presence of R&D performing institutions (Private and public firms and labs, universities) and standards and quality setting institutions.
1. Strong presence of and diverse R&D performing institutions 2. Strong presence of Quality setting institutions
1. Strong presence of and diverse R&D performing institutions 2. Strong presence of Quality setting institutions
1. Strong presence of and diverse R&D performing institutions 2. Presence of Quality setting institutions
1. Relatively strong presence of R&D performing institutions, 2. Presence of Quality setting institutions
6. Presence of institutions (universities and other) doing high level of basic research and publications.
1. Presence of Basic R&D in diverse areas 2. Strong domestic and global publication output
1. Presence of Basic R&D in diverse areas 2. Strong domestic and global publication output
1. Presence of Basic R&D in diverse areas 2. Strong domestic and global publication output
1. Presence of Basic R&D in selected areas 2. Significant publication output
7. Strong IPR regime, particularly to protect industries where technologies are easy to imitate.
Relatively strong IPR regime
Relatively stronger IPR regime than India but lot weaker than Singapore and South Korea
Relatively strengthened IPR regime
Relatively strong IPR regime
8. Strong links between knowledge institutions and production enterprises.
Relatively strong links between knowledge institutions and production in selected sectors and weak links in others
Strong links in many sectors, but weak links in other sectors between knowledge institutions and production
Strong links in selected sectors, but weak links in other sectors between knowledge institutions and production
Weak links between knowledge institutions and production
9. Presence of dynamic science parks that facilitates interaction between diverse range of firms and institutions.
Presence of a number of science/ technology parks
Presence of large number of well established science/ technology parks covering many technology sectors
Presence of large number of science/ technology parks, particularly in software industry
Presence of small number of science parks (e.g. Innovation Hub, Cape Biotech)
10. Presence of diverse industrial structure with high class clusters of technological and industrial activity.
1. Diverse industrial structure 2. A number of well established industrial clusters
1. Diverse industrial structure 2. Well established industrial clusters in number of sectors
1. Diverse industrial structure 2. Emerging industrial clusters in (e.g. automotive, software, biotechnology)
1. Diverse industrial structure 2. Industrial cluster (e.g. Durban Automotive Cluster)
Source: Compiled by the authors Note: Column 1 is derived from 2. National Innovation System (NIS) and FDI in R&D: A Conceptual Framework Table 15 illustrates the strengths and weakness of 10 elements of NIS that influence the flow of FDI in R&D across BRICS economies. It clearly suggests
30
that overall NIS in China is stronger than NIS in other BRICS countries and therefore it explains to some extent the success of China in attracting FDI in general and particular in R&D. India appears to have relatively stronger NIS compared to South Africa and Brazil and India appear to have more or less similar strengths in many NIS components. However, India comes across very strong in terms of availability of S&T skills and low cost wages for skilled workers, tertiary education system, and English language speaking work force. In other words, Brazil and India emerge first or second in terms of particular individual NIS components in the table, although China scores top spot overall. Overall, South Africa clearly comes last in the ranking. This explains its poor performance in overall FDI inflow and FDI flow into R&D. If we compare this to Figure 3 in section 2, we can place all BRICS countries in Scenario 2 where they are able to mainly attract FDI in R&D in medium and low technological and innovation areas to varying degrees along with FDI in relatively higher technological complexity. The difference in the case of China and India is that they are able to attract FDI in more complex and high technology R&D in diverse and more industrial sectors, compared to Brazil and South Africa. This can be explained using Table 15 which clearly demonstrates that both China and India have stronger individual components of NSI that influences the nature and shape of FDI in R&D. 8. Conclusions This paper set out to examine the links between a country’s NIS and its ability to attract FDI in R&D. The discussions and empirical data presented in this paper clearly established that the nature and shape of FDI in R&D in a country has strong links to the strengths and weaknesses of its NIS. As China’s NIS demonstrates overall strengths compared to others, the overall FDI flow in R&D in China is also significantly greater and stronger than others. On the other extreme we can see that the South Africa’s NIS overall appears weaker among the BRICS economies and that can explains the low performance of South Africa in attracting FDI in R&D. However, very strong individual elements of a particular NSI can lead to some unique developments. The emergence of stand alone R&D centres in India without any links or interaction with local production activities can be explained to the particular characteristics of the S&T skills availability in India. It is also evident that FDI in R&D across industrial sectors in BRICS economies largely reflects the trend in global industry wise R&D intensity. That is, TNCs tend to invest largely in sectors where they have invested significantly in their home base. In other words, developing countries that demonstrate strong capabilities in those industrial sectors where TNCs have invested heavily in their home countries are likely to attract FDI in R&D provided they also demonstrate
31
significant strengths in a number of individual components of NIS as highlighted in Table 15. TNCs based in the US and Europe are likely to invest more in R&D (as well as in more technologically complex R&D aimed at global market) in developing countries than TNCs based in Japan. Further, increasing R&D operations by TNCs in developing economies (including BRICS) is unlikely to displace significant R&D infrastructure and employment in their home bases, but likely to shift or reduce the R&D activities in other developed countries. It is an interesting area for further research, as there are concerns raised by various stakeholders in the TNCs home countries. The interesting question that emerges from this paper and is also already raised by others (e.g. Chaminade and Vang, 2008; Mrinalini and Wakdikar, 2008) is: What are the impacts of FDI in R&D on the emerging national economies such as India and China? It is not within the scope of this paper to investigate the impact of FDI in R&D on innovativeness and performance of domestic firms and economy. One can safely argue that FDI in R&D is likely to have helped develop research skills and knowledge in BRICS economies. However, the full impact of FDI in R&D is not very clear on local firms and economies, as it appears more varied and complex in different BRICS economies. But FDI in R&D is likely to have both positive and negative impacts. It is important that policy makers take steps to increase positive outputs from FDI in R&D by strengthening various components of NIS and also by creating strong linkages to local economy.
32
References AT Kearney (2004), FDI Confidence Index, October, vol.7 (Alexandia, Virginia: Global
Business Policy Council). AT Kearney (2005), Global FDI Recovery Clouded By saving Glut Overhang, say Global
Executives in New A.T. Kearney Study, December (Alexandia, Virginia: Global Business Policy Council).
Baskaran A. and Muchie. M. (Forthcoming), “The Impact of the National Innovation Systems on the Flow and Benefits of Foreign Direct Investment to National Economies”, IJTLID.
Costa I. (2005), “R&D and TNCs Affiliates in Brazil”. See Website E: http://www.unctad.org/sections/meetings/docs/narula_en.pdf
Chakraborty, C. and Basu, P. (2002), “Foreign Direct Investment and Growth in India: A Co integration Approach,” Applied Economics, Vol. 34, pp.1061-1073.
Chaminade C. and Vang J. (2008), “China and India: the new innovation power house”. See http://www.asiaportal.info/infocusblog/?cat=14
Christiansen H., Charles Oman C., and Charlton A. (2003), Incentives-based Competition for Foreign Direct Investment: The Case of Brazil (Paris: OECED).
Edes J. (2004), “Flagship Auto Policy Pays Off,” FDI Magazine. See http://www.fdimagazine.com/news/printpage.php/aid/696/Flagship_auto_policy_pays_off.html
FDI Magazine (2004), “Attention Seekers,” 2 June. See http://www.fdimagazine.com Festel G. (2008), “Investing in Indian R&D: new money pouring into research &
development in India makes the country an attractive place for innovation”. See http://www.entrepreneur.com/tradejournals/article/print/174818821.html
Government of India (2003), Science and Technology Policy 2003, Department of Science and Technology, Statement by India’s Prime Minister Dr Manmohan Singh. See http://www.dst.gov.in/stsysindia/stp2003.htm
Lundin N., Sjoholm F., He P., and Qian J. (2007), “FDI, Market Structure and R&D Investment in China,” Working paper Series Vol. 2007-04, The International Centre for the Study of East Asian Development, Kitakyushu.
Maxwell C., “Investment Incentives in South Africa”. See Website C: http://www.lowtax.net/lowtax/html/offon/southafrica/sa_incentives.html
Mitra R. M. (2007), “India’s Emergence as a Global R&D Center,” Working paper R2007:012, ITPS, Swedish Institute for Growth Policy Studies, Sweden.
Mrinalini N. and Wakdikar S. (2008), “Foreign R&D centres in India: Is there any positive impact?” Current Science, vol. 94, no. 4, 25 February, pp. 452-458.
Mugabe J. (2005), “Foreign Direct Investment, R&D, and Technology Transfer in Africa: An overview of policies and practices”. See Website E: http://www.unctad.org/sections/meetings/docs/narula_en.pdf
National Science Foundation (US Government), Science and Engineering Indicators 2008. See http://www.nsf.gov/statistics/seind08/c4/c4s6.htm
OECD (2002), Foreign Direct Investment for Development: Maximising Benefits, Minimising Costs (Paris: OECD).
OECD (2008), “Globalisation of Industrial Biotechnology R&D”, Directorate for science, Technology and Industry (Working party on Biotechnology), DSTI/STP/BIO (2008)13.
Rajan, R. S. (2005), FDI, Trade and the Internationalisation of Production in the Asia-Pacific Region: issues and Policy Conundrums (Singapore: National University).
Reddy P. (2005), “Global R&D Activities in India” See Website E: http://www.unctad.org/sections/meetings/docs/narula_en.pdf
Satyanand P. N. (2007), “Chemical Attraction,” 03 October. See http://www.fdimagazine.com/news/fullstory.php/aid/2158/Chemical_attraction.html
33
SouthAfrica.info (2005) See http://www.southafrica.info/pls/procs/iac.page?p_t1=692&p_t2=1828&p_t3=2680&p_t4=0&p_dynamic=YP&p_content_id=703445&p_site_id=38
Thomas, L. and Leape, J. (2005), “Foreign Direct Investment in South Africa: The initial impact of the Trade, Development and Cooperation Agreement between South Africa and the European Union,” CREFSA Research Paper, London School of Economics.
TIFAC (2006), FDI in the R&D Sector: Study for the pattern in 1998-2003, Department of Science and Technology (New Delhi: GOI).
Tiwari R. (2007), “The Role of offshore R&D in Strengthening Competitive Advantage: Chances and Challenges in India,” in: Innovationen und Produktentstehung in der Antriebs- und Steuerungstechnik, Proceedings of the Third Rexroth Doktoranden Kolloquium, Lohr am Main, Germany.
UNCTAD (2005), World Investment Report: Transnational Corporations and the Internationalization of R&D (New York and Geneva: United Nations).
UNCTAD (2006), World Investment Report: (New York and Geneva: United Nations). Wei, W. (2005), “China and India: Any Difference in their FDI Performances?,” Journal of
Asian Economics, Vol.16, pp. 719-736. Website A: “2006 Index of Economic Freedom: South Africa”. See
http://www.heritage.org/research/features/index/country.cfm?id=SouthAfrica Website B: “South Africa,” FDI Magazine. See
http://www.fdimagazine.com/news/printpage.php/aid/1054/South_Africa.html Website D:
http://www.fdimagazine.com/news/printpage.php/aid/688/Cape_Biotech:_Boosting_biotechnology_innovation.html
Website F: 2005 Investment Climate Statement: http://www.state.gov/e/eb/ifd/2005/42112.htm
Yuan Z. (2005), “Features and Impacts of Internationalization of Transnational Corporations’ R&D: China’s Case,” Presentation prepared for Expert Meeting on FDI Development, UNCTAD, 24-26 January, Geneva. See Website E: http://www.unctad.org/sections/meetings/docs/narula_en.pdf
Zanatta M., Strachman E., Carvalho F., Carvalho P., Camillo E., and Barra M. (2007) “National policies to attract FDI in R&D: an assessment of Brazil and some selected countries,” Globelics Conference 2007, Saratov, Russia. See http://globelics2007.sstu.ru/globelics.nsf/0/99D13C8B1393BECFC32572CC00334383/$File/FDI%20policies%20Carvalho%20et%20al.pdf
DIIPER RESEARCH SERIES WORKING PAPERS: No. 1. Gorm Winther: Democracy and Power in Greenland – the Appearance of a New
Class?, 27 pp, 2007. No. 2. Angathevar Baskaran & Mammo Muchie: The Making of the Indian National
Innovation Systems: Lessons on the specific characteristics of the domestic and the external co-evolutions of technologies, institutions and incentives, 32 pp, 2007.
No. 3. Wang Weyi: Chinese Culture of Social Interactions: Current Sequential Organi-
zations in Gift Offering and Acceptance, 15 pp, 2007. No. 4. Angathevar Baskaran & Mammo Muchie: The Impact of the National Innovation
Systems on the Flow and Benefits of Foreign Direct Investment to National Economics, 38 pp, 2008.
No. 5. Ann Sasa List-Jensen: Economic Development and Authoritarianism - A Case
Study on the Korean Developmental State, 27 pp, 2008. No. 6. Berhanu Gutema Balcha: Ethnicity and restructuring of the state in Ethiopia, 24
pp, 2008. No. 7. Angathevar Baskaran & Mammo Muchie: Foreign Direct Investment and
Internationalization: The Case of BRICS Economics, 33 pp, 2008.