Embed Size (px)
Citation preview

Foreign direct investment in Poland and Polish direct investment abroad in 2015

Foreign direct investment in Poland and Polish direct investment abroad in 2015
Warsaw 2017

Developed by: Department of Statistics
Published by: Narodowy Bank Polski ul. Świętokrzyska 11/21 00-919 Warszawa
www.nbp.pl
© Copyright Narodowy Bank Polski, 2017
Table of contents
Introduction 5
Summary 7
1 Foreign direct investment in Poland 13
1.1 Foreign direct investment transactions to Poland 141.2 Foreign direct investment positions in Poland 201.3 Foreign direct investment positions in Poland – regional analysis 251.4 Income on foreign direct investment in Poland 28
2 Polish direct investment abroad 31
2.1 Polish direct investment transactions abroad 322.2 Polish direct investment positions abroad 342.3 Income on Polish direct investment abroad 36
3 Profitability of entities with the share of foreign direct investment capital 41
3.1 Profitability of foreign direct investment in Poland 423.2 Retained earnings of direct investment entities 473.3 Summary 50
Methodological note 51
Standard of direct investment statistics 52Data sources for direct investment 53Method of compilation and presentation of data on direct investment 53Foreign direct investment glossary 54
Statistical annex 59
Index of Boxes 82
Index of Tables 82
Index of Figures 84


Introduction

Narodowy Bank Polski6
Introduction
The annual report on foreign direct investment in Poland and Polish direct investment abroad was prepared based on reporting data collected by NBP for the purpose of analysis of multifaceted foreign economic relations of Poland, including, in particular the purpose of the balance of payments and international investment position.
Foreign direct investment represents a significant part of cross-border capital flows and constitutes an important part of the financial account in the country’s balance of payments. At the same time, it is an important element of the globalisation process of the world economy.
The report responds to the relatively high interest in direct investment issues and shows information concerning such investment in various dimensions. The statistical data are presented according to the applicable international standard. In accordance with this standard, the basic criterion used for classification of direct investment is the location of its control centre in the country or abroad. As a consequence, direct investment is divided into investment controlled by non-residents and investment controlled by residents. In the case of Poland, we refer to foreign direct investment in Poland and Polish direct investment abroad. The aforementioned method of presentation of data on direct investment differs from that adopted in the balance of payments and international investment position where direct investment is presented according to the assets and liabilities principle.
In this year’s report, data on direct investment exclude transactions of special purpose entities. This change arises from the fact that such transactions, despite their formal compliance with the binding definition of direct investment, do not correspond to the traditional understanding of such investment. The new presentation method is compliant with the recommendations of international institutions dealing with the collection and analysis of data on direct investment.
Details of the method applied for presentation of direct investment data are included in the Methodological note. The terms used in the report are explained in the glossary included in the final part of the report.

Summary
Narodowy Bank Polski8
Summary
In 2015 non-residents continued to perceive Poland as a favourable place for long-term investment. This is confirmed by net capital inflow of direct investments of PLN 50.8 billion. This result was by only approx. PLN 4.0 billion lower than in the record year, i.e. 2007 and, at the same time, the highest since the global economic crisis of 2008−2009. Similar to the result achieved previously, it resulted mainly from the relatively high profits gained by direct investment entities and the high level of reinvestment of such earnings.
In 2015, Polish direct investors concluded transactions for the amount of PLN 12.1 billion, which represented growth compared to the previous year of approx. PLN 3.0 billion, i.e. 33%.
In the same period, significant growth of the value of direct investment transactions was recorded globally. They reached the highest value (USD 1.8 trillion) since the economic crisis of 2008−2009 and were by 38% higher than in 2014.1
Foreign direct investment in Poland
In 2015 net inflow of direct investment to Poland amounted to PLN 50.8 billion. Once again, reinvestment of earnings in the amount of PLN 30.4 billion was the predominant item. Inflow of capital in the form of equity amounted to PLN 15.5 billion whereas net capital inflows in the form of debt instruments amounted to PLN 4.9 billion.
The highest inflow of foreign direct investment concerned the Netherlands (PLN 12.0 billion), the United Kingdom (PLN 10.6 billion) and Germany (PLN 9.8 billion). Disinvestment (the withdrawal of investments) took place, among others, in case of the United States (PLN -1.3 billion).
In 2015 inward direct investment flows were mainly targeted at manufacturing entities (PLN 11.8 billion) as well as at entities dealing with professional, scientific and technical activities (PLN 10.3 billion). In the case of entities involved in mining and quarrying, outflow of capital was recorded, associated with losses incurred by those entities (negative reinvestment of earnings) as well as repayment of debt to direct investors (PLN -0.3 billion in total).
A closer analysis of the structure of direct investment inflows to Poland over the recent years indicates a certain change of investment areas and investments forms, which may be interpreted as a change of direct investors’ preferences. In the area of services, the role of investment in the form of equity is increasing to the detriment of other forms of investment. On the other hand, in Polish manufacturing, reinvestment of earnings is the prevailing form of investment, with simultaneous outflows of capital in the form of equity.
1 UNCTAD, “World Investment Report 2016. Investor nationality: Policy challenges”, United Nations Publication, p. 10.

Summary
9Foreign direct investment in Poland and Polish direct investment abroad in 2015
It should be added that similar to previous years, the overall level of inward direct investment transactions to Poland was significantly affected by single large transactions.
At the end of 2015 foreign direct investment positions in Poland amounted to PLN 712.1 billion. Thus, a decrease in foreign direct investment stocks was recorded for the first time. Their geographical structure was almost identical to that observed a year ago. The highest positions were recorded for investors from the Netherlands (PLN 129.3 billion), Germany (PLN 116.6 billion), Luxembourg (PLN 82.2 billion) and France (PLN 76.3 billion). In terms of the ultimate investing country (UIC), Germany (PLN 135.9 billion) is the biggest direct investor in Poland. Next are the United States (PLN 77.3 billion) and France (PLN 76.9 billion).
No significant changes occurred in the structure of foreign direct investment positions according to industry. The highest amounts of foreign direct investment stocks were attributed to manufacturing (PLN 229.6 billion), financial and insurance activities (PLN 134.0 billion), wholesale and retail trade, including repair of vehicles (PLN 108.6 billion) and real estate activities (PLN 56.0 billion).
In 2015, income on foreign direct investment in Poland reached PLN 67.5 billion. It included dividends in the amount of almost PLN 29.0 billion, reinvested earnings at the level of PLN 30.4 billion and interest income with the value of PLN 8.1 billion. The highest income was recorded by direct investors from the Netherlands (PLN 14.5 billion), Germany (PLN 13.7 billion), Luxembourg (PLN 6.9 billion) and France (PLN 6.5 billion). The highest income was gained by investors involved in the: manufacturing (PLN 27.8 billion), wholesale, retail trade and repair of vehicles (PLN 10.5 billion) as well as financial and insurance activities (PLN 9.7 billion).
Similar to previous years, in the part of the report related to foreign direct investment in Poland, the analysis of such investment in regional terms has been presented.
The highest net inward foreign direct investment positions in 2015 were recorded in the Mazowieckie Voivodeship (PLN 389.4 billion). Other voivodeships with a significant level of investors’ involvement include: Śląskie Voivodeship (PLN 67.7 billion), Wielkopolskie Voivodeship (PLN 63.1 billion), Dolnośląskie Voivodeship (PLN 40.5 billion), Małopolskie Voivodeship (PLN 35.2 billion) and Pomorskie Voivodeship (PLN 25.2 billion). However, the interpretation of the above data requires considerable caution since inward direct investment positions show the place of investment registration, whereas the real place of incurring capital expenditure is often different than the seat of registered office of the entity that a given direct investment is related to.
Polish direct investment abroad in 2015
In 2015 Polish direct investors invested PLN 12.1 billion abroad, whereas equity transactions amounted to PLN 10.9 billion, negative reinvestment of earnings reached the level of PLN -0.6 billion, and debt instruments transactions amounted to PLN 1.9 billion.
The biggest outward direct investment transactions by Polish residents occurred in Cyprus (PLN 11.2 billion) and in Switzerland (PLN 4.0 billion). Polish direct investors withdrew their

Narodowy Bank Polski10
capital (disinvestment), among others, from Luxembourg (PLN -4.4 billion) and from Sweden (PLN -2.2 billion). In the case of Sweden, the negative amount of investment resulted from new liabilities incurred by Polish residents at their subsidiaries.
In 2015 Polish direct investment transactions were mainly targeted at direct investment entities dealing with financial and insurance activities, in particular, financial holdings (PLN 13.1 billion) and at entities dealing with mining and quarrying (PLN 4.3 billion). On the other hand, capital was withdrawn from entities dealing with professional, scientific and technical activities (PLN -4.0 billion).
At the end of 2015, Polish direct investment positions abroad amounted to PLN 93.6 billion. They included equity position at the level of PLN 97.7 billion and negative debt instruments position at the level of PLN -4.1 billion. The negative debt instruments position resulted from payables of Polish direct investors (PLN 46.4 billion), exceeding their receivables (PLN 42.3 billion) from foreign affiliates.
The highest Polish direct investment positions abroad at the end of 2015 were recorded for entities from Cyprus (PLN 35.1 billion), Luxembourg (PLN 19.3 billion), the Czech Republic (PLN 7.3 billion) and the Netherlands (PLN 7.1 billion). In the case of several countries, negative outward direct investment position resulted from the specific investment method of Polish companies’ investing in those countries.2 The highest negative value was recorded for Polish direct investment position in Sweden (PLN -22.8 billion).
The highest amounts of Polish outward direct investment positions were attributed to financial and insurance activities (PLN 48.0 billion), manufacturing (PLN 15.3 billion), administrative and support service activities (PLN 14.8 billion) and to professional, scientific and technical activities (PLN 11.3 billion). The highest negative Polish outward direct investment positions were recorded in information and communication (PLN -7.6 billion).
In 2015, Polish direct investors’ income on direct investment abroad reached the value of PLN 2.3 billion. Declared dividends amounted to PLN 2.6 billion, reinvested earnings had a negative value: PLN -0.6 billion. Interest income amounted to PLN 0.3 billion.
The highest income was gained on investment in Lithuania (PLN 1.3 billion) and in Cyprus (PLN 0.9 billion). The highest negative balance of income (losses) was recorded in the case of Luxembourg (PLN -0.8 billion) and the United States (PLN -0.6 billion). In case of Sweden negative income (PLN -0.4 billion) resulted from high interest payments in favour of direct investment entities.
In 2015, the income of Polish investors originated mainly from investment in foreign direct investment entities associated with manufacturing (PLN 1.0 billion) and wholesale and retail trade including repair of vehicles (PLN 0.5 billion).
2 Negative Polish outward direct investment positions arise from the fact that Polish companies have liabilities to their daughter companies established abroad, through which they acquire capital from the issue of bonds on the European market exceeding the amount of capital invested in those entities.

Summary
11Foreign direct investment in Poland and Polish direct investment abroad in 2015
Profitability of foreign direct investment in Poland
The level of income gained by foreign investors, being one of the basic criteria for selection of the place and sector of direct investment, depends on many factors. The level of investors’ income is mainly affected by the individual phases of the investment life cycle, the tax burden and the type of economic activity of the direct investment entity.
The values of the rate of return on equity in 2001−2002 in Poland were lower than the values of the profitability ratio of debt instruments. Since 2004, the opposite situation has been observed. In 2015 the rate of return on equity in Poland reached 10.4%, and profitability of debt instruments 4.7%.


Foreign direct investment in Poland
Chapter 1

Chapter 1
Narodowy Bank Polski14
Foreign direct investment in Poland
1.1 Foreign direct investment transactions to Poland
In 2015 the net inward direct investment transactions to Poland amounted to PLN 50.8 billion and were by PLN 5.8 billion higher, i.e. 12.8%, than in 2014 (PLN 45.0 billion). The value of those transactions consisted of the positive balance of inflow of equity amounting to PLN 15.5 billion, reinvestment of earnings amounting to PLN 30.4 billion and the balance of debt instruments transactions equal to PLN 4.9 billion. Consequently, net inward direct investment transactions to Poland in 2015 were only approximately by PLN 4.0 billion lower than in the record year of 2007. At the same time, they were the highest since the global financial crisis of 2008−2009 and even by PLN 39.3 billion higher than the inflow of direct investment in 2013 when the debt crisis in some countries of the euro area reached a significant scale.
Figure 1 Foreign direct investment transactions to Poland in 2000–2015
2004 2005 2006 20072000 2001 2002 2003 2008 2009 2010 2011 2012 2013 2014 2015-10 000
0
10 000
20 000
30 000
40 000
50 000
60 000PLN million
Debt instruments TotalReinvestment of earningsEquity
The level and structure of inward direct investment transactions to Poland in 2015 were affected, as in previous years, by economic conditions of the Polish economy.
In particular, the following factors should be mentioned:
§ the relatively good position of Poland as a potential place for direct investment, among others, due to labour costs which are still lower than in economically developed countries, and access to educated human resources;3
§ the good results and outlook of enterprises with foreign capital in Poland, which encouraged direct investors to reinvest earnings;
3 “EY’s Attractiveness Survey. Europe 2016” indicates Poland − next to Germany, the United Kingdom, France and the Netherlands − as a country of the highest investment attractiveness in Europe.

Foreign direct investment in Poland
15Foreign direct investment in Poland and Polish direct investment abroad in 2015
§ the growing purchasing power of foreign investors due to the depreciation of the zloty against other currencies;
§ the relatively strong growth of Poland’s GDP in 2015 (3.6%) compared to certain other countries of the region which influenced the positive assessment of the investment outlook;
§ the announced and implemented changes in international tax regulations,4 influencing taxation of international groups of companies, which indirectly influenced organisational changes in those groups, resulting in partial outflows of inward direct investment capital in Poland.
In 2015 the majority of direct investment inflows originated from European countries (PLN 51.0 billion), including, in particular, from the European Union member states (PLN 49.5 billion) and states of the euro area (PLN 33.6 billion).
Figure 2 Foreign direct investment transactions to Poland in 2015 broken down by countries
4 000
-4 000
2 000
-2 0000
14 00012 00010 000
8 0006 000
PLN million
Netherla
nds
United K
ingdom
Germany Spai
nAust
ria
Luxem
bourg
Portuga
lMalta
Slovaki
a
United S
tates
Other co
untries
Debt instruments TotalReinvestment of earningsEquity
The biggest foreign direct investors in Poland in 2015 were: the Netherlands (PLN 12.0 billion), the United Kingdom (PLN 10.6 billion) and Germany (PLN 9.8 billion). The almost seven-fold (compared to 2014) decline in direct capital inflow from Luxembourg (to PLN 2.8 billion) was caused by the particularly high level of inflow of such investment in 2014 resulting from single transactions (the level of inflow of investments in the form of equity amounted in 2014 to PLN 9.3 billion). The almost eighteen-fold growth of inflow of direct investment from the United Kingdom should be justified in a similar way. This was the result of the relatively low level of those transactions in previous periods; in 2014 the United Kingdom recorded negative equity investment (disinvestment) in Poland, at the level of PLN -0.3 billion. Both cases confirm the thesis that the geographical variability of the structure of capital inflow due to direct investment to Poland is to a large extent determined by single transactions, and doesn’t constitute a long-lasting trend.
4 Including, among others, work under the BEPS project (base erosion and profit shifting); more information on the issue is available on the OECD website, http://www.oecd.org/tax/beps/.
Chapter 1
Narodowy Bank Polski16
Reinvestment of earnings which dominated in the structure of direct investment inflow to Poland in 2015 was mainly performed by investors from Germany (PLN 7.5 billion), the Netherlands (PLN 6.4 billion), Luxembourg (PLN 3.9 billion), Sweden (PLN 2.4 billion) and France (PLN 2.2 billion). The highest inflows of capital in the form of equity originated from the United Kingdom (PLN 7.3 billion), the Netherlands (PLN 5.3 billion), Germany (PLN 3.4 billion), Cyprus (PLN 2.7 billion) and Austria (PLN 1.9 billion).
In 2015, the highest disinvestment (withdrawal of net capital) was recorded in the case of the United States (PLN -1.3 billion), Slovakia (PLN -0.9 billion), Malta (PLN -0.9 billion) and France (PLN – 0.7 billion). In the case of the United States it consisted mainly of the repayment of liabilities of Polish direct investment entities due to debt instruments (PLN -1.5 billion). In case of Slovakia, disinvestment resulted from the repayment of liabilities due to debt instruments (PLN -0.6 billion) and the withdrawal of funds in the form of equity (PLN -0.4 billion). Direct investors from Malta were also withdrawing funds in the form of equity (PLN -0.5 billion) and repaying liabilities due to debt instruments (PLN -0.4 billion). The withdrawal of the capital by investors from France was mainly connected with the decline (repayment) of liabilities of Polish direct investment entities due to debt instruments (PLN -2.3 billion) and was to a lesser extent associated with their withdrawal of funds in the form of equity (PLN -0.6 billion).
In 2015 the highest inflow of net capital due to inward direct investment was related to entities from the manufacturing section5 (PLN 11.8 billion; section C). It is worth paying attention to the high value of capital inflows in the form of reinvested earnings (PLN 15.1 billion), with the simultaneous capital outflow in the form of equity (PLN -1.9 billion) and in the form of debt instruments (PLN -1.5 billion). The outflow of capital in the form of equity refers, in particular, to the manufacture of chemicals and chemical products (PLN -2.0 billion) and, to a lesser extent, to the manufacture of motor vehicles, trailers and semitrailers (PLN -0.3 billion) as well as the manufacture of basic metals and fabricated metal products, except machinery and equipment (PLN -0.3 billion). The outflow of capital in the manufacturing section arises mainly from the sale of domestic companies or their parts by foreign investors to domestic investors. Only the data from consecutive years will allow to draw conclusions on how sustainable this phenomenon is.
The inflow of direct investment to the services sector6 amounted to PLN 37.0 billion. It was dominated by investment in professional, scientific and technical activities (PLN 10.3 billion). The consecutive positions were taken by investment in the section of wholesale and retail trade, including the repair of motor vehicles and motorcycles (PLN 10.0 billion; section G), investment in the area of information and communication (PLN 6.5 billion; section J) and real estate activities (PLN 4.9 billion; section L). Disinvestment at the level of PLN -1.4 billion was recorded in entities representing the remaining financial activity in K section (financial activity section). It included mainly equity outflows.
5 The section is a part of a hierarchically streamlined collection of economic activity performed by economic operators. In the report we use the Polish Classification of Activities (PKD) of 2007 (PKD 2007).
6 The aggregate of sections C to U is referred herein as the services sector.

Foreign direct investment in Poland
17Foreign direct investment in Poland and Polish direct investment abroad in 2015
Box 1 Foreign direct investment in the Polish banking sector
In accordance with the international standards, foreign direct investment in the banking sector comprises investment in the form of equity. Under Polish conditions, it mainly means the holding of the banks’ shares and establishing their branches. Other forms of banks’ foreign investment comprise portfolio investment (purchase of securities) or other investment (purchase of other financial instruments).
One of the characteristics of the Polish banking system is the relatively high share of foreign direct investors. At the end of 2015 it amounted to approximately 41% of the capital of the entire banking sector. In addition, almost 14% of banks’ shares were held by foreign portfolio investors.
The share of foreign capital in Polish banks stems from and can be justified by the changes which took place in Poland after 1989 as a result of the economic transformation. At that time, the Polish banking system was, in fact, created from scratch. The permissible share of non-residents in the capital of the banks was gradually increased. This resulted from the liberalisation of capital flows associated with Poland’s accession first to the OECD and later, to the European Union. Foreign investors provided not only capital but also modern technologies and organisational solutions in the area of finance.
The analysis of direct investment inflows to the sector of monetary financial institutions in 1996−2015 helps to identify three stages. Stage 1 lasted until 2005; at that time, the inflow of capital arising from the purchase of banks’ shares by foreign investors prevailed, with simultaneously insignificant profits of the banks and reinvestment of earnings limited due to the above reasons. The years 2006−2011 were marked by consecutive transactions in the banking market and the partial consolidation of the
Figure 3 Foreign direct investment transactions to Poland in 2015 broken down by economic activity
20 000
15 000
10 000
5 000
0
-5 000C M G J L K D35 B Other
sections
PLN million
Debt instrumentsReinvestment of earningsEquity Total
B − Mining and quarrying; C − Manufacturing; D35 − Electricity, gas, steam and air conditioning supply; G − Wholesale and retail trade; repair of motor vehicles and motorcycles; J − Information and communication; K − Financial and insurance activity, L − Real estate activities; M − Professional, scientific and technical activities.

Chapter 1
Narodowy Bank Polski18
sector associated with ownership changes. This was connected with the increase in the share of direct investors in the shareholding of Polish banks. In this period, due to an improvement in profitability, the reinvestment of earnings usually exceeded the inflow of capital in the form of acquisition of shares.
From 2012, a period started when capital inflows to the banking sector, in fact, resulted mainly from reinvestment of earnings. On the other hand, capital outflows resulted from selling-off share blocks to portfolio investors or complete withdrawal of foreign investors and the sale of majority blocks of shares to domestic investors.
In 2015, growth of the share of assets of banks controlled by domestic investors in banking sector assets in Poland was registered (from 38.5% to 41.0%), which was a consequence of PZU SA taking control over Alior Bank SA.
Figure B1 Foreign direct investment inflows to the sector of monetary financial institutions in 1996−2015
10 000
-10 000
8 000
-8 000
6 000
-6 000
4 000
-4 000
2 000
-2 0000
PLN million
Reinvestment of earningsEquity
2004 2005 2006 200720001999199819971996 2001 2002 2003 2008 2009 2010 2011 2012 2013 2014 2015
Figure B2 Foreign direct investment positions in the sector of monetary financial institutions in 2004−2015 (data at the end of the year)
140 000
120 000
100 000
80 000
60 000
40 000
20 000
0
PLN million
2004 2005 2006 2007 2008 2009 2010 2011 2012 2013 2014 2015

Foreign direct investment in Poland
19Foreign direct investment in Poland and Polish direct investment abroad in 2015
1 http://www.knf.gov.pl/Images/Banki_zalezne_220211_tcm75-25646.pdf.
Until 2014 the growth of Poland’s liabilities due to inward direct investment in the banking sector stemmed both from transactions executed by direct investors and from an improvement in the valuation of banks in connection with their increased profitability.
The year 2015 saw a decline in the value of direct investment in the banking sector which was associated with a strong slump in the value of Polish banks. This resulted mainly from investors’ concerns related to the introduction of the bank levy and concerns related to the form of the legislative solution to the issue of FX loans for households. At the end of 2015, direct investment in the banking sector was still relatively high, amounting to PLN 93.0 billion. As compared to 2014 it decreased by PLN 32.0 million, i.e. by 25.7%.
Domestic investors controlled 12 commercial banks and all the cooperative banks (the State Treasury controlled 5 commercial banks), while foreign investors controlled 26 commercial banks and all the branches of credit institutions (investors from 18 countries held controlling stakes, with the dominating role of investors from Italy, Germany and Spain).1
Figure B3 Income on foreign direct investment in the banking sector
-1 000
1 000
0
2 000
3 000
4 000
5 000
6 000PLN million
Reinvested earningsDividends
2004 2005 2006 200720001999199819971996 2001 2002 2003 2008 2009 2010 2011 2012 2013 2014 2015
Foreign direct investment in the Polish banking sector generated income to foreign direct investors throughout the whole period from 1996 to 2015. As in the case of inflow of direct investment to Poland, three periods can be distinguished in terms of the way that investors disposed of this income. Until 2001 the majority of income was reinvested whereas in the years 2002−2008, income was paid in the form of a dividend. From 2009 to 2015, direct investors reinvested the majority of the banks’ earnings. This resulted partly from the supervisory recommendations of the KNF.
Chapter 1
Narodowy Bank Polski20
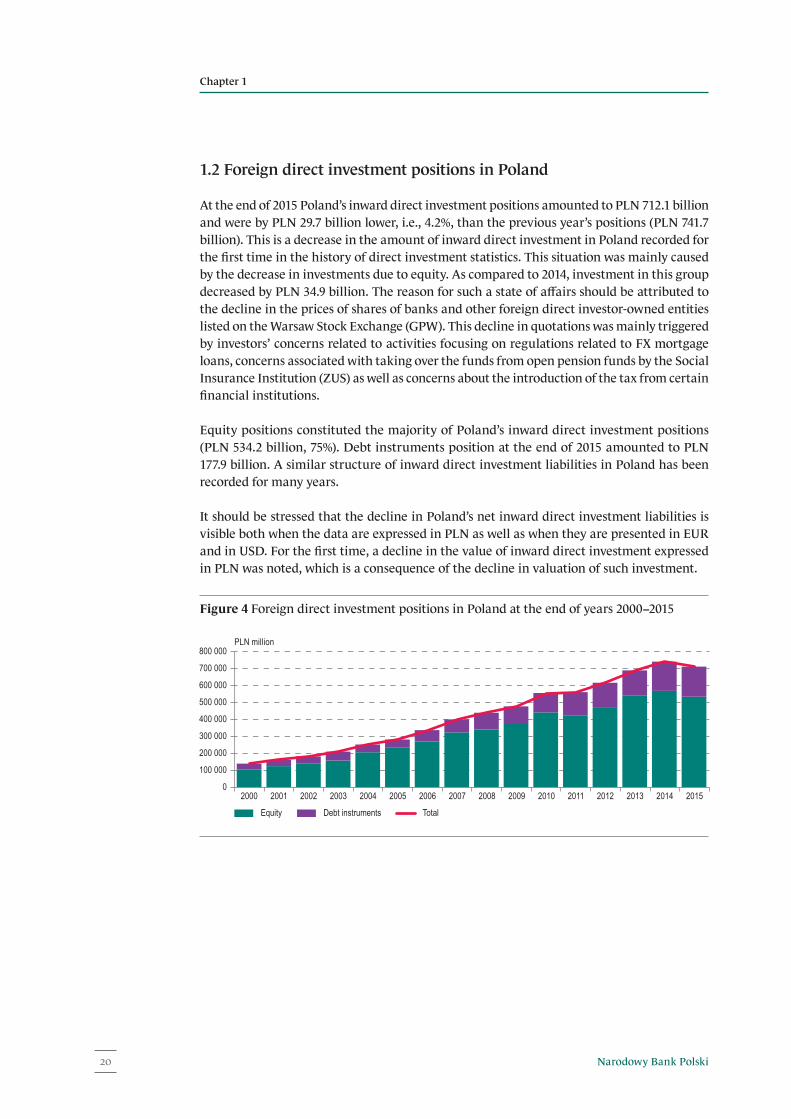
1.2 Foreign direct investment positions in Poland
At the end of 2015 Poland’s inward direct investment positions amounted to PLN 712.1 billion and were by PLN 29.7 billion lower, i.e., 4.2%, than the previous year’s positions (PLN 741.7 billion). This is a decrease in the amount of inward direct investment in Poland recorded for the first time in the history of direct investment statistics. This situation was mainly caused by the decrease in investments due to equity. As compared to 2014, investment in this group decreased by PLN 34.9 billion. The reason for such a state of affairs should be attributed to the decline in the prices of shares of banks and other foreign direct investor-owned entities listed on the Warsaw Stock Exchange (GPW). This decline in quotations was mainly triggered by investors’ concerns related to activities focusing on regulations related to FX mortgage loans, concerns associated with taking over the funds from open pension funds by the Social Insurance Institution (ZUS) as well as concerns about the introduction of the tax from certain financial institutions.
Equity positions constituted the majority of Poland’s inward direct investment positions (PLN 534.2 billion, 75%). Debt instruments position at the end of 2015 amounted to PLN 177.9 billion. A similar structure of inward direct investment liabilities in Poland has been recorded for many years.
It should be stressed that the decline in Poland’s net inward direct investment liabilities is visible both when the data are expressed in PLN as well as when they are presented in EUR and in USD. For the first time, a decline in the value of inward direct investment expressed in PLN was noted, which is a consequence of the decline in valuation of such investment.
Figure 4 Foreign direct investment positions in Poland at the end of years 2000−2015
100 000
0
200 000
300 000
400 000
500 000
600 000
700 000
800 000PLN million
2004 2005 2006 200720012000 2002 2003 2008 2009 2010 2011 2012 2013 2014 2015
Debt instruments TotalEquity

Foreign direct investment in Poland
21Foreign direct investment in Poland and Polish direct investment abroad in 2015
Figure 5 Foreign direct investment positions in Poland at the end of years 2000−2015 expressed in various currencies
100
0
200
300
400
500
600
700
800Year 2000 = 100
PLN USD EUR
2004 2005 2006 200720012000 2002 2003 2008 2009 2010 2011 2012 2013 2014 2015
At the end of 2015 the Netherlands was the biggest creditor of Poland due to foreign direct investment, similar to the previous year. Liabilities to direct investors from this country amounted to PLN 129.3 billion and were slightly higher than in 2014 (PLN 127.4 billion). They constituted 18.2% of total liabilities. The consecutive positions among direct investors were occupied by: Germany (PLN 116.6 billion, i.e. 16.4%), Luxembourg (PLN 82.2 billion, i.e. 11.5%) and France (PLN 76.3 billion, i.e. 10.7%). At the end of 2014, the geographical structure of Poland’s liabilities due to direct investment was similar.
Figure 6 Foreign direct investment positions in Poland at the end of 2015 broken down by countries
140 000
120 000
100 000
80 000
60 000
40 000
20 000
-20 000
0
PLN million
Netherla
nds
United K
ingdom
Germany Spai
nItal
y
Belgium
Cyprus
Austria
France
Luxem
bourg
Switzerlan
d
Sweden
United S
tates
Other co
untries
Debt instruments TotalEquity
As in previous years, the majority of net foreign direct investment liabilities in Poland comprised liabilities to European Union member states. At the end of 2015, they reached PLN 654.1 billion and constituted, as in 2014, approximately 92% of all liabilities. This was mainly the result of the free movement of capital within the European Union. The position of the Netherlands, Luxembourg and Cyprus in this list was also undoubtedly influenced by the fact that due to agreements for the avoidance of double taxation, investors outside

Chapter 1
Narodowy Bank Polski22
the European Union often used entities established in those countries to preform direct investments’ transactions.
The structure of direct investment liabilities in relation to the neighbouring countries of Poland (Germany, the Czech Republic, Slovakia, Ukraine, Belarus, Lithuania and the Russian Federation) has not changed significantly. It seems that due to the geographical proximity those countries should demonstrate a particular interest in locating their direct investment in Poland. The value of liabilities due to those countries’ direct investment in Poland at the end of 2015 amounted to PLN 120.5 billion. The main and, in fact, the only significant investor in this group was Germany (PLN 116.6 billion). The value of direct investment of other countries of this group was insignificant, amounting to approximately PLN 4 billion in total. The major part of liabilities to neighbouring countries of Poland (besides Germany) fell to the Russian Federation (PLN 1.4 billion), Slovakia (PLN 0.6 billion) and the Czech Republic (PLN 2.7 billion). Liabilities to Ukraine and Belarus had negative values, similar to the end of 2014 (PLN -0.6 billion and PLN -0.2 billion, respectively). It means that direct investment enterprises in Poland with Ukrainian and Belarusian capital were net creditors of investors from Ukraine and Belarus. Such a situation usually results from cumulative losses incurred in Poland by direct investors from the aforementioned countries or from specific forms of capital flows between direct investors from those countries and direct investment enterprises in Poland. The limited involvement of neighbouring countries in direct investments in Poland may arise, among others, from the limited capital potential of investors established in those countries. In some cases barriers to capital flow between the European Union and non-EU countries play a significant role.
The statistics of direct investment in Poland according to the ultimate investing country (UIC) gives a slightly changed image of the geographical structure of liabilities due to inward direct investment in Poland.
Figure 7 Foreign direct investment positions in Poland at the end of 2015 broken down by ultimate investing country
140 000
160 000
120 000
100 000
80 000
60 000
40 000
20 000
0
PLN million
Netherla
nds
United K
ingdom
Germany Spai
nItal
y
Belgium
Finland
Cyprus
Austria
France
Luxem
bourg
Canada
Denmark
Poland
Switzerlan
d
Sweden
Japan
United S
tates
Unknow
n coun
try
Other co
untries
Portuga
l
Country of immediate investor seat Country of ultimate investor seat
With such an approach, the value of liabilities changes significantly in the case of Luxembourg, the Netherlands, the United States, Japan, Canada, Belgium, Germany, Spain and Cyprus. Differences in relation to other countries are slightly smaller. If the Netherlands, Luxembourg,

Foreign direct investment in Poland
23Foreign direct investment in Poland and Polish direct investment abroad in 2015
Cyprus, Belgium and Spain are considered as countries where the direct investor is established, the amounts of liabilities will turn out much higher than in the situation when they are treated as countries where the seat of the ultimate controlling parent is located. It confirms that companies established in those countries are often used as an indirect link in the ownership chain within groups of companies, with the purpose of more flexible disposing of the target investment and more favourable taxation of passive income. This results from favourable conditions of establishing and functioning of economic operators, in particular, in terms of tax solutions. The opposite situation occurs in the case of the United States, Germany, the United Kingdom, Japan and Canada. If those countries are treated as places of establishment of ultimate controlling parents, liabilities due to direct investment in Poland will turn out higher than under the circumstances when they are considered as places of establishment of direct investors. This means that companies managed by ultimate controlling parents from those countries invested in Poland through entities based in other places, mainly in the Netherlands and Luxembourg.
The ranking of the biggest direct investors investing their funds in Poland, taking into account individual countries as places of establishment of the ultimate controlling parent, is different from the situation when the country where the direct investor is established is taken into account. In the first case, Germany (PLN 135.9 billion) is still the biggest direct investor in Poland. It is followed by the United States (PLN 77.3 billion) and France (PLN 76.9 billion). The United Kingdom (PLN 44.3 billion) occupies only fourth place. The Netherlands, considered as a country where the direct investor is established, used to be ranked first, with direct investment at the level of PLN 129.3 billion; on the other hand, when this country is treated as the place of establishment of the ultimate controlling parent, it occupies only eighth position, with direct investment in Poland amounting to PLN 22.6 billion. Luxembourg, in standard terms, occupied third place, whereas in the case of presentation of direct investment according to the place of establishment of the ultimate controlling parent in the group of companies, it is only seventeenth. This confirms the opinion that this country is still willingly used as an intermediary link of direct investment within groups of companies.
Similar to previous years, a part of inward direct investment in Poland (PLN 33.3 billion) comprises liabilities to foreign entities that are members of groups of companies where the ultimate controlling parent is the Polish resident. Such a phenomenon is called as roundtripping. In terms of direct investment, such a phenomenon is defined as “the channelling abroad by direct investors of local funds and the subsequent return of these funds to the local economy in the form of direct investment”.7 The reason to perform such operations is the strive to optimise earnings from invested funds. This is possible owing to the use of legal and economic conditions of conducting economic activity in various countries. In addition, investors make use of investment incentives addressed to non-residents in particular countries. In 2015 the value of direct investment made in Poland by Polish investors through foreign daughter companies accounted for 4.7% of Poland’s total inward direct investment liabilities. This level was slightly higher than at the end of 2014.
Attention should be paid to the still relatively high share of direct investors for whom the country where the ultimate controlling parent is established is defined as unclassified. The share of such countries in liabilities due to inward direct investment in Poland at the
7 “OECD Benchmark Definition of Foreign Direct Investment”, OECD, 2008, p. 241.
Chapter 1
Narodowy Bank Polski24
end of 2015, similar to the previous year, amounted to 11.5%. Difficulties related to identifying the country of establishment of the ultimate controlling parent in the group of companies whose member is the direct investor, concern mainly private equity funds and individuals. In the case of individuals operating as direct investors, establishing their residence is often difficult or not at all possible. The trace usually breaks off in countries defined as tax havens, where banks and financial intermediaries guard the identity of their clients. It mainly results from the legal regulations binding in those countries. The issue of recognising this type of investment is currently not determined precisely in international standards and work concerning the development of recommendations in this area is still in progress.
As the aforementioned analysis shows, looking at direct investment from the perspective of the country of the ultimate controlling parent in the group of companies whose member is the direct investor, is useful for many reasons. First of all, it enables to determine the strength of real economic links among countries. Secondly, it helps to identify the political and legal environment from which such relation may arise. For example, it enables to determine whether investment decisions are based on reasons resulting from agreements related to mutual investment, trade agreements or tax regulations. This analysis also indicates that the basis of many investment decisions is not the conditions (for a given investment) existing in the country of a direct investment entity, but arises from regulations applicable in the country of the ultimate controlling parent in the group. The application of such an approach allows for the identification of these types of conditions in capital flows within direct investment. For these reasons international organisations recommend preparing additional analyses of foreign direct investment liabilities according to the country in which the ultimate controlling parent in the group has its seat, also for their own studies. In the case of Poland we observe this phenomenon due to tax optimisation, in particular, consisting in investing by international concerns (non-EU) through companies in the Netherlands and in Luxembourg.
The analysis of inward direct investment liabilities in Poland indicates their relatively stable industry structure. At the end of 2015, over a half (58.7%) of the these liabilities originated from the area of services (PLN 417.9 billion; sections from G to U). In those sections, almost one third of (total) liabilities referred to financial and insurance activity (PLN 134.0 billion; section K). Moreover, a significant item constituted liabilities originating from the section of wholesale and retail sales including repair of motor vehicles and motorcycles (PLN 108.6 billion, section G), from the section associated with real estate activities (PLN 56.0 billion; section L) and the section of professional, scientific and technical activities (PLN 48.8 billion; section M).
In 2015, similar to the previous year, liabilities associated with manufacturing (PLN 229.6 billion; section C) constituted approximately 33% of liabilities due to inward direct investment in Poland. In this section, the following subsections prevailed: manufacture of motor vehicles, trailers and semitrailers and other transport equipment, with liabilities at the level of PLN 43.8 billion, manufacture of food products; beverages and tobacco products (PLN 43.7 billion) and manufacture of metal and machinery products, except electrical equipment (PLN 41.4 billion).

Foreign direct investment in Poland
25Foreign direct investment in Poland and Polish direct investment abroad in 2015
Figure 8 Foreign direct investment positions in Poland at the end of 2015 broken down by economic activity
PLN million
200 000
250 000
150 000
100 000
50 000
0C MG JLK D35 H N I A QF B Other
sectionsDebt instruments TotalEquity
A − Agriculture, forestry and fishing; B − Mining and quarrying; C − Manufacturing; D35 − Electricity, gas, steam and air conditioning supply; F − Construction; G − Wholesale and retail trade; repair of motor vehicles and motorcycles; H − Transport and storage; I − Accommodation and food service activities; J − Information and communication; K − Financial and insurance activities; L − Real estate activities; M − Professional, scientific and technical activities; N − Administrative and support service activities; Q − Human health and social work activities.
In 2015 the broadly defined service sector (sections from G to U) recorded a decrease in liabilities due to inward direct investment by PLN 17.6 billion. In this sector, significant declines occurred in financial and insurance activity (PLN 33.4 billion; section K) and in the information and communication section (PLN 4.0 billion; section J). As mentioned before, they resulted predominantly from the slump in the valuation of Warsaw Stock Exchange listed entities owned by direct investors.
1.3 Foreign direct investment positions in Poland – regional analysis
As in previous years, this part of the report presents a short analysis of direct investment in Poland in regional terms. It shows which regions of Poland attracted the greatest interest of foreign investors.
The results of this analysis may be interesting but their interpretation requires considerable caution. The presented values of foreign direct investment in Poland in a regional breakdown do not always reflect the real regional distribution of investment, i.e. the place where funds were really invested. The liabilities due to inward direct investment show the place of investment registration, whereas, in reality, capital expenditure is often incurred in other locations. A good illustration of this state of affairs is the Mazowieckie Voivodeship where definitely the highest number of direct investment entities is located (3,528 at the end of 2015) with liabilities due to inward direct investment. At the same time, it is known that investment projects registered in the accounting systems of companies which usually have their seat in Warsaw are often deployed in various, often distant regions of Poland. Thus, the regional distribution of foreign direct investment in Poland presented below should be treated carefully, taking into account the above comments.

Chapter 1
Narodowy Bank Polski26
Figure 9 Foreign direct investment positions in Poland at the end of 2015 broken down by voivodeships
200 000250 000300 000350 000400 000450 000
PLN million
150 000100 000
50 000
-50 0000
Dolnośl
ąskie
Kujawsko
-Pomors
kie
Lubels
kie
Lubusk
ieŁód
zkie
Małopol
skie
Mazowiec
kie
Opolski
e
Podkarp
ackie
Podlask
ie
Pomors
kieŚląs
kie
Świętokrz
yskie
Warmińs
ko-Mazu
rskie
Wielkopo
lskie
Zachodn
iopom
orskie
Liabilities Net liabilitiesAssets
Similar to previous years, the highest net liabilities due to inward direct investment were recorded in the Mazowieckie Voivodeship (PLN 389.5 billion). Liabilities of direct investment entities from this region accounted for 54.7% of Poland’s total inward direct investment liabilities at the end of 2015. A significant investments of foreign direct investors were also recorded in Śląskie Voivodeship (PLN 67.6 billion), Wielkopolskie Voivodeship (PLN 63.2 billion), Dolnośląskie Voivodeship (PLN 40.5 billion), Małopolskie Voivodeship (PLN 35.2 billion) and Pomorskie Voivodeship (PLN 25.2 billion). Well-developed links with international groups, represented by significant receivables from affiliates, are mainly recorded in the Mazowieckie and Śląskie voivodeships.
A review of the average value8 of direct investment in individual voivodeships gives a slightly different picture. In these terms, the highest positions are occupied by: the Podkarpackie Voivodeship (PLN 151 million), Mazowieckie Voivodeship (PLN 110 million), Śląskie Voivodeship (PLN 108 million) and Świętokrzyskie Voivodeship (PLN 102 million). The lowest average value of direct investment was recorded in the Opolskie Voivodeship (PLN 39 million).
In 2015, similar to the previous years, the geographical structure of liabilities due to inward direct investment in individual voivodeships was quite diversified. In the Mazowieckie Voivodeship investors from the Netherlands were present (PLN 65.3 billion, i.e. 16.8% of the voivodeship’s total liabilities due to direct investment), as well as those from Germany (PLN 51.7 billion, i.e. 13.3%) and Luxembourg (PLN 34.9 billion, i.e. 9.0%). The total liabilities of direct investment entities from the Mazowieckie Voivodeship to the three aforementioned countries accounted for 39.0% of the voivodeship liabilities due to direct investment. A similar situation was observed in the majority of other voivodeships, where inward direct investments originated mainly from the three aforementioned countries. In the Dolnośląskie Voivodeship liabilities to investors from Germany prevailed, in Kujawsko-Pomorskie and Śląskie voivodeships, to investors from the Netherlands and in the Małopolskie Voivodeship to investors from Luxembourg.
8 The average value is understood here as the quotient of liabilities due to direct investment in a given voivodeship and the number of entities with a direct investor having their seat in such a voivodeship.

Foreign direct investment in Poland
27Foreign direct investment in Poland and Polish direct investment abroad in 2015
Figure 10 Foreign direct investment positions in Poland at the end of 2015 broken down by voivodeships and main counterpart countries
Germany Luxembourg Netherlands Other countries
0102030405060708090
100%
Dolnośląskie
Kujawsko-Pomorskie
Lubelskie
Lubuskie
Łódzkie
Małopolskie
Mazow
ieckie
Opolskie
Podka
rpackie
Podlaskie
Pomorskie
Śląskie
Święto
krzyskie
Warmińsko-Mazurskie
Wielkopo
lskie
Zacho
dniopo
morskie
Within the industry structure of liabilities due to inward direct investment, direct investment entities associated with the manufacturing section (section C) prevailed in almost all voivodeships. The Mazowieckie Voivodeship was an exception, where entities representing financial and insurance activity prevailed (section K). In the Małopolskie, Wielkopolskie and Mazowieckie voivodeships the significant share of companies associated with wholesale and retail trade (section G) is worth emphasising.
At the end of 2015, similar to the previous year, the following voivodeships demonstrated a high industry concentration of direct investment: Podlaskie, Lubuskie and Warmińsko- -Mazurskie (mainly manufacturing, section C).
Figure 11 Foreign direct investment positions in Poland at the end of 2015 broken down by voivodeships and main economic activities
0102030405060708090
100%
Dolnośl
ąskie
Kujawsko
-Pomors
kie
Lubels
kie
Lubusk
ieŁód
zkie
Małopol
skie
Mazowiec
kie
Opolski
e
Podkarp
ackie
Podlask
ie
Pomors
kieŚląs
kie
Świętokrz
yskie
Warmińs
ko-Mazu
rskie
Wielkopo
lskie
Zachodn
iopom
orskie
Other sectionsFinancial and insurance activitiesWholesale and retail trade; repair of motor vehicles and motorcyclesManufacturing

Chapter 1
Narodowy Bank Polski28
It should be pointed out that from the point of view of the economic policy of a given region, a high concentration of inward direct investment (either in terms of industry or in geographical terms) is not favourable. The reason is that the risk of withdrawal of the biggest investor usually triggers threats and affects the economic condition of the given region.
1.4 Income on foreign direct investment in Poland
In 2015 income on foreign direct investment in Poland amounted to PLN 67.5 billion and was by PLN 3.3 billion, i.e. 5.2% higher than in 2014.9
It consisted of dividends at the level of PLN 29.0 billion, reinvested earnings at the level of PLN 30.4 billion and interest amounting to PLN 8.1 billion.
Income on inward direct investment in Poland grew in 2015, as compared to the previous year, despite the overall decrease in Poland’s liabilities due to this investment. The main reason was the fact that the decrease in liabilities resulted, to a major extent, from the decline in valuation of direct investment in Poland, which did not have an adverse impact on income from this investment.
Figure 12 Income on foreign direct investment in Poland in 2000–2015
PLN million
-10 0000
10 00020 00030 00040 00050 000
80 000
60 00070 000
2004 2005 2006 200720012000 2002 2003 2008 2009 2010 2011 2012 2013 2014 2015
Reinvested earnings InterestDividends Total
The geographical structure of income in 2015 reflected mainly the geographical structure of liabilities due to inward direct investment, which is associated with the fact that reinvested earnings constituted a major part of income.
The highest income was earned by investors from the Netherlands (PLN 14.5 billion) and Germany (PLN 13.7 billion). In both cases the figures were higher than in 2014. Subsequent positions were occupied by investors from Luxembourg (PLN 6.9 billion) and France
9 Since 2010 income on equity has been calculated in accordance with the Current Operating Performance Concept (COPC) which, excludes changes in valuation of financial instruments and extraordinary losses from the result generated by companies, which stabilises income presented by economic operators. More information about the method of income calculation is presented in the Methodological note.

Foreign direct investment in Poland
29Foreign direct investment in Poland and Polish direct investment abroad in 2015
(PLN 6.5 billion). The income of investors from France in 2015 was lower than a year before (by PLN 0.2 billion), whereas in the case of investors from Luxembourg, there was significant growth (of PLN 1.4 billion). Similar to the previous year, income generated by investment from the above mentioned countries accounted for approximately 62.0% of income due to foreign investment in Poland in 2015.
In 2015, the income of direct investors from the United Kingdom (PLN 3.5 billion), Sweden (PLN 3.5 billion), Italy (PLN 3.4 billion), Austria (PLN 2.7 billion), Spain (PLN 2.5 billion) and Switzerland (PLN 1.9 billion) remained at the similar level as compared to the previous year.
In 2015 over 40% (PLN 27.8 billion) of income on inward direct investment in Poland were generated by investment in the manufacturing section (section C). The highest amounts came from manufacture of metal and machinery products, except electrical equipment (PLN 5.7 billion) and from manufacture of motor vehicles, trailers and semitrailers and other transport equipment (PLN 5.1 billion). The only section which recorded significant losses due to inward direct investment was mining and quarrying (PLN -0.5 billion; section B).
Figure 13 Income on foreign direct investment in Poland in 2015 broken down by countries
PLN million
14 00016 000
12 00010 0008 0006 0004 0002 000
-2 0000
Reinvested earnings InterestDividends
Netherla
nds
United K
ingdom
Germany Spai
nItal
y
Belgium
Austria
France
Luxem
bourg
Switzerlan
d
Sweden
United S
tates
Other co
untries
Total
Finland
Denmark
Similar to previous years, in 2015 a significant part of income on inward direct investment in Poland fell to services (in total, PLN 36.9 billion; sections from G to U). The prevailing part of income was gained by direct investors from the section of wholesale and retail trade, including the repair of motor vehicles and motorcycles (PLN 10.5 billion; section G). The subsequent positions were taken by income from the following sections: financial and insurance activity (PLN 9.7 billion; section K) as well as information and communication (PLN 6.5 billion; section J).
In 2015, similar to previous years, dividends and reinvested earnings prevailed in the structure of income on direct investment in Poland. Interest constituted a minor part, which reflects the structure of direct investment liabilities.

Chapter 1
Narodowy Bank Polski30
Figure 14 Income on foreign direct investment in Poland in 2015 broken down by economic activity
PLN million
20 000
30 000
15 000
25 000
10 000
5 000
0
-5 000
Reinvested earnings InterestDividends Total
C MG J LK D35H N AF B Othersections
A − Agriculture, forestry and fishing; B − Mining and quarrying; C − Manufacturing; D35 − Electricity, gas, steam and air conditioning supply; F − Construction; G − Wholesale and retail trade; repair of motor vehicles and motorcycles; H − Transport and storage; J − Information and communication; K − Financial and insurance activities; L − Real estate activities; M − Professional, scientific and technical activities; N − Administrative and support service activities.

Polish direct investment abroad
Chapter 2

Chapter 2
Narodowy Bank Polski32
Polish direct investment abroad
2.1 Polish direct investment transactions abroad
In 2015, the net value of Polish outward direct investment transactions amounted to PLN 12.1 billion (compared to the previous year it represented a growth of PLN 3.0 billion, i.e. 32.6%). This growth was primarily influenced by positive balances of: equity transactions (PLN 10.8 billion) and debt financial instruments transactions (PLN 1.8 billion), exceeding the negative amount of reinvestment of earnings (PLN -0.6 billion). For comparison, in 2014 growth of Polish outward direct investment was mainly determined by the positive balance of equity transactions, in the amount of PLN 17.5 billion and positive reinvestment of earnings in the amount of PLN 1.6 billion. On the other hand, an item decreasing the total value of transactions due to Polish outward direct investment was the negative balance of debt financial instruments transactions (PLN -9.9 billion).
Figure 15 Polish direct investment transactions abroad in 2000–2015
PLN million
20 000
15 000
-15 000
25 000
10 000
-10 000
5 000
0
-5 000
2004 2005 2006 200720012000 2002 2003 2008 2009 2010 2011 2012 2013 2014 2015
Debt instruments TotalReinvestment of earningsEquity
The fluctuation in the value of Polish outward direct investment transactions is mainly determined by individual transactions. A similar situation occurred in 2015. If one big transaction of Polish direct investors had not taken place, Polish outward direct investment in 2015 would have been negative. However, their value is also influenced by events associated with the global economic situation and conditions arising from the national economic environment. Both those factors influenced decisions taken in 2015 by Polish direct investors concerning the further method of investing funds, particularly within groups of companies. Moreover, turmoil in global financial markets resulted in a deterioration in the financial condition of foreign direct investment entities, which is demonstrated by the negative amount of reinvested earnings (the losses incurred in 2015 and the amount of declared dividends exceeded the profits generated in 2015).
An analysis of the level and structure of value of equity transactions, reinvestment of earnings and debt financial instruments transactions, as well as a comparison of the year 2015 with the previous year once again confirm the opinion that in the case of Polish outward direct

Polish direct investment abroad
33Foreign direct investment in Poland and Polish direct investment abroad in 2015
investment, due to the relatively low volumes of transactions and the considerable influence of single transactions of significant values, it is difficult to refer to sustainable, long-term trends.
The geographical structure of Polish outward direct investment in 2015 was similar to that of 2014.
Figure 16 Polish direct investment transactions abroad in 2015 broken down by countries
PLN million14 00012 00010 0008 0006 0004 0002 000
-2 000-4 000-6 000-8 000
0
TotalDebt instrumentsReinvestment of earningsEquity
United K
ingdom
Germany
Cyprus
Austria
Luxem
bourg
Canada
Hungary
Switzerlan
d
Sweden
United S
tates
Norway
Other co
untries
Countries with the highest positive values of Polish outward direct investment transactions included Cyprus (PLN 11.2 billion), Switzerland (PLN 4.0 billion) and Canada (PLN 2.3 billion). In the case of Cyprus and Switzerland, investors purchased mainly equity. In Canada, Norway and Sweden, the predominance of investment in the form of debt instruments was visible. Investment was mainly targeted at direct investment entities dealing with financial and insurance activity (PLN 13.1 billion; section K), including activities of holding companies (PLN 10.6 billion), mining and quarrying (PLN 4.3 billion; section B) and real estate activities (PLN 0.9 billion; section L). Countries which reported the highest value of disinvestment (negative values of Polish outward direct investment transactions) included: Luxembourg (PLN -4.4 billion), Sweden (PLN -2.2 billion) and Norway (PLN -1.1 billion).
Disinvestment concerned mainly direct investment entities established in Luxembourg (PLN -5.5 billion). Capital was mainly withdrawn from entities representing professional, scientific and technical activities (PLN -5.9 billion; section M).
The balance of debt financial instruments transactions, increasing Polish outward direct investment amounted to PLN 1.9 billion in 2015 and to PLN -9.9 billion in 2014. The radical change in both the level and the direction of this balance resulted from the increase in the level of loans granted by Polish direct investors to their foreign subsidiaries and from repayment of loans received from those companies by Polish investors.
In 2015, the major borrowers included direct investment entities established in Canada (PLN 2.3 billion) and Luxembourg (PLN 1.2 billion). The majority of them constituted enterprises dealing with mining and quarrying (PLN 4.2 billion; section B). On the other

Chapter 2
Narodowy Bank Polski34
hand, companies located in Sweden continued to be the largest creditors for residents. Entities associated with information and communication were the source of such loans (section J).
Figure 17 Polish direct investment transactions abroad in 2015 broken down by economic activity
PLN million20 000
15 000
10 000
-10 000
5 000
0
-5 000
TotalDebt instrumentsReinvestment of earningsEquity
MG JLK D35HI FB Othersections
B − Mining and quarrying; D35 − Electricity, gas, steam and air conditioning supply; F − Construction; G − Wholesale and retail trade; repair of motor vehicles and motorcycles; H − Transport and storage; I − Accommodation and food service activities; J − Information and communication; K − Financial and insurance activity; L − Real estate activities; M − Professional, scientific and technical activities.
2.2 Polish direct investment positions abroad
At the end of 2015 net Polish outward direct investment positions amounted to PLN 93.6 billion, i.e. by PLN 3.7 billion, i.e. 4% less than at the end of the previous year. The reasons behind the decrease were negative changes of valuation and losses sustained by direct investment entities which were not offset by exchange gains resulting from the depreciation of the zloty.
The amount of Polish outward direct investment positions consisted of equity position at the level of PLN 97.7 billion and negative debt financial instruments position at the level of PLN -4.1 billion. The negative debt financial instruments position resulted from the liabilities of Polish direct investors (PLN 46.4 billion), exceeding their receivables (PLN 42.3 billion) from foreign affiliates.
The negative debt financial instruments position, like in 2013 and 2014, resulted from the indebtedness of Polish direct investors in foreign direct investment entities. It should be noted that it is a typical situation for Polish outward direct investment, part of which is performed with the purpose of acquisition of funds through daughter companies established outside the country.
At the end of 2015, like a year ago, the countries with the highest positive Polish direct investment positions included: Cyprus (PLN 35.1 billion) and Luxembourg (PLN 19.3 billion), followed by the Czech Republic (PLN 7.3 billion) and the Netherlands (PLN 7.1 billion). The sources of these positions included mainly foreign direct investment entities dealing with financial and insurance activity (PLN 48.0 billion; section J), manufacturing (PLN 15.3 billion; section C) and administrative and support service activities (PLN 14.8 billion; section N).

Polish direct investment abroad
35Foreign direct investment in Poland and Polish direct investment abroad in 2015
The highest negative positions were recorded by direct investment entities registered in Sweden (EUR -22.8 billion). They usually comprised daughter companies through which Polish direct investors gained access to capital, e.g. by means of the issue of bonds in the European market. Direct investment entities associated with information and communication (PLN -7.6 billion; section J) had the highest negative positions.
Figure 18 Polish direct investment positions abroad at the end of years 2000−2015
PLN million
-20 000
0
20 000
40 000
80 000
100 000
120 000
60 000
2004 2005 2006 200720012000 2002 2003 2008 2009 2010 2011 2012 2013 2014 2015
Debt instrumentsEquity Total
Figure 19 Polish direct investment positions abroad at the end of 2015 broken down by countries
PLN million
-10 000
0
10 000
20 000
-20 000
30 000
-30 000
40 000
Netherla
nds
United K
ingdom
Lithuan
ia
Germany
Belgium
Cyprus
Luxem
bourg
Czech R
epublic
Canada
Switzerlan
d
Sweden
Malta
United S
tates
Russia
Other co
untries
Debt instruments TotalEquity
Similar to 2014, the main sources of Polish outward equity position in 2015 included direct investment entities established in Cyprus (PLN 35.4 billion) and Luxembourg (PLN 17.6 billion). It was the consecutive year that these positions were mainly allocated to entities dealing with financial and insurance activity (PLN 52.9 billion; section K). They mainly comprised entities conducting holding activities for investment in other countries.
In 2015 the highest outward debt financial instruments positions were recorded by direct investment entities established in Canada (PLN 2.9 billion), the Netherlands (PLN 2.7 billion) and the Czech Republic (PLN 2.1 billion).

Chapter 2
Narodowy Bank Polski36
Within outward debt instruments position, mining and quarrying (PLN 8.7 billion; section B), manufacturing (PLN 3.2 billion; section C) and real estate activities (PLN 2.7 billion, section L) deserve attention.
Figure 20 Polish direct investment positions abroad at the end of 2015 broken down by economic activity
PLN million
-10 000
0
10 000
20 000
-20 000
30 000
60 000
50 000
40 000
TotalDebt instrumentsEquityM G JLK D35SNC HB Other
sections
B − Mining and quarrying; C − Manufacturing; D35 − Electricity, gas, steam and air conditioning supply; G − Wholesale and retail trade; repair of motor vehicles and motorcycles; H – Transportation and storage; J − Information and communication; K − Financial and insurance activity, L − Real estate activities; M − Professional, scientific and technical activities; N – Administrative and support service activities; S – Other service activities.
The industry structure of Polish direct investor’s assets claim (receivables) was similar to that of the previous year. Receivables connected with the broadly defined services sector (sections from G to U) constituted the major part, accounting for approximately 80% of all Poland’s receivables from foreign direct investment entities at the end of 2015. They comprise receivables from foreign entities dealing with financial and insurance activity (PLN 47.9 billion; section K), administrative and support service activities (PLN 14.8 billion; section N) as well as professional, scientific and technical activities (PLN 11.3 billion; section M). Receivables from entities dealing with manufacturing (section C) amounted to PLN 15.3 billion, whereas receivables from entities involved in mining and quarrying (section B) were equal to PLN 9.5 billion. Similar to the previous year, negative receivables were recorded in the case of entities dealing with information and communication (PLN -7.6 billion; section J) and electricity, gas, steam and air conditioning supply (PLN -6.7 billion; section D).
2.3 Income on Polish direct investment abroad
In 2015, the total income of residents on Polish outward direct investment amounted to PLN 2.3 billion, which represented a decline by PLN 2.7 billion compared to the previous year. The main reasons for the decline included lower profits than a year ago and losses of direct investment entities which, considering the significant level of the dividends, resulted in negative reinvested earnings. Interest income on debt financial instruments amounted to PLN 0.3 billion and was almost three times higher than in the previous year. The positive balance of interest income (surplus of interest received by Polish direct investors over interest paid by them due to the use of debt instruments) resulted from the structure of receivables

Polish direct investment abroad
37Foreign direct investment in Poland and Polish direct investment abroad in 2015
due to debt financial instruments. The receivables originated mostly from the financing of outward investment, where Polish investors collect a risk premium from abroad, whereas in the case of liabilities the entity in the group acts only as an intermediary in collecting financing from the market – in this case, the interest is closer to low market interest.
Figure 21 Income on Polish direct investment abroad in 2000–2015
PLN million6 000
4 000
2 000
-2 000
-4 000
-6 000
0
2004 2005 2006 200720012000 2002 2003 2008 2009 2010 2011 2012 2013 2014 2015
TotalReinvested earnings InterestDividends
While looking at the several-year long time series of data related to income on Polish outward direct investment, attention should be paid to the fact that since 2011 residents’ income in the form of dividends has been growing steadily. However, in 2015 the amount of declared dividends was by PLN 0.8 billion lower, i.e. 23%, than a year earlier and amounted to PLN 2.6 billion. This is the result of single transactions of the previous year and rather does not mean a significant change of the trend.
In 2015, the highest dividends declared in favour of direct investors from Poland originated from foreign direct investment entities registered in Cyprus (PLN 0.7 billion), in Switzerland (PLN 0.3 billion) and Germany (PLN 0.2 billion). They comprised receivables from foreign entities dealing with financial and insurance activity (PLN 0.8 billion; section K), administrative and support service activities (PLN 0.5 billion; section N) as well as professional, scientific and technical activities (PLN 0.4 billion; section M). For comparison, in 2014 the highest inflows due to dividends concerned foreign direct investment entities established in Luxembourg (PLN 1.0 billion) and in Slovakia and Cyprus (PLN 0.7 billion each). The sources of those inflows also comprised financial and insurance activity (PLN 1.7 billion; section K) and administrative and support service activities (PLN 0.7 billion; section N).
The highest positive balance of income on Polish outward direct investment was achieved by foreign direct investment entities established in Lithuania (PLN 1.3 billion) and in Cyprus (PLN 0.9 billion). They mainly comprised entities associated with manufacturing (PLN 1.0 billion; section C) as well as with wholesale and retail trade, including repair of motor vehicles and motorcycles (PLN 0.5 billion, section G). On the other hand, the highest negative balance of income was shown by entities registered in Luxembourg (PLN -0.8 billion), the United States (PLN -0.6 billion) and in Sweden (PLN -0.4 billion). In the case of Luxembourg and the United States, the negative income balances were determined by negative amounts of reinvested earnings (in those countries, balance sheet losses incurred by direct investment

Chapter 2
Narodowy Bank Polski38
entities exceeded their profits). On the other hand, in Sweden the negative amount was the result of relatively high interest payments due to debt financial instruments.
Figure 22 Income on Polish direct investment abroad in 2015 broken down by countries
PLN million
0
-500
500
-1 000
1 000
-1 500
1 500
Reinvested earnings InterestDividends Total
Lithuan
ia
Germany
Norway
Cyprus
Luxem
bourg
Czech R
epublic
Sweden
United S
tates
Other co
untries
Hungary
Slovaki
aFran
ceSpai
n
Romani
a
Figure 23 Income on Polish direct investment abroad in 2015 broken down by economic activity
PLN million1 000
800
600
-600
400
-400
200
-200
0
Reinvested earnings InterestDividends Total
MG J LK D35IF SNC B Othersections
B − Mining and quarrying; C − Manufacturing; D35 − Electricity, gas, steam and air conditioning supply; F − Construction; G − Wholesale and retail trade; repair of motor vehicles and motorcycles; I − Accommodation and food service activities; J − Information and communication; K − Financial and insurance activities; L − Real estate activities; M − Professional, scientific and technical activities; N – Administrative and support service activities; S – Other service activities.
As already mentioned, in 2015 income on Polish outward direct investment in the form of reinvested earnings was negative (PLN -0.6 billion). In 2014, the total amount of reinvested earnings was positive and amounted to PLN 1.6 billion. The highest level of positive reinvested earnings was reached by foreign direct investment entities with their seat in the Czech Republic (PLN 0.3 billion) as well as in Norway and in the Russian Federation (PLN 0.1 billion each), representing mainly the manufacturing section (PLN 0.7 billion; section C). On the other hand, the highest negative reinvested earnings were recorded by enterprises from Luxembourg

Polish direct investment abroad
39Foreign direct investment in Poland and Polish direct investment abroad in 2015
(PLN -0.9 billion) and the United States (PLN -0.6 billion), mainly conducting professional, scientific and technical activities (PLN -0.5 billion; section M).
In 2015, significant growth of debt income, i.e. interest on debt financial instruments, was mainly recorded by foreign direct investment entities with their seat in Cyprus (PLN 0.2 billion) as well as in Norway and the Netherlands (PLN 0.1 billion each). These were mainly entities dealing with wholesale and retail trade; repair of motor vehicles and motorcycles (PLN 0.3 billion; section G) as well as mining and quarrying (PLN 0.2 billion; section B).


Profitability of entities with the share of foreign direct investment capital
Chapter 3

Chapter 3
Narodowy Bank Polski42
Profitability of entities with the share of foreign direct investment capital
One of the major factors determining the selection of location for foreign direct investment is profitability. It is higher than profitability of other categories of the balance of payments. In the case of Poland, direct investment income represents an important part of the (usually negative) balance of payments current account.
The level of income gained by foreign direct investors depends on the time horizon of investment. This dependence is demonstrated by the value of the cumulative total rate of return on investment. In the first years it usually assumes negative values, to reach levels significantly above zero in subsequent periods. The initial loss incurred by foreign investors results mainly from the need to bear considerable capital expenditure (associated, among others, with the purchase of shares, assets, in-kind contribution, e.g. in the form of machinery) in relation to the income gained.
Another equally important factor influencing the level of income gained on invested capital is the tax. The maintenance of the corporate income tax (CIT) rate in Poland at a relatively low, stable level in the years 2000−2015 was accompanied by an increase in earnings from the current activity of direct investment entities (practically throughout the entire period, excluding 2008, when the earnings were reduced by the financial crisis).
In 2005–2014 foreign direct investors retained10 almost half of the annual earnings gained on current activity in direct investment entities established in Poland. Over a period of ten years, the rate of retained earnings showed an upward tendency (excluding the “crisis” years) from 27.6% in 2005 to 47.8% in 2014.
Due to the low value of Polish outward direct investment, this chapter focuses only on inward direct investment in Poland.
3.1 Profitability of foreign direct investment in Poland
In the analysis of inward direct investment profitability, the indicators of return on equity, return on debt instruments and total profitability, are used. The general form of the aforementioned indicators results from the formula:
profitability t =
incone t ,
where:
position
t
–
1
10 The retaining of earnings means leaving a part of the profit from a given year after deducting the dividend paid from the earnings.

Profitability of entities with the share of foreign direct investment capital
43Foreign direct investment in Poland and Polish direct investment abroad in 2015
profitability t – return on equity in a given year or return on debt instruments in a given year
or total profitability in a given year,
income t – current operating performance understood as the sum of dividends declared in
a given year and reinvested earnings in a given year (for the rate of return on equity), income on debt (interest) in a given year (for the rate of return on debt instruments), the sum of dividends declared in a given year, earnings reinvested in a given year and interest in a given year (for the total profitability ratio),
position t – 1 – equity position in the preceding year (for the rate of return on equity), debt
position in the preceding year (for the rate of return on debt instruments), total foreign direct investment position in Poland in the previous year (for the total profitability ratio).
The rate of return on equity demonstrates the level of income gained in a given year from capital invested in the preceding year, in equity.
The rate of return on debt instruments refers to the level of interest on loans granted by foreign direct investors accrued in a given year, in relation to debt instruments position at the end of the preceding period (i.e. it refers to the annual interest rate on capital acquired from direct investors).
The total profitability ratio demonstrates the level of income gained by a foreign investor in a given year on the total invested capital, in relation to the value of this capital at the end of the previous year.
Figure 24 Profitability ratios of foreign direct investment in Poland in 2001–2015
25
20
15
10
5
-5
%
0
2004 2005 2006 20072001 2002 2003 2008 2009 2010 2011 2012 2013 2014 2015
Return on equity Return on debt instruments Total profitability
In the years 2001−2004 the rate of return on equity was growing steadily reaching -0.2%; 0.5%; 4.3% and 20.7% in the subsequent years. The growth of its value resulted from the increasing value of current operating profit of direct investment entities (from PLN -0.3 billion in 2001 to PLN 32.5 billion in 2004) in relation to equity position remaining at a similar level, amounting, on average, to PLN 131 billion. In the subsequent years (i.e. from 2005 to 2010) periods of alternate decrease and increase in the level of the rate of return on equity were observed. In 2005 this rate decreased to the level of 13.5%, and increased to 17.8% over
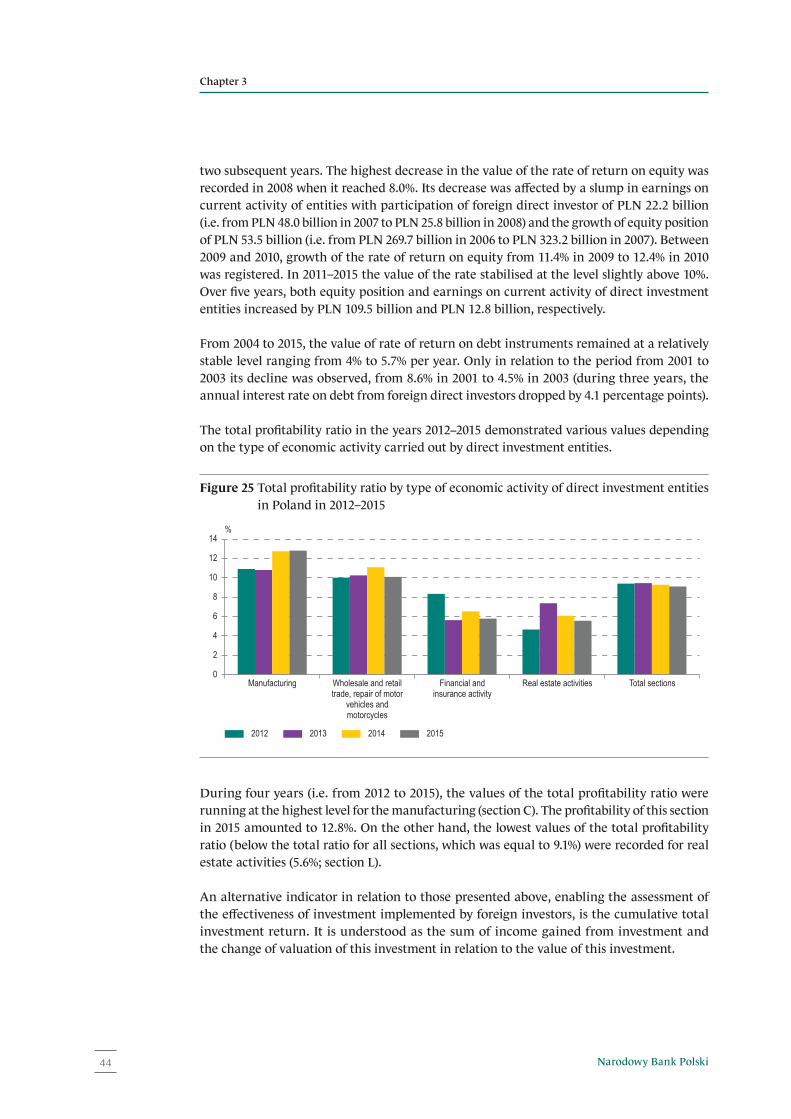
Chapter 3
Narodowy Bank Polski44
two subsequent years. The highest decrease in the value of the rate of return on equity was recorded in 2008 when it reached 8.0%. Its decrease was affected by a slump in earnings on current activity of entities with participation of foreign direct investor of PLN 22.2 billion (i.e. from PLN 48.0 billion in 2007 to PLN 25.8 billion in 2008) and the growth of equity position of PLN 53.5 billion (i.e. from PLN 269.7 billion in 2006 to PLN 323.2 billion in 2007). Between 2009 and 2010, growth of the rate of return on equity from 11.4% in 2009 to 12.4% in 2010 was registered. In 2011–2015 the value of the rate stabilised at the level slightly above 10%. Over five years, both equity position and earnings on current activity of direct investment entities increased by PLN 109.5 billion and PLN 12.8 billion, respectively.
From 2004 to 2015, the value of rate of return on debt instruments remained at a relatively stable level ranging from 4% to 5.7% per year. Only in relation to the period from 2001 to 2003 its decline was observed, from 8.6% in 2001 to 4.5% in 2003 (during three years, the annual interest rate on debt from foreign direct investors dropped by 4.1 percentage points).
The total profitability ratio in the years 2012−2015 demonstrated various values depending on the type of economic activity carried out by direct investment entities.
Figure 25 Total profitability ratio by type of economic activity of direct investment entities in Poland in 2012–2015
%
10
8
12
14
6
4
2
0Total sectionsReal estate activitiesFinancial and
insurance activityWholesale and retailtrade, repair of motor
vehicles andmotorcycles
Manufacturing
2012 2013 2014 2015
During four years (i.e. from 2012 to 2015), the values of the total profitability ratio were running at the highest level for the manufacturing (section C). The profitability of this section in 2015 amounted to 12.8%. On the other hand, the lowest values of the total profitability ratio (below the total ratio for all sections, which was equal to 9.1%) were recorded for real estate activities (5.6%; section L).
An alternative indicator in relation to those presented above, enabling the assessment of the effectiveness of investment implemented by foreign investors, is the cumulative total investment return. It is understood as the sum of income gained from investment and the change of valuation of this investment in relation to the value of this investment.

Profitability of entities with the share of foreign direct investment capital
45Foreign direct investment in Poland and Polish direct investment abroad in 2015
The cumulative total investment return indicates the total rate of return on investment achievable by a foreign investor in a given year, based on capital. In relation to inward direct investment in Poland, this indicator is provided by the following formula:
CTIR t =
position t – position 0 + ∑
t
i = 0 div i + ∑
t
i = 0 int i – ∑
t
i = 0 trans i ,
where: position
0 + ∑
t
i =
0 trans
i
CTIRt – cumulative total investment return at the end of the year,positiont – position0 – change in Poland’s inward direct investment position, understood
as the difference between Poland’s inward direct investment position in a given year (positiont ) and Poland’s inward direct investment position in the initial period – 0.
∑ t
i =
0 div
i – cumulative value of declared dividends from the initial year (0) to a given year,
∑ t
i =
0 int
i – cumulative value of income on debt (interest) from the initial year (0) to a given year,
∑ t
i =
0 trans
i – cumulative value of transactions (less the value of reinvested earnings) from the initial year (0) to a given year.
The year 2000 was adopted as the initial year for calculating the indicator (period 0), due to the lack of data in the relevant categories. Consecutive t periods mean the consecutive years after 2000, e.g. period t = 13 means 2013.
In order to show the cumulative total investment return, the sum of the change of positions, declared dividends and interest accrued was decreased by the value of transactions. In order to refer the gained rate of return to invested capital (working in consecutive years), the physical capital was estimated by means of the cumulative value of transactions. Due to the creation of the total rate of return on investment taking into account reinvested earnings which raise the value of direct investment entities, the value of transactions in the formula was reduced by the value of reinvested earnings.
Figure 26 Cumulative total investment return gained by foreign direct investors in Poland in 2001–2015
%
-40
40
-20
20
8060
120100
140
0
2004 2005 2006 20072001 2002 2003 2008 2009 2010 2011 2012 2013 2014 2015

Chapter 3
Narodowy Bank Polski46
In the years 2001−2003 the cumulative total investment return reached a negative but steadily growing value, ranging from -17.3% in 2001 to -3.4% in 2003. The observed loss incurred by direct investors due to capital invested in Poland resulted mainly from high capital expenditure in relation to the income generated. The first year when foreign direct investors recorded a positive return on invested capital, amounting to 8.8%, was 2004 (in the case of the inclusion of the data recorded before 2000, this return would probably have been recorded earlier11). In 2004 the growth rate of the cumulative total investment return in relation to the previous year was equal to 362%.
Starting from 2005 to 2015 the cumulative total investment return was increasing: from 20.1% in 2005 to 123.5% in 2015. Only in 2011 and in 2015 the value of the analysed indicator decreased in relation to the previous year, i.e. by 2.7 percentage points (a decline in the cumulative total investment return from 86.2% in 2010 to 83.5% in 2011) and by 8.2 percentage points (a decline in the value of the indicator from 131.7% in 2014 to 123.5% in 2015. The aforementioned decline in the value of the cumulative total investment return in 2011 could have resulted, among others, from the debt crisis of the euro area. Moreover, the reasons for the decline in the cumulative total investment return in 2011 should be attributed, among others, to the decline in the income generated by foreign direct investors and to the growth of capital expenditure. On the other hand, the decline in the value of the analysed indicator in 2015 resulted from the decrease in equity position from PLN 569.1 billion in 2014 to PLN 534.2 billion in 2015 (a decline of PLN 34.9 billion).
The level of income, which is one of the major factors determining the selection of location for inward direct investment, is significantly affected by the tax burden. One of the important taxes contributing to the reduction of entities’ earnings is corporate income tax (CIT). In the case of the maintenance of high tax rates in a given country, the owners of enterprises willingly undertake measures to optimise tax burdens. To that end they use various methods of tax optimisation, among others, tax controlling, pre-emptive tax planning, measures optimising financial flows, measures aimed at reducing the tax base.12
Both the level of corporate income tax rate (CIT rate) and the frequency of its changes, influence the tax policy pursued by an enterprise and, as a consequence, the level of recognised current operating performance.
Over 16 years (i.e. between 2000 and 2015), 2001 was the only year when direct investment entities posted a loss on current activity. Starting from 2002, the current operating performance of companies with the share of foreign direct investment capital increased from PLN 0.6 billion in 2002 to PLN 32.5 billion in 2004. In 2005 it dropped to the level of PLN 27.7 billion as a result of a drop in the current operating profit of direct investment entities of PLN 4.7 billion in relation to the previous year. In the subsequent years further growth of earnings was observed: from PLN 37.7 billion in 2006 to PLN 48.0 billion in 2007, as well as a temporary decline in 2008. The aforementioned decline in the current operating profit of direct investment entities was a consequence of the global economic crisis (in 2008 the rate of decrease amounted to 46% in relation to the previous year).
11 Similar phenomena are also observed in other countries (see: Novotný F., “Profitability Life Cycle of Foreign Direct Investment and its Application to the Czech Republic”, CNB Working Paper Series, No. 11/2015).
12 Wyrzykowski W., “Optymalizacja podatkowa przedsiębiorców – granice prawa a granice bezpieczeństwa”, Zarządzanie i Finanse, Vol. 13, No. 3/2/2015.

Profitability of entities with the share of foreign direct investment capital
47Foreign direct investment in Poland and Polish direct investment abroad in 2015
Figure 27 Current operating performance of direct investment entities against the CIT rate in 2000–2015
%
25
20
35
30
15
10
5
-5
0
40 000
-10 000
10 000
30 000
50 000
20 000
60 000
70 000
0
PLN million
2004 2005 2006 200720012000 2002 2003 2008 2009 2010 2011 2012 2013 2014 2015
Current operating performance (left axis) CIT rate (right axis)
The years 2009−2015 saw further growth of the current operating profit of foreign direct investors due to capital invested in Poland. Between 2009 and 2010, the reasons for the aforementioned growth of profit should be attributed to the increasing profitability of direct investment entities and the growth of the level of invested capital. In the subsequent years, amid stable profitability, the growth of the current operating profit was only a consequence of the growth of the level of working capital.
Between 2000 and 2003 the CIT rate in Poland was reduced by 3 percentage points, i.e. from 30% in 2000 to 28% in 2001 and to 27% in 2003 (in 2002 the previous year’s rate was maintained). Moreover, a significant change in the level of the CIT rate was introduced in 2004, when it was set at 19%. Alongside the reduction of the corporate income tax rate, an increase in the current operating profit was observed of 443% in relation to the previous year, i.e. from PLN 6 billion in 2003 to PLN 32.5 billion in 2004.
3.2 Retained earnings of direct investment entities
In 2005−2014 Poland was a relatively attractive location for inward direct investment. This is confirmed by the relatively high, positive rate of retained earnings (amounting to approximately 35% on average in the period under analysis). This rate is calculated according to the following formula:
retention rate t = income t – div t + 1 ,
where:
income t
income t − current operation performance understood as the sum of declared dividends in a given year and reinvested earnings in a given year,
div t + 1 – declared dividend in the subsequent year from the profit of the previous year (incomet ).

Chapter 3
Narodowy Bank Polski48
The rate of retained earnings of a given year shows what part of profit for a given year was retained by foreign investors in direct investment entities. This rate is not the term equivalent to the earnings reinvestment rate presented in earlier chapters. The first of the aforementioned rates refers to the real distribution of generated current operating performance into a part paid in the form of dividend and a part left in direct investment entities. On the other hand, the reinvestment rate constitutes the part of the profit generated through reducing the profit of a given year by the dividend declared in a given year from the profit for the previous year.13 At the same time, the interpretation of the earnings reinvestment rate is hindered significantly due to the problem of negative reinvested earnings emerging when the value of the current operating performance for a given year is lower than the value of the dividend declared in a given year from the current operating performance for the previous year. The rate of retained earnings is free from the aforementioned interpretation problem, whereas it is not free from other defects. Unlike the earnings reinvestment rate, due to the lack of data related to the value of the dividend declared in the next year it is calculated with a greater delay (at the moment of presentation of the report, it is only possible to calculate it up to 2014).
Figure 28 Earnings retention rate in direct investment entities in 2005–2014
%
20
30
40
50
10
02005 2006 2007 2008 2009 2010 2011 2012 2013 2014
In the years 2005−2007 the earnings retention rate increased from 27.6% in 2005 to 41.5% in 2007; subsequently, in 2008 its rapid short-term decline to the level of 9.4% was observed. This decline was associated with the decrease in the total income gained by direct investors (i.e. from PLN 51.5 billion in 2007 to PLN 30.1 billion in 2008), as a consequence of the global economic crisis continuing from mid-2007. In 2009, 2010 and in 2011, foreign investors retained the following levels of current operating profit in direct investment entities: 38.7%, 46.1% and 40.8%, respectively, in relation to the total profits generated in those years. In 2012 a decline of the rate of retained earnings to the level of 20.8% was observed (decline of the rate by 20.0 percentage points in relation to the previous year). This decline was accompanied by the increase in the dividends paid (from PLN 24.9 billion in 2011 to PLN 27.5 billion in 2012), the increase in the income on debt instruments (from PLN 5.3 billion to PLN 6.3 billion) and the increase in the total income of foreign investors due to the capital invested in Poland in the form of direct investment (from PLN 51.8 billion to PLN 52.0 billion). Both in 2013 and in 2014 the rate of retained profits increased to 42.0% in 2013 (growth of the rate of retained earnings by 21.2 percentage points in relation to 2012), and to 47.8% in 2014 (growth of 5.8 percentage points in relation to 2013).
13 The presented method of calculating the reinvested earnings results from international statistics manuals.

Profitability of entities with the share of foreign direct investment capital
49Foreign direct investment in Poland and Polish direct investment abroad in 2015
Between 2005 and 2014 foreign investors retained, on average, 35.5% of current operating profit on an annual basis in Polish direct investment entities. In this period, the highest retention rate was recorded in 2014 (investors retained 47.8% of the current operating profit in companies, in relation to the total profit generated in 2014). On the other hand, the lowest level of earnings rate retention was observed in 2008 when it amounted to 9.4%.
Throughout the majority of the period under analysis, the earnings retention rate showed an upward tendency. From 2005 to 2014, an increase by 20.2 percentage points was observed, i.e. from 27.6% in 2005 to 47.8% in 2014. Only in the “crisis” years (in 2008 and in 2012) it showed a decline triggered by the financing of foreign investors with disbursements of higher dividends from Polish direct investment entities.
Box 2 Dividends in direct investment entities1
The essence of an investment is the expectation of the owners of capital to receive benefits for making it available. The decisions to pay dividends on the equity depend on many factors. Below, the results of study conducted on the significance and direction of the impact of such factors in 2012−2014 in enterprises with participation of foreign direct investor are presented. The objective of the study was to understand the behaviour of Polish companies with the share of foreign capital (microeconomic aspect), as well as to better identify the developments in income streams and capital inflows to the Polish economy over time (macroeconomic aspect).
The data used in the study come from direct investment entities. For the analysis, the data from 3,437 entities with participation of a foreign direct investor were used.
In the analysis, the hypothesis stating that the payments of dividends by Polish direct investment entities are affected by identical factors as in the case of other enterprises operating in the Polish market was verified. In addition, the impact of the industry- -specific characteristics of entities with participation of a foreign direct investor on the decision to pay a dividend was verified.
In the years 2012−2014, a variable referring to the dividend paid in previous periods had a strong, positive and statistically important impact on the payment of dividends. The stake of the major investor and payments from the capital also showed a statistically significant, positive (although lower) impact on the relation of paid dividend to profit. In relation to the stake of the largest shareholders, the results obtained confirmed the conclusions concerning the higher propensity of big investors to pay dividends. In the case of withdrawn capital, a positive impact was observed. This could have resulted from statistical standards treating the payment of a dividend from reserve capital as disinvestment, rather than a dividend. Therefore, there is a likelihood that in the years 2012−2014 entities with participation of a foreign direct investor could pay
1 The box is a summary of the authors’ article published in Polish as “Wypłaty dywidend w spółkach z udziałem zagranicznych inwestorów bezpośrednich”, AUNC EKONOMIA, Vol. 47, No. 1 (2016), pp. 7–26.

Chapter 3
Narodowy Bank Polski50
3.3 Summary
In the years 2001−2002, the values of the rate of return on equity in Poland were lower than the values of the profitability ratio of debt instruments. Since 2004, a reverse situation has been observed. In the case of the return on equity, from 2004 alternate periods of growth and decline in the value of the ratio have been observed, followed by its stabilisation at the level slightly above 10%. On the other hand, the return on debt instruments has remained at the relatively stable level since 2004, ranging from 4% to 6%. Due to the predominance of shares and equity in the structure of liabilities arising from direct investment, the return rate reflects mainly the volatility of profitability of shares and equity. The influence of the return on debt instruments on total profitability is limited.
dividends from the current profit and dividends from the profit of the previous years at the same time.
A significant positive factor influencing the explained variable was also the participation of the given direct investment entity in the specific section or subsection of PKD 2007.
In relation to the variable describing the fact of activity of direct investment entities in a given section of PKD 2007, a statistically significant and positive impact of a given industry on the decision to pay dividends was noted in the case of the following sections: manufacturing, trade and financial intermediation and management consultancy.

Methodological note

Narodowy Bank Polski52
Methodological note
Standard of direct investment statistics
The world standard of direct investment statistics is the document of the Organisation for Economic Cooperation and Development (OECD), The Benchmark Definition of Foreign Direct Investment (Benchmark Definition), developed for the first time in 1983. In 2008 its fourth, current issue was elaborated.14 The current version of the standard of direct investment statistics is implemented by an increasing number of countries.
The OECD Benchmark Definition of Foreign Direct Investment – Fourth Edition is fully consistent with the concept and definitions of direct investment contained in the sixth issue of the International Monetary Fund standard, on the balance of payments and the international investment position.15 It is also compliant with the concept of the system of national accounts – SNA 2008 and its European counterpart – ESA 2010.16 Narodowy Bank Polski has published data on foreign direct investment since 1996, in accordance with international standards, implementing their subsequent versions.
The OECD publication, concentrating on foreign direct investment, defines the methods of presentation of positions for assets and liabilities as well as transactions related to such investment, including related income in the aggregate form and with a breakdown by partner country and by industrial activity.
In addition, the latest issue of Benchmark Definition recommends new presentations of direct investment, among others the following:
– presentation according to the revised directional principle (a new treatment of entities with the status of “fellow enterprises”),
– distinguishing direct investment according to ultimate investing country,
– presentation on an assets/liabilities basis.
Based on the presented standard, Narodowy Bank Polski publishes data in accordance with users’ needs and, fulfilling international obligations, submits data on direct investment to international organisations, in accordance with those institutions’ demand.
14 “OECD Benchmark Definition of Foreign Direct Investment – Fourth Edition”, 2008, OECD.15 “Balance of Payments and International Investment Position Manual − Sixth Edition”, 2007, IMF.16 European System of Accounts introduced under Regulation of the European Parliament and of the Council
No. 549/2013.
Methodological note
53Foreign direct investment in Poland and Polish direct investment abroad in 2015
Data sources for direct investment
Reports of reporting entities submitted to Narodowy Bank Polski represent the basic source of data on direct investment.
Such data are submitted to the NBP for the purposes of the balance of payments and the international investment position by banks and by other residents17. The information provided refers to own transactions of individual entities. Only in the case of investment firms and banks maintaining securities accounts, aggregated data related to those institutions’ clients are also submitted.
Information is collected on a monthly, quarterly and annual basis.
The sources of data on direct investment based on securities include reports sent by Polish investors (related to assets) and issuers or financial intermediaries (related to liabilities). They contain data broken down into individual securities. Such data are collected using the “paper by paper” method.18
Data on foreign direct investment in companies holding dematerialised shares are collected at the level of individual series of shares ISIN numbers19), based on available financial statements of issuers and monthly reports of custodian banks and brokerage houses.
Direct investment does not include assets and liabilities of investment funds.
Press information, financial statements of entities and direct contacts with entities provide an additional data source for the direct investment statistics.
Information acquired in this way serves mainly for the verification and updating of the register of reporting entities.
Method of compilation and presentation of data on direct investment
Data for direct investment statistics are submitted by reporting entities in electronic form, through the reporting portal and subsequently verified and processed by the dedicated internal electronic system of Narodowy Bank Polski.
17 The legal basis for the collection of data on direct investment in Poland consists of the following: Regulation of the Minister of Finance of 23 October 2009 concerning the provision of data required for the preparation of the balance of payments and the international investment position to Narodowy Bank Polski (Journal of Laws of 3 November 2009, No. 184, item 1437) and Resolution No. 78/2009 of the Management Board of Narodowy Bank Polski of 29 October 2009 concerning the procedure and detailed rules of submission of the data required for the preparation of the balance of payments and the international investment position by banks to Narodowy Bank Polski, as amended (Official Gazette of NBP of 19 November 2009, No. 18, item 20).
18 The reporting entity provides the value of the transaction/ position of assets or liabilities and the identification number of each security, based on which other information is identified.
19 The International Securities Identification Number is an international identification code assigned to securities issued in financial markets. It is an alphanumerical code consisting of 12 characters with a structure defined in accordance with the ISO 6166 standard.

Narodowy Bank Polski54
In the process of verification and compilation of data on securities with the ISIN code, data contained in the CSDB database of the European Central Bank, information from the Central Securities Depository of Poland (KDPW) and information acquired from issuers themselves are additionally used.20
In this report, in accordance with the rules applicable in direct investment statistics, data are presented in compliance with the directional principle,21 excluding domestic special purpose entities. For the purposes of the balance of payments and the international investment position, information on direct investment is presented according to the asset/liability principle taking into account domestic special purpose entities. The result of this discrepancy in the presentation method is the lack of possibility of simple comparison of data on direct investment derived from those two sources.
In accordance with the OECD definition, an outward direct investment is an investment by a resident of one economy (direct investor) in an entity – resident of another economy (direct investment entity) in order to achieve a long-term return on the invested capital. The direct investment enterprise is an entity in which the direct investor holds the rights to at least 10% of shareholders’ votes in the governing body of the entity.
Direct investment income consists of income on equity as well as income on debt instruments. Equity income includes declared in a given reporting year, attributable to a direct investor: dividends (in capital-based companies), shares in profits (in partnerships), distributed branch profits and reinvested earnings (earnings on equity accruing to direct investors less declared dividend). The balance of income due and accrued, respectively, on received or granted credits, loans or other debt instruments, constitutes income on debt instruments.
In accordance with the rules defined by the OECD, profits are calculated according to the Current Operating Performance Concept (COPC) standard, adjusted to the accounting standards applicable in Poland.
Information on interest is presented on an accrual basis. Data on dividends are presented according to the date of dividend declaration. Reinvested earnings are calculated as earnings on equity accruing to direct investors during the period, less the dividends.
The relation of direct investment is defined pursuant to the methodology compliant with the Framework for Direct Investment Relationship (FDIR), constituting a part of the OECD definition of direct investment.
Foreign direct investment glossary
Control shall be understood as holding directly and/or indirectly more than 50% of voices in the governing body of another entity.
20 Central Securities Database – the database of securities issued within the European Union existing since 2010; see: https://www.ecb.europa.eu/pub/pdf/other/centralisedsecuritiesdatabase201002en.pdf.
21 The presentation of data on direct investment in accordance with the directional principle, introduces the classification into outward direct investment and inward direct investment.

Methodological note
55Foreign direct investment in Poland and Polish direct investment abroad in 2015
The Current Operating Performance Concept (COPC) is the concept recommended by the Benchmark Definition to measure direct investment earnings. The concept is explained in the International Accounting Standard, “Unusual and Prior Period Items and Changes in Accounting Policy”. When earnings are measured on the basis of this concept, such earnings consist of income from normal enterprise operations before non-recurring items (such as write-offs) and capital gains and losses are accounted for (see also entry on all-inclusive concept not recommended by the Benchmark Definition).
Debt instruments mean all forms of investing other than the acquisition of shares or equity, or reinvestment of earnings associated with such shares or equities. Debt instruments include, among others, credits and loans, debt securities and other unsettled payments between entities in direct investment relationship.
Direct investment flows mean financial flows between entities from the enterprise group in a given period.
Direct investment income is part of the return on the direct investment position; that is, the return on equity and debt investment. Direct investment income consists of earnings on equity investment (for example, a resident direct investor ’s share in the net income or earnings of its direct investment enterprises) plus income on debt between direct investors and direct investment enterprises and between fellow enterprises. Direct investment income payables are calculated in a similar way. Direct investment income is recorded as it accrues. However, as debt instruments involving FDI-related financial intermediaries are excluded from direct investment, so is the debt income between them.
Direct investment / foreign direct investment (FDI). Foreign direct investment (FDI) is a category of investment that reflects the objective of establishing a lasting interest by a resident enterprise in one economy (direct investor) in an enterprise (direct investment enterprise) that is resident in an economy other than that of the direct investor. The lasting interest implies the existence of a long-term relationship between the direct investor and the direct investment enterprise and a significant degree of influence on the management of the enterprise. The direct or indirect ownership of 10% or more of the voting power of an enterprise resident in one economy by an investor resident in another economy is evidence of such a relationship. Some compilers may argue that in some cases an ownership of as little as 10% of the voting power may not lead to the exercise of any significant influence while on the other hand, an investor may own less than 10% but have an effective voice in the management. Nevertheless, the recommended methodology does not allow any qualification of the 10% threshold and recommends its strict application to ensure statistical consistency across countries.
Enterprise group consists of all the enterprises under the control of the same owner. When a group of owners has control of more than one enterprise, the enterprises may act in a concerted way and the transactions between them may not be driven by the same concerns as “arm’s length” transactions. The Framework for Direct Investment Relationships can be used to determine which enterprises are under control or influence of the same owner. A multinational enterprise group consists of all the enterprises located in different economies and under the control or influence of the same owner wherever located. An economy-specific enterprise group consists of all the enterprises located in the same economy and under the control or the influence of the same owner also located
Narodowy Bank Polski56
in the same economy. Ownership links that are external to the economy are not recognised in the formation of local enterprise groups.
Equity capital comprises: i) equity in branches; ii) all shares in subsidiaries and associates (except non-participating, preferred shares that are treated as debt securities and included under direct investment, debt instruments); and iii) other contributions of an equity nature. Ownership of equity is usually evidenced by shares, stocks, participations, depositary receipts or similar documents. Shares and stocks have the same meaning while depositary receipts are securities that represent ownership of securities by a depositary. This category includes proprietors’ net equity in quasi-corporations, as well as shares and equity in corporations. It also includes preferred stocks or shares that provide for participation in the residual value on dissolution of an incorporated enterprise. Reinvestment of earnings comprises the claim of direct investors (in proportion to equity held) on the retained earnings of direct investment enterprises. Reinvestment of earnings represents financial account transactions that contribute to the equity position of a direct investor in a direct investment enterprise.
Fellow enterprises. An enterprise in one economy may be related through the Framework of Direct Investment Relationships – FDIR to another enterprise in the same economy, or in a different economy, without either being a direct investor in the other, but through both being directly or indirectly influenced by the same enterprise in the ownership hierarchy. This “common parent” must be a direct investor in at least one of enterprises in question. Such enterprises can be considered to be related through a “horizontal” linkage within the FDIR – not involving FDI voting power of 10% or more – and are called fellow enterprises. It should be noted, however, that for FDI statistics, only cross-border transactions and positions between FDI-related enterprises should be recorded.
A foreign direct investment enterprise is an enterprise resident in one economy and in which an investor resident in another economy owns, either directly or indirectly, 10% or more of its voting power if it is incorporated or the equivalent for an unincorporated enterprise. The numerical threshold of ownership of 10% of the voting power determines the existence of a direct investment relationship between the direct investor and the direct investment enterprise. An ownership of at least 10% of the voting power of the enterprise is regarded as the necessary evidence that the investor has sufficient influence to have an effective voice in its management.
Foreign direct investment positions data indicate the levels of investment at a given point in time. Also referred to as “foreign direct investment stocks”.
Foreign direct investor is an entity (an institutional unit) resident in one economy that has acquired, either directly or indirectly, at least 10% of the voting power of a corporation (enterprise), or equivalent for an unincorporated enterprise, resident in another economy. A direct investor could be classified to any sector of the economy and could be any of the following: i) an individual; ii) a group of related individuals; iii) an incorporated or unincorporated enterprise; iv) a public or private enterprise; v) a group of related enterprises; vi) a government body; vii) an estate, trust or other societal organisation; or viii) any combination of the above. In the case where two enterprises each own 10% or more of each other’s voting power, each is a direct investor in the other. A direct investor has a direct investment enterprise operating in a country other than the economy of residence of the foreign direct investor.

Methodological note
57Foreign direct investment in Poland and Polish direct investment abroad in 2015
Influence is understood as holding directly and/or indirectly at least 10% of votes in the governing body of another entity.
Inward direct investment is investment by a non-resident direct investor in a direct investment enterprise resident in the host economy; the direction of the influence by the direct investor is “inward” for the reporting economy. Also referred to as direct investment in the reporting economy.
A merger occurs when two (or more) companies agree to merge into a new single company rather than remain separated for creating business synergies.
Outward direct investment is investment by a resident direct investor in a non-resident direct investment enterprise; the direction of the influence by the direct investor is “outward” for the reporting economy. Also referred to as direct investment abroad.
Reinvestment of earnings/reinvested earnings refer to earnings on equity accruing to direct investors less distributed earnings, proportionate to the percentage ownership of the equity owned by the direct investor(s). Reinvested earnings are included in direct investment income because the earnings of the direct investment enterprise are deemed to be the income of the direct investor (proportionate to the direct investor’s holding of equity in the direct investment enterprise), whether they are reinvested in the enterprise or remitted to the direct investor. Because reinvested earnings are not actually distributed to the direct investor but rather increase the direct investor’s investment in its affiliate, an entry that is equal to that made in the direct investment income account but of opposite sign is entered in the direct investment transactions account. In the direct investment income account, this transaction is referred to as “reinvested earnings”, while in the direct investment transactions account, this transaction is referred to as “reinvestment of earnings”.
Special purpose entities (SPE). Multinational enterprises (MNEs) often diversify their investments geographically through various organisational structures. These may include certain types of special purpose entities. Examples are financing subsidiaries, conduits, holding companies, shell companies, shelf companies and brass-plate companies. Although there is no universal definition of SPEs, they do share a number of features. They are all legal entities that have little or no employment, or operations, or physical presence in the jurisdiction in which they are created by their parent enterprises which are typically located in other jurisdictions (economies). They are often used as devices to raise capital or to hold assets and liabilities and usually do not undertake significant production.
An enterprise is usually considered as an SPE if it meets the following criteria:
– the enterprise is a legal entity, formally registered with a national authority; and subject to fiscal and other legal obligations of the economy in which it is resident;
– the enterprise is ultimately controlled by a non-resident parent, directly or indirectly;
– the enterprise has no or few employees, little or no production in the host economy and little or no physical presence;

Narodowy Bank Polski58
– almost all the assets and liabilities of the enterprise represent investments in or from other countries;
– the core business of the enterprise consists of group financing or holding activities, that is – viewed from the perspective of the compiler in a given country – the channelling of funds from non-residents to other non-residents. However, in its daily activities, managing and directing plays only a minor role.
Super dividends / liquidating dividends mean dividends arising as a result of redistribution of profit from previous years. They are usually higher than dividends paid regularly. In accordance with the current standards, they are classified as withdrawal of equity, rather than income.
Transactions (direct investment) are financial flows and income flows between direct investors, direct investment enterprises, and/or other fellow enterprises. Transactions (flows) provide information for FDI activity within a given period of time.
Transactions of special purpose entities mean the phenomenon where in a given reporting period an inflow of foreign funds is recorded, increasing the share capital of special purpose entities; subsequently such funds are transferred by such entities to foreign branches or subsidiaries outside the boundaries of the given country. The occurrence of transactions of special purpose entities results in recording symmetrical entries, both in inward direct investment in the country and in outward direct investment. Inflow of capital from transactions of special purpose entities does not have a significant impact on domestic production and employment.
Ultimate controlling partner is an entity influencing other entities, in particular an entity controlling them.

Statistical annex

Narodowy Bank Polski60
Statistical annex
This annex presents selected data from the tables related to direct investment. Detailed tables (also in EUR and USD) are available on the NBP website.
Inward direct investment in Poland:
http://nbp.pl/home.aspx?f=/publikacje/zib/zib.html
Polish outward direct investment:
http://nbp.pl/home.aspx?f=/publikacje/pib/pib.html
Table 1 Foreign direct investment transactions to Poland in 2000–2015 (in PLN million)
Year Equity Reinvestment of earnings Debt instruments Total
2000 38,771.0 -1,739.0 4,018.0 41,050.0
2001 21,672.0 -4,259.0 5,427.9 22,840.9
2002 17,432.0 -4,991.0 4,002.0 16,443.0
2003 17,733.0 -328.0 -1,917.5 15,487.5
2004 25,978.5 22,620.0 -4,193.9 44,404.7
2005 9,569.8 10,937.0 6,034.6 26,541.3
2006 10,558.1 17,646.0 17,032.2 45,236.3
2007 16,154.1 25,610.0 13,141.5 54,905.7
2008 19,796.9 -2,301.0 12,096.9 29,592.8
2009 10,692.3 15,497.0 5,134.8 31,324.1
2010 1,612.8 22,448.0 14,523.8 38,584.6
2011 -804.9 21,572.0 26,416.7 47,183.8
2012 12,447.0 18,254.1 9,756.6 40,457.7
2013 -5,674.7 14,732.2 2,401.2 11,458.7
2014 13,297.0 25,939.5 5,774.8 45,011.3
2015 15,513.3 30,379.1 4,891.8 50,784.2

Statistical annex
61Foreign direct investment in Poland and Polish direct investment abroad in 2015
Table 2 Foreign direct investment positions in Poland at the end of years 2000−2015 (in PLN million)
Year Equity Debt instruments Total
2000 105,043.0 33,657.6 138,700.6
2001 123,619.0 37,405.6 161,024.6
2002 138,155.0 43,402.6 181,557.6
2003 156,789.0 53,106.4 209,895.4
2004 206,089.5 45,409.4 251,499.0
2005 232,454.3 49,144.2 281,598.5
2006 269,723.2 67,288.9 337,012.1
2007 323,225.0 77,016.1 400,241.1
2008 340,238.2 99,344.2 439,582.4
2009 373,166.4 103,971.0 477,137.5
2010 441,739.2 114,332.4 556,071.7
2011 424,678.7 137,225.3 561,904.0
2012 472,597.9 144,077.8 616,675.7
2013 540,261.4 149,989.1 690,250.5
2014 569,116.5 172,600.0 741,716.5
2015 534,171.8 177,886.4 712,058.3
Table 3 Income on foreign direct investment in Poland in 2000–2015 (in PLN million)
Year Dividends Reinvested earnings Interest Total
2000 2,447.0 -1,738.0 2,128.1 2,837.1
2001 4,003.0 -4,258.0 2,906.7 2,651.7
2002 5,571.0 -4,992.0 2,364.8 2,943.8
2003 6,309.0 -328.0 1,953.3 7,934.3
2004 9,837.0 22,619.0 2,140.5 34,596.5
2005 16,790.0 10,937.0 2,107.3 29,834.3
2006 20,078.0 17,645.0 2,772.5 40,495.5
2007 22,432.0 25,609.0 3,481.3 51,522.3
2008 28,095.0 -2,302.0 4,267.2 30,060.2
2009 23,356.0 15,499.0 4,425.2 43,280.2
2010 23,829.0 22,448.0 4,687.8 50,964.8
2011 24,945.0 21,572.0 5,256.2 51,773.2
2012 27,518.2 18,254.1 6,258.3 52,030.6
2013 36,267.7 14,732.2 7,234.8 58,234.7
2014 29,592.4 25,939.5 8,595.7 64,127.6
2015 28,986.8 30,379.1 8,087.2 67,453.1

Narodowy Bank Polski62
Table 4 Foreign direct investment transactions to Poland in 2015 broken down by countries and economic zones (in PLN million)
DSD code Description Equity Reinvestment
of earningsDebt
instruments Total
W0 World total 15,513.3 30,379.1 4,891.8 50,784.2
of which:
NL Netherlands 5,282.8 6,405.1 324.5 12,012.4
GB United Kingdom 7,319.5 1,602.3 1,673.3 10,595.1
DE Germany 3,396.9 7,495.1 -1,059.2 9,832.8
ES Spain 557.8 1,446.0 2,078.2 4,082.0
AT Austria 1,900.0 1,284.9 -21.1 3,163.8
LU Luxembourg -3,133.4 3,870.0 2,106.3 2,842.9
SE Sweden -26.6 2,356.6 387.2 2,717.1
CY Cyprus 2,704.8 -797.6 756.6 2,663.9
BE Belgium 173.2 854.0 1,041.5 2,068.8
CH Switzerland 329.1 882.6 500.6 1,712.2
TW Taiwan 0.0 3.0 46.9 50.0
HR Croatia 0.0 10.5 33.8 44.3
AU Australia 0.0 3.6 39.9 43.5
RU Russian Federation -99.7 -83.8 225.0 41.4
BM Bermuda 0.0 -5.7 -130.9 -136.6
IE Ireland -46.2 -683.2 501.8 -227.6
UA Ukraine -194.7 -176.9 134.6 -237.0
JP Japan -45.2 -20.4 -337.6 -403.2
FR France -575.0 2,233.6 -2,341.9 -683.3
PT Portugal -1,182.9 442.4 -79.2 -819.7
MT Malta -462.5 -31.5 -387.4 -881.4
SK Slovakia -385.4 43.3 -591.3 -933.4
US United States 151.2 109.2 -1,540.3 -1,280.0
of which economic zones:
B5 European Union (28 countries) 15,115.1 29,018.7 5,357.8 49,491.6
I8 Euro area (19 countries) 6,797.8 24,281.1 2,546.0 33,624.9
P0 Organisation for Economic Co-operation and Development (OECD) 13,532.2 31,384.5 3,646.3 48,563.0
R3 North American Free Trade Agreement (NAFTA) 382.7 210.8 -1,735.5 -1,141.9
R14 CIS -294.6 -254.0 293.3 -255.3
R4 ASEAN -48.7 13.9 -65.9 -100.8
R5 OPEC 4.0 74.9 -37.2 41.7
A8 Latin America 2.7 -9.4 26.8 20.1
R6 African, Caribbean and Pacific States (ACP) 61.4 -158.1 12.4 -84.3
9A International organisations, excluding the European Union institutions -90.8 0.0 0.0 -90.8

Statistical annex
63Foreign direct investment in Poland and Polish direct investment abroad in 2015
Table 5 Foreign direct investment transactions to Poland in 2015 broken down by economic activity (in PLN million)
DSD code Description Equity Reinvestment
of earningsDebt
instruments Total
FDI_T Total 15,513.3 30,379.1 4,891.8 5,0784.2
of which:
A Agriculture, forestry and fishing -55.6 22.7 134.0 101.1
B Mining and quarrying 478.4 -628.2 -152.9 -302.7
C Industrial processing -1,894.0 15,139.0 -1,451.0 11,793.9
D35 Electricity, gas, steam and air conditioning supply -624.6 -613.0 996.7 -240.8
E Water supply; sewerage, waste management and remediation activities 37.2 45.6 -9.5 73.4
F Construction 439.7 -129.5 1,067.7 1,377.9
GTU Total services 17,132.2 16,542.5 3,355.1 37,029.8
of which:
G Wholesale and retail trade; repair of motor vehicles and motorcycles 4,956.5 4,394.1 626.2 9,976.7
H Transportation and storage 1,568.2 538.2 -1,096.6 1,009.7
I Accommodation and food service activities 150.6 107.0 -100.8 156.9
J Information and communication 1,881.9 5,135.5 -510.4 6,507.0
K Financial and insurance activities -1,355.9 3,611.0 38.1 2,293.2
L Real estate activities 1,232.6 -40.0 3,728.5 4,921.1
M Professional, scientific and technical activities 8,648.0 2,162.3 -475.8 10,334.5
N Administrative and support service activities -250.3 700.5 1,045.6 1,495.8
Q Human health and social work activities 278.9 0.2 2.2 281.3

Narodowy Bank Polski64
Table 6 Foreign direct investment positions in Poland at the end of 2015 broken down by countries and economic zones (in PLN million)
DSD code Description Equity Debt instruments Total
W0 All countries 534,171.8 177,886.4 712,058.3
of which:
NL Netherlands 107,546.0 21,712.8 129,258.8
DE Germany 99,117.3 17,460.4 116,577.6
LU Luxembourg 57,687.9 24,476.5 82,164.4
FR France 41,619.6 34,720.9 76,340.5
ES Spain 28,739.7 14,633.7 43,373.4
GB United Kingdom 30,391.3 8,614.5 39,005.8
IT Italy 36,362.3 -128.4 36,233.9
AT Austria 20,206.2 6,842.2 27,048.4
CY Cyprus 19,598.4 5,025.2 24,623.6
BE Belgium 7,816.1 13,798.7 21,614.8
US United States 15,931.3 4,966.2 20,897.5
CH Switzerland 13,854.5 4,028.9 17,883.4
SE Sweden 13,956.9 2,336.1 16,293.0
DK Denmark 11,605.0 2,048.2 13,653.1
IE Ireland 898.8 6,619.2 7,518.0
FI Finland 3,413.4 2,823.0 6,236.4
EG Egypt 0.0 -85.7 -85.7
BM Bermuda 1.4 -135.9 -134.5
RO Romania -19.0 -160.8 -179.8
BY Belarus 16.8 -252.6 -235.8
UA Ukraine -1,195.1 578.7 -616.5
of which economic areas:
B5 European Union (28 countries) 490,654.3 163,401.3 654,055.6
I8 Euro area (19 countries) 429,939.7 149,214.1 579,153.8
P0 Organisation for Economic Co-operation and Development (OECD) 508,425.8 170,336.6 678,762.3
R3 North American Free Trade Agreement (NAFTA) 17,087.8 5,060.7 22,148.5
R14 CIS 547.5 -0.4 547.1
R4 ASEAN 197.6 -49.5 148.0
R5 OPEC 37.4 277.9 315.3
R12 Offshore financial centres 935.0 2,062.6 2,997.5
R6 African, Caribbean and Pacific States (ACP) 609.4 170.2 779.6
9A International organisations, excluding the European Union institutions 0.0 0.0 0.0

Statistical annex
65Foreign direct investment in Poland and Polish direct investment abroad in 2015
Table 7 Foreign direct investment positions in Poland at the end of 2015 broken down by economic activity (in PLN million)
DSD code Description Equity Debt instruments Total
FDI_T Total 534,171.8 177,886.4 712,058.3
of which:
A Agriculture, forestry and fishing 2,454.0 1,188.4 3,642.4
B Mining and quarrying 392.9 1,786.2 2,179.1
C Industrial processing 210,797.3 18,778.5 229,575.8
D35 Electricity, gas, steam and air conditioning supply 11,212.4 11,801.0 23,013.4
E Water supply; sewerage, waste management and remediation activities 1,001.6 675.2 1,676.9
F Construction 11,416.2 22,619.2 34,035.4
GTU Total services 296,897.4 121,037.8 417,935.2
of which:
G Wholesale and retail trade; repair of motor vehicles and motorcycles 80,130.3 28,470.0 108,600.3
H Transportation and storage 9,620.0 2,263.9 11,883.9
I Accommodation and food service activities 3,366.5 753.4 4,119.9
J Information and communication 25,615.7 13,790.4 39,406.1
K Financial and insurance activities 124,137.7 9,808.2 133,945.9
L Real estate activities 16,655.5 39,350.2 56,005.7
M Professional, scientific and technical activities 27,120.6 21,661.2 48,781.7
N Administrative and support service activities 8,311.6 2,282.7 10,594.4
Q Human health and social work activities 1,158.2 1,814.8 2,973.0

Narodowy Bank Polski66
Table 8 Income on foreign direct investment in Poland in 2015 broken down by countries and economic zones (in PLN million)
DSD code Description Dividends Reinvested
earnings Interest Total
W0 All countries 28,986.8 30,379.1 8,087.2 67,453.1
of which:
NL Netherlands 6,866.2 6,405.1 1,197.6 14,468.8
DE Germany 5,716.3 7,495.1 457.6 13,669.0
LU Luxembourg 1,709.7 3,870.0 1,307.1 6,886.8
FR France 2,676.3 2,233.6 1,572.5 6,482.4
GB United Kingdom 1,613.0 1,602.3 332.5 3,547.8
SE Sweden 903.5 2,356.6 280.7 3,540.8
IT Italy 1,989.7 1,385.0 22.3 3,397.1
AT Austria 1,171.7 1,284.9 260.9 2,717.4
ES Spain 274.3 1,446.0 774.6 2,494.9
CH Switzerland 870.0 882.6 140.8 1,893.5
US United States 909.3 109.2 481.1 1,499.5
BE Belgium 180.1 854.0 401.8 1,435.9
DK Denmark 863.0 400.8 39.1 1,302.9
BM Finland 371.9 255.1 139.7 766.6
GG Guernsey 0.0 -33.4 2.3 -31.1
SZ Swaziland 0.0 -47.5 0.0 -47.5
MT Malta 11.8 -31.5 -41.4 -61.1
UA Ukraine 0.0 -176.9 41.2 -135.6
of which economic areas:
B5 European Union (28 countries) 26,055.3 29,018.7 7,287.8 62,361.8
I8 Euro area (19 countries) 22,573.9 24,281.1 6,562.5 53,417.5
P0 Organisation for Economic Co-operation and Development (OECD) 27,315.9 31,384.5 7,795.8 66,496.2
R3 North American Free Trade Agreement (NAFTA) 919.6 210.8 491.0 1,621.4
R14 CIS 91.5 -254.0 48.8 -113.7
R4 ASEAN 3.0 13.9 -4.4 12.5
R5 OPEC 0.0 74.9 5.2 80.1
R12 Offshore financial centres 6.3 20.4 26.1 52.8
R6 African, Caribbean and Pacific States (ACP) 743.3 -158.1 0.7 586.0
9A International organisations, excluding the European Union institutions 0.0 0.0 -0.1 -0.1

Statistical annex
67Foreign direct investment in Poland and Polish direct investment abroad in 2015
Table 9 Income on foreign direct investment in Poland in 2015 broken down by economic activity (in PLN million)
DSD code Description Dividends Reinvested
earnings Interest Total
FDI_T Total 28,986.8 30,379.1 8,087.2 67,453.1
of which:
A Agriculture, forestry and fishing 239.2 22.7 38.0 299.9
B Mining and quarrying 22.4 -628.2 141.6 -464.2
C Industrial processing 11,229.4 15,139.0 1,463.5 27,831.9
D35 Electricity, gas, steam and air conditioning supply 995.0 -613.0 525.0 907.0
E Water supply; sewerage, waste management and remediation activities 52.0 45.6 32.7 130.3
F Construction 692.5 -129.5 1,286.1 1,849.1
GTU Total services 15,756.3 16,542.5 4,608.5 36,907.3
of which:
G Wholesale and retail trade; repair of motor vehicles and motorcycles 5,401.1 4,394.1 723.0 10,518.2
H Transportation and storage 1,301.7 538.2 73.3 1,913.2
I Accommodation and food service activities 52.5 107.0 23.9 183.4
J Information and communication 989.3 5,135.5 417.7 6,542.5
K Financial and insurance activities 5,801.4 3,611.0 258.8 9,671.2
L Real estate activities 1,026.3 -40.0 1,797.5 2,783.7
M Professional, scientific and technical activities 904.3 2,162.3 1,054.0 4,120.6
N Administrative and support service activities 180.6 700.5 119.9 1,001.0
Q Human health and social work activities 12.9 0.2 89.7 102.8
Table 10 Polish direct investment transactions abroad in 2000–2015 (in PLN million)
Year Equity Reinvestment of earnings Debt instruments Total
2000 488.0 -52.0 -362.0 74.0
2001 -196.0 37.0 -704.1 -863.1
2002 1,115.0 -297.0 -263.0 555.0
2003 404.0 -44.0 -1,528.5 -1,168.5
2004 822.5 83.0 -298.9 606.7
2005 4,069.8 182.0 105.6 4,357.3
2006 11,702.1 1,806.0 -1,537.8 11,970.3
2007 5,995.1 -229.0 -1,115.5 4,650.7
2008 2,858.9 576.0 1,042.9 4,477.8
2009 10,046.3 -4,304.0 -106.2 5,636.1
2010 2,504.8 921.0 15,109.8 18,535.6
2011 1,940.2 636.2 464.8 3,041.2
2012 5,573.8 4,215.0 -341.6 9,447.2
2013 4,029.9 -671.8 -4,784.2 -1,426.1
2014 17,480.8 1,609.6 -9,948.2 9,142.2
2015 10,843.8 -566.7 1,846.4 12,123.5

Narodowy Bank Polski68
Table 11 Polish direct investment positions abroad at the end of years 2000−2015 (in PLN million)Year Equity Debt instruments Total
2000 3,605.0 -2,495.4 1,109.6
2001 3,982.0 -2,768.4 1,213.6
2002 4,852.0 -3,195.4 1,656.6
2003 6,060.0 -4,629.6 1,430.4
2004 5,905.5 -3,817.6 2,088.0
2005 9,324.3 -3,530.8 5,793.5
2006 17,269.2 -4,457.1 12,812.1
2007 21,925.0 -4,199.9 17,725.1
2008 28,387.2 -4,085.8 24,301.4
2009 36,753.4 -3,964.0 32,789.5
2010 43,566.2 5,064.4 48,630.7
2011 56,053.9 8,629.3 64,683.2
2012 72,050.8 8,855.3 80,906.1
2013 84,492.1 -984.4 83,507.7
2014 101,476.9 -4,128.5 97,348.4
2015 97,651.3 -4,070.3 93,581.0
Table 12 Income on Polish direct investment abroad in 2000–2015 (in PLN million)
Year Dividends Reinvested earnings Interest Total
2000 76.0 -52.0 -157.9 -133.9
2001 74.0 37.0 -228.3 -117.3
2002 70.0 -297.0 -187.2 -414.2
2003 57.0 -44.0 -165.7 -152.7
2004 131.0 83.0 -183.5 30.5
2005 139.0 180.0 -182.7 136.3
2006 188.0 1,804.0 -233.5 1,758.5
2007 404.0 -228.0 -290.7 -114.7
2008 1,426.0 576.0 -339.8 1,662.2
2009 1,056.0 -4,305.0 -313.8 -3,562.8
2010 1,074.0 921.0 -402.2 1,592.8
2011 -1,218.8 636.2 -191.2 -773.8
2012 474.3 4,215.0 -359.2 4,330.1
2013 1,912.9 -671.8 43.3 1,284.4
2014 3,329.5 1,609.6 97.5 5,036.6
2015 2,564.4 -566.7 290.1 2,287.8
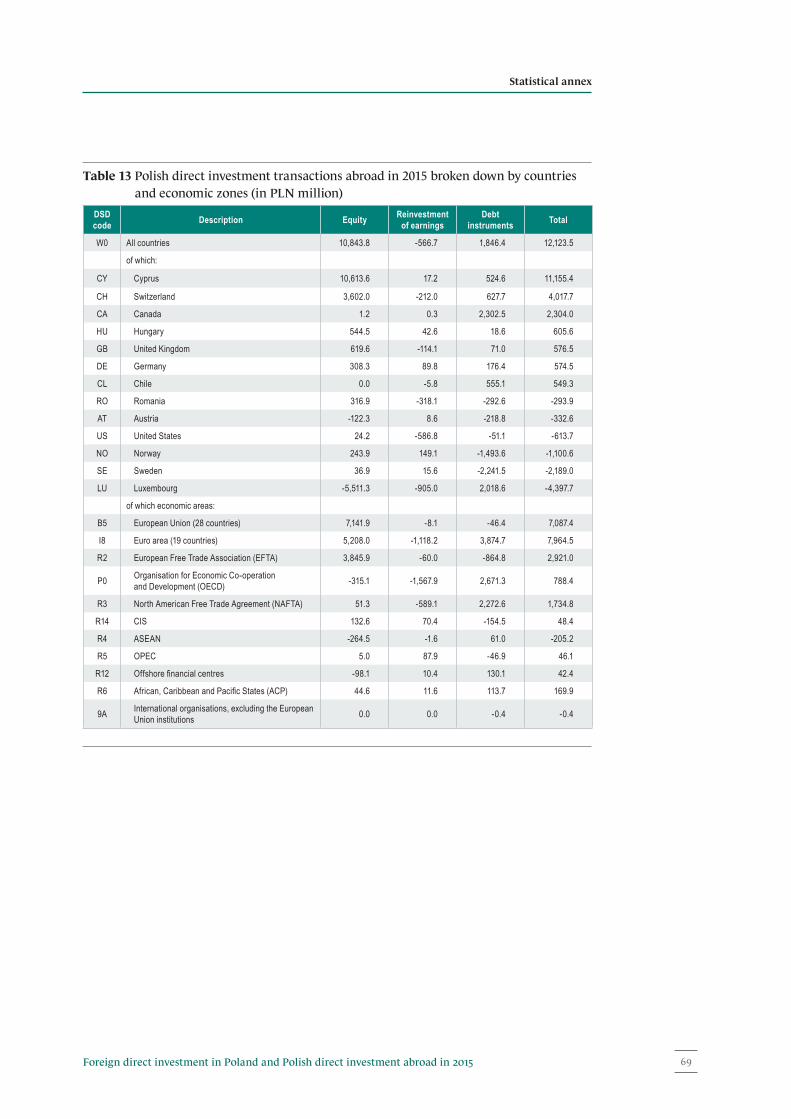
Statistical annex
69Foreign direct investment in Poland and Polish direct investment abroad in 2015
Table 13 Polish direct investment transactions abroad in 2015 broken down by countries and economic zones (in PLN million)
DSD code Description Equity Reinvestment
of earningsDebt
instruments Total
W0 All countries 10,843.8 -566.7 1,846.4 12,123.5
of which:
CY Cyprus 10,613.6 17.2 524.6 11,155.4
CH Switzerland 3,602.0 -212.0 627.7 4,017.7
CA Canada 1.2 0.3 2,302.5 2,304.0
HU Hungary 544.5 42.6 18.6 605.6
GB United Kingdom 619.6 -114.1 71.0 576.5
DE Germany 308.3 89.8 176.4 574.5
CL Chile 0.0 -5.8 555.1 549.3
RO Romania 316.9 -318.1 -292.6 -293.9
AT Austria -122.3 8.6 -218.8 -332.6
US United States 24.2 -586.8 -51.1 -613.7
NO Norway 243.9 149.1 -1,493.6 -1,100.6
SE Sweden 36.9 15.6 -2,241.5 -2,189.0
LU Luxembourg -5,511.3 -905.0 2,018.6 -4,397.7
of which economic areas:
B5 European Union (28 countries) 7,141.9 -8.1 -46.4 7,087.4
I8 Euro area (19 countries) 5,208.0 -1,118.2 3,874.7 7,964.5
R2 European Free Trade Association (EFTA) 3,845.9 -60.0 -864.8 2,921.0
P0 Organisation for Economic Co-operation and Development (OECD) -315.1 -1,567.9 2,671.3 788.4
R3 North American Free Trade Agreement (NAFTA) 51.3 -589.1 2,272.6 1,734.8
R14 CIS 132.6 70.4 -154.5 48.4
R4 ASEAN -264.5 -1.6 61.0 -205.2
R5 OPEC 5.0 87.9 -46.9 46.1
R12 Offshore financial centres -98.1 10.4 130.1 42.4
R6 African, Caribbean and Pacific States (ACP) 44.6 11.6 113.7 169.9
9A International organisations, excluding the European Union institutions 0.0 0.0 -0.4 -0.4

Narodowy Bank Polski70
Table 14 Polish direct investment transactions abroad in 2015 broken down by economic activity (in PLN million)
DSD code Description Equity Reinvestment
of earningsDebt
instruments Total
FDI_T Total 10,843.8 -566.7 1,846.4 12,123.5
of which:
A Agriculture, forestry and fishing -3.1 -0.2 2.0 -1.3
B Mining and quarrying 257.6 24.8 4,061.0 4,343.3
C Industrial processing 352.7 742.9 -1,975.1 -879.5
D35 Electricity, gas, steam and air conditioning supply -0.8 -10.2 -1,458.2 -1,469.2
E Water supply; sewerage, waste management and remediation activities 0.4 1.1 2.2 3.7
F Construction -36.5 85.8 406.5 455.8
GTU Total services 10,521.2 -1,430.1 -1,519.8 7,571.3
of which:
G Wholesale and retail trade; repair of motor vehicles and motorcycles -234.5 -73.9 730.0 421.6
H Transportation and storage 630.1 16.6 42.5 689.2
I Accommodation and food service activities 622.2 92.3 32.6 747.1
J Information and communication 66.6 58.5 -1,638.4 -1,513.3
K Financial and insurance activities 14,813.0 -286.6 -1,426.7 13,099.7
L Real estate activities 328.4 -253.3 786.7 861.8
M Professional, scientific and technical activities -5,858.1 -527.4 28.7 -6,356.8
N Administrative and support service activities 134.1 -282.2 -133.2 -281.4

Statistical annex
71Foreign direct investment in Poland and Polish direct investment abroad in 2015
Table 15 Polish direct investment positions abroad at the end of 2015 broken down by countries and economic zones (in PLN million)
DSD code Description Equity Debt instruments Total
W0 All countries 97,651.3 -4,070.3 93,581.0
of which:
CY Cyprus 35,392.1 -298.6 35,093.5
LU Luxembourg 17,615.6 1,686.2 19,301.8
CZ Czech Republic 5,285.3 2,011.9 7,297.2
NL Netherlands 4,320.9 2,736.4 7,057.3
CH Switzerland 5,771.3 905.3 6,676.7
DE Germany 3,354.3 1,730.1 5,084.4
GB United Kingdom 3,933.9 287.3 4,221.2
LT Lithuania 2,929.6 444.6 3,374.3
CA Canada 12.6 2,923.1 2,935.7
US United States 1,627.6 1,156.2 2,783.8
RU Russia 1,472.7 1,038.0 2,510.7
BE Belgium 2,626.0 -519.0 2,107.0
MT Malta 2,012.6 10.6 2,023.2
NO Norway 64.4 1,954.8 2,019.2
RO Romania 953.5 892.5 1,846.1
HU Hungary 1,621.4 218.6 1,840.1
SK Slovakia 949.0 356.9 1,305.9
TR Turkey -154.1 1,182.5 1,028.4
IN India 658.6 261.3 919.9
VG British Virgin Islands 0.0 -64.3 -64.3
EG Egypt -91.6 0.8 -90.9
FR France 162.9 -599.3 -436.4
ES Spain 615.3 -1,384.6 -769.2
SE Sweden 819.0 -23,571.6 -22,752.6
including economic areas:
B5 European Union (28 countries) 84,413.9 -15,287.6 69,126.3
I8 Euro area (19 countries) 68,636.3 4,148.6 72,784.9
P0 Organisation for Economic Co-operation and Development (OECD) 50,711.1 -8,087.5 42,623.6
R3 North American Free Trade Agreement (NAFTA) 1,661.3 4,104.3 5,765.5
R14 CIS 2,487.8 1,027.9 3,515.7
R4 ASEAN 286.7 395.8 682.5
R5 OPEC 572.1 -5.1 567.0
R12 Offshore financial centres 688.6 490.7 1,179.4
R6 African, Caribbean and Pacific States (ACP) 793.2 286.2 1,079.4
9A International organisations, excluding the European Union institutions 0.0 1.1 1.1

Narodowy Bank Polski72
Table 16 Polish direct investment positions abroad at the end of 2015 broken down by economic activity (in PLN million)
DSD code Description Equity Debt instruments Total
FDI_T Total 97,651.3 -4,070.3 93,581.0
of which:
A Agriculture, forestry and fishing 19.4 2.5 21.9
B Mining and quarrying 754.1 8,721.7 9,475.8
C Industrial processing 12,095.2 3,193.8 15,289.1
D35 Electricity, gas, steam and air conditioning supply 61.3 -6,726.8 -6,665.4
E Water supply; sewerage, waste management and remediation activities 7.1 -7.8 -0.6
F Construction 482.1 -675.7 -193.5
GTU Total services 83,904.9 -9,070.8 74,834.1
of which:
G Wholesale and retail trade; repair of motor vehicles and motorcycles 1,374.9 937.5 2,312.4
H Transportation and storage 2,057.5 -25.5 2,032.0
I Accommodation and food service activities 860.8 -474.0 386.9
J Information and communication 1,606.7 -9,250.7 -7,644.0
K Financial and insurance activities 52,928.6 -4,993.9 47,934.7
L Real estate activities -1,114.9 2,711.2 1,596.3
M Professional, scientific and technical activities 9,467.1 1,823.5 11,290.6
N Administrative and support service activities 14,874.4 -73.7 14,800.8

Statistical annex
73Foreign direct investment in Poland and Polish direct investment abroad in 2015
Table 17 Income on Polish direct investment abroad in 2015 broken down by countries and economic zones (in PLN million)
DSD code Description Dividends Reinvested
earnings Interest Total
W0 All countries 2,564.4 -566.7 290.1 2,287.8
of which:
LT Lithuania 67.2 1,185.0 2.3 1,254.5
CY Cyprus 725.1 17.2 203.8 946.1
CZ Czech Republic 66.0 276.0 72.4 414.5
DE Germany 241.7 89.8 40.3 371.8
NO Norway 0.0 149.1 119.1 268.2
HU Hungary 160.8 42.6 -13.5 189.9
SK Slovakia 125.5 48.9 2.3 176.7
RU Russia 14.4 128.4 21.6 164.5
CH Switzerland 335.6 -212.0 0.2 123.8
MT Malta 152.4 -55.9 1.4 97.9
AE United Arab Emirates 0.0 88.2 0.1 88.3
FR France 0.6 -24.3 -39.4 -63.1
ES Spain 58.0 -114.1 -74.3 -130.4
RO Romania 33.2 -318.1 71.3 -213.7
SE Sweden 23.8 15.6 -469.4 -430.0
US United States 0.0 -586.8 41.6 -545.2
LU Luxembourg 65.7 -905.0 82.1 -757.2
of which economic areas:
B5 European Union (28 countries) 2,146.8 -8.1 -69.0 2,069.7
I8 Euro area (19 countries) 1,599.7 -1,118.2 282.7 764.2
P0 Organisation for Economic Co-operation and Development (OECD) 1,508.0 -1,567.9 -112.7 -172.6
R3 North American Free Trade Agreement (NAFTA) 0.0 -589.1 86.8 -502.3
R14 CIS 18.9 70.4 56.8 146.0
R4 ASEAN 2.4 -1.6 38.2 39.0
R5 OPEC 0.0 87.9 1.0 88.9
R12 Offshore financial centres 0.9 10.4 32.5 43.8
R6 African, Caribbean and Pacific States (ACP) 0.0 11.6 1.1 12.6
R15 MERCOSUR 0.0 -2.7 3.4 0.8
9A International organisations, excluding the European Union institutions 0.0 0.0 0.0 0.0

Narodowy Bank Polski74
Table 18 Income on Polish direct investment abroad in 2015 broken down by economic activity (in PLN million)
DSD code Description Dividends Reinvested
earnings Interest Total
FDI_T Total 2,564.4 -566.7 290.1 2,287.8
of which:
A Agriculture, forestry and fishing 0.0 -0.2 0.0 -0.2
B Mining and quarrying 18.9 24.8 219.5 263.2
C Industrial processing 227.1 742.9 5.0 975.0
D35 Electricity, gas, steam and air conditioning supply 1.2 -10.2 -188.8 -197.8
E Water supply; sewerage, waste management and remediation activities 0.0 1.1 -1.2 -0.1
F Construction 40.7 85.8 -30.3 96.2
GTU Total services 2,276.5 -1,430.1 284.0 1,130.4
of which:
G Wholesale and retail trade; repair of motor vehicles and motorcycles 246.9 -73.9 316.3 489.4
H Transportation and storage 3.4 16.6 3.2 23.2
I Accommodation and food service activities 6.6 92.3 -30.2 68.7
J Information and communication 148.4 58.5 -32.2 174.8
K Financial and insurance activities 749.8 -286.6 -71.5 391.7
L Real estate activities 21.3 -253.3 55.5 -176.6
M Professional, scientific and technical activities 409.1 -527.4 29.7 -88.6
N Administrative and support service activities 507.7 -282.2 -7.0 218.5

Statistical annex
75Foreign direct investment in Poland and Polish direct investment abroad in 2015
Table 19 Foreign direct investment positions in Poland at the end of 2015 broken down by ultimate investing country and immediate investing country (in PLN million)
Country By the ultimate investing country % total By the immediate
ivestor country % total
Germany 135,853.8 19.1 116,577.6 16.4
United States 77,316.2 10.9 20,897.5 2.9
France 76,914.0 10.8 76,340.5 10.7
United Kingdom 44,299.2 6.2 39,005.8 5.5
Italy 40,232.9 5.7 36,233.9 5.1
Poland 33,322.8 4.7 0.0 0.0
Spain 32,870.9 4.6 43,373.4 6.1
Netherlands 22,581.3 3.2 129,258.8 18.2
Austria 22,040.3 3.1 27,048.4 3.8
Switzerland 17,536.8 2.5 17,883.4 2.5
Japan 14,430.1 2.0 3,009.7 0.4
Sweden 13,853.0 1.9 16,293.0 2.3
Denmark 11,955.2 1.7 13,653.1 1.9
Portugal 9,812.2 1.4 4,896.4 0.7
Belgium 9,657.8 1.4 21,614.8 3.0
Canada 8,898.5 1.2 1,200.5 0.2
Luxembourg 7,454.4 1.0 82,164.4 11.5
Finland 7,357.8 1.0 6,236.4 0.9
Cyprus 0.0 0.0 24,623.6 3.5
Unknown country 82,024.5 11.5 0.0 0.0
Other countries 43,646.7 6.1 31,747.1 4.5
Total 712,058.3 100.0 712,058.3 100.0

Narodowy Bank Polski76
Table 20 Foreign direct investment positions in Poland at the end of 2015 broken down by voivodeships (in PLN million)
Voivodeship Tota
l
C − M
anuf
actu
ring
K − F
inan
cial
inte
rmed
iatio
n
G − T
rade
Othe
rs
Germ
any
Neth
erla
nds
Luxe
mbo
urg
Othe
r cou
ntrie
s
Dolnośląskie 40,546.4 25,533.3 5,074.7 5,052.7 4,885.6 14,331.4 4,843.8 2,969.3 18,401.9
Kujawsko-Pomorskie 9,295.1 7,162.6 49.2 1,513.7 569.6 2,074.2 3,300.7 270.0 3,650.2
Lubelskie 4,991.8 3,552.2 0.0 492.6 946.9 657.3 240.4 776.5 3,317.5
Lubuskie 7,307.0 6,552.2 5.8 64.3 684.7 1,741.1 202.8 116.4 5,246.6
Łódzkie 18,561.7 12,889.6 504.1 2,731.7 2,436.3 3,460.8 4,615.7 2,807.9 7,677.3
Małopolskie 35,200.0 17,688.2 184.8 9,180.8 8,146.2 2,840.2 2,758.2 13,113.3 16,488.2
Mazowieckie 389,423.9 32,578.5 109,647.0 63,095.7 184,102.8 51,664.1 65,313.7 34,890.3 237,555.9
Opolskie 5,410.9 4,660.1 33.8 266.9 450.1 1,873.7 1,326.9 171.4 2,039.0
Podkarpackie 16,151.6 12,321.6 0.0 360.6 3,469.3 3,928.4 2,147.3 1,113.9 8,962.0
Podlaskie 2,972.4 2,617.0 17.3 121.7 216.4 914.7 175.8 148.0 1,733.9
Pomorskie 25,231.6 7,723.9 4,673.5 2,185.0 10,649.2 4,317.9 5,618.3 6,135.7 9,159.7
Śląskie 67,673.5 43,924.9 11,767.6 4,048.9 7,932.2 8,158.8 21,430.0 9,031.4 29,053.3
Świętokrzyskie 7,420.7 4,387.3 43.8 134.7 2,854.8 384.1 1,214.0 599.9 5,222.7
Warmińsko-Mazurskie 3,668.6 3,213.3 0.0 109.0 346.3 282.7 157.7 83.9 3,144.3
Wielkopolskie 63,145.2 34,707.6 2,193.6 15,574.6 10,669.4 16,500.0 14,544.8 9,325.9 22,774.5
Zachodniopomorskie 15,058.0 8,891.2 189.6 3,096.4 2,880.9 2,856.5 1,350.6 350.8 10,500.2
Total 712,058.3 228,403.4 134,384.8 108,029.3 241,240.8 115,985.9 129,240.7 81,904.6 384,927.2

Statistical annex
77Foreign direct investment in Poland and Polish direct investment abroad in 2015
Table 21 Profitability ratios of foreign direct investment in Poland in 2001–2015 (income as percentage of the underlying instrument)Year Return on equity Return on debt instruments Total return
2001 -0.2 8.6 1.9
2002 0.5 6.3 1.8
2003 4.3 4.5 4.4
2004 20.7 4.0 16.5
2005 13.5 4.6 11.9
2006 16.2 5.6 14.4
2007 17.8 5.2 15.3
2008 8.0 5.5 7.5
2009 11.4 4.5 9.8
2010 12.4 4.5 10.7
2011 10.5 4.6 9.3
2012 10.8 4.6 9.3
2013 10.8 5.0 9.4
2014 10.3 5.7 9.3
2015 10.4 4.7 9.1
Table 22 Cumulative total investment return gained by foreign direct investors in Poland in 2001–2015
Year Total cumulative rate of return on investment (in %)
2001 -17.3
2002 -12.6
2003 -3.4
2004 8.8
2005 20.1
2006 34.6
2007 49.2
2008 55.7
2009 66.2
2010 86.2
2011 83.5
2012 94.0
2013 121.6
2014 131.7
2015 123.5

Narodowy Bank Polski78
Table 23 Current operating performance of direct investment entities against the CIT rate in 2000–2015
Year Current operating performance CIT rate (in %)
2000 709.0 30
2001 -255.0 28
2002 579.0 28
2003 5,981.0 27
2004 32,456.0 19
2005 27,727.0 19
2006 37,723.0 19
2007 48,041.0 19
2008 25,793.0 19
2009 38,855.0 19
2010 46,277.0 19
2011 46,517.0 19
2012 45,772.3 19
2013 50,999.9 19
2014 55,531.9 19
2015 59,365.9 19
Table 24 Earnings retention rate in direct investment entities in 2005–2014
Year Earnings retention rate (in %)
2005 27.6
2006 40.5
2007 41.5
2008 9.4
2009 38.7
2010 46.1
2011 40.8
2012 20.8
2013 42.0
2014 47.8

Statistical annex
79Foreign direct investment in Poland and Polish direct investment abroad in 2015
Table 25 Foreign direct investment transactions to resident special purpose entities in 2000–2015 (in PLN million)
Year Total Excluding special purpose entities Special purpose entities
2000 41,050.0 41,050.0 0.0
2001 22,840.9 22,840.9 0.0
2002 16,443.0 16,443.0 0.0
2003 15,487.5 15,487.5 0.0
2004 45,501.1 44,404.7 1,096.5
2005 31,444.6 26,541.3 4,903.2
2006 57,040.2 45,236.3 11,803.9
2007 59,905.5 54,905.7 4,999.9
2008 33,397.9 29,592.8 3,805.1
2009 37,093.8 31,324.1 5,769.7
2010 38,582.8 38,584.6 -1.8
2011 54,097.1 47,183.8 6,913.3
2012 23,185.2 40,457.7 -17,272.5
2013 8,641.2 11,458.7 -2,817.5
2014 45,011.3 46,742.3 -1,731.0
2015 47,722.2 50,784.2 -3,062.0
Table 26 Foreign inward direct investment positions of resident special purpose entities at the end of the year in 2000–2015 (in PLN million)
Year Total Excluding special purpose entities Special purpose entities
2000 138,700.6 138,700.6 0.0
2001 161,024.6 161,024.6 0.0
2002 181,557.6 181,557.6 0.0
2003 209,895.4 209,895.4 0.0
2004 252,595.4 251,499.0 1,096.5
2005 287,598.2 281,598.5 5,999.7
2006 354,184.9 337,012.1 17,172.8
2007 419,056.1 400,241.1 18,815.0
2008 465,514.2 439,582.4 25,931.8
2009 504,283.0 477,137.5 27,145.6
2010 579,212.4 556,071.7 23,140.8
2011 596,887.4 561,904.0 34,983.4
2012 630,252.3 616,675.7 13,576.6
2013 698,827.4 690,250.5 8,576.9
2014 731,727.2 741,716.5 6,925.0
2015 715,980.3 712,058.3 3,922.0
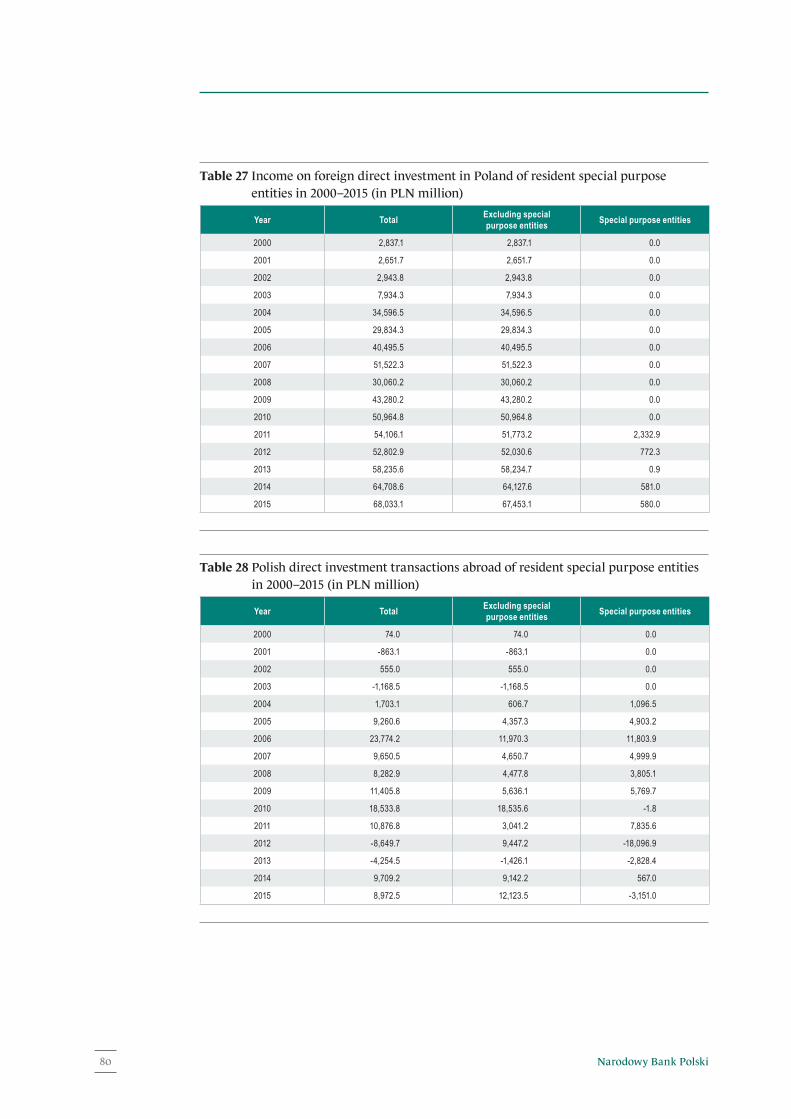
Narodowy Bank Polski80
Table 27 Income on foreign direct investment in Poland of resident special purpose entities in 2000–2015 (in PLN million)
Year Total Excluding special purpose entities Special purpose entities
2000 2,837.1 2,837.1 0.0
2001 2,651.7 2,651.7 0.0
2002 2,943.8 2,943.8 0.0
2003 7,934.3 7,934.3 0.0
2004 34,596.5 34,596.5 0.0
2005 29,834.3 29,834.3 0.0
2006 40,495.5 40,495.5 0.0
2007 51,522.3 51,522.3 0.0
2008 30,060.2 30,060.2 0.0
2009 43,280.2 43,280.2 0.0
2010 50,964.8 50,964.8 0.0
2011 54,106.1 51,773.2 2,332.9
2012 52,802.9 52,030.6 772.3
2013 58,235.6 58,234.7 0.9
2014 64,708.6 64,127.6 581.0
2015 68,033.1 67,453.1 580.0
Table 28 Polish direct investment transactions abroad of resident special purpose entities in 2000–2015 (in PLN million)
Year Total Excluding special purpose entities Special purpose entities
2000 74.0 74.0 0.0
2001 -863.1 -863.1 0.0
2002 555.0 555.0 0.0
2003 -1,168.5 -1,168.5 0.0
2004 1,703.1 606.7 1,096.5
2005 9,260.6 4,357.3 4,903.2
2006 23,774.2 11,970.3 11,803.9
2007 9,650.5 4,650.7 4,999.9
2008 8,282.9 4,477.8 3,805.1
2009 11,405.8 5,636.1 5,769.7
2010 18,533.8 18,535.6 -1.8
2011 10,876.8 3,041.2 7,835.6
2012 -8,649.7 9,447.2 -18,096.9
2013 -4,254.5 -1,426.1 -2,828.4
2014 9,709.2 9,142.2 567.0
2015 8,972.5 12,123.5 -3,151.0

Statistical annex
81Foreign direct investment in Poland and Polish direct investment abroad in 2015
Table 29 Polish direct investment abroad positions held by resident special purpose entities at the end of the year in 2000–2015 (in PLN million)
Year Total Excluding special purpose entities Special purpose entities
2000 1,109.6 1,109.6 0.0
2001 1,213.6 1,213.6 0.0
2002 1,656.6 1,656.6 0.0
2003 1,430.4 1,430.4 0.0
2004 3,184.4 2,088.0 1,096.5
2005 11,793.2 5,793.5 5,999.7
2006 29,984.9 12,812.1 17,172.8
2007 36,540.1 17,725.1 18,815.0
2008 50,233.2 24,301.4 25,931.8
2009 59,935.0 32,789.5 27,145.6
2010 71,771.4 48,630.7 23,140.8
2011 99,699.7 64,683.2 35,016.5
2012 95,773.8 80,906.1 14,867.7
2013 92,340.3 83,507.7 8,832.6
2014 105,090.4 97,348.4 7,742.0
2015 95,317.0 93,581.0 1,736.0
Table 30 Resident special purpose entities’ income on direct investment abroad in 2000–2015 (in PLN million)
Year Total Excluding special purpose entities Special purpose entities
2000 -133.9 -133.9 0.0
2001 -117.3 -117.3 0.0
2002 -414.2 -414.2 0.0
2003 -152.7 -152.7 0.0
2004 30.5 30.5 0.0
2005 136.3 136.3 0.0
2006 1,758.5 1,758.5 0.0
2007 -114.7 -114.7 0.0
2008 1,662.2 1,662.2 0.0
2009 -3,562.8 -3,562.8 0.0
2010 1,592.8 1,592.8 0.0
2011 1,514.4 -773.8 2,288.3
2012 5,416.3 4,330.1 1,086.1
2013 1,280.2 1,284.4 -4.2
2014 5,511.6 5,036.6 475.0
2015 2,780.8 2,287.8 493.0

Narodowy Bank Polski82
Index of Boxes
Box 1 Foreign direct investment in the Polish banking sector 17
Box 2 Dividends in direct investment entities 49
Index of Figures
Figure 1 Foreign direct investment transactions to Poland in 2000–2015 14
Figure 2 Foreign direct investment transactions to Poland in 2015 broken down by countries 15
Figure 3 Foreign direct investment transactions to Poland in 2015 broken down by economic activity 17
Figure 4 Foreign direct investment positions in Poland at the end of years 2000−2015 20
Figure 5 Foreign direct investment positions in Poland at the end of years 2000−2015 expressed in various currencies 21
Figure 6 Foreign direct investment positions in Poland at the end of 2015 broken down by countries 21
Figure 7 Foreign direct investment positions in Poland at the end of 2015 broken down by ultimate investing country 22
Figure 8 Foreign direct investment positions in Poland at the end of 2015 broken down by economic activity 25
Figure 9 Foreign direct investment positions in Poland at the end of 2015 broken down by voivodeships 26
Figure 10 Foreign direct investment positions in Poland at the end of 2015 broken down by voivodeships and main counterpart countries 27
Figure 11 Foreign direct investment positions in Poland at the end of 2015 broken down by voivodeships and main economic activities 27
Figure 12 Income on foreign direct investment in Poland in 2000–2015 28
Figure 13 Income on foreign direct investment in Poland in 2015 broken down by countries 29
Statistical annex
83Foreign direct investment in Poland and Polish direct investment abroad in 2015
Figure 14 Income on foreign direct investment in Poland in 2015 broken down by economic activity 30
Figure 15 Polish direct investment transactions abroad in 2000–2015 32
Figure 16 Polish direct investment transactions abroad in 2015 broken down by countries 33
Figure 17 Polish direct investment transactions abroad in 2015 broken down by economic activity 34
Figure 18 Polish direct investment positions abroad at the end of years 2000−2015 35
Figure 19 Polish direct investment positions abroad at the end of 2015 broken down by countries 35
Figure 20 Polish direct investment positions abroad at the end of 2015 broken down by economic activity 36
Figure 21 Income on Polish direct investment abroad in 2000–2015 37
Figure 22 Income on Polish direct investment abroad in 2015 broken down by countries 38
Figure 23 Income on Polish direct investment abroad in 2015 broken down by economic activity 38
Figure 24 Profitability ratios of foreign direct investment in Poland in 2001–2015 43
Figure 25 Total profitability ratio by type of economic activity of direct investment entities in Poland in 2012–2015 44
Figure 26 Cumulative total investment return gained by foreign direct investors in Poland in 2001–2015 45
Figure 27 Current operating performance of direct investment entities against the CIT rate in 2000–2015 47
Figure 28 Earnings retention rate in direct investment entities in 2005–2014 48
Figure B1 Foreign direct investment inflows to the sector of monetary financial institutions in 1996–2015 18
Figure B2 Foreign direct investment positions in the sector of monetary financial institutions in 2004–2015 (data at the end of the year) 18
Figure B3 Income on foreign direct investment in the banking sector 19

Narodowy Bank Polski84
Index of Tables
Table 1 Foreign direct investment transactions to Poland in 2000–2015 60
Table 2 Foreign direct investment positions in Poland at the end of years 2000−2015 61
Table 3 Income on foreign direct investment in Poland in 2000–2015 61
Table 4 Foreign direct investment transactions to Poland in 2015 broken down by countries and economic zones 62
Table 5 Foreign direct investment transactions to Poland in 2015 broken down by economic activity 63
Table 6 Foreign direct investment positions in Poland at the end of 2015 broken down by countries and economic zones 64
Table 7 Foreign direct investment positions in Poland at the end of 2015 broken down by economic activity 65
Table 8 Income on foreign direct investment in Poland in 2015 broken down by countries and economic zones 66
Table 9 Income on foreign direct investment in Poland in 2015 broken down by economic activity 67
Table 10 Polish direct investment transactions abroad in 2000–2015 67
Table 11 Polish direct investment positions abroad at the end of years 2000−2015 68
Table 12 Income on Polish direct investment abroad in 2000–2015 68
Table 13 Polish direct investment transactions abroad in 2015 broken down by countries and economic zones 69
Table 14 Polish direct investment transactions abroad in 2015 broken down by economic activity 70
Table 15 Polish direct investment positions abroad at the end of 2015 broken down by countries and economic zones 71
Table 16 Polish direct investment positions abroad at the end of 2015 broken down by economic activity 72
Table 17 Income on Polish direct investment abroad in 2015 broken down by countries and economic zones 73
Table 18 Income on Polish direct investment abroad in 2015 broken down by economic activity 74

Statistical annex
85Foreign direct investment in Poland and Polish direct investment abroad in 2015
Table 19 Foreign direct investment positions in Poland at the end of 2015 broken down by ultimate investing country and immediate investing country 75
Table 20 Foreign direct investment positions in Poland at the end of 2015 broken down by voivodeships 76
Table 21 Profitability ratios of foreign direct investment in Poland in 2001–2015 77
Table 22 Cumulative total investment return gained by foreign direct investors in Poland in 2001–2015 77
Table 23 Current operating performance of direct investment entities against the CIT rate in 2000–2015 78
Table 24 Earnings retention rate in direct investment entities in 2005–2014 78
Table 25 Foreign direct investment transactions to resident special purpose entities in 2000–2015 79
Table 26 Foreign inward direct investment positions of resident special purpose entities at the end of the year in 2000–2015 79
Table 27 Income on foreign direct investment in Poland of resident special purpose entities in 2000–2015 80
Table 28 Polish direct investment transactions abroad of resident special purpose entities in 2000–2015 80
Table 29 Polish direct investment abroad positions held by resident special purpose entities at the end of the year in 2000–2015 81
Table 30 Resident special purpose entities’ income on direct investment abroad in 2000–2015 81

www.nbp.pl