Embed Size (px)
Citation preview
FOREIGN INVESTMENT
CAPITAL FLOWS
IN U.S. REAL ESTATE
“U.S. 2016 AND BEYOND”
Overview Review of Past 10-year Trends (As of 4Q 2015)
Update of Recent Trends (As of 3Q 2016)
View of 2016 and Beyond
“Foreign Investment Capital
- U.S. Outlook for 2016”
Article by Tony D. Kamath, MAI, MRICS
Published in CRE Finance World Magazine, Summer
2016 (page 31-34)
Base: Data and published literature as of 1Q 2016
Sources:
Surveys, Data & Opinions
CBRE - “2016 Global Real Estate Market Outlook”
Cushman & Wakefield (C&W) – “Atlas Outlook 2016”
Jones Lang LaSalle (JLL) – “Global Market Perspective, Q1 2016”
RCA – “USA Incoming Cross-Border Capital into Property (Past 5-10 Years)”
AFIRE – Association of Foreign Investors in Real Estate
CRE (Counselors of Real Estate) –”The CRE 2015-16 Top Ten Issues Affecting
Real Estate”
ULI (Urban Land Institute) – “Urban Land”

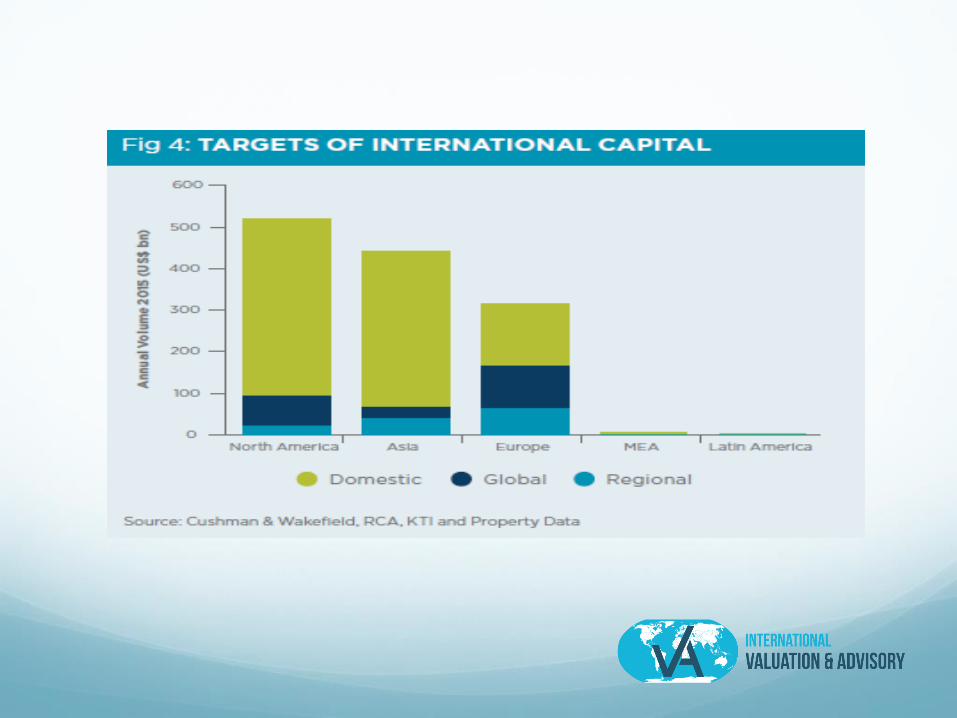
The Big Picture
U.S. Capital Inflows Historically from Europe, Canada and Japan
Recent 5 years – Sovereign Wealth & Pension Funds
Savings from Canada, China, Singapore and Norway
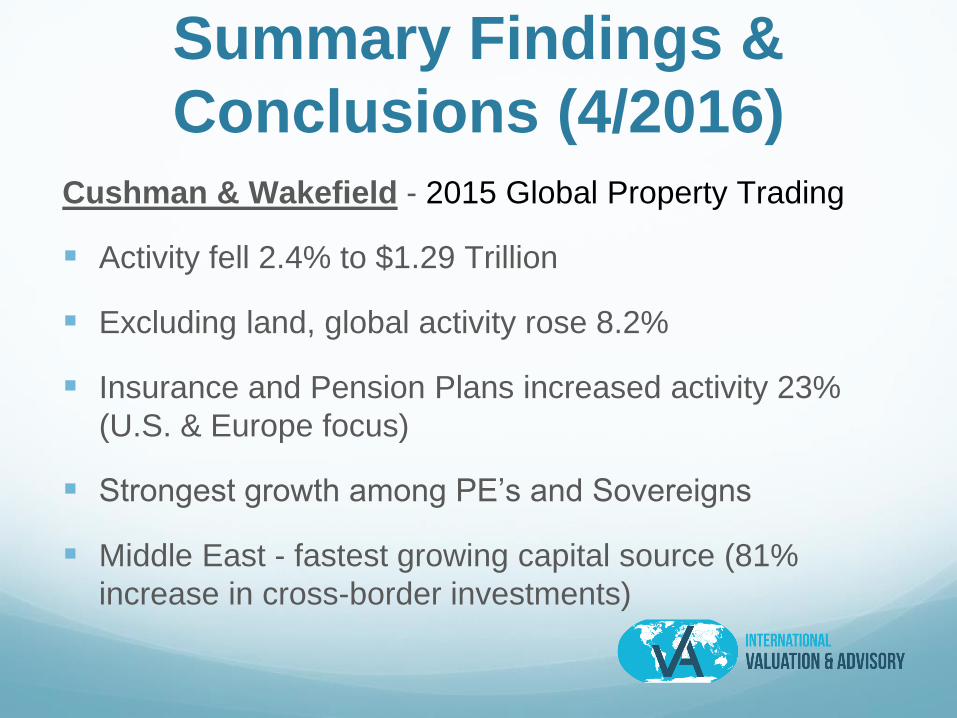
Summary Findings &
Conclusions (4/2016)Cushman & Wakefield - 2015 Global Property Trading
Activity fell 2.4% to $1.29 Trillion
Excluding land, global activity rose 8.2%
Insurance and Pension Plans increased activity 23%
(U.S. & Europe focus)
Strongest growth among PE’s and Sovereigns
Middle East - fastest growing capital source (81%
increase in cross-border investments)
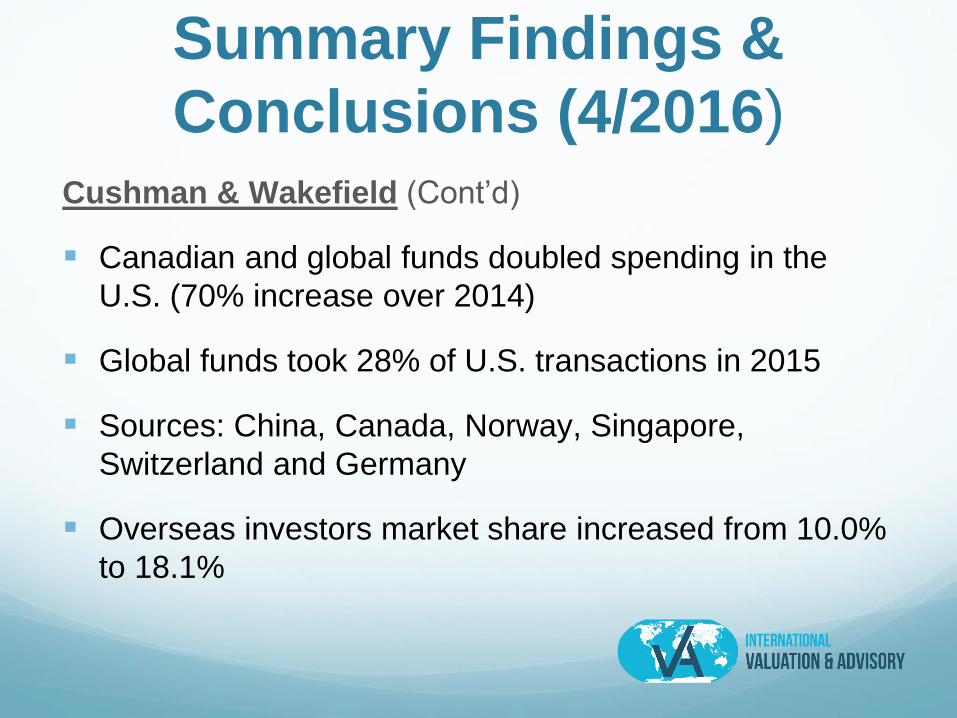
Summary Findings &
Conclusions (4/2016)Cushman & Wakefield (Cont’d)
Canadian and global funds doubled spending in the
U.S. (70% increase over 2014)
Global funds took 28% of U.S. transactions in 2015
Sources: China, Canada, Norway, Singapore,
Switzerland and Germany
Overseas investors market share increased from 10.0%
to 18.1%
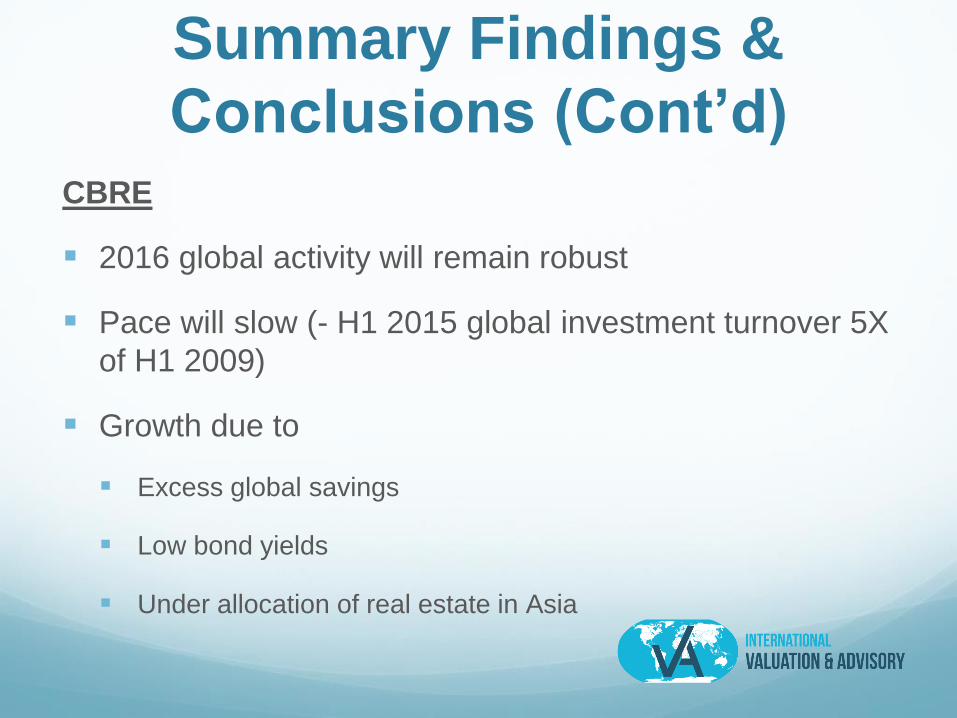
Summary Findings &
Conclusions (Cont’d)CBRE
2016 global activity will remain robust
Pace will slow (- H1 2015 global investment turnover 5X
of H1 2009)
Growth due to
Excess global savings
Low bond yields
Under allocation of real estate in Asia
Summary Findings &
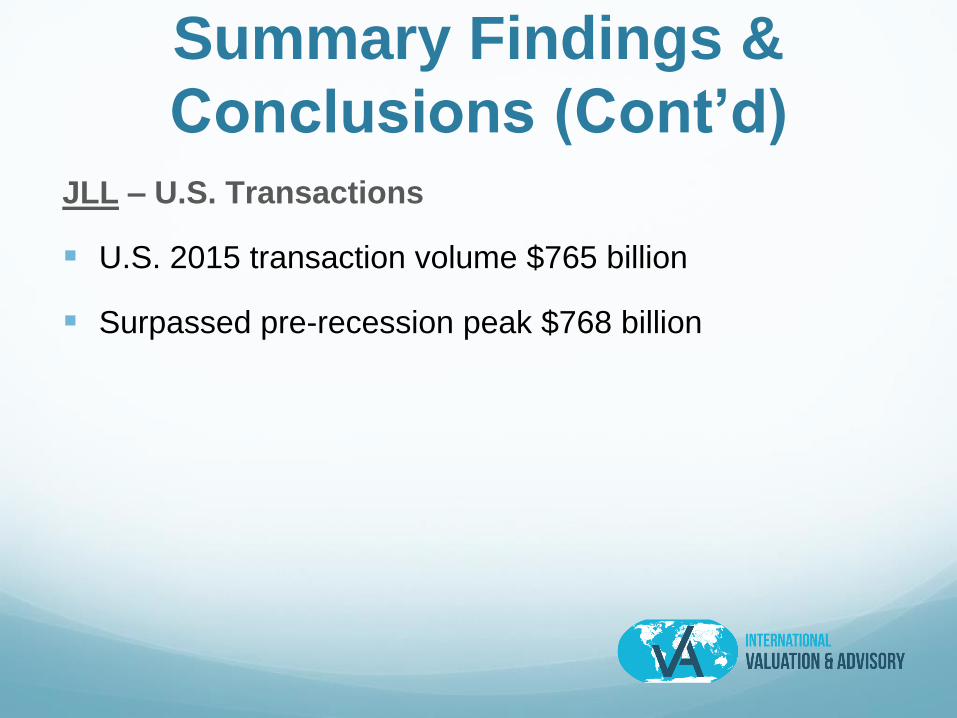
Conclusions (Cont’d)JLL – U.S. Transactions
U.S. 2015 transaction volume $765 billion
Surpassed pre-recession peak $768 billion
The Analytics
RCA Data
RCA – “Real Capital
Analytics” Data
Transactions of $5 million and above
RCA’s First Batch of Data
Past Five Years -1Q 2011 – 4Q 2015
Past Ten Years – 1Q 2006 – 4Q 2015
RCA’s Second Batch of Data*
Past Five Years -4Q 2011 – 3Q 2016
Past Ten Years – 4Q 2006 – 3Q 2016
* Updated for this presentation!
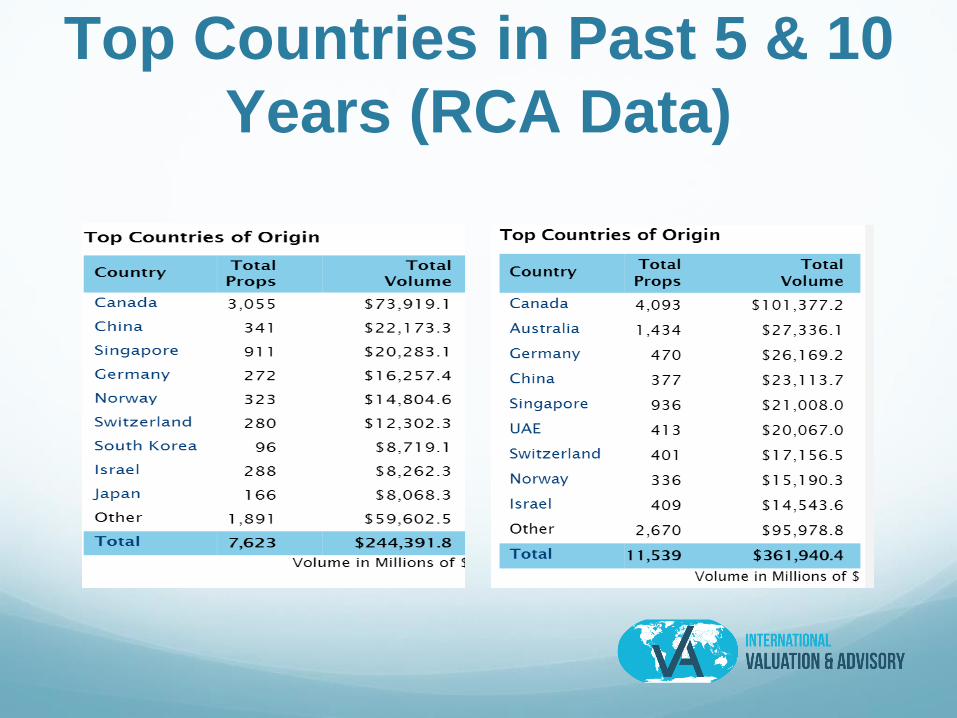
Top Countries in Past 5 & 10
Years (RCA Data)
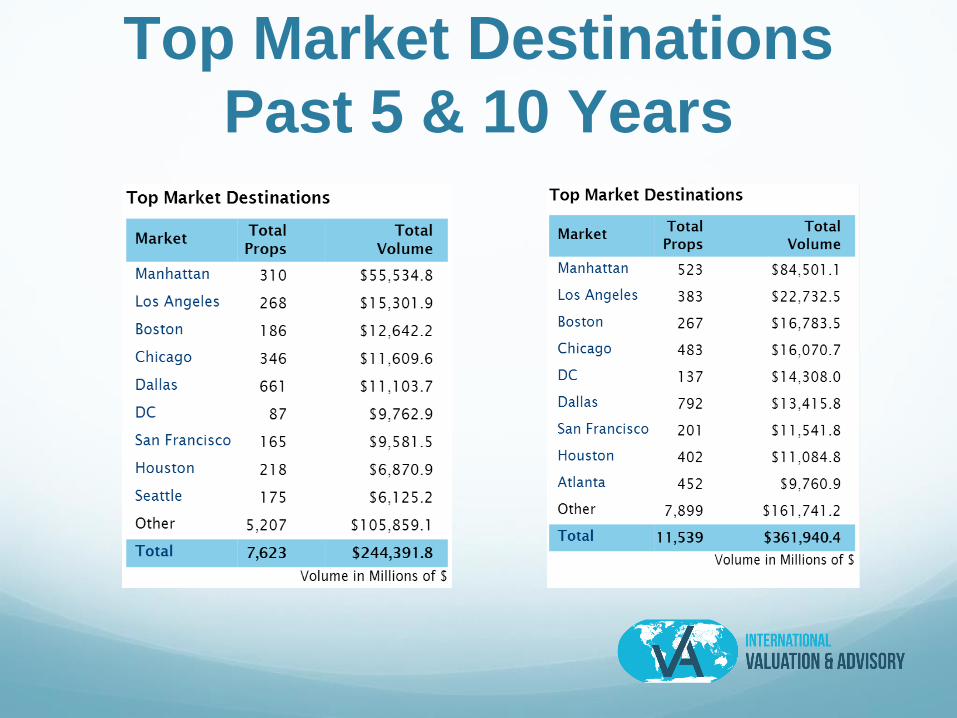
Top Market Destinations
Past 5 & 10 Years
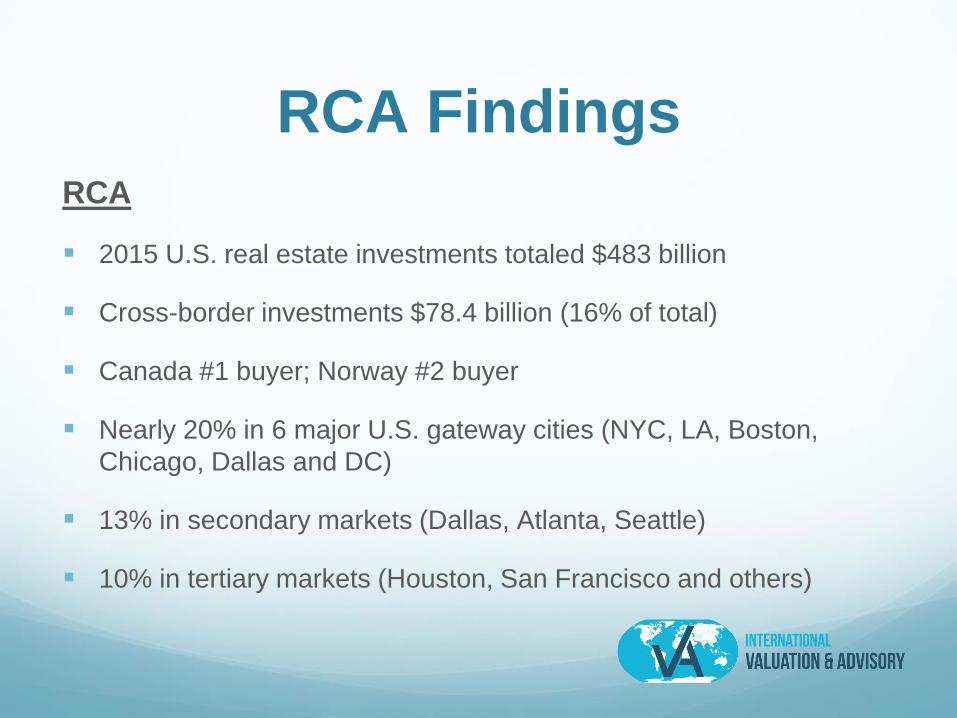
RCA FindingsRCA
2015 U.S. real estate investments totaled $483 billion
Cross-border investments $78.4 billion (16% of total)
Canada #1 buyer; Norway #2 buyer
Nearly 20% in 6 major U.S. gateway cities (NYC, LA, Boston,
Chicago, Dallas and DC)
13% in secondary markets (Dallas, Atlanta, Seattle)
10% in tertiary markets (Houston, San Francisco and others)
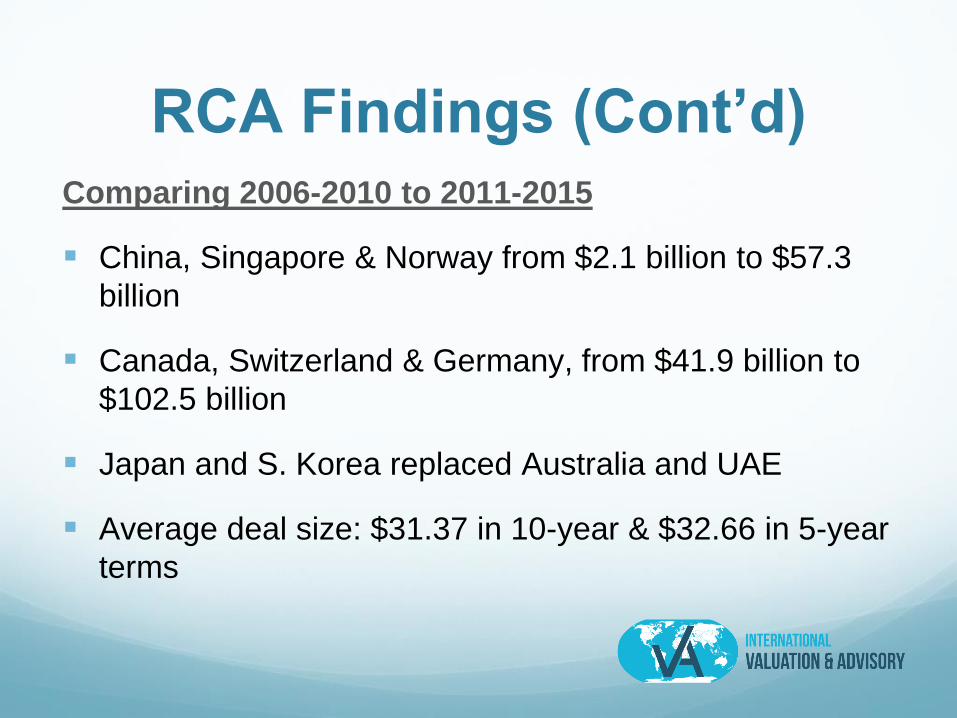
RCA Findings (Cont’d)Comparing 2006-2010 to 2011-2015
China, Singapore & Norway from $2.1 billion to $57.3
billion
Canada, Switzerland & Germany, from $41.9 billion to
$102.5 billion
Japan and S. Korea replaced Australia and UAE
Average deal size: $31.37 in 10-year & $32.66 in 5-year
terms
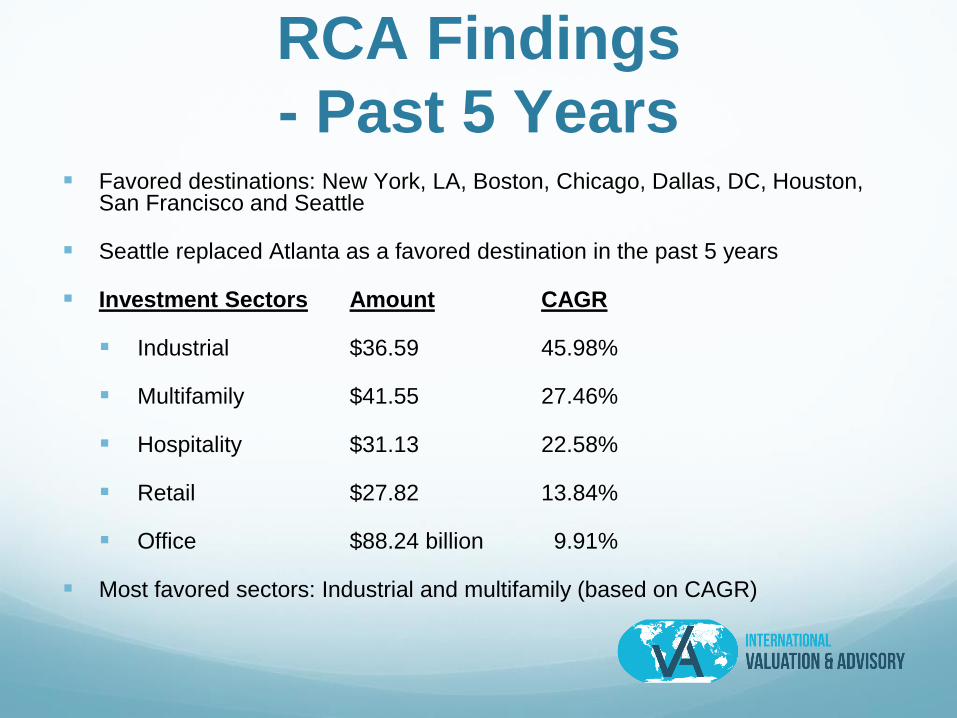
RCA Findings
- Past 5 Years Favored destinations: New York, LA, Boston, Chicago, Dallas, DC, Houston,
San Francisco and Seattle
Seattle replaced Atlanta as a favored destination in the past 5 years
Investment Sectors Amount CAGR
Industrial $36.59 45.98%
Multifamily $41.55 27.46%
Hospitality $31.13 22.58%
Retail $27.82 13.84%
Office $88.24 billion 9.91%
Most favored sectors: Industrial and multifamily (based on CAGR)
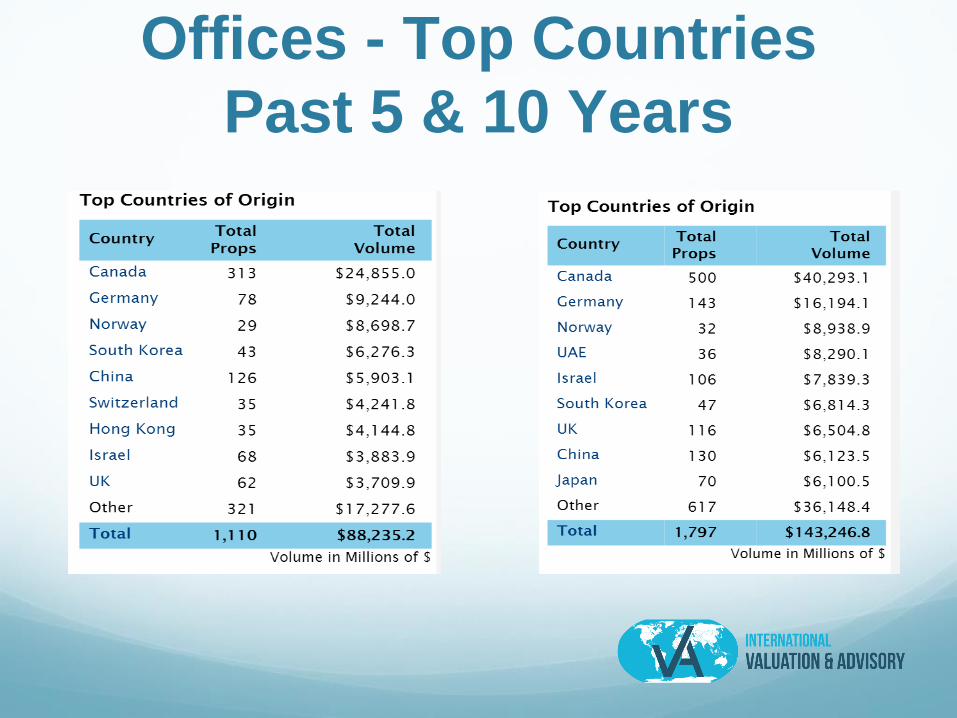
Offices - Top Countries
Past 5 & 10 Years
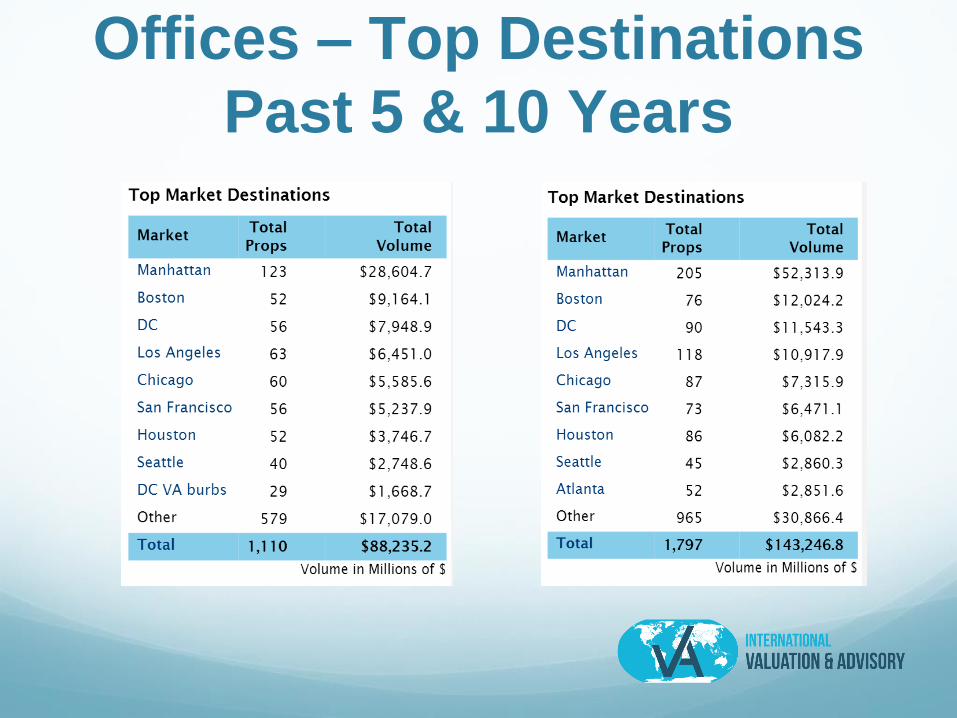
Offices – Top Destinations
Past 5 & 10 Years
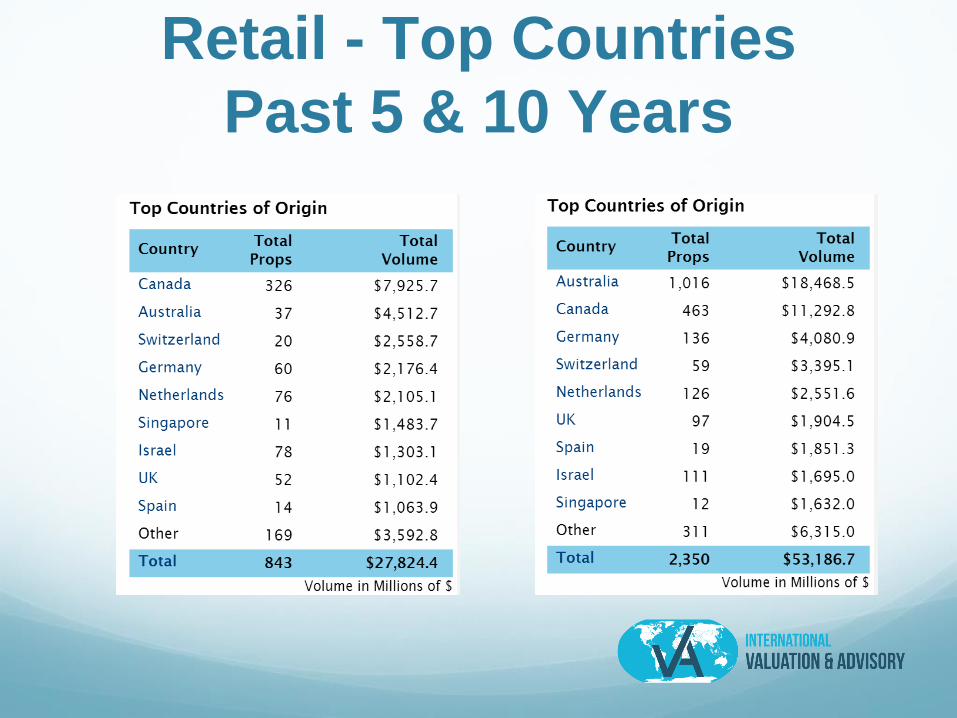
Retail - Top Countries
Past 5 & 10 Years
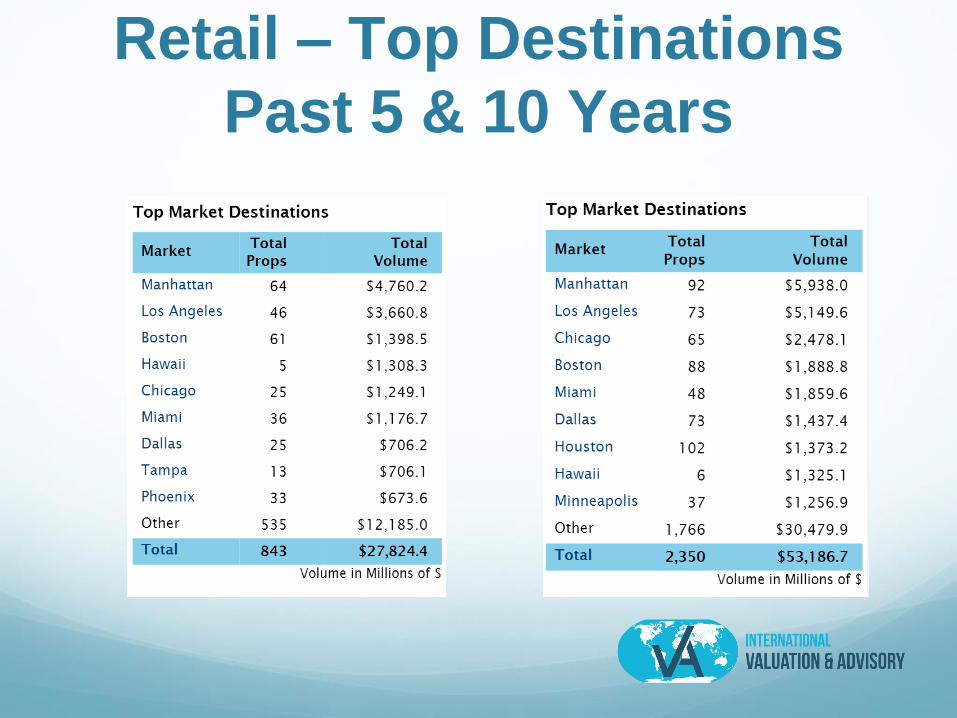
Retail – Top Destinations
Past 5 & 10 Years
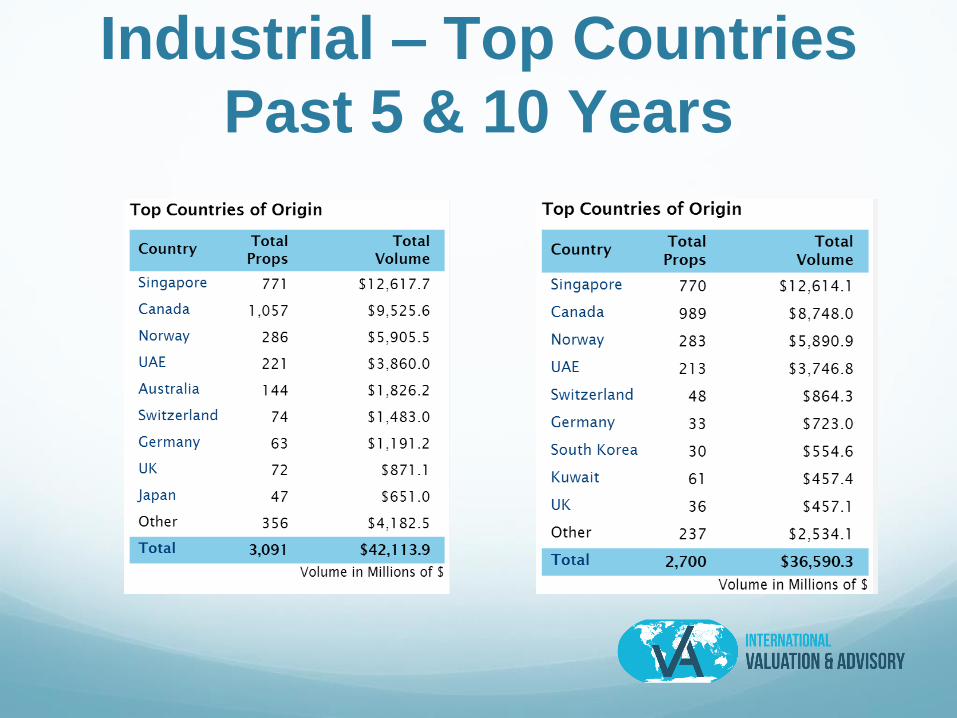
Industrial – Top Countries
Past 5 & 10 Years
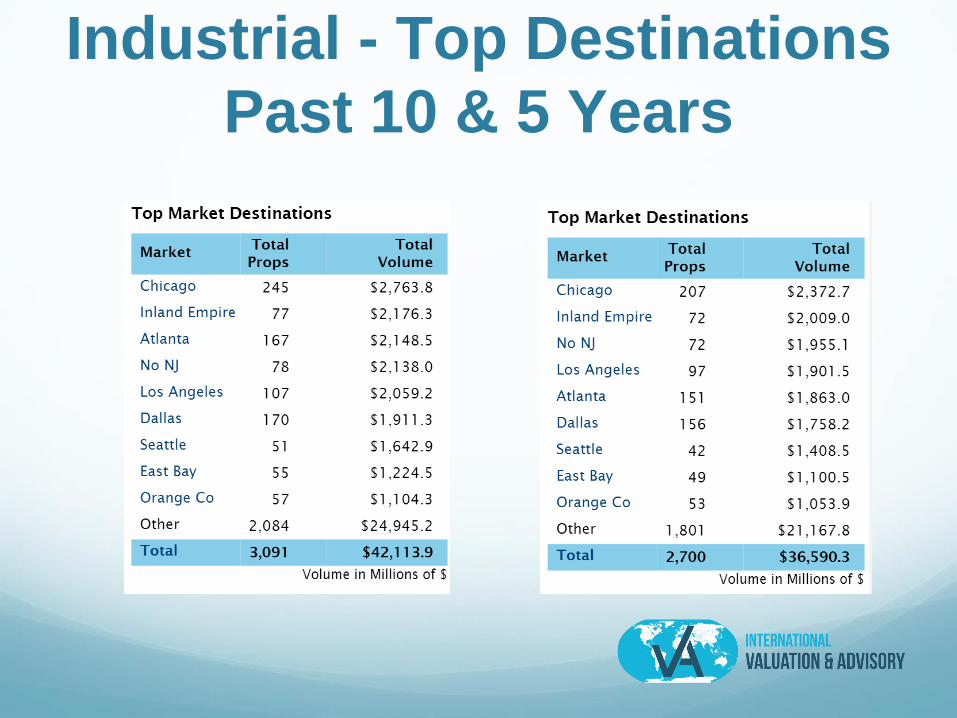
Industrial - Top Destinations
Past 10 & 5 Years
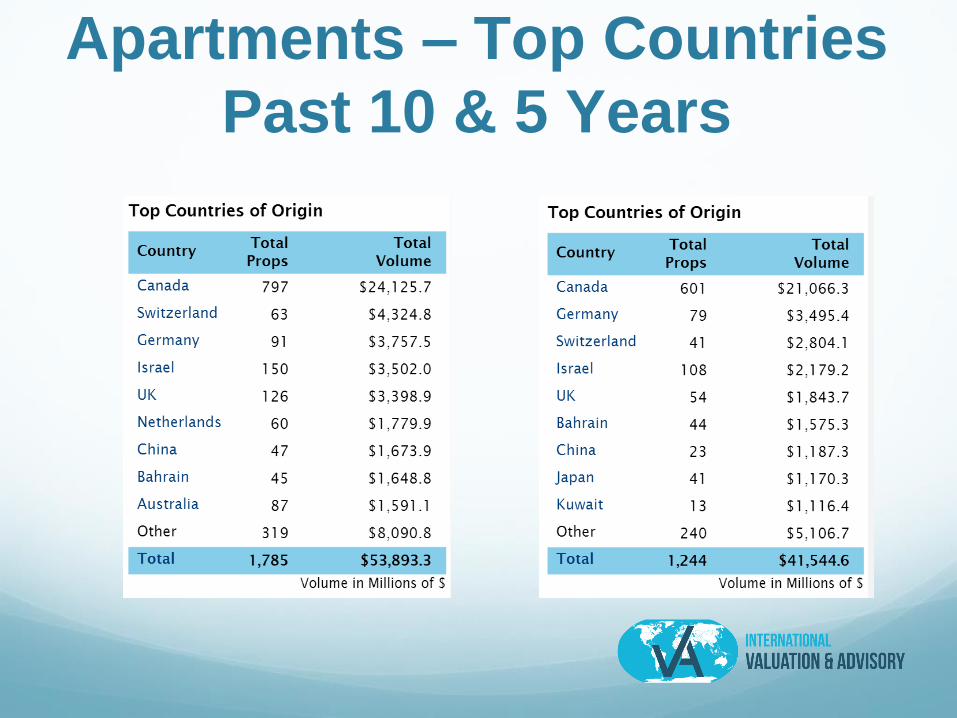
Apartments – Top Countries
Past 10 & 5 Years

Apartments – Top Destinations
Past 10 & 5 Years
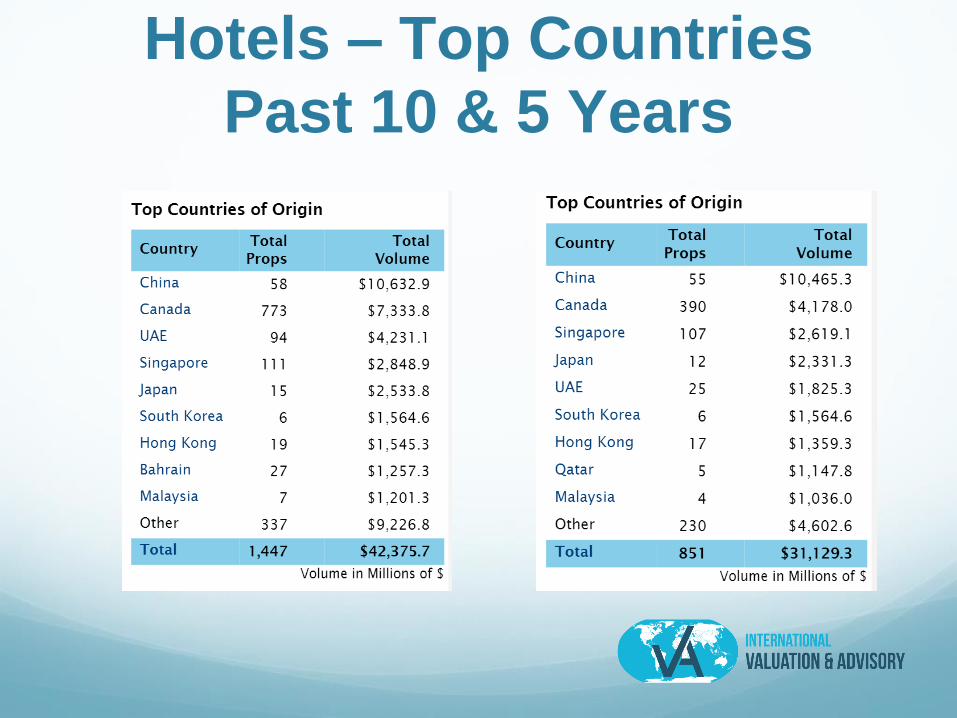
Hotels – Top Countries
Past 10 & 5 Years
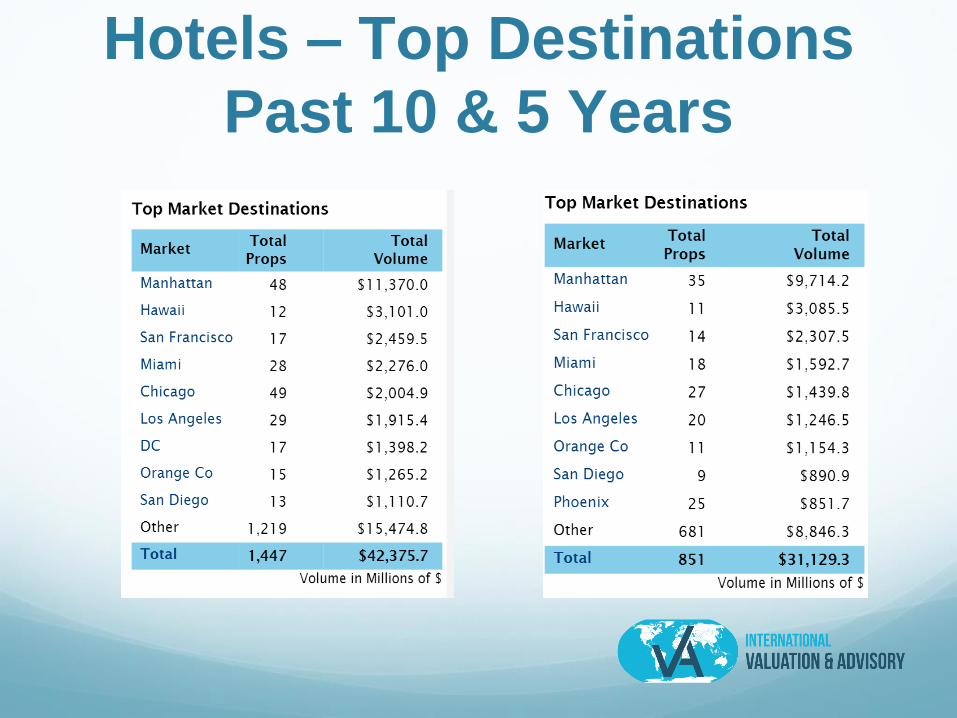
Hotels – Top Destinations
Past 10 & 5 Years
Summary Findings &
ConclusionsCRE – Counselors of Real Estate
Funds continue to flow outside the countries to the U.S.
Driven by economies that have:
High savings rate
Shortage of mature financial markets
Shortage of investable assets
Summary Findings &
Conclusions (Cont’d)ULI - Urban Land Institute
Global capital is driven to U.S. property market
By global economic and political uncertainty
Because the U.S. is a safe haven
U.S. – the most stable market
U.S. - the most transparent market
Summary Findings &
Conclusions (Cont’d)AFIRE
Preferred property types
Multi-family
Industrial
Others
Retail
Office
Hotel
The Backdrop
A Mixed Environment
Challenging External
Influences (1Q 2016) Low commodity prices (e.g. oil)
Pressure on domestic budgets
Disinvestment and decreased 2016 capital outflow
Oil producers account for 40% of global savings
Overall glut of savings – cross-border investments
Negative interest rate environment – Japan & Europe
Mixed Global Environment -
Benefits U.S. Real Estate Monetary policies (QE in Europe)
Global economic and political reform agendas
Political developments (Elections in Europe; Brexit)
Lending policies and interest rates
China’s slowing economy – positive for outflow (?)
In 2015 Chinese spent $8.6 billion in U.S. – more
than 4X in 2014
Domestic Environment -
Favors U.S. Real Estate U.S. interest rate decision; effect on 10-year Treasuries
Yields in U.S. commercial real estate; competitive
(“super”) market
FIRPTA (Foreign Investment in Real Estate Property
Act, 1980) reform

Future View
2016 & BeyondCBRE:
U.S. real estate environment to remain positive
Investors have large amount of capital to deploy
Expect moderate yield compression
2016 & Beyond (Cont’d)Cushman & Wakefield:
Investment flows may be better in 2016
Low global interest rates
Global uncertainty & relative strength of U.S.
Strong property & currency markets
Strong supply of debt in U.S. market
4.2% increase in real estate trading volume
2016 & Beyond (Cont’d)AFIRE:
“The investment opportunity is the United States itself.”
Real estate fundamentals are sound
Economy remains strong
Opportunities across all sectors, in gateway and secondary cities
Recent legislation on FIRPTA taxes should provide additional incentives
“In an environment that is regarded both as the safest and most secure in the world, with a strong currency and the best opportunity for capital appreciation, the US is the safest harbor.”
- James A. Fetgatter, CEO of AFIRE

Talking Points
2016 & Beyond…?Debate on U.S. Real Estate Market (1Q, 2016)
Signs of severe downturn?
Is the market ripe for a correction?
Is this a periodic review of portfolios?
Is the market absorbing global uncertainties (e.g.
Brexit)?
2016 & Beyond…(Cont’d)Backdrop: 2015 U.S. Economic Environment (1Q 2016)
2.7 non-farms jobs created
13 million jobs since economic recession
Unemployment rate at 4.9% (in Feb. 2016)
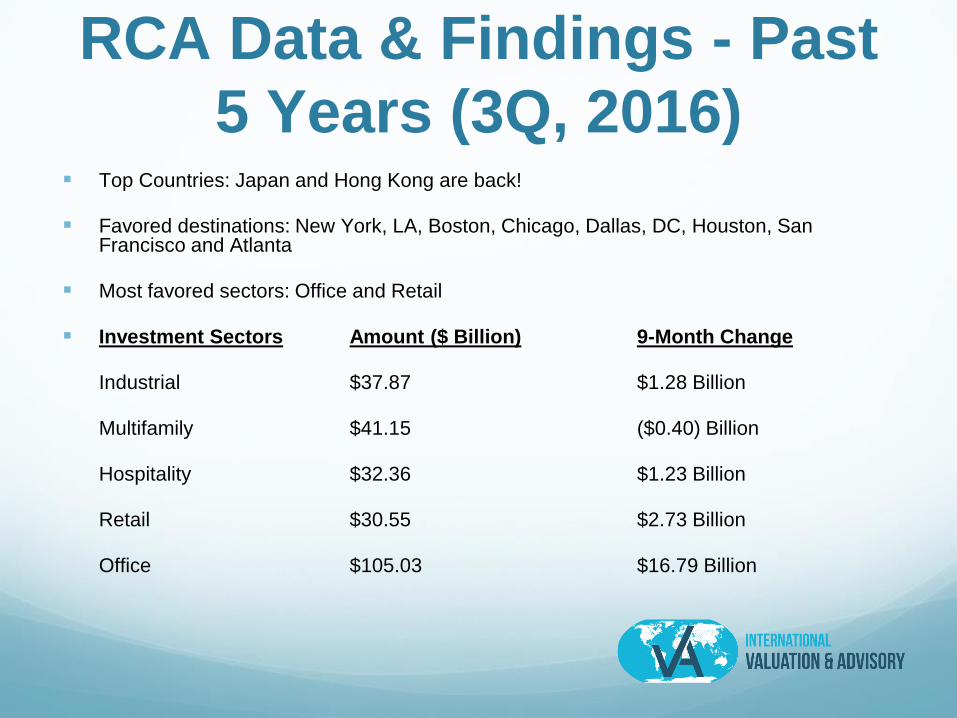
RCA Data & Findings - Past
5 Years (3Q, 2016) Top Countries: Japan and Hong Kong are back!
Favored destinations: New York, LA, Boston, Chicago, Dallas, DC, Houston, San Francisco and Atlanta
Most favored sectors: Office and Retail
Investment Sectors Amount ($ Billion) 9-Month Change
Industrial $37.87 $1.28 Billion
Multifamily $41.15 ($0.40) Billion
Hospitality $32.36 $1.23 Billion
Retail $30.55 $2.73 Billion
Office $105.03 $16.79 Billion
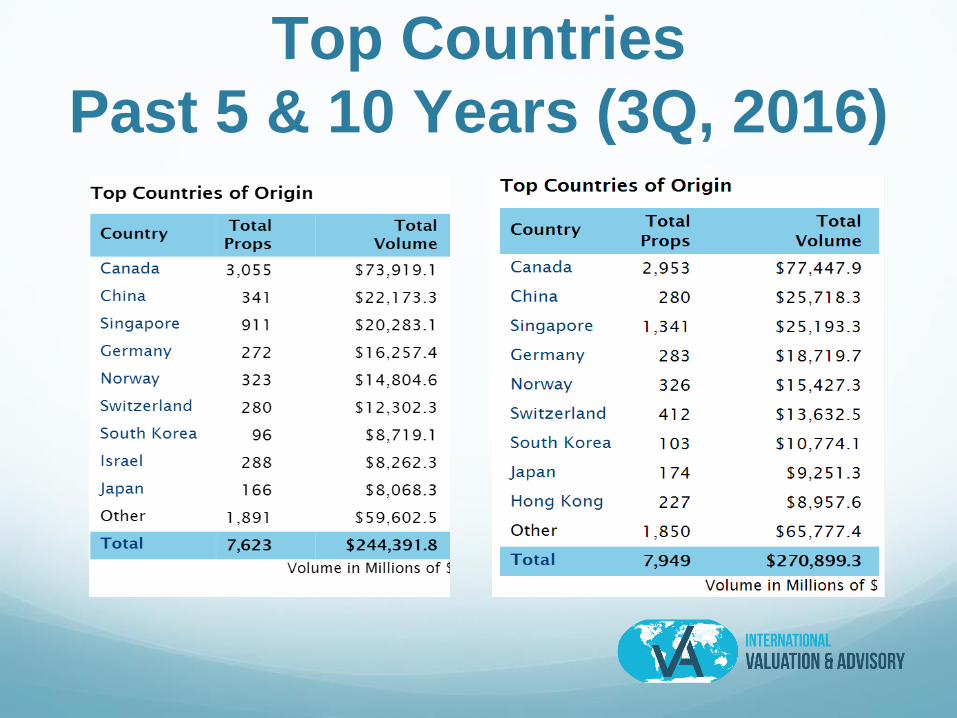
Top Countries
Past 5 & 10 Years (3Q, 2016)
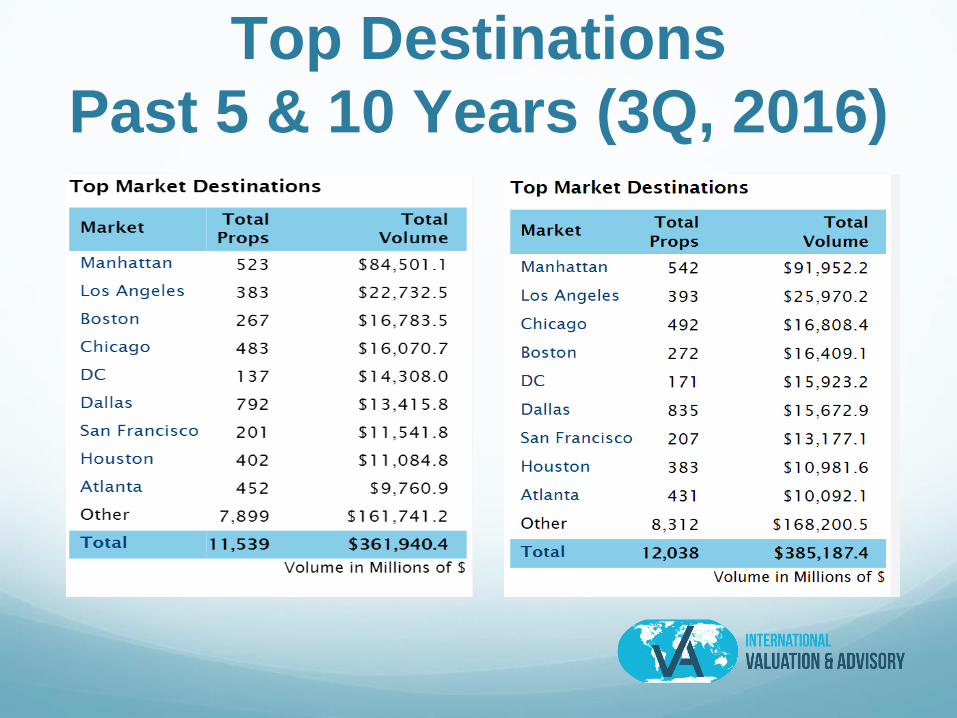
Top Destinations
Past 5 & 10 Years (3Q, 2016)
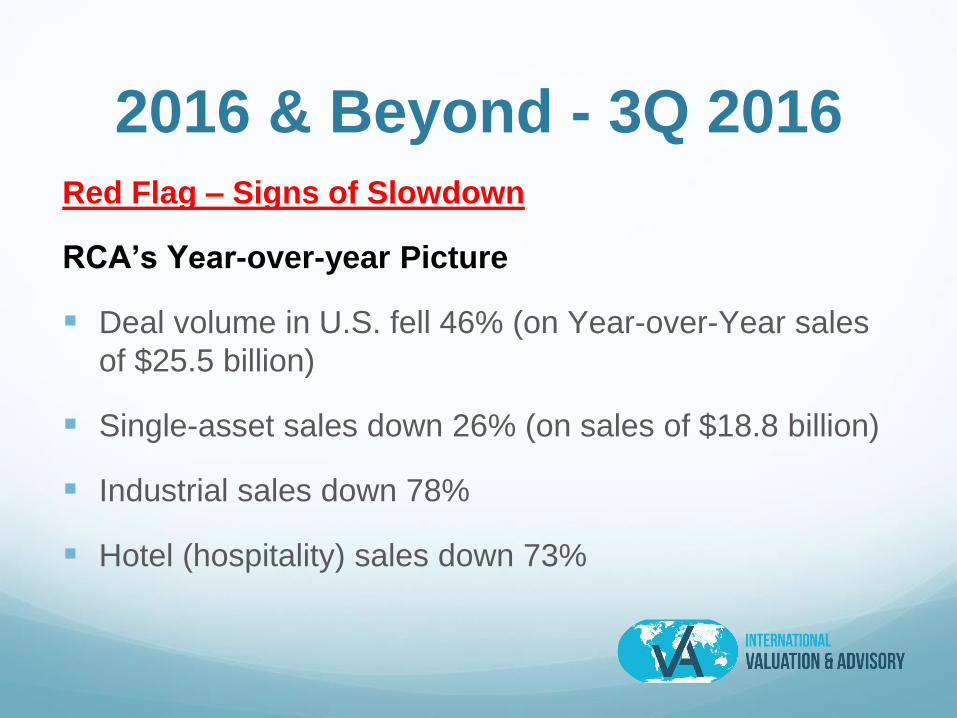
2016 & Beyond - 3Q 2016Red Flag – Signs of Slowdown
RCA’s Year-over-year Picture
Deal volume in U.S. fell 46% (on Year-over-Year sales
of $25.5 billion)
Single-asset sales down 26% (on sales of $18.8 billion)
Industrial sales down 78%
Hotel (hospitality) sales down 73%
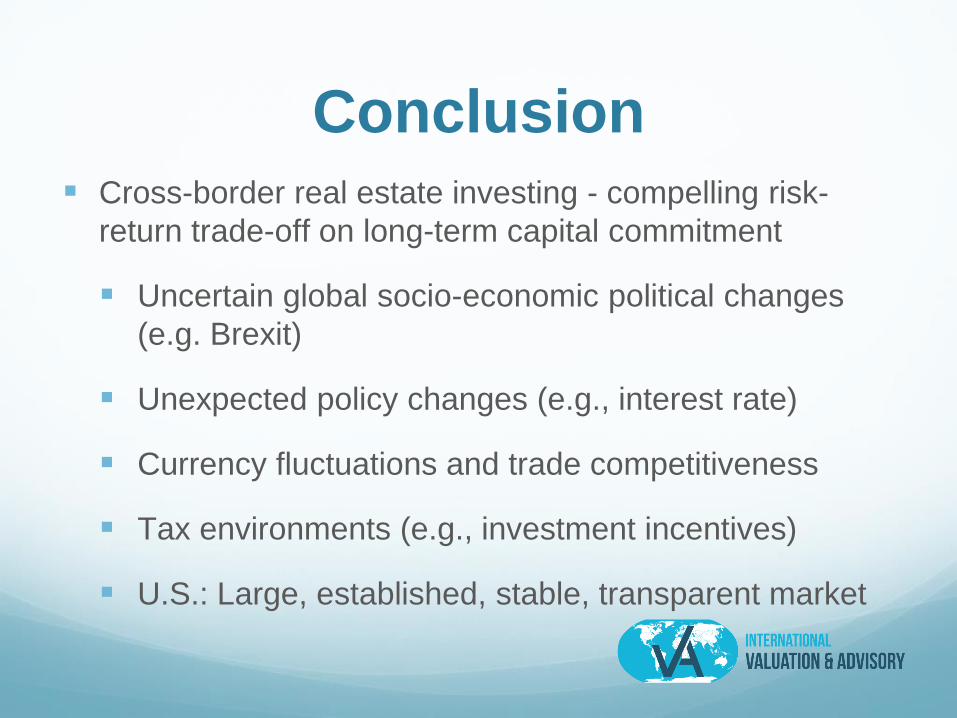
Conclusion Cross-border real estate investing - compelling risk-
return trade-off on long-term capital commitment
Uncertain global socio-economic political changes
(e.g. Brexit)
Unexpected policy changes (e.g., interest rate)
Currency fluctuations and trade competitiveness
Tax environments (e.g., investment incentives)
U.S.: Large, established, stable, transparent market
“In the increasingly unstable global eco-
political atmosphere, foreign investors will
seek more certainty on returns and
reallocate saving surpluses to seek U.S.
growth opportunities.”
- Tony D’Silva Kamath, MAI, MRICS, Principal, International
Valuation & Advisory LLC
Thank You!
Steven Williams, Real Capital Analytics
FENG – Financial Executives Network Group
&
Tom McFarland, Hinduja Group Offices, New York, NY
Tony D. Kamath, MAI, MRICS
Phone: 917-558-1945
International Valuation & Advisory LLC
www.InternationalValuation.com
Note: The opinions expressed in this presentation are the author’s only.