Embed Size (px)
Citation preview

© 2 0 1 6 F O R E S E E
F O R E S E E R E TA I L B E N C H M A R K R E P O R T
A U G U S T 2 0 1 6

2 T H E F O R E S E E R E TA I L B E N C H M A R K R E P O R T – AU G U S T 2 0 1 6 W W W. F O R E S E E . C O M
E X E C U T I V E S U M M A R Y
Most companies can benchmark against competitors in terms of sales, revenue, number of stores, etc.
They also benchmark against industry averages for everything from click-through rates to conversion
rates to average order size.
But if you believe all the research proving that customer experience (CX) predicts future revenue,
loyalty, market share, and stock prices, then you need to know how you stack up in terms of CX as
well. Being able to benchmark against other direct competitors using a scientific methodology is
extremely valuable for assessing success and progress.
Benchmarks are incredibly important to us. After all, we know how we stack up to competitors in terms of sales and market share. Since CX is a proven predictor of loyalty, revenue, and stock prices, we need to know how we stack up in terms of experience as well. ForeSee benchmarks are one of many useful services provided by ForeSee to help us assess our success.
ROB SCHMULTS
SENIOR VICE PRESIDENT, E-COMMERCE & CRM, TALBOTS

3 T H E F O R E S E E R E TA I L B E N C H M A R K R E P O R T – AU G U S T 2 0 1 6 W W W. F O R E S E E . C O M
A B O U T F O R E S E E R E TA I L B E N C H M A R K S
As part of ForeSee's service, we make our robust benchmarks available to clients. In retail alone, we
have 70 benchmarks, allowing our clients an unparalleled ability to compare their performance in
CX against themselves over time, against direct competitors, and against best-in-class companies.
Our benchmarks give you the context you need to understand the impact of customer experience
improvements you make.
5 WAYS TO BENCHMARK
Suggestions for useful benchmarking, all of which are available from ForeSee:
1. Against yourself, over time: How does your company’s performance stack up against itself compared
to last week, last month, and last year? Is your CX improving, declining, or maintaining the status quo?
How about specific elements of the experience, or the customer experience with a specific channel or
touchpoint? You should measure customer experience overall and by discrete customer experience.
2. Against competitors: Are you comparing your company’s CX performance to competitors? Chances are,
your team is already doing this without involving any data at all — and that’s a mistake.
3. Against best-in-class companies, regardless of industry: Whether or not you compete with CX leaders
like Apple, Nordstrom, Amazon and Netflix, your customers are subconsciously comparing you to them.
So while your CX scores may have limitations due to your industry or other factors, you should be aware
of how the best of the best perform.
4. Against companies in your industry with similar touchpoints or experiences: It’s one thing to know how
your web CX stacks up against your competitors. But do you know how your “Buy Online, Pickup In
Store” experience measures up? Or your checkout process? Or your mobile app?
5. Seasonally: Some retailers find it useful to compare their performance to peers during certain key times
of year with specified sets of custom questions. The ForeSee team puts together custom question sets
around winter holidays, Valentine's Day, Mother's Day, Father's Day, and back to school. Retailers can
choose to add those questions to their surveys and compare their performance to peers.
ForeSee works with hundreds of retailers in every sub-category of retail, including 70 of the top 100
retailers, according to Internet Retailer. ForeSee’s retail benchmarks (including both ForeSee clients
and other top retailers measured in ForeSee’s annual FXI) include companies like Amazon.com, Apple,
Argos, Best Buy, Costco, CVS, Dell, Disney Store, Drugstore.com. Etsy, Express, Gap, Netflix, Neiman
Marcus, Nike, Nordstrom, REI, Sears, Target, Victoria’s Secret, Walgreens, and Walmart.

4 T H E F O R E S E E R E TA I L B E N C H M A R K R E P O R T – AU G U S T 2 0 1 6 W W W. F O R E S E E . C O M
H O W TO U S E T H E F O R E S E E B E N C H M A R K S
According to Dan Chester, ForeSee’s Retail Practice Leader, standardizing the use of benchmarks
can make them more useful. First the retailer can look broadly at benchmarks across the customer’s
entire journey and zero in on those measures that are doing well versus where they are below average
performance. The retailer can then zero in on the specific scores that underperform ForeSee’s
benchmarks to understand what is driving those lower scores.
For example, a retailer may find that their mobile site, BOPIS measure, and post-visit fulfillment
CX scores are all at or above industry standards, but that the experience of those who abandoned a
shopping cart is well below the benchmark.
The retailer can drill into main drivers and micro-drivers of underperformance — including looking at
survey results, verbatim comments, session replays of the users’ struggle, and usability analysis — to
identify areas of improvement and identify best practices for success.
Many of our retail clients also use benchmarks as a performance metric or review metric for employees.
ForeSee benchmark scores, like all ForeSee CX scores, are on a 100-point scale. They are index scores,
not percentages.

5 T H E F O R E S E E R E TA I L B E N C H M A R K R E P O R T – AU G U S T 2 0 1 6 W W W. F O R E S E E . C O M
C R O S S - I N D U ST RY B E N C H M A R K S
First, let’s look at how retail in general stacks up to other industries in terms of desktop customer
experience. We can see that retail (average CX score of 72 on ForeSee’s 100-point scale) performs well
above the average overall (68), and in fact exceeds all of our major industry benchmarks. Retailers
have worked hard to deliver good customer experiences, and it’s paying off.
Industry CX Score
Average 68
Retail 72
Product Manufacturer 71
Financial Services 69
Automotive 68
Content 65
Insurance 56
Utility 53
Telecom 46
FIgURE 1: CROSS-INDUSTRY BENCHMARKS, DESKTOP WEB CX

6 T H E F O R E S E E R E TA I L B E N C H M A R K R E P O R T – AU G U S T 2 0 1 6 W W W. F O R E S E E . C O M
TOUCHPOINT
Customers shopping in stores may look far more satisfied than customers shopping online, in mobile,
or interacting with retailers through a contact center. However, most of these surveys are aimed at
purchasers only, while the digital and contact center surveys are for web browsers. Purchasers are
naturally more satisfied than browsers, or they wouldn’t have purchased!
More useful is the comparison of digital channels, since they represent the experience of browsers
and provide a better apples-to-apples comparison. Mobile apps, mobile sites, and tablet sites all
consistently outperform desktop websites when comparing digital benchmarks. We know mobile is the
future in terms of usage; this data may partially explain customers’ willingness to shift. In addition to
convenience, they’re having a better experience.
Many retailers measure all these channels with ForeSee, and often find they outstrip the benchmark in
one channel while falling short in another.
CX Score
Store 87
Mobile App 81
Mobile Site 78
Contact Center 75
Tablet SIte 74
Desktop Web 72
FIgURE 2: RETAIL BENCHMARKS: BY TOUCHPOINT

7 T H E F O R E S E E R E TA I L B E N C H M A R K R E P O R T – AU G U S T 2 0 1 6 W W W. F O R E S E E . C O M
PRODUCT CATEgORY
The next way to look at benchmarks is by retail category. If the average CX score for retail websites
is 72, cosmetics retailers far exceed the average (82), as do food and beverage retailers (80) and shoe
retailers (79). Let’s say your desktop CX score is a 70. If you’re a food and beverage retailer, you’re in
trouble. Your competitors are going to eat your lunch. If you’re a mobile phone retailer with a CX score
of 70, you can just head to the bank — you are leaps and bounds ahead of the average in your industry.
The ForeSee team can share further insights about trends and challenges within specific retail
product categories.
CX Score
Average 72
Cosmetics 82
Food and Beverage 80
Shoes 79
Accessories 76
Health and Personal Care 76
Sporting, Outdoor and Fitness 76
Apparel - Women's 75
Gifts 75
Home Appliances/Housewares 75
Apparel 74
Specialty Retailers 72
Home Furnishings 71
Big Box Retailers 70
Mass Merchants 70
High SKU Count Stores 70
Department Stores 70
Mass Merchants - Brick and Mortar 69
Discount Stores 67
Hardware and Home Centers 63
Mobile Phones and Accessories 54
FIgURE 3: RETAIL DESKTOP BENCHMARKS: BY PRODUCT CATEgORIES

8 T H E F O R E S E E R E TA I L B E N C H M A R K R E P O R T – AU G U S T 2 0 1 6 W W W. F O R E S E E . C O M
TYPE OF RETAILER
How do you make most of your sales? Consumers rate pure plays and companies with a legacy of
catalogs and call centers with higher CX scores (both categories have an average CX of 79) than
they do direct manufacturers of durables (64). So as you’re evaluating your CX score, take into
consideration what kind of retailer you are.
CX Score
Average 72
Internet Pure Play 79
Catalog/Call Center/Other 79
Catalog Marketing 79
Manufacturer Direct (Non-Durable) 76
Manufacturer Direct 72
Multi-Channel 72
Brick and Mortar 71
Manufacturer Direct (Durables) 64
FIgURE 4: RETAIL DESKTOP BENCHMARKS: BY TYPE OF RETAILER

9 T H E F O R E S E E R E TA I L B E N C H M A R K R E P O R T – AU G U S T 2 0 1 6 W W W. F O R E S E E . C O M
CUSTOMER JOURNEY
Many retail clients measure at various points along the customer journey, including: pre-purchase,
during consideration (digital browse), during the online checkout process, post-purchase, and post-
fulfillment. Measuring each of these discrete steps in the journey can provide great insight. Measuring
the BOPIS experience is an area of huge growth recently for ForeSee clients.
CX scores for fulfillment surveys tend to do best (80), so if you are underperforming in this
benchmark there are real opportunities to examine your business to make sure your customers
will buy again. Online checkout experiences are also less stellar (64), indicating an area where an
innovative retailer has an opportunity to shine.
CX Score
Average 72
Fulfillment 80
Post-Purchase 76
Buy Online, PickUp In Store (BOPIS) 76
Digital Browse 72
Online Checkout 64
FIgURE 5: RETAIL BENCHMARKS: BY CUSTOMER JOURNEY
10 T H E F O R E S E E R E TA I L B E N C H M A R K R E P O R T – AU G U S T 2 0 1 6 W W W. F O R E S E E . C O M
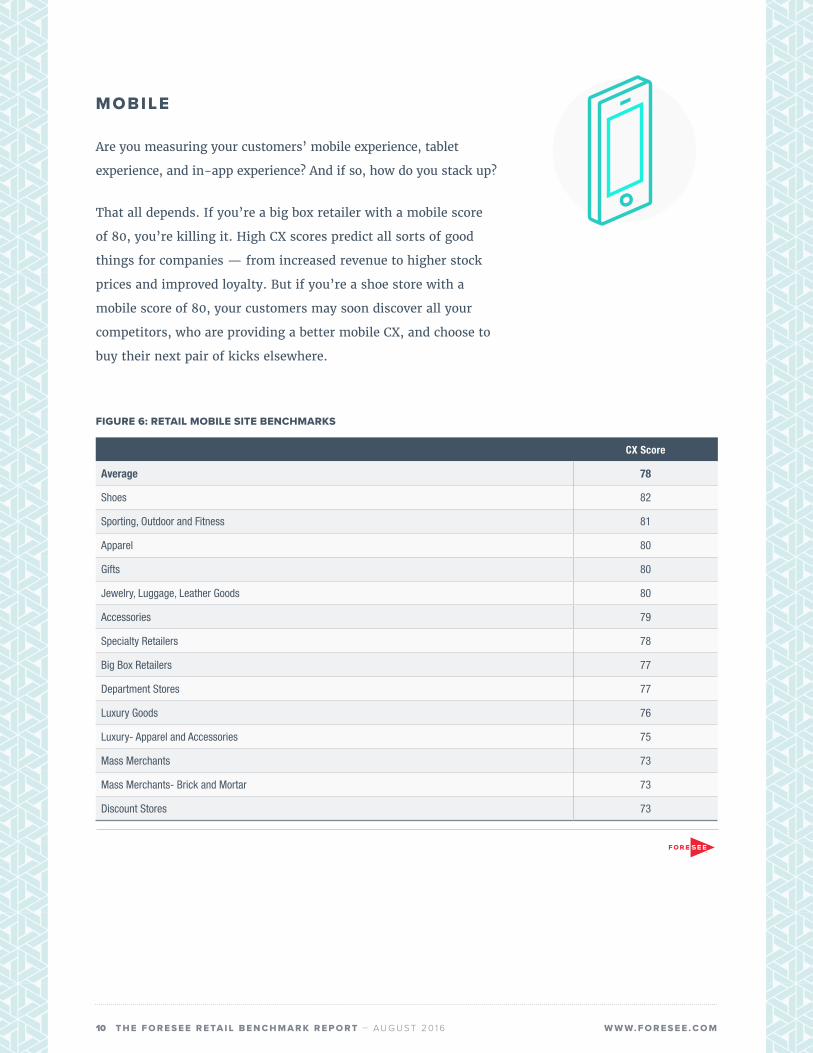
MOBILE
Are you measuring your customers’ mobile experience, tablet
experience, and in-app experience? And if so, how do you stack up?
That all depends. If you’re a big box retailer with a mobile score
of 80, you’re killing it. High CX scores predict all sorts of good
things for companies — from increased revenue to higher stock
prices and improved loyalty. But if you’re a shoe store with a
mobile score of 80, your customers may soon discover all your
competitors, who are providing a better mobile CX, and choose to
buy their next pair of kicks elsewhere.
CX Score
Average 78
Shoes 82
Sporting, Outdoor and Fitness 81
Apparel 80
Gifts 80
Jewelry, Luggage, Leather Goods 80
Accessories 79
Specialty Retailers 78
Big Box Retailers 77
Department Stores 77
Luxury Goods 76
Luxury- Apparel and Accessories 75
Mass Merchants 73
Mass Merchants- Brick and Mortar 73
Discount Stores 73
FIgURE 6: RETAIL MOBILE SITE BENCHMARKS

11 T H E F O R E S E E R E TA I L B E N C H M A R K R E P O R T – AU G U S T 2 0 1 6 W W W. F O R E S E E . C O M
Mobile experiences and audiences are different enough now that
most retailers find value in differentiating between mobile web and
tablet. Customers are more satisfied with mobile web experiences
than they are with tablet experiences in general, suggesting this
could be an area where an ambitious retailer could really stand out.
CX Score
Average 74
Apparel 77
Specialty Retailers 75
Department Stores 74
Big Box Retailers 73
Mass Merchants 70
Mass Merchants- Brick and Mortar 68
CX Score
Average 81
Specialty Retailers 82
Big Box Retailers 79
FIgURE 7: RETAIL TABLET SITE BENCHMARKS
FIgURE 8: RETAIL MOBILE APP BENCHMARKS
Finally: apps. More and more retailers provide apps for customers, and if you have one, you should be
measuring it. After all, if you don’t measure it you can’t manage it. Customer experience scores for
apps on average (81) actually outperform scores for mobile web (74) and tablet experiences (78). Build
that app!

12 T H E F O R E S E E R E TA I L B E N C H M A R K R E P O R T – AU G U S T 2 0 1 6 W W W. F O R E S E E . C O M
STORES
For many retailers, stores are still where the majority of sales take
place, even as web and mobile channels increase their influence on
what happens there. Therefore, the store channel is a critical place
to measure, understand, and improve the customer experience.
On average, CX is high (87) with shoe stores slightly edging out
apparel and specialty retail stores.
CX Score
Average Across All Retail Stores 87
Shoe Stores 89
Apparel Stores 88
Specialty Retailer Stores 87
FIgURE 9: RETAIL SCORE LOCATIONS
Contact ForeSee to learn which of our benchmarks can help illuminate where in your customer journey you shine and where you may need help.

13 T H E F O R E S E E R E TA I L B E N C H M A R K R E P O R T – AU G U S T 2 0 1 6 W W W. F O R E S E E . C O M
A B O U T F O R E S E E
ForeSee helps organizations keep their customers happy and loyal. ForeSee® CX Suite allows companies
to manage all of their customer experience needs from one place, capture the entire customer journey,
and prioritize their most critical CX issues. Clients include more than 2,000 companies worldwide
— in retail, government, financial services, and other industries — that have transformed their VOC
programs into a strategic business discipline that delivers economic impact. Only ForeSee offers a multi-
patented algorithmic approach to customer experience measurement, access to almost 200 million
benchmarked experiences, and actionable insights from a team of 200 expert analysts that give certainty
to CX improvements. Founded in 2001, ForeSee is headquartered in Ann Arbor, MI and has offices
in New York, San Francisco, Mountain View, St. Louis, Cleveland, Vancouver, and London. For more
information, visit www.foresee.com.
F S - 1 5 4 6 - 0 8 1 6