Embed Size (px)
Citation preview
FOREST
Forest cover includes all lands with a tree canopy of over 10 percent. The forest and tree cover of
the state as per the assessment in 2011 is 22456 sq. km, which is 11.46 percent of the
geographical area. This includes 4 percent of the tree cover and 7.46 percent of forest cover
(Forest Survey of India (FSI) 2011). Table 6 shows the distribution of forests and tree cover in
Gujarat. However, as per the data provided by the Directorate of Economics and Statistics, forest
land in Gujarat is 19130 sq. km. This study, in order to analyse regional variations of forests and
tree cover we have used data available in the reports of Forest Survey of India. Variation in
forest cover data of different agencies is due to different scale and resolution of surveys adopted.
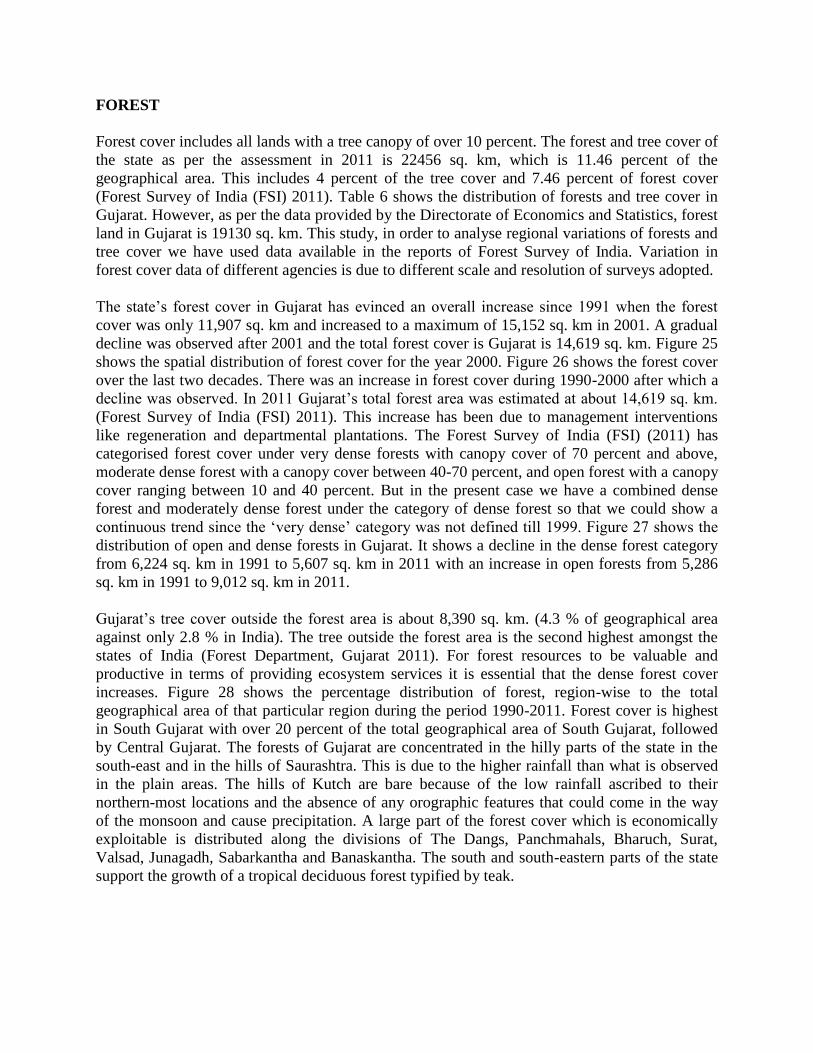
The state’s forest cover in Gujarat has evinced an overall increase since 1991 when the forest
cover was only 11,907 sq. km and increased to a maximum of 15,152 sq. km in 2001. A gradual
decline was observed after 2001 and the total forest cover is Gujarat is 14,619 sq. km. Figure 25
shows the spatial distribution of forest cover for the year 2000. Figure 26 shows the forest cover
over the last two decades. There was an increase in forest cover during 1990-2000 after which a
decline was observed. In 2011 Gujarat’s total forest area was estimated at about 14,619 sq. km.
(Forest Survey of India (FSI) 2011). This increase has been due to management interventions
like regeneration and departmental plantations. The Forest Survey of India (FSI) (2011) has
categorised forest cover under very dense forests with canopy cover of 70 percent and above,
moderate dense forest with a canopy cover between 40-70 percent, and open forest with a canopy
cover ranging between 10 and 40 percent. But in the present case we have a combined dense
forest and moderately dense forest under the category of dense forest so that we could show a
continuous trend since the ‘very dense’ category was not defined till 1999. Figure 27 shows the
distribution of open and dense forests in Gujarat. It shows a decline in the dense forest category
from 6,224 sq. km in 1991 to 5,607 sq. km in 2011 with an increase in open forests from 5,286
sq. km in 1991 to 9,012 sq. km in 2011.
Gujarat’s tree cover outside the forest area is about 8,390 sq. km. (4.3 % of geographical area
against only 2.8 % in India). The tree outside the forest area is the second highest amongst the
states of India (Forest Department, Gujarat 2011). For forest resources to be valuable and
productive in terms of providing ecosystem services it is essential that the dense forest cover
increases. Figure 28 shows the percentage distribution of forest, region-wise to the total
geographical area of that particular region during the period 1990-2011. Forest cover is highest
in South Gujarat with over 20 percent of the total geographical area of South Gujarat, followed
by Central Gujarat. The forests of Gujarat are concentrated in the hilly parts of the state in the
south-east and in the hills of Saurashtra. This is due to the higher rainfall than what is observed
in the plain areas. The hills of Kutch are bare because of the low rainfall ascribed to their
northern-most locations and the absence of any orographic features that could come in the way
of the monsoon and cause precipitation. A large part of the forest cover which is economically
exploitable is distributed along the divisions of The Dangs, Panchmahals, Bharuch, Surat,
Valsad, Junagadh, Sabarkantha and Banaskantha. The south and south-eastern parts of the state
support the growth of a tropical deciduous forest typified by teak.
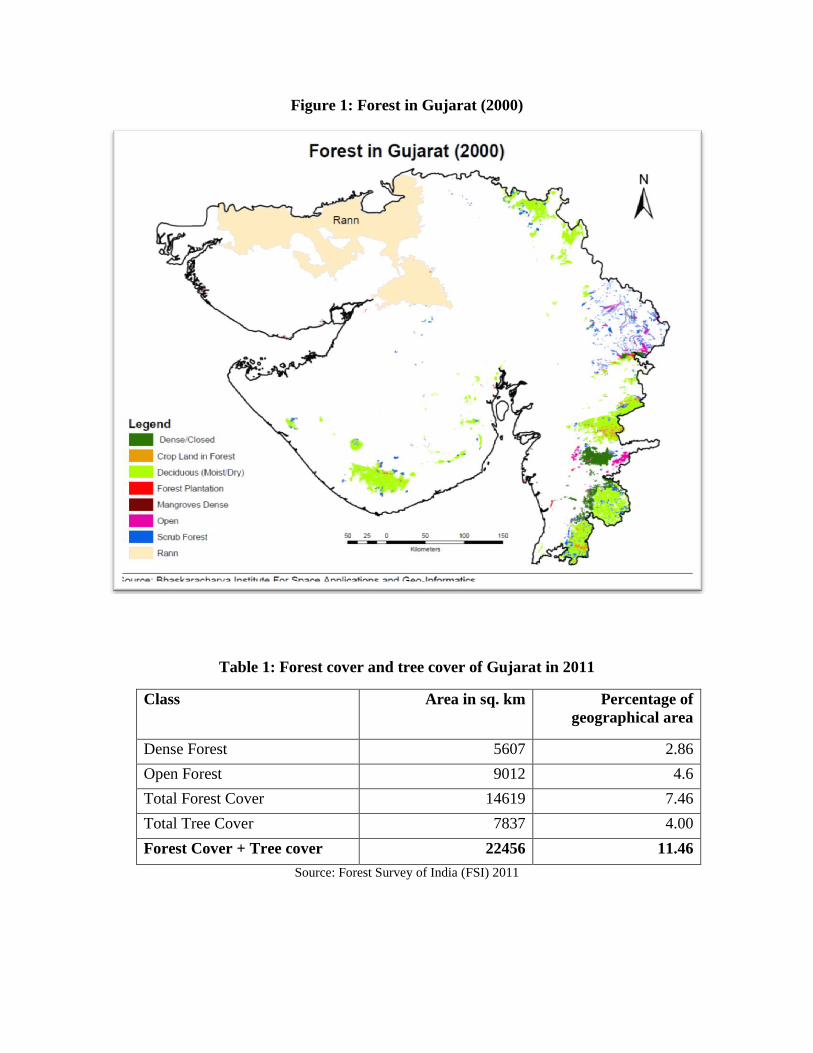
Figure 1: Forest in Gujarat (2000)
Table 1: Forest cover and tree cover of Gujarat in 2011
Class Area in sq. km Percentage of
geographical area
Dense Forest 5607 2.86
Open Forest 9012 4.6
Total Forest Cover 14619 7.46
Total Tree Cover 7837 4.00
Forest Cover + Tree cover 22456 11.46
Source: Forest Survey of India (FSI) 2011
Figure 2: Forest cover from 1991 to 2011
Source: Analysis based on data from; Forest Survey of India (FSI) (1991-2011)
Figure 3: Forest cover density in Gujarat from 1990 to 2011
Source: Analysis based on data from Forest Survey of India (FSI) (1991-2011)
0.00
1.00
2.00
3.00
4.00
5.00
6.00
7.00
8.00
9.00
1991 1993 1995 1997 1999 2001 2003 2005 2007 2011
Pe
rce
nta
ge t
o t
he
TG
A
Year
Forest Cover in Gujarat (1991-2011)
0.0
0.5
1.0
1.5
2.0
2.5
3.0
3.5
4.0
4.5
5.0
1991 1993 1995 1997 1999 2001 2003 2005 2007 2011
Pe
rce
nta
ge t
o t
he
TG
A
Years
Open and Dense Forest in Gujarat
Dense Forest
Open Forest
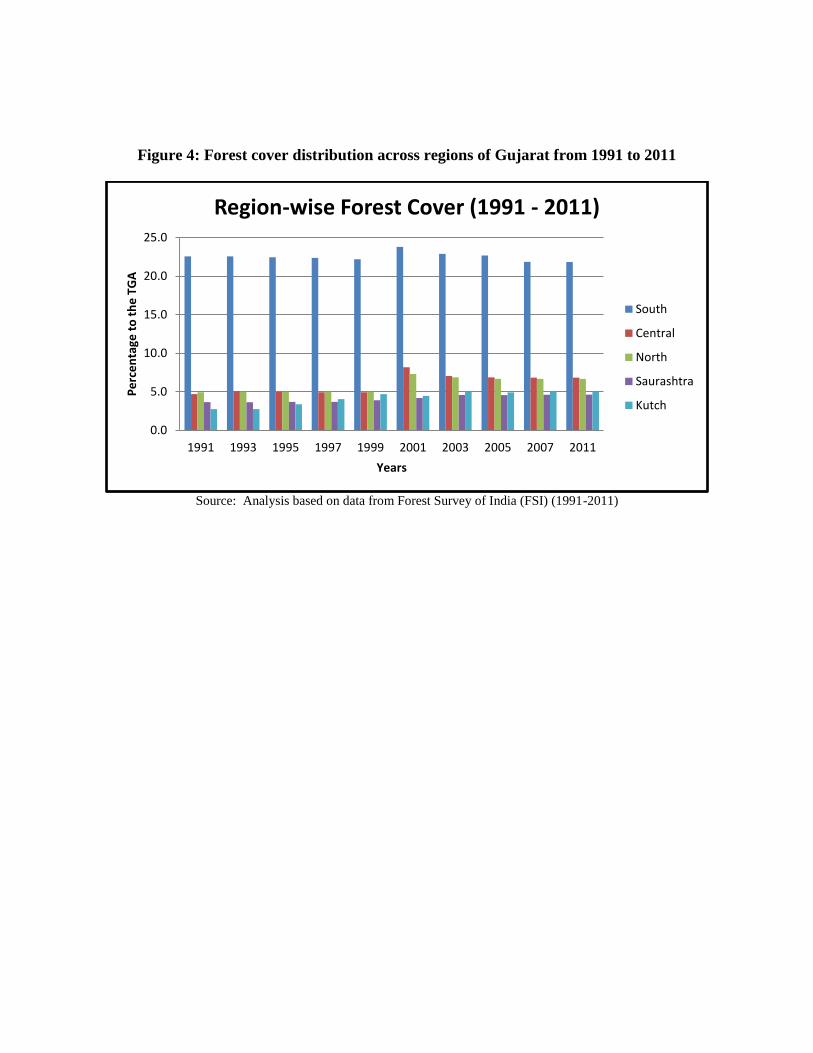
Figure 4: Forest cover distribution across regions of Gujarat from 1991 to 2011
Source: Analysis based on data from Forest Survey of India (FSI) (1991-2011)
0.0
5.0
10.0
15.0
20.0
25.0
1991 1993 1995 1997 1999 2001 2003 2005 2007 2011
Pe
rce
nta
ge t
o t
he
TG
A
Years
Region-wise Forest Cover (1991 - 2011)
South
Central
North
Saurashtra
Kutch
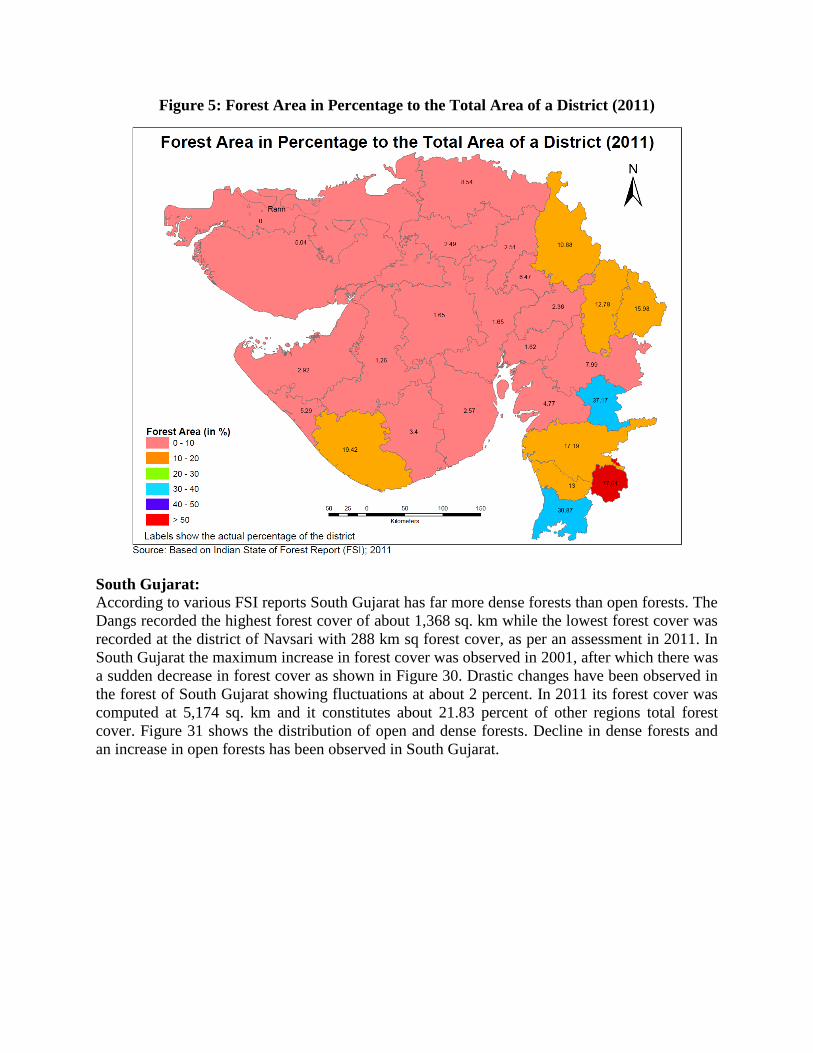
Figure 5: Forest Area in Percentage to the Total Area of a District (2011)
South Gujarat:
According to various FSI reports South Gujarat has far more dense forests than open forests. The
Dangs recorded the highest forest cover of about 1,368 sq. km while the lowest forest cover was
recorded at the district of Navsari with 288 km sq forest cover, as per an assessment in 2011. In
South Gujarat the maximum increase in forest cover was observed in 2001, after which there was
a sudden decrease in forest cover as shown in Figure 30. Drastic changes have been observed in
the forest of South Gujarat showing fluctuations at about 2 percent. In 2011 its forest cover was
computed at 5,174 sq. km and it constitutes about 21.83 percent of other regions total forest
cover. Figure 31 shows the distribution of open and dense forests. Decline in dense forests and
an increase in open forests has been observed in South Gujarat.
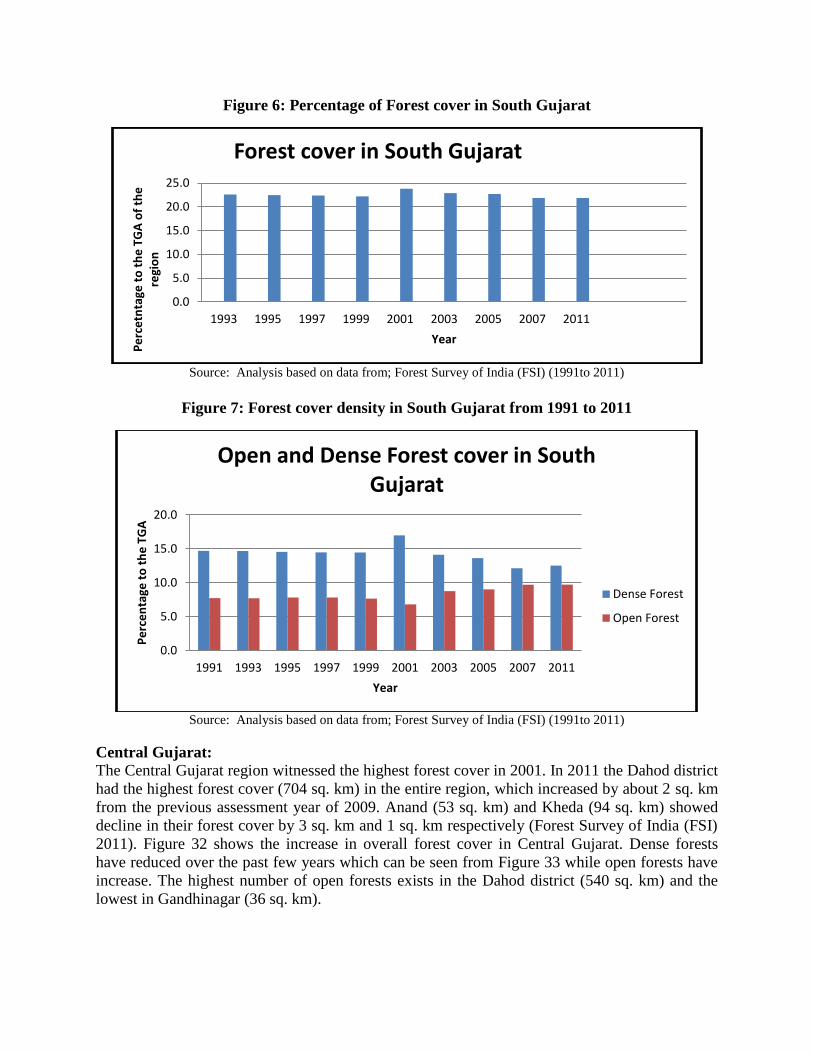
Figure 6: Percentage of Forest cover in South Gujarat
Source: Analysis based on data from; Forest Survey of India (FSI) (1991to 2011)
Figure 7: Forest cover density in South Gujarat from 1991 to 2011
Source: Analysis based on data from; Forest Survey of India (FSI) (1991to 2011)
Central Gujarat:
The Central Gujarat region witnessed the highest forest cover in 2001. In 2011 the Dahod district
had the highest forest cover (704 sq. km) in the entire region, which increased by about 2 sq. km
from the previous assessment year of 2009. Anand (53 sq. km) and Kheda (94 sq. km) showed
decline in their forest cover by 3 sq. km and 1 sq. km respectively (Forest Survey of India (FSI)
2011). Figure 32 shows the increase in overall forest cover in Central Gujarat. Dense forests
have reduced over the past few years which can be seen from Figure 33 while open forests have
increase. The highest number of open forests exists in the Dahod district (540 sq. km) and the
lowest in Gandhinagar (36 sq. km).
0.0
5.0
10.0
15.0
20.0
25.0
1993 1995 1997 1999 2001 2003 2005 2007 2011
Pe
rce
tnta
ge t
o t
he
TG
A o
f th
e
regi
on
Year
Forest cover in South Gujarat
0.0
5.0
10.0
15.0
20.0
1991 1993 1995 1997 1999 2001 2003 2005 2007 2011
Pe
rce
nta
ge t
o t
he
TG
A
Year
Open and Dense Forest cover in South Gujarat
Dense Forest
Open Forest
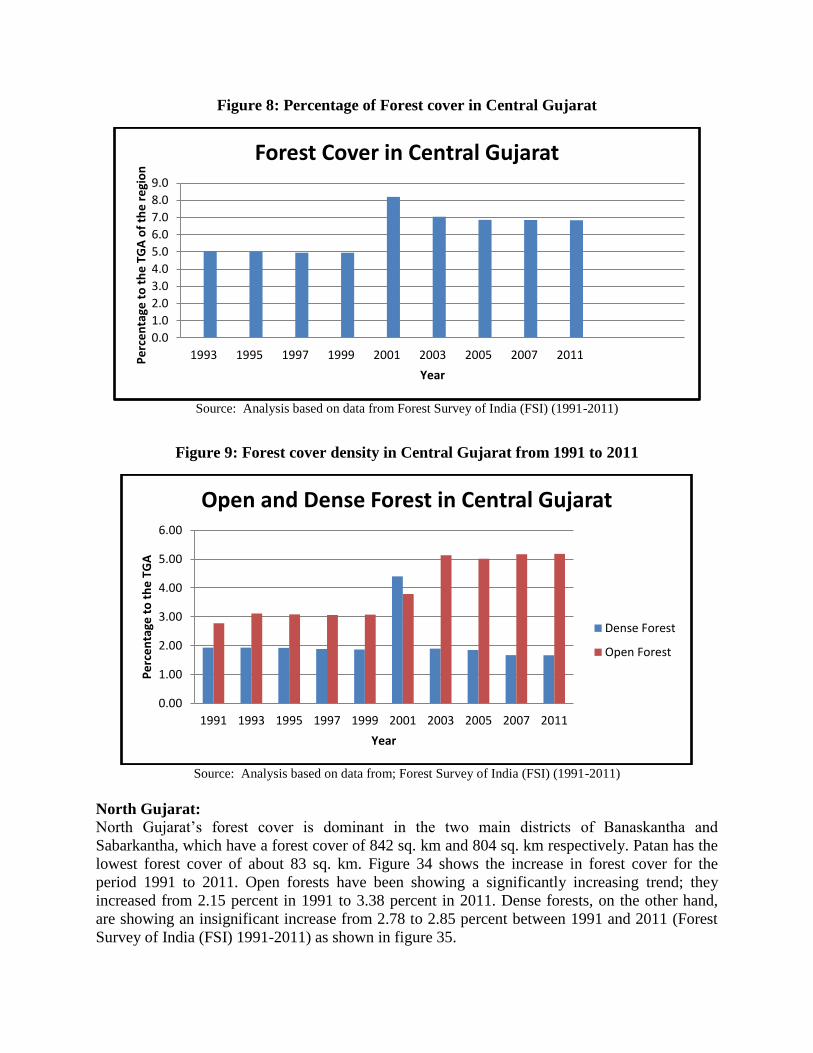
Figure 8: Percentage of Forest cover in Central Gujarat
Source: Analysis based on data from Forest Survey of India (FSI) (1991-2011)
Figure 9: Forest cover density in Central Gujarat from 1991 to 2011
Source: Analysis based on data from; Forest Survey of India (FSI) (1991-2011)
North Gujarat:
North Gujarat’s forest cover is dominant in the two main districts of Banaskantha and
Sabarkantha, which have a forest cover of 842 sq. km and 804 sq. km respectively. Patan has the
lowest forest cover of about 83 sq. km. Figure 34 shows the increase in forest cover for the
period 1991 to 2011. Open forests have been showing a significantly increasing trend; they
increased from 2.15 percent in 1991 to 3.38 percent in 2011. Dense forests, on the other hand,
are showing an insignificant increase from 2.78 to 2.85 percent between 1991 and 2011 (Forest
Survey of India (FSI) 1991-2011) as shown in figure 35.
0.0
1.0
2.0
3.0
4.0
5.0
6.0
7.0
8.0
9.0
1993 1995 1997 1999 2001 2003 2005 2007 2011Pe
rce
nta
ge t
o t
he
TG
A o
f th
e r
egi
on
Year
Forest Cover in Central Gujarat
0.00
1.00
2.00
3.00
4.00
5.00
6.00
1991 1993 1995 1997 1999 2001 2003 2005 2007 2011
Pe
rce
nta
ge t
o t
he
TG
A
Year
Open and Dense Forest in Central Gujarat
Dense Forest
Open Forest
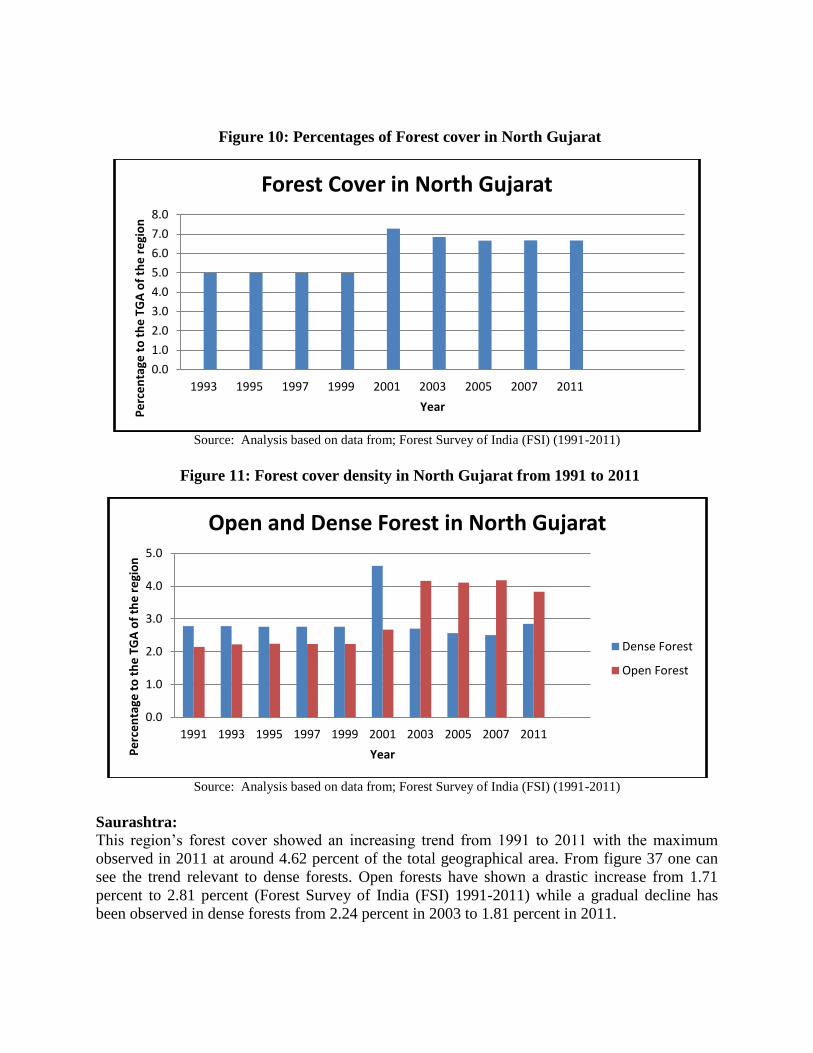
Figure 10: Percentages of Forest cover in North Gujarat
Source: Analysis based on data from; Forest Survey of India (FSI) (1991-2011)
Figure 11: Forest cover density in North Gujarat from 1991 to 2011
Source: Analysis based on data from; Forest Survey of India (FSI) (1991-2011)
Saurashtra:
This region’s forest cover showed an increasing trend from 1991 to 2011 with the maximum
observed in 2011 at around 4.62 percent of the total geographical area. From figure 37 one can
see the trend relevant to dense forests. Open forests have shown a drastic increase from 1.71
percent to 2.81 percent (Forest Survey of India (FSI) 1991-2011) while a gradual decline has
been observed in dense forests from 2.24 percent in 2003 to 1.81 percent in 2011.
0.0
1.0
2.0
3.0
4.0
5.0
6.0
7.0
8.0
1993 1995 1997 1999 2001 2003 2005 2007 2011
Pe
rce
nta
ge t
o t
he
TG
A o
f th
e r
egi
on
Year
Forest Cover in North Gujarat
0.0
1.0
2.0
3.0
4.0
5.0
1991 1993 1995 1997 1999 2001 2003 2005 2007 2011
Pe
rce
nta
ge t
o t
he
TG
A o
f th
e r
egi
on
Year
Open and Dense Forest in North Gujarat
Dense Forest
Open Forest
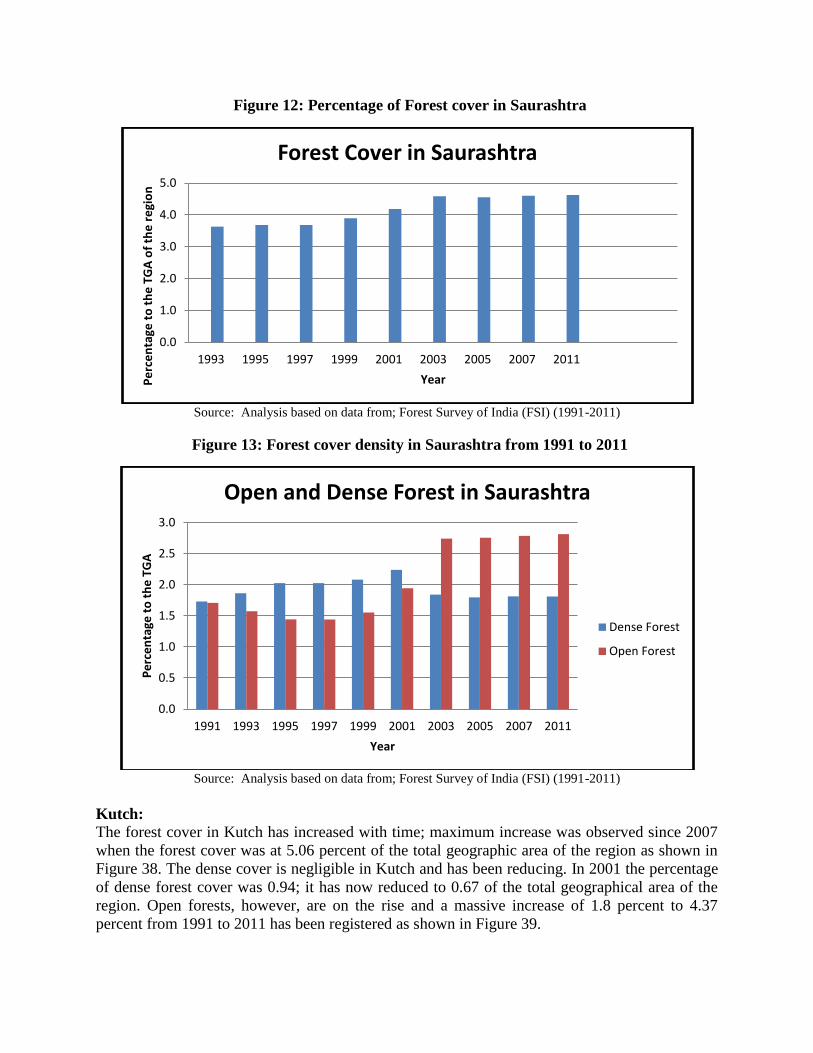
Figure 12: Percentage of Forest cover in Saurashtra
Source: Analysis based on data from; Forest Survey of India (FSI) (1991-2011)
Figure 13: Forest cover density in Saurashtra from 1991 to 2011
Source: Analysis based on data from; Forest Survey of India (FSI) (1991-2011)
Kutch:
The forest cover in Kutch has increased with time; maximum increase was observed since 2007
when the forest cover was at 5.06 percent of the total geographic area of the region as shown in
Figure 38. The dense cover is negligible in Kutch and has been reducing. In 2001 the percentage
of dense forest cover was 0.94; it has now reduced to 0.67 of the total geographical area of the
region. Open forests, however, are on the rise and a massive increase of 1.8 percent to 4.37
percent from 1991 to 2011 has been registered as shown in Figure 39.
0.0
1.0
2.0
3.0
4.0
5.0
1993 1995 1997 1999 2001 2003 2005 2007 2011
Pe
rce
nta
ge t
o t
he
TG
A o
f th
e r
egi
on
Year
Forest Cover in Saurashtra
0.0
0.5
1.0
1.5
2.0
2.5
3.0
1991 1993 1995 1997 1999 2001 2003 2005 2007 2011
Pe
rce
nta
ge t
o t
he
TG
A
Year
Open and Dense Forest in Saurashtra
Dense Forest
Open Forest
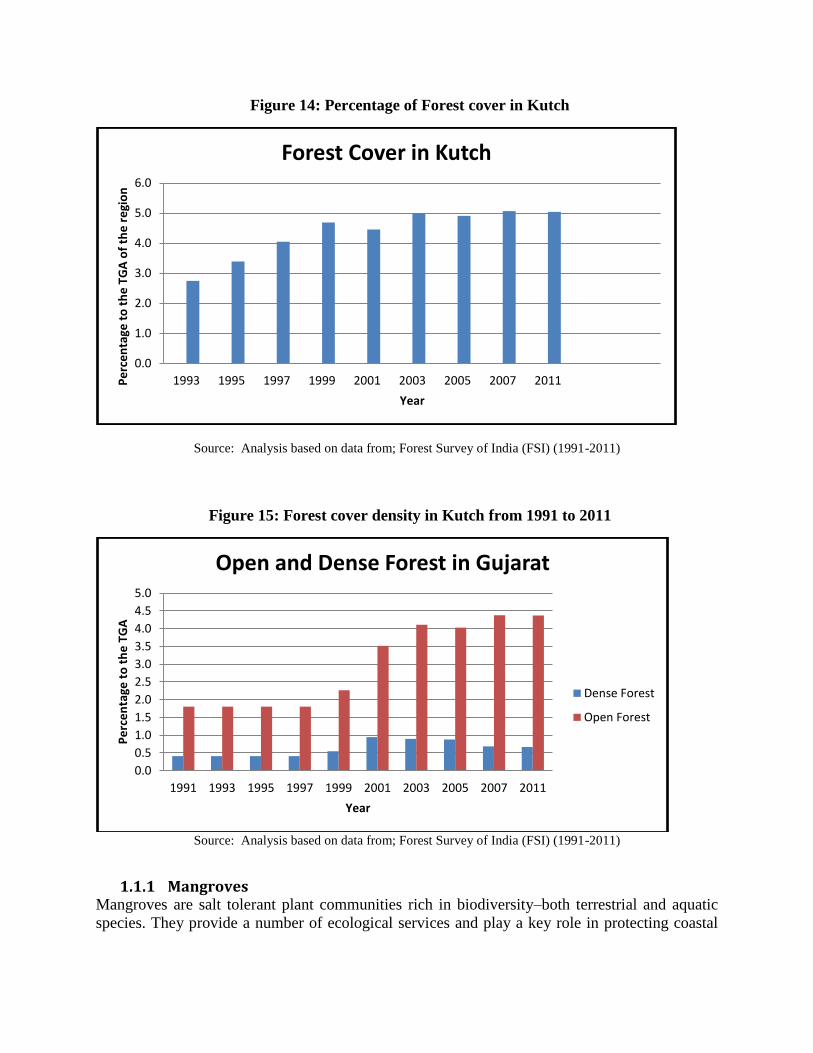
Figure 14: Percentage of Forest cover in Kutch
Source: Analysis based on data from; Forest Survey of India (FSI) (1991-2011)
Figure 15: Forest cover density in Kutch from 1991 to 2011
Source: Analysis based on data from; Forest Survey of India (FSI) (1991-2011)
1.1.1 Mangroves Mangroves are salt tolerant plant communities rich in biodiversity–both terrestrial and aquatic
species. They provide a number of ecological services and play a key role in protecting coastal
0.0
1.0
2.0
3.0
4.0
5.0
6.0
1993 1995 1997 1999 2001 2003 2005 2007 2011Pe
rce
nta
ge t
o t
he
TG
A o
f th
e r
egi
on
Year
Forest Cover in Kutch
0.0
0.5
1.0
1.5
2.0
2.5
3.0
3.5
4.0
4.5
5.0
1991 1993 1995 1997 1999 2001 2003 2005 2007 2011
Pe
rce
nta
ge t
o t
he
TG
A
Year
Open and Dense Forest in Gujarat
Dense Forest
Open Forest
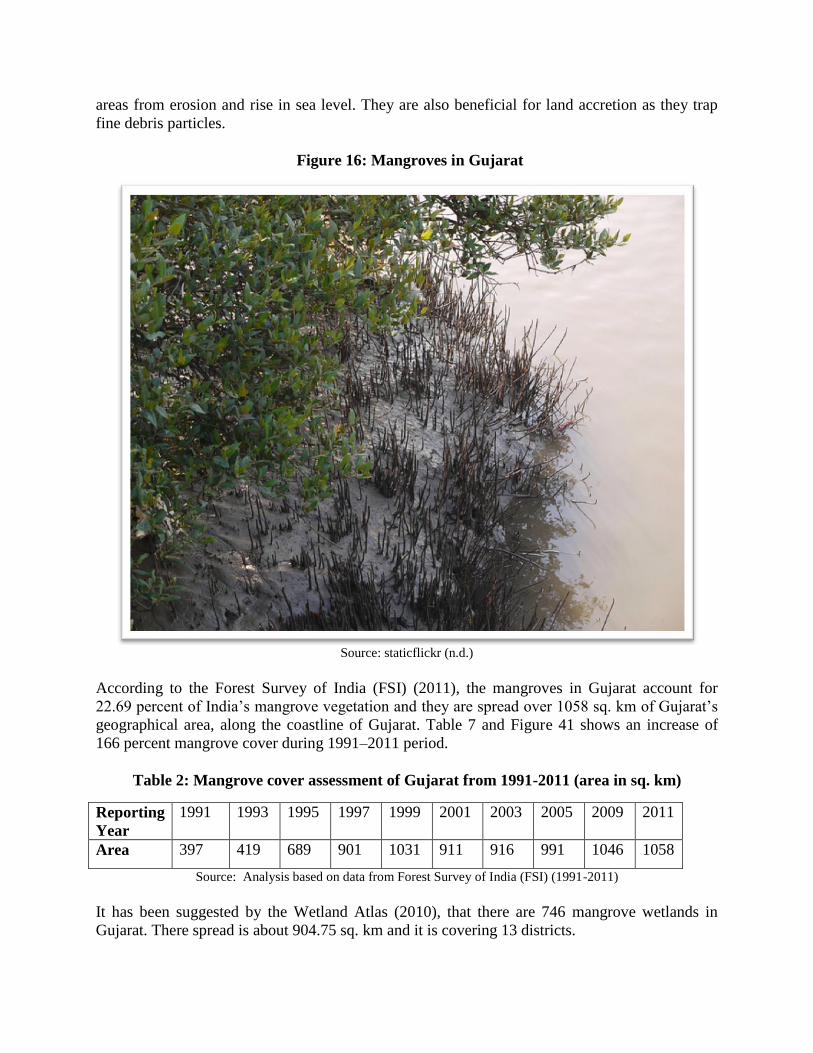
areas from erosion and rise in sea level. They are also beneficial for land accretion as they trap
fine debris particles.
Figure 16: Mangroves in Gujarat
Source: staticflickr (n.d.)
According to the Forest Survey of India (FSI) (2011), the mangroves in Gujarat account for
22.69 percent of India’s mangrove vegetation and they are spread over 1058 sq. km of Gujarat’s
geographical area, along the coastline of Gujarat. Table 7 and Figure 41 shows an increase of
166 percent mangrove cover during 1991–2011 period.
Table 2: Mangrove cover assessment of Gujarat from 1991-2011 (area in sq. km)
Reporting
Year
1991 1993 1995 1997 1999 2001 2003 2005 2009 2011
Area 397 419 689 901 1031 911 916 991 1046 1058
Source: Analysis based on data from Forest Survey of India (FSI) (1991-2011)
It has been suggested by the Wetland Atlas (2010), that there are 746 mangrove wetlands in
Gujarat. There spread is about 904.75 sq. km and it is covering 13 districts.
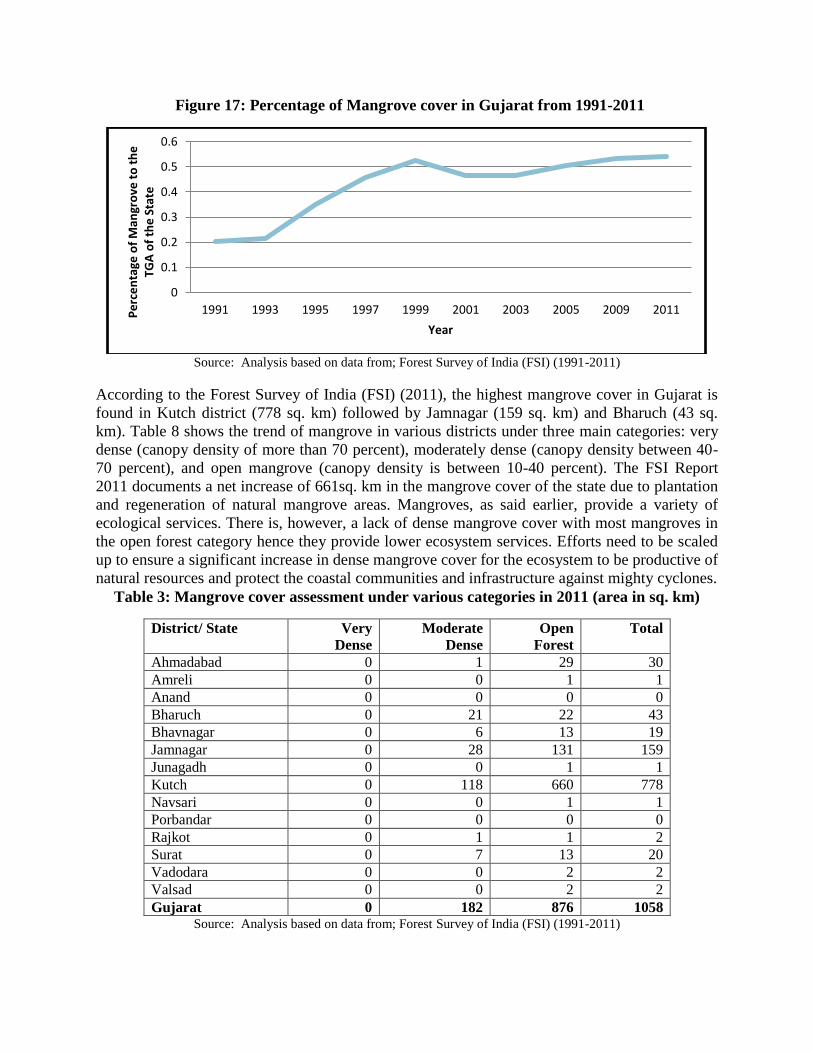
Figure 17: Percentage of Mangrove cover in Gujarat from 1991-2011
Source: Analysis based on data from; Forest Survey of India (FSI) (1991-2011)
According to the Forest Survey of India (FSI) (2011), the highest mangrove cover in Gujarat is
found in Kutch district (778 sq. km) followed by Jamnagar (159 sq. km) and Bharuch (43 sq.
km). Table 8 shows the trend of mangrove in various districts under three main categories: very
dense (canopy density of more than 70 percent), moderately dense (canopy density between 40-
70 percent), and open mangrove (canopy density is between 10-40 percent). The FSI Report
2011 documents a net increase of 661sq. km in the mangrove cover of the state due to plantation
and regeneration of natural mangrove areas. Mangroves, as said earlier, provide a variety of
ecological services. There is, however, a lack of dense mangrove cover with most mangroves in
the open forest category hence they provide lower ecosystem services. Efforts need to be scaled
up to ensure a significant increase in dense mangrove cover for the ecosystem to be productive of
natural resources and protect the coastal communities and infrastructure against mighty cyclones.
Table 3: Mangrove cover assessment under various categories in 2011 (area in sq. km)
District/ State Very
Dense
Moderate
Dense
Open
Forest
Total
Ahmadabad 0 1 29 30
Amreli 0 0 1 1
Anand 0 0 0 0
Bharuch 0 21 22 43
Bhavnagar 0 6 13 19
Jamnagar 0 28 131 159
Junagadh 0 0 1 1
Kutch 0 118 660 778
Navsari 0 0 1 1
Porbandar 0 0 0 0
Rajkot 0 1 1 2
Surat 0 7 13 20
Vadodara 0 0 2 2
Valsad 0 0 2 2
Gujarat 0 182 876 1058 Source: Analysis based on data from; Forest Survey of India (FSI) (1991-2011)
0
0.1
0.2
0.3
0.4
0.5
0.6
1991 1993 1995 1997 1999 2001 2003 2005 2009 2011Pe
rce
nta
ge o
f M
angr
ove
to
th
e
TGA
of
the
Sta
te
Year