Embed Size (px)
Citation preview

Forest Inventory and Monitoring Forest Inventory and Monitoring Forest Inventory and Monitoring Forest Inventory and Monitoring Program: Growth and Yield Program: Growth and Yield Program: Growth and Yield Program: Growth and Yield Standards and ProceduresStandards and ProceduresStandards and ProceduresStandards and Procedures
Chapter 1: Establishing Permanent Sample Plots in Natural Stands
Prepared by Ministry of Sustainable Resource Management
Terrestrial Information Branch for the
Resources Information Standards Committee
March 31, 2003
Version 1.0

© The Province of British Columbia Published by the Resources Information Standards Committee
National Library of Canada Cataloguing in Publication Data Main entry under title: Forest Inventory and Monitoring Program : Growth and Yield standards and procedures. “March 31, 2003” Contents: 1. Establishing permanent sample plots in natural stands -- 2. Remeasurement of permanent sample plots in natural stands -- 3. Remeasuring experimental plots in natural stands -- 4. Remeasurement of permanent sample plots in silviculturally treated stands -- Appendices. Also available on the Internet. ISBN 0-7726-4874-3 1. British Columbia. Forest Inventory and Monitoring Program. 2. Trees - Sampling - British Columbia – Methodology – Handbooks, manuals, etc. 3. Trees - Monitoring - British Columbia – Methodology – Handbooks, manuals, etc. 4. Trees – British Columbia – Growth. 5. Forest productivity – British Columbia. 6. Site index (Forestry) - British Columbia. I. British Columbia. Resources Information Standards Committee. II. British Columbia. Terrestrial Information Branch. III. British Columbia. Ministry of Forests. Growth and Yield Program. SD387.S86F76 2003 6 34.9 C2002-960246-7
Additional Copies of this publication can be purchased from:
Government Publication Services Phone: (250) 387-6409 or Toll free: 1-800-663-6105 Fax: (250) 387-1120 www.publications.gov.bc.ca
Digital Copies are available on the Internet at: http://srmwww.gov.bc.ca/risc

Chapter 1: Establishing PSPs in Natural Stands
March 31, 2003 i
Preface The standards and procedures described in this chapter of the Forest Inventory Manual (Volume 3 – Growth and Yield/ Decay and Volume) are based upon the Minimum Standards for the Establishment and Remeasurement of Permanent Sample Plots in British Columbia.
The latter publication was developed for the Forest Productivity Council (FPC) to recommend minimum standards for measurement of permanent sample plots for the purpose of measuring growth and estimating future yield. It was last revised in March 1999. See the following web-site for further information: http://srmwww.gov.bc.ca/forestproductivity/ .
With the inactivity of the FPC, the Ministry of Sustainable Resource Management (previously Ministry of Forests) continues to upgrade the Forest Inventory Manual in response to client needs. The chapter following reflects that updated methodology and supersedes the FPC Minimum Standards document. The Ministry of Sustainable Resource Management recommends that this methodology be followed for all establishments and remeasurements of permanent sample plots.


Chapter 1: Establishing PSPs in Natural Stands
March 31, 2003 iii
Acknowledgments The Government of British Columbia provides funding of the Resources Information Standards Committee work, including the preparation of this document. The Resources Information Standards Committee supports the effective, timely and integrated use of land and resource information for planning and decision making by developing and delivering focussed, cost-effective, common provincial standards and procedures for information collection, management and analysis. Representatives to the Committee and its Task Forces are drawn from the ministries and agencies of the Canadian and the British Columbia governments, including academic, industry and First Nations involvement.
The Resources Information Standards Committee evolved from the Resources Inventory Committee which received funding from the Canada-British Columbia Partnership Agreement of Forest Resource Development (FRDA II), the Corporate Resource Inventory Initiative (CRII) and by Forest Renewal BC (FRBC), and addressed concerns of the 1991 Forest Resources Commission.
For further information about the Resources Information Standards Committee, please access the RISC website at: http://srmwww.gov.bc.ca/risc/.


Chapter 1: Establishing PSPs in Natural Stands
March 31, 2003 v
Table of Contents Preface ........................................................................................................................................i
Acknowledgments ................................................................................................................... iii
Introduction................................................................................................................................1
Field Training ........................................................................................................................1
Selecting Natural Stands............................................................................................................3
Unsuitable Areas....................................................................................................................3
Locating and Marking Permanent Natural Samples ..................................................................5
Describing Access and Location of the Sample ....................................................................5
Choosing a Tie Point .............................................................................................................5
Running a Tie Line from the Tie Point..................................................................................5
Marking the Plot Centre.........................................................................................................6
Establishing Plots.......................................................................................................................7
Choosing the Plot Size...........................................................................................................7
Dense Young Stands..........................................................................................................7
Marking the Plot Circumference............................................................................................8
Dividing the Plot into Sectors................................................................................................8
Tagging Trees ........................................................................................................................8
Tagging by Sectors ............................................................................................................8 Attaching Tags to Trees.....................................................................................................9 Tagging Forked Trees........................................................................................................9 Measuring the Diameter of Trees Growing Together........................................................9 Tagging Unusual Live Trees .............................................................................................9
Establishing Sub-plots .............................................................................................................11
Choosing the Sub-plot Size .................................................................................................11
Dividing the Sub-plot into Sectors.......................................................................................11
Growth and Yield Standards and Procedures
vi March 31, 2003
Tagging Trees in the Sub-plot ............................................................................................. 11
What to Tag..................................................................................................................... 11 How to Tag...................................................................................................................... 12 Tagging Forked Trees in Sub-plots................................................................................. 12
Gathering Data About the Sample........................................................................................... 13
Measuring the Trees ............................................................................................................ 13
Abnormal trees ................................................................................................................ 13
Classifying Trees................................................................................................................. 13
Tree Classes .................................................................................................................... 14
Pathological Indicators........................................................................................................ 15
Dead Tree Attributes ........................................................................................................... 16
Assessing Damage Agents and Severity ............................................................................. 16
Assigning a Crown Class Code........................................................................................... 17
Estimating Live-crown Length............................................................................................ 17
Recording Stumps ............................................................................................................... 17
Determining the Stand Structure ......................................................................................... 18
Height Sample Trees ........................................................................................................... 18
Top Height ...................................................................................................................... 18 Selecting Sample Trees ................................................................................................... 19 Measuring Suppressed Trees with Flattened Tops.......................................................... 20 Measurement Consistency............................................................................................... 20 Age Sample Trees ........................................................................................................... 20
Estimating Other Plot Attributes ......................................................................................... 21
Estimating Crown Closure .............................................................................................. 21 Determining Elevation .................................................................................................... 21 Determining Aspect and Slope........................................................................................ 22 Determining Slope Position ............................................................................................ 22
Stem Mapping ......................................................................................................................... 23
Collecting Ecological Data...................................................................................................... 25
Quality Assurance ................................................................................................................... 27

Chapter 1: Establishing PSPs in Natural Stands
March 31, 2003 vii
Checking Sampling Crews ..............................................................................................27
Checking the Samples in the Office ................................................................................27
Inspecting the Samples ........................................................................................................27
Pre-field Inspection..........................................................................................................27 Field Inspection ...............................................................................................................28 Post-field Inspection ........................................................................................................29
Mapping Samples ....................................................................................................................31
Submitting the Samples ...........................................................................................................33


Chapter 1: Establishing PSPs in Natural Stands
March 31, 2003 1
Introduction Permanent Samples are established in natural stands to measure:
1. rates of growth,
2. mortality,
3. change in stand structure, and
4. stand development.
The data collected is used to develop growth and yield models, validate site index curves, and to provide a basis for further scientific studies.
Stands are selected for sampling by means of a detailed analysis of previous surveys by management unit. Natural samples should not be established in multi-layered stands except in forest districts where this type of stand structure is prominent.
For a list of measurement standards see the “Standard of Measurement for Permanent Samples” in Appendix 1.
Established samples must be classified ecologically according to Research Branch specifications.
Since permanent samples are cost intensive, protecting them is of the utmost importance. Using buffers, as illustrated in “Recommended Protection Buffers for Permanent Samples” Appendix 18, is recommended.
Field Training All personnel involved in establishing natural samples in the field should attend a short training course on field procedures. Next, crews should work under the direct guidance of senior personnel long enough to gain a full understanding of the different phases of the work and to become efficient at collecting field measurements.


Chapter 1: Establishing PSPs in Natural Stands
March 31, 2003 3
Selecting Natural Stands 1. Obtain the most recent forest cover maps and status maps and note the areas where you
might establish a natural sample.
2. Select stands that meet the following matrix cell stratification criteria: • biogeoclimatic ecosystem classification (BEC) zone; • species group; • age class; • site index class; • density class.
3. Collect the latest air photos of the areas.
4. Carry out field reconnaissance of the areas to ensure that: • the stands are relatively free of insects and disease; • the stands are relatively free of injury, such as animal damage, and windthrow; • the portions of the stands that will contain the plot and buffer are relatively
homogeneous in species composition, age, aspect, density and height.
5. Discard unsuitable areas.
6. Assign a number to the selected samples. Consult the provincial sample list, which enumerates samples consecutively by region and compartment. Assign the next number available within the compartment. Do not assign the sample a number already in use.
Further details on selecting strata are agreed to by the regional Inventory Officer and by the Growth and Yield Section of the Resources Inventory Branch.
For a list of equipment used in establishing plots in natural stands, see the “Equipment List for Permanent Sample Measurements” in Appendix 4.
Unsuitable Areas In even-aged forests, examples of unsuitable areas are:
1. stands containing more than fifty veterans per hectare;
2. stands that are too small to accommodate the plot and buffer;
3. stands that may be too old for at least three remeasurements.
In all-aged or residual forests, examples of unsuitable areas are:
1. stands too small to accommodate a sample and buffer.
2. stands in which site and species composition vary extremely.

Chapter 1: Establishing PSPs in Natural Stands
March 31, 2003 5
Locating and Marking Permanent Natural Samples
Describing Access and Location of the Sample For the benefit of future remeasurement crews, describe in detail how to get to the sample, and where it is located.
1. Start from an easily identifiable landmark that won't change during the ten years between measurements. Examples: a bridge crossing, a main road junction.
2. From the starting point, travel to the sample. En route, note the distances to road junctions, creek crossings, or other prominent features.
3. Describe the tie point. See “Choosing a Tie Point” in this chapter.
4. Describe the species, diameter and location of the tie tree. See “Choosing a Tie Point” in this chapter.
Choosing a Tie Point 1. Choose a tie point, or reference point. The tie point should be a permanent topographic
feature distinguishable on air photos and on the ground. Examples: a road junction, a bend in the road, a creek junction, a road crossing, a creek.
2. Choose the tree closest to the tie point. This is your tie tree. Paint both sides of the tree approximately 2 m above the ground in the direction of the tie line.
3. Nail aluminum markers over the paint. The aluminum plot markers are designed to be used in all the growth and yield programs. Each marker is divided into three sections. See “Tie Point and Plot Centre Aluminum Markers” in Appendix 5.
4. Inscribe the following information in the middle and bottom sections of the markers: • the sample type (G for natural stands); • the sample number; • the plot number (always 1); • the region number; • the compartment number; • the bearing and distance to the plot; • the date the sample was established.
5. Mark the tie tree with two strands of plastic flagging tape, one above and one below the aluminum markers.
6. Prepare a sketch showing the tie point, sample location, and other significant topographic features, and attach it to the access notes.
Running a Tie Line from the Tie Point Run the tie line from the tie point to the plot centre using a hand compass, a Suunto clinometer and a measuring tape.

Growth and Yield Standards and Procedures
6 March 31, 2003
1. On a set bearing, locate the boundary of the plot. • The plot boundary must be at least 50 m from the edge of the forest type represented
by the plot. The exception is if the field officer does a written justification for decreasing the distance. Under no circumstances can this distance be less than the average height of the plot. This is the buffer.
2. Follow the bearing set on the hand compass for the required horizontal distance.
3. Measure the slope with the clinometer and make the required correction for horizontal distance.
4. Mark each side of the trees along the tie line with paint. As well, flag the tie line often enough to be readily followed.
Marking the Plot Centre 1. Mark the plot centre with a one-metre tubular aluminum stake, driven into the ground for
at least half its length. This is the plot centre stake.
2. Build a cairn around the base of the stake to support it firmly.
3. For plots that will not be stem mapped, select three trees around the plot centre, and record the bearing, slope and distance from the plot centre stake to the centre of each tree. Place a nail at the centre of each tree for consistency in measuring distance to the centre stake. This will help future measurement crews locate the position of a centre stake that has been pulled out.
4. Choose a large living tree close to the plot centre stake. This is the plot centre tree.
5. Nail two aluminum plot markers, in the direction of the tie line, to the plot centre tree about 2 m above the ground.
6. Record the following information in the top section of each aluminum marker: • sample type (G); • sample number; • plot number (always 1).
7. Record the following information in the bottom section of each aluminum marker: • region number; • compartment number; • date the sample was established.
8. If the plot centre is also the tie point for the next sample, fill out the middle section of the aluminum marker.
9. Flag the plot centre tree with two strands of flagging tape, one above and one below the aluminum markers.
Chapter 1: Establishing PSPs in Natural Stands
March 31, 2003 7
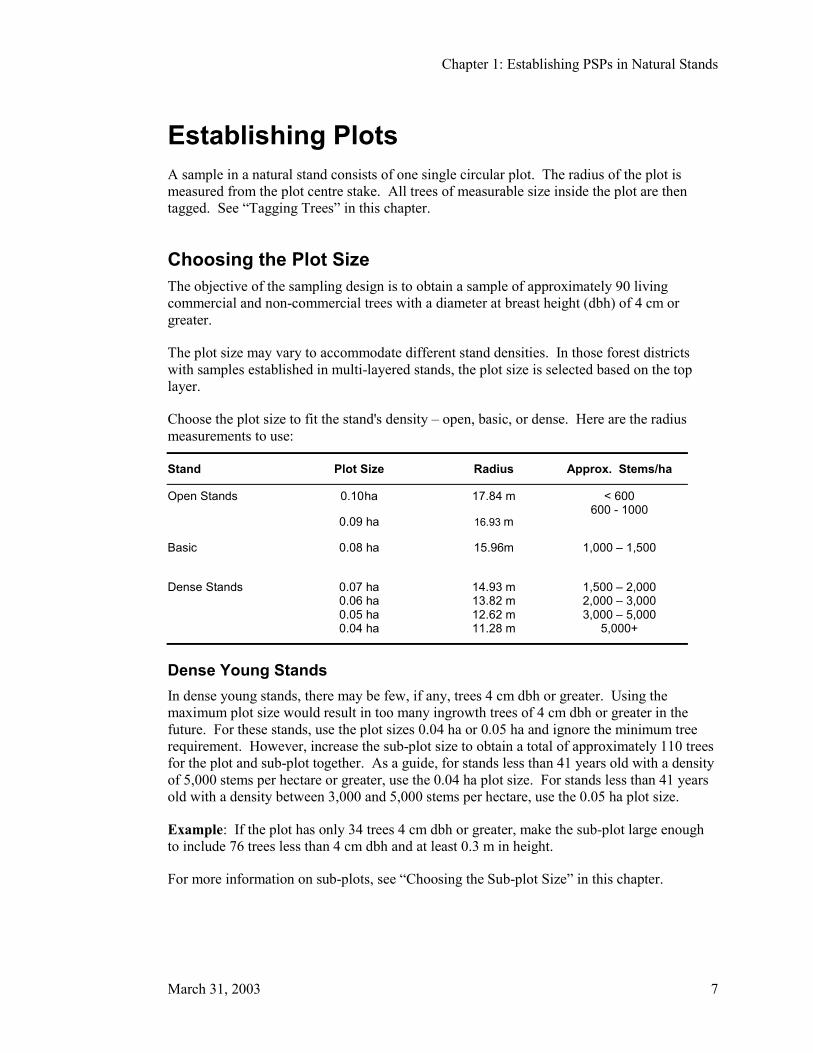
Establishing Plots A sample in a natural stand consists of one single circular plot. The radius of the plot is measured from the plot centre stake. All trees of measurable size inside the plot are then tagged. See “Tagging Trees” in this chapter.
Choosing the Plot Size The objective of the sampling design is to obtain a sample of approximately 90 living commercial and non-commercial trees with a diameter at breast height (dbh) of 4 cm or greater.
The plot size may vary to accommodate different stand densities. In those forest districts with samples established in multi-layered stands, the plot size is selected based on the top layer.
Choose the plot size to fit the stand's density – open, basic, or dense. Here are the radius measurements to use:
Stand Plot Size Radius Approx. Stems/ha
Open Stands 0.10 ha
0.09 ha
17.84 m
16.93 m
< 600 600 - 1000
Basic 0.08 ha
15.96m
1,000 – 1,500
Dense Stands 0.07 ha 0.06 ha 0.05 ha 0.04 ha
14.93 m 13.82 m 12.62 m 11.28 m
1,500 – 2,000 2,000 – 3,000 3,000 – 5,000
5,000+
Dense Young Stands In dense young stands, there may be few, if any, trees 4 cm dbh or greater. Using the maximum plot size would result in too many ingrowth trees of 4 cm dbh or greater in the future. For these stands, use the plot sizes 0.04 ha or 0.05 ha and ignore the minimum tree requirement. However, increase the sub-plot size to obtain a total of approximately 110 trees for the plot and sub-plot together. As a guide, for stands less than 41 years old with a density of 5,000 stems per hectare or greater, use the 0.04 ha plot size. For stands less than 41 years old with a density between 3,000 and 5,000 stems per hectare, use the 0.05 ha plot size.
Example: If the plot has only 34 trees 4 cm dbh or greater, make the sub-plot large enough to include 76 trees less than 4 cm dbh and at least 0.3 m in height.
For more information on sub-plots, see “Choosing the Sub-plot Size” in this chapter.

Growth and Yield Standards and Procedures
8 March 31, 2003
Marking the Plot Circumference 1. Using a plot tape, measure the chosen plot radius from the plot centre stake.
• On level terrain, hold the tape horizontally; • On sloping terrain, hold the tape parallel to the slope, measure the slope with the
clinometer using the percent scale, and apply a slope correction to the radius. See “Plot and Sub-plot Radii Slope Allowance for Natural Stands Samples” in Appendix 6.
2. Measure the plot radius a minimum of eight directions and mark the circumference with plot string.
3. Check trees close to the circumference with the plot tape. These trees are called line trees. Include line trees in the plot when at least half their base is inside the plot.
Dividing the Plot into Sectors Divide the plot into pie-shaped, 0.01 ha sectors. These are the tagging and site sectors. For ease of tagging dense plots with areas of 0.04 and 0.05 ha, divide the plot into 0.005 ha tagging sectors but combine them into pairs in order to have 0.01 site sectors. This procedure is needed to choose the correct number of site trees later.
Sector 1, in both cases, is always the first sector clockwise from north.
Tagging Trees Once you divide the plot into sectors, tag all commercial and non-commercial trees that have a dbh of 4.0 cm and greater for living trees and 10.0 cm and greater for dead standing trees. Use round, blue plastic tags with white numbers from 1 to 300. Do not duplicate tag numbers in a plot.
Tagging by Sectors 1. Start with sector 1. In this sector, affix the tags so that they face the plot centre.
2. Tag the trees near the plot centre first; then continue tagging outward by moving side-to-side across the pie-shaped sector.
3. As you reach the circumference of sector 1, make the last sideways pass in the direction of sector 2 so that the last tree tagged in sector 1 is, as near as possible to the first tree you will tag in sector 2.
4. Begin tagging sector 2. In this sector, affix the tags so that they face the circumference, not the plot centre as in sector 1.
5. Tag the trees near the circumference first, then continue tagging inward by moving side-to-side across the pie-shaped sector.
6. Make sure the last tree you tag in this sector is the one closest to the plot centre.
7. Repeat the procedures used in sectors 1 and 2 for the remaining sectors. Remember that tags in odd-numbered sectors face the plot centre while those in even-numbered sectors face the circumference.
Chapter 1: Establishing PSPs in Natural Stands
March 31, 2003 9
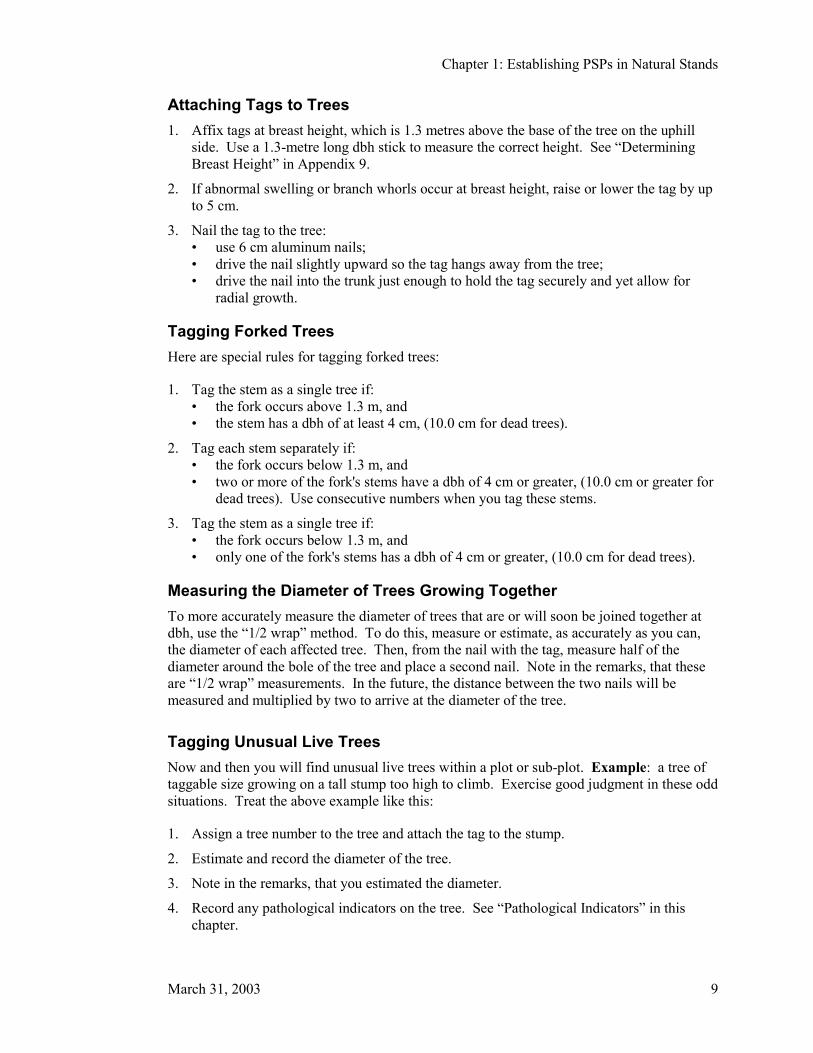
Attaching Tags to Trees 1. Affix tags at breast height, which is 1.3 metres above the base of the tree on the uphill
side. Use a 1.3-metre long dbh stick to measure the correct height. See “Determining Breast Height” in Appendix 9.
2. If abnormal swelling or branch whorls occur at breast height, raise or lower the tag by up to 5 cm.
3. Nail the tag to the tree: • use 6 cm aluminum nails; • drive the nail slightly upward so the tag hangs away from the tree; • drive the nail into the trunk just enough to hold the tag securely and yet allow for
radial growth.
Tagging Forked Trees Here are special rules for tagging forked trees:
1. Tag the stem as a single tree if: • the fork occurs above 1.3 m, and • the stem has a dbh of at least 4 cm, (10.0 cm for dead trees).
2. Tag each stem separately if: • the fork occurs below 1.3 m, and • two or more of the fork's stems have a dbh of 4 cm or greater, (10.0 cm or greater for
dead trees). Use consecutive numbers when you tag these stems.
3. Tag the stem as a single tree if: • the fork occurs below 1.3 m, and • only one of the fork's stems has a dbh of 4 cm or greater, (10.0 cm for dead trees).
Measuring the Diameter of Trees Growing Together To more accurately measure the diameter of trees that are or will soon be joined together at dbh, use the “1/2 wrap” method. To do this, measure or estimate, as accurately as you can, the diameter of each affected tree. Then, from the nail with the tag, measure half of the diameter around the bole of the tree and place a second nail. Note in the remarks, that these are “1/2 wrap” measurements. In the future, the distance between the two nails will be measured and multiplied by two to arrive at the diameter of the tree.
Tagging Unusual Live Trees Now and then you will find unusual live trees within a plot or sub-plot. Example: a tree of taggable size growing on a tall stump too high to climb. Exercise good judgment in these odd situations. Treat the above example like this:
1. Assign a tree number to the tree and attach the tag to the stump.
2. Estimate and record the diameter of the tree.
3. Note in the remarks, that you estimated the diameter.
4. Record any pathological indicators on the tree. See “Pathological Indicators” in this chapter.


Chapter 1: Establishing PSPs in Natural Stands
March 31, 2003 11
Establishing Sub-plots We establish sub-plots within a given plot to get some representation of trees smaller than the plot tagging limit, that is, trees less than 4 cm dbh. The objective is to obtain a sample of approximately 20 trees of commercial species that are less than 4 cm dbh and at least 0.3 m high.
Choosing the Sub-plot Size Like the sample, the sub-sample consists of one circular sub-plot. Like the plot, the size of the sub-plot depends on the stand's density. The minimum acceptable size is 0.002 ha and the maximum is the plot size.
Choose the sub-plot size that will produce the desired number of trees. For a list of sub-plot sizes and radii, see Appendix 6.
Using the procedure described in “Marking the Plot Circumference” in this chapter, mark the sub-plot circumference with string.
Dividing the Sub-plot into Sectors For the sub-plot, use the same sector divisions you laid out for the main plot.
Tagging Trees in the Sub-plot
What to Tag Tag with nails all living trees of commercial species between 2 cm dbh and 3.9 cm dbh. For procedures, see “Tagging Trees” in this chapter.
For trees of commercial species less than 2 cm dbh:
1. Count them in a dot tally.
2. Derive their dbh classes (see table below).
3. Record them by species and dbh class.

Growth and Yield Standards and Procedures
12 March 31, 2003
Metric Dbh Classes and Limits
dbh class Limits
0 0.3 m to 1.3 m high
1 0.1 cm to 1.9 cm dbh
How to Tag Use the procedure described in Tagging by Sectors.
Tagging Forked Trees in Sub-plots Here are special rules for tagging forked trees with a dbh of between 2 cm and 3.9 cm:
1. Tag the stem as a single tree if the fork occurs above 1.3 m.
2. Tag each stem separately if: • the fork occurs below 1.3 m, and • two or more of the forked stems have a dbh of 2 cm or greater.
3. Tag the stem as a single tree if:
• the fork occurs below 1.3 m, and • only one of the forks’ stems is 2.0 cm or greater.
Give special attention to the method of counting forked trees with stems less than 2 cm dbh. Certain trees have numerous leaders, which are the topmost shoots of a main stem. To avoid counting them all, count only the tallest leader. This rule only applies if the main leader is less than 2 cm dbh.

Chapter 1: Establishing PSPs in Natural Stands
March 31, 2003 13
Gathering Data About the Sample For each tagged tree, gather and record the following information:
• the tree number; • the species; • the tagging sector number; • the site sector number; • the dbh (must be >10.0 cm for dead trees); • the tree class; • pathological indicators or dead tree attributes; • the crown class (living trees only); • suitability for height measurement, (Y)es, (N)o, (C)ould be, (F)lagged, (V)ery difficult to
measure, (E)asy to measure; • the live-crown length (living trees only); • damage agent codes, if applicable.
The data must be captured digitally in the field with an Electronic Field Recorder (EFR) using Gyhost/Gyhand software (see “Gyhost/Gyhand: A Data Collecting, Editing and Reporting System” on the Ministry’s Web Page). In case of emergency (i.e. EFR breaks down) the data may be collected on field sheets and then later entered into the Gyhost/Gyhand system. For information on how to fill out the field sheets, see “Completing the Field Sheets” in Appendix 16. See Appendix 19 for a copy of the “Growth Sample Record Sheet”.
Measuring the Trees For tagged trees in the sample with a dbh of 2 cm or more, measure the diameter just above the nail to the nearest millimetre. Make sure the diameter tape is perpendicular to the bole of the tree, and is pulled tight. See Appendix 9.
Abnormal trees For abnormal trees less than 2 cm dbh within the sub-plot, special measurement rules apply. See Appendix 10.
Classifying Trees Classify each tagged tree according to its pathological indicators.
To classify a tree properly, view it from all sides. The person measuring dbh should move far enough away from the tree to be able to classify the lower third of the stem. The recorder should move around the tree to classify the upper two thirds.
Growth and Yield Standards and Procedures
14 March 31, 2003
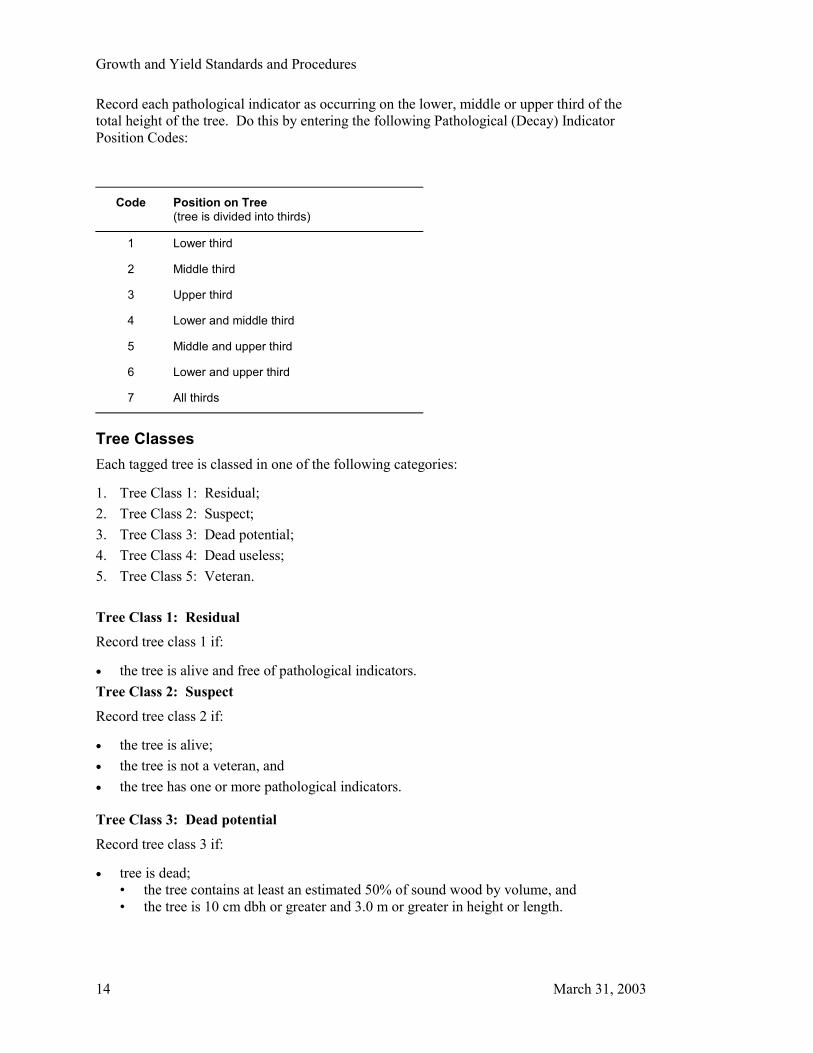
Record each pathological indicator as occurring on the lower, middle or upper third of the total height of the tree. Do this by entering the following Pathological (Decay) Indicator Position Codes:
Code Position on Tree (tree is divided into thirds)
1 Lower third
2 Middle third
3 Upper third
4 Lower and middle third
5 Middle and upper third
6 Lower and upper third
7 All thirds
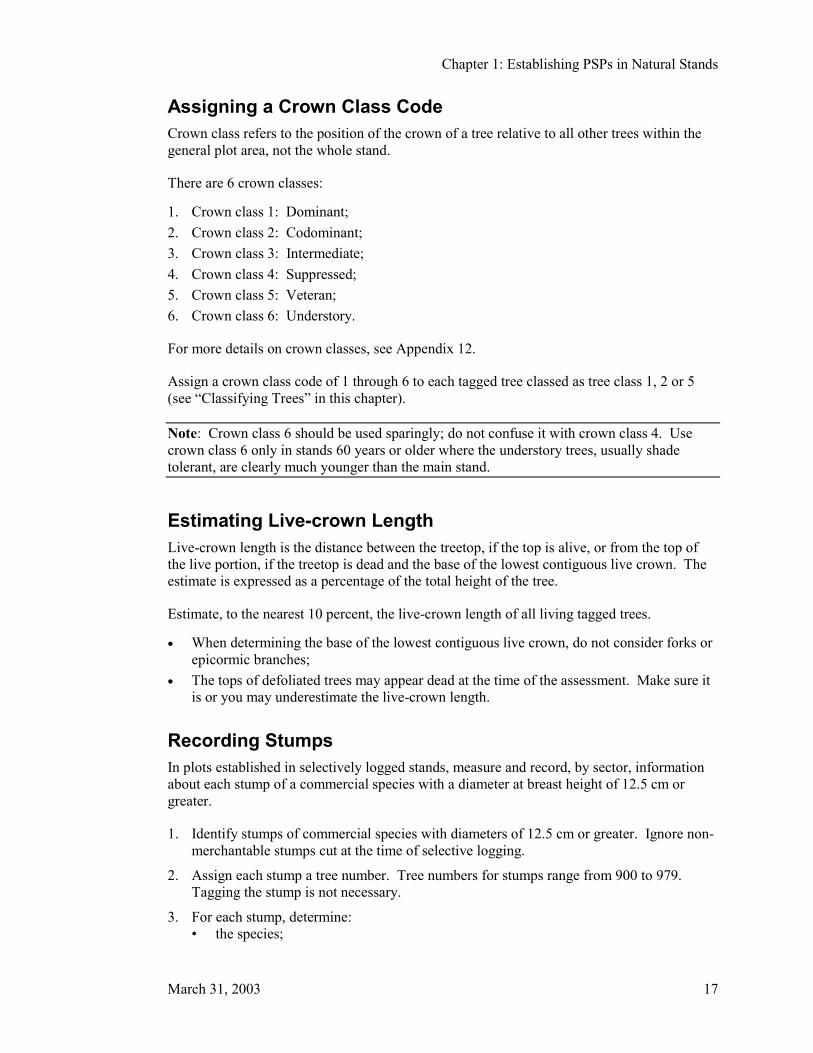
Tree Classes Each tagged tree is classed in one of the following categories:
1. Tree Class 1: Residual; 2. Tree Class 2: Suspect; 3. Tree Class 3: Dead potential; 4. Tree Class 4: Dead useless; 5. Tree Class 5: Veteran.
Tree Class 1: Residual Record tree class 1 if:
• the tree is alive and free of pathological indicators. Tree Class 2: Suspect
Record tree class 2 if:
• the tree is alive; • the tree is not a veteran, and • the tree has one or more pathological indicators.
Tree Class 3: Dead potential
Record tree class 3 if:
• tree is dead; • the tree contains at least an estimated 50% of sound wood by volume, and • the tree is 10 cm dbh or greater and 3.0 m or greater in height or length.

Chapter 1: Establishing PSPs in Natural Stands
March 31, 2003 15
Tree Class 4: Dead useless Record tree class 4 if:
• the tree is dead, and • the tree is not potentially useful. See Tree Class 3.
Tree Class 5: Veteran In simple stands, record tree class 5 if:
• a tree is at least 40 years older than the mean age of the main stand, and • the veteran component has an estimated crown closure of less than 6% for the sample.
In complex stands, a tree is considered a veteran only when:
• it is a remnant of a much older stand; • it is at least 100 years older than the mean age of the main stand, and • it has a much larger diameter than the other trees in the stand. This criterion is necessary
because of the subjectivity involved in determining what constitutes the main stand owing to the wide range of ages possible in it.
Veterans are not recognized in stands 121 years or older, except in lodgepole pine stands, which may have a veteran component of Douglas fir or larch.
Record pathological indicators for veteran trees the same way as for other trees.
Pathological Indicators The indicators of decay (pathological indicators) are:
Fork or Crook is the result of damage to the main leader.
Scar must be weathered and may be open or closed.
Frost Crack may resemble a scar but always follows the grain.
Dead Top is a dead leader on a living tree.
Broken Top (record height to break, to nearest metre) is a broken leader.
Conk is the fruiting body of decay fungi.
Mistletoe is a parasitic flowering plant.
Blind Conk is pronounced swelling or depression around knots.
Rotten branch obviously decayed large branches with a DIB of over 10 cm.
See Appendix 11 for definitions and illustrations of these pathological indicators.

Growth and Yield Standards and Procedures
16 March 31, 2003
The following abnormalities are not pathological indicators:
• butt rot; • candelabra branch; • sweep; • flute; • branch fan; • exposed root; • dry side; • spiral grain; • insect boring; • black knot; • sapsucker hole; • burl and gall.
Dead Tree Attributes The following attributes are collected on dead trees that are 10.0 cm and greater in dbh in place of pathological indicators. See Appendix 22.
• species certainty; • vertical position: standing only for establishment; • presence of breakage; • height to break if broken, ocular estimate; • damage agent code and severity see Appendix 14; • wildlife tree appearance.
Assessing whether a tree is still alive may be difficult in certain situations. Ensure that all needles are dead if the tree is being called dead, and if uncertain, err on the side of caution by calling it alive.
Assessing Damage Agents and Severity We collect insect, disease and injury data to quantify their effect on tree growth.
For each tree affected:
1. Identify, if possible, the two most damaging agents (see Appendix 14 for damage agents and severity codes).
2. Assess the damage severity.
3. Record the damage agent code to a level that you are confident. • The damage agent codes are hierarchical and enable coding from very general (type
or category) to specific (species). The first letter indicates the type of the damage while the second and third indicate the specific agent;
• If you are unable to identify the damage agent species, a short, incomplete label is still useful. Example: You may identify a defoliating insect and assess the percent defoliation for the tree as 30 percent. Record this as ID_30.
For the sample affected:
1. Identify the two most damaging agents in the sample.
2. Calculate the percent assessment of each agent for the sample. Determine the damage severity to the nearest one percent up to ten percent and the nearest five percent for severities greater than ten percent.
3. Record this assessment in the header. If known, also record the year in which the damage took place.
Chapter 1: Establishing PSPs in Natural Stands
March 31, 2003 17
Assigning a Crown Class Code Crown class refers to the position of the crown of a tree relative to all other trees within the general plot area, not the whole stand.
There are 6 crown classes:
1. Crown class 1: Dominant; 2. Crown class 2: Codominant; 3. Crown class 3: Intermediate; 4. Crown class 4: Suppressed; 5. Crown class 5: Veteran; 6. Crown class 6: Understory.
For more details on crown classes, see Appendix 12.
Assign a crown class code of 1 through 6 to each tagged tree classed as tree class 1, 2 or 5 (see “Classifying Trees” in this chapter).
Note: Crown class 6 should be used sparingly; do not confuse it with crown class 4. Use crown class 6 only in stands 60 years or older where the understory trees, usually shade tolerant, are clearly much younger than the main stand.
Estimating Live-crown Length Live-crown length is the distance between the treetop, if the top is alive, or from the top of the live portion, if the treetop is dead and the base of the lowest contiguous live crown. The estimate is expressed as a percentage of the total height of the tree.
Estimate, to the nearest 10 percent, the live-crown length of all living tagged trees.
• When determining the base of the lowest contiguous live crown, do not consider forks or epicormic branches;
• The tops of defoliated trees may appear dead at the time of the assessment. Make sure it is or you may underestimate the live-crown length.
Recording Stumps In plots established in selectively logged stands, measure and record, by sector, information about each stump of a commercial species with a diameter at breast height of 12.5 cm or greater.
1. Identify stumps of commercial species with diameters of 12.5 cm or greater. Ignore non-merchantable stumps cut at the time of selective logging.
2. Assign each stump a tree number. Tree numbers for stumps range from 900 to 979. Tagging the stump is not necessary.
3. For each stump, determine: • the species;

Growth and Yield Standards and Procedures
18 March 31, 2003
• height; • diameter; • whether the stump is new or old - under 10 years since cutting, or over 10 years?; • the tree number of the closest tagged tree.
Determining the Stand Structure Stand structure is the physical arrangement or pattern of organization of the stand. Stand structure is described and classified according to recognizable age and height differences.
The recognized stand structures are:
1. Single layer, simple stands (even age and height) • with veterans • without veterans
2. Single layer, complex stands (uneven age and height) • with veterans • without veterans
3. Multi layer stands • layer 1 is the top layer • layer 2 is the bottom layer
For single layer stands, layer 1 is assumed for trees in the main stand and tree class 5 identifies the veteran layer.
For multi layer stands, record 1 for the top layer trees and 2 for the bottom layer. The sample primary layer, according to regional priorities, must be identified.
For further details on stand structure, see Appendix 13.
Height Sample Trees Local height-diameter curves are constructed from sample data before compiling samples.
To construct reliable curves, a substantial number of heights are needed for each species. The number depends on the stand composition, which ultimately is based on basal area. In the field, use the calculated basal area for stand composition.
Top Height Select the top height tree from a 0.01 ha circular plot at plot centre. Record “C” (centre sector) for the tree. Top height (1998) is the height of the largest diameter tree, regardless of species, in a 0.01 ha plot, providing the tree is suitable. A suitable tree must be healthy, not have a broken or damaged top, not have its height growth affected by a competitor nor be a residual left from previous logging. There is no substitution for an unsuitable tree.
If the PSP is one selected for SIBEC, select the largest diameter tree of each additional species in the 0.01 ha circular plot at plot centre, and record “C” (centre sector) for the tree.

Chapter 1: Establishing PSPs in Natural Stands
March 31, 2003 19
For a single-layered stand, or for each layer in a multi-layered stand, select height sample trees as follows:
First Two Major Species For each of the first two major species (20 percent or more by composition), select trees for the sample as follows:
1. Select the required number of site trees, to a maximum of ten. These trees are selected on the basis of the largest diameter tree per 0.01 ha plot or sector. Suitable trees have the following characteristics: • largest diameter trees; • living; • free of major defects; • crown class of 1 or 2. The exception is in the case of the second layer in a two-layer
stand where crown class 3 and 4 are acceptable; • cannot be substituted.
Example: On a 0.1 hectare sample, the ten largest dbh trees from each of the two leading major species are selected for site tree measurements. Similarly, four trees would be selected in a 0.04 hectare sample.
2. Select an additional 15 trees distributed evenly across the remaining dbh range, down to 2 cm dbh.
For Third and Fourth Majors, Minor and Scattered Species For the third and fourth major species (20 per cent or greater by composition), each minor species (10 to 19 percent by composition) and for scattered species (less than 10 percent by composition), select 15 trees, if present and suitable. Distribute them across the dbh range, down to 2 cm dbh. Place emphasis on larger diameter classes.
For Veterans For the veteran layer:
1. Select one tree for each species present.
2. Estimate the height of all others.
3. Record the estimated height in the small tree or Vet height section.
Selecting Sample Trees When possible, select residual trees (tree class 1). See “Classifying Trees” in this chapter. Otherwise, select trees that do not have a major fork, which affects the true height, or a major scar at breast height, which affects the true diameter.
Do not select trees with:
• diameters that were estimated; • sweeps or leans greater than 10 degrees.

Growth and Yield Standards and Procedures
20 March 31, 2003
In some areas, it may be impossible to meet sample height requirements if only suitable trees as described above are taken. In this situation, take the best of the “poor” trees to meet the requirements. However, do not select a tree if its height is less than 95% of what it would be without its defect - lean, fork, broken top, etc.
Measuring Suppressed Trees with Flattened Tops To ensure accurate measurements of suppressed trees:
1. Sight on the highest point of the top.
2. For hemlock trees, sight on the highest point of the droop.
3. For cedar trees, make sure you take the top reading on the tiny leader and not on a lateral branch, which may be higher.
Measurement Consistency To make sure the height measurement is taken consistently from the same location, paint a blue dot at dbh to indicate the direction from which you made the height measurement.
Age Sample Trees In single layer, simple stands, pure and mixed, the age of the stand is determined by averaging the ages of the site trees of the leading major species on the plot. However, ages of the site trees of the second major species must also be taken.
The sample mean age is derived from the site trees of the leading species only, even if some of their cores are rotted. The rotted portion must be estimated to derive a total age for the tree. See “Counting Rings on Rotted Cores” in this chapter.
Bore trees that appear to be veterans to confirm they are in fact veterans. Bore the smallest diameter veteran per species only; the others can then be assumed to be veterans too. Use these ages for the veteran layer.
In single layer, complex stands determine the average age of the stand from the ages of the site trees of the leading major species. However, to show the variation of the stand's age, take two additional ages of the leading major species from the younger portion of the stand. Treat the second major species the same as the leading.
In multi layer stands, select sample trees, as outlined above, for each layer. The site tree method for determining site index is more suitable for even-aged stands. However, to simplify matters, select sample trees for both layers using the site tree requirements as above.
Taking the Age of a Tree 1. Bore the selected trees 1.3 m above the base of the tree on the uphill side.
2. Remove the core. Make sure two cores per species include the pith.
3. If the core includes the pith, record “Y” in the pith field.
4. Rebore the tree if you missed the pith by more than an estimated: • 2 years on a tree younger than 100 years, or

Chapter 1: Establishing PSPs in Natural Stands
March 31, 2003 21
• 2 percent on a tree older than 100 years.
5. While in the field, count the rings on the core and record the count. (Note that the first ring from the pith as 1 year, not pith).
6. Measure and record the radial increment for the last 5, 10 and 20 years.
7. Measure and record the evidence of suppression, if any. See Appendix 23.
8. Place the core in a plastic straw with the following information: • region number, R#; • compartment number, Co#; • sample number, G#; • tree number; • species; • counted age.
Counting Rings on Rotted Cores If the sample tree has rotted:
1. Count the rings on the sound portion of the core.
2. Estimate the number of years in the rotten portion.
3. Add the number of years in the sound portion to the estimated number of years in the rotten portion.
4. Record the total breast-height age with an (R)otted for pith.
Boring Small Trees If it is not possible to bore a small (less than 4 cm dbh) tree without damaging it:
1. Select a tree of a similar diameter and height outside the plot and bore it.
2. Assign the age to the plot tree.
3. Record (E)stimated for pith.
Estimating Other Plot Attributes
Estimating Crown Closure Crown closure is the percentage of ground area covered by the vertically projected crowns of trees.
For each plot, estimate and record the crown closure by layer to the nearest 10 percent.
For the veteran component of the plot, record crown closure to the nearest percent. If the crown closure of the veteran component for the sample is 6% or more, it must be classified as a separate layer.
Determining Elevation Determine and record the elevation of each plot.

Growth and Yield Standards and Procedures
22 March 31, 2003
Determining Aspect and Slope Determine the aspect and slope for each plot.
Determining Slope Position Slope position is the relative position of the plot within a water catchment area. Determine the slope position and record the appropriate code:
Code Category Slope position
C
U
M
L
T
F
D
Crest
Upper
Mid
Lower
Toe
Flat (level)
Depression

Chapter 1: Establishing PSPs in Natural Stands
March 31, 2003 23
Stem Mapping Ten percent of samples established in natural stands are stem mapped. The Resources Inventory Branch decides which sample and stratum (type group, site, age class) to stem map. The stem maps are then used in distance-dependent growth modeling studies.
To create a stem map, you begin from the plot centre stake and measure the bearing and distance to each tagged tree. See Appendix 4 for a list of equipment needed for stem mapping.
To stem map the plot, follow this procedure:
1. If no large tree nearby interferes with sight lines, set up your compass directly over the plot centre stake: • level the instrument; • record that the compass was not offset.
2. If a large tree nearby interferes with sight lines, set up the compass in an opening close to the plot centre: • level the instrument; • measure and record the bearing and distance from the compass to the plot centre; • record that the compass was offset.
3. Adjust the compass for magnetic declination and raise the sighting vanes. In Western Canada, the magnetic declination is east of true north. Obtain the correct magnetic declination from an isogonic table. See Appendix 7.
4. Sight on to the first tree on the plot. Some tips for sighting are listed below: • to avoid sighting the wrong tree, wrap the dbh stick with flagging tape to make it
more visible, then place the stick in front and center of the tree; • to avoid false compass readings as you sight the tree, keep sources of magnetic
interference away from the compass, including steel tapes, axes, knives, steel datum holders, eye glasses with steel frames, and most metal objects;
• to simplify recording and possibly minimize errors, use a staff compass with Azimuth bearings when possible.
5. Measure the slope distance between the plot centre and the centre of the tree.
6. Measure the slope with the Suunto clinometer using the percent scale.
7. Read the compass bearing on the scale at the north end of the compass needle.
8. Record all measurements for each tagged tree in the plot.


Chapter 1: Establishing PSPs in Natural Stands
March 31, 2003 25
Collecting Ecological Data All samples established in natural stands are ecologically assessed. Collect and record ecological data to the Biogeoclimatic Ecosystem Classification (BEC) site series level. See Appendix 25. If it is not possible to collect the ground data at the time of measurement, at minimum, obtain the BEC Zone, Sub-Zone, and Variant.

Chapter 1: Establishing PSPs in Natural Stands
March 31, 2003 27
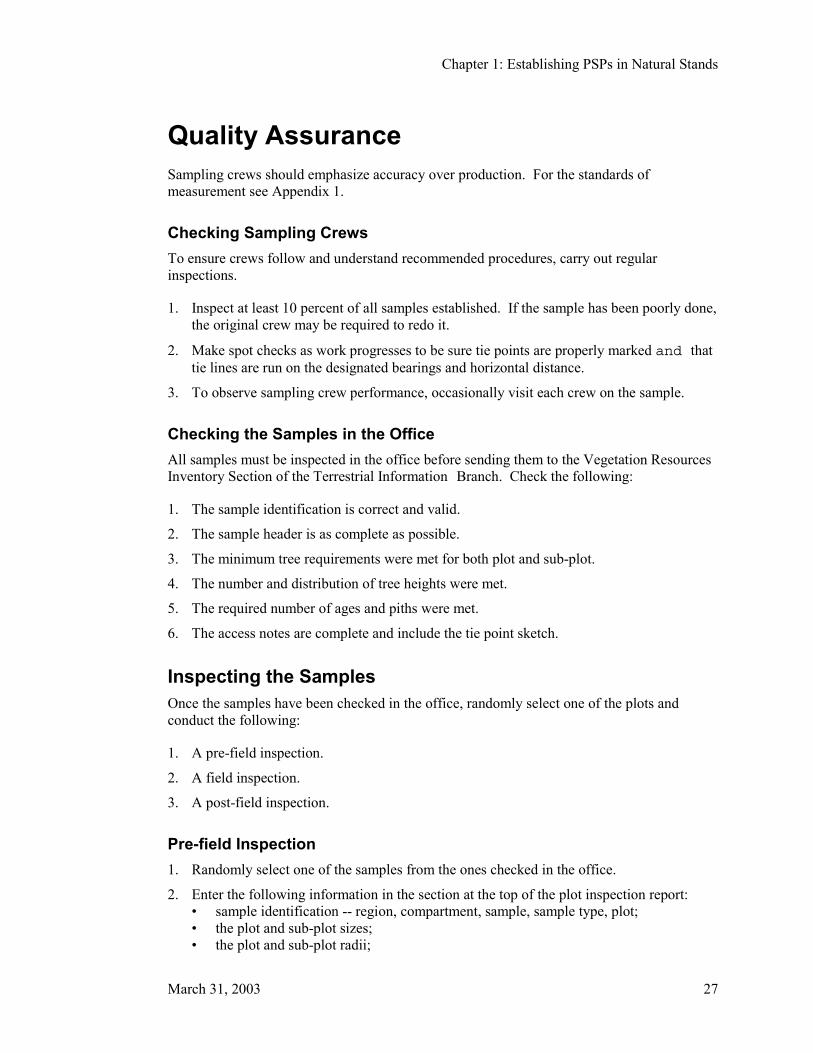
Quality Assurance Sampling crews should emphasize accuracy over production. For the standards of measurement see Appendix 1.
Checking Sampling Crews To ensure crews follow and understand recommended procedures, carry out regular inspections.
1. Inspect at least 10 percent of all samples established. If the sample has been poorly done, the original crew may be required to redo it.
2. Make spot checks as work progresses to be sure tie points are properly marked and that tie lines are run on the designated bearings and horizontal distance.
3. To observe sampling crew performance, occasionally visit each crew on the sample.
Checking the Samples in the Office All samples must be inspected in the office before sending them to the Vegetation Resources Inventory Section of the Terrestrial Information Branch. Check the following:
1. The sample identification is correct and valid.
2. The sample header is as complete as possible.
3. The minimum tree requirements were met for both plot and sub-plot.
4. The number and distribution of tree heights were met.
5. The required number of ages and piths were met.
6. The access notes are complete and include the tie point sketch.
Inspecting the Samples Once the samples have been checked in the office, randomly select one of the plots and conduct the following:
1. A pre-field inspection.
2. A field inspection.
3. A post-field inspection.
Pre-field Inspection 1. Randomly select one of the samples from the ones checked in the office.
2. Enter the following information in the section at the top of the plot inspection report: • sample identification -- region, compartment, sample, sample type, plot; • the plot and sub-plot sizes; • the plot and sub-plot radii;

Growth and Yield Standards and Procedures
28 March 31, 2003
• the inspection date; • the original tally crew; • the measurement date.
3. Randomly select seven live trees and two dead trees for tree detail checking.
4. Transcribe the measurements of the seven live trees and two dead trees to the top section of the plot inspection report. See Appendix 15.
5. Randomly select five trees from the sample tree section, for height checking.
6. Transcribe the height measurements of the five trees to the sample tree section of the plot inspection report.
7. Select two age cores and check the age count as well as the suppression readings.
8. Transcribe the crown closure, aspect, slope and slope position of the plot to the appropriate section of the plot inspection report.
9. Randomly select one tree count diameter class for a species. Later, use this diameter class in the field to check that the dot tally is correct for the species and class.
Note: Steps 2 to 9 are automatically done on the Gyhost/Gyhand Data Capture and Reporting System. Select the quality assurance report for printing.
Field Inspection 1. Use the access notes to get to the sample and verify their accuracy and completeness.
2. Check that the tie point is correctly marked. See “Choosing a Tie Point” in this chapter.
3. Make sure the tie line bearing and distance run within the allowable standards.
4. Make sure the plot centre markers are correctly inscribed, and that the plot centre stake is protected with a cairn.
5. Check the plot and sub-plot radius at a minimum of three different locations. Check for trees that were missed or that should have been excluded from the plot or sub-plot.
6. Within the plot or sub-plot, make sure trees larger than the tagging limits were not missed. Also check for trees that were tallied when they should not have. Flag with a circled asterisk any missed or erroneously tallied tree.
7. Make sure all sub-plot trees of the selected tree count class were counted in the dot tally.
8. Carefully measure all the trees selected for field inspection: • Tree identification - Make sure the genus or species of each tree is correct. If not,
place a circled asterisk beside the tree. • Tree tag height - Check the tag height of the seven selected trees to verify that breast
height is 1.3 m above the base of the tree on the uphill side. At the same time, make sure the nails were securely driven into the trees and the nail with the tag was driven in at a slight angle so that the tag hangs away from the tree.
• Diameter and pathological remarks (decay indicators) - Measure the dbh of the seven live and two dead selected trees and classify them.
• Sample tree heights - Measure the five selected trees for height.

Chapter 1: Establishing PSPs in Natural Stands
March 31, 2003 29
• Stem mapping - If the sample was stem mapped, check the seven selected trees for bearing, distance and percent slope.
9. Assess the crown closure for the plot.
10. Compare your measurements with the crew's measurements. Give the crew the benefit of the doubt.
11. Check that the results conform to the standards of measurements. See Appendix 1.
12. If the difference between two measurements is greater than the allowable error, place an asterisk in the margin.
13. If the error is greater than two times the allowable error, circle the asterisk.
14. Complete the inspection items section of the inspection report.
15. Rate the quality of the work on the plot using the weighted system in Appendix 2.
16. Record your rating of the sample and any other comments in the remarks section of the plot inspection report.
Post-field Inspection 1. Discuss the results of your inspection with the original field crew.
2. Make recommendations to the original field crew, if necessary, on how to improve their work.
3. Correct all the original data that was flagged with an asterisk or a circled asterisk in your inspection report.


Chapter 1: Establishing PSPs in Natural Stands
March 31, 2003 31
Mapping Samples Once you establish the samples:
1. Plot them on forest cover maps.
2. Send copies of the maps to the Terrestrial Information Branch.


Chapter 1: Establishing PSPs in Natural Stands
March 31, 2003 33
Submitting the Samples Once the samples are checked in the office and corrected:
1. Send a list of all the samples, any original field sheets, the electronic download from the GyHost as well as a hard copy of reports 1, 2, 3, 5 and 7 to the Vegetation Resources Inventory Section of the Terrestrial Information Branch.
2. Keep a copy of all the above for security and reference.