Embed Size (px)
Citation preview
Forest Inventory and Monitoring Program: Growth and Yield Standards and Procedures
Prepared by Ministry of Forests and Range
Forest Analysis and Inventory Branch for the
Resources Information Standards Committee
November 2007
Version 2.0
© The Province of British Columbia Published by the Resources Information Standards Committee
Library and Archives of Canada Cataloguing in Publication Data
Main entry under title:
Forest Inventory and Monitoring Program : growth and yield standards and procedures
"November 2007."
Contents: 1. Establishing permanent sample plots in natural stands -- 2. Remeasurement of permanent sample plots in natural stands -- 3. Remeasuring experimental plots in natural stands -- Appendices.
Also available on the Internet.
ISBN 978-0-7726-5878-4
1. British Columbia. Forest Inventory and Monitoring Program. 2. Trees - Sampling - British Columbia – Methodology – Handbooks, manuals, etc. 3. Trees - Monitoring - British Columbia – Methodology – Handbooks, manuals, etc. 4. Trees – British Columbia – Growth. 5. Forest productivity – British Columbia. 6. Site index (Forestry) - British Columbia. I. British Columbia. Resources Information Standards Committee. II. British Columbia. Forest Analysis and Inventory Branch. III. British Columbia. Ministry of Forests and Range. Growth and Yield Program.
SD387.S86F76 2007 634.9 C2007-960231-2

Additional Copies of this publication can be purchased from:
Government Publication Services PO Box 9452 Stn Prov Govt 563 Superior Street 2nd Flr Victoria, BC V8W 9V7 Phone: (250) 387-6409 or Toll free: 1-800-663-6105 Fax: (250) 387-1120 http://www.publications.gov.bc.ca
Digital Copies are available on the Internet at: http://ilmbwww.gov.bc.ca/risc/index.htm

Growth and Yield Standards and Procedures
Preface The standards and procedures described in this chapter of the Forest Inventory Manual (Volume 3 – Growth and Yield/ Decay and Volume) are based upon the Minimum Standards for the Establishment and Remeasurement of Permanent Sample Plots in British Columbia.
The latter publication was developed for the Forest Productivity Council (FPC) to recommend minimum standards for measurement of permanent sample plots for the purpose of measuring growth and estimating future yield. It was last revised in March 1999.
With the inactivity of the FPC, the Ministry of Forests and Range continues to upgrade the Forest Inventory Manual in response to client needs. The chapter following reflects that updated methodology and supersedes the FPC Minimum Standards document. The Ministry of Forests and Range recommends that this methodology be followed for all establishments and remeasurements of permanent sample plots.
November 2007 v

Growth and Yield Standards and Procedures
Acknowledgments The Government of British Columbia provides funding of the Resources Information Standards Committee work, including the preparation of this document. The Resources Information Standards Committee supports the effective, timely and integrated use of land and resource information for planning and decision making by developing and delivering focused, cost-effective, common provincial standards and procedures for information collection, management and analysis. Representatives to the Committee and its Task Forces are drawn from the ministries and agencies of the Canadian and the British Columbia governments, including academic, industry and First Nations involvement.
The Resources Information Standards Committee evolved from the Resources Inventory Committee which received funding from the Canada-British Columbia Partnership Agreement of Forest Resource Development (FRDA II), the Corporate Resource Inventory Initiative (CRII) and by Forest Renewal BC (FRBC), and addressed concerns of the 1991 Forest Resources Commission.
For further information about the Resources Information Standards Committee, please access the RISC website at: http://ilmbwww.gov.bc.ca/risc/index.htm
.
November 2007 vii


Growth and Yield Standards and Procedures
Table of Contents Preface....................................................................................................................................... v
Acknowledgments ...................................................................................................................vii
1. Establishing Permanent Sample Plots in Natural Stands....................................................... 1
Introduction ........................................................................................................................... 1
Field Training .................................................................................................................... 1
Selecting Natural Stands ....................................................................................................... 1
Unsuitable Areas ............................................................................................................... 2
Locating and Marking Permanent Natural Samples.............................................................. 2
Describing Access and Location of the Sample ................................................................ 2
Choosing a Tie Point ......................................................................................................... 3
Running a Tie Line from the Tie Point ............................................................................. 3
Marking the Plot Centre .................................................................................................... 3
Establishing Plots .................................................................................................................. 4
Choosing the Plot Size ...................................................................................................... 4
Marking the Plot Circumference ....................................................................................... 5
Dividing the Plot into Sectors............................................................................................ 5
Tagging Trees.................................................................................................................... 6
Establishing Sub-plots........................................................................................................... 7
Choosing the Sub-plot Size ............................................................................................... 7
Dividing the Sub-plot into Sectors .................................................................................... 7
Tagging Trees in the Sub-plot ........................................................................................... 8
Gathering Data About the Sample......................................................................................... 8
Measuring the Trees .......................................................................................................... 9
Classifying Trees............................................................................................................... 9
November 2007 ix
Growth and Yield Standards and Procedures
Pathological Indicators.....................................................................................................11
Dead Tree Attributes........................................................................................................12
Assessing Damage Agents and Severity ..........................................................................12
Assigning a Crown Class Code........................................................................................12
Estimating Live-crown Length ........................................................................................13
Recording Stumps............................................................................................................13
Determining the Stand Structure......................................................................................13
Height Sample Trees........................................................................................................14
Estimating Other Plot Attributes......................................................................................17
Stem Mapping......................................................................................................................18
Collecting Ecological Data ..................................................................................................19
Quality Assurance................................................................................................................19
Inspecting the Samples ....................................................................................................20
Mapping Samples.................................................................................................................21
Submitting the Samples .......................................................................................................22
Once the samples are checked in the office and corrected: .............................................22
2. Remeasurement of Permanent Sample Plots in Natural Stands...........................................23
Introduction..........................................................................................................................23
Preparing for Field Work .....................................................................................................23
Field Training...................................................................................................................23
Relocating the Plot ...............................................................................................................23
Checking Location and Access ........................................................................................23
Checking the Tie Line......................................................................................................24
Checking the Centre Tree ................................................................................................24
Checking the Plot Centre Tree Markers...........................................................................25
Checking the Plot Centre Stake .......................................................................................25
x November 2007
Growth and Yield Standards and Procedures
Remeasuring the Plot and Sub-plot ..................................................................................... 26
Converting Breast Height in Industrial Permanent Samples ........................................... 26
Sectors in the Plot............................................................................................................ 26
Tagging Trees.................................................................................................................. 26
Measuring DBH .............................................................................................................. 27
Classifying Trees............................................................................................................. 28
Pathological Indicators .................................................................................................... 30
Assessing Damage Agents and Severity ......................................................................... 30
Assigning a Crown Class Code ....................................................................................... 31
Estimating Live-crown Length........................................................................................ 31
Tagging Ingrowth Trees .................................................................................................. 32
Recording Data About the Sample: ................................................................................. 32
Sub-plot and Tree Count ................................................................................................. 33
Measuring Sub-plot Trees ............................................................................................... 33
Determining the Stand Structure ..................................................................................... 34
Height Sample Trees ....................................................................................................... 35
Estimating Other Plot Attributes ..................................................................................... 38
Stem Mapping ..................................................................................................................... 39
Collecting Ecological Data.................................................................................................. 40
Quality Assurance ............................................................................................................... 40
Inspecting the Sample ..................................................................................................... 41
Damage to the Sample and Returning the Samples............................................................. 43
Damage to the Sample..................................................................................................... 43
Returning the Samples..................................................................................................... 43
3. Remeasuring Experimental Plots in Natural Stands............................................................ 45
Introduction ......................................................................................................................... 45
November 2007 xi
Growth and Yield Standards and Procedures
Preparing for Field Work .....................................................................................................45
Field Training...................................................................................................................45
Relocating the Plot ...............................................................................................................46
Checking Location and Access ........................................................................................46
Checking the Tie Line......................................................................................................47
Checking Corner Posts and Centre Stake ........................................................................47
Remeasuring the Plot and Sub-plot......................................................................................47
Converting the Breast Height in Experimental Permanent Samples................................47
Sectors in the Plot ............................................................................................................47
Tagging Trees ..................................................................................................................48
Measuring DBH...............................................................................................................48
Classifying Trees .............................................................................................................49
Pathological Indicators.....................................................................................................51
Assessing Damage Agents and Severity ..........................................................................51
Assigning a Crown Class Code........................................................................................52
Estimating Live-crown Length ........................................................................................52
Tagging Ingrowth Trees...................................................................................................53
Recording Data About the Sample: .................................................................................53
Sub-plot and Tree Count ..................................................................................................54
Determining the Stand Structure......................................................................................56
Height Sample Trees........................................................................................................56
Estimating Other Plot Attributes......................................................................................60
Collecting Ecological Data ..................................................................................................61
Quality Assurance................................................................................................................61
Inspecting the Sample ......................................................................................................62
Damage to the Sample and Returning the Samples .............................................................64
xii November 2007
Growth and Yield Standards and Procedures
Damage to the Experimental Plot.................................................................................... 64
Returning the Samples..................................................................................................... 64
Appendix 1: Standards of Measurement for Permanent Samples .......................................... 65
Appendix 2: Weighted Error Rating Table and the Basis for the Acceptance or Rejection of a Plot .......................................................................................................................................... 67
Appendix 3: Species Symbols ............................................................................................... 69
Names and Symbols for Tree Species in B.C...................................................................... 69
Appendix 4: Equipment List for Permanent Sample Measurements ..................................... 73
Appendix 5: Tie Point and Plot Centre Aluminum Markers .................................................. 75
Appendix 6: Plot and Sub-plot Radii Slope Allowance for Natural Stands Samples ............ 77
Appendix 7: Isogonic and Isoporic Table .............................................................................. 79
Magnetic Declination and Annual Change for May 2002................................................... 79
Appendix 8: Plot and Sub-Plot Radii Slope Allowance For Treated Stands.......................... 81
Appendix 9: Determining Breast Height ................................................................................ 83
Appendix 10: Special Rules for the Measurement and Classification of Abnormal Trees .... 85
Counting and Height Measurement of Abnormal Trees Less than 2.0 cm DBH. ............... 85
Distinction Between Broken Top and for Trees Greater than 2.0 cm DBH........................ 87
Trees Greater than 2.0 cm DBH Growing Along the Ground............................................. 87
Appendix 11: Pathological Classification of Trees ................................................................ 89
Classes of Trees................................................................................................................... 89
Suspect Trees................................................................................................................... 89
Residual Trees ................................................................................................................. 90
Suspect Indicators of Decay on Standing Trees .................................................................. 90
Conks............................................................................................................................... 90
Blind Conks..................................................................................................................... 90
Scars ................................................................................................................................ 91
Fork or Pronounced Crook .............................................................................................. 96
November 2007 xiii
Growth and Yield Standards and Procedures
Frost Cracks .....................................................................................................................97
Mistletoe Trunk Infections...............................................................................................98
Rotten Branches ...............................................................................................................99
Dead Top..........................................................................................................................99
Broken Top ......................................................................................................................99
Non-suspect Abnormalities................................................................................................100
External Evidence of Butt Rot Not Associated With Suspect Abnormalities................100
Flutes..............................................................................................................................100
Candelabra Branches .....................................................................................................100
Branch Fans ...................................................................................................................101
Black Knots....................................................................................................................102
Burls and Galls...............................................................................................................102
Sweep.............................................................................................................................103
Exposed Roots ...............................................................................................................103
Spiral Grain....................................................................................................................103
Dry Side .........................................................................................................................103
Sapsucker Holes.............................................................................................................104
Insect Borings ................................................................................................................104
Appendix 12: Crown Class ...................................................................................................105
Appendix 13: Stand Structure ...............................................................................................107
Single-layered Stand Structure...........................................................................................107
Single-layered, simple structure without veterans .........................................................107
Single-layered, simple structure with veterans ..............................................................107
Complex stand structure ................................................................................................108
Complex stand structure with veterans ..........................................................................108
Multi-layer Stand Structure................................................................................................109
xiv November 2007

Growth and Yield Standards and Procedures
Appendix 14: Damage Agents and Severity Codes.............................................................. 113
I. Damage Agents ............................................................................................................. 113
II. Damage Severity and Mortality Condition Codes ....................................................... 119
Appendix 15: Quality Assurance Report.............................................................................. 121
Appendix 16: Completing the Field Sheets.......................................................................... 127
Appendix 17: Location and Access Notes Example ............................................................ 133
Appendix 18: Recommended Protection Buffers for Permanent Samples........................... 135
Appendix 19: Growth Sample Record Sheet........................................................................ 137
Appendix 20: Guidelines for Deciding if Damaged Permanent Plots Should be Remeasured139
Appendix 21: Converting Breast Height in Industrial Permanent Samples ......................... 141
Method 1 ....................................................................................................................... 141
Method 2 ....................................................................................................................... 141
Establishing a Sub-plot in Industrial Plots ........................................................................ 141
Appendix 22: Dead Tree Attributes ..................................................................................... 143
Appendix 23: Field Assessment of Suppressed Trees.......................................................... 145
Appendix 24: Example of Tagging and Site Sectors for Remeasuring Plots ....................... 147
Appendix 25: Minimum Data Collection Requirements for Ecological Field Forms (FS 882)149
Vegetation Form............................................................................................................ 150
November 2007 xv

Growth and Yield Standards and Procedures
List of Figures Error! No table of figures entries found.
November 2007 xvii


Growth and Yield Standards and Procedures
List of Tables Error! No table of figures entries found.
November 2007 xix


Growth and Yield Standards and Procedures
1. Establishing Permanent Sample Plots in Natural Stands
Introduction Permanent Samples are established in natural stands to measure:
1. rates of growth,
2. mortality,
3. change in stand structure, and
4. stand development.
The data collected is used to develop growth and yield models, validate site index curves, and to provide a basis for further scientific studies.
Stands are selected for sampling by means of a detailed analysis of previous surveys by management unit. Natural samples should not be established in multi-layered stands except in forest districts where this type of stand structure is prominent.
For a list of measurement standards see the “Standard of Measurement for Permanent Samples” in Appendix 1.
Established samples must be classified ecologically according to Research Branch specifications.
Since permanent samples are cost intensive, protecting them is of the utmost importance. Using buffers, as illustrated in “Recommended Protection Buffers for Permanent Samples” Appendix 18, is recommended.
Field Training All personnel involved in establishing natural samples in the field should attend a short training course on field procedures. Next, crews should work under the direct guidance of senior personnel long enough to gain a full understanding of the different phases of the work and to become efficient at collecting field measurements.
Selecting Natural Stands 1. Obtain the most recent forest cover maps and status maps and note the areas where you
might establish a natural sample.
2. Select stands that meet the following matrix cell stratification criteria: biogeoclimatic ecosystem classification (BEC) zone; species group; age class; site index class;
November 2007 1
Growth and Yield Standards and Procedures
density class.
3. Collect the latest air photos of the areas.
4. Carry out field reconnaissance of the areas to ensure that: the stands are relatively free of insects and disease; the stands are relatively free of injury, such as animal damage, and windthrow; the portions of the stands that will contain the plot and buffer are relatively homogeneous
in species composition, age, aspect, density and height.
5. Discard unsuitable areas.
6. Assign a number to the selected samples. Consult the provincial sample list, which enumerates samples consecutively by region and compartment. Assign the next number available within the compartment. Do not assign the sample a number already in use.
Further details on selecting strata are agreed to by the regional Inventory Officer and by the Growth and Yield Section of the Resources Inventory Branch.
For a list of equipment used in establishing plots in natural stands, see the “Equipment List for Permanent Sample Measurements” in Appendix 4.
Unsuitable Areas In even-aged forests, examples of unsuitable areas are:
1. stands containing more than fifty veterans per hectare;
2. stands that are too small to accommodate the plot and buffer;
3. stands that may be too old for at least three remeasurements.
In all-aged or residual forests, examples of unsuitable areas are:
1. stands too small to accommodate a sample and buffer.
2. stands in which site and species composition vary extremely.
Locating and Marking Permanent Natural Samples
Describing Access and Location of the Sample For the benefit of future remeasurement crews, describe in detail how to get to the sample, and where it is located.
1. Start from an easily identifiable landmark that won't change during the ten years between measurements. Examples: a bridge crossing, a main road junction.
2. From the starting point, travel to the sample. En route, note the distances to road junctions, creek crossings, or other prominent features.
3. Describe the tie point. See “Choosing a Tie Point” in this chapter.
4. Describe the species, diameter and location of the tie tree. See “Choosing a Tie Point” in this chapter.
2 November 2007
Growth and Yield Standards and Procedures
Choosing a Tie Point 1. Choose a tie point, or reference point. The tie point should be a permanent topographic
feature distinguishable on air photos and on the ground. Examples: a road junction, a bend in the road, a creek junction, a road crossing, a creek.
2. Choose the tree closest to the tie point. This is your tie tree. Paint both sides of the tree approximately 2 m above the ground in the direction of the tie line.
3. Nail aluminum markers over the paint. The aluminum plot markers are designed to be used in all the growth and yield programs. Each marker is divided into three sections. See “Tie Point and Plot Centre Aluminum Markers” in Appendix 5.
4. Inscribe the following information in the middle and bottom sections of the markers: the sample type (G for natural stands); the sample number; the plot number (always 1); the region number; the compartment number; the bearing and distance to the plot; the date the sample was established.
5. Mark the tie tree with two strands of plastic flagging tape, one above and one below the aluminum markers.
6. Prepare a sketch showing the tie point, sample location, and other significant topographic features, and attach it to the access notes.
Running a Tie Line from the Tie Point Run the tie line from the tie point to the plot centre using a hand compass, a Suunto clinometer and a measuring tape.
1. On a set bearing, locate the boundary of the plot. The plot boundary must be at least 50 m from the edge of the forest type represented by
the plot. The exception is if the field officer does a written justification for decreasing the distance. Under no circumstances can this distance be less than the average height of the plot. This is the buffer.
2. Follow the bearing set on the hand compass for the required horizontal distance.
3. Measure the slope with the clinometer and make the required correction for horizontal distance.
4. Mark each side of the trees along the tie line with paint. As well, flag the tie line often enough to be readily followed.
Marking the Plot Centre 1. Mark the plot centre with a one-metre tubular aluminum stake, driven into the ground for
at least half its length. This is the plot centre stake.
2. Build a cairn around the base of the stake to support it firmly.
3. For plots that will not be stem mapped, select three trees around the plot centre, and record the bearing, slope and distance from the plot centre stake to the centre of each tree. Place a nail at the centre of each tree for consistency in measuring distance to the centre
November 2007 3
Growth and Yield Standards and Procedures
stake. This will help future measurement crews locate the position of a centre stake that has been pulled out.
4. Choose a large living tree close to the plot centre stake. This is the plot centre tree.
5. Nail two aluminum plot markers, in the direction of the tie line, to the plot centre tree about 2 m above the ground.
6. Record the following information in the top section of each aluminum marker: sample type (G); sample number; plot number (always 1).
7. Record the following information in the bottom section of each aluminum marker: region number; compartment number; date the sample was established.
8. If the plot centre is also the tie point for the next sample, fill out the middle section of the aluminum marker.
9. Flag the plot centre tree with two strands of flagging tape, one above and one below the aluminum markers.
Establishing Plots A sample in a natural stand consists of one single circular plot. The radius of the plot is measured from the plot centre stake. All trees of measurable size inside the plot are then tagged. See “Tagging Trees” in this chapter.
Choosing the Plot Size The objective of the sampling design is to obtain a sample of approximately 90 living commercial and non-commercial trees with a diameter at breast height (dbh) of 4 cm or greater.
The plot size may vary to accommodate different stand densities. In those forest districts with samples established in multi-layered stands, the plot size is selected based on the top layer.
4 November 2007
Growth and Yield Standards and Procedures
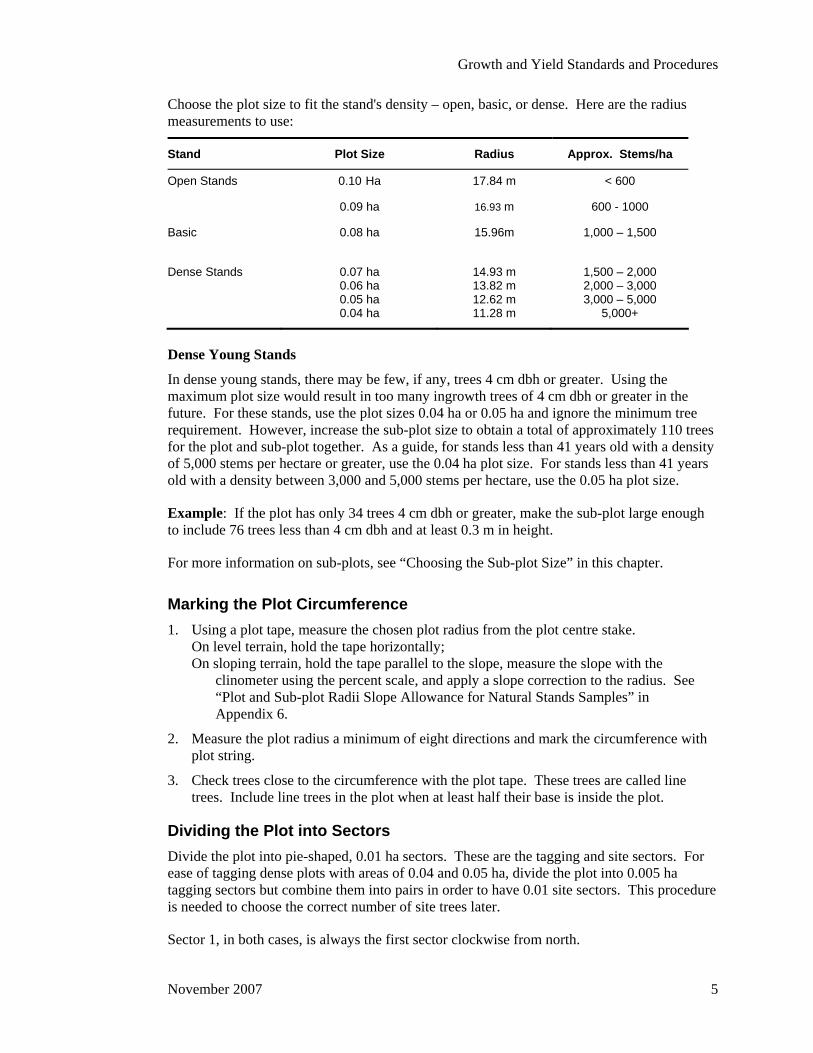
Choose the plot size to fit the stand's density – open, basic, or dense. Here are the radius measurements to use:
Stand Plot Size Radius Approx. Stems/ha
Open Stands 0.10 Ha
0.09 ha
17.84 m
16.93 m
< 600
600 - 1000
Basic 0.08 ha
15.96m
1,000 – 1,500
Dense Stands 0.07 ha 0.06 ha 0.05 ha 0.04 ha
14.93 m 13.82 m 12.62 m 11.28 m
1,500 – 2,000 2,000 – 3,000 3,000 – 5,000
5,000+
Dense Young Stands
In dense young stands, there may be few, if any, trees 4 cm dbh or greater. Using the maximum plot size would result in too many ingrowth trees of 4 cm dbh or greater in the future. For these stands, use the plot sizes 0.04 ha or 0.05 ha and ignore the minimum tree requirement. However, increase the sub-plot size to obtain a total of approximately 110 trees for the plot and sub-plot together. As a guide, for stands less than 41 years old with a density of 5,000 stems per hectare or greater, use the 0.04 ha plot size. For stands less than 41 years old with a density between 3,000 and 5,000 stems per hectare, use the 0.05 ha plot size.
Example: If the plot has only 34 trees 4 cm dbh or greater, make the sub-plot large enough to include 76 trees less than 4 cm dbh and at least 0.3 m in height.
For more information on sub-plots, see “Choosing the Sub-plot Size” in this chapter.
Marking the Plot Circumference 1. Using a plot tape, measure the chosen plot radius from the plot centre stake.
On level terrain, hold the tape horizontally; On sloping terrain, hold the tape parallel to the slope, measure the slope with the
clinometer using the percent scale, and apply a slope correction to the radius. See “Plot and Sub-plot Radii Slope Allowance for Natural Stands Samples” in Appendix 6.
2. Measure the plot radius a minimum of eight directions and mark the circumference with plot string.
3. Check trees close to the circumference with the plot tape. These trees are called line trees. Include line trees in the plot when at least half their base is inside the plot.
Dividing the Plot into Sectors Divide the plot into pie-shaped, 0.01 ha sectors. These are the tagging and site sectors. For ease of tagging dense plots with areas of 0.04 and 0.05 ha, divide the plot into 0.005 ha tagging sectors but combine them into pairs in order to have 0.01 site sectors. This procedure is needed to choose the correct number of site trees later.
Sector 1, in both cases, is always the first sector clockwise from north.
November 2007 5

Growth and Yield Standards and Procedures
Tagging Trees Once you divide the plot into sectors, tag all commercial and non-commercial trees that have a dbh of 4.0 cm and greater for living trees and 10.0 cm and greater for dead standing trees. Use round, blue plastic tags with white numbers from 1 to 300. Do not duplicate tag numbers in a plot.
Tagging by Sectors
1. Start with sector 1. In this sector, affix the tags so that they face the plot centre.
2. Tag the trees near the plot centre first; then continue tagging outward by moving side-to-side across the pie-shaped sector.
3. As you reach the circumference of sector 1, make the last sideways pass in the direction of sector 2 so that the last tree tagged in sector 1 is, as near as possible to the first tree you will tag in sector 2.
4. Begin tagging sector 2. In this sector, affix the tags so that they face the circumference, not the plot centre as in sector 1.
5. Tag the trees near the circumference first, then continue tagging inward by moving side-to-side across the pie-shaped sector.
6. Make sure the last tree you tag in this sector is the one closest to the plot centre.
7. Repeat the procedures used in sectors 1 and 2 for the remaining sectors. Remember that tags in odd-numbered sectors face the plot centre while those in even-numbered sectors face the circumference.
Attaching Tags to Trees
1. Affix tags at breast height, which is 1.3 metres above the base of the tree on the uphill side. Use a 1.3-metre long dbh stick to measure the correct height. See “Determining Breast Height” in Appendix 9.
2. If abnormal swelling or branch whorls occur at breast height, raise or lower the tag by up to 5 cm.
3. Nail the tag to the tree: use 6 cm aluminum nails; drive the nail slightly upward so the tag hangs away from the tree; drive the nail into the trunk just enough to hold the tag securely and yet allow for radial
growth.
Tagging Forked Trees
Here are special rules for tagging forked trees:
1. Tag the stem as a single tree if: the fork occurs above 1.3 m, and the stem has a dbh of at least 4 cm, (10.0 cm for dead trees).
2. Tag each stem separately if: the fork occurs below 1.3 m, and two or more of the fork's stems have a dbh of 4 cm or greater, (10.0 cm or greater for
dead trees). Use consecutive numbers when you tag these stems.
6 November 2007
Growth and Yield Standards and Procedures
3. Tag the stem as a single tree if: the fork occurs below 1.3 m, and only one of the fork's stems has a dbh of 4 cm or greater, (10.0 cm for dead trees).
Measuring the Diameter of Trees Growing Together
To more accurately measure the diameter of trees that are or will soon be joined together at dbh, use the “1/2 wrap” method. To do this, measure or estimate, as accurately as you can, the diameter of each affected tree. Then, from the nail with the tag, measure half of the diameter around the bole of the tree and place a second nail. Note in the remarks, that these are “1/2 wrap” measurements. In the future, the distance between the two nails will be measured and multiplied by two to arrive at the diameter of the tree.
Tagging Unusual Live Trees
Now and then you will find unusual live trees within a plot or sub-plot. Example: a tree of taggable size growing on a tall stump too high to climb. Exercise good judgment in these odd situations. Treat the above example like this:
1. Assign a tree number to the tree and attach the tag to the stump.
2. Estimate and record the diameter of the tree.
3. Note in the remarks, that you estimated the diameter.
4. Record any pathological indicators on the tree. See “Pathological Indicators” in this chapter.
Establishing Sub-plots We establish sub-plots within a given plot to get some representation of trees smaller than the plot tagging limit, that is, trees less than 4 cm dbh. The objective is to obtain a sample of approximately 20 trees of commercial species that are less than 4 cm dbh and at least 0.3 m high.
Choosing the Sub-plot Size Like the sample, the sub-sample consists of one circular sub-plot. Like the plot, the size of the sub-plot depends on the stand's density. The minimum acceptable size is 0.002 ha and the maximum is the plot size.
Choose the sub-plot size that will produce the desired number of trees. For a list of sub-plot sizes and radii, see Appendix 6.
Using the procedure described in “Marking the Plot Circumference” in this chapter, mark the sub-plot circumference with string.
Dividing the Sub-plot into Sectors For the sub-plot, use the same sector divisions you laid out for the main plot.
November 2007 7
Growth and Yield Standards and Procedures
Tagging Trees in the Sub-plot
What to Tag
Tag with nails all living trees of commercial species between 2 cm dbh and 3.9 cm dbh. For procedures, see “Tagging Trees” in this chapter.
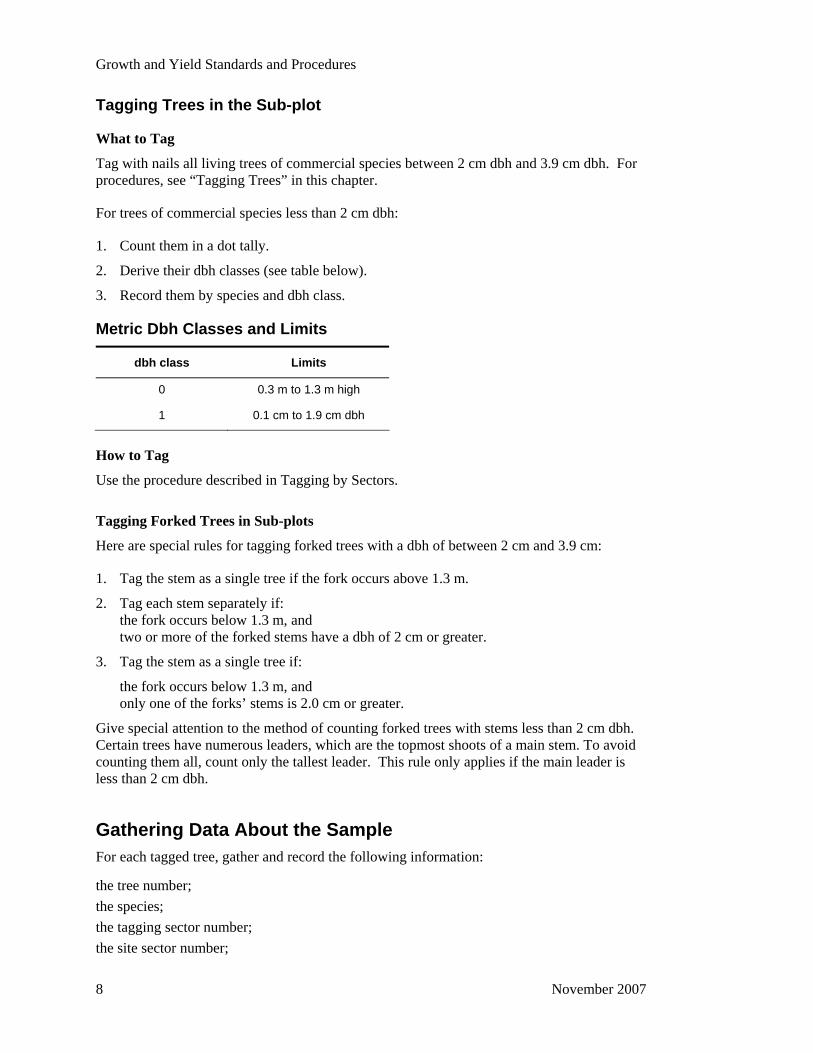
For trees of commercial species less than 2 cm dbh:
1. Count them in a dot tally.
2. Derive their dbh classes (see table below).
3. Record them by species and dbh class.
Metric Dbh Classes and Limits
dbh class Limits
0 0.3 m to 1.3 m high
1 0.1 cm to 1.9 cm dbh
How to Tag
Use the procedure described in Tagging by Sectors.
Tagging Forked Trees in Sub-plots
Here are special rules for tagging forked trees with a dbh of between 2 cm and 3.9 cm:
1. Tag the stem as a single tree if the fork occurs above 1.3 m.
2. Tag each stem separately if: the fork occurs below 1.3 m, and two or more of the forked stems have a dbh of 2 cm or greater.
3. Tag the stem as a single tree if:
the fork occurs below 1.3 m, and only one of the forks’ stems is 2.0 cm or greater.
Give special attention to the method of counting forked trees with stems less than 2 cm dbh. Certain trees have numerous leaders, which are the topmost shoots of a main stem. To avoid counting them all, count only the tallest leader. This rule only applies if the main leader is less than 2 cm dbh.
Gathering Data About the Sample For each tagged tree, gather and record the following information:
the tree number; the species; the tagging sector number; the site sector number;
8 November 2007
Growth and Yield Standards and Procedures
the dbh (must be >10.0 cm for dead trees); the tree class; pathological indicators or dead tree attributes; the crown class (living trees only); suitability for height measurement, (Y)es, (N)o, (C)ould be, (F)lagged, (V)ery difficult to
measure, (E)asy to measure; the live-crown length (living trees only); damage agent codes, if applicable.
The data must be captured digitally in the field with an Electronic Field Recorder (EFR) using Gyhost/Gyhand software (see “Gyhost/Gyhand: A Data Collecting, Editing and Reporting System” on the Ministry’s Web Page). In case of emergency (i.e. EFR breaks down) the data may be collected on field sheets and then later entered into the Gyhost/Gyhand system. For information on how to fill out the field sheets, see “Completing the Field Sheets” in Appendix 16. See Appendix 19 for a copy of the “Growth Sample Record Sheet”.
Measuring the Trees For tagged trees in the sample with a dbh of 2 cm or more, measure the diameter just above the nail to the nearest millimetre. Make sure the diameter tape is perpendicular to the bole of the tree, and is pulled tight. See Appendix 9.
Abnormal trees
For abnormal trees less than 2 cm dbh within the sub-plot, special measurement rules apply. See Appendix 10.
Classifying Trees Classify each tagged tree according to its pathological indicators.
To classify a tree properly, view it from all sides. The person measuring dbh should move far enough away from the tree to be able to classify the lower third of the stem. The recorder should move around the tree to classify the upper two thirds.
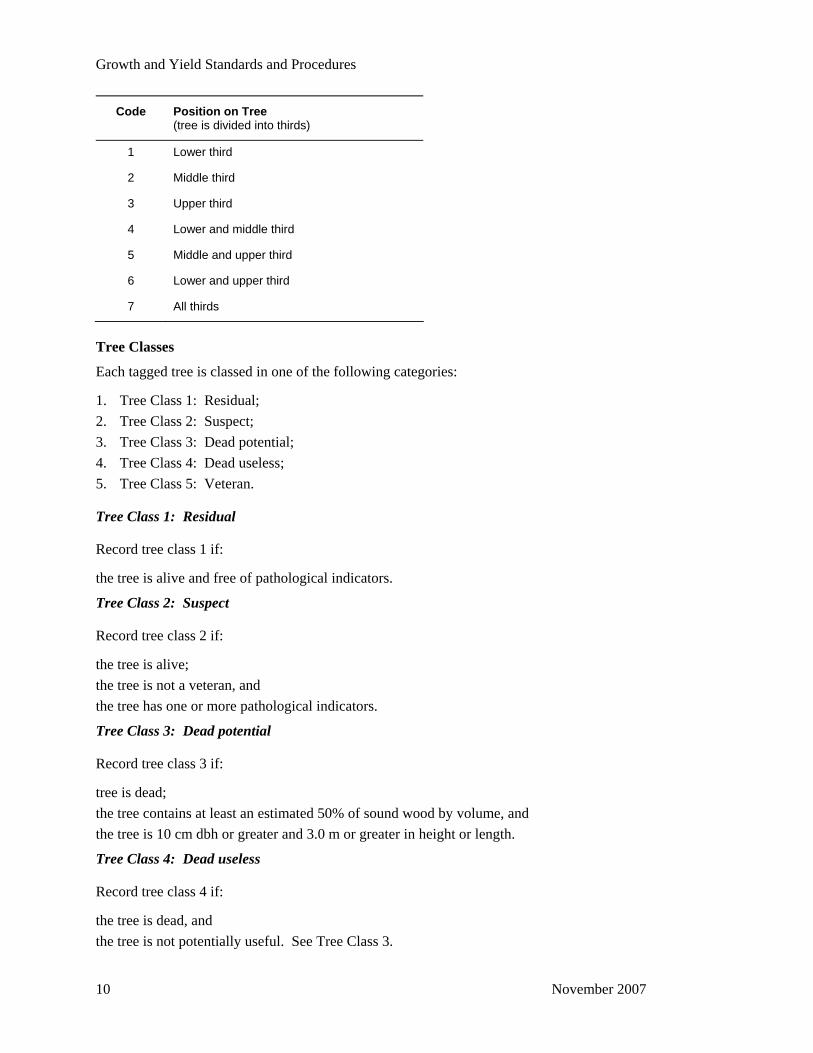
Record each pathological indicator as occurring on the lower, middle or upper third of the total height of the tree. Do this by entering the following Pathological (Decay) Indicator Position Codes:
November 2007 9
Growth and Yield Standards and Procedures
Code Position on Tree (tree is divided into thirds)
1 Lower third
2 Middle third
3 Upper third
4 Lower and middle third
5 Middle and upper third
6 Lower and upper third
7 All thirds
Tree Classes
Each tagged tree is classed in one of the following categories:
1. Tree Class 1: Residual; 2. Tree Class 2: Suspect; 3. Tree Class 3: Dead potential; 4. Tree Class 4: Dead useless; 5. Tree Class 5: Veteran.
Tree Class 1: Residual
Record tree class 1 if:
the tree is alive and free of pathological indicators.
Tree Class 2: Suspect
Record tree class 2 if:
the tree is alive; the tree is not a veteran, and the tree has one or more pathological indicators.
Tree Class 3: Dead potential
Record tree class 3 if:
tree is dead; the tree contains at least an estimated 50% of sound wood by volume, and the tree is 10 cm dbh or greater and 3.0 m or greater in height or length.
Tree Class 4: Dead useless
Record tree class 4 if:
the tree is dead, and the tree is not potentially useful. See Tree Class 3.
10 November 2007
Growth and Yield Standards and Procedures
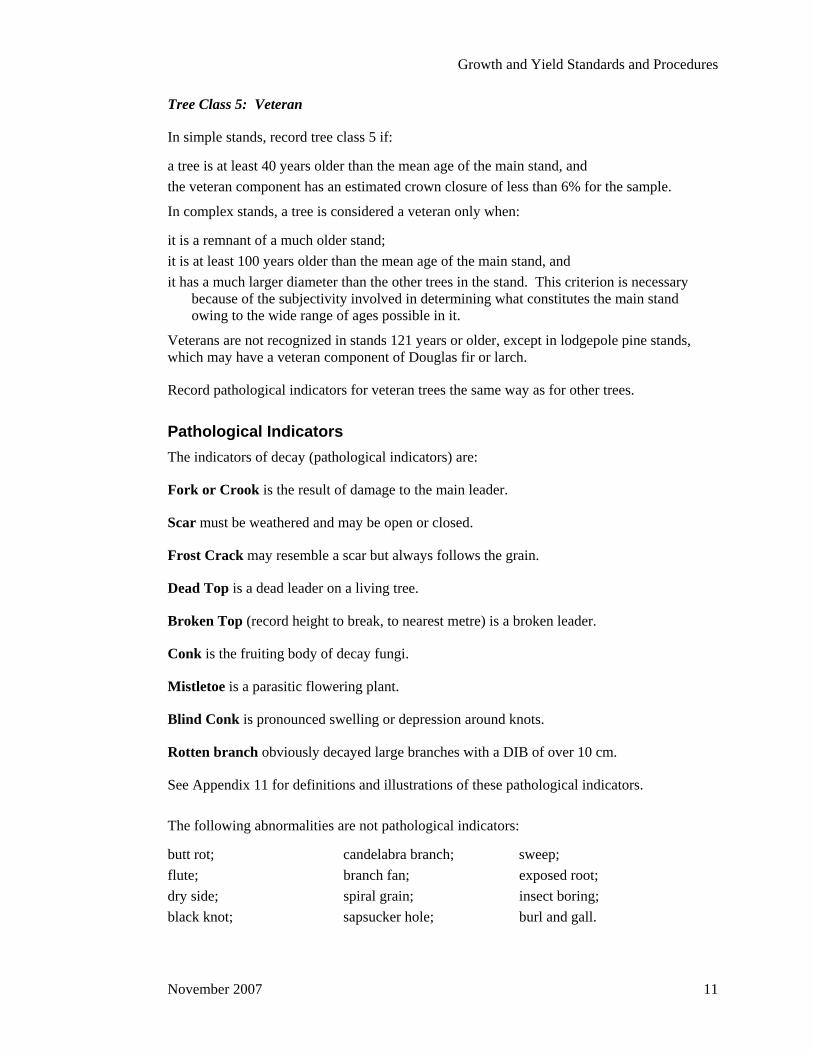
Tree Class 5: Veteran
In simple stands, record tree class 5 if:
a tree is at least 40 years older than the mean age of the main stand, and the veteran component has an estimated crown closure of less than 6% for the sample.
In complex stands, a tree is considered a veteran only when:
it is a remnant of a much older stand; it is at least 100 years older than the mean age of the main stand, and it has a much larger diameter than the other trees in the stand. This criterion is necessary
because of the subjectivity involved in determining what constitutes the main stand owing to the wide range of ages possible in it.
Veterans are not recognized in stands 121 years or older, except in lodgepole pine stands, which may have a veteran component of Douglas fir or larch.
Record pathological indicators for veteran trees the same way as for other trees.
Pathological Indicators The indicators of decay (pathological indicators) are:
Fork or Crook is the result of damage to the main leader.
Scar must be weathered and may be open or closed.
Frost Crack may resemble a scar but always follows the grain.
Dead Top is a dead leader on a living tree.
Broken Top (record height to break, to nearest metre) is a broken leader.
Conk is the fruiting body of decay fungi.
Mistletoe is a parasitic flowering plant.
Blind Conk is pronounced swelling or depression around knots.
Rotten branch obviously decayed large branches with a DIB of over 10 cm.
See Appendix 11 for definitions and illustrations of these pathological indicators.
The following abnormalities are not pathological indicators:
butt rot; candelabra branch; sweep; flute; branch fan; exposed root; dry side; spiral grain; insect boring; black knot; sapsucker hole; burl and gall.
November 2007 11
Growth and Yield Standards and Procedures
Dead Tree Attributes The following attributes are collected on dead trees that are 10.0 cm and greater in dbh in place of pathological indicators. See Appendix 22.
species certainty; vertical position: standing only for establishment; presence of breakage; height to break if broken, ocular estimate; damage agent code and severity see Appendix 14; wildlife tree appearance.
Assessing whether a tree is still alive may be difficult in certain situations. Ensure that all needles are dead if the tree is being called dead, and if uncertain, err on the side of caution by calling it alive.
Assessing Damage Agents and Severity We collect insect, disease and injury data to quantify their effect on tree growth.
For each tree affected:
1. Identify, if possible, the two most damaging agents (see Appendix 14 for damage agents and severity codes).
2. Assess the damage severity.
3. Record the damage agent code to a level that you are confident. The damage agent codes are hierarchical and enable coding from very general (type or
category) to specific (species). The first letter indicates the type of the damage while the second and third indicate the specific agent;
If you are unable to identify the damage agent species, a short, incomplete label is still useful. Example: You may identify a defoliating insect and assess the percent defoliation for the tree as 30 percent. Record this as ID_30.
For the sample affected:
1. Identify the two most damaging agents in the sample.
2. Calculate the percent assessment of each agent for the sample. Determine the damage severity to the nearest one percent up to ten percent and the nearest five percent for severities greater than ten percent.
3. Record this assessment in the header. If known, also record the year in which the damage took place.
Assigning a Crown Class Code Crown class refers to the position of the crown of a tree relative to all other trees within the general plot area, not the whole stand.
There are 6 crown classes:
1. Crown class 1: Dominant;
12 November 2007
Growth and Yield Standards and Procedures
2. Crown class 2: Codominant; 3. Crown class 3: Intermediate; 4. Crown class 4: Suppressed; 5. Crown class 5: Veteran; 6. Crown class 6: Understory.
For more details on crown classes, see Appendix 12.
Assign a crown class code of 1 through 6 to each tagged tree classed as tree class 1, 2 or 5 (see “Classifying Trees” in this chapter).
Note: Crown class 6 should be used sparingly; do not confuse it with crown class 4. Use crown class 6 only in stands 60 years or older where the understory trees, usually shade tolerant, are clearly much younger than the main stand.
Estimating Live-crown Length Live-crown length is the distance between the treetop, if the top is alive, or from the top of the live portion, if the treetop is dead and the base of the lowest contiguous live crown. The estimate is expressed as a percentage of the total height of the tree.
Estimate, to the nearest 10 percent, the live-crown length of all living tagged trees.
When determining the base of the lowest contiguous live crown, do not consider forks or epicormic branches;
The tops of defoliated trees may appear dead at the time of the assessment. Make sure it is or you may underestimate the live-crown length.
Recording Stumps In plots established in selectively logged stands, measure and record, by sector, information about each stump of a commercial species with a diameter at breast height of 12.5 cm or greater.
1. Identify stumps of commercial species with diameters of 12.5 cm or greater. Ignore non-merchantable stumps cut at the time of selective logging.
2. Assign each stump a tree number. Tree numbers for stumps range from 900 to 979. Tagging the stump is not necessary.
3. For each stump, determine: the species; height; diameter; whether the stump is new or old - under 10 years since cutting, or over 10 years; the tree number of the closest tagged tree.
Determining the Stand Structure Stand structure is the physical arrangement or pattern of organization of the stand. Stand structure is described and classified according to recognizable age and height differences.
November 2007 13
Growth and Yield Standards and Procedures
The recognized stand structures are:
1. Single layer, simple stands (even age and height) with veterans without veterans
2. Single layer, complex stands (uneven age and height) with veterans without veterans
3. Multi layer stands layer 1 is the top layer layer 2 is the bottom layer
For single layer stands, layer 1 is assumed for trees in the main stand and tree class 5 identifies the veteran layer.
For multi layer stands, record 1 for the top layer trees and 2 for the bottom layer. The sample primary layer, according to regional priorities, must be identified.
For further details on stand structure, see Appendix 13.
Height Sample Trees Local height-diameter curves are constructed from sample data before compiling samples.
To construct reliable curves, a substantial number of heights are needed for each species. The number depends on the stand composition, which ultimately is based on basal area. In the field, use the calculated basal area for stand composition.
Top Height
Select the top height tree from a 0.01 ha circular plot at plot centre. Record “C” (centre sector) for the tree. Top height (1998) is the height of the largest diameter tree, regardless of species, in a 0.01 ha plot, providing the tree is suitable. A suitable tree must be healthy, not have a broken or damaged top, not have its height growth affected by a competitor nor be a residual left from previous logging. There is no substitution for an unsuitable tree.
If the PSP is one selected for SIBEC, select the largest diameter tree of each additional species in the 0.01 ha circular plot at plot centre, and record “C” (centre sector) for the tree.
For a single-layered stand, or for each layer in a multi-layered stand, select height sample trees as follows:
First Two Major Species
For each of the first two major species (20 percent or more by composition), select trees for the sample as follows:
1. Select the required number of site trees, to a maximum of ten. These trees are selected on the basis of the largest diameter tree per 0.01 ha plot or sector. Suitable trees have the following characteristics:
14 November 2007
Growth and Yield Standards and Procedures
largest diameter trees; living; free of major defects; crown class of 1 or 2. The exception is in the case of the second layer in a two-layer
stand where crown class 3 and 4 are acceptable; cannot be substituted.
Example: On a 0.1 hectare sample, the ten largest dbh trees from each of the two leading major species are selected for site tree measurements. Similarly, four trees would be selected in a 0.04 hectare sample.
2. Select an additional 15 trees distributed evenly across the remaining dbh range, down to 2 cm dbh.
For Third and Fourth Majors, Minor and Scattered Species
For the third and fourth major species (20 per cent or greater by composition), each minor species (10 to 19 percent by composition) and for scattered species (less than 10 percent by composition), select 15 trees, if present and suitable. Distribute them across the dbh range, down to 2 cm dbh. Place emphasis on larger diameter classes.
For Veterans
For the veteran layer:
1. Select one tree for each species present.
2. Estimate the height of all others.
3. Record the estimated height in the small tree or Vet height section.
Selecting Sample Trees
When possible, select residual trees (tree class 1). See “Classifying Trees” in this chapter. Otherwise, select trees that do not have a major fork, which affects the true height, or a major scar at breast height, which affects the true diameter.
Do not select trees with:
diameters that were estimated; sweeps or leans greater than 10 degrees.
In some areas, it may be impossible to meet sample height requirements if only suitable trees as described above are taken. In this situation, take the best of the “poor” trees to meet the requirements. However, do not select a tree if its height is less than 95% of what it would be without its defect - lean, fork, broken top, etc.
Measuring Suppressed Trees with Flattened Tops
To ensure accurate measurements of suppressed trees:
1. Sight on the highest point of the top.
2. For hemlock trees, sight on the highest point of the droop.
November 2007 15
Growth and Yield Standards and Procedures
3. For cedar trees, make sure you take the top reading on the tiny leader and not on a lateral branch, which may be higher.
Measurement Consistency
To make sure the height measurement is taken consistently from the same location, paint a blue dot at dbh to indicate the direction from which you made the height measurement.
Age Sample Trees
In single layer, simple stands, pure and mixed, the age of the stand is determined by averaging the ages of the site trees of the leading major species on the plot. However, ages of the site trees of the second major species must also be taken.
The sample mean age is derived from the site trees of the leading species only, even if some of their cores are rotted. The rotted portion must be estimated to derive a total age for the tree. See “Counting Rings on Rotted Cores” in this chapter.
Bore trees that appear to be veterans to confirm they are in fact veterans. Bore the smallest diameter veteran per species only; the others can then be assumed to be veterans too. Use these ages for the veteran layer.
In single layer, complex stands determine the average age of the stand from the ages of the site trees of the leading major species. However, to show the variation of the stand's age, take two additional ages of the leading major species from the younger portion of the stand. Treat the second major species the same as the leading.
In multi layer stands, select sample trees, as outlined above, for each layer. The site tree method for determining site index is more suitable for even-aged stands. However, to simplify matters, select sample trees for both layers using the site tree requirements as above.
Taking the Age of a Tree
1. Bore the selected trees 1.3 m above the base of the tree on the uphill side.
2. Remove the core. Make sure two cores per species include the pith.
3. If the core includes the pith, record “Y” in the pith field.
4. Rebore the tree if you missed the pith by more than an estimated: 2 years on a tree younger than 100 years, or 2 percent on a tree older than 100 years.
5. While in the field, count the rings on the core and record the count. (Note that the first ring from the pith as 1 year, not pith).
6. Measure and record the radial increment for the last 5, 10 and 20 years.
7. Measure and record the evidence of suppression, if any. See Appendix 23.
8. Place the core in a plastic straw with the following information: region number, R#; compartment number, Co#; sample number, G#; tree number;
16 November 2007
Growth and Yield Standards and Procedures
species; counted age.
Counting Rings on Rotted Cores
If the sample tree has rotted:
1. Count the rings on the sound portion of the core.
2. Estimate the number of years in the rotten portion.
3. Add the number of years in the sound portion to the estimated number of years in the rotten portion.
4. Record the total breast-height age with an (R)otted for pith.
Boring Small Trees
If it is not possible to bore a small (less than 4 cm dbh) tree without damaging it:
1. Select a tree of a similar diameter and height outside the plot and bore it.
2. Assign the age to the plot tree.
3. Record (E)stimated for pith.
Estimating Other Plot Attributes
Estimating Crown Closure
Crown closure is the percentage of ground area covered by the vertically projected crowns of trees.
For each plot, estimate and record the crown closure by layer to the nearest 10 percent.
For the veteran component of the plot, record crown closure to the nearest percent. If the crown closure of the veteran component for the sample is 6% or more, it must be classified as a separate layer.
Determining Elevation
Determine and record the elevation of each plot.
Determining Aspect and Slope
Determine the aspect and slope for each plot.
Determining Slope Position
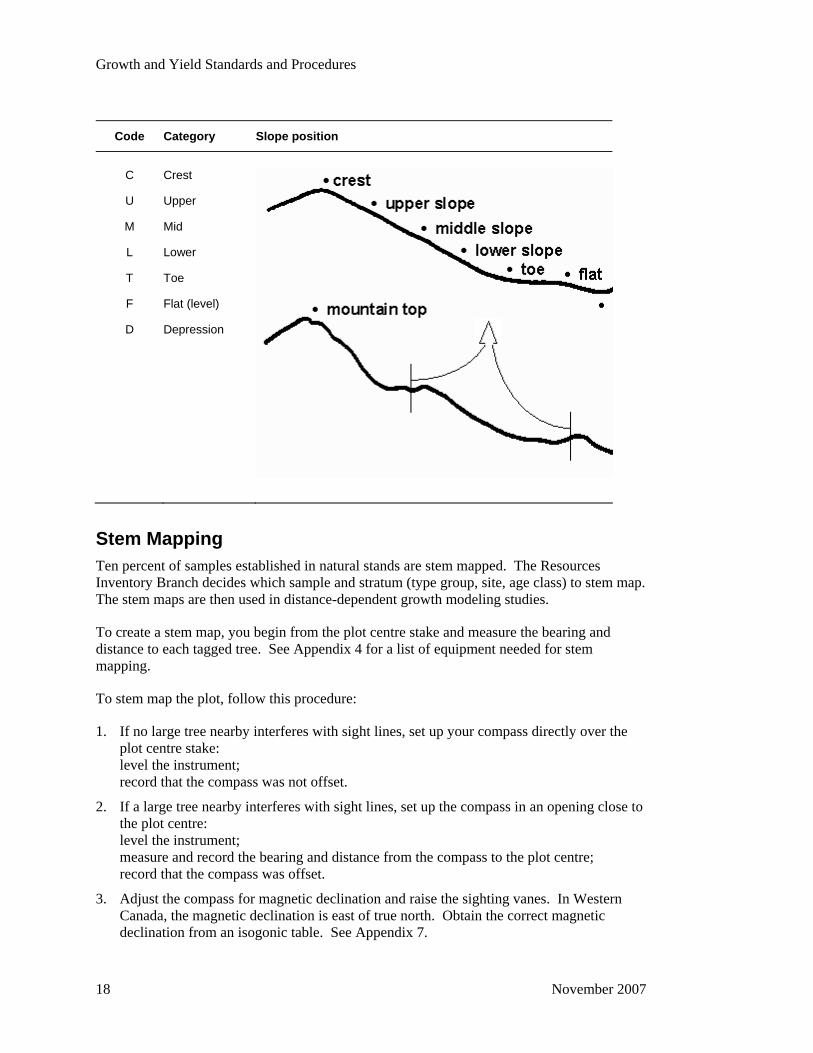
Slope position is the relative position of the plot within a water catchment area. Determine the slope position and record the appropriate code:
November 2007 17
Growth and Yield Standards and Procedures
Code Category Slope position
C
U
M
L
T
F
D
Crest
Upper
Mid
Lower
Toe
Flat (level)
Depression
Stem Mapping Ten percent of samples established in natural stands are stem mapped. The Resources Inventory Branch decides which sample and stratum (type group, site, age class) to stem map. The stem maps are then used in distance-dependent growth modeling studies.
To create a stem map, you begin from the plot centre stake and measure the bearing and distance to each tagged tree. See Appendix 4 for a list of equipment needed for stem mapping.
To stem map the plot, follow this procedure:
1. If no large tree nearby interferes with sight lines, set up your compass directly over the plot centre stake: level the instrument; record that the compass was not offset.
2. If a large tree nearby interferes with sight lines, set up the compass in an opening close to the plot centre: level the instrument; measure and record the bearing and distance from the compass to the plot centre; record that the compass was offset.
3. Adjust the compass for magnetic declination and raise the sighting vanes. In Western Canada, the magnetic declination is east of true north. Obtain the correct magnetic declination from an isogonic table. See Appendix 7.
18 November 2007
Growth and Yield Standards and Procedures
4. Sight on to the first tree on the plot. Some tips for sighting are listed below: to avoid sighting the wrong tree, wrap the dbh stick with flagging tape to make it more
visible, then place the stick in front and center of the tree; to avoid false compass readings as you sight the tree, keep sources of magnetic
interference away from the compass, including steel tapes, axes, knives, steel datum holders, eye glasses with steel frames, and most metal objects;
to simplify recording and possibly minimize errors, use a staff compass with Azimuth bearings when possible.
5. Measure the slope distance between the plot centre and the centre of the tree.
6. Measure the slope with the Suunto clinometer using the percent scale.
7. Read the compass bearing on the scale at the north end of the compass needle.
8. Record all measurements for each tagged tree in the plot.
Collecting Ecological Data All samples established in natural stands are ecologically assessed. Collect and record ecological data to the Biogeoclimatic Ecosystem Classification (BEC) site series level. See Appendix 25. If it is not possible to collect the ground data at the time of measurement, at minimum, obtain the BEC Zone, Sub-Zone, and Variant.
Quality Assurance Sampling crews should emphasize accuracy over production. For the standards of measurement see Appendix 1.
Checking Sampling Crews
To ensure crews follow and understand recommended procedures, carry out regular inspections.
1. Inspect at least 10 percent of all samples established. If the sample has been poorly done, the original crew may be required to redo it.
2. Make spot checks as work progresses to be sure tie points are properly marked and that tie lines are run on the designated bearings and horizontal distance.
3. To observe sampling crew performance, occasionally visit each crew on the sample.
Checking the Samples in the Office
All samples must be inspected in the office before sending them to the Vegetation Resources Inventory Section of the Terrestrial Information Branch. Check the following:
1. The sample identification is correct and valid.
2. The sample header is as complete as possible.
3. The minimum tree requirements were met for both plot and sub-plot.
4. The number and distribution of tree heights were met.
5. The required number of ages and piths were met.
November 2007 19
Growth and Yield Standards and Procedures
6. The access notes are complete and include the tie point sketch.
Inspecting the Samples Once the samples have been checked in the office, randomly select one of the plots and conduct the following:
1. A pre-field inspection.
2. A field inspection.
3. A post-field inspection.
Pre-field Inspection
1. Randomly select one of the samples from the ones checked in the office.
2. Enter the following information in the section at the top of the plot inspection report: sample identification -- region, compartment, sample, sample type, plot; the plot and sub-plot sizes; the plot and sub-plot radii; the inspection date; the original tally crew; the measurement date.
3. Randomly select seven live trees and two dead trees for tree detail checking.
4. Transcribe the measurements of the seven live trees and two dead trees to the top section of the plot inspection report. See Appendix 15.
5. Randomly select five trees from the sample tree section, for height checking.
6. Transcribe the height measurements of the five trees to the sample tree section of the plot inspection report.
7. Select two age cores and check the age count as well as the suppression readings.
8. Transcribe the crown closure, aspect, slope and slope position of the plot to the appropriate section of the plot inspection report.
9. Randomly select one tree count diameter class for a species. Later, use this diameter class in the field to check that the dot tally is correct for the species and class.
Note: Steps 2 to 9 are automatically done on the Gyhost/Gyhand Data Capture and Reporting System. Select the quality assurance report for printing.
Field Inspection
1. Use the access notes to get to the sample and verify their accuracy and completeness.
2. Check that the tie point is correctly marked. See “Choosing a Tie Point” in this chapter.
3. Make sure the tie line bearing and distance run within the allowable standards.
4. Make sure the plot centre markers are correctly inscribed, and that the plot centre stake is protected with a cairn.
20 November 2007
Growth and Yield Standards and Procedures
5. Check the plot and sub-plot radius at a minimum of three different locations. Check for trees that were missed or that should have been excluded from the plot or sub-plot.
6. Within the plot or sub-plot, make sure trees larger than the tagging limits were not missed. Also check for trees that were tallied when they should not have. Flag with a circled asterisk any missed or erroneously tallied tree.
7. Make sure all sub-plot trees of the selected tree count class were counted in the dot tally.
8. Carefully measure all the trees selected for field inspection: Tree identification - Make sure the genus or species of each tree is correct. If not, place
a circled asterisk beside the tree. Tree tag height - Check the tag height of the seven selected trees to verify that breast
height is 1.3 m above the base of the tree on the uphill side. At the same time, make sure the nails were securely driven into the trees and the nail with the tag was driven in at a slight angle so that the tag hangs away from the tree.
Diameter and pathological remarks (decay indicators) - Measure the dbh of the seven live and two dead selected trees and classify them.
Sample tree heights - Measure the five selected trees for height. Stem mapping - If the sample was stem mapped, check the seven selected trees for
bearing, distance and percent slope.
9. Assess the crown closure for the plot.
10. Compare your measurements with the crew's measurements. Give the crew the benefit of the doubt.
11. Check that the results conform to the standards of measurements. See Appendix 1.
12. If the difference between two measurements is greater than the allowable error, place an asterisk in the margin.
13. If the error is greater than two times the allowable error, circle the asterisk.
14. Complete the inspection items section of the inspection report.
15. Rate the quality of the work on the plot using the weighted system in Appendix 2.
16. Record your rating of the sample and any other comments in the remarks section of the plot inspection report.
Post-field Inspection
1. Discuss the results of your inspection with the original field crew.
2. Make recommendations to the original field crew, if necessary, on how to improve their work.
3. Correct all the original data that was flagged with an asterisk or a circled asterisk in your inspection report.
Mapping Samples Once you establish the samples:
1. Plot them on forest cover maps.
2. Send copies of the maps to the Terrestrial Information Branch.
November 2007 21

Growth and Yield Standards and Procedures
Submitting the Samples
Once the samples are checked in the office and corrected: 1. Send a list of all the samples, any original field sheets, the electronic download from the
GyHost as well as a hard copy of reports 1, 2, 3, 5 and 7 to the Vegetation Resources Inventory Section of the Terrestrial Information Branch.
2. Keep a copy of all the above for security and reference.
22 November 2007
Growth and Yield Standards and Procedures
2. Remeasurement of Permanent Sample Plots in Natural Stands
Introduction Samples in natural stands are remeasured every ten years. This interval should be maintained whenever possible. A list of samples with their establishment and remeasurement dates and map locations is regularly circulated to the regions so that remeasurement can be planned in advance.
The standards of measurement for permanent samples are listed in Appendix 1.
If not already done, ecologically classify, according to Research Branch specifications, all samples due for remeasurement.
Since permanent samples are cost intensive, protecting them is of the utmost importance. To ensure their protection, the protection buffers illustrated in Appendix 18 are recommended.
Preparing for Field Work Before field work starts, prepare and collect:
Copies of the original field sheets
Maps to show you how to get to the sample – example, 1:250 000 contour maps – and photocopies of parts of forest cover maps, which have an approximate scale of 1:20 000 and show the plot’s location in detail.
Photos showing original tie points, either those used when the sample was established, or, preferably, the latest photos on which tie points and sample locations were replotted.
Equipment. See Appendix 4 for the equipment needed.
Field Training All personnel involved in remeasurement work must attend a field procedures course.
Relocating the Plot
Checking Location and Access The notes on the location of the plot and access to the plot usually begin with a description of an easily identifiable point.
1. Follow the access notes to the tie point.
November 2007 23
Growth and Yield Standards and Procedures
2. Correct the notes where necessary.
The reference or tie point generally is a prominent topographic feature distinguishable on the photos and on the ground. Examples: a road junction, road bend, creek junction or bridge.
The blazed and/or painted tie tree should be located nearby, as described in the access notes. Aluminum sample markers were nailed to the tie tree, and strands of plastic flagging tape should still be noticeable on or near the tree.
The aluminum marker contains pertinent sample information such as:
• region number; • compartment number; • sample type (G); • sample number and plot number (usually 1, but 3-plot samples exist); • bearing and distance to the plot centre; • date the sample was established.
For more information on sample markers, see Appendix 5.
New Tie Point Needed
If a new tie point is needed:
1. Select a new tie point recognizable on the photos and the ground.
2. From the map, measure and record the new bearing and distance to the plot centre.
3. Paint both sides of the tie tree in the direction of the tie line.
4. Nail an aluminum sample marker above the paint.
5. Inscribe the pertinent information on the middle and bottom sections of the 2 markers. Note: “Date” on the marker always refers to the date the sample was originally established. See Appendix 5.
6. Flag the tie tree with two strands of flagging tape, one above and one below the markers.
7. To aid future measurement crews, prepare a sketch showing the tie point, the sample location, and other significant topographic features. Attach the sketch to the access notes.
If you establish a new tie point, you must run a new tie line.
Checking the Tie Line The tie line is run from the tie point with a hand compass, a clinometer and a measuring tape. When you rerun the original tie line, it is sufficient to paint the blazes, and to renew the tape markings.
Checking the Centre Tree Each established plot has a centre tree marked with aluminum markers and strands of flagging tape. The markers and tape are usually secured about two metres above ground to
24 November 2007
Growth and Yield Standards and Procedures
avoid interfering with dbh measurements. If the centre tree is missing, either because of natural causes or because somebody cut it down:
1. Select another centre tree near the plot centre.
2. Mark it with the two aluminum markers and flagging tape.
Checking the Plot Centre Tree Markers
Missing or Illegible Plot Markers
Discovering missing or illegible plot centre tree markers is not unusual. Here’s how to proceed:
1. Replace the old markers. Centre tree markers are the same as those used for tie point trees. See Appendix 5.
2. Complete the top and bottom sections of the markers. Include the following information: • sample type (G); • sample number; • plot number; • region number; • compartment number; • date the plot was established.
When the Plot Centre Is Also a Tie Point
Very often the plot centre also serves as a tie point for the next plot on the tie line. When it is, the middle section of the marker should also be filled out.
Checking the Plot Centre Stake The plot centre is marked by a tubular aluminum stake either driven into the ground or supported by a cairn on rocky ground. You can usually identify the stake by the flagging tape on it. If the plot centre stake location has never been stem mapped, select three trees around the plot centre and record the bearing, slope, and distance from the plot centre stake to the centre of each tree. Place a nail at the centre of each tree for consistency in measuring distance to the centre stake.
Replace the plot centre stake if the stake is:
• missing; • pulled out but lying on the ground; • bent but still in the original location.
Replacing a bent stake is not difficult because it’s still stuck in the ground. For a stake found lying on the ground, you may locate its original position by simply looking around for signs of the plot centre location.
November 2007 25
Growth and Yield Standards and Procedures
In Case the Stake is Missing
Unless the centre stake location was stem mapped, relocating a missing plot centre stake is a difficult, time-consuming, but necessary task.
If the centre stake location was not stem mapped:
1. Tally the original trees on the plot before relocating the centre stake. Some tags may be down or missing, so replace them before relocating the centre stake.
2. Determine the approximate centre by observing the layout of the sectors.
3. Find trees close to the plot perimeter and measure the plot radius from those trees until you determine the approximate plot centre. Using the ‘approximate plot centre’ and the plot radius as a starting point, check that all tagged trees are in the plot. If not, adjust the plot centre until they are.
4. If not already done, build a cairn around the newly relocated plot centre stake.
5. Measure the bearing, slope percent, and slope distance from the plot centre to 3 trees nearby. Place a nail at the centre of each tree for consistency in measuring distance to the centre stake.
6. In sample remarks, record that the centre stake was missing.
Remeasuring the Plot and Sub-plot Accurate work is required when you compare new measurements with previous ones. Always position the dbh tape just above the nail and perpendicular to the bole of the tree. Check measurements that appear to be out of the expected range, that is, measurements showing a very large increase compared with those showing little or no increase.
Correct any errors and note them in the remarks. Example: “dbh checked.”
Converting Breast Height in Industrial Permanent Samples See Appendix 21 for procedures to convert, if needed, industrial permanent sample plots (PSPs) from imperial (1.37 m) to metric (1.3 m) breast height.
Sectors in the Plot Plots were generally divided into eight tagging sectors with number one starting clockwise from the direction of the original tie line or, in later years, from the north. In order to aid in the choosing of top height and site trees, the plot must also be divided into 0.01 ha site sectors using the same procedure previously used - that is starting clockwise from the direction of the original tie line or from north. See Appendix 24.
Tagging Trees Determine the breast height of trees with missing tags, as well as of ingrowth trees. In 1991, breast height determination changed from using the point of germination to using the base of the tree on the uphill side. Therefore:
• for samples established before 1991, continue using the point of germination
26 November 2007
Growth and Yield Standards and Procedures
• for samples established after 1990, use the base of the tree on the uphill side
Up to 1979, all living trees had the tree tag nailed and dbh taken at 1.37 m above germination point. During the remeasurements from 1980 to 1989 inclusive, the dbh height and dbh were changed to 1.3 m above germination in one of two ways (see Appendix 21). If Method 1 was used, you will have to remove the nail at 1.3 m and replace it with the nail and tag that is at 1.37 m.
Note: If a plot is being remeasured that has not had the dbh changed from 1.37 m to 1.3 m, do it now following Method 2 in Appendix 21.
Missing Tags
For all previously measured living trees with missing tags:
1. Determine breast height at 1.3 m above germination, or 1.3 m above the base of the tree on the uphill side for samples established after 1990.
2. Nail a tag which has the same tag number as the missing one.
Finding Missing Tags
During the establishment, tagging began near the centre in sector 1 and continued in a zigzagging pattern toward the circumference with the tags facing the plot centre. Once all taggable trees in sector 1 were tagged, the procedure was repeated in sector 2, only this time tagging began at the circumference with the tags facing away from the plot centre. The procedures for tagging sectors 1 and 2 were repeated alternately for all remaining sectors of the plot.
Measuring DBH For all numbered living trees, measure above the nail, to the nearest millimetre, the diameter at 1.3 m.
To more accurately measure the diameter of trees that are or will soon be joined together at dbh, use the “1/2 wrap” method. To do this, measure or estimate, as accurately as you can, the diameter of each affected tree. Then, from the nail with the tag, measure half of the diameter around the bole of the tree and place a second nail. Note in the remarks that these are “1/2 wrap” measurements. In the future, the distance between the two nails will be measured and multiplied by two to arrive at the diameter of the tree.
After remeasuring the diameter:
• Pull out the nail holding the number enough to allow for tree growth until the next remeasurement.
For all previously numbered living trees now dead:
1. Measure the diameter above the nail at 1.3 m.
2. If you can’t find the dead tree, assign it the same diameter as in the previous measurement. If the tree was cut down, record it as Tree Class 6 and assign the same diameter as in the previous measurement.
November 2007 27
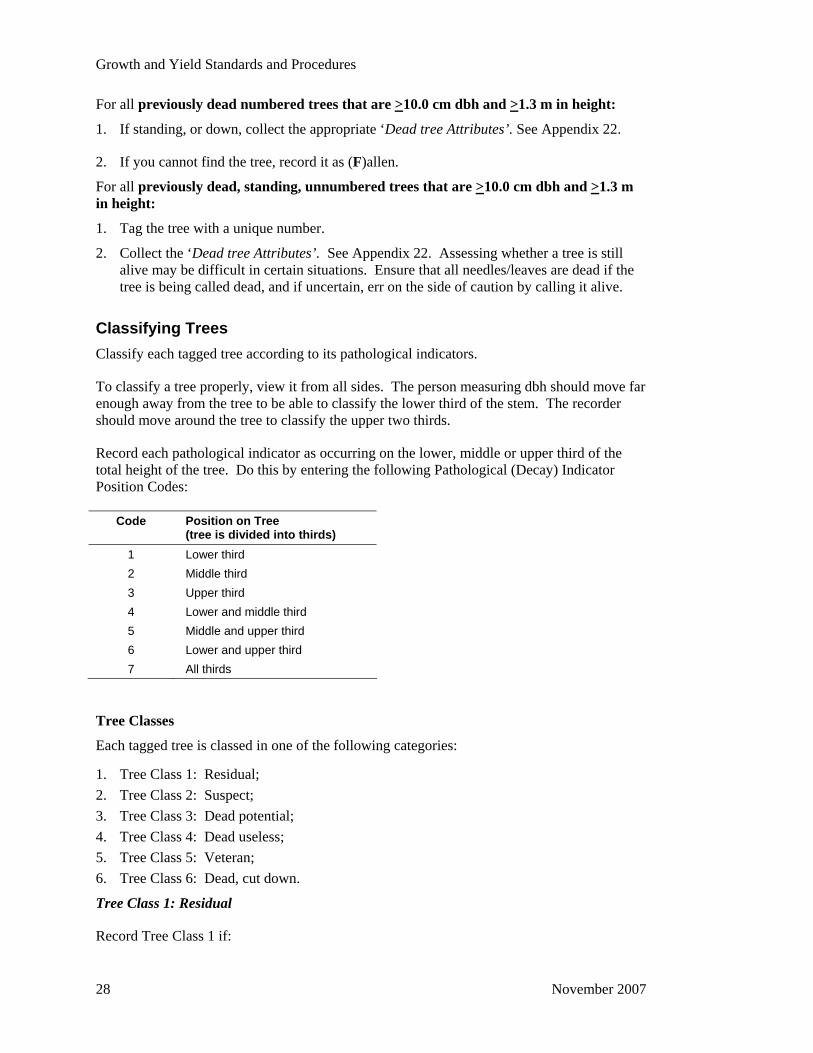
Growth and Yield Standards and Procedures
For all previously dead numbered trees that are >10.0 cm dbh and >1.3 m in height:
1. If standing, or down, collect the appropriate ‘Dead tree Attributes’. See Appendix 22.
2. If you cannot find the tree, record it as (F)allen.
For all previously dead, standing, unnumbered trees that are >10.0 cm dbh and >1.3 m in height:
1. Tag the tree with a unique number.
2. Collect the ‘Dead tree Attributes’. See Appendix 22. Assessing whether a tree is still alive may be difficult in certain situations. Ensure that all needles/leaves are dead if the tree is being called dead, and if uncertain, err on the side of caution by calling it alive.
Classifying Trees Classify each tagged tree according to its pathological indicators.
To classify a tree properly, view it from all sides. The person measuring dbh should move far enough away from the tree to be able to classify the lower third of the stem. The recorder should move around the tree to classify the upper two thirds.
Record each pathological indicator as occurring on the lower, middle or upper third of the total height of the tree. Do this by entering the following Pathological (Decay) Indicator Position Codes:
Code Position on Tree (tree is divided into thirds)
1 Lower third 2 Middle third 3 Upper third 4 Lower and middle third 5 Middle and upper third 6 Lower and upper third 7 All thirds
Tree Classes
Each tagged tree is classed in one of the following categories:
1. Tree Class 1: Residual; 2. Tree Class 2: Suspect; 3. Tree Class 3: Dead potential; 4. Tree Class 4: Dead useless; 5. Tree Class 5: Veteran; 6. Tree Class 6: Dead, cut down.
Tree Class 1: Residual
Record Tree Class 1 if:
28 November 2007

Growth and Yield Standards and Procedures
• the tree is alive, not a veteran and free of any decay indicators.
Tree Class 2: Suspect
Record Tree Class 2 if:
• the tree is alive; • the tree is not a veteran, and; • the tree has one or more decay indicators.
Tree Class 3: Dead Potential
Record Tree Class 3 if:
• the tree is dead, either standing or down; • the tree contains at least an estimated 50% of sound wood by volume, and; • the tree is greater than or equal to 10 cm dbh and greater than or equal to 3 m in height or
length.
If you can determine the tree died as a result of an insect or a disease, record the primary insect or disease responsible for the death. See Appendix 14 for damage agents and severity codes.
Tree Class 4: Dead Useless
Record Tree Class 4 if:
• the tree is dead, either standing or down; • the tree is not potentially useful. See Tree Class 3.
If you can determine the tree died as a result of an insect or a disease, record the primary insect or disease responsible for the death. See Appendix 14 for damage agents and severity codes.
Tree Class 5: Veteran
For simple stands, record Tree Class 5 if:
• a tree is at least 40 years older than the mean age of the main stand; • the veteran component has an estimated crown closure of less than 6% for the sample.
In complex stands, a tree is considered a veteran only when it:
• is a remnant of a much older stand; • is at least 100 years older than the oldest sample trees of the main stand; • has a much larger diameter than trees in the main stand. This criterion is necessary
because of the subjectivity in determining what constitutes the main stand owing to the wide range of ages possible in it.
Veterans are not recognized in stands 121 years or older, except in lodgepole pine stands, which may have a veteran component of Douglas fir or larch.
Record pathological indicators for veteran trees the same way as for other trees.
November 2007 29
Growth and Yield Standards and Procedures
Tree Class 6: Dead, Cut Down
Record Tree Class 6 if the tree is dead as a result of being cut down.
Pathological Indicators The indicators of decay (pathological indicators) are:
Fork or Crook the result of damage to the main leader.
Scar must be weathered and may be open or closed.
Frost Crack may resemble a scar but always follows the grain.
Dead Top is a dead leader on a living tree.
Broken Top (record height to break, to the nearest metre) is a broken leader.
Conk the fruiting body of decay fungi.
Mistletoe is a parasitic flowering plant.
Blind Conk pronounced swelling of depression around knots.
Rotten branch obviously decayed large branches with a DIB of over 10 cm.
See Appendix 11 for definitions and illustrations of these pathological indicators.
The following abnormalities are not pathological indicators.
• butt rot • black knot • sweep • flute • burl and gall • exposed root • candelabra branch • sapsucker hole • spiral grain • branch fan • insect boring • dry side
Assessing Damage Agents and Severity We collect insect, disease and injury data to quantify their effect on tree growth.
For each tree affected:
1. Identify, if possible, the two most damaging agents (see Appendix 14 for damage agents and codes).
2. Assess the damage severity.
3. Record the damage agent code to a level that you are confident. • The damage agent codes are hierarchical and enable coding from very general (type
or category) to specific (species). The first letter indicates the type of the damage while the second and third indicate the specific agent.
30 November 2007

Growth and Yield Standards and Procedures
• If you are unable to identify the damage agent species, a short, incomplete label is still useful. Example: You may identify a defoliating insect and assess the percent defoliation for the tree as 30 percent. Record this as ID_30.
For the sample affected:
1. Identify the two most damaging agents in the sample.
2. Calculate the percent assessment of each agent for the sample. Determine the damage severity to the nearest one percent up to ten percent and to the nearest five percent for severities greater than ten percent.
3. Record this assessment in the header. If known, also record the year in which the damage took place.
Assigning a Crown Class Code Crown class refers to the position of the crown of a tree relative to all other trees within the general plot area, not the whole stand.
There are six crown classes:
1. Crown Class 1: Dominant; 2. Crown Class 2: Codominant; 3. Crown Class 3: Intermediate; 4. Crown Class 4: Suppressed; 5. Crown Class 5: Veteran; 6. Crown Class 6: Understory.
For more details on crown classes, see Appendix 12.
Assign a crown class code of 1 through 4 and 6 to each tagged tree classed as Tree Class 1 or 2. For tree class 5, assign crown class 5 (see “Classifying Trees” in this chapter).
Note: Crown Class 6 should be used sparingly; do not confuse it with Crown Class 4. Use Crown Class 6 only in stands 60 years or older where the understory trees, usually shade tolerant, are clearly much younger than the main stand.
Estimating Live-crown Length Live-crown length is the distance between the treetop, if the top is alive, or from the top of the live portion, if the treetop is dead, and the base of the lowest contiguous live crown. The estimate is expressed as a percentage of the total height of the tree.
Estimate, to the nearest 10 percent, the live-crown length of all living tagged trees.
• When determining the base of the lowest contiguous live crown, do not consider forks or epicormic branches;
• The tops of defoliated trees may appear dead at the time of the assessment. Make sure it is or you may underestimate the live-crown length.
November 2007 31

Growth and Yield Standards and Procedures
Tagging Ingrowth Trees The term ingrowth trees refers to commercial and non-commercial trees that were below the tagging limit during the last measurement but now meet or exceed that limit.
When all previously numbered trees have been remeasured, tag all commercial and non-commercial living trees now 4 cm and greater at dbh by consecutive number for the plot.
Dealing with Forked Trees
Special rules govern the tagging of forked trees:
• If the fork occurs above 1.3 m: Tag the stem as a single tree, provided it has a dbh of at least 4 cm;
• If the fork occurs below 1.3 m, and two or more stems of the fork are 4 cm or greater in dbh: Tag each stem separately using consecutive numbers. Record, in the remarks, that these stems are forked together.
• If the fork occurs below 1.3 m, and only one of the stems is 4 cm or greater: Tag it as a single tree.
Tagging Procedure for Ingrowth Trees
1. If a large number of ingrowth trees are present, use consecutive, pre-numbered blue plastic tags. If few trees are present, use aluminum tags and inscribe the consecutive tree numbers for the plot.
2. Nail the tag to the tree 1.3 m above the germination point—or above the base of the tree on the uphill side, for samples established after 1990.
3. Do not use previously used numbers within the plot.
For plots in dense stands, string the plot circumference beforehand.
Recording Data About the Sample: For each tagged tree (4.0 cm + if alive or 10 cm + if dead) ensure that the following information is recorded:
• the tree number; • the species; • the tagging sector number; • the site sector number; • the dbh; • the tree class; • any pathological indicators or dead tree attributes; • the crown class (living trees only); • suitability for height measurement, (Y)es, (N)o, (C)ould be, (F)lagged, (V)ery
difficult to measure, (E)asy to measure; • the live-crown length; • damage agent codes, if applicable; • the tree number of the closest, previously numbered living tree (if ingrowth).
32 November 2007
Growth and Yield Standards and Procedures
The data must be captured digitally in the field with an Electronic Field Recorder (EFR) using Gyhost/Gyhand software (see “Gyhost/Gyhand: A Data Collecting, Editing and Reporting System” on the Ministry’s Web page. In case of emergency (i.e. EFR breaks down) the data may be collected on field sheets and then later entered into the Gyhost/Gyhand system. For information on how to fill out the field sheets, see “Completing the Field Sheets” in Appendix 16. See Appendix 19 for a copy of the “Growth Sample Record Sheet”.
Note: Previously classified trees that are now considered to be shrubs must be dropped (code “D” for drop) from the sample and tags removed.
Sub-plot and Tree Count To have some representation from trees below the plot tagging limit, a sub-plot was established for each sample. The objective was to obtain a total of 20 living commercial trees that were less than the plot tagging limit but at least 0.3 m in height. For a list of sub-plot radii, see Appendix 6.
Within the sub-plot, all living commercial trees 2 cm dbh and greater but less than the plot tagging limit were tagged using method 1 or method 2, previously mentioned in “Tagging Trees” in this chapter.
Trees of commercial species less than 2 cm dbh but 0.3 m in height had their tags wired onto either a branch or the main stem. These tags and wires should be removed if possible to prevent girdling of the stems.
Measuring Sub-plot Trees For trees 2 cm dbh and greater previously tagged within the sub-plot, use the same method as in the main plot. See “Tagging Trees” in this chapter.
Attach a number tag to the tree with a nail at breast height (1.3 m) if the tree:
• was less than 2.0 cm dbh during the last measurement; • has now a dbh of 2 cm or greater, and; • is a commercial species.
Include the tree in the dot count if the tree:
• is less than 2 cm dbh, and; • is a commercial species.
Special rules govern the tagging of forked trees at least 2 cm dbh but less than 4 cm dbh within the sub-plots:
• If the fork occurs above 1.3 m, tag the stem as a single tree; • If the fork occurs below 1.3 m, tag each fork as a tree, provided each is 2 cm dbh and
greater.
November 2007 33

Growth and Yield Standards and Procedures
Gathering & Recording Information About Sub-plot Trees
Trees 2 cm dbh and greater:
For each tree 2 cm dbh and greater in the sub-plot, record the following:
• the tree number; • the species; • the tagging sector number; • the site sector number; • the dbh; • the tree class; • any pathological indicators; • the crown class; • the live-crown length; • damage agent codes, if applicable; • suitability for height measurement, (Y)es, (N)o, (C)ould be, (F)lagged, (V)ery difficult to
measure, (E)asy to measure; • the number of the closest previously tagged plot living tree.
Trees Less than 2 cm dbh:
Count trees less than 2 cm dbh in a dot tally and record them:
• as dbh class 0 or 1. See Table 1 below • by species. See Appendix 3
Table 1. Metric dbh Classes and Limits
dbh class Limits
0 0.3 m to 1.3 m high 1 0.1 cm to 1.9 cm dbh
Forked Trees Less than 2 cm dbh:
Give special attention to the method of counting forked trees less than 2 cm dbh. Example: To avoid counting numerous leaders of trees that have been severely browsed, count only the tallest leader. See Appendix 10 for a further explanation.
Unusual trees:
Now and then, you will find unusual live trees within the sub-plot. Special rules apply when measuring the height of abnormal trees less than 2.0 cm dbh. See Appendix 10.
Determining the Stand Structure Stand structure is the physical arrangement or pattern of organisation of the stand. Stand structure is described and classified according to recognizable age and height differences.
34 November 2007
Growth and Yield Standards and Procedures
The recognized stand structures are:
1. Single layer, simple stands (even age and height) • with veterans • without veterans
2. Single layer, complex stands (uneven age and height) • with veterans • without veterans
3. Multi layer stands • layer 1 is the top layer • layer 2 is the bottom layer
For single layer stands, layer 1 is assumed for trees in the main stand and tree class 5 identifies the veteran layer.
For multi layer stands, record 1 for the top layer trees and 2 for the bottom layer. The sample primary layer, according to regional priorities, must be identified.
For further details on stand structure, see Appendix 13.
Height Sample Trees Local height-diameter curves are constructed from sample data before compiling samples.
To construct reliable curves, a substantial number of heights is needed for each species. The number depends on the stand composition, which ultimately is based on basal area. In the field, use the calculated basal area for stand composition.
Top Height
Select the top height tree from a 0.01 ha circular plot at the plot centre. For three-plot samples, select the top height tree only on the middle plot of the three-plot cluster. Record “C” (centre sector) for the tree. Top height (1998) is the height of the largest diameter tree, regardless of species, in a 0.01 ha plot, providing the tree is suitable. A suitable tree must be healthy, not have a broken or damaged top, not have its height growth affected by a competitor nor be a residual left from previous logging. There is no substitution for an unsuitable tree.
If the PSP is one selected for SIBEC, select the largest diameter tree of each additional species in the 0.01 ha circular plot at plot centre, and record “C” (centre sector) for the tree.
For a single-layered stand, or for each layer in a multi-layered stand, select height sample trees as follows:
First Two Major Species
For each of the first two major species (20 percent or more by composition), select trees for the sample as follows:
1. Select the required number of site trees on the basis of the largest diameter living tree per 0.01 ha plot or sector, to a maximum of ten. In the case of a sample larger than 0.1 ha,
November 2007 35
Growth and Yield Standards and Procedures
randomly select ten site sectors and take the site trees from them - do not substitute. In future remeasurements, the same sector numbers will be used to choose site trees.
Suitable site trees have the following characteristics: • free of major defects; • crown class of 1 or 2. The exception is in the case of the second layer in a two-layer
stand where crown class 3 and 4 are acceptable; • cannot be substituted.
Example: On a 0.1 hectare sample, the ten largest dbh trees from each of the two leading major species are selected for site tree measurements. Similarly, four trees would be selected in a 0.04 hectare sample.
2. Select an additional 15 trees distributed evenly across the remaining dbh range, down to 2 cm dbh.
For Third and Fourth Majors, Minor and Scattered Species
For the third and fourth major species (20 per cent or greater by composition), each minor species (10 to 19 percent by composition) and for scattered species (less than 10 percent by composition), select 15 trees, if present and suitable. Distribute them across the dbh range, down to 2 cm dbh. Place emphasis on larger diameter classes.
For Veterans
For the veteran layer:
1. Select one tree for each species present;
2. Estimate the height of all others;
3. Record the estimated height in the small tree or Vet height section.
Remeasuring Heights Consistently
To ensure future height measurements are taken consistently from the same direction, paint a blue dot, if not already done, at dbh to indicate the direction from which the height measurement was taken.
Ensure that height sample trees previously taken are remeasured for height and from the same direction as indicated by the blue painted dot (unless no longer suitable) even if the resultant distribution over the dbh classes is not optimum. If possible, strive for the full range of diameters down to 2 cm dbh.
Selecting Sample Trees
When possible, select residual trees (Tree Class 1). See “Classifying Trees” in this chapter. Otherwise, select trees that do not have major suspect characteristics, such as a major fork, which affects the true height, or a major scar at breast height, which affects the true diameter.
Do not select trees with:
• diameters that were estimated;
36 November 2007
Growth and Yield Standards and Procedures
• sweeps or leans greater than 5 degrees.
In some areas, it may be impossible to meet sample height requirements if only suitable trees as described above are taken. In this situation, take the best of the “poor” trees to meet the requirements. However, do not select a tree if its height is less than 95% of what it would be without its defect – lean, fork, broken top, etc.
Measuring Suppressed Trees with Flattened Tops
To ensure accurate measurements of suppressed trees:
1. Sight on the highest point of the top.
2. For hemlock trees, sight on the highest point of the droop.
3. For cedar trees, make sure you take the top reading on the tiny leader and not on a lateral branch, which may be higher.
Age Sample Trees
Note: If the present top height and site trees had their ages taken at 1.3 m during the last measurement, no further ages are required. If the top height tree or any site tree of the first and second leading major species, do not have an age at 1.3 m, it must be taken now and recorded in the “New Age” field.
In single layer, simple stands, pure and mixed, the age of the stand is determined by averaging the ages of the trees of the leading major species in the sample. However, ages of the site trees of the second major species must also be taken.
The sample mean age is derived from the site trees of the leading species only, even if some of their cores are rotten. The rotten portion must be estimated to derive a total age for the tree. See “Counting Rings on Rotted Cores” in this chapter.
Bore trees that appear to be veterans to confirm they are in fact veterans. Bore the smallest diameter veteran per species only; the others can be assumed to be veterans too. Use these ages for the veteran layer.
In single layer, complex stands, the average age of the stand is determined from the ages of the site trees of the leading major species. However, to show the variation of the stand’s age, take two additional ages of the leading major species from the younger portion of the stand. Treat the second major species the same as the leading.
In multi-layer stands, select sample trees, as outlined above, for each layer.
Taking the Age of a Tree
1. Bore the selected trees at 1.3 m.
2. Remove the core. Make sure two cores per species include the pith.
3. If the core includes the pith, record “Y” in the pith field.
4. Rebore the tree if you missed the pith by more than an estimated: • years on a tree younger than 100 years, or • percent on a tree older than 100 years.
November 2007 37
Growth and Yield Standards and Procedures
5. While in the field, count the rings on the core and record the count.
6. Measure and record the radial increment for the last 5, 10 and 20 years.
7. Measure and record the evidence of suppression, if any. See Appendix 23.
8. Place the cores in plastic straws with the following information: • the region number, R# • the compartment number, Co# • the sample number, G# • tree number • species • counted age
Counting Rings on Rotted Cores
If the sample tree has rotten portions:
1. Count the rings on the sound portion of the core.
2. Estimate the number of years in the rotten portion.
3. Add the number of years in the sound portion to the estimated number of years in the rotten portion.
4. Record the total breast-height age with an (R)otted for pith.
Estimating Other Plot Attributes
Estimating Crown Closure
Crown closure is the percentage of ground area covered by the vertically projected crowns of trees.
For each plot, estimate and record the crown closure by layer to the nearest 10 percent.
For the veteran component of the plot, record crown closure to the nearest percent. If the crown closure of the veteran component for the sample is six percent or more, it must be classified as a separate layer.
Determining Elevation
Determine and record the elevation of each plot if not already done.
Determining Aspect and Slope
Determine the aspect and slope for each plot if not already done.
Determining Slope Position
Slope position is the relative position of the plot within a water catchment area. Determine the slope position and record the appropriate code:
38 November 2007
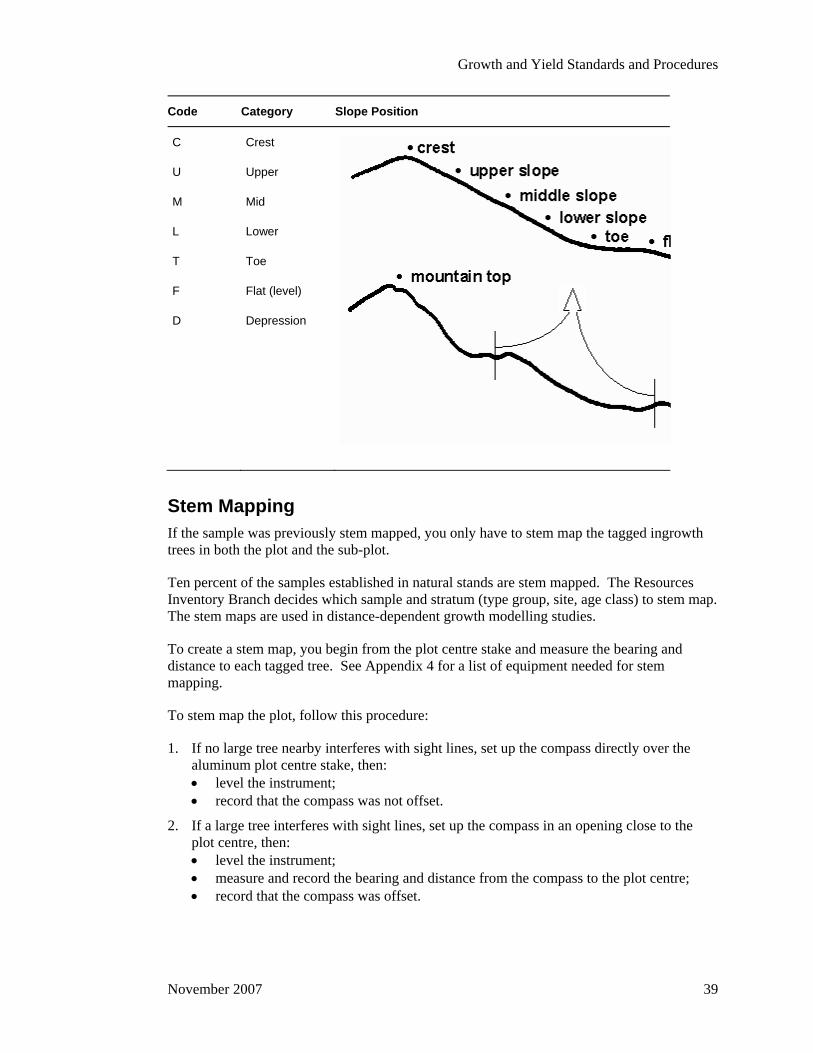
Growth and Yield Standards and Procedures
Code Category Slope Position
C
U
M
L
T
F
D
Crest
Upper
Mid
Lower
Toe
Flat (level)
Depression
Stem Mapping If the sample was previously stem mapped, you only have to stem map the tagged ingrowth trees in both the plot and the sub-plot.
Ten percent of the samples established in natural stands are stem mapped. The Resources Inventory Branch decides which sample and stratum (type group, site, age class) to stem map. The stem maps are used in distance-dependent growth modelling studies.
To create a stem map, you begin from the plot centre stake and measure the bearing and distance to each tagged tree. See Appendix 4 for a list of equipment needed for stem mapping.
To stem map the plot, follow this procedure:
1. If no large tree nearby interferes with sight lines, set up the compass directly over the aluminum plot centre stake, then: • level the instrument; • record that the compass was not offset.
2. If a large tree interferes with sight lines, set up the compass in an opening close to the plot centre, then: • level the instrument; • measure and record the bearing and distance from the compass to the plot centre; • record that the compass was offset.
November 2007 39

Growth and Yield Standards and Procedures
3. Adjust the compass for magnetic declination and raise the sighting vanes. In western Canada, magnetic declination is east of true north. Obtain the correct magnetic declination from an isogonic chart. See Appendix 7.
4. Sight on to the first tree on the plot. Some tips for sighting are listed below: • to avoid sighting the wrong tree, wrap the dbh stick with flagging tape to make it
more visible, then place the stick in front and center of the tree; • to avoid false compass readings as you sight the tree, keep sources of magnetic
interference away from the compass, including steel tapes, axes, knives, steel datum holders, eye glasses with steel frames, and most metal objects;
• to simplify recording and possible minimize errors, use a staff compass with Azimuth bearings when possible;
5. Measure the slope distance between the compass and the centre of the tree;
6. Measure the slope with the Suunto clinometer using the percent scale;
7. Read the compass bearing on the scale at the north end of the compass needle;
8. Record the measurements for each tagged tree in the plot.
Collecting Ecological Data All samples established in natural stands are ecologically assessed. If not already done, collect and record ecological data to the Biogeoclimatic Ecosystem Classification (BEC) site series level. See Appendix 25. If it is not possible to collect the ground data at the time of measurement, at minimum, obtain the BEC Zone, Sub-Zone, and Variant.
Quality Assurance Sampling crews should emphasize accuracy over production. For the standards of measurement see Appendix 1.
Checking Sampling Crews
To ensure crews follow and understand recommended procedures, carry out regular inspections.
1. Inspect at least 10 percent of all samples remeasured. If the sample has been poorly done, the original crew may be required to redo it.
2. Make spot checks as work progresses to be sure tie points and tie lines are properly marked.
3. To observe sampling crew performance, occasionally visit each crew on the sample.
Checking the Samples in the Office
All samples must be inspected in the office before sending them to the Vegetation Resources Inventory Section of the Terrestrial Information Branch. Ensure that:
1. The sample identification is correct and valid.
2. The sample header is as complete as possible.
3. The number and distribution of tree heights - both top height and others - were met.
40 November 2007
Growth and Yield Standards and Procedures
4. The required number of ages and piths were met.
5. The access notes are complete and include the tie point sketch.
Inspecting the Sample Once the samples have been checked in the office, randomly select one of the samples and conduct the following:
• a pre-field inspection; • a field inspection; • a post-field inspection.
Pre-field Inspection
1. Randomly select one plot from the ones checked in the office.
2. Enter the following information in the section at the top of the plot inspection report: • sample identification – region, compartment, sample, sample type, plot; • the plot and sub-plot sizes; • the plot and sub-plot radii • the inspection date; • the original tally crew; • the measurement date.
3. Randomly select 7 live trees and 2 dead from the tree detail section.
4. Transcribe the measurements of the 7 live trees and 2 dead to the top section of the plot inspection report. See Appendix 15.
5. Randomly select five trees for height from the sample tree section.
6. Transcribe the height measurements of the 5 trees to the sample tree section of the plot inspection report.
7. Select two age cores and check the age count as well as the suppression readings.
8. Transcribe the crown closure, aspect, slope and slope position of the plot to the appropriate section of the plot inspection report.
9. From the tree count summary section, randomly select one diameter class for a species. Later, you will use this diameter class in the field to check that the dot tally is correct for that class.
Note: Steps 2 to 9 are automatically done on the Gyhost/Gyhand Data Capture and Reporting System. Select the quality assurance report for printing.
Field Inspection
1. Use the access notes to get to the sample and verify their accuracy and completeness.
2. If a new tie tree was selected on remeasurement, check that it was marked as specified in “Checking Location and Access” in this chapter.
November 2007 41

Growth and Yield Standards and Procedures
3. If a new tie line was run, verify that the bearing and distance were run within the allowable standards.
4. Check that the plot centre markers were inscribed correctly and the plot centre stake was properly protected with a cairn.
5. Check the plot and sub-plot radius at a minimum of three different locations. Look for trees that should have been included or excluded from the plot or sub-plot. Flag with a circled asterisk any tree missed or mistakenly tallied.
6. Check that the chosen diameter class was properly dot tallied.
7. Carefully measure all the trees you selected in the pre-field inspection: • Tree identification - Check that the genus or species of each tree inspected is
correct. If not, place a circled asterisk beside the tree. • Tree tag height - Check the tag height of the selected ingrowth trees to verify that
breast heights, if applicable, were located at 1.3 m above the germination point for plots established before 1991, or at 1.3 m above the base of the tree on the uphill side for plots established after 1990. At the same time, make sure the nails were securely driven into the trees and the nail with the tag was driven in at a slight angle so that the tag hangs away from the tree.
• Diameter and pathological remarks (decay indicators) - Measure the 7 live and 2 dead selected trees and classify them.
• Sample tree heights - Measure the 5 selected trees for height. • Stem mapping - If the sample was stem mapped, check the selected ingrowth trees
for bearing, distance and percent slope.
8. Assess the crown closure for the plot.
9. Compare your measurements with the crew’s measurements. Give the crew the benefit of the doubt.
10. Check that the results conform to the standards of measurements. See Appendix 1.
11. If the difference between two measurements is greater than the allowable error, place an asterisk in the margin.
12. If the error is greater than two times the allowable error, circle the asterisk.
13. Complete the inspection items section of the inspection report.
14. Rate the quality of the work on the plot using the weighted system in Appendix 2.
15. Record your rating of the plot and any other comments in the remarks section of the plot inspection report.
Post-field Inspection
1. Discuss the results of your inspection with the original field crew.
2. Make recommendations to the original field crew, if necessary, on how to improve their work.
3. Correct the original data changing all the data that was flagged with an asterisk or a circled asterisk in your inspection report.
42 November 2007
Growth and Yield Standards and Procedures
Damage to the Sample and Returning the Samples
Damage to the Sample Damage to samples can result from natural or artificial causes.
1. If the sample was damaged by natural causes such as slides, snow, fungi, insects, disease and fire, it should be remeasured if at least 25% of the plot trees are still living.
2. If the sample was damaged (disturbed) by artificial means, refer to “Guidelines For Deciding if Damaged Permanent Plots Should be Remeasured” in Appendix 20.
If a sample is to be destroyed:
1. Remeasure it one last time if at least three years have elapsed since the last measurement.
2. Classify it ecologically.
3. Make sure the plot centre can be relocated after logging so that the long-term productivity effects can be determined.
Returning the Samples Once the samples are checked in the office and corrected:
1. Send a list of all the samples, any original field sheets, the electronic download from the GyHost as well as a hard copy of reports 1,2,3,5,6 and 7 to the Vegetation Resources Inventory Section of the Terrestrial Information Branch.
2. Keep a copy of all the above for security and reference.
November 2007 43

Growth and Yield Standards and Procedures
3. Remeasuring Experimental Plots in Natural Stands
Introduction From 1921 until 1949, the Research Branch established permanent plots to evaluate the growth and yield of different forest types. To protect this large investment from any type of disturbance, a reserve was placed around each plot. In 1957, the Research Branch transferred responsibility for 65 experimental plots, all of them still in a natural state, to the Resources Inventory Branch.
Since then, the Growth and Yield Section has continued to remeasure them at 10-year intervals. Some of the original 65 plots were abandoned owing to increased pressure on the area for other uses, or to the fact that sufficient data had been collected.
The standards of measurement for permanent samples are listed in Appendix 1.
If not already done, ecologically classify, according to Research Branch specifications, all experimental samples due for remeasurement.
Since permanent samples are cost intensive, protecting them is of the utmost importance. To ensure their protection, the protection buffers illustrated in Appendix 18 are recommended.
Preparing for Field Work Before starting field work, prepare and collect:
Copies of the original field sheets
Maps to show you how to get to the sample – example, 1:250 000 contour maps – and photocopies of parts of forest cover maps, which have an approximate scale of 1:20 000 and show the plot’s location in detail.
Photos showing original tie points, either those used when the sample was established, or, preferably, the latest photos on which tie points and sample locations were replotted.
Equipment. See Appendix 4 for the equipment needed.
Field Training All personnel involved in remeasurement work must attend a field procedures course.
November 2007 45
Growth and Yield Standards and Procedures
Relocating the Plot
Checking Location and Access The notes on the location of the plot and access to the plot usually begin with a description of an easily identifiable point.
1. Follow the access notes to the tie point.
2. Correct the notes where necessary.
The reference or tie point generally is a prominent topographic feature distinguishable on the photos and on the ground. Examples: a road junction, road bend, creek junction or bridge.
The blazed and/or painted tie tree should be located nearby, as described in the access notes. Aluminum sample markers were nailed to the tie tree, and strands of plastic flagging tape should still be noticeable on or near the tree.
The aluminum marker contains pertinent sample information such as:
region number; compartment number; sample type (R); sample number and plot number (1 assumed); bearing and distance to the plot centre; date the sample was established.
For more information on sample markers, see Appendix 5.
New Tie Point Needed
If a new tie point is needed:
1. Select a new tie point recognizable on the photos and the ground.
2. From the map, measure and record the new bearing and distance to the plot centre.
3. Paint both sides of the tie tree in the direction of the tie line.
4. Nail an aluminum sample marker above the paint.
5. Inscribe the pertinent information on the middle and bottom sections of the 2 markers. Note: “Date” on the marker always refers to the date the sample was originally established. See Appendix 5.
6. Flag the tie tree with two strands of flagging tape, one above and one below the markers.
7. To aid future measurement crews, prepare a sketch showing the tie point, the sample location, and other significant topographic features. Attach the sketch to the access notes.
If you establish a new tie point, you must run a new tie line.
46 November 2007
Growth and Yield Standards and Procedures
Checking the Tie Line The tie line is run from the tie point with a hand compass, a clinometer and a measuring tape. When you rerun the original tie line, it is sufficient to paint the blazes, and to renew the tape markings.
Checking Corner Posts and Centre Stake Once at the experimental plot:
1. Locate all 4 corner posts and centre stake. Each of the corners or centre was marked with a cedar post or aluminum stake driven into the ground. Sometimes cairns were built around them.
2. Check that each post is solid enough to last another 10 years. When necessary, replace a post with a tubular aluminum stake.
3. Mark each post or aluminum stake with flagging tape.
To prevent future problems locating the corners and plot centre:
1. Build a cairn around each post or stake.
2. Stem map each (unless already done) of the 4 corners and plot centre to 3 trees nearby in the plot. For each of the 4 corners and plot centre, measure: • the bearings to the 3 trees; • slope percent to the 3 trees; • slope distance to the 3 trees (place a nail at the centre of each tree for consistency in
measuring distance).
Remeasuring the Plot and Sub-plot Accurate work is required when you compare new measurements with previous ones. Check measurements that appear to be out of the expected range, that is measurements showing a very large increase compared with those showing little or no increase.
Correct any errors and note them in the remarks. Example: “dbh checked.”
Converting the Breast Height in Experimental Permanent Samples If necessary, see Appendix 21 for procedures to convert, experimental sample plots from imperial (1.37 m) to metric (1.3 m) breast height. The conversion is done only once.
Sectors in the Plot Experimental samples are either square or rectangular in shape.
To simplify tagging, the plot was divided into sectors. Tagging started in one corner of the plot and continued up and down each sector, beginning with sector 1. Sector numbers increased toward the opposite end. The number of sectors in a plot varies among the experimental samples.
November 2007 47
Growth and Yield Standards and Procedures
In order to aid in the choosing of top height and site trees, the plot must also be divided into 0.01 ha site sectors using the same procedure previously used - that is starting with sector 1. See Appendix 24.
Tagging Trees Determine the breast height of trees with missing tags, as well as of ingrowth trees. Prior to 1991, breast height determination used the point of germination. Therefore, continue using point of germination.
During the remeasurements from 1980 to 1989 inclusive, the dbh height and dbh were changed to 1.3 m above germination in one of two ways (see Appendix 21). If Method 1 was used, you will have to remove the nail at 1.3 m and replace it with the nail and tag that is at 1.37 m.
Note: If a plot is being remeasured that has not had the dbh changed from 1.37 m to 1.3 m, do it now following Method 2 in Appendix 21.
Missing Tags
For all previously measured living trees with missing tags:
1. Determine breast height at 1.3 m above germination.
2. Nail a tag which has the same tag number as the missing one.
Measuring DBH For all numbered living trees, measure above the nail to the nearest millimetre, the diameter at 1.3 m.
To more accurately measure the diameter of trees that are or will soon be joined together at dbh, use the “1/2 wrap” method. To do this, measure or estimate, as accurately as you can, the diameter of each affected tree. Then, from the nail with the tag, measure half of the diameter around the bole of the tree and place a second nail. Note in the remarks that these are “1/2 wrap” measurements. In the future, the distance between the two nails will be measured and multiplied by two to arrive at the diameter of the tree.
After remeasuring the diameter:
Pull out the nail holding the number enough to allow for tree growth until the next remeasurement.
For all previously numbered living trees now dead:
1. Measure the diameter above the nail at 1.3.
2. If you can’t find the dead tree, assign it the same diameter as in the previous measurement. If the tree was cut down, record it as Tree Class 6 and assign the same diameter as in previous measurement.
For all previously dead unnumbered trees that are >10.0 cm dbh and >1.3 m in height:
1. If standing or down, collect the appropriate ‘Dead tree Attributes’. See Appendix 22.
48 November 2007
Growth and Yield Standards and Procedures
2. If you cannot find the tree, record it as (F)allen.
For all previously dead, standing, unnumbered trees that are >10.0 cm dbh and >1.3 m in height:
1. Tag the tree with a unique number.
2. Collect the ‘Dead tree Attributes’. See Appendix 22.
Assessing whether a tree is still alive may be difficult in certain situations. Ensure that all needles/leaves are dead if the tree is being called dead, and if uncertain, err on the side of caution by calling it alive.
Classifying Trees Classify each tagged tree according to its pathological indicators. To classify a tree properly, view it from all sides. The person measuring dbh should move far enough away from the tree to be able to classify the lower third of the stem. The recorder should move around the tree to classify the upper two thirds.
In the pathological remarks section, record each decay indicator occurring on the lower, middle or upper third of the total height of the tree. Do this by entering the correct numerical position code as follows:
Code Position on Tree (tree is divided into thirds)
1 Lower third
2 Middle third
3 Upper third
4 Lower and middle third
5 Middle and upper third
6 Lower and upper third
7 All thirds
Tree Classes
Each tagged tree is classed in one of the following categories:
Tree Class 1: Residual;
Tree Class 2: Suspect;
Tree Class 3: Dead potential;
Tree Class 4: Dead useless;
Tree Class 5: Veteran;
Tree Class 6: Dead, cut down.
Tree Class 1: Residual
Record Tree Class 1 if:
• the tree is alive, not a veteran and free of any decay indicators.
November 2007 49
Growth and Yield Standards and Procedures
Tree Class 2: Suspect
Record Tree Class 2 if:
• the tree is alive; • the tree is not a veteran, and; • the tree has one or more decay indicators.
Tree Class 3: Dead Potential
Record Tree Class 3 if:
• the tree is dead, either standing or down; • the tree contains at least an estimated 50% of sound wood by volume, and; • the tree is greater than or equal to 10 cm dbh and greater than or equal to 3 m in height or
length.
If you can determine the tree died as a result of an insect or a disease, record the primary insect or disease responsible for the death. See Appendix 14 for damage agents and severity codes.
Tree Class 4: Dead Useless
Record Tree Class 4 if:
• the tree is dead, either standing or downed, and; • the tree is not potentially useful. See Tree Class 3.
If you can determine the tree died as a result of an insect or a disease, record the primary insect or disease responsible for the death. See Appendix 14 for damage agents and severity codes.
Tree Class 5: Veteran
For simple stands, record Tree Class 5 if:
• a tree is at least 40 years older than the mean age of the main stand, and • the veteran component has an estimated crown closure of less than 6% for the sample.
In complex stands, a tree is considered a veteran only when it:
• is a remnant of a much older stand; • is at least 100 years older than the oldest sample trees of the main stand; • has a much larger diameter than trees in the main stand. This criterion is necessary
because of the subjectivity in determining what constitutes the main stand owing to the wide range of ages possible in it.
Veterans are not recognized in stands 121 years or older, except in lodgepole pine stands, which may have a veteran component of Douglas fir or larch.
Record pathological indicators for veteran trees the same way as for other trees.
50 November 2007
Growth and Yield Standards and Procedures
Tree Class 6: Dead, Cut Down
Record Tree Class 6 if the tree is dead as a result of being cut down.
Pathological Indicators The indicators of decay (pathological indicators) are:
Fork or Crook the result of damage to the main leader.
Scar must be weathered and may be open or closed.
Frost Crack may resemble a scar but always follows the grain.
Dead Top is a dead leader on a living tree.
Broken Top (record height to break, to the nearest metre) is a broken leader.
Conk the fruiting body of decay fungi.
Mistletoe a parasitic flowering plant.
Blind Conk pronounced swelling of depression around knots.
Rotten Branch obviously decayed large branches with a DIB of over 10 cm.
See Appendix 11 for definitions and illustrations of these pathological indicators.
The following abnormalities are not decay indicators.
butt rot black knot sweep flute burl and gall exposed root candelabra branch sapsucker hole spiral grain branch fan insect boring. dry side
Assessing Damage Agents and Severity We collect insect, disease and injury data to quantify their effect on tree growth.
For each tree affected:
1. Identify, if possible, the two most damaging agents (see Appendix 14 for damage agents and codes).
2. Assess the damage severity.
3. Record the damage agent code to a level that you are confident. • The damage agent codes are hierarchical and enable coding from very general (type
or category) to specific (species). The first letter indicates the type of the damage while the second and third indicate the specific agent.
November 2007 51

Growth and Yield Standards and Procedures
• If you are unable to identify the damage agent species, a short, incomplete label is still useful. Example: You may identify a defoliating insect and assess the percent defoliation for the tree as 30 percent. Record this as ID_30.
For the sample affected:
1. Identify the two most damaging agents in the sample.
2. Calculate the percent assessment of each agent for the sample. Determine the damage severity to the nearest one percent up to ten percent, and to the nearest five percent for severities greater than ten percent.
3. Record this assessment in the header. If known, also record the year in which the damage took place.
Assigning a Crown Class Code Crown class refers to the position of the crown of a tree relative to all other trees within the general plot area, not the whole stand.
There are six crown classes:
1. Crown Class 1: Dominant; 2. Crown Class 2: Codominant; 3. Crown Class 3: Intermediate; 4. Crown Class 4: Suppressed; 5. Crown Class 5: Veteran; 6. Crown Class 6: Understory.
For more details on crown classes, see Appendix 12.
Assign a crown class code of 1 through 4 and 6 to each tagged tree classed as Tree Class 1, 2 or 6. For tree class 5, assign crown class 5. See “Classifying Trees” in this chapter.
Note: Crown Class 6 should be used sparingly; do not confuse it with Crown Class 4. Use Crown Class 6 only in stands 60 years or older where the understory trees, usually shade tolerant, are clearly much younger than the main stand.
Estimating Live-crown Length Live-crown length is the distance between the treetop, if the top is alive, or from the top of the live portion, if the treetop is dead, and the base of the lowest contiguous live crown. The estimate is expressed as a percentage of the total height of the tree.
Estimate, to the nearest 10 percent, the live-crown length of all living tagged trees. 1. When determining the base of the lowest contiguous live crown, do not consider forks or
epicormic branches; 2. The tops of defoliated trees may appear dead at the time of the assessment. Make sure it
is or you may underestimate the live crown length.
52 November 2007
Growth and Yield Standards and Procedures
Tagging Ingrowth Trees The term ingrowth trees refers to commercial and non-commercial trees that were below the tagging limit during the last measurement but that now exceed that limit.
When all previously numbered trees have been remeasured, tag all commercial and non-commercial living trees now 4 cm dbh and greater, by consecutive number for the plot.
Dealing with Forked Trees
Special rules govern the tagging of forked trees:
• If the fork occurs above 1.3 m, tag the stem as a single tree, provided it has a dbh of at least 4 cm;
• If the fork occurs below 1.3 m, and two or more stems of the fork are 4 cm or greater in dbh tag each stem separately using consecutive numbers. Record, in the remarks, that these stems are forked together;
• If the fork occurs below 1.3 m, and only one of the stems is 4 cm or greater, tag it as a single tree.
Tagging Procedure for Ingrowth Trees
1. If a large number of ingrowth trees are present, use consecutive, pre-numbered blue plastic tags. If a few trees are present, use aluminum tags and inscribe the consecutive tree numbers for the plot.
2. Nail the tag to the tree 1.3 m above the germination point.
3. Do not use a previously used number within the plot.
Recording Data About the Sample: For each tagged tree (4.0 cm + if alive or 10 cm + if dead) ensure that the following information is recorded: • the tree number; • the species; • the tagging sector number; • the site sector number; • the dbh; • the tree class; • any pathological indicators or dead tree attributes; • the crown class (living trees only); • suitability for height measurement, (Y)es, (N)o, (C)ould be, (F)lagged, (V)ery difficult to
measure, (E)asy to measure; • the live-crown length; • pest or injury codes, if applicable; • the tree number of the closest, previously numbered living tree (if ingrowth).
The data must be captured digitally in the field with an Electronic Field Recorder (EFR) using Gyhost/Gyhand software (see “Gyhost/Gyhand: A Data Collecting, Editing
November 2007 53
Growth and Yield Standards and Procedures
and Reporting System” on the Ministry’s Web page. In case of emergency (i.e. EFR breaks down) the data may be collected on field sheets and then later entered into the Gyhost/Gyhand system. For information on how to fill out the field sheets, see “Completing the Field Sheets” in Appendix 16. See Appendix 19 for a copy of the “Growth Sample Record Sheet”.
Note: Previously classified trees that are now considered to be shrubs must be dropped (code “D” for drop) from the sample and tags removed.
Sub-plot and Tree Count To have some representation from trees below the plot tagging limit, a circular sub-plot was established with its centre at the intersection of diagonals from the corner posts. The objective was to obtain a minimum of 20 living commercial trees that were less than the plot tagging limit but at lease 0.3 m in height. The sub-plot size was selected from Appendix 6. However, the sub-plot radius was less or equal to one-half the length of the shortest side of the rectangle even if less than 20 stems were obtained.
The centre was marked with an aluminum tubular stake. A plot centre tree close to the aluminum stake was selected and marked with aluminum markers.
If the plot centre tree is missing, whether from natural causes or not:
1. Select another centre tree near the plot centre.
2. Mark it properly. Nail two aluminum plot markers approximately 2 metres above the ground.
3. Inscribe the following information on the markers: • sample type (R); • sample number; • plot number (1 assumed); • region number; • compartment number; • the original date the plot was established.
4. Mark the centre tree with two strands of plastic flagging tape, one above and one below the aluminum markers.
If the centre tree is present but its markers are missing or illegible, replace them.
If the stake was pulled out, the bearing and distance from the centre stake to 3 trees nearby were recorded. Use this information to relocate the centre stake.
Within the sub-plot, all living commercial trees 2 cm dbh and greater but less than the plot tagging limit were tagged using one of two methods. See “Tagging Trees” in this chapter.
Trees of commercial species less than 2 cm dbh but 0.3 m in height had their tags wired either to a branch or to the main stem. These tags and wires should be removed, if possible, to prevent girdling the stems.
54 November 2007
Growth and Yield Standards and Procedures
Measuring Sub-plot Trees
For trees 2 cm dbh and greater previously tagged within the sub-plot, use the same method as in the main plot. See “Tagging Trees” in this chapter.
Attach a number tag to the tree with a nail at breast height (1.3 m) if the tree:
• was less than 2 cm dbh during the last measurement; • now has a dbh of 2 cm or greater, and; • is a commercial species.
Include the tree in the dot count if the tree:
• is less than 2 cm dbh, and; • is a commercial species.
Special rules govern the tagging of forked trees at least 2 cm dbh but less than 4 cm dbh within the sub-plots:
• If the fork occurs above 1.3 m, tag the stem as a single tree; • If the fork occurs below 1.3 m, tag each fork as a tree provided each is 2 cm dbh and
greater.
Gathering and Recording Information about Sub-plot Trees
Trees 2 cm dbh and greater:
For each tree 2 cm dbh and greater in the sub-plot, record the following:
• the tree number; • the species; • the tagging sector number; • the site sector number; • the dbh; • the tree class; • any pathological indicators; • the crown class; • the live-crown length; • damage agent codes, if applicable; • suitability for height measurement (Y)es, (N)o, (C)ould be, (F)lagged, (V)ery difficult to
measure, (E)asy to measure; • the number of the closest previously tagged plot living tree.
Trees less than 2 cm dbh:
Count trees less than 2 cm dbh in a dot tally and record them:
as dbh class 0 or 1 (see Table 1 below) by species. See Appendix 3.
November 2007 55

Growth and Yield Standards and Procedures
Table 1 Metric dbh Classes and Limits
dbh class Limits
0 0.3 m to 1.3 m high
1 0.1 cm to 1.9 cm dbh
Forked trees less than 2 cm dbh:
Give special attention to the method of counting forked trees less than 2 cm dbh. For example: To avoid counting numerous leaders of trees that have been severely browsed, count only the tallest leader. See Appendix 10 for a further explanation.
Unusual trees:
Now and then, you will find unusual live trees within the sub-plot. Special rules apply when measuring the height of abnormal trees less than 2.0 cm dbh. See Appendix 10.
Determining the Stand Structure Stand structure is the physical arrangement or pattern of organisation of the stand. Stand structure is described and classified according to recognizable age and height differences.
The recognized stand structures are:
1. Single layer, simple stands (even age and height)
• with veterans • without veterans
2. Single layer, complex stands (uneven age and height)
• with veterans • without veterans
3. Multi layer stands
• layer 1 is the top layer • layer 2 is the bottom layer
For single layer stands, layer 1 is assumed for trees in the main stand and tree class 5 identifies the veteran layer.
For multi layer stands, record 1 for the top layer trees and 2 for the bottom layer. The sample primary layer, according to regional priorities, must be identified.
For further details on stand structure, see Appendix 13.
Height Sample Trees Local height-diameter curves are constructed from sample data before compiling samples.
To construct reliable curves, a substantial number of heights is needed for each species. The number depends on the stand composition, which ultimately is based on basal area. In the field, use the calculated basal area for stand composition.
56 November 2007
Growth and Yield Standards and Procedures
Top Height
Select the top height tree from a 0.01 ha circular plot at plot centre. Record “C” (centre sector) for the tree. Top height (1998) is the height of the largest diameter tree, regardless of species, in a 0.01 ha plot, providing the tree is suitable. A suitable tree must be healthy, not have a broken or damaged top, not have its height growth affected by a competitor nor be a residual left from previous logging. There is no substitution for an unsuitable tree.
If the PSP is one selected for SIBEC, select the largest diameter tree of each additional species in the 0.01 ha circular plot at plot centre, and record “C” (centre sector) for the tree.
For a single-layered stand, or for each layer in a multi-layered stand, select height sample trees as follows:
First Two Major Species
For each of the first two major species (20 percent or more by composition), select trees for the sample as follows:
1. Select the required number of site trees on the basis of the largest diameter living tree per 0.01 ha plot or sector, to a maximum of ten. In the case of a sample larger than 0.1 ha, randomly select ten site sectors and take the site trees from them - do not substitute. In future remeasurements, the same sector numbers will be used to choose site trees.
Suitable site trees have the following characteristics: • free of major defects; • crown class of 1 or 2. The exception is in the case of the second layer in a two-layer
stand where crown class 3 and 4 are acceptable; • cannot be substituted.
Example: On a 0.1 hectare sample, the ten largest dbh trees from each of the two leading major species are selected for site tree measurements. Similarly, four trees would be selected in a 0.04 hectare sample.
2. Select an additional 15 trees distributed evenly across the remaining dbh range, down to 2 cm dbh.
For Third and Fourth Majors, Minor and Scattered Species
For the third and fourth major species (20 per cent or greater by composition), each minor species (10 to 19 percent by composition) and for scattered species (less than 10 percent by composition), select 15 trees, if present and suitable. Distribute them across the dbh range, down to 2 cm dbh. Place emphasis on larger diameter classes.
For Veterans
For the veteran layer:
1. Select one sample tree from each species present.
2. Estimate the height of all others.
3. Record the estimated height of all the veterans in the small tree or Vet height section.
November 2007 57
Growth and Yield Standards and Procedures
Remeasuring Heights Consistently
To ensure future height measurements are taken consistently from the same direction, paint a blue dot, if not already done, at dbh to indicate the direction from which the height measurement was taken.
Ensure that height sample trees previously taken are remeasured for height and from the same direction as indicated by the blue painted dot (unless no longer suitable) even if the resultant distribution over the dbh classes is not optimum. If possible, strive for the full range of diameters down to 2.0 cm dbh.
Selecting Sample Trees
When possible, select residual trees (Tree Class 1). See “Classifying Trees” in this chapter. Otherwise, select trees that do not have major suspect characteristics, such as a major fork, which affects the true height or a major scar at breast height which affects its true diameter.
Do not select trees with:
• diameters that were estimated; • sweeps or leans greater than 5 degrees.
In some areas, it may be impossible to meet sample height requirements if only suitable trees as described above are taken. In this situation, take the best of the “poor” trees to meet the requirement. However, do not select a tree if its height is less than 95% of what it would be without its defect – lean, fork, broken top, etc.
Measuring Suppressed Trees with Flattened Tops
To ensure accurate measurements of suppressed trees:
1. Sight on the highest point of the top.
2. For hemlock trees, sight on the highest point of the droop.
3. For cedar trees, make sure you take the top reading on the tiny leader and not on a lateral branch, which may be higher.
Age Sample Trees
Note: If the present top height and site trees had their ages taken at 1.3 m during the last measurement, no further ages are required. If the top height tree or any tree of first and second leading major species do not have an age at 1.3 m, it must be taken now and recorded in the “New Age” field.
In single layer, simple stands, pure and mixed, the age of the stand is determined by averaging the ages of the site trees of the leading major species in the sample. However, ages of the site trees of the second major species must also be taken.
The sample mean age is derived from the site trees of the leading species only, even if some of their cores are rotten. The rotten portion must be estimated to derive a total age for the tree. See “Counting Rings on Rotted Cores” in this chapter.
58 November 2007
Growth and Yield Standards and Procedures
Bore trees that appear to be veterans to confirm they are in fact veterans. Bore the smallest diameter veteran per species only; the others can be assumed to be veterans too. Use these ages for the veteran layer.
In single layer, complex stands, the average age of the stand is determined from the ages of the site trees of the leading major species. However, to show the variation of the stand’s age, take two additional ages of the leading major species from the younger portion of the stand. Treat the second major species the same as the leading.
In multi layer stands, select sample trees, as outlined above, for each layer.
Taking the Age of a Tree
1. Bore the selected trees at 1.3 m.
2. Remove the core. Make sure two cores per species include the pith.
3. If the core includes the pith, record “Y” in the pith field.
4. Rebore the tree if you missed the pith by more than an estimated: • 2 years on a tree younger than 100 years, or; • 2 percent on a tree older than 100 years.
5. While in the field, count the rings on the core and record the count.
6. Measure and record the radial increment for the last 5, 10 and 20 years.
7. Measure and record the evidence of suppression, if any. See Appendix 23.
8. Place the cores in plastic straws with the following information:
9. Place the cores in plastic straws with the following information: • the region number, R#; • the compartment number, Co#; • the sample number, R#; • tree number; • species; • counted age.
Counting Rings on Rotted Cores
If the sample tree has rotten portions:
1. Count the rings on the sound portion of the core.
2. Estimate the number of years in the rotten portion.
3. Add the number of years in the sound portion to the estimated number of years in the rotten portion.
4. Record the total breast-height age, with an (R)otted for pith.
November 2007 59
Growth and Yield Standards and Procedures
Estimating Other Plot Attributes
Estimating Crown Closure
Crown closure is the percentage of ground area covered by the vertically projected crowns of trees.
For each plot, estimate and record the crown closure by layer to the nearest 10%.
For the veteran component of the plot, record crown closure to the nearest percent. If the crown closure of the veteran component for the sample is six percent or more, it must be classified as a separate layer.
Determining Elevation
Determine and record the elevation of each plot if not already done.
Determining Aspect and Slope
Determine the aspect and slope for each plot if not already done.
60 November 2007
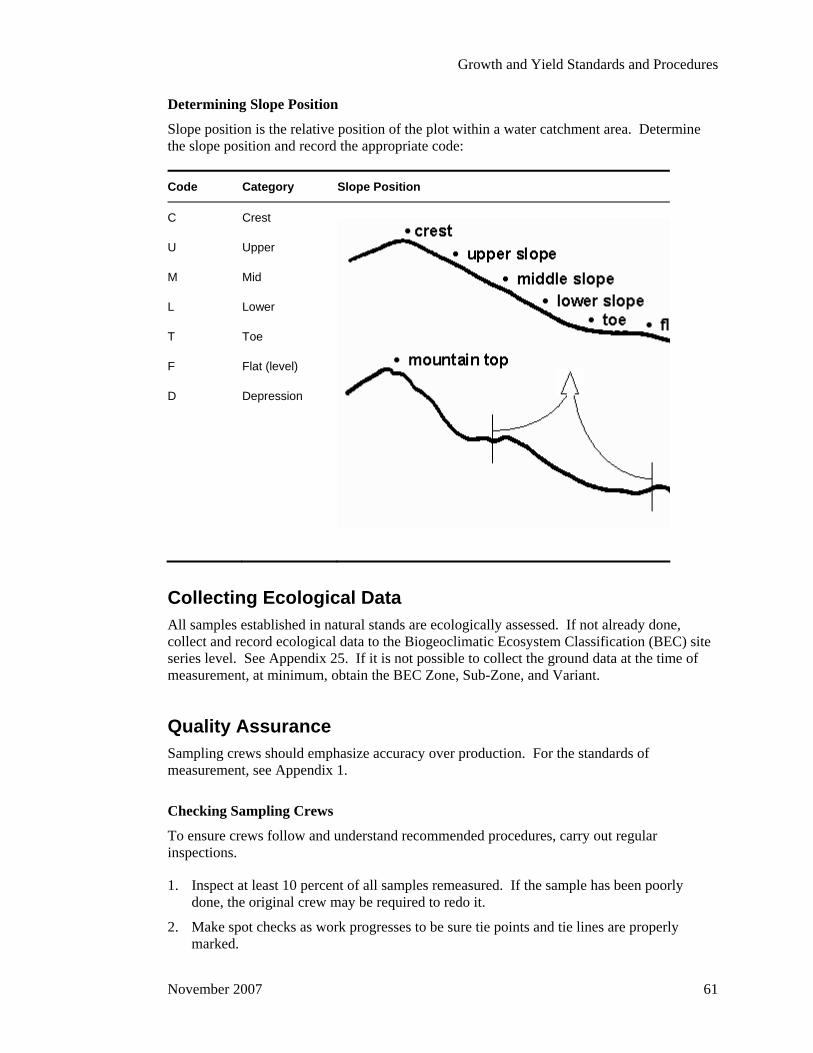
Growth and Yield Standards and Procedures
Determining Slope Position
Slope position is the relative position of the plot within a water catchment area. Determine the slope position and record the appropriate code:
Code Category Slope Position
C
U
M
L
T
F
D
Crest
Upper
Mid
Lower
Toe
Flat (level)
Depression
Collecting Ecological Data All samples established in natural stands are ecologically assessed. If not already done, collect and record ecological data to the Biogeoclimatic Ecosystem Classification (BEC) site series level. See Appendix 25. If it is not possible to collect the ground data at the time of measurement, at minimum, obtain the BEC Zone, Sub-Zone, and Variant.
Quality Assurance Sampling crews should emphasize accuracy over production. For the standards of measurement, see Appendix 1.
Checking Sampling Crews
To ensure crews follow and understand recommended procedures, carry out regular inspections.
1. Inspect at least 10 percent of all samples remeasured. If the sample has been poorly done, the original crew may be required to redo it.
2. Make spot checks as work progresses to be sure tie points and tie lines are properly marked.
November 2007 61
Growth and Yield Standards and Procedures
3. To observe sampling crew performance, occasionally visit each crew on the sample.
Checking the Samples in the Office
All samples must be inspected in the office before sending them to the Vegetation Resources Inventory Section of the Terrestrial Information Branch. Ensure that:
1. The sample identification is correct and valid.
2. The sample header is as complete as possible.
3. The number and distribution of tree heights − both top height and others − were met.
4. The required number of ages and piths were met.
5. The access notes are complete and include the tie point sketch.
Inspecting the Sample Once the samples have been checked in the office, randomly select one of the samples and conduct the following:
a pre-field inspection; a field inspection; a post-field inspection.
Pre-field Inspection
1. Randomly select one sample from the ones checked in the office.
2. Enter the following information in the section at the top of the plot inspection report: 3. the sample identification − region, compartment, sample, sample type and plot; 4. the plot and sub-plot sizes; 5. the length of plot sides and sub-plot radii; 6. the inspection date; 7. the original tally crew; 8. the measurement date.
3. Randomly select 7 live and 2 dead trees from the tree detail section.
4. Transcribe the measurements of the 7 live and 2 dead trees to the top section of the plot inspection report. See Appendix 15.
5. Randomly select 5 trees for height from the sample tree section.
6. Transcribe the height measurements of the 5 trees to the sample tree section of the plot inspection report.
7. Select two age cores and check the age count as well as the suppression readings.
8. Transcribe the crown closure, aspect, slope and slope position of the plot to the appropriate section of the plot inspection report.
9. From the tree count summary section, randomly select one diameter class for a species. Later, you will use this diameter class in the field to check that the dot tally is correct for that class.
62 November 2007
Growth and Yield Standards and Procedures
Note: Steps 2 to 9 are automatically done on the Gyhost/Gyhand Data Capture and Reporting System. Select the quality assurance report for printing.
Field Inspection
1. Use the access notes to get to the sample and verify their accuracy and completeness.
2. If a new tie tree was selected on remeasurement, check that it was marked as specified in “Checking the Tie Point” in this chapter.
3. If a new tie line was run, verify that the bearing and distance were run within the allowable standards.
4. Check that the plot centre markers were inscribed correctly and the plot centre stake was properly protected with a cairn.
5. Check the plot sides and the sub-plot radius at a minimum of three different locations. Look for ingrowth trees that should have been included or excluded from the plot or sub-plot. Flag with a circled asterisk any tree missed or mistakenly tallied.
6. Check that all sub-plot trees less than 4 cm dbh but at least 0.3 m in height were either tagged or counted in the dot tally.
7. Carefully measure all the trees you selected during the pre-field inspection: • Tree Identification − Check that the genus or species of each tree inspected is
correct. If not, place a circled asterisk beside the tree; • Tree tag height − Check the tag height of the selected ingrowth trees to verify that
breast heights, if applicable, were located at 1.3 m above the germination point. At the same time, make sure the nails were securely driven into the trees and the nail with the tag was driven in at a slight angle so that the tag hangs away from the tree;
• Diameter and pathological remarks (decay indicators) − Measure the 7 live and 2 dead selected trees and classify them;
• Sample tree heights − Measure the 5 selected trees for height; • Stem mapping − If the sample was stem mapped, check the 7 selected trees for
bearing, distance and percent slope.
8. Assess the crown closure for the plot.
9. Compare your measurements with the previous ones giving the crew the benefit of the doubt.
10. Check that the results conform to the standards of measurement. See Appendix 1.
11. If the difference between two measurements is greater than the allowable error, place an asterisk in the margin.
12. If the error is greater than two times the allowable error, circle the asterisk.
13. Complete the inspection items section of the inspection report.
14. Rate the quality of the work on the plot using the weighted system in Appendix 2.
15. Record your rating of the plot and any other comments in the remarks section of the plot inspection report.
November 2007 63
Growth and Yield Standards and Procedures
Post-Field Inspection
1. Discuss the results of your inspection with the original field crew.
2. Make recommendations to the original field crew, if necessary, on how to improve their work.
3. Correct the original data changing all the data that was flagged with an asterisk or a circled asterisk in your inspection report.
Damage to the Sample and Returning the Samples
Damage to the Experimental Plot Damage to samples can result from natural or artificial causes.
1. If the sample was damaged by natural causes such as slides, snow, fungi, insects, disease and fire, it should be remeasured if at least 25% of the plot trees are still living.
2. If the sample was damaged (disturbed) by artificial means, refer to “Guidelines for Deciding if Damaged Permanent Plots Should be Remeasured” in Appendix 20.
If a sample is to be destroyed:
1. Remeasure it one last time if at least three years have elapsed since the last measurement.
2. Classify it ecologically.
3. Make sure the plot centre can be relocated after logging so that the long-term productivity effects can be determined.
Returning the Samples Once the samples are checked in the office and corrected:
1. Send a list of all the samples, any original field sheets, the electronic download from the GyHost as well as a hard copy of reports 1,2,3,5,6 and 7 to the Vegetation Resources Inventory Section of the Terrestrial Information Branch.
2. Keep a copy of all the above for security and reference.
64 November 2007

Growth and Yield Standards and Procedures
Appendix 1: Standards of Measurement for Permanent Samples Tie Line Bearing ±2°
Distance ±2%
Plot Missed and extra trees No error within the plot.
Radius ± 0.5% of plot/sub-plot radius tolerance for borderline trees.
Tree species No error, but identication to genus level allowable for birch, interior spruce and willow.
Breast height ±5 cm
D.B.H. live ±0.l cm or 1.0%, whichever is greater.
D.B.H. dead ±0.2 cm or 2.0% whichever is greater.
Decay indicators ±1 or 10%, whichever is greater, of the total number of external indicators of all trees checked.
Crown closure ± one 10% class
Live crown ± one 10% class
Crown class ± one crown class
Quality + 1 or 10%, whichever is greater, of the total number of trees checked.
Measured tree height ± 20 cm or 2%, whichever is greater.
Estimated tree height +or- 0.5m or 10%, whichever is greater.
Tree age ±2 years or 2%, whichever is greater.
Radial increment ±0.1 cm
Slope ± 5%,
Aspect ± 10 degrees
Elevation ± 50 metres
Wildlife Visual Appearance
± 1 visual appearance class
Stem Mapping Bearing ±2°
Distance ±2%
Location Latitude ± 1 second
Longitude ± 1 second
UTM ± 20 metres
November 2007 65

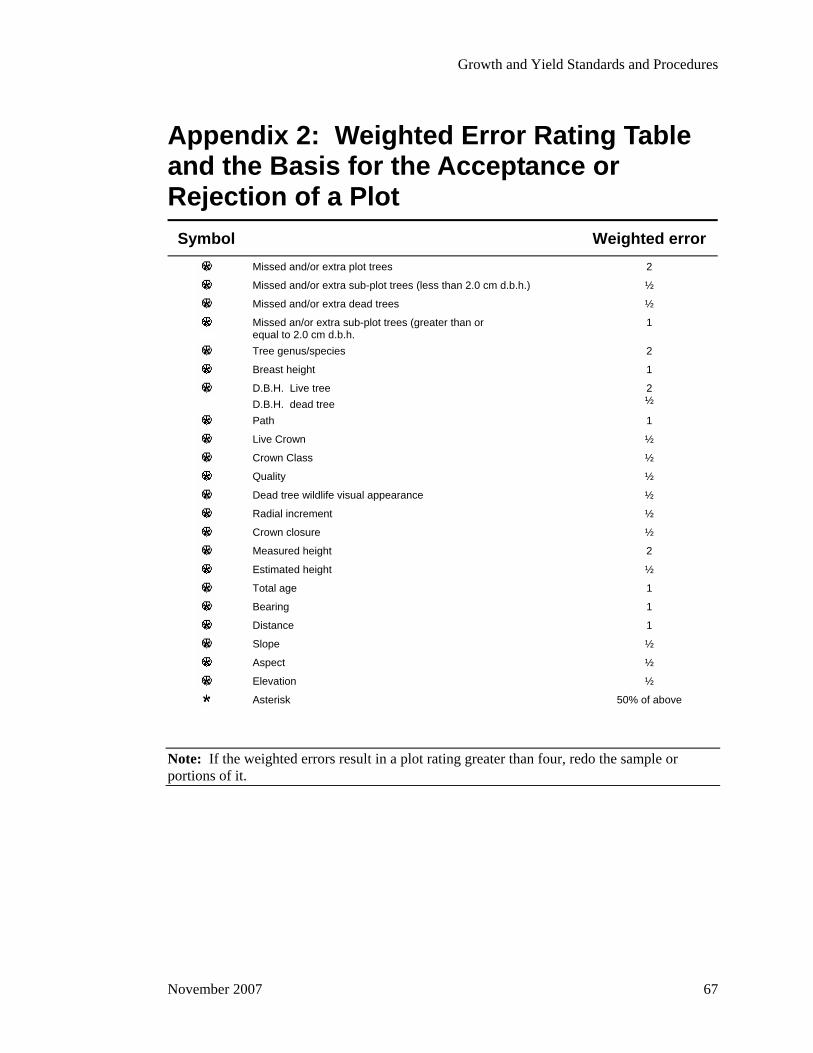
Growth and Yield Standards and Procedures
Appendix 2: Weighted Error Rating Table and the Basis for the Acceptance or Rejection of a Plot
Symbol Weighted error
Missed and/or extra plot trees 2
Missed and/or extra sub-plot trees (less than 2.0 cm d.b.h.) ½
Missed and/or extra dead trees ½
Missed an/or extra sub-plot trees (greater than or equal to 2.0 cm d.b.h.
1
Tree genus/species 2
Breast height 1
D.B.H. Live tree D.B.H. dead tree
2 ½
Path 1
Live Crown ½
Crown Class ½
Quality ½
Dead tree wildlife visual appearance ½
Radial increment ½
Crown closure ½
Measured height 2
Estimated height ½
Total age 1
Bearing 1
Distance 1
Slope ½
Aspect ½
Elevation ½
Asterisk 50% of above
Note: If the weighted errors result in a plot rating greater than four, redo the sample or portions of it.
November 2007 67

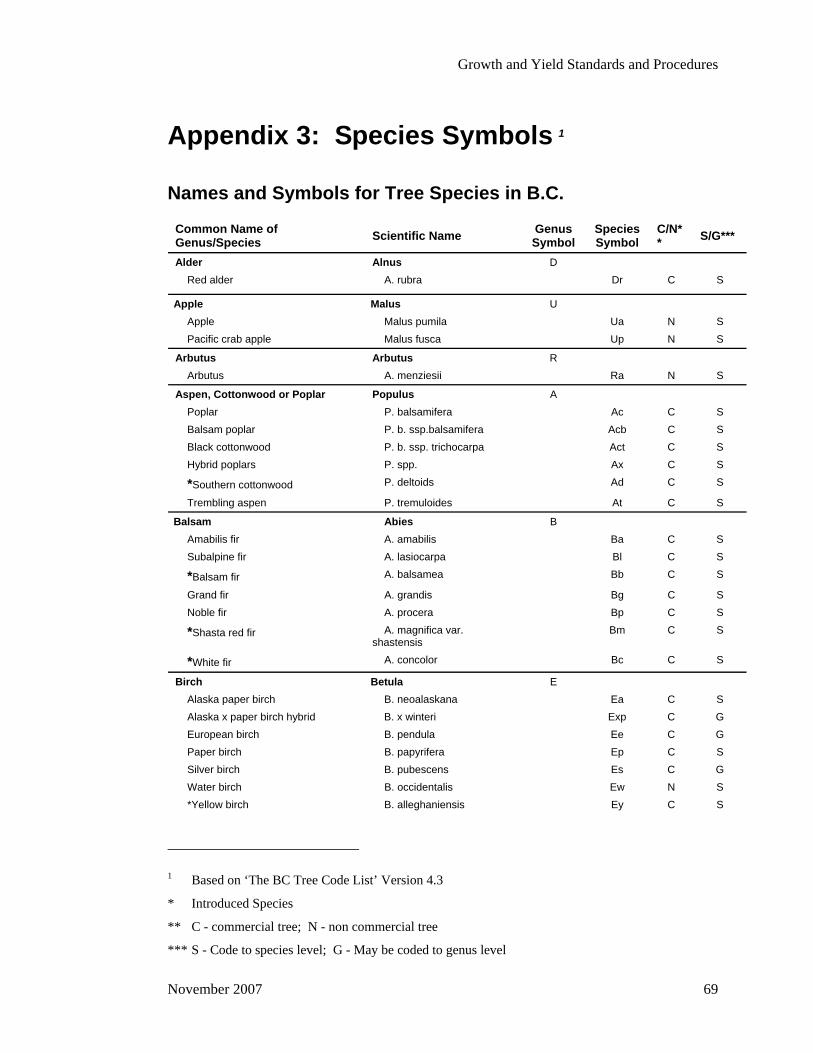
Growth and Yield Standards and Procedures
Appendix 3: Species Symbols 1
Names and Symbols for Tree Species in B.C.
Common Name of Genus/Species Scientific Name Genus
Symbol SpeciesSymbol
C/N** S/G***
Alder Alnus D Red alder A. rubra Dr C S
Apple Malus U Apple Malus pumila Ua N S Pacific crab apple Malus fusca Up N S
Arbutus Arbutus R Arbutus A. menziesii Ra N S
Aspen, Cottonwood or Poplar Populus A Poplar P. balsamifera Ac C S Balsam poplar P. b. ssp.balsamifera Acb C S Black cottonwood P. b. ssp. trichocarpa Act C S Hybrid poplars P. spp. Ax C S
*Southern cottonwood P. deltoids Ad C S
Trembling aspen P. tremuloides At C S
Balsam Abies B Amabilis fir A. amabilis Ba C S Subalpine fir A. lasiocarpa Bl C S
*Balsam fir A. balsamea Bb C S
Grand fir A. grandis Bg C S Noble fir A. procera Bp C S
*Shasta red fir A. magnifica var. shastensis
Bm C S
*White fir A. concolor Bc C S
Birch Betula E Alaska paper birch B. neoalaskana Ea C S Alaska x paper birch hybrid B. x winteri Exp C G European birch B. pendula Ee C G Paper birch B. papyrifera Ep C S Silver birch B. pubescens Es C G Water birch B. occidentalis Ew N S *Yellow birch B. alleghaniensis Ey C S
1 Based on ‘The BC Tree Code List’ Version 4.3
* Introduced Species
** C - commercial tree; N - non commercial tree
*** S - Code to species level; G - May be coded to genus level
November 2007 69
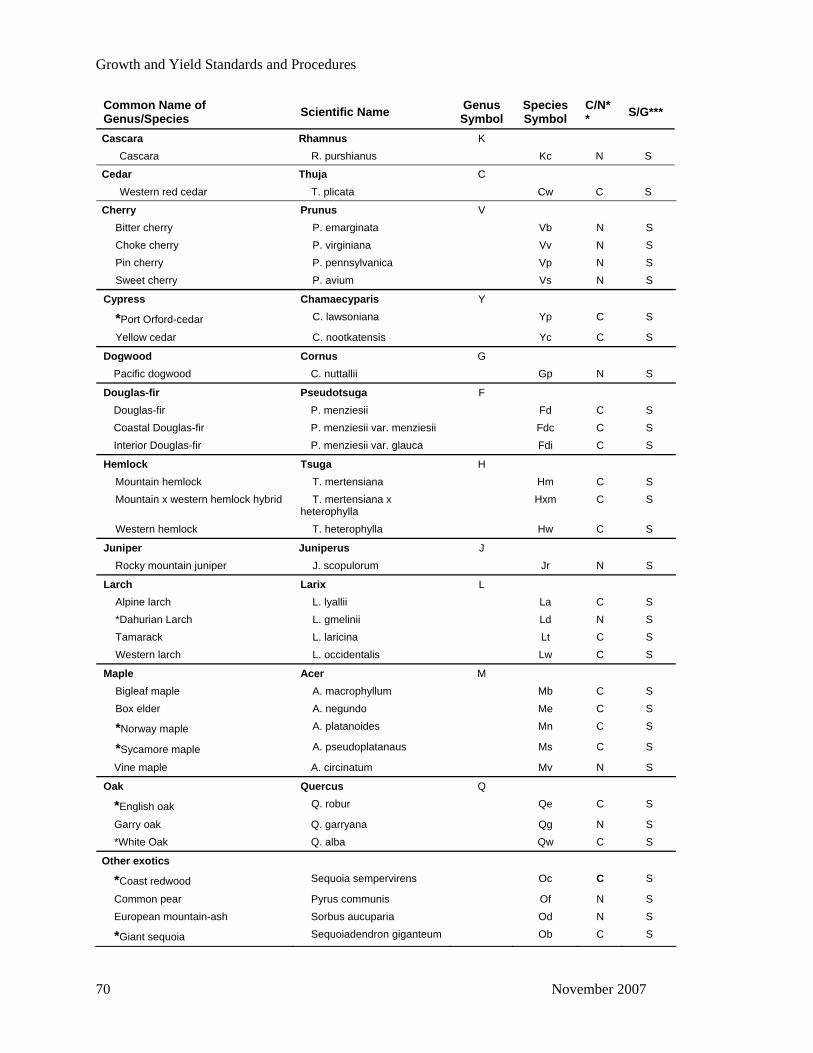
Growth and Yield Standards and Procedures
Common Name of Genus/Species Scientific Name Genus
Symbol SpeciesSymbol
C/N** S/G***
Cascara Rhamnus K Cascara R. purshianus Kc N S
Cedar Thuja C Western red cedar T. plicata Cw C S
Cherry Prunus V Bitter cherry P. emarginata Vb N S Choke cherry P. virginiana Vv N S Pin cherry P. pennsylvanica Vp N S Sweet cherry P. avium Vs N S
Cypress Chamaecyparis Y
*Port Orford-cedar C. lawsoniana Yp C S
Yellow cedar C. nootkatensis Yc C S
Dogwood Cornus G Pacific dogwood C. nuttallii Gp N S
Douglas-fir Pseudotsuga F Douglas-fir P. menziesii Fd C S Coastal Douglas-fir P. menziesii var. menziesii Fdc C S Interior Douglas-fir P. menziesii var. glauca Fdi C S
Hemlock Tsuga H Mountain hemlock T. mertensiana Hm C S Mountain x western hemlock hybrid T. mertensiana x
heterophylla Hxm C S
Western hemlock T. heterophylla Hw C S
Juniper Juniperus J Rocky mountain juniper J. scopulorum Jr N S
Larch Larix L Alpine larch L. lyallii La C S *Dahurian Larch L. gmelinii Ld N S Tamarack L. laricina Lt C S Western larch L. occidentalis Lw C S
Maple Acer M Bigleaf maple A. macrophyllum Mb C S Box elder A. negundo Me C S
*Norway maple A. platanoides Mn C S
*Sycamore maple A. pseudoplatanaus Ms C S
Vine maple A. circinatum Mv N S
Oak Quercus Q
*English oak Q. robur Qe C S
Garry oak Q. garryana Qg N S *White Oak Q. alba Qw C S
Other exotics
*Coast redwood Sequoia sempervirens Oc C S
Common pear Pyrus communis Of N S European mountain-ash Sorbus aucuparia Od N S
*Giant sequoia Sequoiadendron giganteum Ob C S
70 November 2007
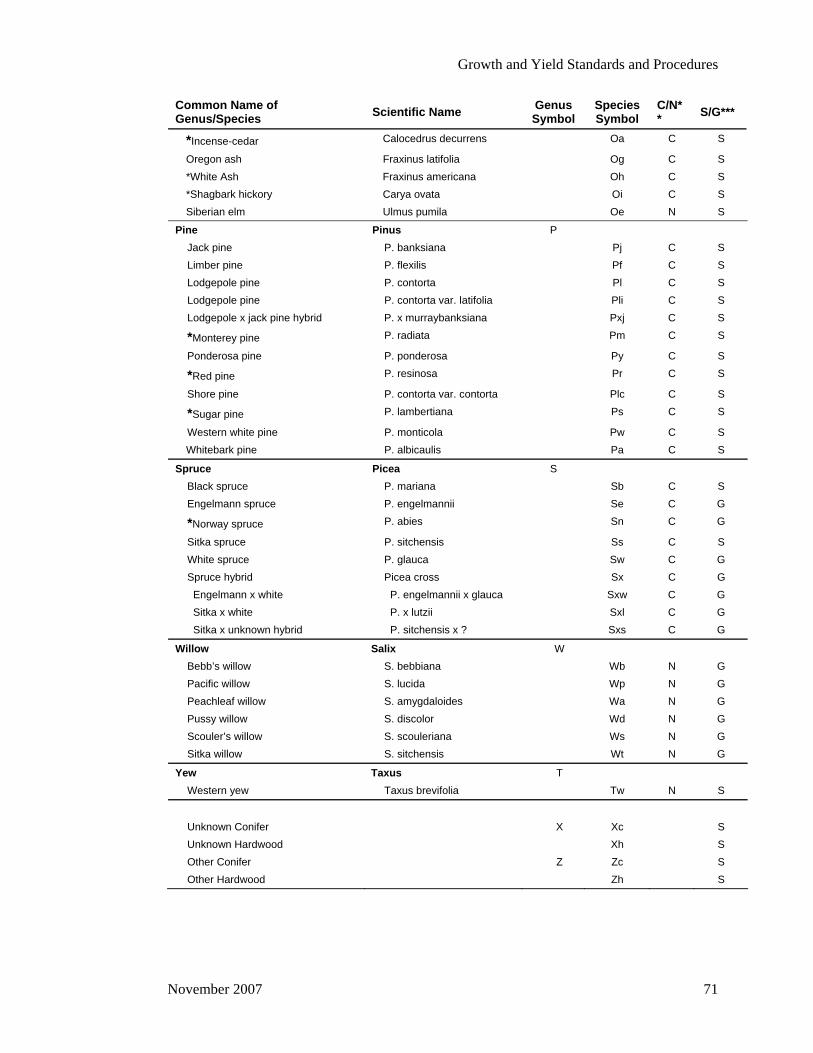
Growth and Yield Standards and Procedures
Common Name of Genus/Species Scientific Name Genus
Symbol SpeciesSymbol
C/N** S/G***
*Incense-cedar Calocedrus decurrens Oa C S
Oregon ash Fraxinus latifolia Og C S *White Ash Fraxinus americana Oh C S *Shagbark hickory Carya ovata Oi C S Siberian elm Ulmus pumila Oe N S
Pine Pinus P Jack pine P. banksiana Pj C S Limber pine P. flexilis Pf C S Lodgepole pine P. contorta Pl C S Lodgepole pine P. contorta var. latifolia Pli C S Lodgepole x jack pine hybrid P. x murraybanksiana Pxj C S
*Monterey pine P. radiata Pm C S
Ponderosa pine P. ponderosa Py C S
*Red pine P. resinosa Pr C S
Shore pine P. contorta var. contorta Plc C S
*Sugar pine P. lambertiana Ps C S
Western white pine P. monticola Pw C S Whitebark pine P. albicaulis Pa C S
Spruce Picea S Black spruce P. mariana Sb C S Engelmann spruce P. engelmannii Se C G
*Norway spruce P. abies Sn C G
Sitka spruce P. sitchensis Ss C S White spruce P. glauca Sw C G Spruce hybrid Picea cross Sx C G Engelmann x white P. engelmannii x glauca Sxw C G Sitka x white P. x lutzii Sxl C G Sitka x unknown hybrid P. sitchensis x ? Sxs C G
Willow Salix W Bebb’s willow S. bebbiana Wb N G Pacific willow S. lucida Wp N G Peachleaf willow S. amygdaloides Wa N G Pussy willow S. discolor Wd N G Scouler’s willow S. scouleriana Ws N G Sitka willow S. sitchensis Wt N G
Yew Taxus T Western yew Taxus brevifolia Tw N S
Unknown Conifer X Xc S Unknown Hardwood Xh S Other Conifer Z Zc S Other Hardwood Zh S
November 2007 71

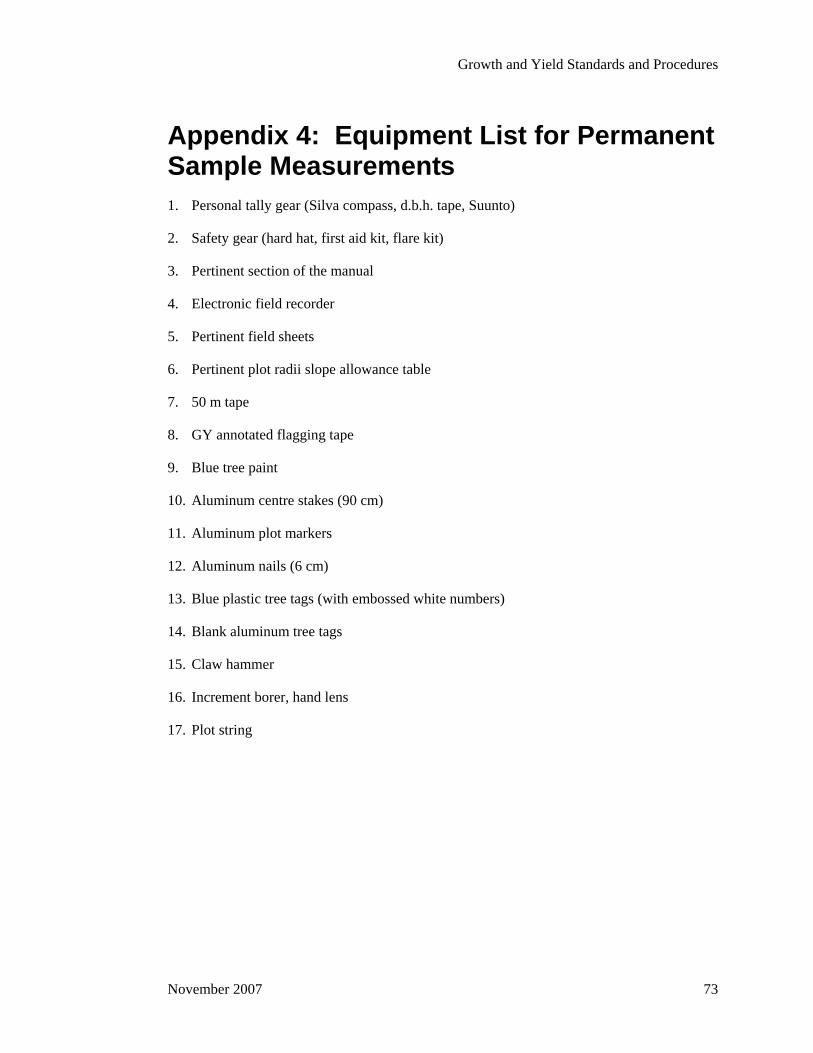
Growth and Yield Standards and Procedures
Appendix 4: Equipment List for Permanent Sample Measurements 1. Personal tally gear (Silva compass, d.b.h. tape, Suunto)
2. Safety gear (hard hat, first aid kit, flare kit)
3. Pertinent section of the manual
4. Electronic field recorder
5. Pertinent field sheets
6. Pertinent plot radii slope allowance table
7. 50 m tape
8. GY annotated flagging tape
9. Blue tree paint
10. Aluminum centre stakes (90 cm)
11. Aluminum plot markers
12. Aluminum nails (6 cm)
13. Blue plastic tree tags (with embossed white numbers)
14. Blank aluminum tree tags
15. Claw hammer
16. Increment borer, hand lens
17. Plot string
November 2007 73

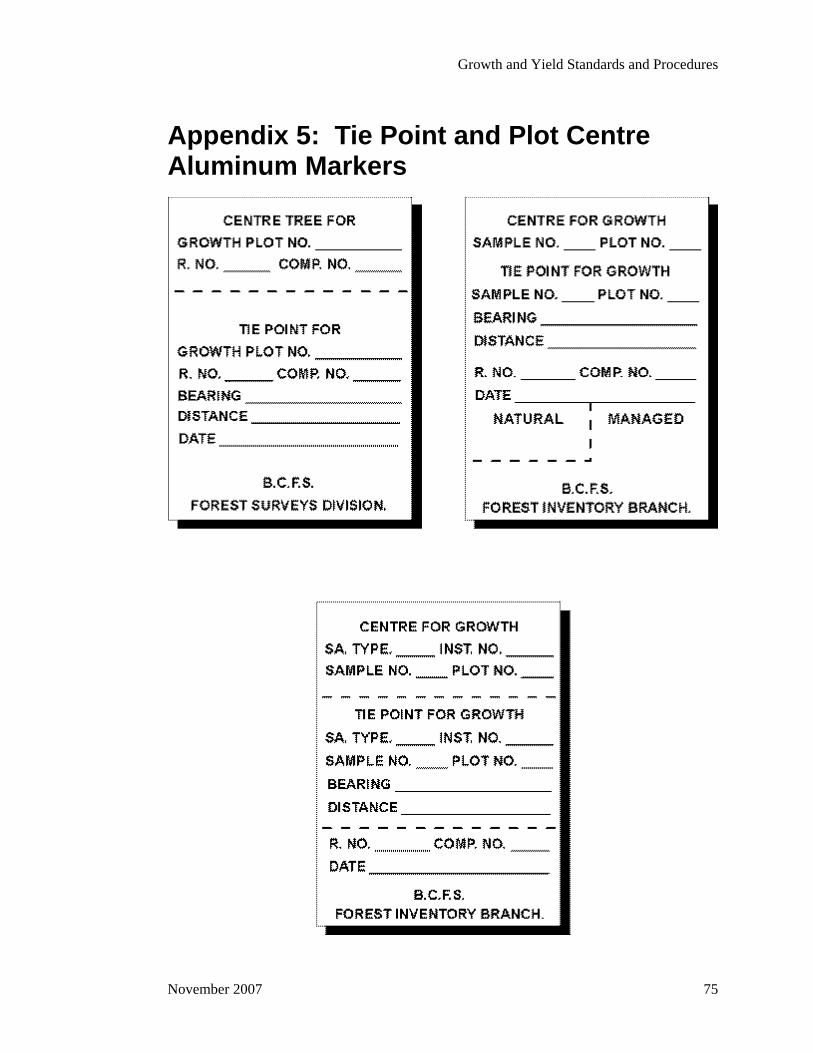
Growth and Yield Standards and Procedures
Appendix 5: Tie Point and Plot Centre Aluminum Markers
November 2007 75


Growth and Yield Standards and Procedures
Appendix 6: Plot and Sub-plot Radii Slope Allowance for Natural Stands Samples
Plot Size
(ha)/P.H.F. Plot Radii (m)
Plot and Sub-plot Size (ha), P.H.F., and Radii (m)
0.102 0.081 0.0503 .1 0.09 0.08 0.07 0.06 0.05 0.04 0.03 0.025 0.02 0.015 0.01 0.007 0.005
9.88 12.36 19.76 10.0 11.11 12.50 14.29 16.67 20.00 25.00 33.33 40.00 50.00 66.67 100.00 142.86 200.00
17.98 16.06 12.65 17.84 16.93 15.96 14.93 13.82 12.62 11.28 9.77 8.92 7.98 6.91 5.64 4.72 3.99
Slope %
Plot Radii Plus Slope
Allowance (m)
Sub-plot Radii Plus Slope Allowance (m)
10 18.07 16.14 12.71 17.93 17.01 16.04 15.00 13.89 12.68 11.34 9.82 8.96 8.02 6.94 5.67 4.74 4.01
12 18.11 16.18 12.74 17.97 17.05 16.07 15.04 13.92 12.71 11.36 9.84 8.98 8.04 6.96 5.68 4.75 4.02
14 18.16 16.22 12.77 18.01 17.10 16.12 15.08 13.95 12.74 11.39 9.87 9.01 8.06 6.98 5.70 4.77 4.03
16 18.21 16.26 12.81 18.07 17.15 16.16 15.12 14.00 12.78 11.42 9.89 9.03 8.08 7.00 5.71 4.78 4.04
18 18.27 16.32 12.85 18.13 17.20 16.22 15.17 14.04 12.82 11.46 9.93 9.06 8.11 7.02 5.73 4.80 4.05
20 18.34 16.38 12.90 18.19 17.27 16.28 15.23 14.09 12.87 11.50 9.96 9.10 8.14 7.05 5.75 4.81 4.07
22 18.41 16.44 12.95 18.27 17.33 16.34 15.29 14.15 12.92 11.55 10.00 9.13 8.17 7.08 5.77 4.83 4.09
24 18.49 16.52 13.01 18.35 17.41 16.41 15.35 14.21 12.98 11.60 10.05 9.17 8.21 7.11 5.80 4.85 4.10
26 18.58 16.59 13.07 18.43 17.49 16.49 15.43 14.28 13.04 11.66 10.09 9.22 8.25 7.14 5.83 4.88 4.12
28 18.67 16.68 13.14 18.53 17.58 16.57 15.50 14.35 13.11 11.71 10.15 9.26 8.29 7.18 5.86 4.90 4.14
30 18.77 16.77 13.21 18.63 17.68 16.66 15.59 14.43 13.18 11.78 10.20 9.31 8.33 7.21 5.89 4.93 4.17
32 18.88 16.86 13.28 18.73 17.78 16.76 15.68 14.51 13.25 11.84 10.26 9.37 8.38 7.26 5.92 4.96 4.19
34 18.99 16.96 13.36 18.84 17.88 16.86 15.77 14.60 13.33 11.91 10.32 9.42 8.43 7.30 5.96 4.99 4.21
36 19.11 17.07 13.44 18.96 17.99 16.96 15.87 14.69 13.41 11.99 10.38 9.48 8.48 7.34 5.99 5.02 4.24
38 19.23 17.18 13.53 19.08 18.11 17.07 15.97 14.78 13.50 12.07 10.45 9.54 8.54 7.39 6.03 5.05 4.27
40 19.37 17.30 13.62 19.21 18.23 17.19 16.08 14.88 13.59 12.15 10.52 9.61 8.59 7.44 6.07 5.08 4.30
42 19.50 17.42 13.72 19.35 18.36 17.31 16.19 14.99 13.69 12.23 10.60 9.67 8.66 7.49 6.12 5.12 4.33
44 19.64 17.55 13.82 19.49 18.50 17.44 16.31 15.10 13.79 12.32 10.67 9.75 8.72 7.55 6.16 5.16 4.36
46 19.79 17.68 13.92 19.64 18.64 17.57 16.43 15.21 13.89 12.42 10.75 9.82 8.78 7.61 6.21 5.20 4.39
48 19.94 17.81 14.03 19.79 18.78 17.70 16.56 15.33 14.00 12.51 10.84 9.89 8.85 7.66 6.26 5.24 4.43
50 20.10 17.96 14.14 19.95 18.93 17.84 16.69 15.45 14.11 12.61 10.92 9.97 8.92 7.73 6.31 5.28 4.46
52 20.27 18.10 14.26 20.11 19.08 17.99 16.83 15.58 14.22 12.71 11.01 10.05 8.99 7.79 6.36 5.32 4.50
November 2007 77
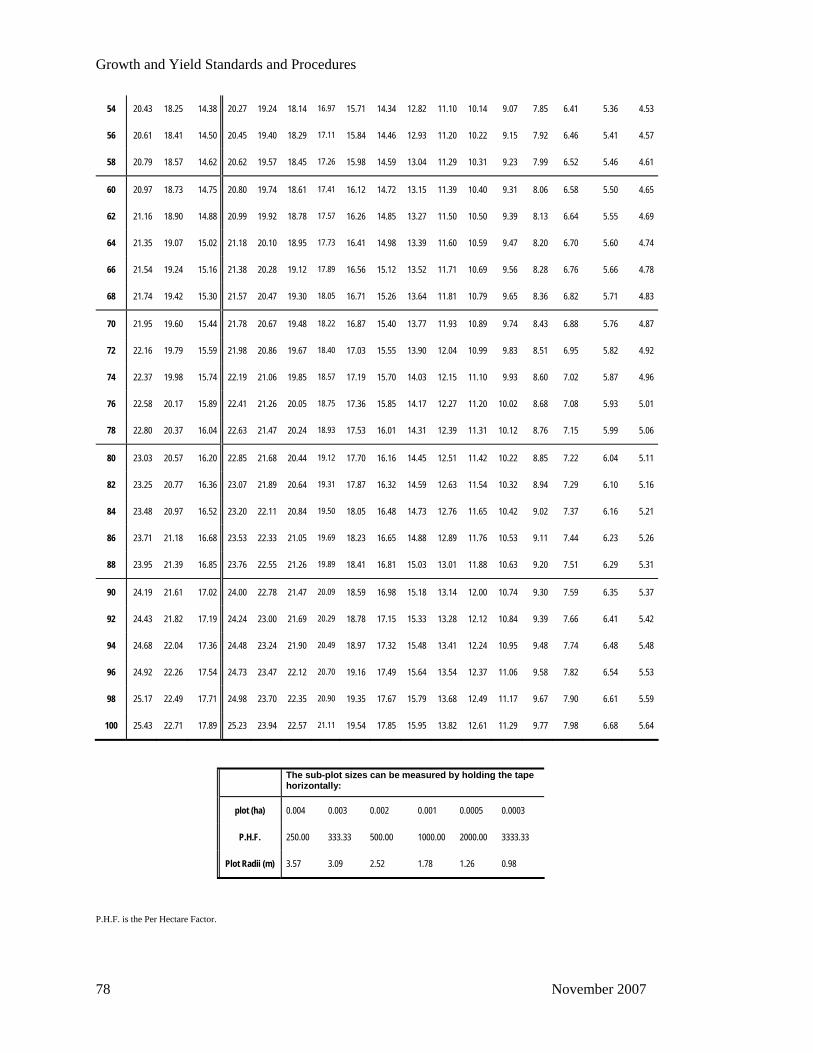
Growth and Yield Standards and Procedures
54 20.43 18.25 14.38 20.27 19.24 18.14 16.97 15.71 14.34 12.82 11.10 10.14 9.07 7.85 6.41 5.36 4.53
56 20.61 18.41 14.50 20.45 19.40 18.29 17.11 15.84 14.46 12.93 11.20 10.22 9.15 7.92 6.46 5.41 4.57
58 20.79 18.57 14.62 20.62 19.57 18.45 17.26 15.98 14.59 13.04 11.29 10.31 9.23 7.99 6.52 5.46 4.61
60 20.97 18.73 14.75 20.80 19.74 18.61 17.41 16.12 14.72 13.15 11.39 10.40 9.31 8.06 6.58 5.50 4.65
62 21.16 18.90 14.88 20.99 19.92 18.78 17.57 16.26 14.85 13.27 11.50 10.50 9.39 8.13 6.64 5.55 4.69
64 21.35 19.07 15.02 21.18 20.10 18.95 17.73 16.41 14.98 13.39 11.60 10.59 9.47 8.20 6.70 5.60 4.74
66 21.54 19.24 15.16 21.38 20.28 19.12 17.89 16.56 15.12 13.52 11.71 10.69 9.56 8.28 6.76 5.66 4.78
68 21.74 19.42 15.30 21.57 20.47 19.30 18.05 16.71 15.26 13.64 11.81 10.79 9.65 8.36 6.82 5.71 4.83
70 21.95 19.60 15.44 21.78 20.67 19.48 18.22 16.87 15.40 13.77 11.93 10.89 9.74 8.43 6.88 5.76 4.87
72 22.16 19.79 15.59 21.98 20.86 19.67 18.40 17.03 15.55 13.90 12.04 10.99 9.83 8.51 6.95 5.82 4.92
74 22.37 19.98 15.74 22.19 21.06 19.85 18.57 17.19 15.70 14.03 12.15 11.10 9.93 8.60 7.02 5.87 4.96
76 22.58 20.17 15.89 22.41 21.26 20.05 18.75 17.36 15.85 14.17 12.27 11.20 10.02 8.68 7.08 5.93 5.01
78 22.80 20.37 16.04 22.63 21.47 20.24 18.93 17.53 16.01 14.31 12.39 11.31 10.12 8.76 7.15 5.99 5.06
80 23.03 20.57 16.20 22.85 21.68 20.44 19.12 17.70 16.16 14.45 12.51 11.42 10.22 8.85 7.22 6.04 5.11
82 23.25 20.77 16.36 23.07 21.89 20.64 19.31 17.87 16.32 14.59 12.63 11.54 10.32 8.94 7.29 6.10 5.16
84 23.48 20.97 16.52 23.20 22.11 20.84 19.50 18.05 16.48 14.73 12.76 11.65 10.42 9.02 7.37 6.16 5.21
86 23.71 21.18 16.68 23.53 22.33 21.05 19.69 18.23 16.65 14.88 12.89 11.76 10.53 9.11 7.44 6.23 5.26
88 23.95 21.39 16.85 23.76 22.55 21.26 19.89 18.41 16.81 15.03 13.01 11.88 10.63 9.20 7.51 6.29 5.31
90 24.19 21.61 17.02 24.00 22.78 21.47 20.09 18.59 16.98 15.18 13.14 12.00 10.74 9.30 7.59 6.35 5.37
92 24.43 21.82 17.19 24.24 23.00 21.69 20.29 18.78 17.15 15.33 13.28 12.12 10.84 9.39 7.66 6.41 5.42
94 24.68 22.04 17.36 24.48 23.24 21.90 20.49 18.97 17.32 15.48 13.41 12.24 10.95 9.48 7.74 6.48 5.48
96 24.92 22.26 17.54 24.73 23.47 22.12 20.70 19.16 17.49 15.64 13.54 12.37 11.06 9.58 7.82 6.54 5.53
98 25.17 22.49 17.71 24.98 23.70 22.35 20.90 19.35 17.67 15.79 13.68 12.49 11.17 9.67 7.90 6.61 5.59
100 25.43 22.71 17.89 25.23 23.94 22.57 21.11 19.54 17.85 15.95 13.82 12.61 11.29 9.77 7.98 6.68 5.64
The sub-plot sizes can be measured by holding the tape horizontally:
plot (ha) 0.004 0.003 0.002 0.001 0.0005 0.0003
P.H.F. 250.00 333.33 500.00 1000.00 2000.00 3333.33
Plot Radii (m) 3.57 3.09 2.52 1.78 1.26 0.98
P.H.F. is the Per Hectare Factor.
78 November 2007
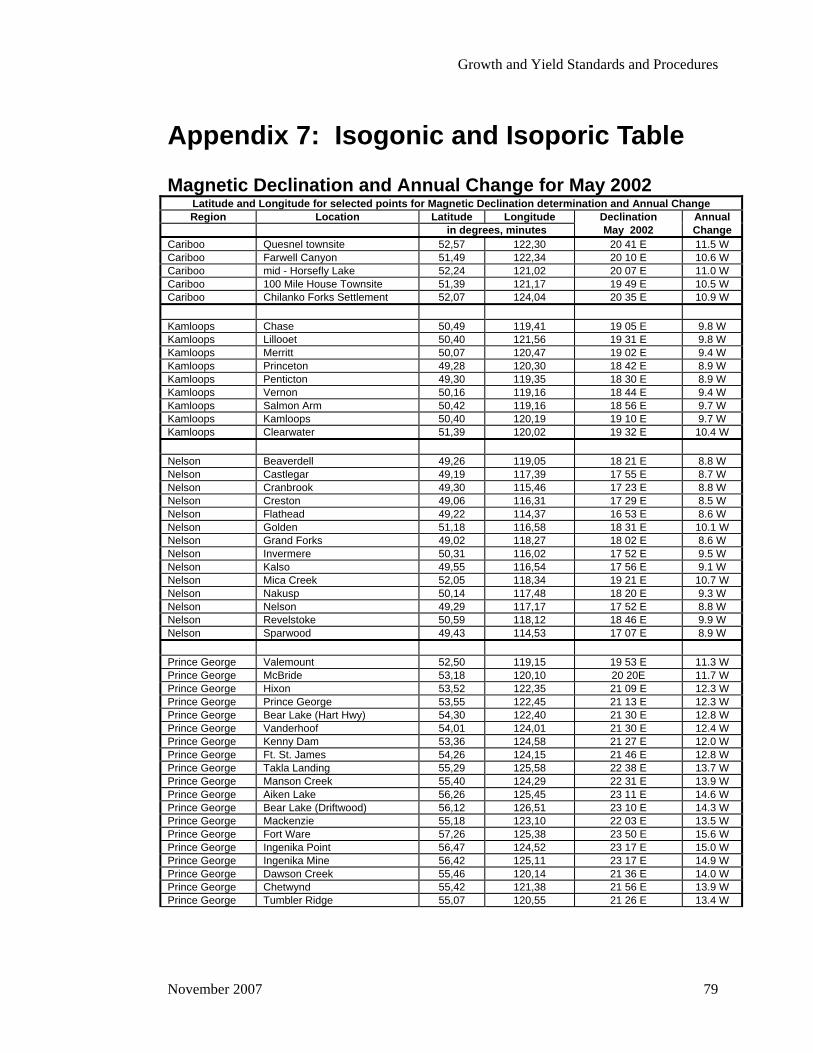
Growth and Yield Standards and Procedures
Appendix 7: Isogonic and Isoporic Table
Magnetic Declination and Annual Change for May 2002 Latitude and Longitude for selected points for Magnetic Declination determination and Annual Change Region Location Latitude Longitude Declination Annual
in degrees, minutes May 2002 Change Cariboo Quesnel townsite 52,57 122,30 20 41 E 11.5 W Cariboo Farwell Canyon 51,49 122,34 20 10 E 10.6 W Cariboo mid - Horsefly Lake 52,24 121,02 20 07 E 11.0 W Cariboo 100 Mile House Townsite 51,39 121,17 19 49 E 10.5 W Cariboo Chilanko Forks Settlement 52,07 124,04 20 35 E 10.9 W Kamloops Chase 50,49 119,41 19 05 E 9.8 W Kamloops Lillooet 50,40 121,56 19 31 E 9.8 W Kamloops Merritt 50,07 120,47 19 02 E 9.4 W Kamloops Princeton 49,28 120,30 18 42 E 8.9 W Kamloops Penticton 49,30 119,35 18 30 E 8.9 W Kamloops Vernon 50,16 119,16 18 44 E 9.4 W Kamloops Salmon Arm 50,42 119,16 18 56 E 9.7 W Kamloops Kamloops 50,40 120,19 19 10 E 9.7 W Kamloops Clearwater 51,39 120,02 19 32 E 10.4 W Nelson Beaverdell 49,26 119,05 18 21 E 8.8 W Nelson Castlegar 49,19 117,39 17 55 E 8.7 W Nelson Cranbrook 49,30 115,46 17 23 E 8.8 W Nelson Creston 49,06 116,31 17 29 E 8.5 W Nelson Flathead 49,22 114,37 16 53 E 8.6 W Nelson Golden 51,18 116,58 18 31 E 10.1 W Nelson Grand Forks 49,02 118,27 18 02 E 8.6 W Nelson Invermere 50,31 116,02 17 52 E 9.5 W Nelson Kalso 49,55 116,54 17 56 E 9.1 W Nelson Mica Creek 52,05 118,34 19 21 E 10.7 W Nelson Nakusp 50,14 117,48 18 20 E 9.3 W Nelson Nelson 49,29 117,17 17 52 E 8.8 W Nelson Revelstoke 50,59 118,12 18 46 E 9.9 W Nelson Sparwood 49,43 114,53 17 07 E 8.9 W Prince George Valemount 52,50 119,15 19 53 E 11.3 W Prince George McBride 53,18 120,10 20 20E 11.7 W Prince George Hixon 53,52 122,35 21 09 E 12.3 W Prince George Prince George 53,55 122,45 21 13 E 12.3 W Prince George Bear Lake (Hart Hwy) 54,30 122,40 21 30 E 12.8 W Prince George Vanderhoof 54,01 124,01 21 30 E 12.4 W Prince George Kenny Dam 53,36 124,58 21 27 E 12.0 W Prince George Ft. St. James 54,26 124,15 21 46 E 12.8 W Prince George Takla Landing 55,29 125,58 22 38 E 13.7 W Prince George Manson Creek 55,40 124,29 22 31 E 13.9 W Prince George Aiken Lake 56,26 125,45 23 11 E 14.6 W Prince George Bear Lake (Driftwood) 56,12 126,51 23 10 E 14.3 W Prince George Mackenzie 55,18 123,10 22 03 E 13.5 W Prince George Fort Ware 57,26 125,38 23 50 E 15.6 W Prince George Ingenika Point 56,47 124,52 23 17 E 15.0 W Prince George Ingenika Mine 56,42 125,11 23 17 E 14.9 W Prince George Dawson Creek 55,46 120,14 21 36 E 14.0 W Prince George Chetwynd 55,42 121,38 21 56 E 13.9 W Prince George Tumbler Ridge 55,07 120,55 21 26 E 13.4 W
November 2007 79
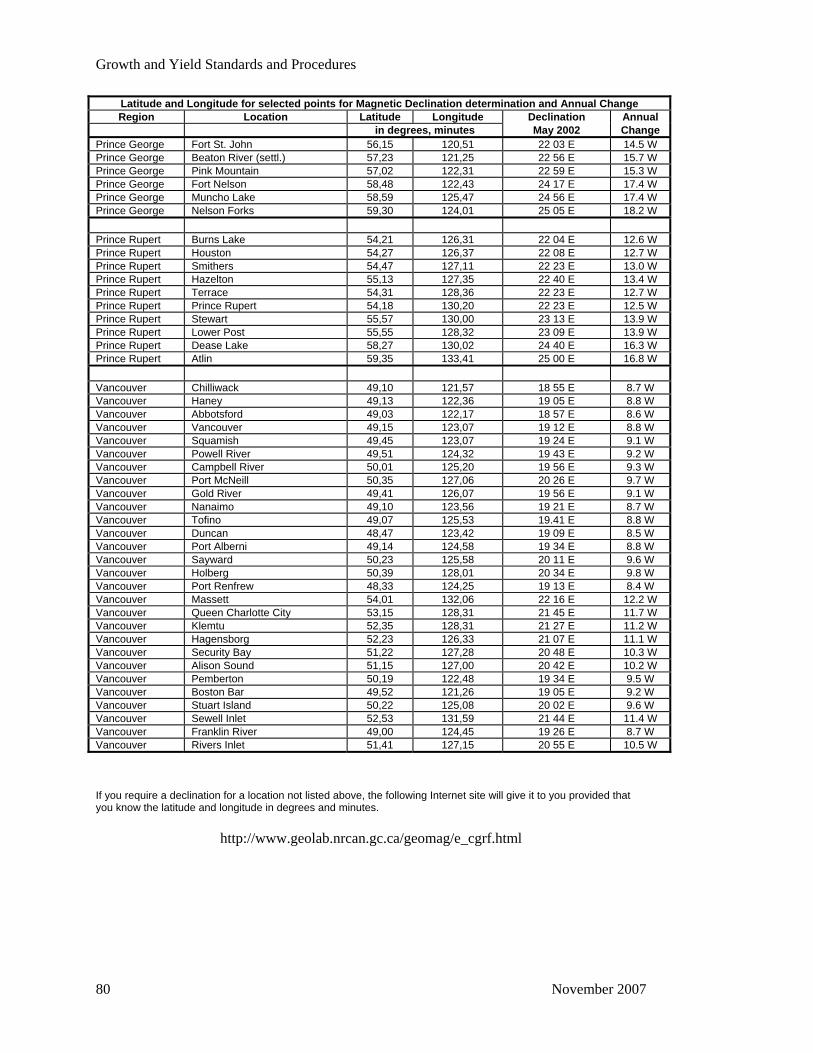
Growth and Yield Standards and Procedures
Latitude and Longitude for selected points for Magnetic Declination determination and Annual Change Region Location Latitude Longitude Declination Annual
in degrees, minutes May 2002 Change Prince George Fort St. John 56,15 120,51 22 03 E 14.5 W Prince George Beaton River (settl.) 57,23 121,25 22 56 E 15.7 W Prince George Pink Mountain 57,02 122,31 22 59 E 15.3 W Prince George Fort Nelson 58,48 122,43 24 17 E 17.4 W Prince George Muncho Lake 58,59 125,47 24 56 E 17.4 W Prince George Nelson Forks 59,30 124,01 25 05 E 18.2 W Prince Rupert Burns Lake 54,21 126,31 22 04 E 12.6 W Prince Rupert Houston 54,27 126,37 22 08 E 12.7 W Prince Rupert Smithers 54,47 127,11 22 23 E 13.0 W Prince Rupert Hazelton 55,13 127,35 22 40 E 13.4 W Prince Rupert Terrace 54,31 128,36 22 23 E 12.7 W Prince Rupert Prince Rupert 54,18 130,20 22 23 E 12.5 W Prince Rupert Stewart 55,57 130,00 23 13 E 13.9 W Prince Rupert Lower Post 55,55 128,32 23 09 E 13.9 W Prince Rupert Dease Lake 58,27 130,02 24 40 E 16.3 W Prince Rupert Atlin 59,35 133,41 25 00 E 16.8 W Vancouver Chilliwack 49,10 121,57 18 55 E 8.7 W Vancouver Haney 49,13 122,36 19 05 E 8.8 W Vancouver Abbotsford 49,03 122,17 18 57 E 8.6 W Vancouver Vancouver 49,15 123,07 19 12 E 8.8 W Vancouver Squamish 49,45 123,07 19 24 E 9.1 W Vancouver Powell River 49,51 124,32 19 43 E 9.2 W Vancouver Campbell River 50,01 125,20 19 56 E 9.3 W Vancouver Port McNeill 50,35 127,06 20 26 E 9.7 W Vancouver Gold River 49,41 126,07 19 56 E 9.1 W Vancouver Nanaimo 49,10 123,56 19 21 E 8.7 W Vancouver Tofino 49,07 125,53 19.41 E 8.8 W Vancouver Duncan 48,47 123,42 19 09 E 8.5 W Vancouver Port Alberni 49,14 124,58 19 34 E 8.8 W Vancouver Sayward 50,23 125,58 20 11 E 9.6 W Vancouver Holberg 50,39 128,01 20 34 E 9.8 W Vancouver Port Renfrew 48,33 124,25 19 13 E 8.4 W Vancouver Massett 54,01 132,06 22 16 E 12.2 W Vancouver Queen Charlotte City 53,15 128,31 21 45 E 11.7 W Vancouver Klemtu 52,35 128,31 21 27 E 11.2 W Vancouver Hagensborg 52,23 126,33 21 07 E 11.1 W Vancouver Security Bay 51,22 127,28 20 48 E 10.3 W Vancouver Alison Sound 51,15 127,00 20 42 E 10.2 W Vancouver Pemberton 50,19 122,48 19 34 E 9.5 W Vancouver Boston Bar 49,52 121,26 19 05 E 9.2 W Vancouver Stuart Island 50,22 125,08 20 02 E 9.6 W Vancouver Sewell Inlet 52,53 131,59 21 44 E 11.4 W Vancouver Franklin River 49,00 124,45 19 26 E 8.7 W Vancouver Rivers Inlet 51,41 127,15 20 55 E 10.5 W
If you require a declination for a location not listed above, the following Internet site will give it to you provided that you know the latitude and longitude in degrees and minutes.
http://www.geolab.nrcan.gc.ca/geomag/e_cgrf.html
80 November 2007
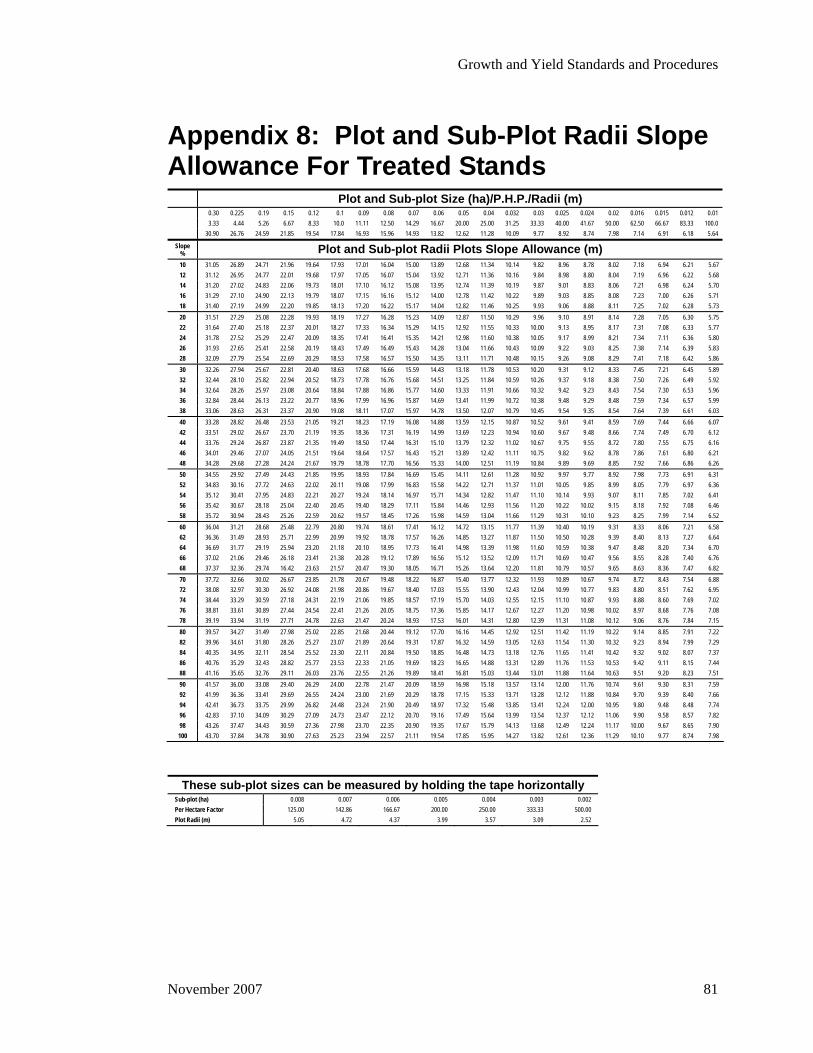
Growth and Yield Standards and Procedures
November 2007 81
Appendix 8: Plot and Sub-Plot Radii Slope Allowance For Treated Stands
Plot and Sub-plot Size (ha)/P.H.P./Radii (m) 0.30 0.225 0.19 0.15 0.12 0.1 0.09 0.08 0.07 0.06 0.05 0.04 0.032 0.03 0.025 0.024 0.02 0.016 0.015 0.012 0.01 3.33 4.44 5.26 6.67 8.33 10.0 11.11 12.50 14.29 16.67 20.00 25.00 31.25 33.33 40.00 41.67 50.00 62.50 66.67 83.33 100.0 30.90 26.76 24.59 21.85 19.54 17.84 16.93 15.96 14.93 13.82 12.62 11.28 10.09 9.77 8.92 8.74 7.98 7.14 6.91 6.18 5.64
Slope % Plot and Sub-plot Radii Plots Slope Allowance (m) 10 31.05 26.89 24.71 21.96 19.64 17.93 17.01 16.04 15.00 13.89 12.68 11.34 10.14 9.82 8.96 8.78 8.02 7.18 6.94 6.21 5.67 12 31.12 26.95 24.77 22.01 19.68 17.97 17.05 16.07 15.04 13.92 12.71 11.36 10.16 9.84 8.98 8.80 8.04 7.19 6.96 6.22 5.68 14 31.20 27.02 24.83 22.06 19.73 18.01 17.10 16.12 15.08 13.95 12.74 11.39 10.19 9.87 9.01 8.83 8.06 7.21 6.98 6.24 5.70 16 31.29 27.10 24.90 22.13 19.79 18.07 17.15 16.16 15.12 14.00 12.78 11.42 10.22 9.89 9.03 8.85 8.08 7.23 7.00 6.26 5.71 18 31.40 27.19 24.99 22.20 19.85 18.13 17.20 16.22 15.17 14.04 12.82 11.46 10.25 9.93 9.06 8.88 8.11 7.25 7.02 6.28 5.73 20 31.51 27.29 25.08 22.28 19.93 18.19 17.27 16.28 15.23 14.09 12.87 11.50 10.29 9.96 9.10 8.91 8.14 7.28 7.05 6.30 5.75 22 31.64 27.40 25.18 22.37 20.01 18.27 17.33 16.34 15.29 14.15 12.92 11.55 10.33 10.00 9.13 8.95 8.17 7.31 7.08 6.33 5.77 24 31.78 27.52 25.29 22.47 20.09 18.35 17.41 16.41 15.35 14.21 12.98 11.60 10.38 10.05 9.17 8.99 8.21 7.34 7.11 6.36 5.80 26 31.93 27.65 25.41 22.58 20.19 18.43 17.49 16.49 15.43 14.28 13.04 11.66 10.43 10.09 9.22 9.03 8.25 7.38 7.14 6.39 5.83 28 32.09 27.79 25.54 22.69 20.29 18.53 17.58 16.57 15.50 14.35 13.11 11.71 10.48 10.15 9.26 9.08 8.29 7.41 7.18 6.42 5.86 30 32.26 27.94 25.67 22.81 20.40 18.63 17.68 16.66 15.59 14.43 13.18 11.78 10.53 10.20 9.31 9.12 8.33 7.45 7.21 6.45 5.89 32 32.44 28.10 25.82 22.94 20.52 18.73 17.78 16.76 15.68 14.51 13.25 11.84 10.59 10.26 9.37 9.18 8.38 7.50 7.26 6.49 5.92 34 32.64 28.26 25.97 23.08 20.64 18.84 17.88 16.86 15.77 14.60 13.33 11.91 10.66 10.32 9.42 9.23 8.43 7.54 7.30 6.53 5.96 36 32.84 28.44 26.13 23.22 20.77 18.96 17.99 16.96 15.87 14.69 13.41 11.99 10.72 10.38 9.48 9.29 8.48 7.59 7.34 6.57 5.99 38 33.06 28.63 26.31 23.37 20.90 19.08 18.11 17.07 15.97 14.78 13.50 12.07 10.79 10.45 9.54 9.35 8.54 7.64 7.39 6.61 6.03 40 33.28 28.82 26.48 23.53 21.05 19.21 18.23 17.19 16.08 14.88 13.59 12.15 10.87 10.52 9.61 9.41 8.59 7.69 7.44 6.66 6.07 42 33.51 29.02 26.67 23.70 21.19 19.35 18.36 17.31 16.19 14.99 13.69 12.23 10.94 10.60 9.67 9.48 8.66 7.74 7.49 6.70 6.12 44 33.76 29.24 26.87 23.87 21.35 19.49 18.50 17.44 16.31 15.10 13.79 12.32 11.02 10.67 9.75 9.55 8.72 7.80 7.55 6.75 6.16 46 34.01 29.46 27.07 24.05 21.51 19.64 18.64 17.57 16.43 15.21 13.89 12.42 11.11 10.75 9.82 9.62 8.78 7.86 7.61 6.80 6.21 48 34.28 29.68 27.28 24.24 21.67 19.79 18.78 17.70 16.56 15.33 14.00 12.51 11.19 10.84 9.89 9.69 8.85 7.92 7.66 6.86 6.26 50 34.55 29.92 27.49 24.43 21.85 19.95 18.93 17.84 16.69 15.45 14.11 12.61 11.28 10.92 9.97 9.77 8.92 7.98 7.73 6.91 6.31 52 34.83 30.16 27.72 24.63 22.02 20.11 19.08 17.99 16.83 15.58 14.22 12.71 11.37 11.01 10.05 9.85 8.99 8.05 7.79 6.97 6.36 54 35.12 30.41 27.95 24.83 22.21 20.27 19.24 18.14 16.97 15.71 14.34 12.82 11.47 11.10 10.14 9.93 9.07 8.11 7.85 7.02 6.41 56 35.42 30.67 28.18 25.04 22.40 20.45 19.40 18.29 17.11 15.84 14.46 12.93 11.56 11.20 10.22 10.02 9.15 8.18 7.92 7.08 6.46 58 35.72 30.94 28.43 25.26 22.59 20.62 19.57 18.45 17.26 15.98 14.59 13.04 11.66 11.29 10.31 10.10 9.23 8.25 7.99 7.14 6.52 60 36.04 31.21 28.68 25.48 22.79 20.80 19.74 18.61 17.41 16.12 14.72 13.15 11.77 11.39 10.40 10.19 9.31 8.33 8.06 7.21 6.58 62 36.36 31.49 28.93 25.71 22.99 20.99 19.92 18.78 17.57 16.26 14.85 13.27 11.87 11.50 10.50 10.28 9.39 8.40 8.13 7.27 6.64 64 36.69 31.77 29.19 25.94 23.20 21.18 20.10 18.95 17.73 16.41 14.98 13.39 11.98 11.60 10.59 10.38 9.47 8.48 8.20 7.34 6.70 66 37.02 21.06 29.46 26.18 23.41 21.38 20.28 19.12 17.89 16.56 15.12 13.52 12.09 11.71 10.69 10.47 9.56 8.55 8.28 7.40 6.76 68 37.37 32.36 29.74 16.42 23.63 21.57 20.47 19.30 18.05 16.71 15.26 13.64 12.20 11.81 10.79 10.57 9.65 8.63 8.36 7.47 6.82 70 37.72 32.66 30.02 26.67 23.85 21.78 20.67 19.48 18.22 16.87 15.40 13.77 12.32 11.93 10.89 10.67 9.74 8.72 8.43 7.54 6.88 72 38.08 32.97 30.30 26.92 24.08 21.98 20.86 19.67 18.40 17.03 15.55 13.90 12.43 12.04 10.99 10.77 9.83 8.80 8.51 7.62 6.95 74 38.44 33.29 30.59 27.18 24.31 22.19 21.06 19.85 18.57 17.19 15.70 14.03 12.55 12.15 11.10 10.87 9.93 8.88 8.60 7.69 7.02 76 38.81 33.61 30.89 27.44 24.54 22.41 21.26 20.05 18.75 17.36 15.85 14.17 12.67 12.27 11.20 10.98 10.02 8.97 8.68 7.76 7.08 78 39.19 33.94 31.19 27.71 24.78 22.63 21.47 20.24 18.93 17.53 16.01 14.31 12.80 12.39 11.31 11.08 10.12 9.06 8.76 7.84 7.15 80 39.57 34.27 31.49 27.98 25.02 22.85 21.68 20.44 19.12 17.70 16.16 14.45 12.92 12.51 11.42 11.19 10.22 9.14 8.85 7.91 7.22 82 39.96 34.61 31.80 28.26 25.27 23.07 21.89 20.64 19.31 17.87 16.32 14.59 13.05 12.63 11.54 11.30 10.32 9.23 8.94 7.99 7.29 84 40.35 34.95 32.11 28.54 25.52 23.30 22.11 20.84 19.50 18.85 16.48 14.73 13.18 12.76 11.65 11.41 10.42 9.32 9.02 8.07 7.37 86 40.76 35.29 32.43 28.82 25.77 23.53 22.33 21.05 19.69 18.23 16.65 14.88 13.31 12.89 11.76 11.53 10.53 9.42 9.11 8.15 7.44 88 41.16 35.65 32.76 29.11 26.03 23.76 22.55 21.26 19.89 18.41 16.81 15.03 13.44 13.01 11.88 11.64 10.63 9.51 9.20 8.23 7.51 90 41.57 36.00 33.08 29.40 26.29 24.00 22.78 21.47 20.09 18.59 16.98 15.18 13.57 13.14 12.00 11.76 10.74 9.61 9.30 8.31 7.59 92 41.99 36.36 33.41 29.69 26.55 24.24 23.00 21.69 20.29 18.78 17.15 15.33 13.71 13.28 12.12 11.88 10.84 9.70 9.39 8.40 7.66 94 42.41 36.73 33.75 29.99 26.82 24.48 23.24 21.90 20.49 18.97 17.32 15.48 13.85 13.41 12.24 12.00 10.95 9.80 9.48 8.48 7.74 96 42.83 37.10 34.09 30.29 27.09 24.73 23.47 22.12 20.70 19.16 17.49 15.64 13.99 13.54 12.37 12.12 11.06 9.90 9.58 8.57 7.82 98 43.26 37.47 34.43 30.59 27.36 27.98 23.70 22.35 20.90 19.35 17.67 15.79 14.13 13.68 12.49 12.24 11.17 10.00 9.67 8.65 7.90
100 43.70 37.84 34.78 30.90 27.63 25.23 23.94 22.57 21.11 19.54 17.85 15.95 14.27 13.82 12.61 12.36 11.29 10.10 9.77 8.74 7.98
These sub-plot sizes can be measured by holding the tape horizontally Sub-plot (ha) 0.008 0.007 0.006 0.005 0.004 0.003 0.002 Per Hectare Factor 125.00 142.86 166.67 200.00 250.00 333.33 500.00 Plot Radii (m) 5.05 4.72 4.37 3.99 3.57 3.09 2.52

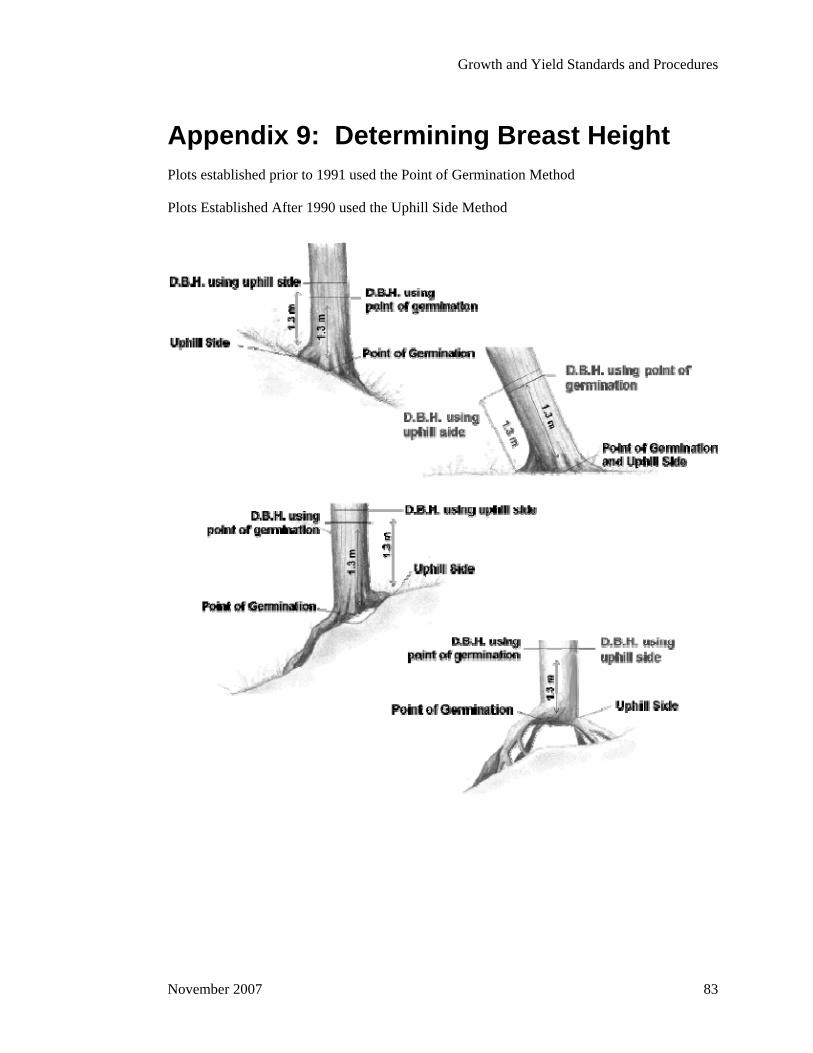
Growth and Yield Standards and Procedures
Appendix 9: Determining Breast Height Plots established prior to 1991 used the Point of Germination Method
Plots Established After 1990 used the Uphill Side Method
November 2007 83

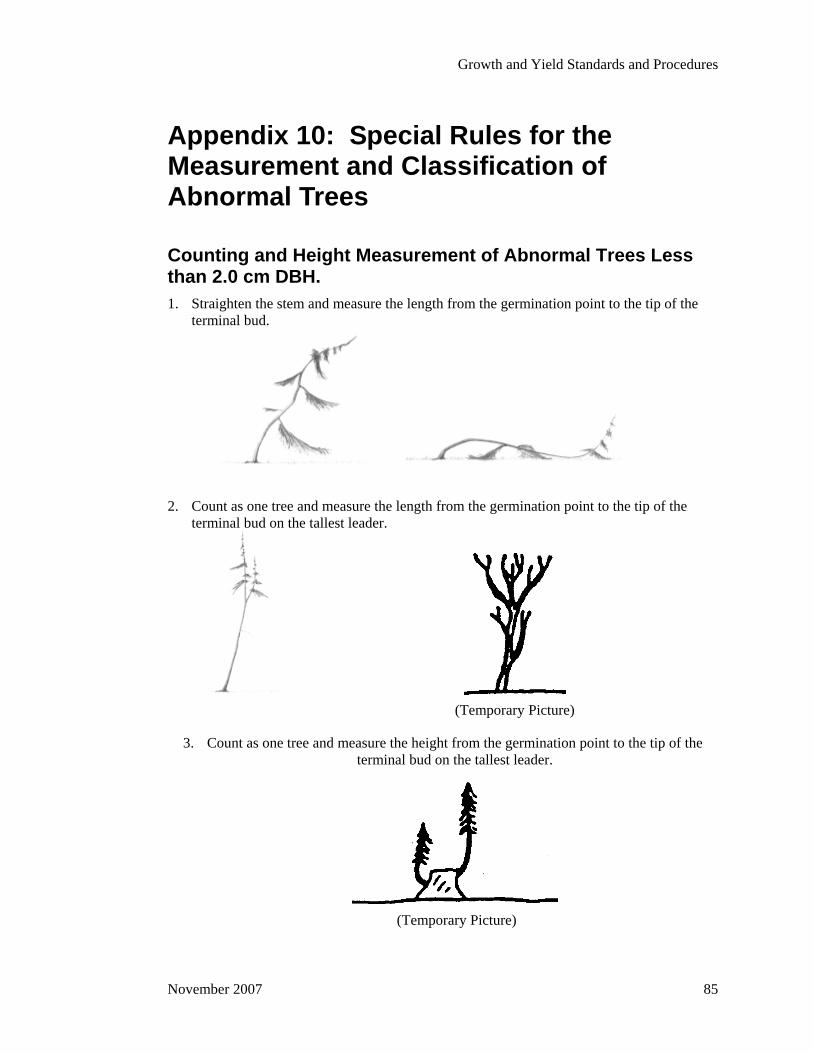
Growth and Yield Standards and Procedures
Appendix 10: Special Rules for the Measurement and Classification of Abnormal Trees
Counting and Height Measurement of Abnormal Trees Less than 2.0 cm DBH. 1. Straighten the stem and measure the length from the germination point to the tip of the
terminal bud.
2. Count as one tree and measure the length from the germination point to the tip of the terminal bud on the tallest leader.
(Temporary Picture)
3. Count as one tree and measure the height from the germination point to the tip of the terminal bud on the tallest leader.
(Temporary Picture)
November 2007 85
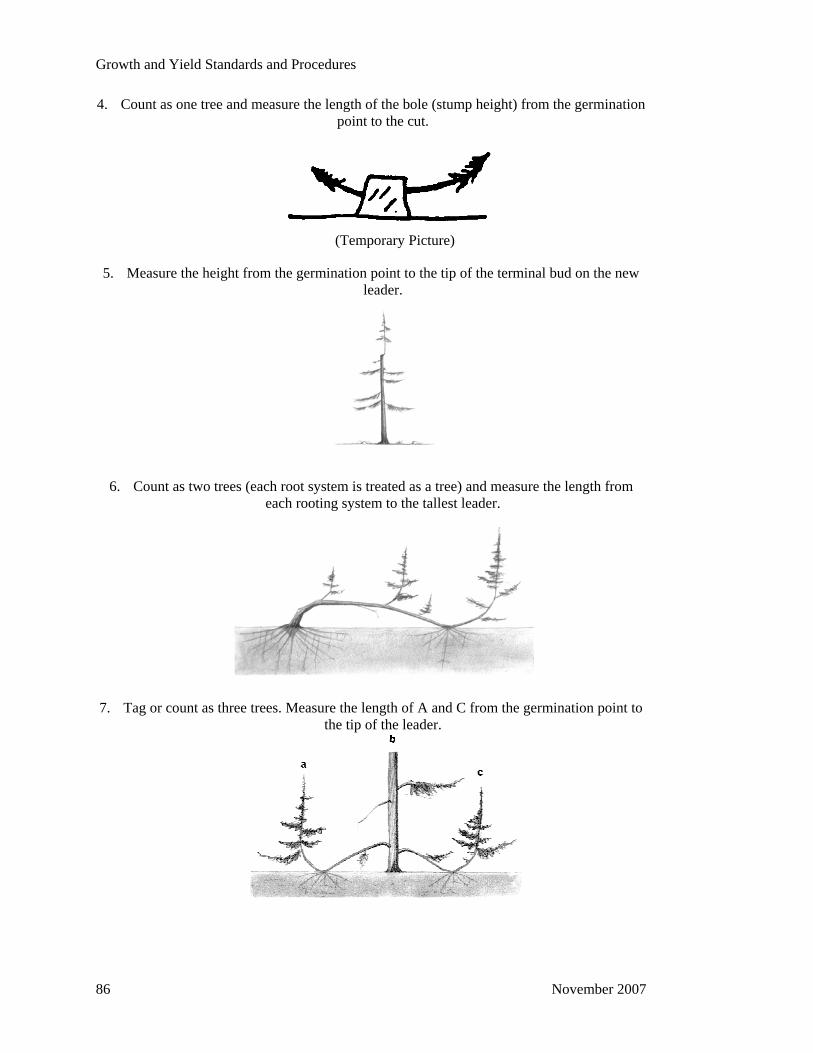
Growth and Yield Standards and Procedures
4. Count as one tree and measure the length of the bole (stump height) from the germination point to the cut.
(Temporary Picture)
5. Measure the height from the germination point to the tip of the terminal bud on the new leader.
6. Count as two trees (each root system is treated as a tree) and measure the length from each rooting system to the tallest leader.
7. Tag or count as three trees. Measure the length of A and C from the germination point to the tip of the leader.
86 November 2007
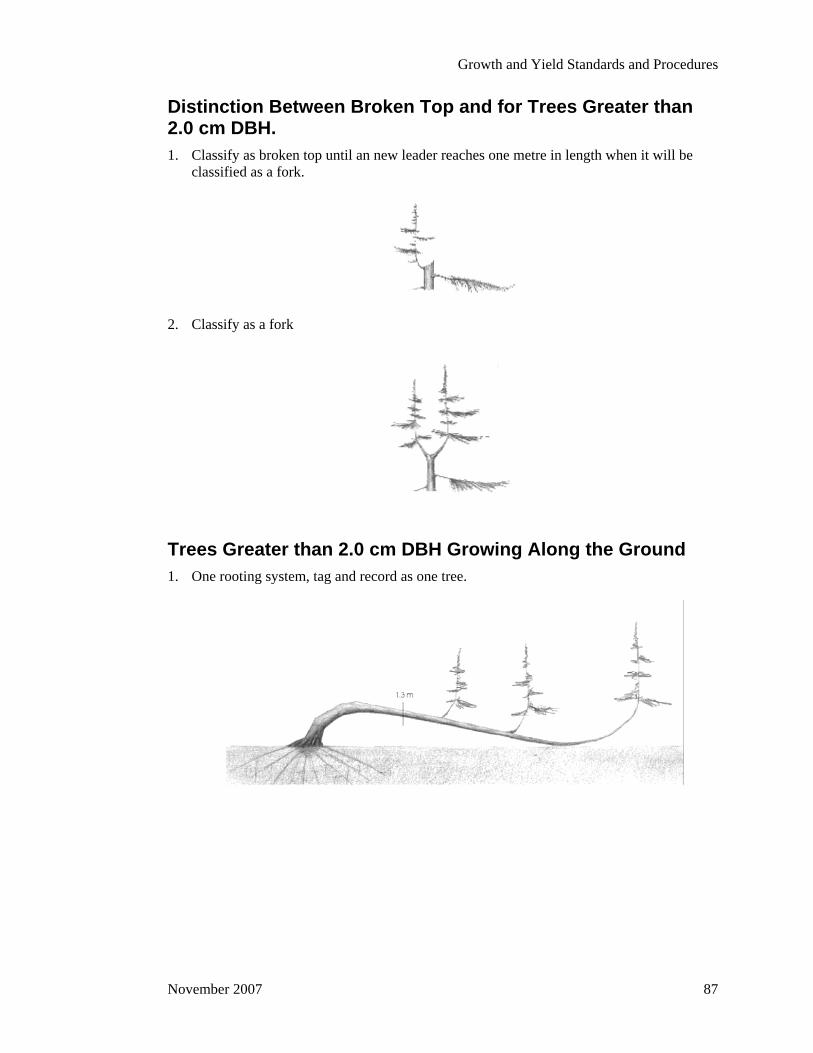
Growth and Yield Standards and Procedures
Distinction Between Broken Top and for Trees Greater than 2.0 cm DBH. 1. Classify as broken top until an new leader reaches one metre in length when it will be
classified as a fork.
2. Classify as a fork
Trees Greater than 2.0 cm DBH Growing Along the Ground 1. One rooting system, tag and record as one tree.
November 2007 87
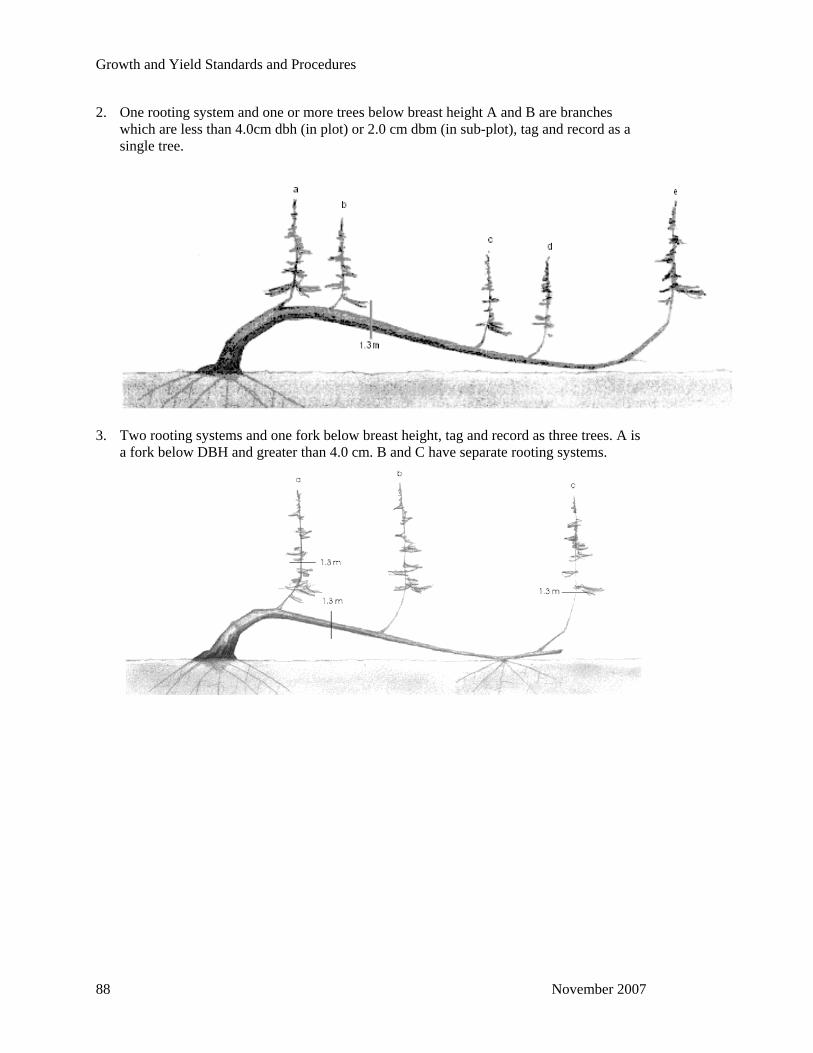
Growth and Yield Standards and Procedures
2. One rooting system and one or more trees below breast height A and B are branches which are less than 4.0cm dbh (in plot) or 2.0 cm dbm (in sub-plot), tag and record as a single tree.
3. Two rooting systems and one fork below breast height, tag and record as three trees. A is a fork below DBH and greater than 4.0 cm. B and C have separate rooting systems.
88 November 2007
Growth and Yield Standards and Procedures
Appendix 11: Pathological Classification of Trees In mature and older immature stands, the amount of decay that may be present in individual trees can vary considerably. However, reliable estimates of net stand volumes must be obtained. This is accomplished through sampling and through the application of decay reduction factors during sample compilation. But, it must be realized that the correct application of these factors can only be achieved when sampling crews correctly identify and record the presence (or absence) of the decay indicators. This involves the determination of suspect and residual tree classes.
Classes of Trees All living trees, equal to or greater than 2.0 cm d.b.h. in the sub-plot and 4.0 cm d.b.h. in the plot, are classed as suspect or residual.
Suspect Trees Suspect trees are living trees which have one or more of the following external indicators of decay on, or immediately adjacent to, the trunk.
1. Conks
2. Blind conks (swollen knots)
3. Scars
4. Fork or pronounced crook
5. Frost crack
6. Trunk infections of mistletoe
7. Rotten branches
8. Dead top
9. Broken top
Note: Classify a tree as suspect on the basis of one or more of the indicators in the preceding list; no other abnormalities are to be used.
Indicators of decay signify decay in the stand rather than in individual trees. The amount of decay indicated varies considerably among species and between individual trees. For example, frost cracks might be highly significant of decay on a particular species in the stand as a whole, but not of individual trees within that stand. On other species within the same
November 2007 89
Growth and Yield Standards and Procedures
stand, frost cracks may not be indicative of decay. However, we must know the occurrence of each indicator of decay before an evaluation can be attempted for any species or stand.
Residual Trees Residual trees are living trees which bear none of the external indicators of decay listed in “Suspect Trees”.
Suspect Indicators of Decay on Standing Trees A brief description and explanation of the external indicators of decay listed in “Suspect Trees” follows:
Conks Conks are definite and reliable indicators of decay. They appear most frequently on the underside of dead branch stubs, on branch scars, and on the underside of live branches in the crown of the tree.
Conks vary in size and shape. Consequently, they are hard to spot, particularly when they occur on the upper trunk. Conks of certain fungi, notably Echinodontium tinctorium and Fomes pini, frequently appear as small hoof-like or shell-like forms on the underside of dead branch stubs on the middle and/or lower trunk of the infected tree.
Moss-covered branch stubs and burls often resemble conks, particularly when viewed from directly below; thus, it is sound practice to view the tree from the side before taking a decision. Remember that conks may appear anywhere on the trunk of an affected tree. Therefore, look for conks on the upper as well as on the lower trunk.
Blind Conks Blind conks (swollen knots) of Fomes pini are as significant indicators of decay as are conks. Blind conks appear typically as pronounced swellings around knots and are quite different from a normal healed-over sound knot. The swelling results from the tree attempting to heal over an abortive conk or the point from which an old conk has dropped. The swelling is often accentuated by the growing conk which actually pushes out the thick, dead, outer bark of the tree. Often the affected knot is partially covered by sound wood, which is implied by the term "blind" conk. A cut with an axe into a blind conk will reveal the bright yellow or buff colour of the conk (see Figure 1).
90 November 2007
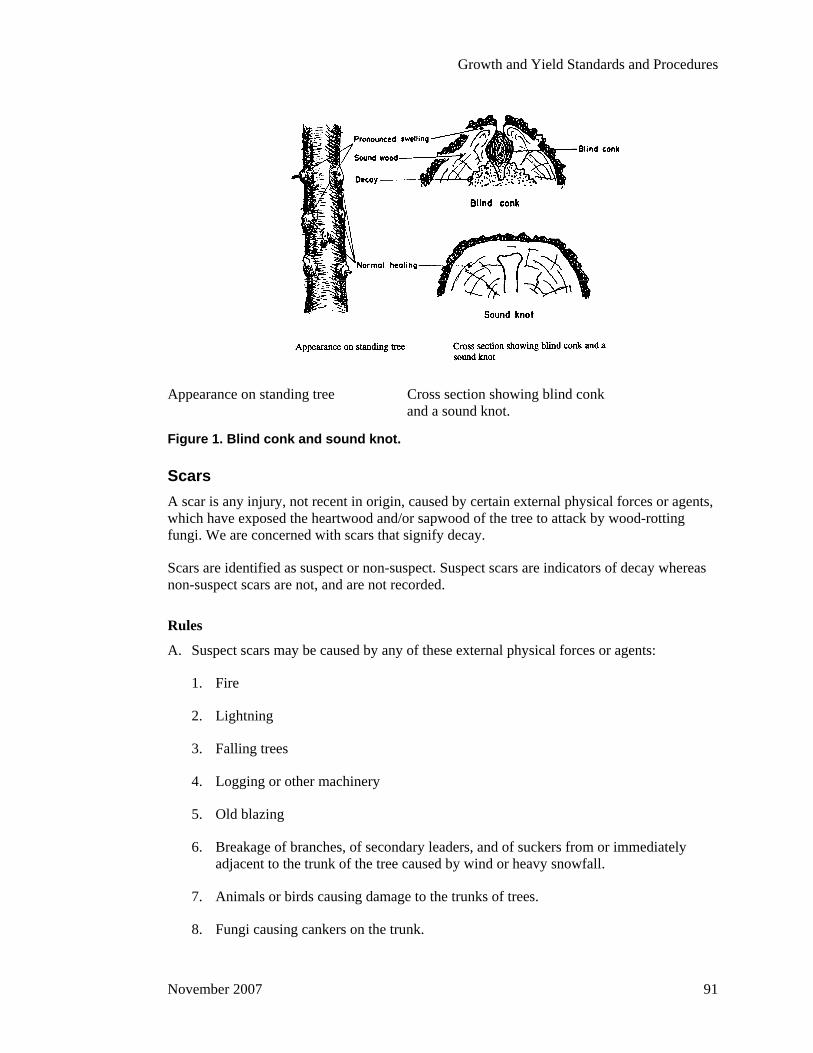
Growth and Yield Standards and Procedures
Appearance on standing tree Cross section showing blind conk and a sound knot.
Figure 1. Blind conk and sound knot.
Scars A scar is any injury, not recent in origin, caused by certain external physical forces or agents, which have exposed the heartwood and/or sapwood of the tree to attack by wood-rotting fungi. We are concerned with scars that signify decay.
Scars are identified as suspect or non-suspect. Suspect scars are indicators of decay whereas non-suspect scars are not, and are not recorded.
Rules
A. Suspect scars may be caused by any of these external physical forces or agents:
1. Fire
2. Lightning
3. Falling trees
4. Logging or other machinery
5. Old blazing
6. Breakage of branches, of secondary leaders, and of suckers from or immediately adjacent to the trunk of the tree caused by wind or heavy snowfall.
7. Animals or birds causing damage to the trunks of trees.
8. Fungi causing cankers on the trunk.
November 2007 91
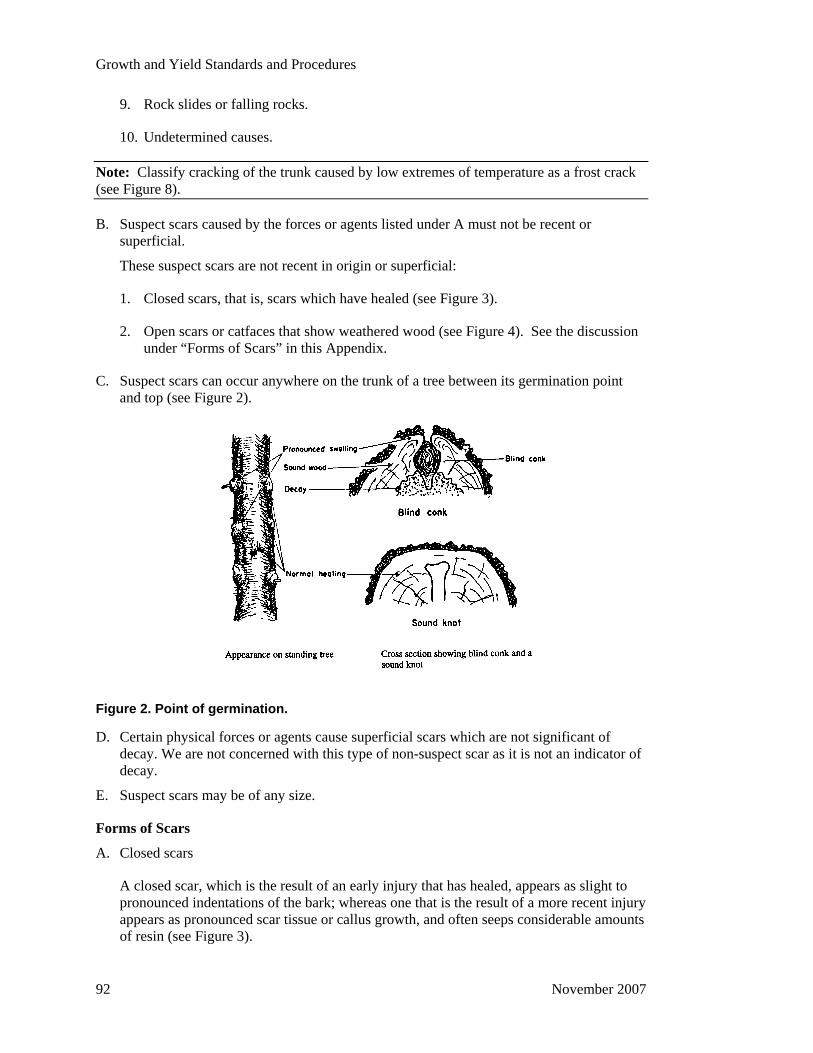
Growth and Yield Standards and Procedures
9. Rock slides or falling rocks.
10. Undetermined causes.
Note: Classify cracking of the trunk caused by low extremes of temperature as a frost crack (see Figure 8).
B. Suspect scars caused by the forces or agents listed under A must not be recent or superficial.
These suspect scars are not recent in origin or superficial:
1. Closed scars, that is, scars which have healed (see Figure 3).
2. Open scars or catfaces that show weathered wood (see Figure 4). See the discussion under “Forms of Scars” in this Appendix.
C. Suspect scars can occur anywhere on the trunk of a tree between its germination point and top (see Figure 2).
Figure 2. Point of germination.
D. Certain physical forces or agents cause superficial scars which are not significant of decay. We are not concerned with this type of non-suspect scar as it is not an indicator of decay.
E. Suspect scars may be of any size.
Forms of Scars
A. Closed scars
A closed scar, which is the result of an early injury that has healed, appears as slight to pronounced indentations of the bark; whereas one that is the result of a more recent injury appears as pronounced scar tissue or callus growth, and often seeps considerable amounts of resin (see Figure 3).
92 November 2007
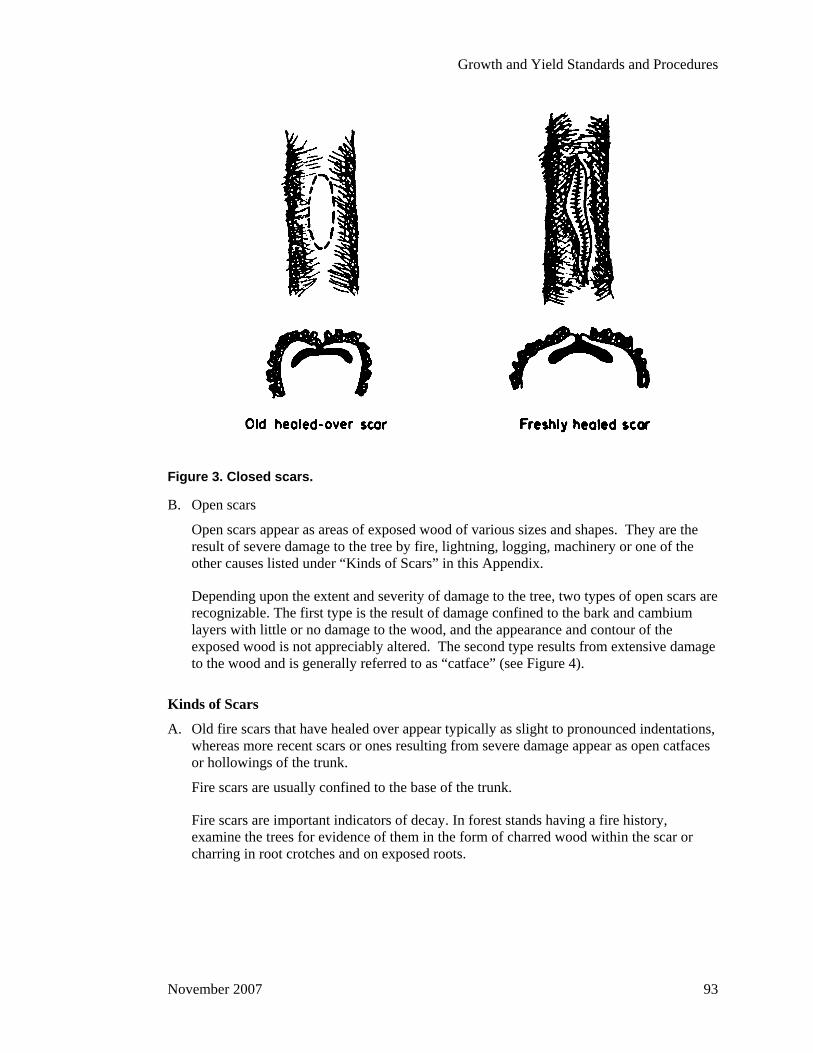
Growth and Yield Standards and Procedures
Figure 3. Closed scars.
B. Open scars
Open scars appear as areas of exposed wood of various sizes and shapes. They are the result of severe damage to the tree by fire, lightning, logging, machinery or one of the other causes listed under “Kinds of Scars” in this Appendix.
Depending upon the extent and severity of damage to the tree, two types of open scars are recognizable. The first type is the result of damage confined to the bark and cambium layers with little or no damage to the wood, and the appearance and contour of the exposed wood is not appreciably altered. The second type results from extensive damage to the wood and is generally referred to as “catface” (see Figure 4).
Kinds of Scars
A. Old fire scars that have healed over appear typically as slight to pronounced indentations, whereas more recent scars or ones resulting from severe damage appear as open catfaces or hollowings of the trunk.
Fire scars are usually confined to the base of the trunk.
Fire scars are important indicators of decay. In forest stands having a fire history, examine the trees for evidence of them in the form of charred wood within the scar or charring in root crotches and on exposed roots.
November 2007 93
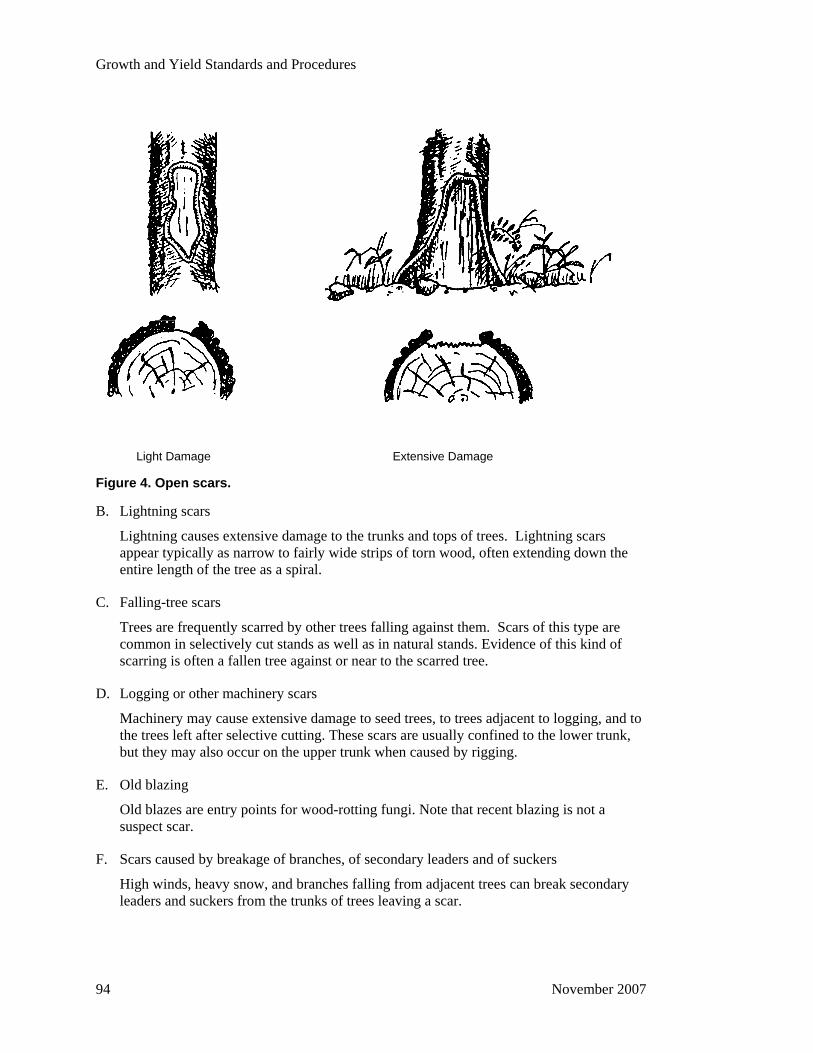
Growth and Yield Standards and Procedures
Light Damage Extensive Damage
Figure 4. Open scars.
B. Lightning scars
Lightning causes extensive damage to the trunks and tops of trees. Lightning scars appear typically as narrow to fairly wide strips of torn wood, often extending down the entire length of the tree as a spiral.
C. Falling-tree scars
Trees are frequently scarred by other trees falling against them. Scars of this type are common in selectively cut stands as well as in natural stands. Evidence of this kind of scarring is often a fallen tree against or near to the scarred tree.
D. Logging or other machinery scars
Machinery may cause extensive damage to seed trees, to trees adjacent to logging, and to the trees left after selective cutting. These scars are usually confined to the lower trunk, but they may also occur on the upper trunk when caused by rigging.
E. Old blazing
Old blazes are entry points for wood-rotting fungi. Note that recent blazing is not a suspect scar.
F. Scars caused by breakage of branches, of secondary leaders and of suckers
High winds, heavy snow, and branches falling from adjacent trees can break secondary leaders and suckers from the trunks of trees leaving a scar.
94 November 2007
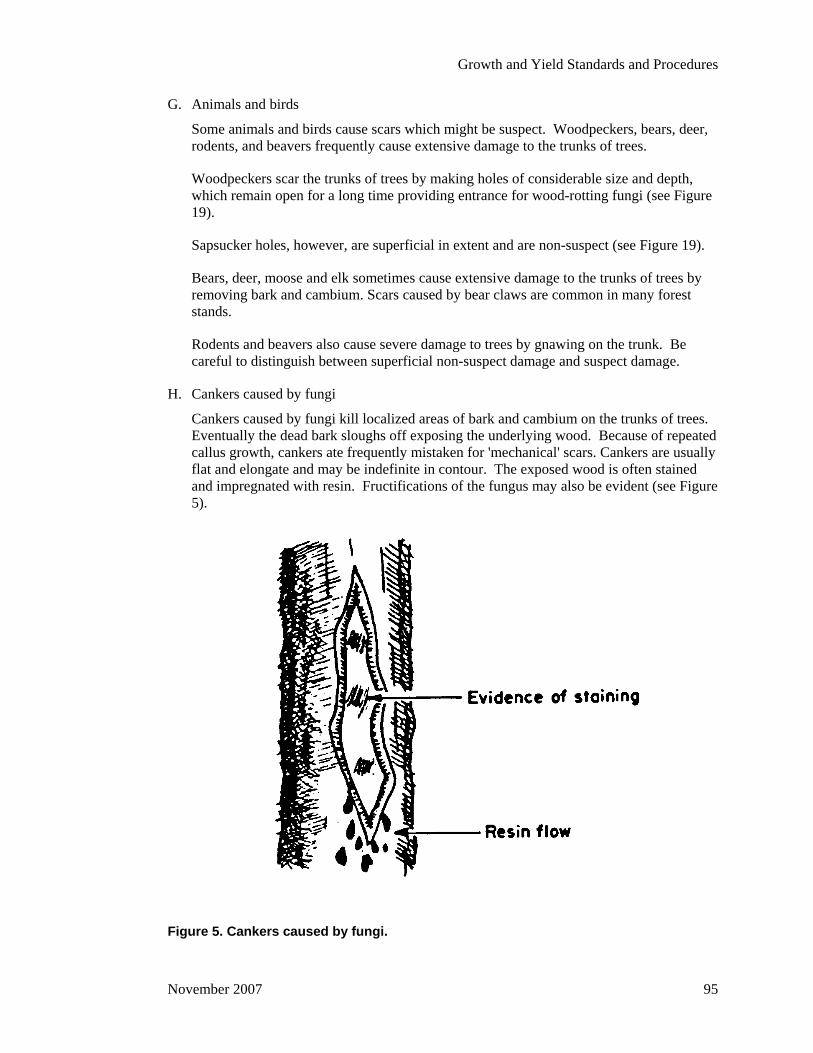
Growth and Yield Standards and Procedures
G. Animals and birds
Some animals and birds cause scars which might be suspect. Woodpeckers, bears, deer, rodents, and beavers frequently cause extensive damage to the trunks of trees.
Woodpeckers scar the trunks of trees by making holes of considerable size and depth, which remain open for a long time providing entrance for wood-rotting fungi (see Figure 19).
Sapsucker holes, however, are superficial in extent and are non-suspect (see Figure 19).
Bears, deer, moose and elk sometimes cause extensive damage to the trunks of trees by removing bark and cambium. Scars caused by bear claws are common in many forest stands.
Rodents and beavers also cause severe damage to trees by gnawing on the trunk. Be careful to distinguish between superficial non-suspect damage and suspect damage.
H. Cankers caused by fungi
Cankers caused by fungi kill localized areas of bark and cambium on the trunks of trees. Eventually the dead bark sloughs off exposing the underlying wood. Because of repeated callus growth, cankers ate frequently mistaken for 'mechanical' scars. Cankers are usually flat and elongate and may be indefinite in contour. The exposed wood is often stained and impregnated with resin. Fructifications of the fungus may also be evident (see Figure 5).
Figure 5. Cankers caused by fungi.
November 2007 95
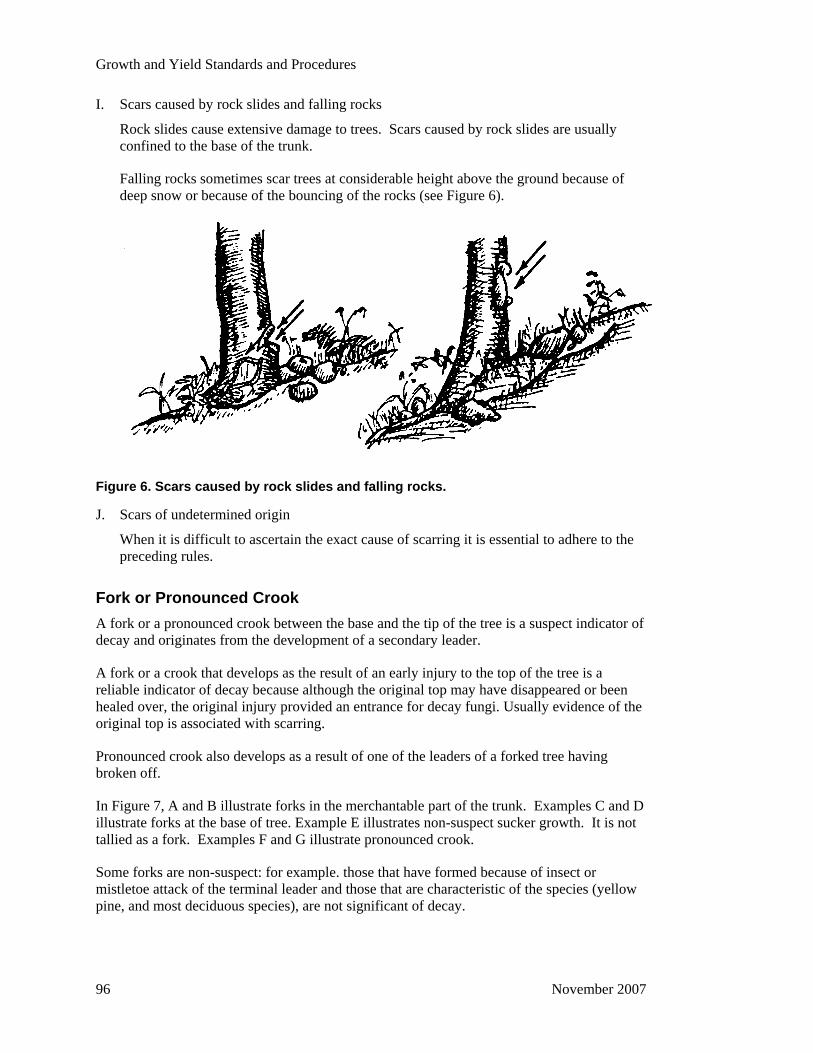
Growth and Yield Standards and Procedures
I. Scars caused by rock slides and falling rocks
Rock slides cause extensive damage to trees. Scars caused by rock slides are usually confined to the base of the trunk.
Falling rocks sometimes scar trees at considerable height above the ground because of deep snow or because of the bouncing of the rocks (see Figure 6).
Figure 6. Scars caused by rock slides and falling rocks.
J. Scars of undetermined origin
When it is difficult to ascertain the exact cause of scarring it is essential to adhere to the preceding rules.
Fork or Pronounced Crook A fork or a pronounced crook between the base and the tip of the tree is a suspect indicator of decay and originates from the development of a secondary leader.
A fork or a crook that develops as the result of an early injury to the top of the tree is a reliable indicator of decay because although the original top may have disappeared or been healed over, the original injury provided an entrance for decay fungi. Usually evidence of the original top is associated with scarring.
Pronounced crook also develops as a result of one of the leaders of a forked tree having broken off.
In Figure 7, A and B illustrate forks in the merchantable part of the trunk. Examples C and D illustrate forks at the base of tree. Example E illustrates non-suspect sucker growth. It is not tallied as a fork. Examples F and G illustrate pronounced crook.
Some forks are non-suspect: for example. those that have formed because of insect or mistletoe attack of the terminal leader and those that are characteristic of the species (yellow pine, and most deciduous species), are not significant of decay.
96 November 2007
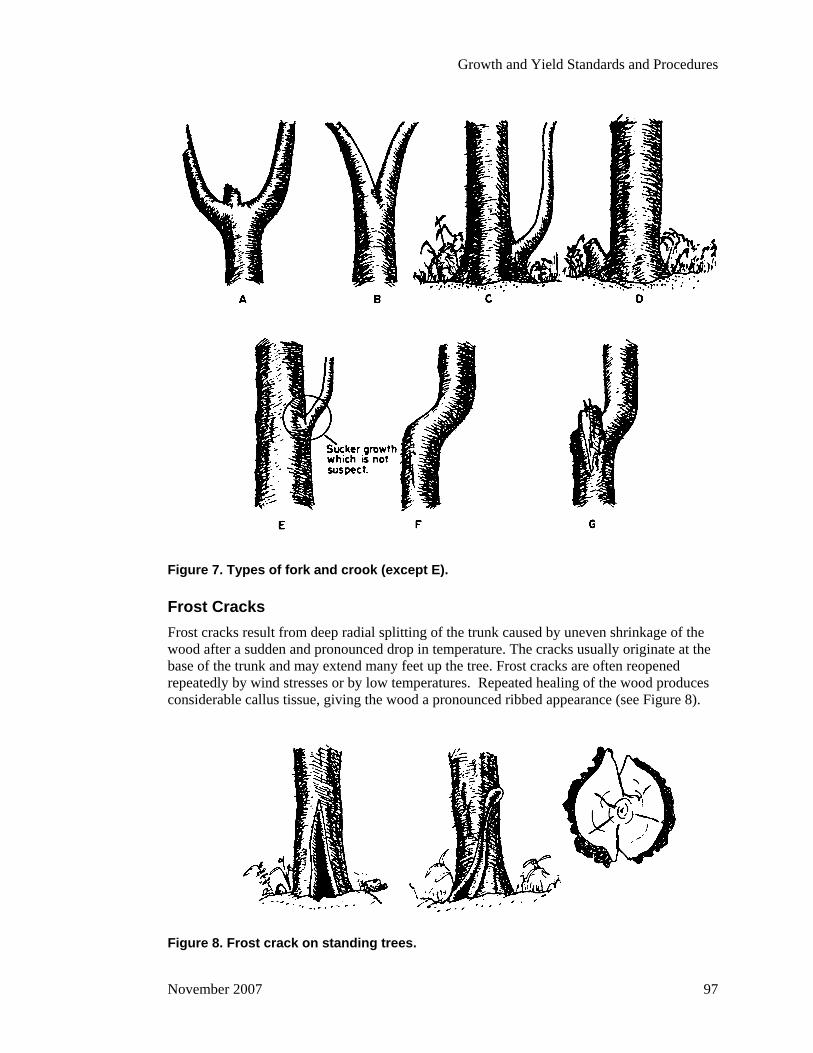
Growth and Yield Standards and Procedures
Figure 7. Types of fork and crook (except E).
Frost Cracks Frost cracks result from deep radial splitting of the trunk caused by uneven shrinkage of the wood after a sudden and pronounced drop in temperature. The cracks usually originate at the base of the trunk and may extend many feet up the tree. Frost cracks are often reopened repeatedly by wind stresses or by low temperatures. Repeated healing of the wood produces considerable callus tissue, giving the wood a pronounced ribbed appearance (see Figure 8).
Figure 8. Frost crack on standing trees.
November 2007 97
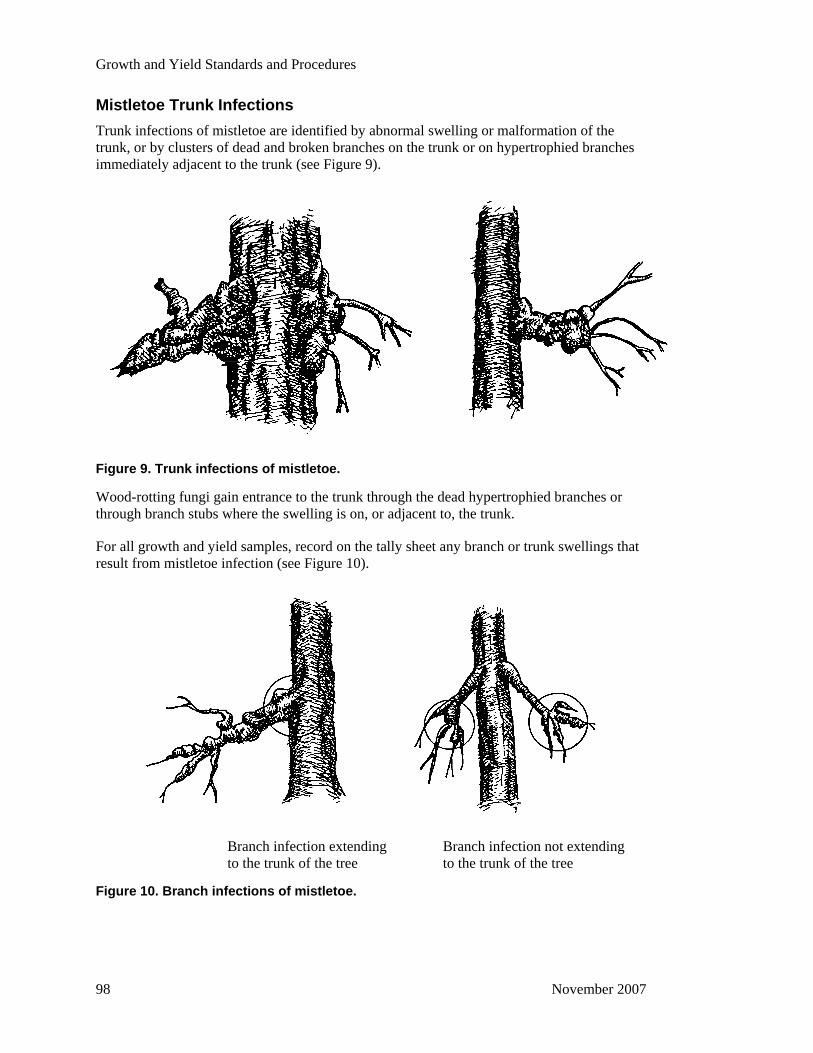
Growth and Yield Standards and Procedures
Mistletoe Trunk Infections Trunk infections of mistletoe are identified by abnormal swelling or malformation of the trunk, or by clusters of dead and broken branches on the trunk or on hypertrophied branches immediately adjacent to the trunk (see Figure 9).
Figure 9. Trunk infections of mistletoe.
Wood-rotting fungi gain entrance to the trunk through the dead hypertrophied branches or through branch stubs where the swelling is on, or adjacent to, the trunk.
For all growth and yield samples, record on the tally sheet any branch or trunk swellings that result from mistletoe infection (see Figure 10).
Branch infection extending Branch infection not extending to the trunk of the tree to the trunk of the tree
Figure 10. Branch infections of mistletoe.
98 November 2007
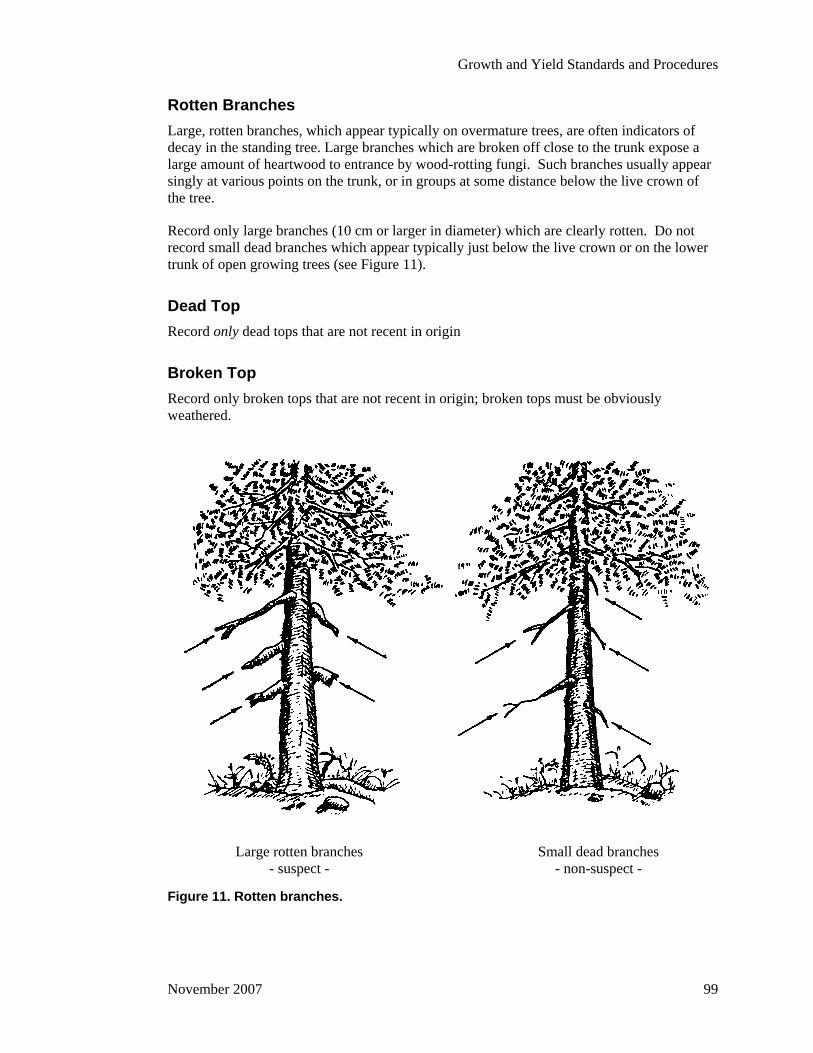
Growth and Yield Standards and Procedures
Rotten Branches Large, rotten branches, which appear typically on overmature trees, are often indicators of decay in the standing tree. Large branches which are broken off close to the trunk expose a large amount of heartwood to entrance by wood-rotting fungi. Such branches usually appear singly at various points on the trunk, or in groups at some distance below the live crown of the tree.
Record only large branches (10 cm or larger in diameter) which are clearly rotten. Do not record small dead branches which appear typically just below the live crown or on the lower trunk of open growing trees (see Figure 11).
Dead Top Record only dead tops that are not recent in origin
Broken Top Record only broken tops that are not recent in origin; broken tops must be obviously weathered.
Large rotten branches Small dead branches - suspect - - non-suspect -
Figure 11. Rotten branches.
November 2007 99
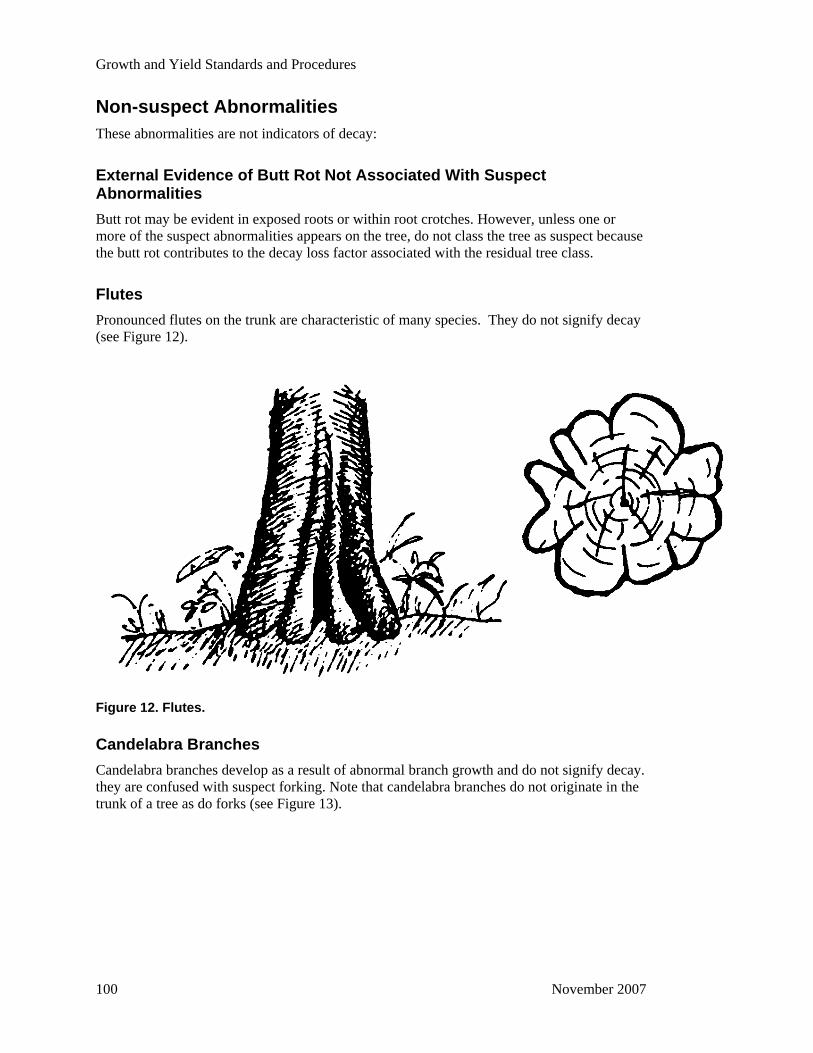
Growth and Yield Standards and Procedures
Non-suspect Abnormalities These abnormalities are not indicators of decay:
External Evidence of Butt Rot Not Associated With Suspect Abnormalities Butt rot may be evident in exposed roots or within root crotches. However, unless one or more of the suspect abnormalities appears on the tree, do not class the tree as suspect because the butt rot contributes to the decay loss factor associated with the residual tree class.
Flutes Pronounced flutes on the trunk are characteristic of many species. They do not signify decay (see Figure 12).
Figure 12. Flutes.
Candelabra Branches Candelabra branches develop as a result of abnormal branch growth and do not signify decay. they are confused with suspect forking. Note that candelabra branches do not originate in the trunk of a tree as do forks (see Figure 13).
100 November 2007
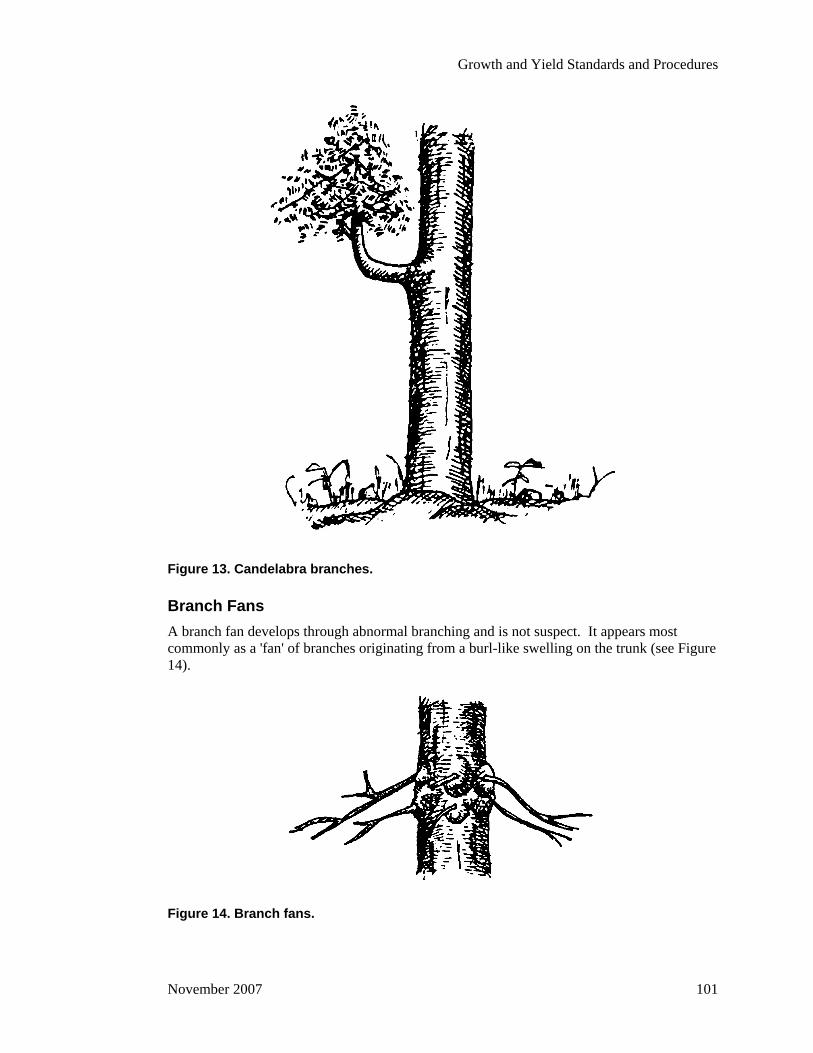
Growth and Yield Standards and Procedures
Figure 13. Candelabra branches.
Branch Fans A branch fan develops through abnormal branching and is not suspect. It appears most commonly as a 'fan' of branches originating from a burl-like swelling on the trunk (see Figure 14).
Figure 14. Branch fans.
November 2007 101
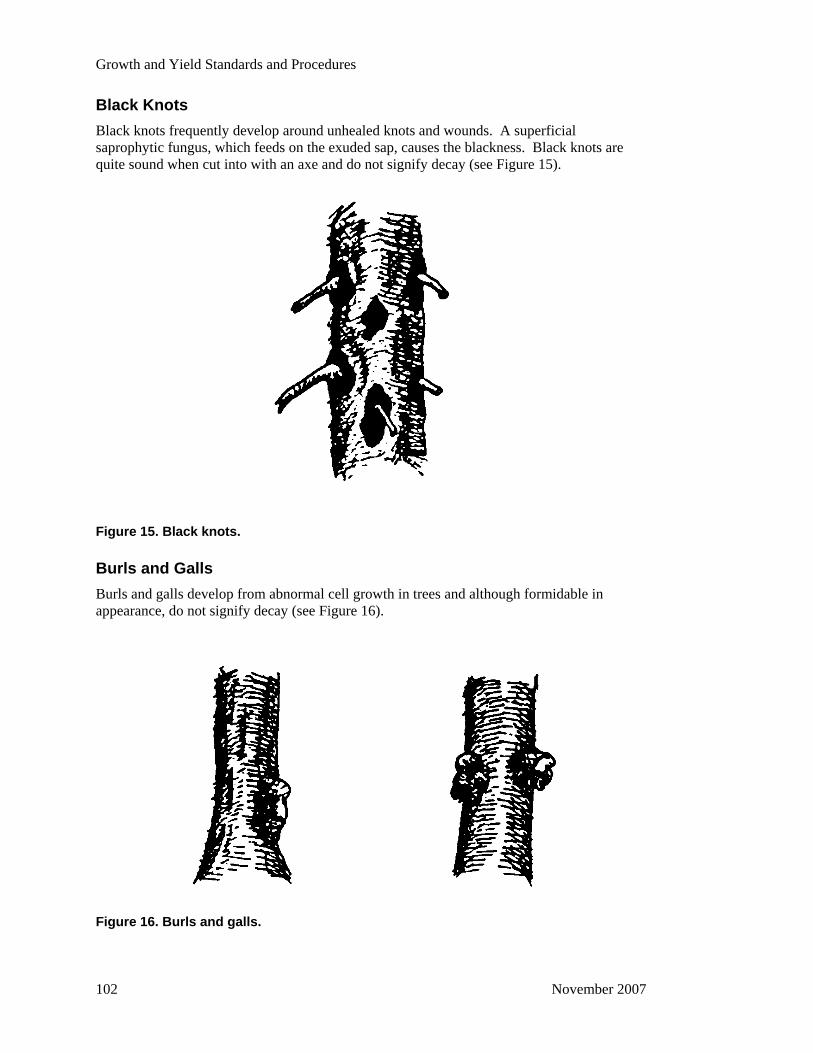
Growth and Yield Standards and Procedures
Black Knots Black knots frequently develop around unhealed knots and wounds. A superficial saprophytic fungus, which feeds on the exuded sap, causes the blackness. Black knots are quite sound when cut into with an axe and do not signify decay (see Figure 15).
Figure 15. Black knots.
Burls and Galls Burls and galls develop from abnormal cell growth in trees and although formidable in appearance, do not signify decay (see Figure 16).
Figure 16. Burls and galls.
102 November 2007

Growth and Yield Standards and Procedures
Sweep Sweep which develops as a slight curvature or distortion of the trunk is not significant of decay and is non-suspect (see Figure 17).
Figure 17. Sweep.
Exposed Roots Exposed roots and buttress roots do not signify decay unless scarring is present above the point of germination (see Figure 19).
Spiral Grain Spiral grain is a growth characteristic of some trees and does not signify decay.
Dry Side Dry side results from the death of the cambium through bruising by other trees or by other physiological causes. Dry side appears as a narrow to wide strip or as a small localized area on the side of a tree. The bark often remains intact over the dead areas. Although dry side may be responsible for the complete rejection, or degrade of a pole tree, it does not signify the presence of decay.
November 2007 103
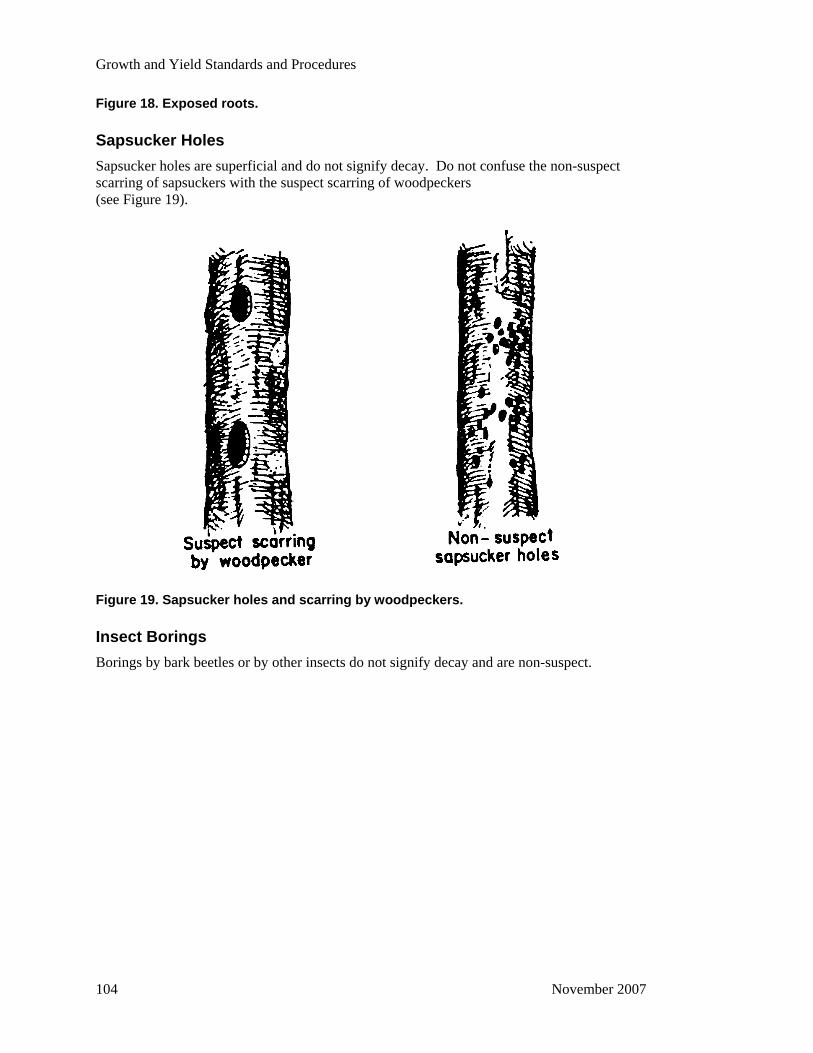
Growth and Yield Standards and Procedures
Figure 18. Exposed roots.
Sapsucker Holes Sapsucker holes are superficial and do not signify decay. Do not confuse the non-suspect scarring of sapsuckers with the suspect scarring of woodpeckers (see Figure 19).
Figure 19. Sapsucker holes and scarring by woodpeckers.
Insect Borings Borings by bark beetles or by other insects do not signify decay and are non-suspect.
104 November 2007
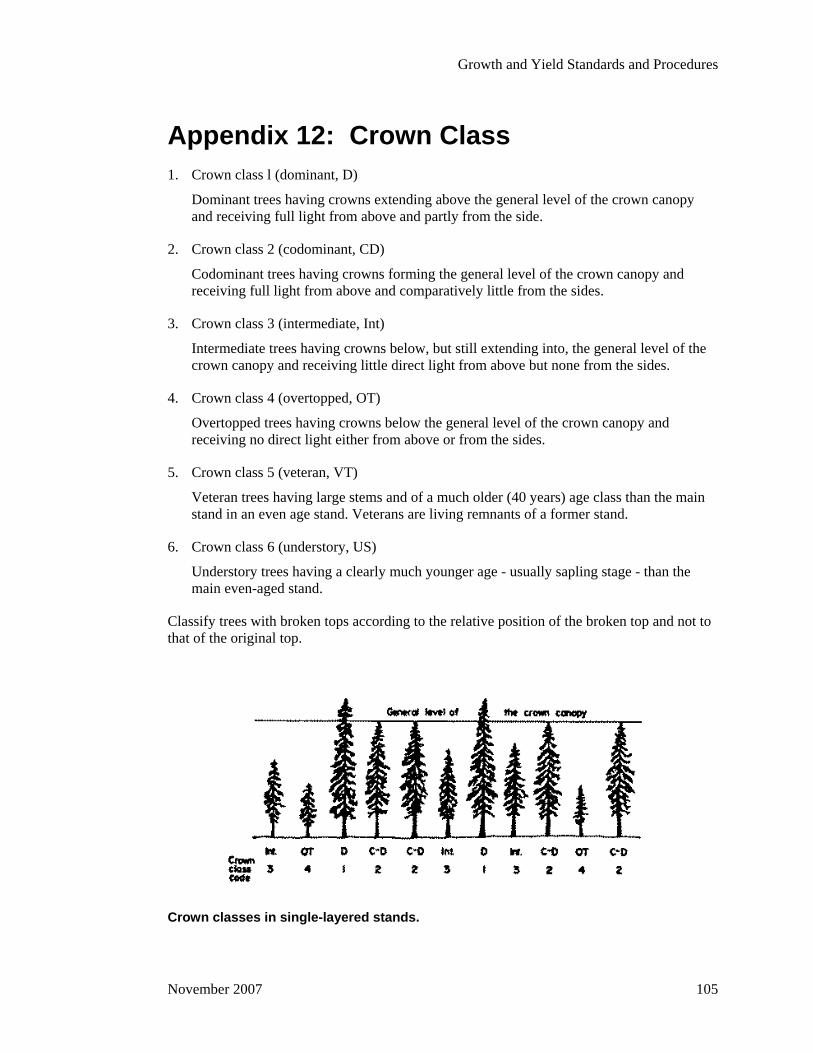
Growth and Yield Standards and Procedures
Appendix 12: Crown Class 1. Crown class l (dominant, D)
Dominant trees having crowns extending above the general level of the crown canopy and receiving full light from above and partly from the side.
2. Crown class 2 (codominant, CD)
Codominant trees having crowns forming the general level of the crown canopy and receiving full light from above and comparatively little from the sides.
3. Crown class 3 (intermediate, Int)
Intermediate trees having crowns below, but still extending into, the general level of the crown canopy and receiving little direct light from above but none from the sides.
4. Crown class 4 (overtopped, OT)
Overtopped trees having crowns below the general level of the crown canopy and receiving no direct light either from above or from the sides.
5. Crown class 5 (veteran, VT)
Veteran trees having large stems and of a much older (40 years) age class than the main stand in an even age stand. Veterans are living remnants of a former stand.
6. Crown class 6 (understory, US)
Understory trees having a clearly much younger age - usually sapling stage - than the main even-aged stand.
Classify trees with broken tops according to the relative position of the broken top and not to that of the original top.
Crown classes in single-layered stands.
November 2007 105
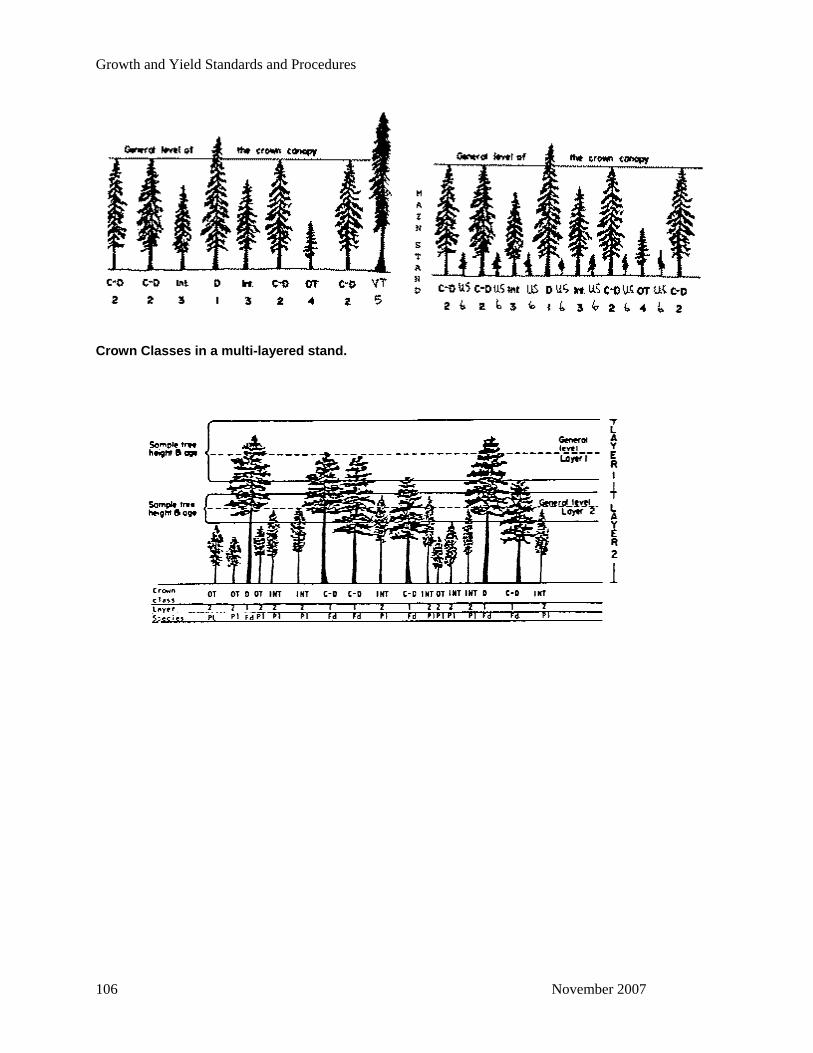
Growth and Yield Standards and Procedures
Crown Classes in a multi-layered stand.
106 November 2007
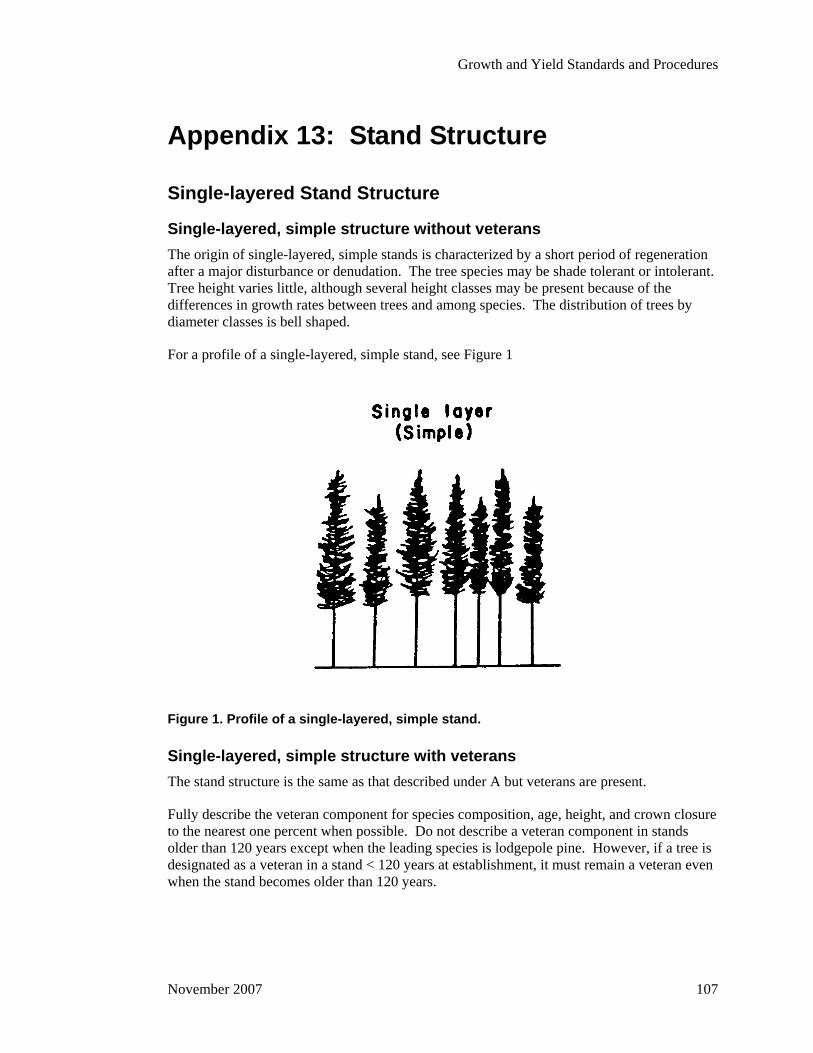
Growth and Yield Standards and Procedures
Appendix 13: Stand Structure
Single-layered Stand Structure
Single-layered, simple structure without veterans The origin of single-layered, simple stands is characterized by a short period of regeneration after a major disturbance or denudation. The tree species may be shade tolerant or intolerant. Tree height varies little, although several height classes may be present because of the differences in growth rates between trees and among species. The distribution of trees by diameter classes is bell shaped.
For a profile of a single-layered, simple stand, see Figure 1
Figure 1. Profile of a single-layered, simple stand.
Single-layered, simple structure with veterans The stand structure is the same as that described under A but veterans are present.
Fully describe the veteran component for species composition, age, height, and crown closure to the nearest one percent when possible. Do not describe a veteran component in stands older than 120 years except when the leading species is lodgepole pine. However, if a tree is designated as a veteran in a stand < 120 years at establishment, it must remain a veteran even when the stand becomes older than 120 years.
November 2007 107
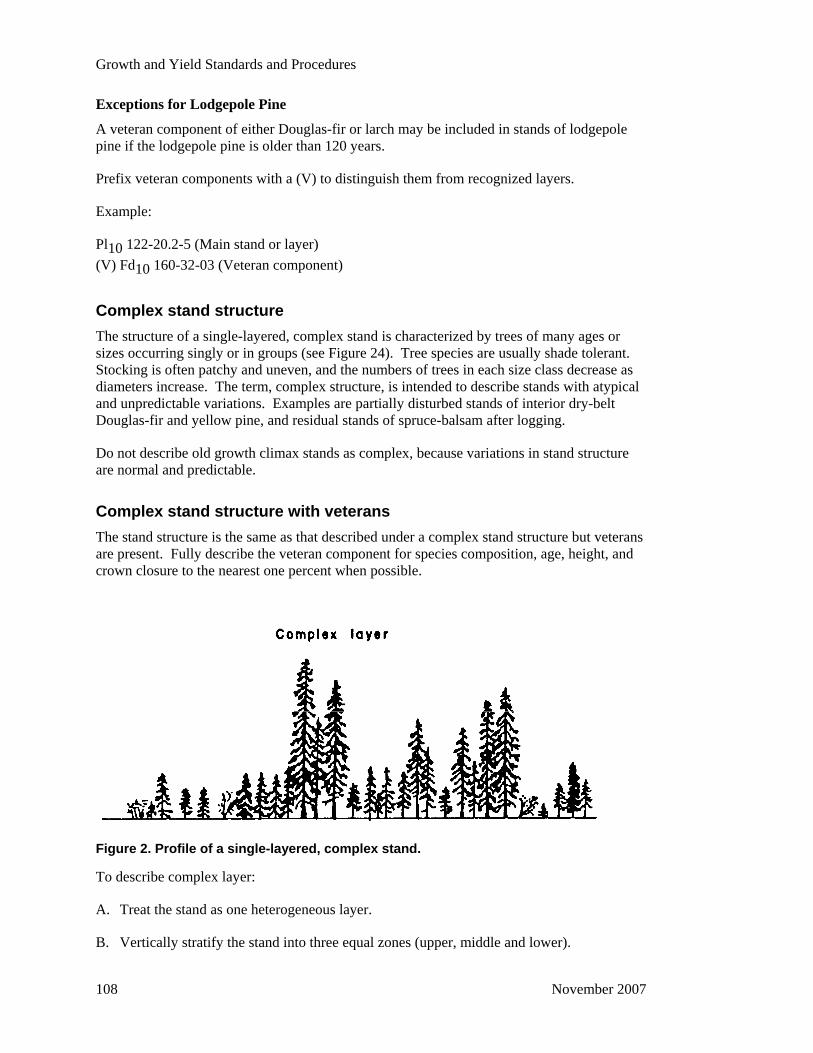
Growth and Yield Standards and Procedures
Exceptions for Lodgepole Pine
A veteran component of either Douglas-fir or larch may be included in stands of lodgepole pine if the lodgepole pine is older than 120 years.
Prefix veteran components with a (V) to distinguish them from recognized layers.
Example:
Pl10 122-20.2-5 (Main stand or layer) (V) Fd10 160-32-03 (Veteran component)
Complex stand structure The structure of a single-layered, complex stand is characterized by trees of many ages or sizes occurring singly or in groups (see Figure 24). Tree species are usually shade tolerant. Stocking is often patchy and uneven, and the numbers of trees in each size class decrease as diameters increase. The term, complex structure, is intended to describe stands with atypical and unpredictable variations. Examples are partially disturbed stands of interior dry-belt Douglas-fir and yellow pine, and residual stands of spruce-balsam after logging.
Do not describe old growth climax stands as complex, because variations in stand structure are normal and predictable.
Complex stand structure with veterans The stand structure is the same as that described under a complex stand structure but veterans are present. Fully describe the veteran component for species composition, age, height, and crown closure to the nearest one percent when possible.
Figure 2. Profile of a single-layered, complex stand.
To describe complex layer:
A. Treat the stand as one heterogeneous layer.
B. Vertically stratify the stand into three equal zones (upper, middle and lower).
108 November 2007
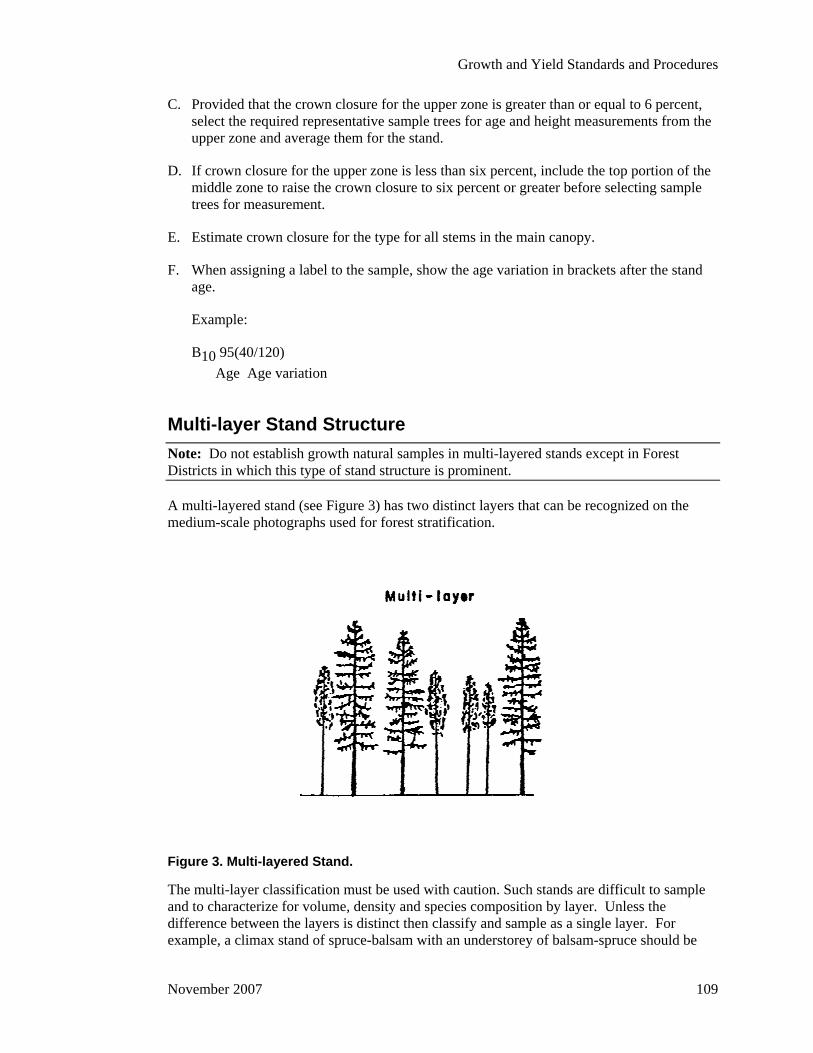
Growth and Yield Standards and Procedures
C. Provided that the crown closure for the upper zone is greater than or equal to 6 percent, select the required representative sample trees for age and height measurements from the upper zone and average them for the stand.
D. If crown closure for the upper zone is less than six percent, include the top portion of the middle zone to raise the crown closure to six percent or greater before selecting sample trees for measurement.
E. Estimate crown closure for the type for all stems in the main canopy.
F. When assigning a label to the sample, show the age variation in brackets after the stand age.
Example:
B10 95(40/120) Age Age variation
Multi-layer Stand Structure Note: Do not establish growth natural samples in multi-layered stands except in Forest Districts in which this type of stand structure is prominent.
A multi-layered stand (see Figure 3) has two distinct layers that can be recognized on the medium-scale photographs used for forest stratification.
Figure 3. Multi-layered Stand.
The multi-layer classification must be used with caution. Such stands are difficult to sample and to characterize for volume, density and species composition by layer. Unless the difference between the layers is distinct then classify and sample as a single layer. For example, a climax stand of spruce-balsam with an understorey of balsam-spruce should be
November 2007 109
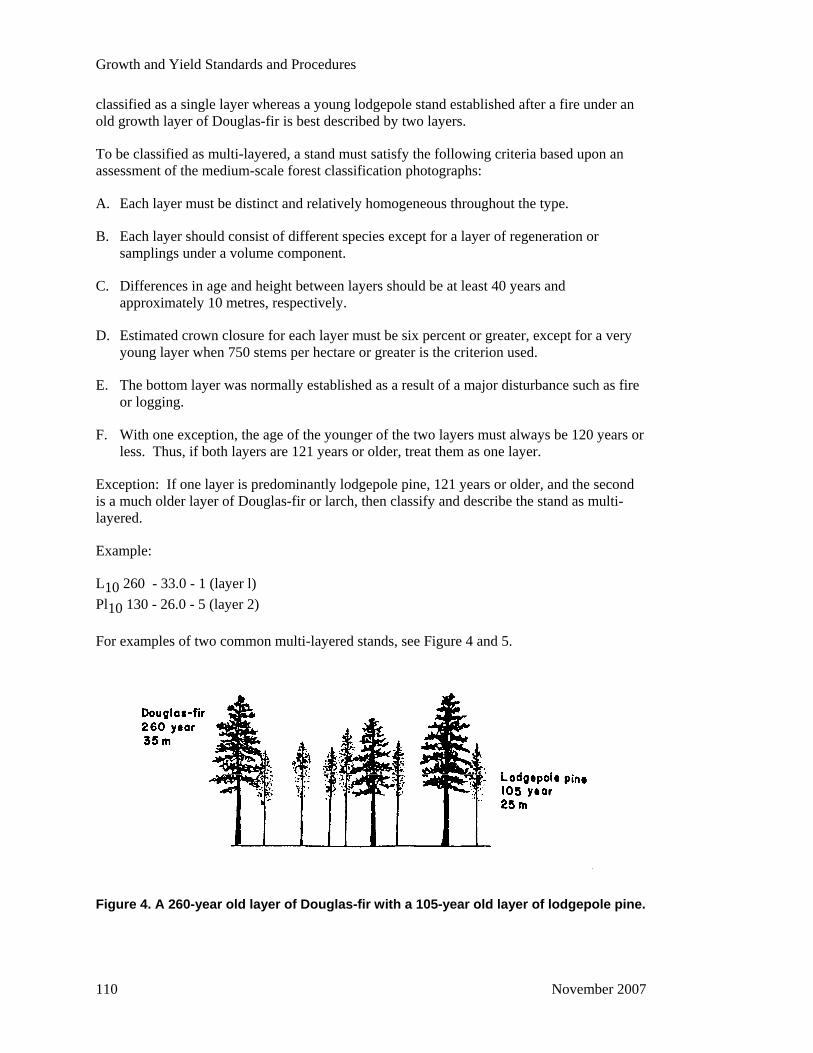
Growth and Yield Standards and Procedures
classified as a single layer whereas a young lodgepole stand established after a fire under an old growth layer of Douglas-fir is best described by two layers.
To be classified as multi-layered, a stand must satisfy the following criteria based upon an assessment of the medium-scale forest classification photographs:
A. Each layer must be distinct and relatively homogeneous throughout the type.
B. Each layer should consist of different species except for a layer of regeneration or samplings under a volume component.
C. Differences in age and height between layers should be at least 40 years and approximately 10 metres, respectively.
D. Estimated crown closure for each layer must be six percent or greater, except for a very young layer when 750 stems per hectare or greater is the criterion used.
E. The bottom layer was normally established as a result of a major disturbance such as fire or logging.
F. With one exception, the age of the younger of the two layers must always be 120 years or less. Thus, if both layers are 121 years or older, treat them as one layer.
Exception: If one layer is predominantly lodgepole pine, 121 years or older, and the second is a much older layer of Douglas-fir or larch, then classify and describe the stand as multi-layered.
Example:
L10 260 - 33.0 - 1 (layer l) Pl10 130 - 26.0 - 5 (layer 2)
For examples of two common multi-layered stands, see Figure 4 and 5.
Figure 4. A 260-year old layer of Douglas-fir with a 105-year old layer of lodgepole pine.
110 November 2007
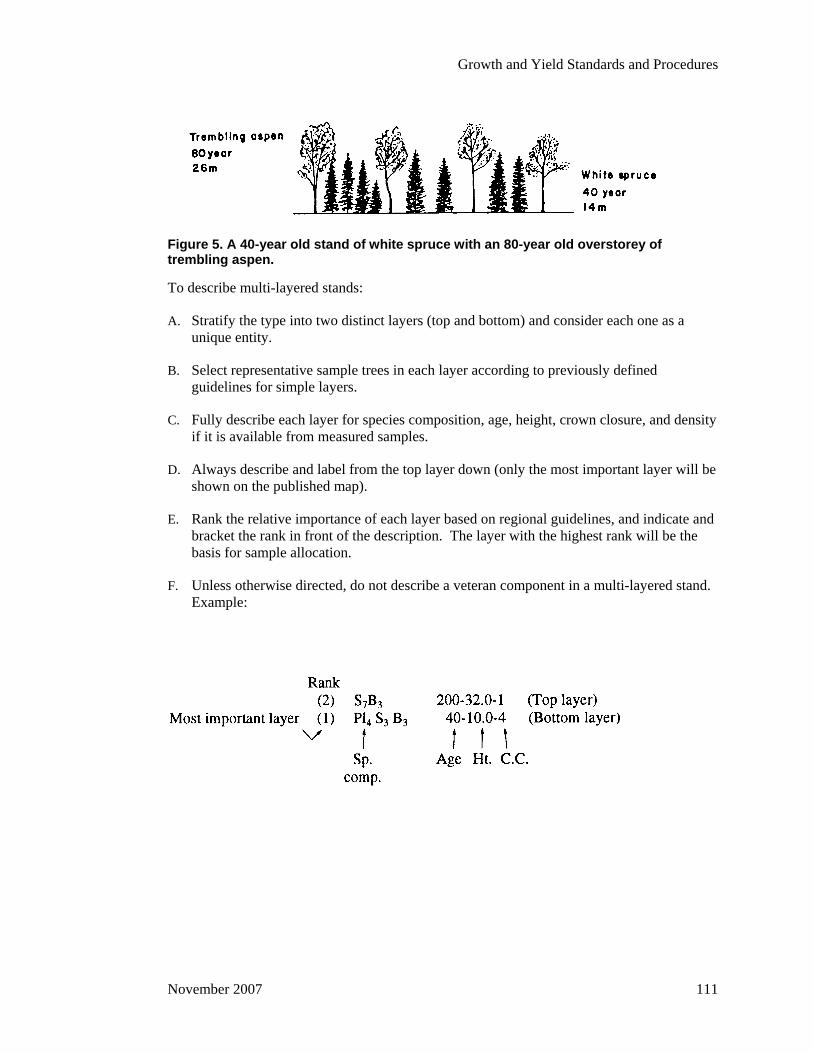
Growth and Yield Standards and Procedures
Figure 5. A 40-year old stand of white spruce with an 80-year old overstorey of trembling aspen.
To describe multi-layered stands:
A. Stratify the type into two distinct layers (top and bottom) and consider each one as a unique entity.
B. Select representative sample trees in each layer according to previously defined guidelines for simple layers.
C. Fully describe each layer for species composition, age, height, crown closure, and density if it is available from measured samples.
D. Always describe and label from the top layer down (only the most important layer will be shown on the published map).
E. Rank the relative importance of each layer based on regional guidelines, and indicate and bracket the rank in front of the description. The layer with the highest rank will be the basis for sample allocation.
F. Unless otherwise directed, do not describe a veteran component in a multi-layered stand. Example:
November 2007 111


Growth and Yield Standards and Procedures
Appendix 14: Damage Agents and Severity Codes
I. Damage Agents
Acceptable Codes Description Scientific Name
A Animal Damage AB Bear AC Cattle AD Deer AE Elk AH Hare or rabbit AM Moose AP Porcupine AS Squirrel AV Vole AX Birds AZ Beaver C Cone and Seed Insects CAH Cone resin midge (Asynapta hopkinsi) CBC Fd cone moth (Barbara colfaxiana) CBX Fir cone moth (Barbara sp.) CCP (Camptomyia pseudotsugae) CDC Sx cone gall midge (Dasineura canadensis) CDD Fir seed midge (Dasineura abiesemia) CDR Sx cone axis midge (Dasineura rachiphaga) CDX Dasineura midges (Dasineura spp.) CEA Fir cone maggot (Earomyia abietum) CEB (Earomyia babara) CEQ (Earomyia aquilonia) CEX Earomyia maggots (Earomyia spp.) CFP Fd cone beetle (Emobius Punctulatus) CHX Budworms (Choristoneura spp.) CIA Fir coneworm (Dioryctria abietivorella) CIP Fd coneworm (Dioryctria psuedotsugella) CIR Sx coneworm (Dioryctria reniculelloides) CIS Pine coneworm (Dioryctria rossi) CIV Py coneworm (Dioryctria auranticella) CIX Coneworms (Dioryctria spp.) CLO Western conifer seed bug (Leptogiossus occidentalis) CMA Py seed chalcid (Megastigmus albifrons) CMC Sx seed chalcid (Megastigmus piceae)
November 2007 113
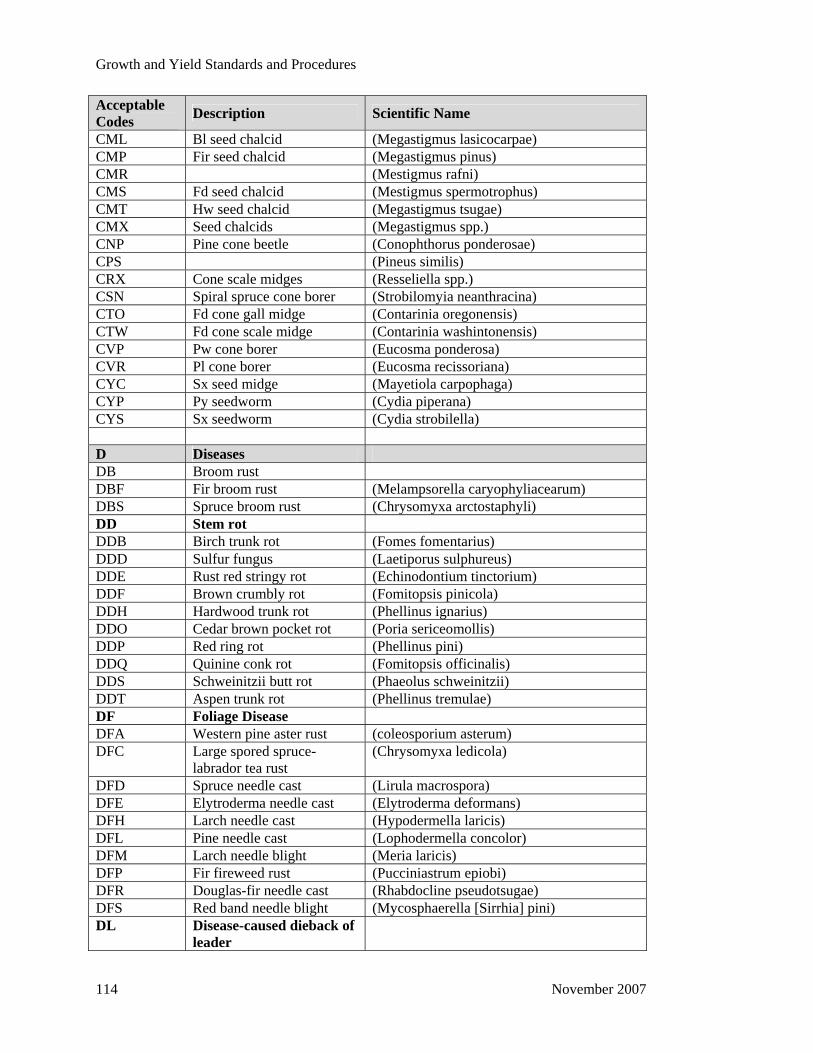
Growth and Yield Standards and Procedures
Acceptable Codes Description Scientific Name
CML Bl seed chalcid (Megastigmus lasicocarpae) CMP Fir seed chalcid (Megastigmus pinus) CMR (Mestigmus rafni) CMS Fd seed chalcid (Mestigmus spermotrophus) CMT Hw seed chalcid (Megastigmus tsugae) CMX Seed chalcids (Megastigmus spp.) CNP Pine cone beetle (Conophthorus ponderosae) CPS (Pineus similis) CRX Cone scale midges (Resseliella spp.) CSN Spiral spruce cone borer (Strobilomyia neanthracina) CTO Fd cone gall midge (Contarinia oregonensis) CTW Fd cone scale midge (Contarinia washintonensis) CVP Pw cone borer (Eucosma ponderosa) CVR Pl cone borer (Eucosma recissoriana) CYC Sx seed midge (Mayetiola carpophaga) CYP Py seedworm (Cydia piperana) CYS Sx seedworm (Cydia strobilella) D Diseases DB Broom rust DBF Fir broom rust (Melampsorella caryophyliacearum) DBS Spruce broom rust (Chrysomyxa arctostaphyli) DD Stem rot DDB Birch trunk rot (Fomes fomentarius) DDD Sulfur fungus (Laetiporus sulphureus) DDE Rust red stringy rot (Echinodontium tinctorium) DDF Brown crumbly rot (Fomitopsis pinicola) DDH Hardwood trunk rot (Phellinus ignarius) DDO Cedar brown pocket rot (Poria sericeomollis) DDP Red ring rot (Phellinus pini) DDQ Quinine conk rot (Fomitopsis officinalis) DDS Schweinitzii butt rot (Phaeolus schweinitzii) DDT Aspen trunk rot (Phellinus tremulae) DF Foliage Disease DFA Western pine aster rust (coleosporium asterum) DFC Large spored spruce-
labrador tea rust (Chrysomyxa ledicola)
DFD Spruce needle cast (Lirula macrospora) DFE Elytroderma needle cast (Elytroderma deformans) DFH Larch needle cast (Hypodermella laricis) DFL Pine needle cast (Lophodermella concolor) DFM Larch needle blight (Meria laricis) DFP Fir fireweed rust (Pucciniastrum epiobi) DFR Douglas-fir needle cast (Rhabdocline pseudotsugae) DFS Red band needle blight (Mycosphaerella [Sirrhia] pini) DL Disease-caused dieback of
leader
114 November 2007

Growth and Yield Standards and Procedures
Acceptable Codes Description Scientific Name
DLD Dermea canker (Dermea pseudotsugae) DLF Red flag disease (Potebniamyces balsamicola) DLP Phomopsis canker ((phomopsis lokoyae) DLS Sydowia (Sclerophoma) tip
dieback (Sclerophoma pithyophila)
DLV Aspen-poplar twig blight (Venturia spp.) DM Dwarf Mistletoe DMF Douglas-fir mistletoe (Arceuthobium douglasii) DMH Hemlock dwarf mistletoe (Arceuthobium tsugense) DML Larch dwarf mistletoe (Arceuthobium laricis) DMP Lodgepole pine dwarf
mistletoe (Arceuthobium americanum)
DR Root Disease DRA Armillaria root disease (Armillaria ostoyae) DRB Black Stain root disease (Leptographium wageneri) DRC Laiminated root rot (cedar
strain) (Phellinus weirii)
DRL Laminated root rot (Inonotus sulphurascens) DRN Annosus root disease (Heterobasidion annosum) DRR Rhizina root disease (Rhizina undulata) DRT Tomentosus root rot (Inonotus tomentosus) DS Stem Diseases (Cankers &
Rusts)
DSA Atropellis canker (Lodgepole pine)
(Atropellis piniphila)
DSB White pine blister rust (Cronartium ribicola) DSC Comandra blister rust (Cronartium comandrae) DSE Sooty bark canker (Encoelia pruinosa) DSG Western gall rust (Endocronartium harknessii) DSH Hypoxylon canker (Hypoxylon mammatum) DSP Cryptosphaeria canker (Cryptosphaeria populina) DSR Ceratocystis canker (Ceratocystis fimbriata) DSS Stalactiform blister rust (Cronartium coleosporioides) DST Target canker (Nectria galligena) DSY Cytospora canker (Cytospora chrysosperma) I Insects IA Aphids or adelgids IAB Balsam woolly adelgid (Adelges piceae) IAC Giant conifer aphid (Cinara spp.) IAG Cooley spruce gall adelgid (Adelges cooleyi) IAL Western larch cone woolly
aphid (Adelges lariciatus)
IAS Green spruce aphid (Elatobium abietinum) IB Bark Beetles IBB Western balsam bark beetle (Dryocetes confusus) IBD Douglas-fir beetle (Dendroctonus pseudotsugae)
November 2007 115
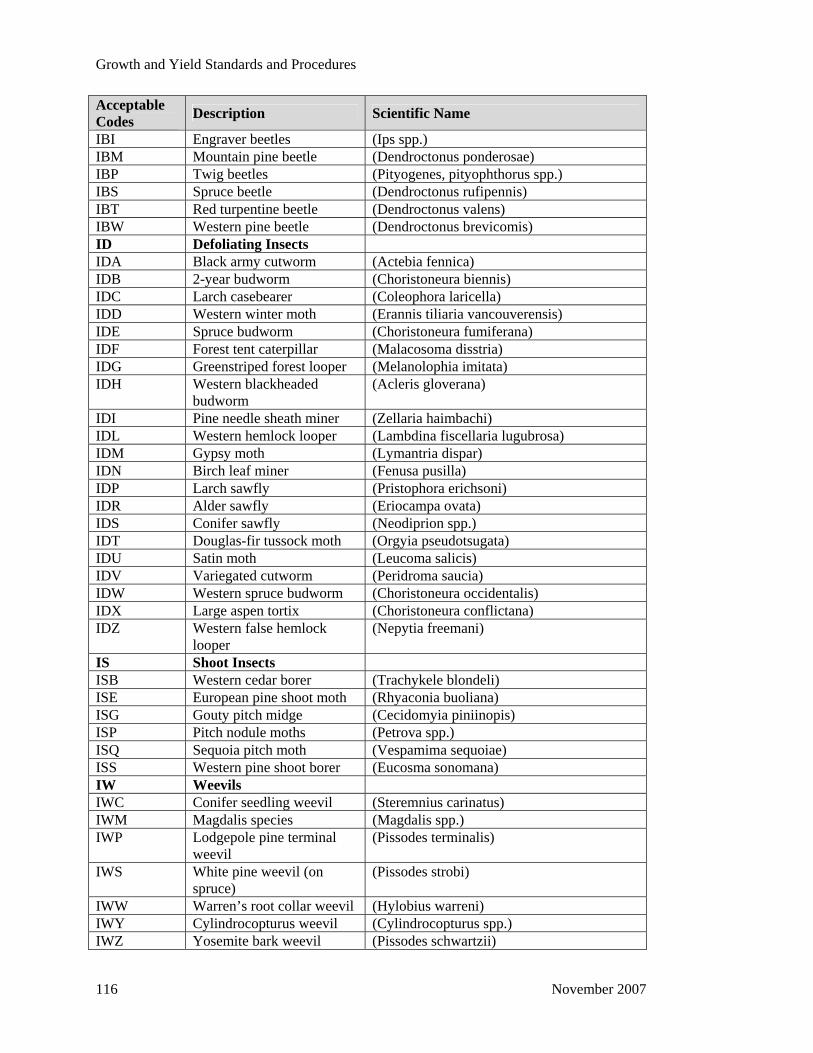
Growth and Yield Standards and Procedures
Acceptable Codes Description Scientific Name
IBI Engraver beetles (Ips spp.) IBM Mountain pine beetle (Dendroctonus ponderosae) IBP Twig beetles (Pityogenes, pityophthorus spp.) IBS Spruce beetle (Dendroctonus rufipennis) IBT Red turpentine beetle (Dendroctonus valens) IBW Western pine beetle (Dendroctonus brevicomis) ID Defoliating Insects IDA Black army cutworm (Actebia fennica) IDB 2-year budworm (Choristoneura biennis) IDC Larch casebearer (Coleophora laricella) IDD Western winter moth (Erannis tiliaria vancouverensis) IDE Spruce budworm (Choristoneura fumiferana) IDF Forest tent caterpillar (Malacosoma disstria) IDG Greenstriped forest looper (Melanolophia imitata) IDH Western blackheaded
budworm (Acleris gloverana)
IDI Pine needle sheath miner (Zellaria haimbachi) IDL Western hemlock looper (Lambdina fiscellaria lugubrosa) IDM Gypsy moth (Lymantria dispar) IDN Birch leaf miner (Fenusa pusilla) IDP Larch sawfly (Pristophora erichsoni) IDR Alder sawfly (Eriocampa ovata) IDS Conifer sawfly (Neodiprion spp.) IDT Douglas-fir tussock moth (Orgyia pseudotsugata) IDU Satin moth (Leucoma salicis) IDV Variegated cutworm (Peridroma saucia) IDW Western spruce budworm (Choristoneura occidentalis) IDX Large aspen tortix (Choristoneura conflictana) IDZ Western false hemlock
looper (Nepytia freemani)
IS Shoot Insects ISB Western cedar borer (Trachykele blondeli) ISE European pine shoot moth (Rhyaconia buoliana) ISG Gouty pitch midge (Cecidomyia piniinopis) ISP Pitch nodule moths (Petrova spp.) ISQ Sequoia pitch moth (Vespamima sequoiae) ISS Western pine shoot borer (Eucosma sonomana) IW Weevils IWC Conifer seedling weevil (Steremnius carinatus) IWM Magdalis species (Magdalis spp.) IWP Lodgepole pine terminal
weevil (Pissodes terminalis)
IWS White pine weevil (on spruce)
(Pissodes strobi)
IWW Warren’s root collar weevil (Hylobius warreni) IWY Cylindrocopturus weevil (Cylindrocopturus spp.) IWZ Yosemite bark weevil (Pissodes schwartzii)
116 November 2007
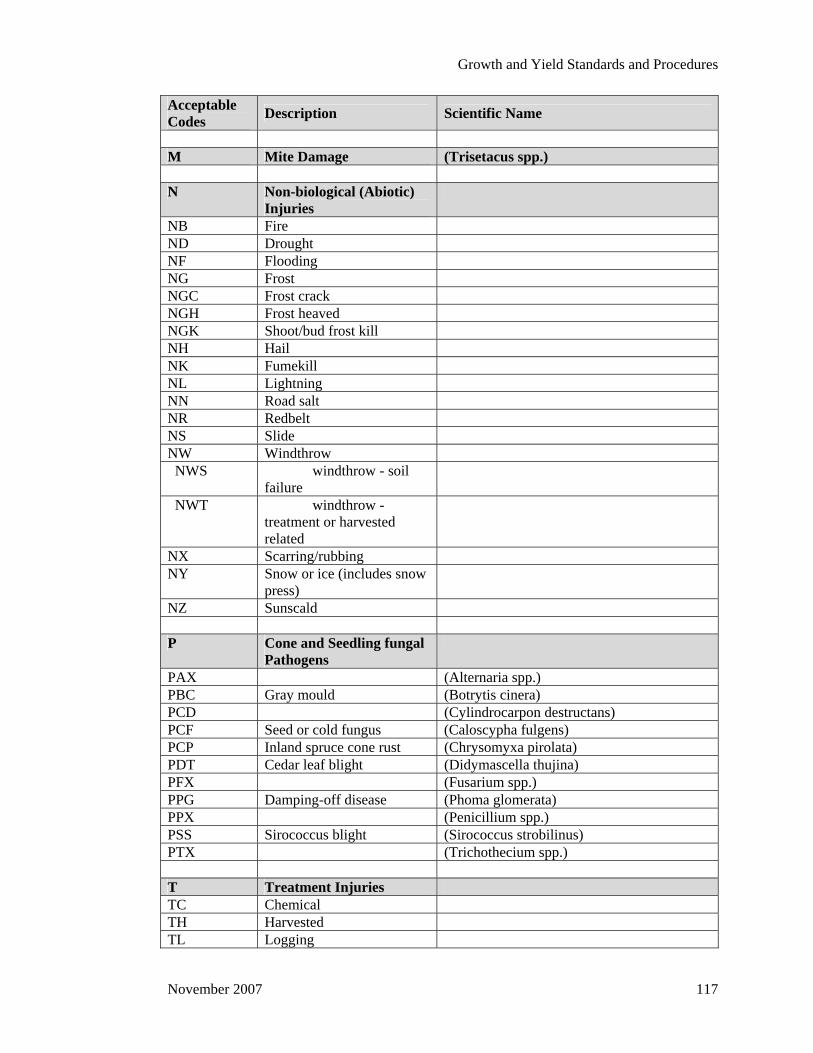
Growth and Yield Standards and Procedures
Acceptable Codes Description Scientific Name
M Mite Damage (Trisetacus spp.) N Non-biological (Abiotic)
Injuries
NB Fire ND Drought NF Flooding NG Frost NGC Frost crack NGH Frost heaved NGK Shoot/bud frost kill NH Hail NK Fumekill NL Lightning NN Road salt NR Redbelt NS Slide NW Windthrow NWS windthrow - soil
failure
NWT windthrow - treatment or harvested related
NX Scarring/rubbing NY Snow or ice (includes snow
press)
NZ Sunscald P Cone and Seedling fungal
Pathogens
PAX (Alternaria spp.) PBC Gray mould (Botrytis cinera) PCD (Cylindrocarpon destructans) PCF Seed or cold fungus (Caloscypha fulgens) PCP Inland spruce cone rust (Chrysomyxa pirolata) PDT Cedar leaf blight (Didymascella thujina) PFX (Fusarium spp.) PPG Damping-off disease (Phoma glomerata) PPX (Penicillium spp.) PSS Sirococcus blight (Sirococcus strobilinus) PTX (Trichothecium spp.) T Treatment Injuries TC Chemical TH Harvested TL Logging
November 2007 117
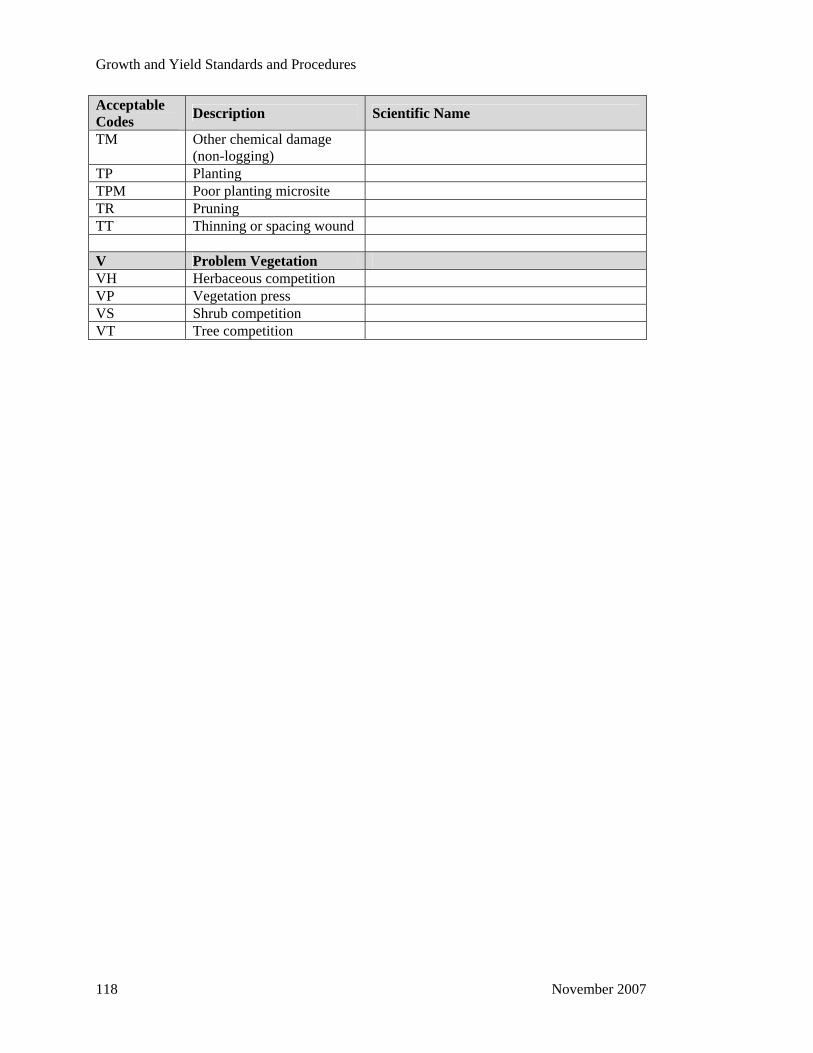
Growth and Yield Standards and Procedures
Acceptable Codes Description Scientific Name
TM Other chemical damage (non-logging)
TP Planting TPM Poor planting microsite TR Pruning TT Thinning or spacing wound V Problem Vegetation VH Herbaceous competition VP Vegetation press VS Shrub competition VT Tree competition
118 November 2007
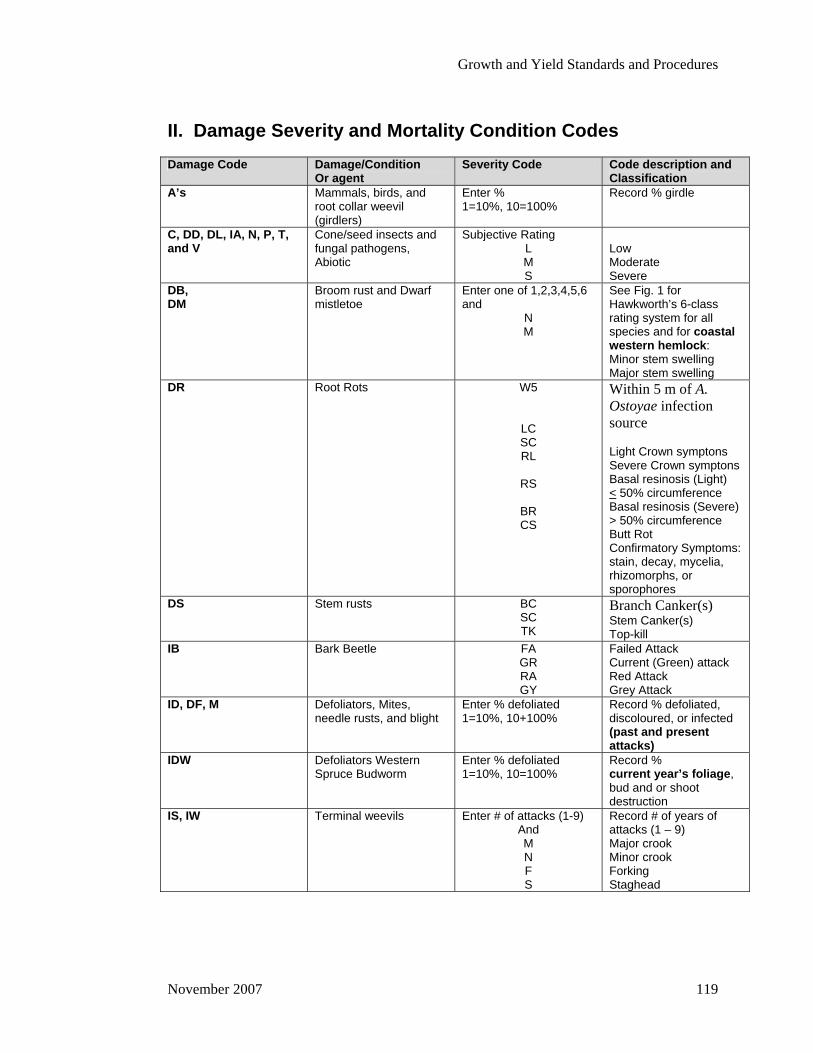
Growth and Yield Standards and Procedures
II. Damage Severity and Mortality Condition Codes
Damage Code Damage/Condition Or agent
Severity Code Code description and Classification
A’s Mammals, birds, and root collar weevil (girdlers)
Enter % 1=10%, 10=100%
Record % girdle
C, DD, DL, IA, N, P, T, and V
Cone/seed insects and fungal pathogens, Abiotic
Subjective Rating L M S
Low Moderate Severe
DB, DM
Broom rust and Dwarf mistletoe
Enter one of 1,2,3,4,5,6 and
N M
See Fig. 1 for Hawkworth’s 6-class rating system for all species and for coastal western hemlock: Minor stem swelling Major stem swelling
DR Root Rots W5
LC SC RL
RS
BR CS
Within 5 m of A. Ostoyae infection source Light Crown symptons Severe Crown symptons Basal resinosis (Light) < 50% circumference Basal resinosis (Severe) > 50% circumference Butt Rot Confirmatory Symptoms: stain, decay, mycelia, rhizomorphs, or sporophores
DS Stem rusts BC SC TK
Branch Canker(s) Stem Canker(s) Top-kill
IB Bark Beetle FA GR RA GY
Failed Attack Current (Green) attack Red Attack Grey Attack
ID, DF, M Defoliators, Mites, needle rusts, and blight
Enter % defoliated 1=10%, 10+100%
Record % defoliated, discoloured, or infected (past and present attacks)
IDW Defoliators Western Spruce Budworm
Enter % defoliated 1=10%, 10=100%
Record % current year’s foliage, bud and or shoot destruction
IS, IW Terminal weevils Enter # of attacks (1-9) And M N F S
Record # of years of attacks (1 – 9) Major crook Minor crook Forking Staghead
November 2007 119

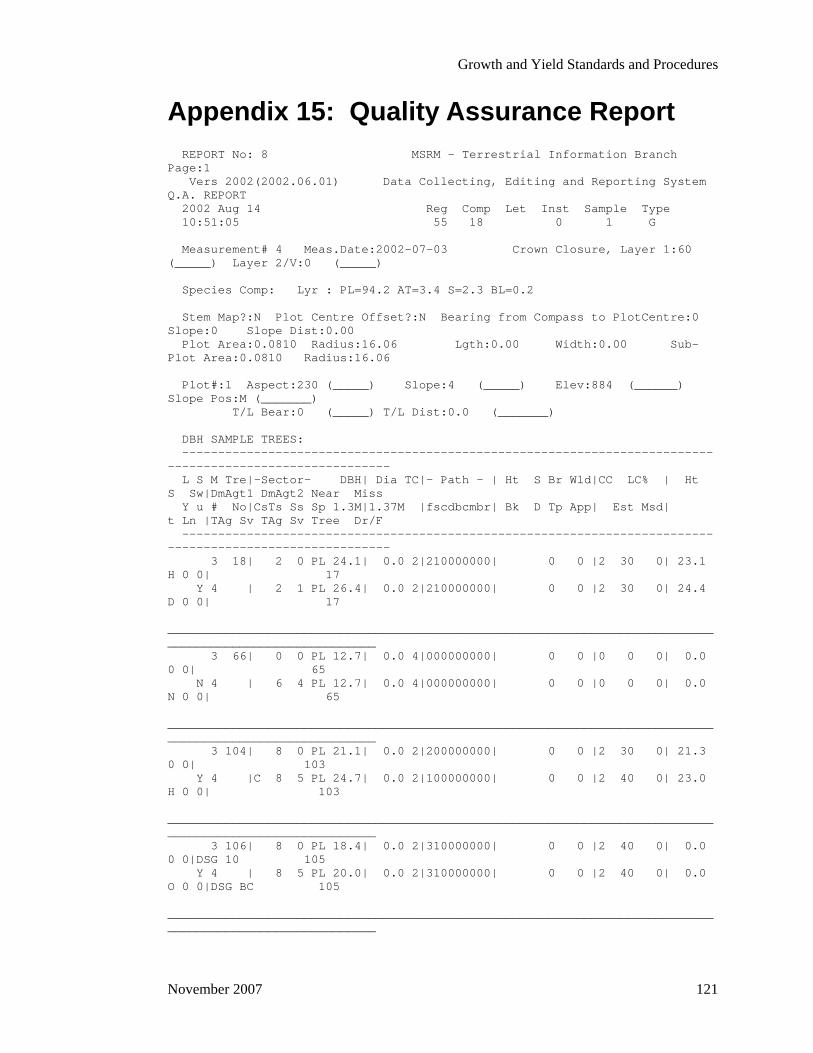
Growth and Yield Standards and Procedures
Appendix 15: Quality Assurance Report REPORT No: 8 MSRM - Terrestrial Information Branch Page:1 Vers 2002(2002.06.01) Data Collecting, Editing and Reporting System Q.A. REPORT 2002 Aug 14 Reg Comp Let Inst Sample Type 10:51:05 55 18 0 1 G Measurement# 4 Meas.Date:2002-07-03 Crown Closure, Layer 1:60 (_____) Layer 2/V:0 (_____) Species Comp: Lyr : PL=94.2 AT=3.4 S=2.3 BL=0.2 Stem Map?:N Plot Centre Offset?:N Bearing from Compass to PlotCentre:0 Slope:0 Slope Dist:0.00 Plot Area:0.0810 Radius:16.06 Lgth:0.00 Width:0.00 Sub-Plot Area:0.0810 Radius:16.06 Plot#:1 Aspect:230 (_____) Slope:4 (_____) Elev:884 (______) Slope Pos:M (_______) T/L Bear:0 (_____) T/L Dist:0.0 (_______) DBH SAMPLE TREES: --------------------------------------------------------------------------------------------------------- L S M Tre|-Sector- DBH| Dia TC|- Path - | Ht S Br Wld|CC LC% | Ht S Sw|DmAgt1 DmAgt2 Near Miss Y u # No|CsTs Ss Sp 1.3M|1.37M |fscdbcmbr| Bk D Tp App| Est Msd| t Ln |TAg Sv TAg Sv Tree Dr/F --------------------------------------------------------------------------------------------------------- 3 18| 2 0 PL 24.1| 0.0 2|210000000| 0 0 |2 30 0| 23.1 H 0 0| 17 Y 4 | 2 1 PL 26.4| 0.0 2|210000000| 0 0 |2 30 0| 24.4 D 0 0| 17 _________________________________________________________________________________________________________ 3 66| 0 0 PL 12.7| 0.0 4|000000000| 0 0 |0 0 0| 0.0 0 0| 65 N 4 | 6 4 PL 12.7| 0.0 4|000000000| 0 0 |0 0 0| 0.0 N 0 0| 65 _________________________________________________________________________________________________________ 3 104| 8 0 PL 21.1| 0.0 2|200000000| 0 0 |2 30 0| 21.3 0 0| 103 Y 4 |C 8 5 PL 24.7| 0.0 2|100000000| 0 0 |2 40 0| 23.0 H 0 0| 103 _________________________________________________________________________________________________________ 3 106| 8 0 PL 18.4| 0.0 2|310000000| 0 0 |2 40 0| 0.0 0 0|DSG 10 105 Y 4 | 8 5 PL 20.0| 0.0 2|310000000| 0 0 |2 40 0| 0.0 O 0 0|DSG BC 105 _________________________________________________________________________________________________________
November 2007 121

Growth and Yield Standards and Procedures
3 107| 8 0 PL 16.1| 0.0 2|110000000| 0 0 |2 20 0| 20.4 0 0| 106 Y 4 | 8 5 PL 17.5| 0.0 2|110000000| 0 0 |2 20 0| 21.1 M 0 0| 106 _________________________________________________________________________________________________________ REPORT No: 8 MSRM - Terrestrial Information Branch Page:2 2002 Aug 14 Reg Comp Let Inst Sample Type 10:51:05 55 18 0 1 G DBH SAMPLE TREES: --------------------------------------------------------------------------------------------------------- L S M Tre|-Sector- DBH| Dia TC|- Path - | Ht S Br Wld|CC LC% | Ht S Sw|DmAgt1 DmAgt2 Near Miss Y u # No|CsTs Ss Sp 1.3M|1.37M |fscdbcmbr| Bk D Tp App| Est Msd| t Ln |TAg Sv TAg Sv Tree Dr/F --------------------------------------------------------------------------------------------------------- 3 109| 9 0 PL 13.5| 0.0 4|000000000| 0 0 |0 0 0| 0.0 0 0|D R L 108 N 4 | 9 6 PL 13.5| 0.0 4|000000000| 3.5 S 0 6 |0 0 0| 0.0 N 0 0| 108 | | | | | | | _________________________________________________________________________________________________________ 3 111| 9 0 PL 11.0| 0.0 2|520000000| 3 0 |2 10 0| 0.0 0 0|DSG 30 110 C 4 | 9 6 PL 12.0| 0.0 2|420000000| 0 0 |3 10 0| 11.8 M 0 0|DSG BC 110 | | | | | | | _________________________________________________________________________________________________________ 3 192| 11 0 S 4.5| 0.0 1|000000000| 0 0 |4 80 0| 0.0 0 0|IAG S 143 Y 4 | 11 8 S 4.9| 0.0 1|000000000| 0 0 |4 80 0| 4.8 M 0 0|IAG S 143 | | | | | | | _________________________________________________________________________________________________________ Y 4 300| 7 5 BL 3.5| 0.0 1|000000000| 0 0 |4 70 0| 3.1 M 0 0| 126 | | | | | | | _________________________________________________________________________________________________________ HEIGHT SAMPLE TREES: --------------------------------------------------------------------------------------------------------- L S M Tree|-Sector- DBH| Dia TC| Height Readings |BH Bor |Radial Inc. |Near
122 November 2007

Growth and Yield Standards and Procedures
Y u # No|CsTs Ss Sp 1.3M|1.37M |Top Bot Tot SDst Slp Ht Cor TotHt|Age Ht Pith Sup|5yr 10yr 20yr|Tree --------------------------------------------------------------------------------------------------------- 3 18| 2 0 PL 24.1| 0.0 2| 84 -3 81 0 25.0 21.8 1.3 23.1| | 0 0 0| 17 Y 4 | 2 1 PL 26.4| 0.0 2| 0 0 0 0 0.0 23.1 1.3 24.4| | 0 0 0| 17 | | | | | | _________________________________________________________________________________________________________ 3 104| 8 0 PL 21.1| 0.0 2| 84 4 88 0 25.0 20.0 1.3 21.3| 0 0.00 | 0 0 0| 103 Y 4 |C 8 5 PL 24.7| 0.0 2| 0 0 0 0 0.0 21.7 1.3 23.0|102 1.30 Y N | 6 12 25| 103 | | | | | | _________________________________________________________________________________________________________
November 2007 123
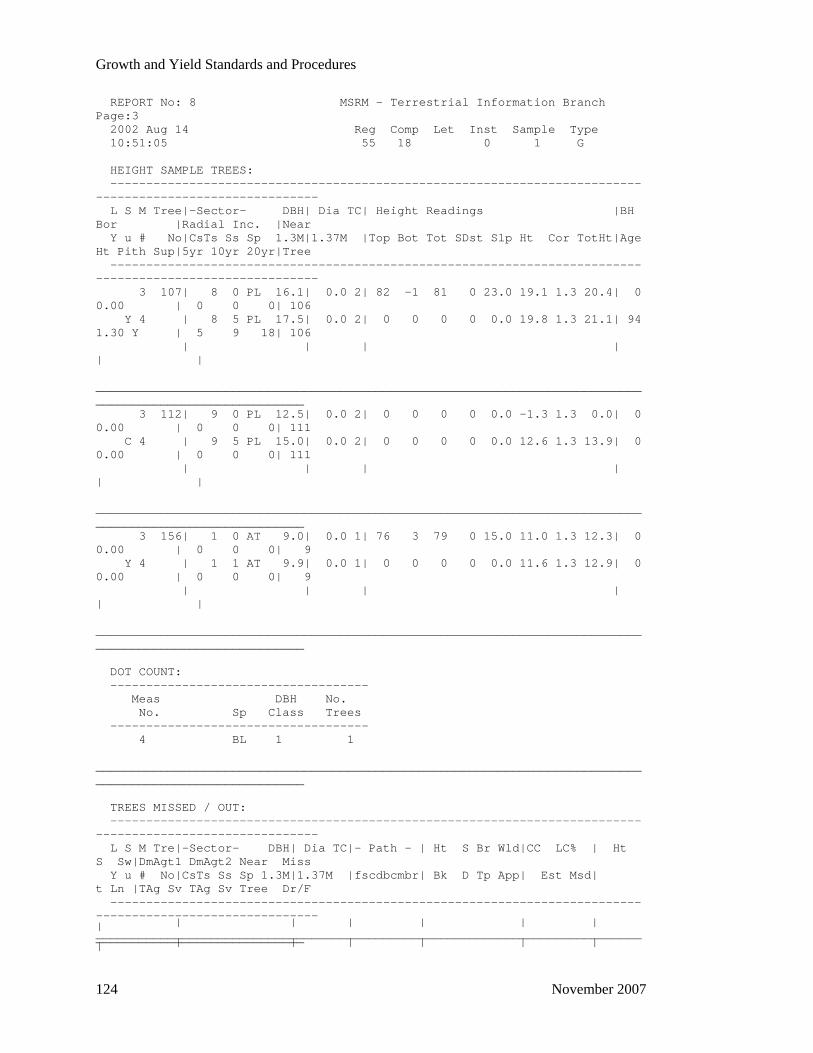
Growth and Yield Standards and Procedures
REPORT No: 8 MSRM - Terrestrial Information Branch Page:3 2002 Aug 14 Reg Comp Let Inst Sample Type 10:51:05 55 18 0 1 G HEIGHT SAMPLE TREES: --------------------------------------------------------------------------------------------------------- L S M Tree|-Sector- DBH| Dia TC| Height Readings |BH Bor |Radial Inc. |Near Y u # No|CsTs Ss Sp 1.3M|1.37M |Top Bot Tot SDst Slp Ht Cor TotHt|Age Ht Pith Sup|5yr 10yr 20yr|Tree --------------------------------------------------------------------------------------------------------- 3 107| 8 0 PL 16.1| 0.0 2| 82 -1 81 0 23.0 19.1 1.3 20.4| 0 0.00 | 0 0 0| 106 Y 4 | 8 5 PL 17.5| 0.0 2| 0 0 0 0 0.0 19.8 1.3 21.1| 94 1.30 Y | 5 9 18| 106 | | | | | | _________________________________________________________________________________________________________ 3 112| 9 0 PL 12.5| 0.0 2| 0 0 0 0 0.0 -1.3 1.3 0.0| 0 0.00 | 0 0 0| 111 C 4 | 9 5 PL 15.0| 0.0 2| 0 0 0 0 0.0 12.6 1.3 13.9| 0 0.00 | 0 0 0| 111 | | | | | | _________________________________________________________________________________________________________ 3 156| 1 0 AT 9.0| 0.0 1| 76 3 79 0 15.0 11.0 1.3 12.3| 0 0.00 | 0 0 0| 9 Y 4 | 1 1 AT 9.9| 0.0 1| 0 0 0 0 0.0 11.6 1.3 12.9| 0 0.00 | 0 0 0| 9 | | | | | | _________________________________________________________________________________________________________ DOT COUNT: ------------------------------------ Meas DBH No. No. Sp Class Trees ------------------------------------ 4 BL 1 1 _________________________________________________________________________________________________________ TREES MISSED / OUT: --------------------------------------------------------------------------------------------------------- L S M Tre|-Sector- DBH| Dia TC|- Path - | Ht S Br Wld|CC LC% | Ht S Sw|DmAgt1 DmAgt2 Near Miss Y u # No|CsTs Ss Sp 1.3M|1.37M |fscdbcmbr| Bk D Tp App| Est Msd| t Ln |TAg Sv TAg Sv Tree Dr/F --------------------------------------------------------------------------------------------------------- | | | | | | | _________________________________________________________________________________________________________ | | | | | | |
124 November 2007
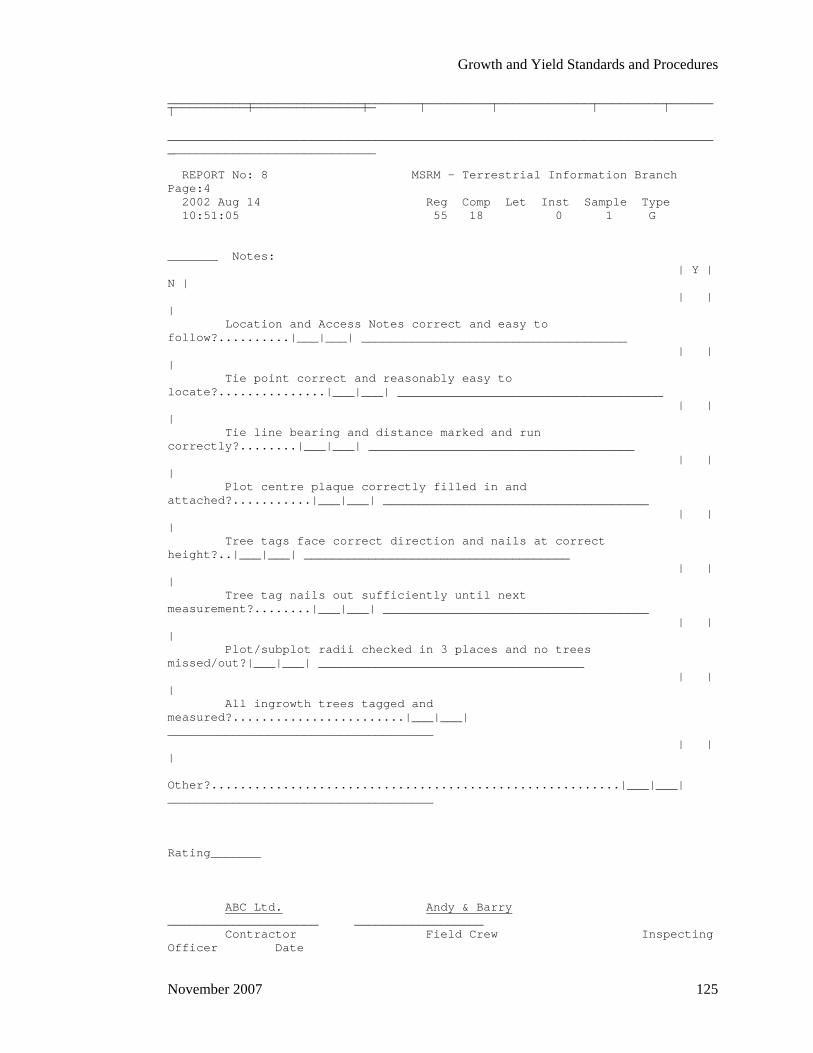
Growth and Yield Standards and Procedures
_________________________________________________________________________________________________________ | | | | | | | ________________________________________________________________________________________________________ _ REPORT No: 8 MSRM - Terrestrial Information Branch Page:4 2002 Aug 14 Reg Comp Let Inst Sample Type 10:51:05 55 18 0 1 G _______ Notes: | Y | N | | | | Location and Access Notes correct and easy to follow?..........|___|___| _____________________________________ | | | Tie point correct and reasonably easy to locate?...............|___|___| _____________________________________ | | | Tie line bearing and distance marked and run correctly?........|___|___| _____________________________________ | | | Plot centre plaque correctly filled in and attached?...........|___|___| _____________________________________ | | | Tree tags face correct direction and nails at correct height?..|___|___| _____________________________________ | | | Tree tag nails out sufficiently until next measurement?........|___|___| _____________________________________ | | | Plot/subplot radii checked in 3 places and no trees missed/out?|___|___| _____________________________________ | | | All ingrowth trees tagged and measured?........................|___|___| _____________________________________ | | | Other?.........................................................|___|___| _____________________________________ Rating_______ ABC Ltd. Andy & Barry _____________________ __________________ Contractor Field Crew Inspecting Officer Date
November 2007 125

Growth and Yield Standards and Procedures
126 November 2007
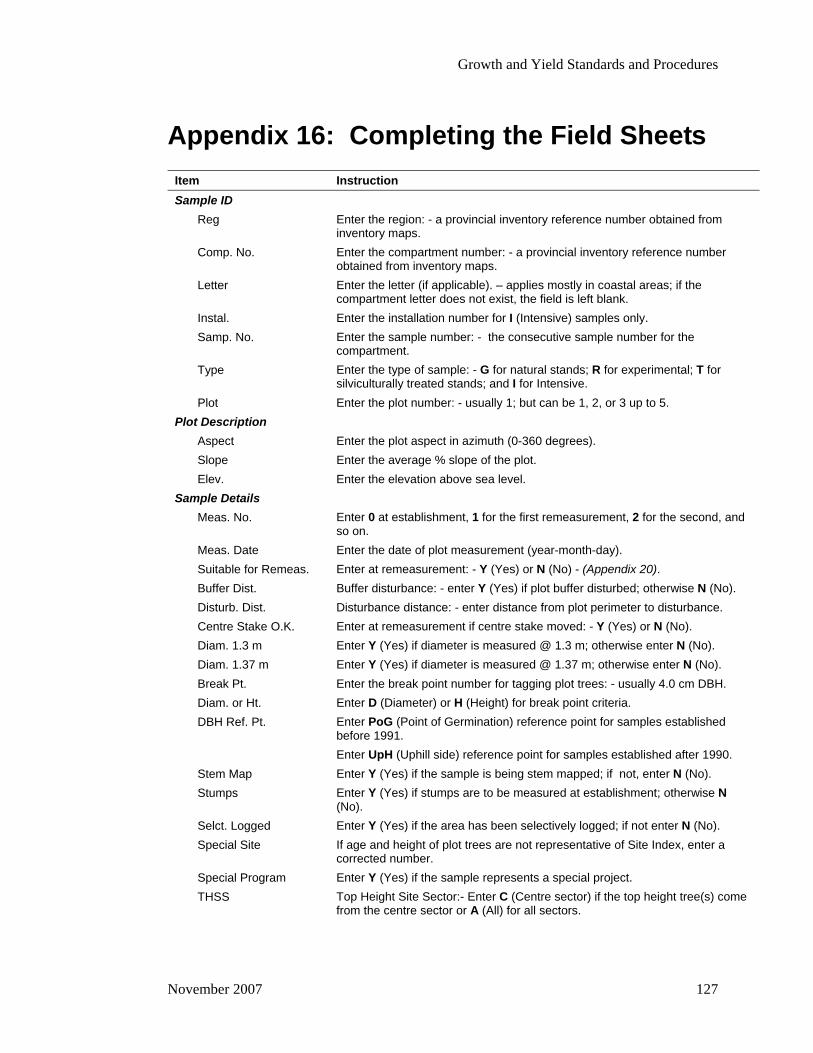
Growth and Yield Standards and Procedures
Appendix 16: Completing the Field Sheets
Item Instruction Sample ID
Reg Enter the region: - a provincial inventory reference number obtained from inventory maps.
Comp. No. Enter the compartment number: - a provincial inventory reference number obtained from inventory maps.
Letter Enter the letter (if applicable). – applies mostly in coastal areas; if the compartment letter does not exist, the field is left blank.
Instal. Enter the installation number for I (Intensive) samples only. Samp. No. Enter the sample number: - the consecutive sample number for the
compartment. Type Enter the type of sample: - G for natural stands; R for experimental; T for
silviculturally treated stands; and I for Intensive. Plot Enter the plot number: - usually 1; but can be 1, 2, or 3 up to 5.
Plot Description Aspect Enter the plot aspect in azimuth (0-360 degrees). Slope Enter the average % slope of the plot. Elev. Enter the elevation above sea level.
Sample Details Meas. No. Enter 0 at establishment, 1 for the first remeasurement, 2 for the second, and
so on. Meas. Date Enter the date of plot measurement (year-month-day). Suitable for Remeas. Enter at remeasurement: - Y (Yes) or N (No) - (Appendix 20). Buffer Dist. Buffer disturbance: - enter Y (Yes) if plot buffer disturbed; otherwise N (No). Disturb. Dist. Disturbance distance: - enter distance from plot perimeter to disturbance. Centre Stake O.K. Enter at remeasurement if centre stake moved: - Y (Yes) or N (No). Diam. 1.3 m Enter Y (Yes) if diameter is measured @ 1.3 m; otherwise enter N (No). Diam. 1.37 m Enter Y (Yes) if diameter is measured @ 1.37 m; otherwise enter N (No). Break Pt. Enter the break point number for tagging plot trees: - usually 4.0 cm DBH. Diam. or Ht. Enter D (Diameter) or H (Height) for break point criteria. DBH Ref. Pt. Enter PoG (Point of Germination) reference point for samples established
before 1991. Enter UpH (Uphill side) reference point for samples established after 1990.
Stem Map Enter Y (Yes) if the sample is being stem mapped; if not, enter N (No). Stumps Enter Y (Yes) if stumps are to be measured at establishment; otherwise N
(No). Selct. Logged Enter Y (Yes) if the area has been selectively logged; if not enter N (No). Special Site If age and height of plot trees are not representative of Site Index, enter a
corrected number. Special Program Enter Y (Yes) if the sample represents a special project. THSS Top Height Site Sector:- Enter C (Centre sector) if the top height tree(s) come
from the centre sector or A (All) for all sectors.
November 2007 127
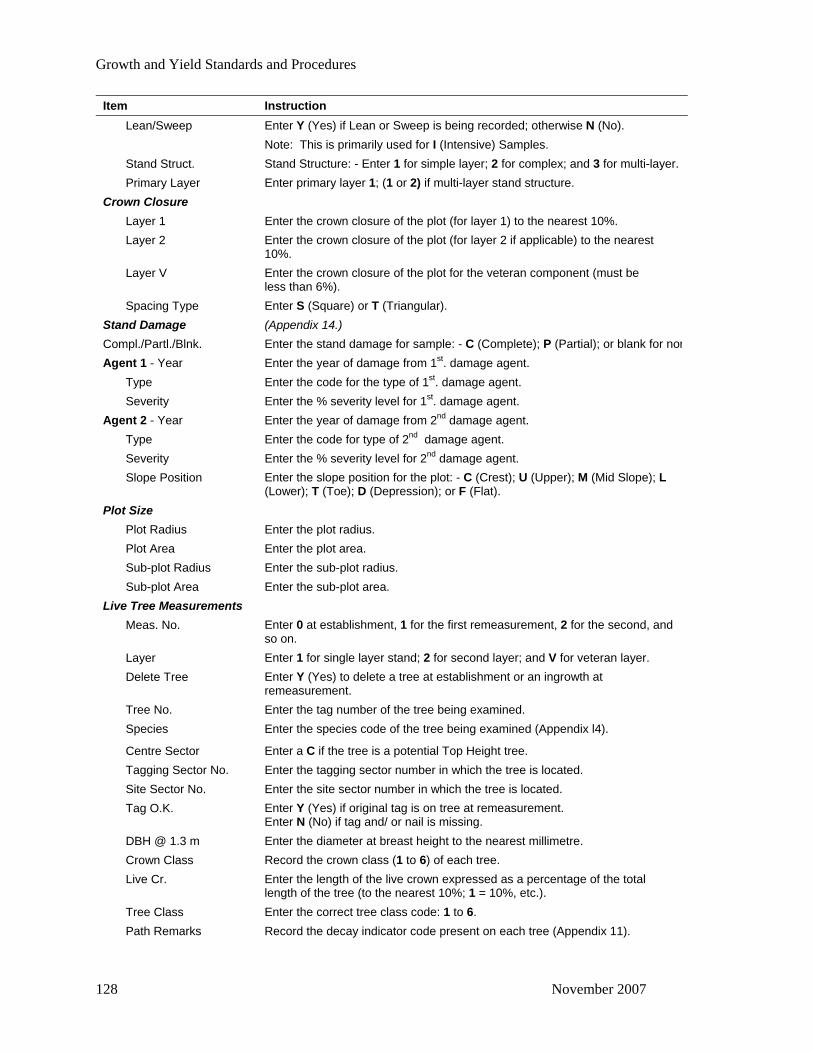
Growth and Yield Standards and Procedures
Item Instruction Lean/Sweep Enter Y (Yes) if Lean or Sweep is being recorded; otherwise N (No).
Note: This is primarily used for I (Intensive) Samples. Stand Struct. Stand Structure: - Enter 1 for simple layer; 2 for complex; and 3 for multi-layer. Primary Layer Enter primary layer 1; (1 or 2) if multi-layer stand structure.
Crown Closure Layer 1 Enter the crown closure of the plot (for layer 1) to the nearest 10%. Layer 2 Enter the crown closure of the plot (for layer 2 if applicable) to the nearest
10%. Layer V Enter the crown closure of the plot for the veteran component (must be
less than 6%). Spacing Type Enter S (Square) or T (Triangular).
Stand Damage (Appendix 14.) Compl./Partl./Blnk. Enter the stand damage for sample: - C (Complete); P (Partial); or blank for nonAgent 1 - Year Enter the year of damage from 1st. damage agent.
Type Enter the code for the type of 1st. damage agent. Severity Enter the % severity level for 1st. damage agent.
Agent 2 - Year Enter the year of damage from 2nd damage agent. Type Enter the code for type of 2nd damage agent. Severity Enter the % severity level for 2nd damage agent. Slope Position Enter the slope position for the plot: - C (Crest); U (Upper); M (Mid Slope); L
(Lower); T (Toe); D (Depression); or F (Flat). Plot Size
Plot Radius Enter the plot radius. Plot Area Enter the plot area. Sub-plot Radius Enter the sub-plot radius. Sub-plot Area Enter the sub-plot area.
Live Tree Measurements Meas. No. Enter 0 at establishment, 1 for the first remeasurement, 2 for the second, and
so on. Layer Enter 1 for single layer stand; 2 for second layer; and V for veteran layer. Delete Tree Enter Y (Yes) to delete a tree at establishment or an ingrowth at
remeasurement. Tree No. Enter the tag number of the tree being examined. Species Enter the species code of the tree being examined (Appendix l4).
Centre Sector Enter a C if the tree is a potential Top Height tree. Tagging Sector No. Enter the tagging sector number in which the tree is located. Site Sector No. Enter the site sector number in which the tree is located. Tag O.K. Enter Y (Yes) if original tag is on tree at remeasurement.
Enter N (No) if tag and/ or nail is missing. DBH @ 1.3 m Enter the diameter at breast height to the nearest millimetre. Crown Class Record the crown class (1 to 6) of each tree. Live Cr. Enter the length of the live crown expressed as a percentage of the total
length of the tree (to the nearest 10%; 1 = 10%, etc.). Tree Class Enter the correct tree class code: 1 to 6. Path Remarks Record the decay indicator code present on each tree (Appendix 11).
128 November 2007
Growth and Yield Standards and Procedures
Item Instruction Ht. to Break Record the height to break for live and dead trees.
Dead Tree Measurements (Appendix 22.) Tree Cert. Code Enter 1 for tree certainty positively identified; 2 for likely correct; and 3 for
uncertain. Sp. Cert. Code Enter 1 for species certainty positively identified; 2 for likely correct; and 3 for
uncertain. Vert. Position Enter S for free standing tree and D for down on the ground (including
supported by other trees). Wildlife App. Use visual description codes 1 to 7. Down Position Enter down position: S for supported off the ground and D for down on
ground. Dead Tr. Stmp. Enter Y (Yes) if stump originated from cut tree. Missed Tree At remeasurement enter M if the tree was missed at previous measurement;
D if the tree is to be dropped because it is determined to be outside of the plot; or F if the tree is gone and most likely dead and fallen.
Estimated Ht. (Vets) or Small Tree
Record the estimated height for veteran trees or for I (Intensive) samples measure the small tree height.
Sweep Record sweep for I (Intensive) samples: - 1 for minor; 2 for major lean. Lean Record Lean for I (Intensive) samples: - 1 for minor; 2 for major sweep..
Other Diameter Stump Enter at establishment: - N (New) for a stump <5 years old; O (old) for a
stump > 5 years old. Stump diam./ or DBH @ 1.37 m
Measure diameter of the stump/ or DBH of tree if measured at 1.37 m.
Stump Ht. Measure height of stump. Near Tree No. Record the tree number of the closest sequentially numbered living tree to
the ingrowth; sub-plot; or dead tree being measured. In Plot Record Y (Yes) if the tree is measured outside of plot. N (No) is the default.
Damage Agent 1 (Appendix 14) Type Enter single letter code for damage agent 1. Agent Enter two letter code for detailed description. Severity Enter appropriate code for damage severity.
Damage Agent 2 Type Enter single letter code for damage agent 2. Agent Enter two letter code for detailed description. Severity Enter appropriate code for damage severity. Ht. Suitable Enter height suitable code: Y (Yes); N (No); C (Could be); V (Very difficult); E
(Easy); or F (Flagged). Stem Mapping
Bearing Record the azimuth bearing from plot centre (PC) to the tree. Slope Record the % slope between PC and the tree. Slope Dist. Record the slope distance between PC and the tree.
November 2007 129
Growth and Yield Standards and Procedures
2nd page Item Instruction
Reg Enter the region: - a provincial inventory reference number obtained from inventory maps.
Comp. No. Enter the compartment number: - a provincial inventory reference number obtained from inventory maps.
Letter Enter the letter (if applicable). – applies mostly in coastal areas; if the compartment letter does not exist, the field is left blank.
Instal. Enter the installation number for I (Intensive) samples only. Samp. No. Enter the sample number: - the consecutive sample number for the
compartment. Type Enter the type of sample: - G for natural stands; R for experimental; T for
silviculturally treated stands; and I for Intensive. Plot Enter the plot number: - usually 1; but can be 1, 2, or 3 and up to 5. Meas. No. Enter 0 at establishment, 1 for the first remeasurement, 2 for the second, and
so on. Centre Sector Enter C for a potential Top Height tree or SIBEC tree; otherwise leave blank. Tag. Sector No. Enter the tagging sector in which the tree is located. Site Sector No. Enter the site sector in which the tree is located. Tree No. Enter the tag number of the tree being examined. Species Enter the species code of the tree being examined.
Height Calculation Top Enter the top Suunto reading (% scale). Bottom Enter the bottom Suunto reading (% scale, + or -). Total Enter the total of the top and bottom readings. Slope Dist. Enter the slope distance from the tree to the measurer. Slope % Enter % slope. Horiz. Dist. Enter the horizontal distance between the tree and the measurer. Height Enter the calculated height. Height Correction Enter the height correction (normally 1.3 m). Total Height Enter the total height.
Age Calculation Age Core Tkn. Age core taken: Enter Y (Yes) or N (No). Boring Age Enter the boring age. Boring Height Enter the boring height (1.3 m). Age Correction Enter the age correction. Total Age Enter the total age. Pith If the pith is included, enter Y(Yes); if missed, enter N (No); and if the core
has rot, enter R (Rotten), and if the age was taken on a similar size out of plot tree, enter E (estimate).
Radial Increment Last 5 Yrs. Enter the radial increment for the last 5 years. Last 10 Yrs. Enter the radial increment for the last 10 years. Last 20 Yrs. Enter the radial increment for the last 20 years.
Age Suppression (Appendix 23) Suppression Enter presence of age suppression in core: Y (Yes); N (No); or P (Possibly). Core Length Enter core length to pith.
130 November 2007

Growth and Yield Standards and Procedures
Item Instruction Supp. Age Enter number of years of suppression. Supp. Length Enter length of total suppression. Supp. 10 Yrs. Enter length of last 10 years of suppression. Released 10 Yrs. Enter length of first 10 years after release. Tree In/Out of Plot Record Y (Yes) if the tree is measured outside of plot; otherwise N (No).
Compass Offset Compass at PC If compass is not at plot centre, enter N (No); otherwise Y (Yes). Bearing From Compass to Plot Centre
Enter bearing (0-360) from the compass to plot centre.
Slope Enter % slope from the compass to plot centre. Slope Distance Enter the slope distance from the compass to plot centre.
Dot Count Summary Meas. No. Enter 0 at establishment, 1 for the first remeasurement, 2 for the second, and
so on. Species Enter the species code of the tree being examined. 0.3-1.3 m (0) Enter the number of trees > 0.3 m and < 1.3 m height 0.1-1.9 cm (1) Enter the number of trees > 1.3 m and < 2.0 cm DBH. Total Enter the total dot count trees for each species.
November 2007 131

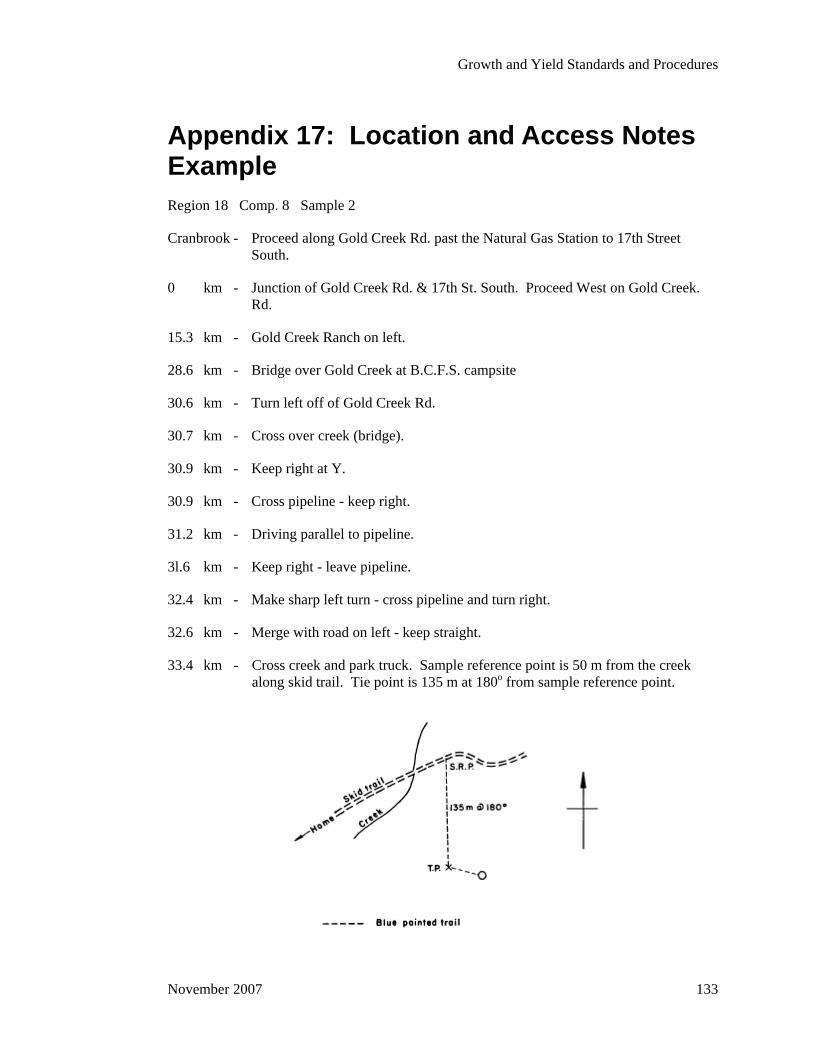
Growth and Yield Standards and Procedures
Appendix 17: Location and Access Notes Example Region 18 Comp. 8 Sample 2
Cranbrook - Proceed along Gold Creek Rd. past the Natural Gas Station to 17th Street South.
0 km - Junction of Gold Creek Rd. & 17th St. South. Proceed West on Gold Creek. Rd.
15.3 km - Gold Creek Ranch on left.
28.6 km - Bridge over Gold Creek at B.C.F.S. campsite
30.6 km - Turn left off of Gold Creek Rd.
30.7 km - Cross over creek (bridge).
30.9 km - Keep right at Y.
30.9 km - Cross pipeline - keep right.
31.2 km - Driving parallel to pipeline.
3l.6 km - Keep right - leave pipeline.
32.4 km - Make sharp left turn - cross pipeline and turn right.
32.6 km - Merge with road on left - keep straight.
33.4 km - Cross creek and park truck. Sample reference point is 50 m from the creek along skid trail. Tie point is 135 m at 180o from sample reference point.
November 2007 133

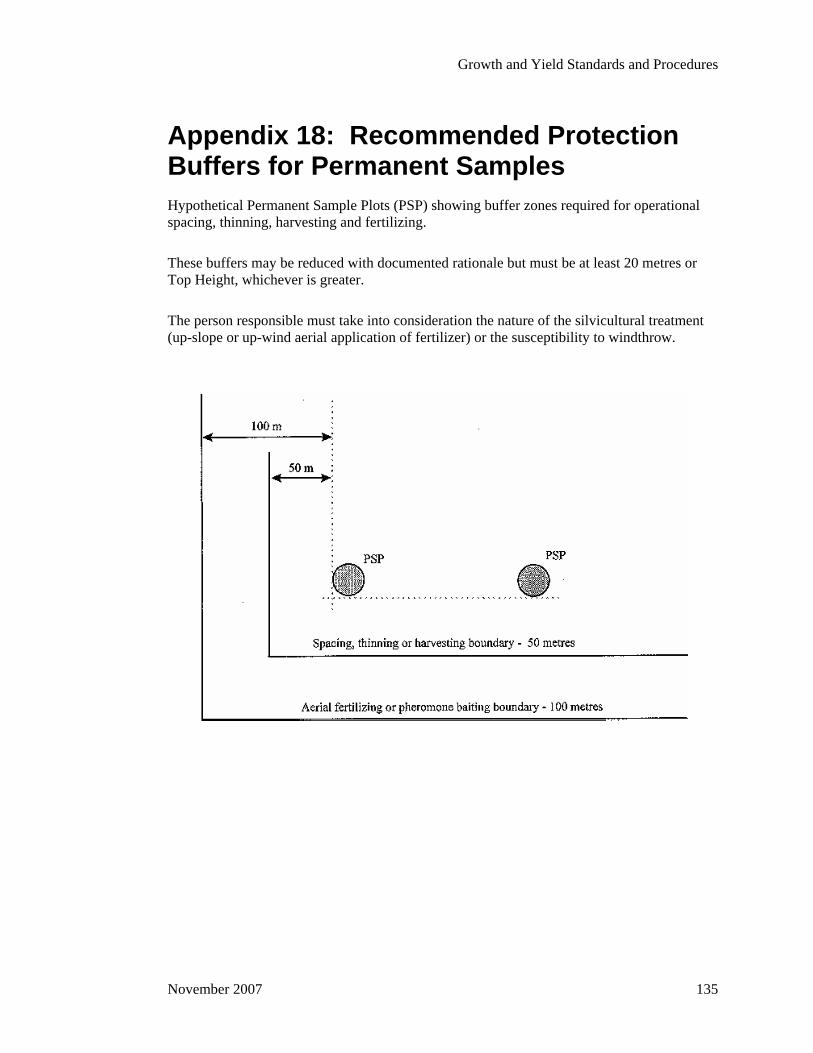
Growth and Yield Standards and Procedures
Appendix 18: Recommended Protection Buffers for Permanent Samples Hypothetical Permanent Sample Plots (PSP) showing buffer zones required for operational spacing, thinning, harvesting and fertilizing.
These buffers may be reduced with documented rationale but must be at least 20 metres or Top Height, whichever is greater.
The person responsible must take into consideration the nature of the silvicultural treatment (up-slope or up-wind aerial application of fertilizer) or the susceptibility to windthrow.
November 2007 135

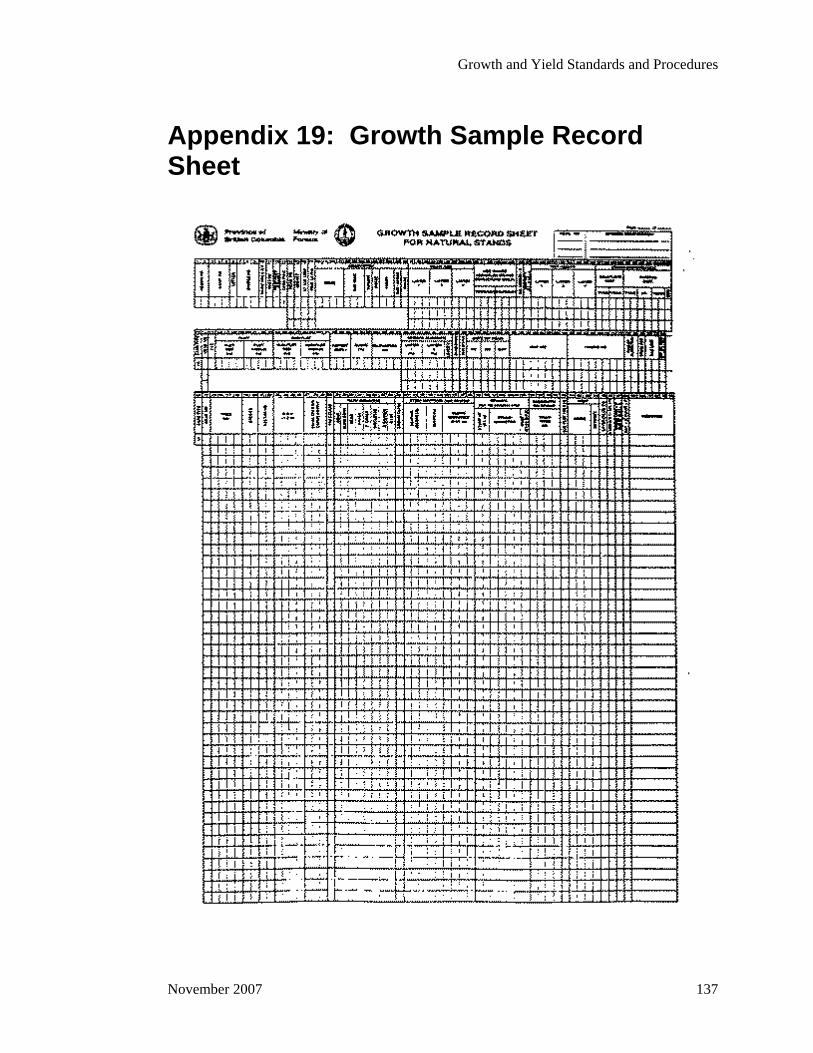
Growth and Yield Standards and Procedures
Appendix 19: Growth Sample Record Sheet
November 2007 137
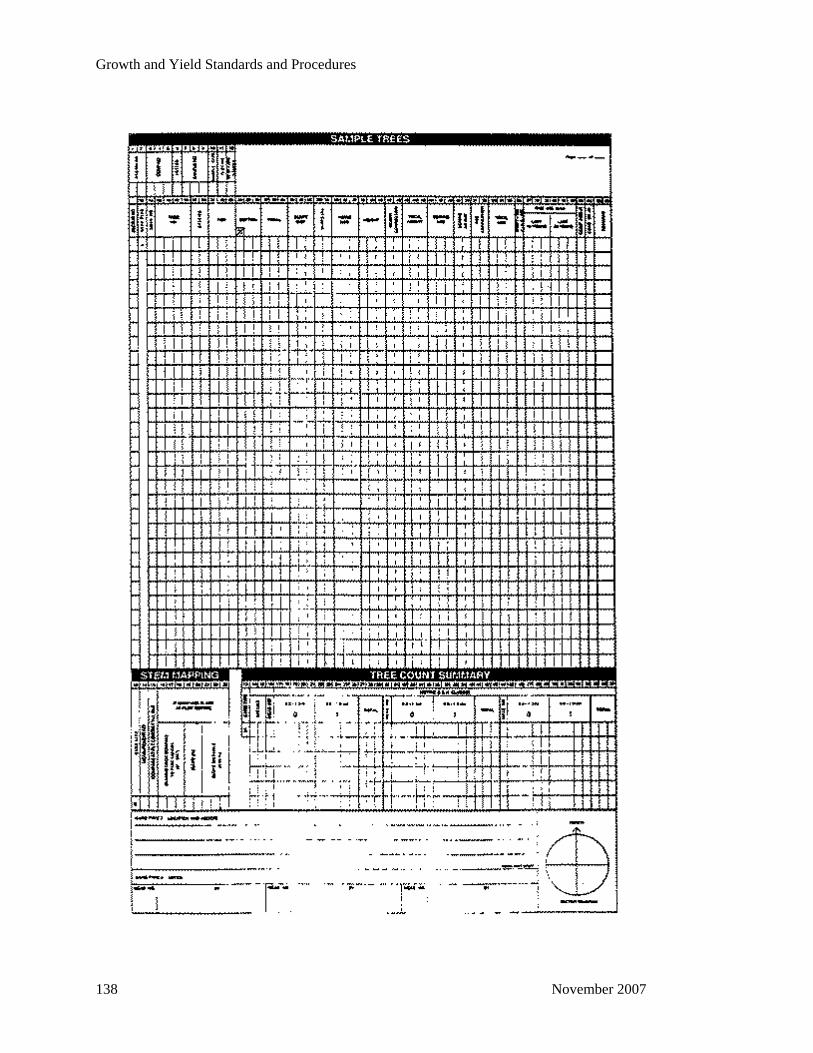
Growth and Yield Standards and Procedures
138 November 2007
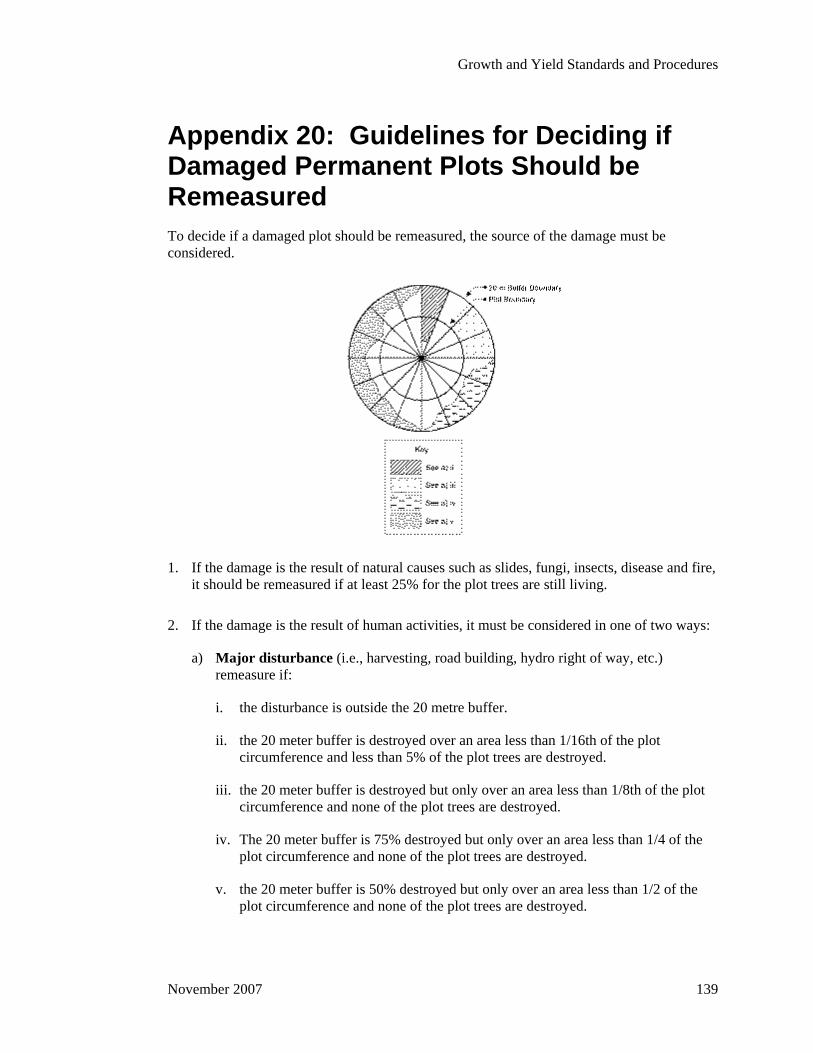
Growth and Yield Standards and Procedures
Appendix 20: Guidelines for Deciding if Damaged Permanent Plots Should be Remeasured To decide if a damaged plot should be remeasured, the source of the damage must be considered.
1. If the damage is the result of natural causes such as slides, fungi, insects, disease and fire, it should be remeasured if at least 25% for the plot trees are still living.
2. If the damage is the result of human activities, it must be considered in one of two ways:
a) Major disturbance (i.e., harvesting, road building, hydro right of way, etc.) remeasure if:
i. the disturbance is outside the 20 metre buffer.
ii. the 20 meter buffer is destroyed over an area less than 1/16th of the plot circumference and less than 5% of the plot trees are destroyed.
iii. the 20 meter buffer is destroyed but only over an area less than 1/8th of the plot circumference and none of the plot trees are destroyed.
iv. The 20 meter buffer is 75% destroyed but only over an area less than 1/4 of the plot circumference and none of the plot trees are destroyed.
v. the 20 meter buffer is 50% destroyed but only over an area less than 1/2 of the plot circumference and none of the plot trees are destroyed.
November 2007 139
Growth and Yield Standards and Procedures
b) Minor disturbance (i.e., spacing, pruning, firewood cutting, small trails, etc.) remeasure if:
i. less than 10% of the plot trees are destroyed, and
ii. less than 10% of the sample area is destroyed, and
iii. the disturbance is not localized (no more than 5% of crown closure in one spot).
140 November 2007
Growth and Yield Standards and Procedures
Appendix 21: Converting Breast Height in Industrial Permanent Samples Convert all industrial permanent sample plots (PSPs) from imperial (1.37 m) to metric (1.3 m) breast height. The conversion is done once to give a base-year measurement.
For all commercial and non-commercial trees 4 cm d.b.h. and greater in the plot and commercial trees 2 cm d.b.h. and greater in the sub-plot, measure the diameters at 1.3 m and at 1.37 m above the germination point. Measure all of the originally tagged trees, including those that died since the last measurement or were cut down as well as ingrowth plot and sub-plot trees.
To convert, use only one of the two methods described below. The first is the preferred one.
Method 1 For trees tagged originally:
1. Make sure the tree number tags are nailed to each tree 1.37 m above the germination point.
2. If necessary, replace the nail and tag. The new tag must have the same number as the old one. Make sure the nail is out far enough to allow for future growth.
3. Drive a second nail at 1.3 m (0.07 m below the nail at 1.37 m).
4. Measure both diameters above the nail.
Method 2 For trees tagged originally:
1. Measure the diameter at 1.37 m above the germination point.
2. Mark the metric breast height at 1.3 m (0.07 m below the nail at 1.37 m).
3. Move the nail and tag to the 1.3 m mark. If necessary, replace the nail and tag with a new tag with the same number.
4. Measure the diameter at 1.3 m.
For trees not previously tagged—example, ingrowth and sub-plot trees:
1. Mark the breast heights at 1.3 m and 1.37 m above the germination point.
2. Nail the tag at 1.3 m.
3. Measure the diameters at 1.3 m and at 1.37 m.
Establishing a Sub-plot in Industrial Plots If a sub-plot is not already established, you must establish one at plot center to have some representation from trees below the tagging limit, that is, trees less than 4 cm d.b.h.
November 2007 141
Growth and Yield Standards and Procedures
In a square or rectangular experimental plot, the sub-plot center is identified by an aluminum tubular stake driven into the ground where the two diagonal lines from the corner posts intersect.
When you establish a sub-plot, the perimeter must not extend beyond the plot boundary. The objective in each sub-sample is to obtain a minimum of 20 commercial trees that are less than 4 cm d.b.h. but are at least 0.3 m high. The sub-sample size depends on stand density. See Appendix 6 for a list of sub-plot radii.
1. Choose the sub-sample size and mark the sub-plot circumference with string.
2. Within the sub-plot, tag all living commercial trees with a d.b.h. of 2 cm and greater, but under 4 cm at 1.3 m and 1.37 m above germination using methods 1 or 2 above.
For the trees in the sub-plot with a d.b.h. of less than 2 cm:
1. Count the trees in a dot tally.
2. Derive their metric d.b.h. classes—either d.b.h. class 0 or 1. See “Table 1 below”.
Table 1 Metric d.b.h. Classes and Limits
d.b.h. class Limits
0 0.3 m to 1.3 m high
1 0.1 cm to 1.9 cm d.b.h.
142 November 2007
Growth and Yield Standards and Procedures
Appendix 22: Dead Tree Attributes For each dead tree that is >10.0 cm in d.b.h. and >1.3 meters in height, collect the following attributes if, the tree is standing - both at establishment and remeasurement - or down if it was living at the last measurement:
Number
Number certainty
- positively identified (1)
- likely correct (2)
- uncertain (3)
Species
Species certainty
- positively identified (1)
- likely correct (2)
- uncertain (3)
Diameter at 1.3 meters
Tagging sector
Near tree number
Tree class
Vertical position
- standing (S)
- down (D)
- supported (S)
- on ground (G)
Broken and standing
- yes (Y)
- no (N)
Height to break (ocular estimate to the nearest meter)
Damage agent code and Severity (see Appendix 14)
Wildlife tree appearance as follows: Use codes (1) to (7).
November 2007 143
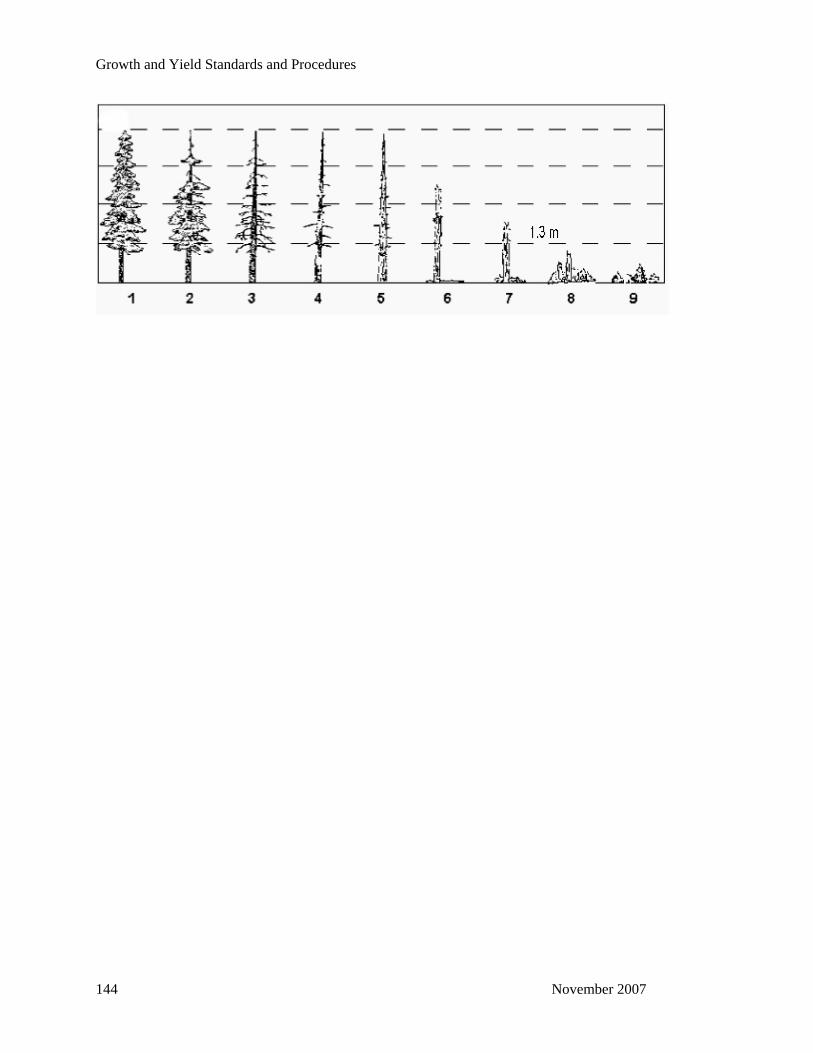
Growth and Yield Standards and Procedures
144 November 2007
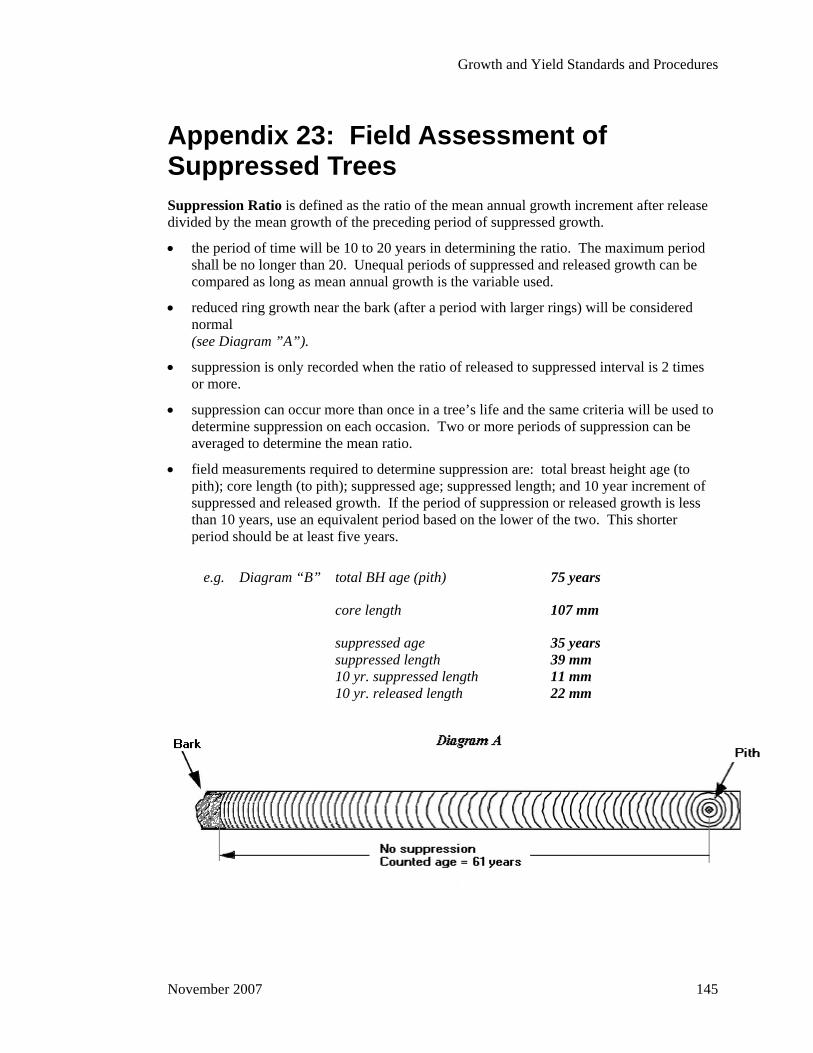
Growth and Yield Standards and Procedures
Appendix 23: Field Assessment of Suppressed Trees Suppression Ratio is defined as the ratio of the mean annual growth increment after release divided by the mean growth of the preceding period of suppressed growth.
• the period of time will be 10 to 20 years in determining the ratio. The maximum period shall be no longer than 20. Unequal periods of suppressed and released growth can be compared as long as mean annual growth is the variable used.
• reduced ring growth near the bark (after a period with larger rings) will be considered normal (see Diagram ”A”).
• suppression is only recorded when the ratio of released to suppressed interval is 2 times or more.
• suppression can occur more than once in a tree’s life and the same criteria will be used to determine suppression on each occasion. Two or more periods of suppression can be averaged to determine the mean ratio.
• field measurements required to determine suppression are: total breast height age (to pith); core length (to pith); suppressed age; suppressed length; and 10 year increment of suppressed and released growth. If the period of suppression or released growth is less than 10 years, use an equivalent period based on the lower of the two. This shorter period should be at least five years.
e.g. Diagram “B” total BH age (pith) 75 years
core length 107 mm
suppressed age 35 years suppressed length 39 mm 10 yr. suppressed length 11 mm 10 yr. released length 22 mm
November 2007 145
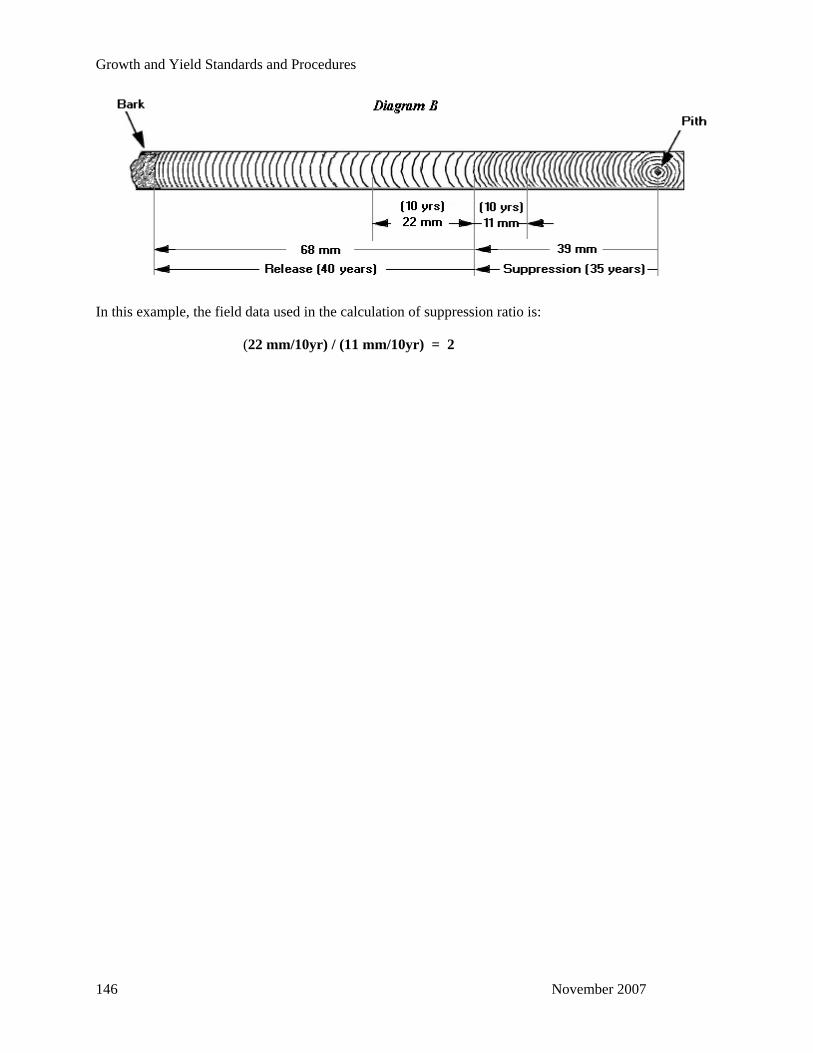
Growth and Yield Standards and Procedures
In this example, the field data used in the calculation of suppression ratio is:
(22 mm/10yr) / (11 mm/10yr) = 2
146 November 2007

Growth and Yield Standards and Procedures
Appendix 24: Example of Tagging and Site Sectors for Remeasuring Plots
November 2007 147

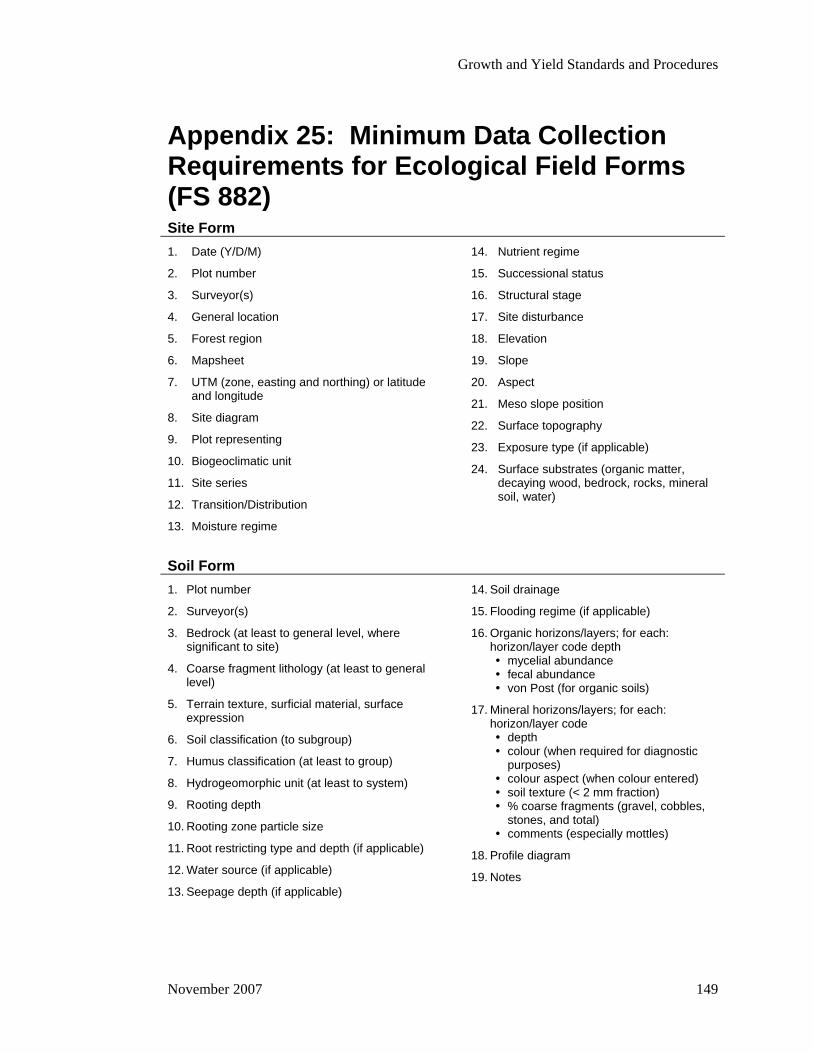
Growth and Yield Standards and Procedures
Appendix 25: Minimum Data Collection Requirements for Ecological Field Forms (FS 882) Site Form 1. Date (Y/D/M)
2. Plot number
3. Surveyor(s)
4. General location
5. Forest region
6. Mapsheet
7. UTM (zone, easting and northing) or latitude and longitude
8. Site diagram
9. Plot representing
10. Biogeoclimatic unit
11. Site series
12. Transition/Distribution
13. Moisture regime
14. Nutrient regime
15. Successional status
16. Structural stage
17. Site disturbance
18. Elevation
19. Slope
20. Aspect
21. Meso slope position
22. Surface topography
23. Exposure type (if applicable)
24. Surface substrates (organic matter, decaying wood, bedrock, rocks, mineral soil, water)
Soil Form 1. Plot number
2. Surveyor(s)
3. Bedrock (at least to general level, where significant to site)
4. Coarse fragment lithology (at least to general level)
5. Terrain texture, surficial material, surface expression
6. Soil classification (to subgroup)
7. Humus classification (at least to group)
8. Hydrogeomorphic unit (at least to system)
9. Rooting depth
10. Rooting zone particle size
11. Root restricting type and depth (if applicable)
12. Water source (if applicable)
13. Seepage depth (if applicable)
14. Soil drainage
15. Flooding regime (if applicable)
16. Organic horizons/layers; for each: horizon/layer code depth
mycelial abundance fecal abundance von Post (for organic soils)
17. Mineral horizons/layers; for each: horizon/layer code
depth colour (when required for diagnostic
purposes) colour aspect (when colour entered) soil texture (< 2 mm fraction) % coarse fragments (gravel, cobbles,
stones, and total) comments (especially mottles)
18. Profile diagram
19. Notes
November 2007 149
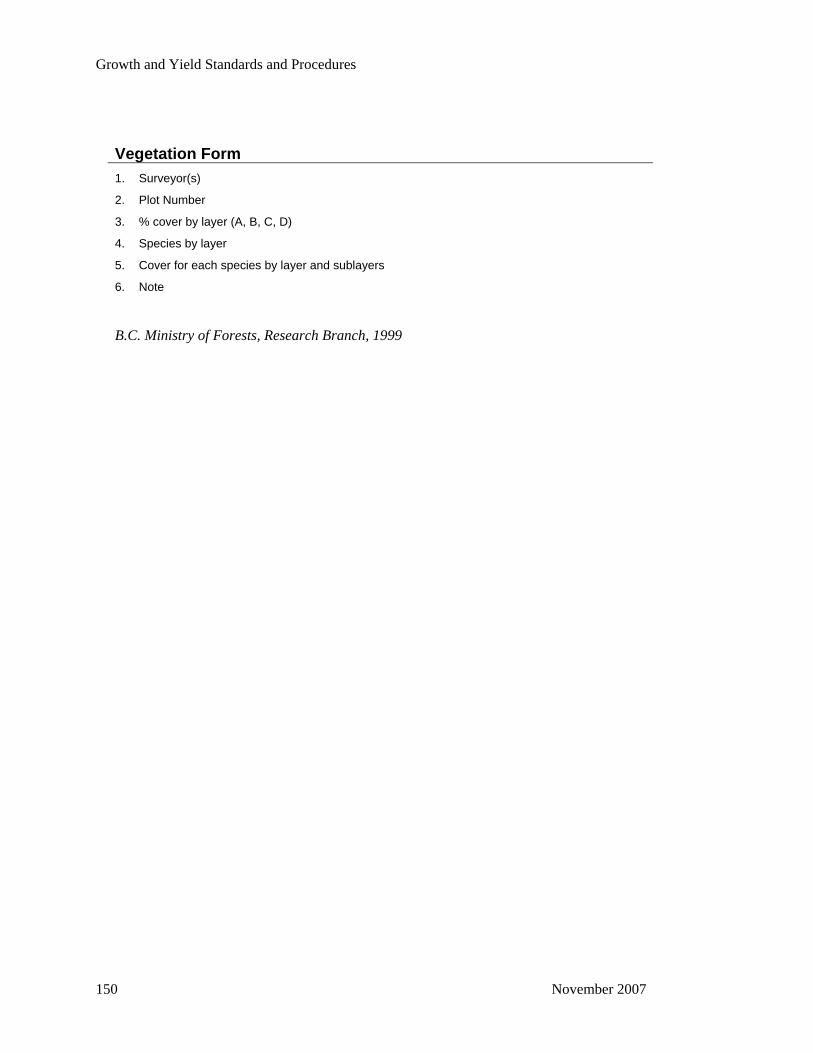
Growth and Yield Standards and Procedures
Vegetation Form
1. Surveyor(s)
2. Plot Number
3. % cover by layer (A, B, C, D)
4. Species by layer
5. Cover for each species by layer and sublayers
6. Note
B.C. Ministry of Forests, Research Branch, 1999
150 November 2007