Embed Size (px)
Citation preview
Forest-related disastersThree case studies and lessons for management of extreme events
17FORESTRY WORKING
PAPER
ISSN 2664-1062
FOOD AND AGRICULTURE ORGANIZATION OF THE UNITED NATIONSRome, 2020
Forest-related disastersThree case studies and lessons for management of extreme events
Required citation: van Hensbergen, H. and Cedergren, J. 2020. Forest-related disasters – Three case studies and lessons for management of extreme events. Forestry Working Paper No. 17. Rome, FAO. https://doi.org/10.4060/cb0686en
The designations employed and the presentation of material in this information product do not imply the expression of any opinion whatsoever on the part of the Food and Agriculture Organization of the United Nations (FAO) concerning the legal or development status of any country, territory, city or area or of its authorities, or concerning the delimitation of its frontiers or boundaries. The mention of specific companies or products of manufacturers, whether or not these have been patented, does not imply that these have been endorsed or recommended by FAO in preference to others of a similar nature that are not mentioned.
The views expressed in this information product are those of the author(s) and do not necessarily reflect the views or policies of FAO.
ISSN 2664-1062 [Print] ISSN 2664-1070 [Online]
ISBN 978-92-5-133185-9 © FAO, 2020
Some rights reserved. This work is made available under the Creative Commons Attribution-NonCommercial-ShareAlike 3.0 IGO licence (CC BY-NC-SA 3.0 IGO; https://creativecommons.org/licenses/by-nc-sa/3.0/igo/legalcode).
Under the terms of this licence, this work may be copied, redistributed and adapted for non-commercial purposes, provided that the work is appropriately cited. In any use of this work, there should be no suggestion that FAO endorses any specific organization, products or services. The use of the FAO logo is not permitted. If the work is adapted, then it must be licensed under the same or equivalent Creative Commons licence. If a translation of this work is created, it must include the following disclaimer along with the required citation: “This translation was not created by the Food and Agriculture Organization of the United Nations (FAO). FAO is not responsible for the content or accuracy of this translation. The original English edition shall be the authoritative edition.”
Disputes arising under the licence that cannot be settled amicably will be resolved by mediation and arbitration as described in Article 8 of the licence except as otherwise provided herein. The applicable mediation rules will be the mediation rules of the World Intellectual Property Organization http://www.wipo.int/amc/en/mediation/rules and any arbitration will be conducted in accordance with the Arbitration Rules of the United Nations Commission on International Trade Law (UNCITRAL).
Third-party materials. Users wishing to reuse material from this work that is attributed to a third party, such as tables, figures or images, are responsible for determining whether permission is needed for that reuse and for obtaining permission from the copyright holder. The risk of claims resulting from infringement of any third-party-owned component in the work rests solely with the user.
Sales, rights and licensing. FAO information products are available on the FAO website (www.fao.org/publications) and can be purchased through [email protected]. Requests for commercial use should be submitted via: www.fao.org/contact-us/licence-request. Queries regarding rights and licensing should be submitted to: [email protected].
Cover photograph: Dominica 2017 after Hurricane Maria. Winds pushed over, snapped and defoliated many trees. However more than half of the trees remained standing and retained some branches. ©FAO/Claus Eckelmann
iii
Contents
Acknowledgements .................................................................................................viii
Acronyms and abreviations ...................................................................................... ix
Executive summary ................................................................................................... xi
1 Introduction ................................................................................................... 1About this report ....................................................................................................... 1
About disasters .......................................................................................................... 2
2 Forests, forestry and disasters ..................................................................... 7Causal factors and their impacts............................................................................... 8
Forest fire ................................................................................................................. 10
Flood and tsunami ....................................................................................................11
Tempest .................................................................................................................... 14
Forests as victims of disaster ................................................................................... 17Forests as providers of goods and services ................................................................... 17Forest disasters and timber supply ................................................................................18
Forests as disaster mitigation .................................................................................. 25
Typology of forest-related disasters ....................................................................... 25
Impacts on critical infrastructure ............................................................................ 26
3 The events .....................................................................................................31Storm Gudrun/Erwin, Sweden (2005) ..................................................................... 31
Before the storm .............................................................................................................32
Storm impact ...................................................................................................................36
Short-term response .......................................................................................................38
Long-term impacts and responses .................................................................................40
Analysis and policy implications of the storm ..............................................................44
The Tohoku tsunami, Japan (2011) .......................................................................... 46Impact on trees................................................................................................................47
Trees as mitigation ..........................................................................................................48
The Central Chile fire (2017) .................................................................................... 51Before the disaster ..........................................................................................................52
Development of the fires................................................................................................53
iv
Immediate response ........................................................................................................56
Impacts of the fire ...........................................................................................................57
Short-term responses ......................................................................................................59
Long-term responses....................................................................................................... 61
Analysis and policy implications ....................................................................................63
Lessons learned ........................................................................................................ 64
4 Managing forest-related disasters ............................................................. 69Strategic approach to forest disaster ..................................................................... 73
Disaster preparedness ............................................................................................. 73Information and communication frameworks ..............................................................73Organizational capacity .................................................................................................. 74Organizational interaction .............................................................................................76
Immediate response ................................................................................................ 77Actions during the event ................................................................................................77
Actions immediately following the event .....................................................................77
Actions in the weeks after the event ............................................................................80
Long-term responses ............................................................................................... 80Policy responses ...............................................................................................................81
Build Back Better .............................................................................................................82
5 Concluding remarks .................................................................................... 85
References ........................................................................................................ 89
Tables1 Timber degradation time limits for recovery of damaged timber
from the field .................................................................................................... 19
2 A classification framework for forest-related disasters ................................. 26
3 Classification of storms according to environmental, social and economic impacts ............................................................................................. 27
4 Level of impact in relation to the conservation status of natural ecosystems affected by the fires ..................................................................... 59
5 The 16-point scale for fire risk developed for Chile ....................................... 62
6 A summary of experiences from three forest-related disasters .................... 70
7 A variety of training exercise types is available for those involved in disaster response .......................................................................................... 74
8 Timber degradation time limits for recovery of damaged timber from the field .................................................................................................... 86
v
Figures1 Relationships between causes and effects in forest-related disasters ........... 82 Direction of treefall in relation to winds during a hurricane ........................ 153 Leading causes of Atlantic tropical cyclone deaths in the US,
aggregated from 1963 to 2012 ........................................................................ 164 Numbers of logging-related accidents in the weeks following
the December 1999 storms in France (CTBA, 2004)........................................ 205 Plan of the timber storage site created at Lynford following
the Great Storm of 1987 ................................................................................... 236 Path of Storm Gudrun/Erwin over Northern Europe and the Baltic.
The zone of maximum wind speeds is indicated ............................................ 317 Tracks of major forest-damaging storms in Europe since 1953 ..................... 348 Maximum wind speeds associated with Gudrun at three
different sites in southern Sweden ................................................................. 359 Maximum winds speeds in southern Sweden during Gudrun....................... 3610 Accidents suffered by Swedish workers during clean-up operations
after Storm Gudrun .......................................................................................... 4311 Area of trees lost or knocked over by the tsunami in Rikuzentakata ........... 4812 Past and future location of forest barriers as tsunami mitigation ................ 5113 Changes in the average annual area burnt and the number of
forest fires during the drought commencing in 2010 .................................... 5214 Forestal Arauco’s firefighting activities each day in January 2017 ................ 5415 Main areas affected by the January-February 2017 fires (LEMA,
EU 2017). The Las Máquinas complex is contained in the upper square, while the lower square is the San Antonio complex ........................ 55
16 Key events during the firestorm at four sites ................................................. 5617 Land-use types affected by the fires ............................................................... 5818 Complete ICS structure for a large wildland fire control situation ............... 7819 Area inundated by Cyclone Idai shown on radar images .............................. 79
Photos1 Åland Islands, Finland, 2018. The first morning after Hurricane Alfrida ...... vii2 Roosevelt Fire 2018, Wyoming, USA ................................................................viii3 Trees contribute to damage, after the storm in Havana, Cuba ....................... x4 Mexican forest firefighters at work ................................................................ xii5 Grenada 2005. Chainsaw milling, “ripping” after Hurricane Ivan
in 2004, using a jig and a Duromatic guidebar ..............................................xiv6 Salvage logging in progress. Note the messy and complex
working environment ......................................................................................... 37 Bahamas 2019, after Hurricane Dorian, a Category 5 hurricane ..................... 58 Cable yarding in progress in a forest damaged by a landslide.
Northern Italy 2019 ............................................................................................. 6
vi
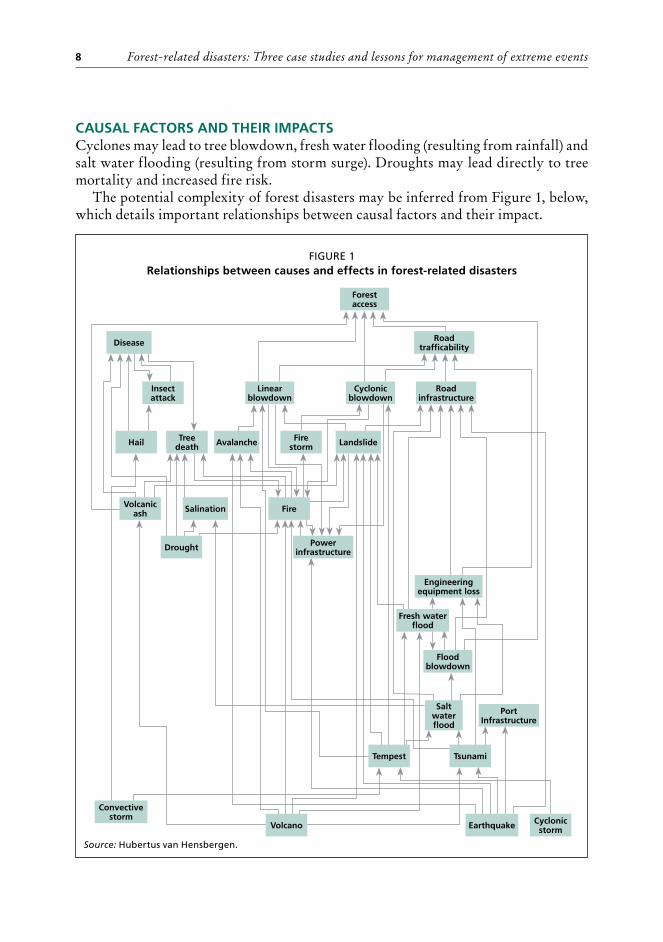
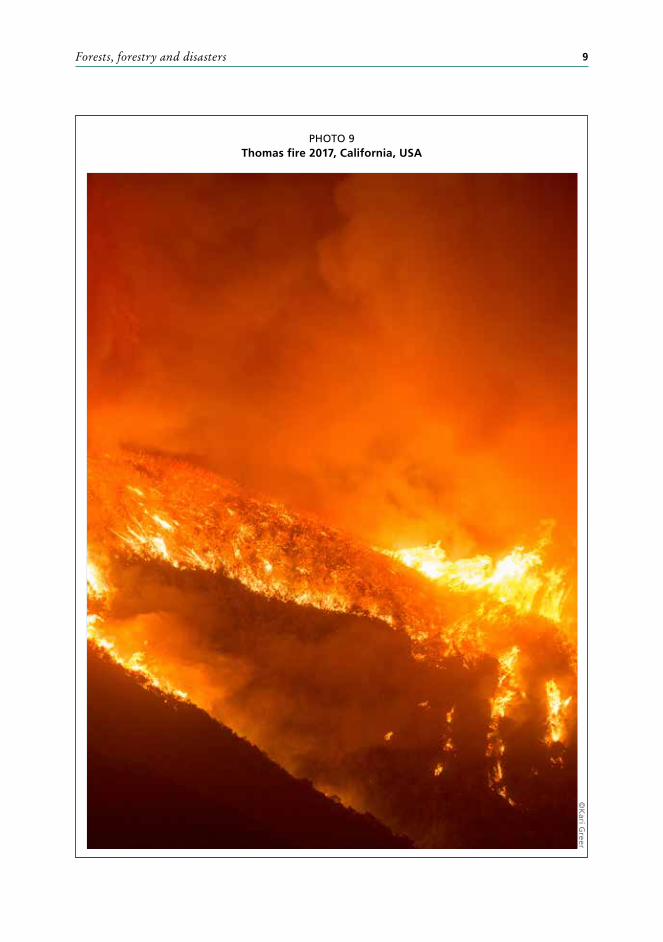
9 Thomas fire 2017, California, USA...................................................................... 910 Salvage logging is risky even for trained and properly equipped
workers; a Swedish worker salvaging timber after Gudrun in 2005 ............. 1211 A safer way of salvaging timber, harvester at work in a forest after a
landslide in northern Italy ................................................................................ 1312 Salvage logging in progress; note the use of wedges ................................... 1413 Tree blocking a road in Havana after a hurricane .......................................... 1614 Kosovo 2018. An example of conflicting interest ........................................... 2015 Post-Gudrun irrigated log storage of 800 000 m3 at Byholma Airport ........ 2216 Severe disturbances to logistics caused by the Gudrun tempest .................. 28
17 Fire at Gortin Glen, Mullaghcarn Area of Special Scientific Interest, Northern Ireland ............................................................................................... 29
18 Northern Italy 2019. Salvage logging after a major landslide....................... 30
19 An illustration of the severity of the event. Photo taken right after the Gudrun tempest in 2005 ............................................................................ 32
20 Trees were not only pushed over, they also snapped. A stand with heavy damage after the Gudrun tempest in January 2005 ........................... 33
21 Telecommunication and electricity breaks were rampant after the Gudrun tempest in January 2005 .............................................................. 33
22 The destruction seen from above. Sweden lost 75 million cubic metres in a couple of hours in January 2005 because of the Gudrun tempest ........ 38
23 Log storage. The logs were salvaged from areas affected by Gudrun ......... 4124 Clearing of roads after the Gudrun tempest in January 2005 required
massive efforts .................................................................................................. 4625 Boats and various other objects hurled into the coastal forests ................... 4726 Forest showing clear limit of damaged area after the tsunami .................... 4927 Coastal forest pushed down (Sendai city)....................................................... 4928 Surviving coastal forest (Ishinomaki city, March 12, 2011) ............................. 5029 Erosion control structures built by Arauco near Santa Olga to
safeguard water quality ................................................................................... 6030 Fire in the Whiskey Complex, Idaho, USA, 2014 ............................................. 6531 Dominica 2017, after hurricane Maria ............................................................. 6632 Dominica 2019, two years after the hurricane Maria ..................................... 6733 Burning boreal forest 2019, Fort Providence, Northwest Territories,
Canada ............................................................................................................... 6834 High clear stem height of trees in a surviving coastal forest
(Ishinomaki city) ................................................................................................ 7235 Montane forest in Dominica recovering after a hurricane ............................ 8436 Widespread and scattered fires in Mustang Complex, Idaho, USA, 2012 ....... 8737 Floodwater washed off the bark, Bahamas .................................................... 88
©Jo
nas C
ederg
ren
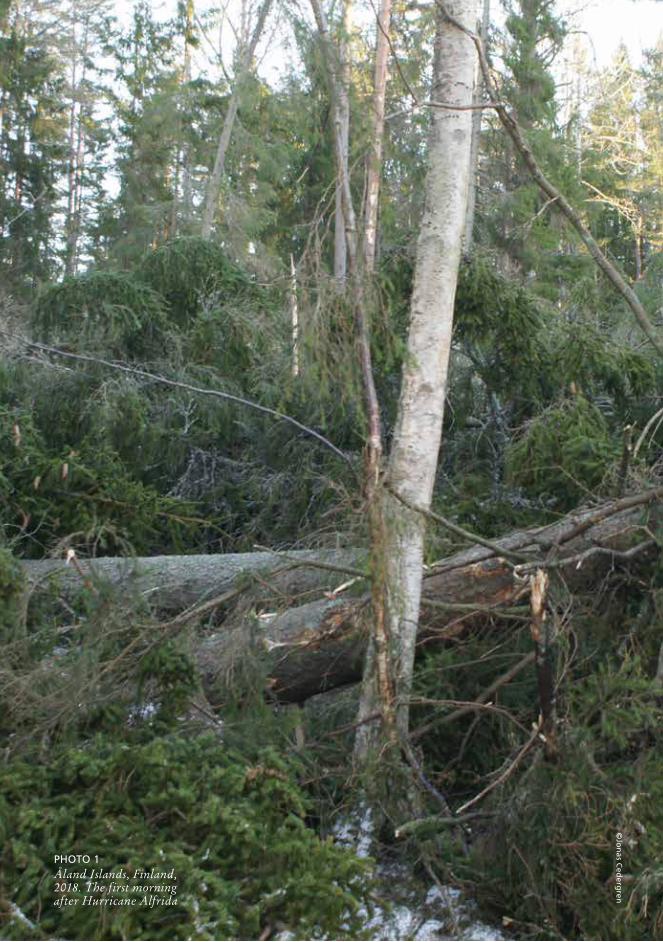
PHOTO 1Åland Islands, Finland, 2018. The first morning after Hurricane Alfrida

viii
Acknowledgements
This report contributes to Outcome 5.4 of FAO Strategic Programme 5, “building capacities for emergency preparedness and providing humanitarian assistance for saving livelihoods.” It is also relevant to a number of Sustainable Development Goals, particularly goals 11 (sustainable cities and communities), 13 (climate action) and 15 (life on land). Finally, it contributes to the implementation of the Sendai Framework for Disaster Risk Reduction, particularly priority areas 2 (Strengthening disaster risk governance to manage disaster risk) and 4 (Enhancing disaster preparedness for effective response and to “Build Back Better” in recovery, rehabilitation and reconstruction).
We thank Stephan Baas and Peter Moore of FAO for conducting a peer review of this paper.
Thanks to Annie Hildebrand for editing, Kate Ferrucci for design and layout and James Varah for proofreading.
PHOTO 2Roosevelt Fire 2018, Wyoming, USA
©K
ari G
reer
ix
Acronyms and abbreviations
BOD/COD The Biochemical Oxygen Demand: Chemical Oxygen Demand QuotaCAD Canadian dollarCITES Convention on International Trade in Endangered Species of Wild Fauna and FloraCONAF National Forest Corporation of Chile CSa Warm Mediterranean Climate ZoneCSb Temperate Mediterranean Climate ZoneCTBA Technical Centre for Wood and FurnitureDTM Displacement Tracking MatrixesECHO European Community Humanitarian Aid OfficeEmol Online news from ChileETC Emergency Telecommunications ClusterFAO Food and Agriculture Organization of the United NationsGDP Gross domestic productGIS Geographical information systemHCV High conservation valueICS Incident Command SystemINDAP Institute of Agricultural Development of ChileIPCC Intergovernmental Panel on Climate ChangeLEMA Lead Emergency Management Authority, European UnionLiDAR Light imaging, detection and rangingMSB Swedish Civil Contingencies AgencyNGI Norwegian Geological InstituteNWFP Non-wood forest productONEMI National Office of Emergency of the Interior Ministry, ChileOODA Observe, Orient, Decide, ActPROFOR The Program on ForestsSDG Sustainable Development GoalSP5 increase the resilience of livelihoods to threats and crisesUAV Unmanned aerial vehicleUNGA United Nations General AssemblyUNISDR United Nations Office for Disaster Risk ReductionUNSTATS United Nations Statistics DivisionUTC Coordinated Universal TimeWUI Wildland-Urban Interface
©Sö
ren
Ro
ng
e
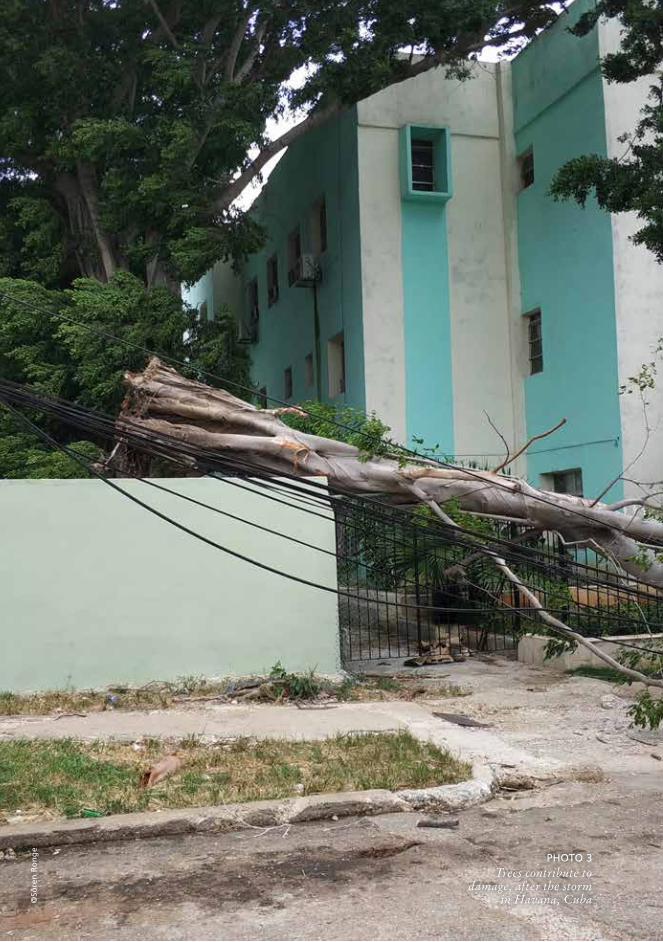
PHOTO 3Trees contribute to
damage, after the storm in Havana, Cuba
xi
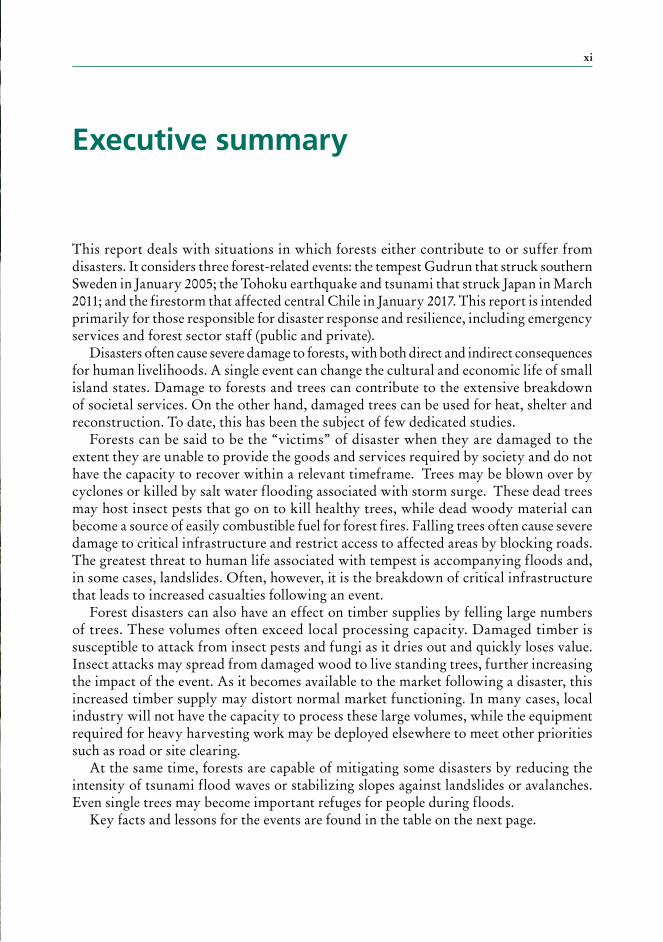
Executive summary
This report deals with situations in which forests either contribute to or suffer from disasters. It considers three forest-related events: the tempest Gudrun that struck southern Sweden in January 2005; the Tohoku earthquake and tsunami that struck Japan in March 2011; and the firestorm that affected central Chile in January 2017. This report is intended primarily for those responsible for disaster response and resilience, including emergency services and forest sector staff (public and private).
Disasters often cause severe damage to forests, with both direct and indirect consequences for human livelihoods. A single event can change the cultural and economic life of small island states. Damage to forests and trees can contribute to the extensive breakdown of societal services. On the other hand, damaged trees can be used for heat, shelter and reconstruction. To date, this has been the subject of few dedicated studies.
Forests can be said to be the “victims” of disaster when they are damaged to the extent they are unable to provide the goods and services required by society and do not have the capacity to recover within a relevant timeframe. Trees may be blown over by cyclones or killed by salt water flooding associated with storm surge. These dead trees may host insect pests that go on to kill healthy trees, while dead woody material can become a source of easily combustible fuel for forest fires. Falling trees often cause severe damage to critical infrastructure and restrict access to affected areas by blocking roads. The greatest threat to human life associated with tempest is accompanying floods and, in some cases, landslides. Often, however, it is the breakdown of critical infrastructure that leads to increased casualties following an event.
Forest disasters can also have an effect on timber supplies by felling large numbers of trees. These volumes often exceed local processing capacity. Damaged timber is susceptible to attack from insect pests and fungi as it dries out and quickly loses value. Insect attacks may spread from damaged wood to live standing trees, further increasing the impact of the event. As it becomes available to the market following a disaster, this increased timber supply may distort normal market functioning. In many cases, local industry will not have the capacity to process these large volumes, while the equipment required for heavy harvesting work may be deployed elsewhere to meet other priorities such as road or site clearing.
At the same time, forests are capable of mitigating some disasters by reducing the intensity of tsunami flood waves or stabilizing slopes against landslides or avalanches. Even single trees may become important refuges for people during floods.
Key facts and lessons for the events are found in the table on the next page.
xii
Key messages (see also the table, above) include the following:• To be effective, responses to forest-related disasters require advance planning. This
includes training individual responders, responder teams and response hierarchies. Training should be based on realistic simulations, and should have a high level of duplication so the system will remain resilient even if key personnel are unable to carry out their roles. In many cases the provision of regional engineering equipment pools – including forestry equipment for rapid deployment to disaster sites – would be beneficial.
• An important part of emergency preparation is the development of information about the location of critical resources. In the context of forest-related disasters this would include the contact details of key forestry staff, the location of forestry equipment, key access routes and sites for timber storage.
• It is not possible for small countries located in regions facing regular hazards to remain resilient by relying on their individual resources alone. In such cases there is a prima facie benefit to developing a cooperative regional disaster response capacity. In the forest sector this would include, for example, a pool of operators skilled in dealing with fallen timber, a joint equipment resource for forest work, joint disaster training and a unified incident control management system.
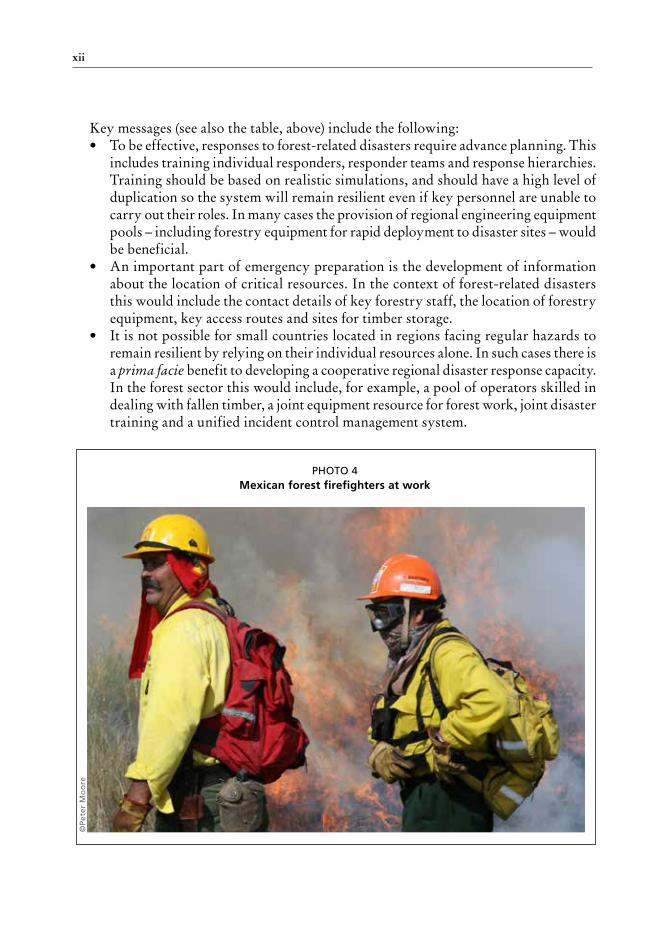
PHOTO 4Mexican forest firefighters at work
©Pe
ter
Mo
ore
xiii
• The use of forest resources following disasters should seek to balance immediate human needs against the longer-term environmental and biodiversity needs of the forest ecosystem. Fallen and damaged timber is both a local reconstruction resource and an economic asset. Because prior planning to determine how forest resources should be used after disasters is rarely undertaken, there is often no clear policy or regulation covering this type of use following an event.
• Salvaging timber after a disaster is very risky work. Forest workers must be trained in all aspects of the work they will be required to undertake in relation to clearing fallen timber and opening roads.
This paper seeks to contribute to the development of effective responses to forest-related disasters, an area that deserves further attention in both developing and developed countries.
©C
lau
s Ec
kelm
ann
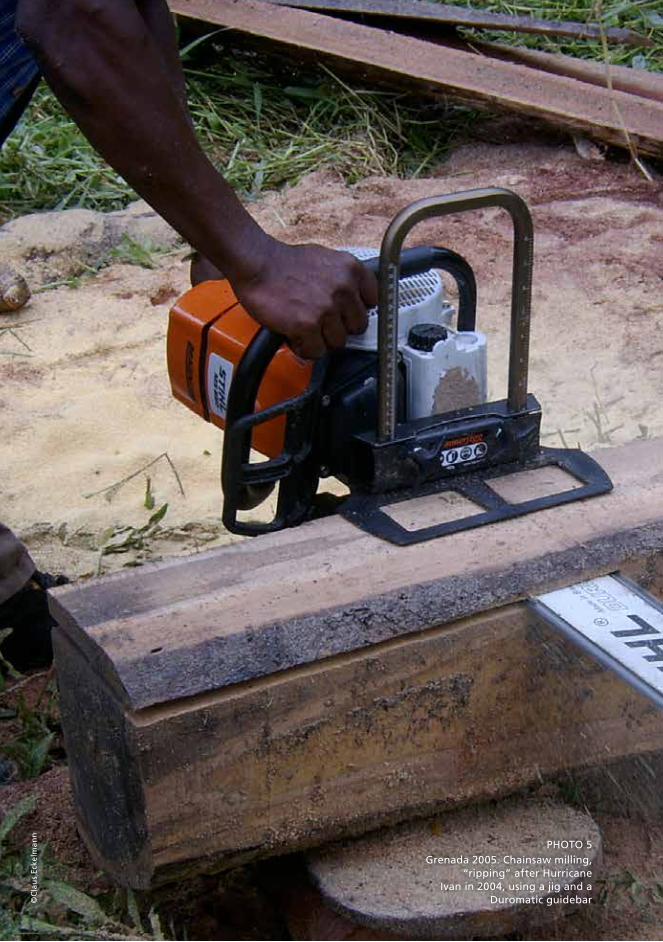
PHOTO 5Grenada 2005. Chainsaw milling,
“ripping” after Hurricane Ivan in 2004, using a jig and a
Duromatic guidebar
1
1 Introduction
ABOUT THIS REPORT This report provides an in-depth investigation into three forest-related disasters of different types (tempest, tsunami and fire) occurring in three different corners of the world (Sweden, Japan and Chile). Its overarching objective is to describe these events in some detail and investigate what lessons can be learned from them (e.g. preparedness, societal response and reconstruction). Reviews such as this one reveal gaps in data and knowledge and can assist in the formulation of efficient action programmes.
This report builds on previous work by the Food and Agriculture Organization of the United Nations (FAO) to address the issue of forest-related disasters (Moore, Cedergren and Sathyapala, 2017) and identifies shortcomings in current approaches to forest disasters in developing countries. These include a disproportionate focus on immediate disaster response and a failure to obtain the information required for forest recovery and restoration. The type, quality and quantity of information obtained following forest disasters vary significantly. There is, for example, a failure to recognize that forest damage can, in many cases, increase short-term timber production as fallen and damaged trees are recovered.
This report also provides a detailed chronology of events before and during the three disasters, examining their consequences and reflecting on lessons learned for both the forest sector and society more broadly. The role of trees, in mitigating as well as in contributing to damage, will also be considered.
This report is primarily intended for planners responsible for disaster response and resilience, including emergency services and forest sector staff (public and private). Response and resilience towards extreme events is likely to become part of forestry training and the present report has been written with this in mind. With time, it is hoped this report can be replaced by similar studies based on more relevant national conditions.
The report contributes to the Sendai Framework for Disaster Risk Reduction (United Nations Office for Disaster Risk Reduction [UNISDR], undated), which seeks the “substantial reduction of disaster risk and losses in lives, livelihoods and health and in economic, physical, social, cultural and environmental assets of persons, businesses, communities and countries.” This report seeks to contribute to two of the Framework’s seven targets:
• substantially increase the number of countries with national and local disaster risk reduction strategies by 2020; and
• substantially enhance international cooperation to developing countries through adequate and sustainable support to complement their national actions for implementation of the Framework by 2030.
In addition, this report aims to contribute to two of the Framework’s priority areas for action:
Forest-related disasters: Three case studies and lessons for management of extreme events2
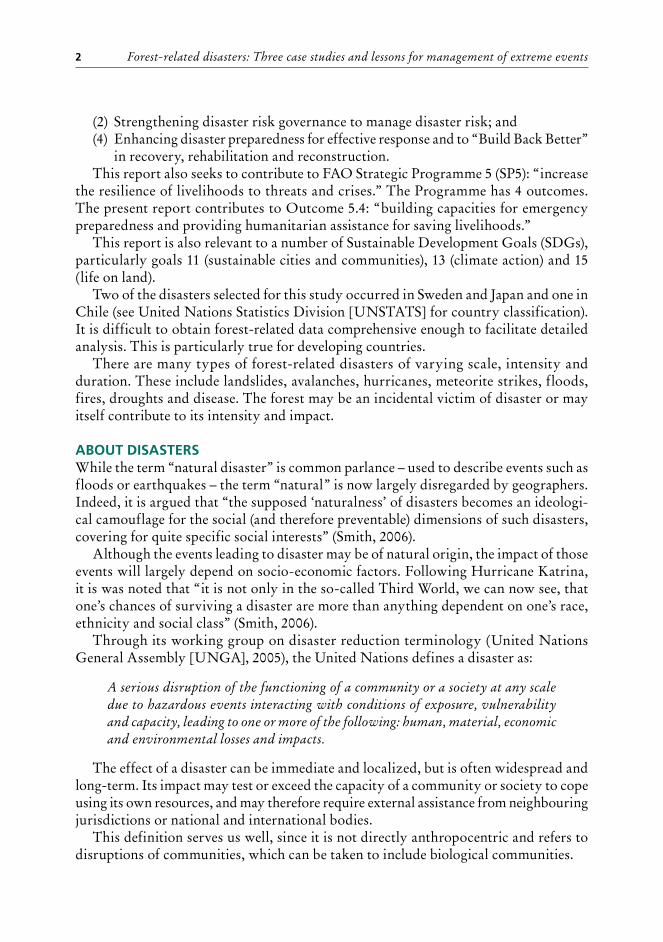
(2) Strengthening disaster risk governance to manage disaster risk; and(4) Enhancing disaster preparedness for effective response and to “Build Back Better”
in recovery, rehabilitation and reconstruction.This report also seeks to contribute to FAO Strategic Programme 5 (SP5): “increase
the resilience of livelihoods to threats and crises.” The Programme has 4 outcomes. The present report contributes to Outcome 5.4: “building capacities for emergency preparedness and providing humanitarian assistance for saving livelihoods.”
This report is also relevant to a number of Sustainable Development Goals (SDGs), particularly goals 11 (sustainable cities and communities), 13 (climate action) and 15 (life on land).
Two of the disasters selected for this study occurred in Sweden and Japan and one in Chile (see United Nations Statistics Division [UNSTATS] for country classification). It is difficult to obtain forest-related data comprehensive enough to facilitate detailed analysis. This is particularly true for developing countries.
There are many types of forest-related disasters of varying scale, intensity and duration. These include landslides, avalanches, hurricanes, meteorite strikes, floods, fires, droughts and disease. The forest may be an incidental victim of disaster or may itself contribute to its intensity and impact.
ABOUT DISASTERSWhile the term “natural disaster” is common parlance – used to describe events such as floods or earthquakes – the term “natural” is now largely disregarded by geographers. Indeed, it is argued that “the supposed ‘naturalness’ of disasters becomes an ideologi-cal camouflage for the social (and therefore preventable) dimensions of such disasters, covering for quite specific social interests” (Smith, 2006).
Although the events leading to disaster may be of natural origin, the impact of those events will largely depend on socio-economic factors. Following Hurricane Katrina, it is was noted that “it is not only in the so-called Third World, we can now see, that one’s chances of surviving a disaster are more than anything dependent on one’s race, ethnicity and social class” (Smith, 2006).
Through its working group on disaster reduction terminology (United Nations General Assembly [UNGA], 2005), the United Nations defines a disaster as:
A serious disruption of the functioning of a community or a society at any scale due to hazardous events interacting with conditions of exposure, vulnerability and capacity, leading to one or more of the following: human, material, economic and environmental losses and impacts.
The effect of a disaster can be immediate and localized, but is often widespread and long-term. Its impact may test or exceed the capacity of a community or society to cope using its own resources, and may therefore require external assistance from neighbouring jurisdictions or national and international bodies.
This definition serves us well, since it is not directly anthropocentric and refers to disruptions of communities, which can be taken to include biological communities.

Introduction 3
BOX 1
Overview of natural disaster figures for the first half of 2019
• A total of 370 loss events produced overall losses of USD 42 billion which, after adjust-
ment for inflation, is lower than the 30-year average of USD 69 billion. However, the
losses caused by severe floods in southeast China, which began in June and reportedly
caused billions of dollars in damage, are not included in this figure.
• Insured losses came to USD 15 billion, below the long-term average of USD 18 billion.
For many events, the insured portion of the overall economic loss was extremely small
due to low insurance penetration in many affected countries.
• Around 4 200 people lost their lives in natural disasters, a figure similar to the previ-
ous year (approximately 4 300). But the trend towards fewer casualties has continued,
thanks to more effective protection measures: the 30-year average for the same half-
year period is more than 27 000 fatalities.
• The deadliest disaster worldwide up to the end of June was Cyclone Idai, which swept
across Mozambique, Malawi, Zimbabwe and South Africa from 9 to 14 March. More
than 1 000 people were killed.
• In May, thunderstorms with tornadoes in the Midwestern United States produced the
heaviest losses, at USD 3.3 billion. The insured portion came to around USD 2.5 billion.
Source: Munich Reinsurance Company, undated.
PHOTO 6Salvage logging in progress. Note the messy and complex working environment
©M
ats Samu
elsson
/Söd
ra Forest O
wn
ers Asso
ciation
, Swed
en
Forest-related disasters: Three case studies and lessons for management of extreme events4
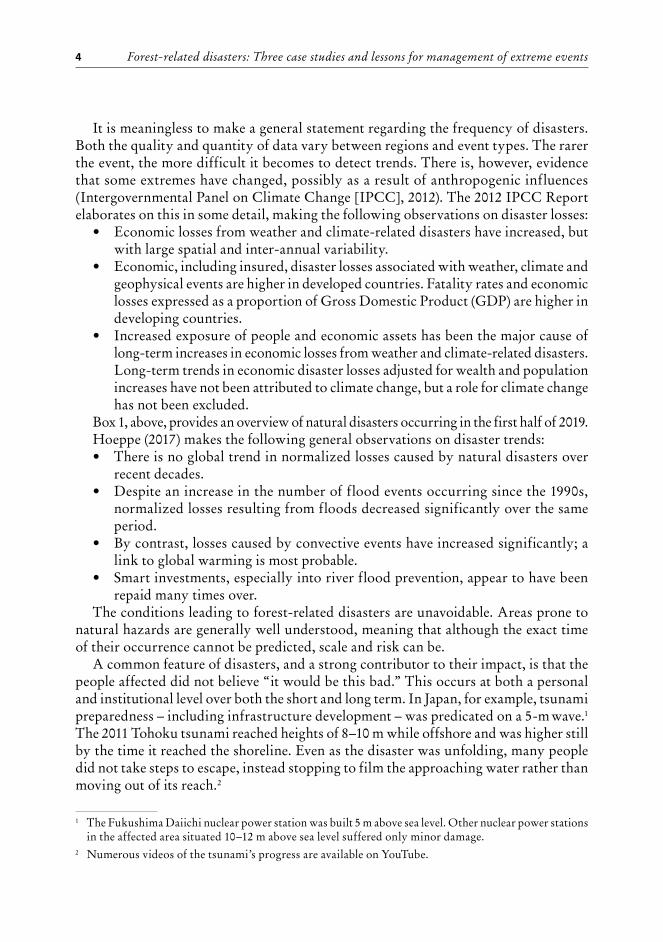
It is meaningless to make a general statement regarding the frequency of disasters. Both the quality and quantity of data vary between regions and event types. The rarer the event, the more difficult it becomes to detect trends. There is, however, evidence that some extremes have changed, possibly as a result of anthropogenic influences (Intergovernmental Panel on Climate Change [IPCC], 2012). The 2012 IPCC Report elaborates on this in some detail, making the following observations on disaster losses:
• Economic losses from weather and climate-related disasters have increased, but with large spatial and inter-annual variability.
• Economic, including insured, disaster losses associated with weather, climate and geophysical events are higher in developed countries. Fatality rates and economic losses expressed as a proportion of Gross Domestic Product (GDP) are higher in developing countries.
• Increased exposure of people and economic assets has been the major cause of long-term increases in economic losses from weather and climate-related disasters. Long-term trends in economic disaster losses adjusted for wealth and population increases have not been attributed to climate change, but a role for climate change has not been excluded.
Box 1, above, provides an overview of natural disasters occurring in the first half of 2019.Hoeppe (2017) makes the following general observations on disaster trends:• There is no global trend in normalized losses caused by natural disasters over
recent decades.• Despite an increase in the number of flood events occurring since the 1990s,
normalized losses resulting from floods decreased significantly over the same period.
• By contrast, losses caused by convective events have increased significantly; a link to global warming is most probable.
• Smart investments, especially into river flood prevention, appear to have been repaid many times over.
The conditions leading to forest-related disasters are unavoidable. Areas prone to natural hazards are generally well understood, meaning that although the exact time of their occurrence cannot be predicted, scale and risk can be.
A common feature of disasters, and a strong contributor to their impact, is that the people affected did not believe “it would be this bad.” This occurs at both a personal and institutional level over both the short and long term. In Japan, for example, tsunami preparedness – including infrastructure development – was predicated on a 5-m wave.1 The 2011 Tohoku tsunami reached heights of 8–10 m while offshore and was higher still by the time it reached the shoreline. Even as the disaster was unfolding, many people did not take steps to escape, instead stopping to film the approaching water rather than moving out of its reach.2
1 The Fukushima Daiichi nuclear power station was built 5 m above sea level. Other nuclear power stations in the affected area situated 10–12 m above sea level suffered only minor damage.
2 Numerous videos of the tsunami’s progress are available on YouTube.
Introduction 5
A similar lack of preparedness was evident in the cases of Cyclone Gudrun, the fires in Chile and, most recently, Cyclone Idai in Mozambique. The correct organizational approach in analogous cases is to prepare for the worst but hope for the best. There are clearly costs associated with increased preparedness and these must be balanced against the risks. Improved warning systems, in terms of both timing and magnitude, will have a commensurate impact on risk preparedness: while the hazard itself cannot be avoided in most cases, a proper response will mitigate its impact.
Fires, pests and diseases differ from other types of disaster in that they are relatively slow-moving and their impact may play out over periods ranging from days to years. Timely intervention can significantly reduce their impact on forests and the natural and social environment more broadly. Similarly, the short term impact of a tropical cyclone will often be followed by a more slowly developing flood episode, which can be mitigated to some extent with the right interventions.
Due to their potential impact on the built infrastructure and the ability to direct, if not control, the development of fires, fire preparedness has received the greatest amount of attention in terms of strategic approaches. This has led to high levels of preparedness and a truly strategic approach to forest fire in some countries. Nevertheless, problems remain, even in countries such as the United States of America, which arguably has the world’s most developed fire preparedness system. This is particularly stark in rural-urban areas due to cultural differences and potential conflict between urban and forest fire management objectives (Pyne, 2018).
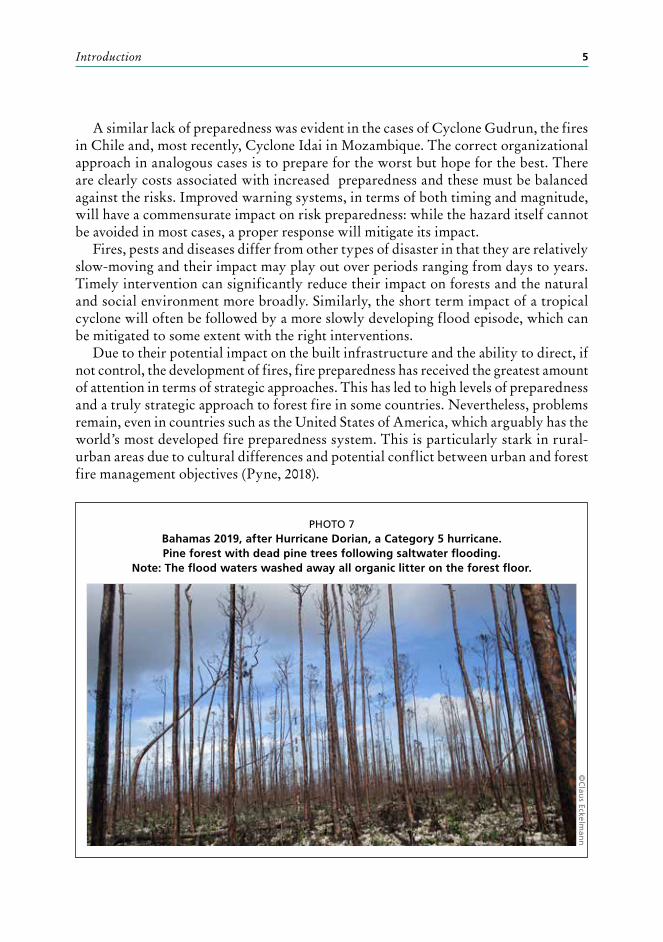
PHOTO 7Bahamas 2019, after Hurricane Dorian, a Category 5 hurricane. Pine forest with dead pine trees following saltwater flooding.
Note: The flood waters washed away all organic litter on the forest floor.
©C
laus Eckelm
ann
©R
affa
ele
Spin
elli
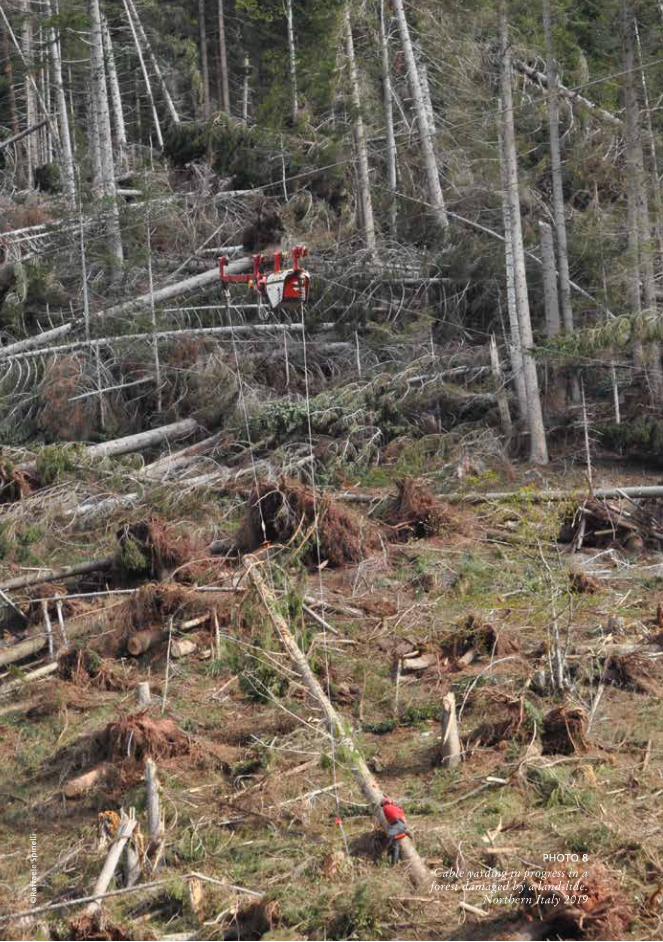
PHOTO 8Cable yarding in progress in a forest damaged by a landslide.
Northern Italy 2019
7
2 Forests, forestry and disasters
For many years, discussion of forest dynamics was dominated by the apparent dichotomy between small- and large-scale forest disturbances. In the case of the former, regenera-tion took place in canopy gaps, while large-scale disturbances (disasters) opened up enormous areas of canopy (McCarthy, 2001). More recently, this apparent dichotomy has been shown to be more of a gradient, whereby forests are exposed to a mix of gap-related and event-related impacts. The inland Amazon basin, for example, considered by many to have forest dynamics dominated by single tree gap events, has been shown to be affected by large-scale disturbances (up to 3 500 ha) resulting from storm downdraft blowdowns (Garstang, White and Shugart, 1998; Magnabosco Marra, Trumbore and Higuchi, 2018). Exactly one week after Storm Gudrun devastated forests in southern Sweden, blowing down the equivalent of 70 million mature trees, a single strong squall line crossed the Amazon basin. The storm downbursts caused numerous blowdowns ranging in area from >1 ha to <30 ha (Negrón-Juárez et al., 2010). In total, an estimated 300 to 600 million trees were blown down. On the other hand, small-scale gap dynamics important for maintenance of diversity in boreal systems can be seen as “nested” in the intervals between large-scale events such as fire or disease. Gap-causing events may also expose the forest to forces leading to much larger scale forest loss (Worrall, Lee and Harrington, 2004). The large-scale disruption caused by extreme events such as hurricanes does, however, appear to be an important factor in maintaining the long-term diversity of the forest system (Vandermeer et al., 2010).
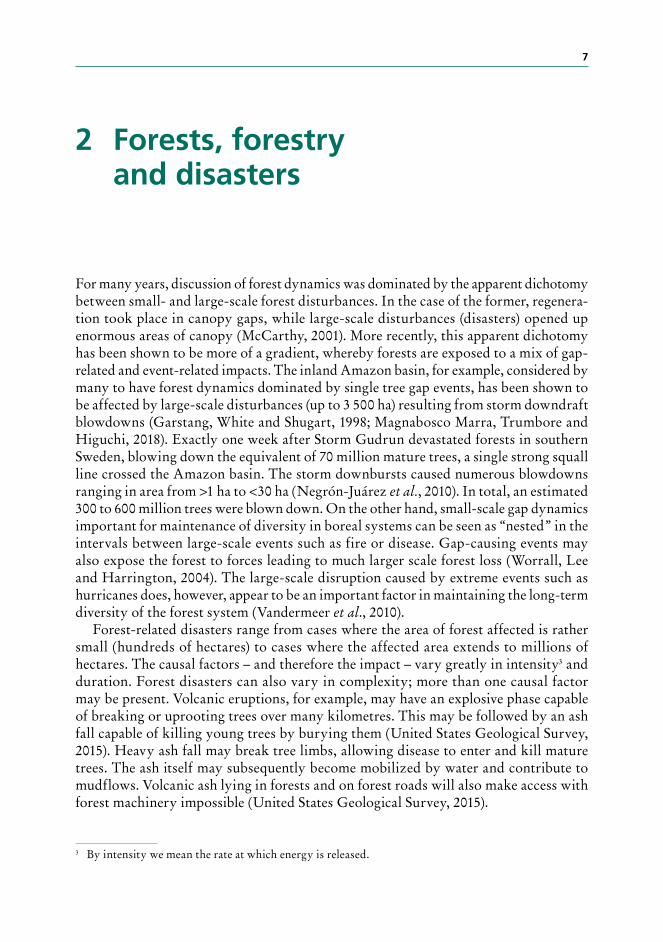
Forest-related disasters range from cases where the area of forest affected is rather small (hundreds of hectares) to cases where the affected area extends to millions of hectares. The causal factors – and therefore the impact – vary greatly in intensity3 and duration. Forest disasters can also vary in complexity; more than one causal factor may be present. Volcanic eruptions, for example, may have an explosive phase capable of breaking or uprooting trees over many kilometres. This may be followed by an ash fall capable of killing young trees by burying them (United States Geological Survey, 2015). Heavy ash fall may break tree limbs, allowing disease to enter and kill mature trees. The ash itself may subsequently become mobilized by water and contribute to mudflows. Volcanic ash lying in forests and on forest roads will also make access with forest machinery impossible (United States Geological Survey, 2015).
3 By intensity we mean the rate at which energy is released.
Forest-related disasters: Three case studies and lessons for management of extreme events8
FIGURE 1Relationships between causes and effects in forest-related disasters
CAUSAL FACTORS AND THEIR IMPACTSCyclones may lead to tree blowdown, fresh water flooding (resulting from rainfall) and salt water flooding (resulting from storm surge). Droughts may lead directly to tree mortality and increased fire risk.
The potential complexity of forest disasters may be inferred from Figure 1, below, which details important relationships between causal factors and their impact.
Road trafficabilityDisease
Insect attack
Linear blowdown
Road infrastructure
Forest access
Cyclonic blowdown
Tree death Avalanche LandslideHail Fire
storm
SalinationVolcanic ash Fire
Drought Power infrastructure
Flood blowdown
Port Infrastructure
Engineering equipment loss
Salt water flood
Tsunami
Cyclonic stormVolcano Earthquake
Tempest
Convective storm
Fresh water flood
Source: Hubertus van Hensbergen.
Forests, forestry and disasters 9
PHOTO 9Thomas fire 2017, California, USA
©K
ari Greer
Forest-related disasters: Three case studies and lessons for management of extreme events10
In most disaster types, fire is either a primary cause or a secondary risk. Any type of event that concentrates the woody fuel in a small area will increase both the probability and severity of fire events, leading to a greatly increased hazard.
Many types of disaster involving forests will impact both power and road infrastructure. This will hamper both direct and electronic communication until the area can be cleared of debris and/or infrastructure can be repaired.
The rectangular boxes in Figure 1 indicate the causes of hazards, while the hexagonal boxes indicate their impacts. Some impacts will in turn become hazards, causing further impacts.
Forests (with some exceptions where the soil resource is lost, destroyed or damaged) are generally well able to recover from even extreme disturbances on their own terms and in their own time.
The terms under which a forest falls victim to disaster can therefore be seen as anthropocentric. Forests can be said to become victims when they are no longer able to provide the range of goods and services required by human society, including playing a role as critical infrastructure. An event can be considered a forest disaster when local resources are inadequate to return a forest to its desired productive state within a relevant timeframe.
Forests can contribute to the impact of disasters in a number of ways. In the case of forest fires, the forest may be the largest single contributor to disasters affecting both biological and human communities. In other cases, forests may be an important secondary contributor. Uprooted forest trees, as well as stacked logs, often get caught up in floodwater and are washed downstream where they become caught on bridges and weirs. This causes increased flooding and may bring down bridges and other structures.
There are many types of forest-related disasters of varying scale, intensity and duration, ranging from landslides and avalanches to hurricanes, meteorite strike, floods, fires, droughts and disease (amongst others). The forest may be an incidental victim of disaster or may itself contribute to the intensity and impact of the disaster.
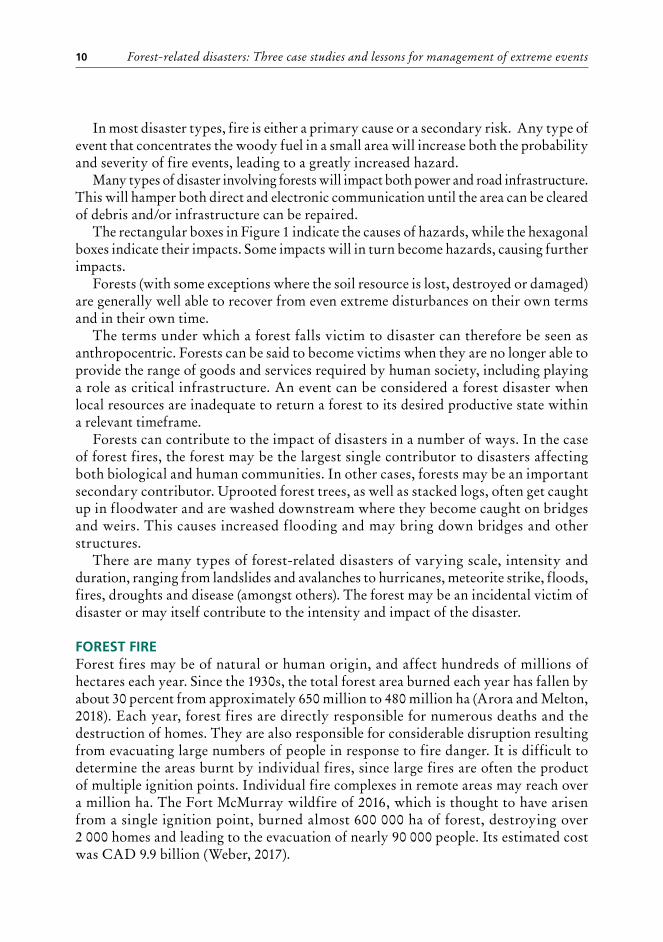
FOREST FIREForest fires may be of natural or human origin, and affect hundreds of millions of hectares each year. Since the 1930s, the total forest area burned each year has fallen by about 30 percent from approximately 650 million to 480 million ha (Arora and Melton, 2018). Each year, forest fires are directly responsible for numerous deaths and the destruction of homes. They are also responsible for considerable disruption resulting from evacuating large numbers of people in response to fire danger. It is difficult to determine the areas burnt by individual fires, since large fires are often the product of multiple ignition points. Individual fire complexes in remote areas may reach over a million ha. The Fort McMurray wildfire of 2016, which is thought to have arisen from a single ignition point, burned almost 600 000 ha of forest, destroying over 2 000 homes and leading to the evacuation of nearly 90 000 people. Its estimated cost was CAD 9.9 billion (Weber, 2017).
Forests, forestry and disasters 11
Although the total area affected by fires is highest in Africa (United Press International, 2006), there is relatively little reporting available on these fires (with the exception of South Africa). The reporting on a fire affecting 15 000 ha of rainforest in the Democratic Republic of the Congo in early 2016 is one exception to this (Erickson-Davis, 2016).
Most forest fires would not be classified as human disasters (although some are certainly human tragedies). The largest, most devastating, fires predominantly occur in countries with sufficient resources to recover without outside assistance. (A notable exception was the Fort McMurray fire of 2016, during which the Canadian government was criticized for failing to accept offers of international assistance.)4
Damage caused by forest fires ranges from individual to large-scale infrastructure damage such as power networks and water supplies.
Smoke from fires may cause damage remotely by impacting air quality. The Indonesian forest fires of 2015 are estimated to have resulted in the premature deaths of 100 000 people (Koplitz et al., 2016) based on models linking mortality to air quality.
Notably, there is considerable controversy surrounding the role of forest management systems and/or methods in relation to fire disasters. It is, however, beyond question that fuel load reduction using a range of management interventions can reduce the risks associated with fire in some cases (Schultz and Moseley, 2018).
In addition, there is a misperception that forest fires are an increasing problem and all forest fire is bad. In fact, humans have coexisted with forest fires for millennia and most forest fire events are considered a normal part of the annual cycle. Moreover, in recent decades the global area affected by wildfire has fallen (Doerr and Santı́ n, 2016).
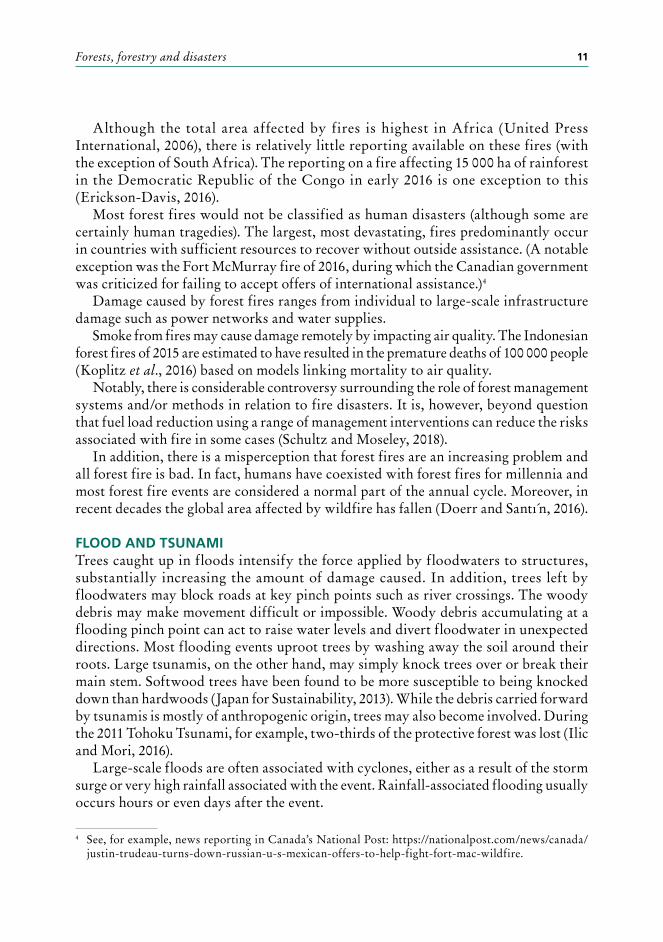
FLOOD AND TSUNAMITrees caught up in floods intensify the force applied by floodwaters to structures, substantially increasing the amount of damage caused. In addition, trees left by floodwaters may block roads at key pinch points such as river crossings. The woody debris may make movement difficult or impossible. Woody debris accumulating at a flooding pinch point can act to raise water levels and divert floodwater in unexpected directions. Most flooding events uproot trees by washing away the soil around their roots. Large tsunamis, on the other hand, may simply knock trees over or break their main stem. Softwood trees have been found to be more susceptible to being knocked down than hardwoods (Japan for Sustainability, 2013). While the debris carried forward by tsunamis is mostly of anthropogenic origin, trees may also become involved. During the 2011 Tohoku Tsunami, for example, two-thirds of the protective forest was lost (Ilic and Mori, 2016).
Large-scale floods are often associated with cyclones, either as a result of the storm surge or very high rainfall associated with the event. Rainfall-associated flooding usually occurs hours or even days after the event.
4 See, for example, news reporting in Canada’s National Post: https://nationalpost.com/news/canada/justin-trudeau-turns-down-russian-u-s-mexican-offers-to-help-fight-fort-mac-wildfire.
Forest-related disasters: Three case studies and lessons for management of extreme events12
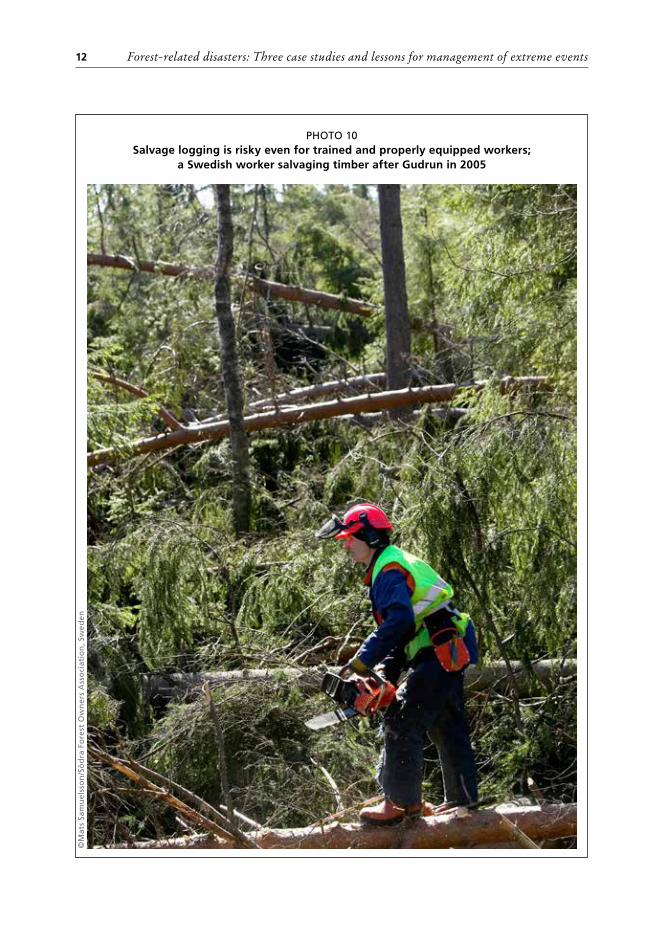
PHOTO 10Salvage logging is risky even for trained and properly equipped workers;
a Swedish worker salvaging timber after Gudrun in 2005
©M
ats
Sam
uel
sso
n/S
öd
ra F
ore
st O
wn
ers
Ass
oci
atio
n, S
wed
en

Forests, forestry and disasters 13
PHOTO 11A safer way of salvaging timber, harvester at work in a forest
after a landslide in northern Italy
© R
affaele Spin
elli
In other cases, flooding may be associated with specific weather conditions, such as the South African floods of 1987, caused by a “cut-off” low-pressure system, which deposited 900 mm over a wide area of KwaZulu-Natal in just three days (Singleton and Reason, 2006). The floods caused more than 300 deaths, disrupting the drinking water supply to Durban and destroying around 50 000 houses (Grobler, 2003).
Forest-related disasters: Three case studies and lessons for management of extreme events14
TEMPESTThe word “tempest” has been chosen to include all situations in which high wind speed is a major contributing factor to the evolution of a disaster. This includes hurricanes, typhoons, tornados and all other high wind events. The majority of destructive high wind events are cyclonic in origin (Schneider, 1996). Straight-line winds caused by thunderstorm downbursts are more localized but can generate wind speeds in excess of 200 km/h and cause extensive damage (Brooks and Doswell, 1993).
Wind damage to forests can be caused by both cyclonic winds and non-cyclonic thunderstorm downbursts. The weather conditions leading to high winds are often associated with other potentially damaging factors such as high rainfall, lightning and hail.
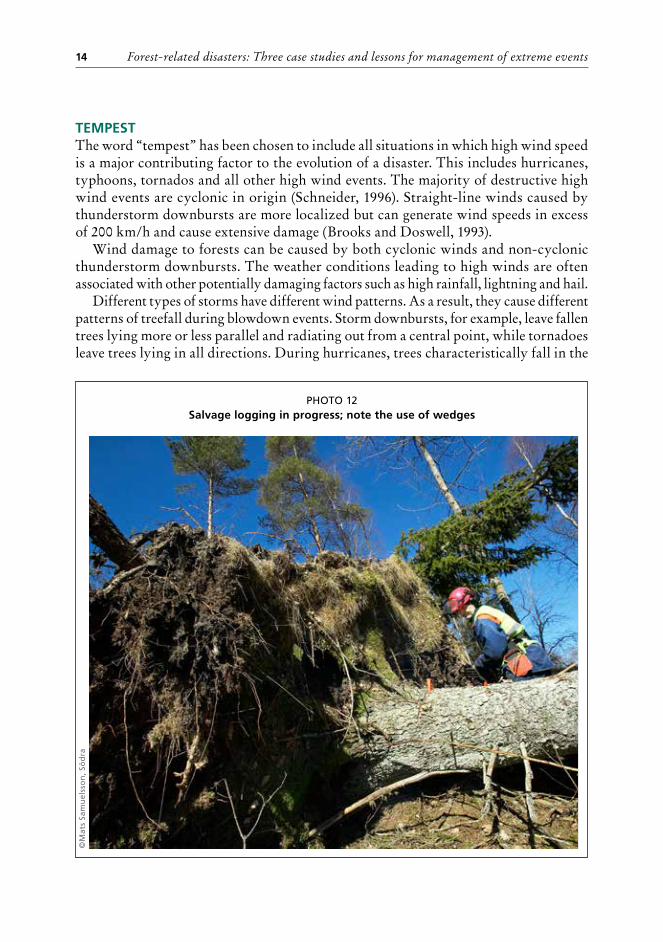
Different types of storms have different wind patterns. As a result, they cause different patterns of treefall during blowdown events. Storm downbursts, for example, leave fallen trees lying more or less parallel and radiating out from a central point, while tornadoes leave trees lying in all directions. During hurricanes, trees characteristically fall in the
PHOTO 12Salvage logging in progress; note the use of wedges
©M
ats
Sam
uel
sso
n, S
öd
ra
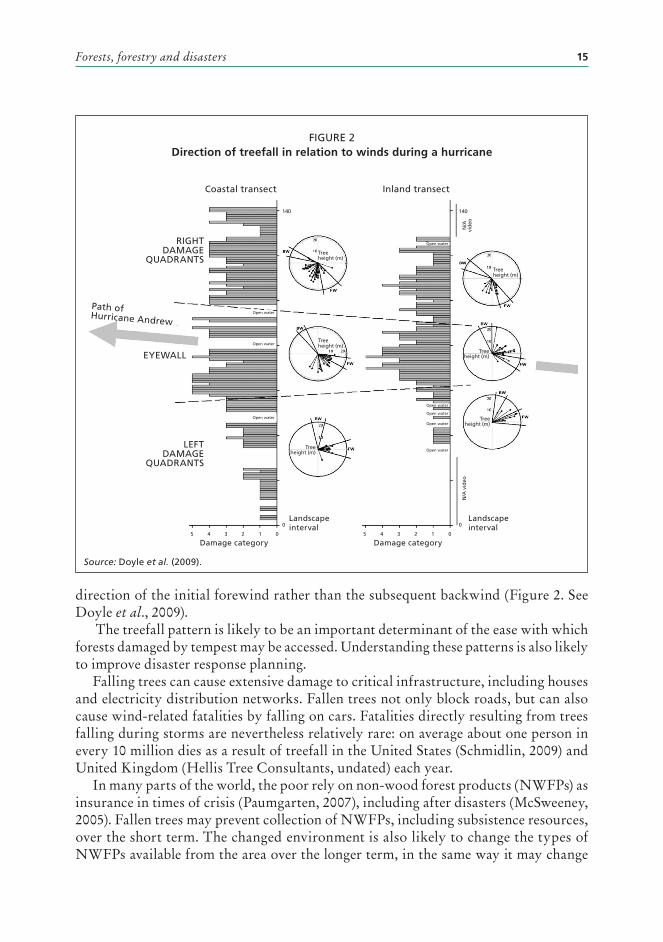
Forests, forestry and disasters 15
direction of the initial forewind rather than the subsequent backwind (Figure 2. See Doyle et al., 2009).
The treefall pattern is likely to be an important determinant of the ease with which forests damaged by tempest may be accessed. Understanding these patterns is also likely to improve disaster response planning.
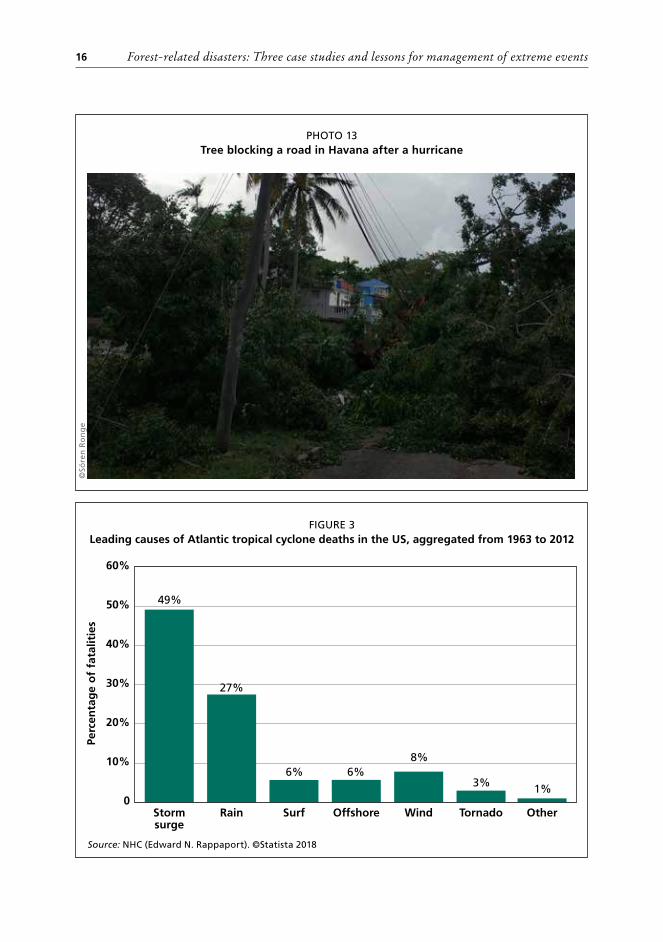
Falling trees can cause extensive damage to critical infrastructure, including houses and electricity distribution networks. Fallen trees not only block roads, but can also cause wind-related fatalities by falling on cars. Fatalities directly resulting from trees falling during storms are nevertheless relatively rare: on average about one person in every 10 million dies as a result of treefall in the United States (Schmidlin, 2009) and United Kingdom (Hellis Tree Consultants, undated) each year.
In many parts of the world, the poor rely on non-wood forest products (NWFPs) as insurance in times of crisis (Paumgarten, 2007), including after disasters (McSweeney, 2005). Fallen trees may prevent collection of NWFPs, including subsistence resources, over the short term. The changed environment is also likely to change the types of NWFPs available from the area over the longer term, in the same way it may change
FIGURE 2Direction of treefall in relation to winds during a hurricane
Coastal transect
Path of Hurricane Andrew
RIGHT DAMAGE
QUADRANTS
LEFT DAMAGE
QUADRANTS
EYEWALL
Inland transect
Tree height (m)
Tree height (m)
Tree height (m)
Tree height (m)
Tree height (m)
Tree height (m)
N/A
vid
eoN
/A
vid
eo
140140
Open water
Open water
Open waterOpen water
Open water
Open water
Open water
Open water
Landscape interval
Landscape interval
Damage categoryDamage category5 54 43 32 21 10 0
0 0
Source: Doyle et al. (2009).
Forest-related disasters: Three case studies and lessons for management of extreme events16
PHOTO 13Tree blocking a road in Havana after a hurricane
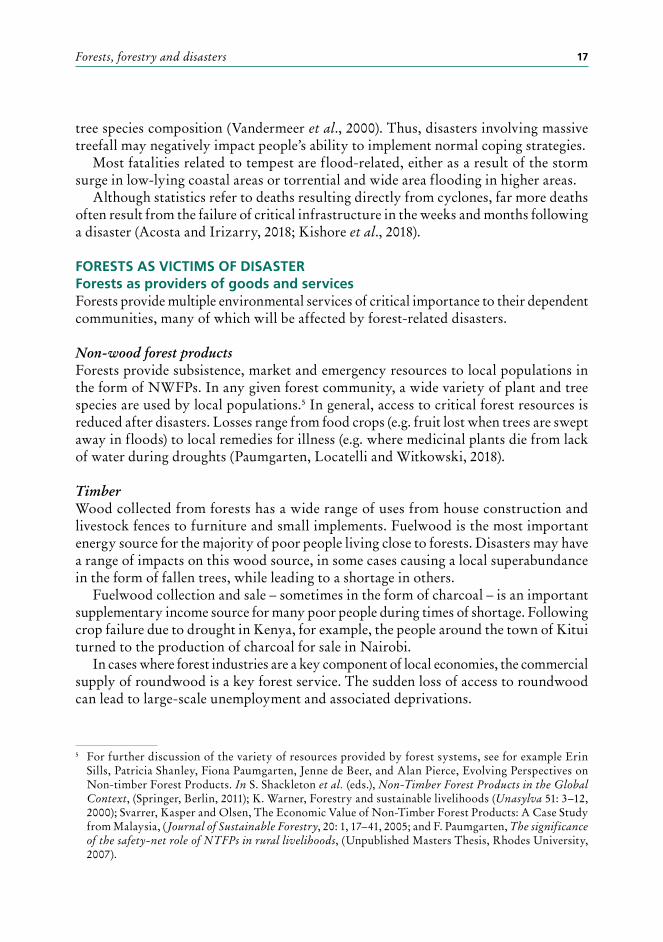
FIGURE 3Leading causes of Atlantic tropical cyclone deaths in the US, aggregated from 1963 to 2012
Source: NHC (Edward N. Rappaport). ©Statista 2018
0
60%
49%
27%
6% 6%8%
3% 1%
40%
50%
30%
20%
10%
Perc
enta
ge
of
fata
litie
s
Storm surge
Offshore Wind TornadoRain Surf Other
©Sö
ren
Ro
ng
e
Forests, forestry and disasters 17
tree species composition (Vandermeer et al., 2000). Thus, disasters involving massive treefall may negatively impact people’s ability to implement normal coping strategies.
Most fatalities related to tempest are flood-related, either as a result of the storm surge in low-lying coastal areas or torrential and wide area flooding in higher areas.
Although statistics refer to deaths resulting directly from cyclones, far more deaths often result from the failure of critical infrastructure in the weeks and months following a disaster (Acosta and Irizarry, 2018; Kishore et al., 2018).
FORESTS AS VICTIMS OF DISASTER Forests as providers of goods and servicesForests provide multiple environmental services of critical importance to their dependent communities, many of which will be affected by forest-related disasters.
Non-wood forest products Forests provide subsistence, market and emergency resources to local populations in the form of NWFPs. In any given forest community, a wide variety of plant and tree species are used by local populations.5 In general, access to critical forest resources is reduced after disasters. Losses range from food crops (e.g. fruit lost when trees are swept away in floods) to local remedies for illness (e.g. where medicinal plants die from lack of water during droughts (Paumgarten, Locatelli and Witkowski, 2018).
TimberWood collected from forests has a wide range of uses from house construction and livestock fences to furniture and small implements. Fuelwood is the most important energy source for the majority of poor people living close to forests. Disasters may have a range of impacts on this wood source, in some cases causing a local superabundance in the form of fallen trees, while leading to a shortage in others.
Fuelwood collection and sale – sometimes in the form of charcoal – is an important supplementary income source for many poor people during times of shortage. Following crop failure due to drought in Kenya, for example, the people around the town of Kitui turned to the production of charcoal for sale in Nairobi.
In cases where forest industries are a key component of local economies, the commercial supply of roundwood is a key forest service. The sudden loss of access to roundwood can lead to large-scale unemployment and associated deprivations.
5 For further discussion of the variety of resources provided by forest systems, see for example Erin Sills, Patricia Shanley, Fiona Paumgarten, Jenne de Beer, and Alan Pierce, Evolving Perspectives on Non-timber Forest Products. In S. Shackleton et al. (eds.), Non-Timber Forest Products in the Global Context, (Springer, Berlin, 2011); K. Warner, Forestry and sustainable livelihoods (Unasylva 51: 3–12, 2000); Svarrer, Kasper and Olsen, The Economic Value of Non-Timber Forest Products: A Case Study from Malaysia, (Journal of Sustainable Forestry, 20: 1, 17–41, 2005; and F. Paumgarten, The significance of the safety-net role of NTFPs in rural livelihoods, (Unpublished Masters Thesis, Rhodes University, 2007).
Forest-related disasters: Three case studies and lessons for management of extreme events18
WaterForests play an important role in the regulation of local hydrological systems. While the role of forests in large-scale water regulation is overstated, they have the ability to reduce sediment and chemical pollutant in downstream water by reducing erosion and filtering water that enters streams by overland and subsurface flow (Calder et al., 2007). On its own, deforestation has a generally positive impact on catchment water yield, but subsequent land use that reduces water infiltration may increase stormflow and reduce baseflow (dry season flow) (Bruijnzeel, 2004). In most cases, disasters are not associated with land-use change sufficient to cause reduced infiltration. However, flooding by fresh and salt water is likely to lead to erosion, as well as salination and sedimentation of water supplies.
Fires can create water repellency in soil (DeBano, 2000), which for a limited period after fire limits the rate of water infiltration and increases surface flow (Granged et al., 2011). This surface flow can cause erosion and decrease the quality of water entering rivers (Doerr, Shakesby and Macdonald, 2011). Soil sealing with ash or sediment particles following fire may also lead to poor water infiltration (Larsen et al., 2009).
MicroclimateForest cover has a profound effect on microclimate variables (Chen et al., 1999). Inside the forest canopy temperatures are lower during the day and higher at night, while humidity is higher and wind speeds are lower than outside forest systems.
The opening of the forest canopy as a result of tempest exposes local populations to increased heat stress likely to lead to an increased demand for water. The changed climatic regime also affects plants and animals that may be important NWFPs.
In Guinea, local populations create forest patches around their villages to provide multiple services including microclimate, food and other resources.
The forest cover also provides protection in times of war (Fairhead and Leach, 1996). Similarly, people in the Republic of South Sudan retreated from their villages and sought safety in distant forests during long periods of civil war over the last 35 years.
Forest disasters and timber supplyAll forest disasters will inflict significant damage on large volumes of timber. Pest and disease outbreaks, fire and drought will result in standing dead trees. Storms, firestorms, landslides and tsunamis will leave fallen trees lying on the ground or in some cases partly fallen or leaning dangerously. The fallen timber itself provides a fuel bed close to the ground, potentially increasing both the risk and severity of forest fires. Storms, tsunamis and other catastrophes like widespread ice storms or unseasonal snow may cause significant damage to tree canopies by breaking off branches or treetops. This damage may render the trees susceptible to attack by insects and disease.
While much of this timber may be recoverable, damage may render it unsuitable for its original use. Moreover, the volumes of damaged timber will often exceed the processing capacity of local industry (CTBA, 2004), meaning it must either be exported or stored locally until it can be processed.
Forests, forestry and disasters 19
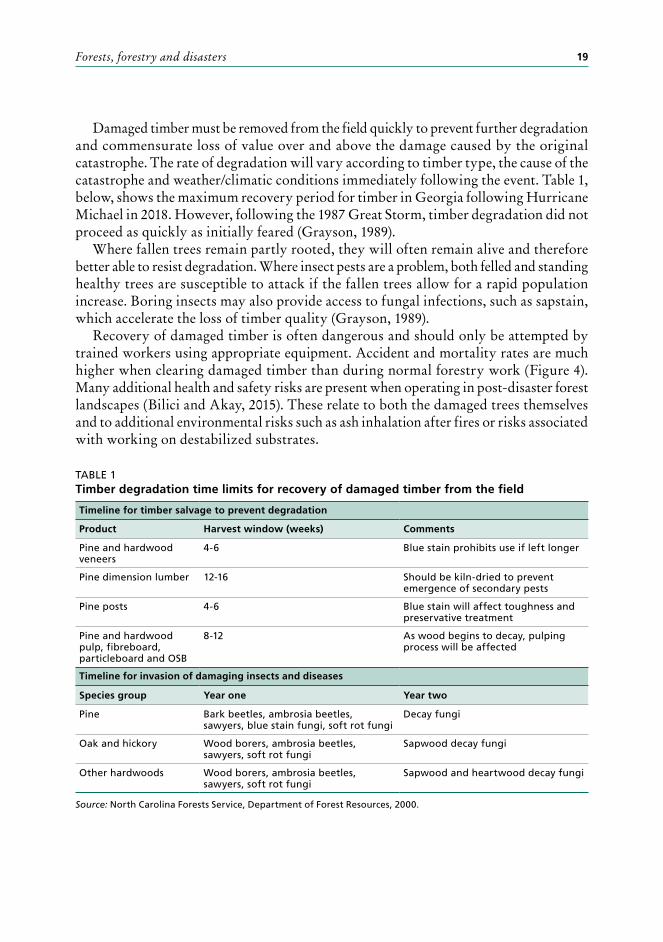
Damaged timber must be removed from the field quickly to prevent further degradation and commensurate loss of value over and above the damage caused by the original catastrophe. The rate of degradation will vary according to timber type, the cause of the catastrophe and weather/climatic conditions immediately following the event. Table 1, below, shows the maximum recovery period for timber in Georgia following Hurricane Michael in 2018. However, following the 1987 Great Storm, timber degradation did not proceed as quickly as initially feared (Grayson, 1989).
Where fallen trees remain partly rooted, they will often remain alive and therefore better able to resist degradation. Where insect pests are a problem, both felled and standing healthy trees are susceptible to attack if the fallen trees allow for a rapid population increase. Boring insects may also provide access to fungal infections, such as sapstain, which accelerate the loss of timber quality (Grayson, 1989).
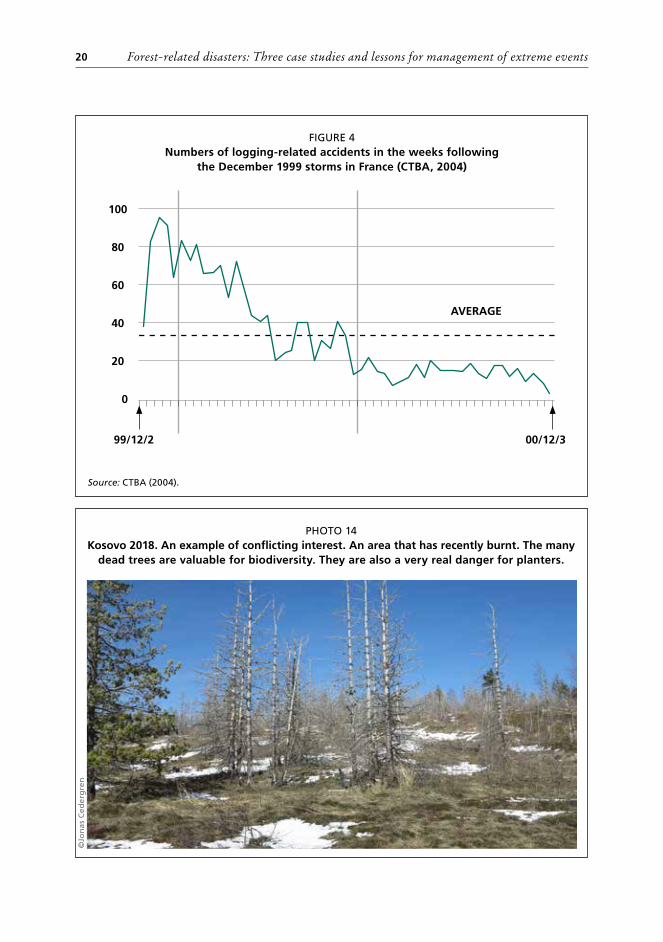
Recovery of damaged timber is often dangerous and should only be attempted by trained workers using appropriate equipment. Accident and mortality rates are much higher when clearing damaged timber than during normal forestry work (Figure 4). Many additional health and safety risks are present when operating in post-disaster forest landscapes (Bilici and Akay, 2015). These relate to both the damaged trees themselves and to additional environmental risks such as ash inhalation after fires or risks associated with working on destabilized substrates.
TABLE 1Timber degradation time limits for recovery of damaged timber from the field
Timeline for timber salvage to prevent degradation
Product Harvest window (weeks) Comments
Pine and hardwood veneers
4-6 Blue stain prohibits use if left longer
Pine dimension lumber 12-16 Should be kiln-dried to prevent emergence of secondary pests
Pine posts 4-6 Blue stain will affect toughness and preservative treatment
Pine and hardwood pulp, fibreboard, particleboard and OSB
8-12 As wood begins to decay, pulping process will be affected
Timeline for invasion of damaging insects and diseases
Species group Year one Year two
Pine Bark beetles, ambrosia beetles, sawyers, blue stain fungi, soft rot fungi
Decay fungi
Oak and hickory Wood borers, ambrosia beetles, sawyers, soft rot fungi
Sapwood decay fungi
Other hardwoods Wood borers, ambrosia beetles, sawyers, soft rot fungi
Sapwood and heartwood decay fungi
Source: North Carolina Forests Service, Department of Forest Resources, 2000.
Forest-related disasters: Three case studies and lessons for management of extreme events20
FIGURE 4Numbers of logging-related accidents in the weeks following
the December 1999 storms in France (CTBA, 2004)
40
20
60
80
100
Source: CTBA (2004).
0
AVERAGE
00/12/399/12/2
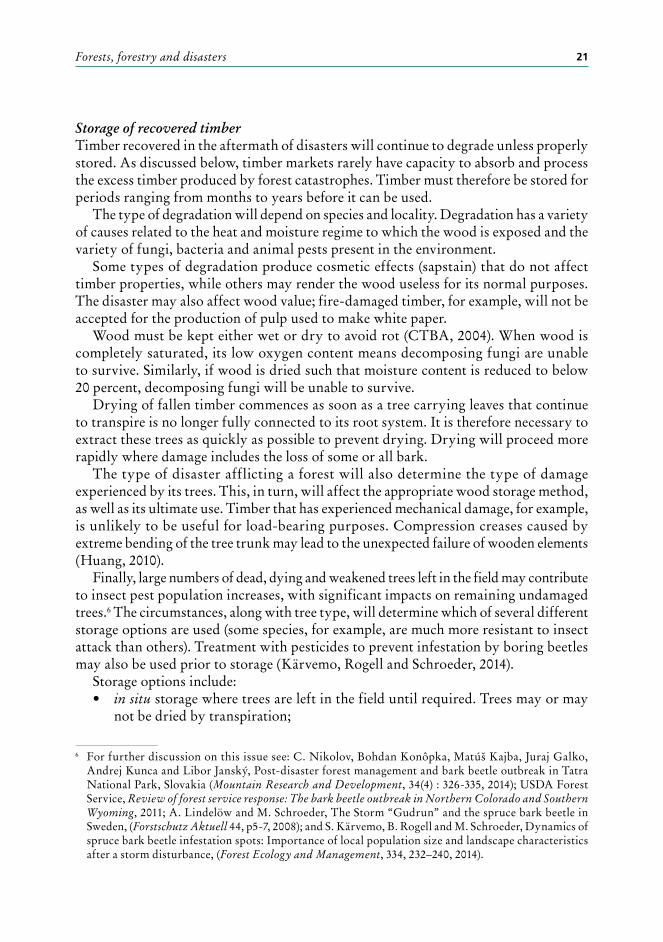
PHOTO 14Kosovo 2018. An example of conflicting interest. An area that has recently burnt. The many
dead trees are valuable for biodiversity. They are also a very real danger for planters.
©Jo
nas
Ced
erg
ren
Forests, forestry and disasters 21
Storage of recovered timberTimber recovered in the aftermath of disasters will continue to degrade unless properly stored. As discussed below, timber markets rarely have capacity to absorb and process the excess timber produced by forest catastrophes. Timber must therefore be stored for periods ranging from months to years before it can be used.
The type of degradation will depend on species and locality. Degradation has a variety of causes related to the heat and moisture regime to which the wood is exposed and the variety of fungi, bacteria and animal pests present in the environment.
Some types of degradation produce cosmetic effects (sapstain) that do not affect timber properties, while others may render the wood useless for its normal purposes. The disaster may also affect wood value; fire-damaged timber, for example, will not be accepted for the production of pulp used to make white paper.
Wood must be kept either wet or dry to avoid rot (CTBA, 2004). When wood is completely saturated, its low oxygen content means decomposing fungi are unable to survive. Similarly, if wood is dried such that moisture content is reduced to below 20 percent, decomposing fungi will be unable to survive.
Drying of fallen timber commences as soon as a tree carrying leaves that continue to transpire is no longer fully connected to its root system. It is therefore necessary to extract these trees as quickly as possible to prevent drying. Drying will proceed more rapidly where damage includes the loss of some or all bark.
The type of disaster afflicting a forest will also determine the type of damage experienced by its trees. This, in turn, will affect the appropriate wood storage method, as well as its ultimate use. Timber that has experienced mechanical damage, for example, is unlikely to be useful for load-bearing purposes. Compression creases caused by extreme bending of the tree trunk may lead to the unexpected failure of wooden elements (Huang, 2010).
Finally, large numbers of dead, dying and weakened trees left in the field may contribute to insect pest population increases, with significant impacts on remaining undamaged trees.6 The circumstances, along with tree type, will determine which of several different storage options are used (some species, for example, are much more resistant to insect attack than others). Treatment with pesticides to prevent infestation by boring beetles may also be used prior to storage (Kärvemo, Rogell and Schroeder, 2014).
Storage options include:• in situ storage where trees are left in the field until required. Trees may or may
not be dried by transpiration;
6 For further discussion on this issue see: C. Nikolov, Bohdan Konôpka, Matúš Kajba, Juraj Galko, Andrej Kunca and Libor Janský, Post-disaster forest management and bark beetle outbreak in Tatra National Park, Slovakia (Mountain Research and Development, 34(4) : 326-335, 2014); USDA Forest Service, Review of forest service response: The bark beetle outbreak in Northern Colorado and Southern Wyoming, 2011; A. Lindelöw and M. Schroeder, The Storm “Gudrun” and the spruce bark beetle in Sweden, (Forstschutz Aktuell 44, p5-7, 2008); and S. Kärvemo, B. Rogell and M. Schroeder, Dynamics of spruce bark beetle infestation spots: Importance of local population size and landscape characteristics after a storm disturbance, (Forest Ecology and Management, 334, 232–240, 2014).
Forest-related disasters: Three case studies and lessons for management of extreme events22
• wet storage in log ponds or under sprinkler systems;• dry storage intended to reduce moisture content as quickly as possible;• wet storage in piles or under cover to maintain moisture content; and• covered storage with oxygen exclusion.As yet, the costs and benefits of these methods have only been evaluated for temperate
timbers (CTBA, 2004).
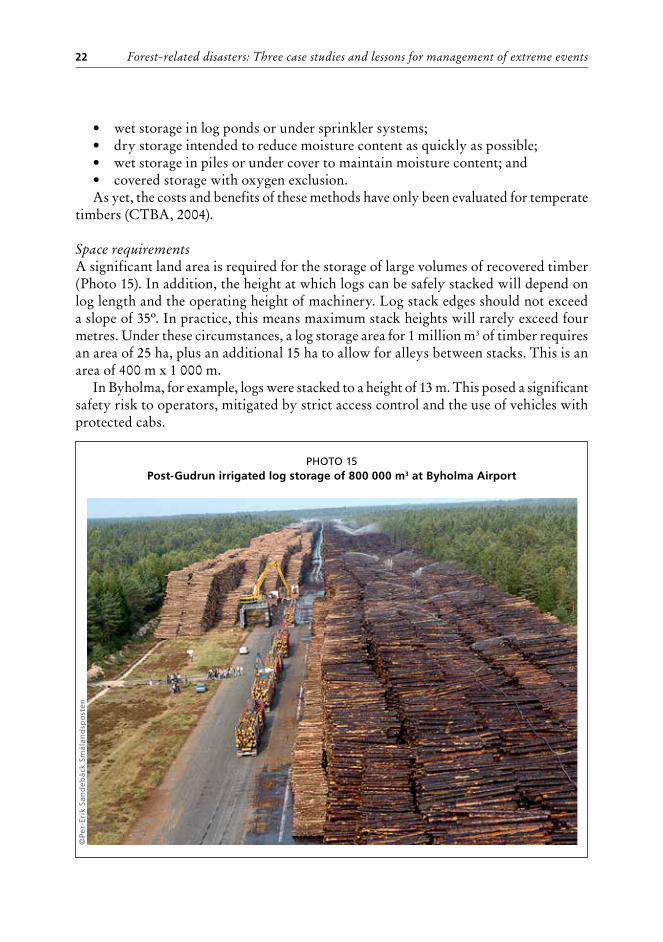
Space requirementsA significant land area is required for the storage of large volumes of recovered timber (Photo 15). In addition, the height at which logs can be safely stacked will depend on log length and the operating height of machinery. Log stack edges should not exceed a slope of 35º. In practice, this means maximum stack heights will rarely exceed four metres. Under these circumstances, a log storage area for 1 million m3 of timber requires an area of 25 ha, plus an additional 15 ha to allow for alleys between stacks. This is an area of 400 m x 1 000 m.
In Byholma, for example, logs were stacked to a height of 13 m. This posed a significant safety risk to operators, mitigated by strict access control and the use of vehicles with protected cabs.
PHOTO 15Post-Gudrun irrigated log storage of 800 000 m3 at Byholma Airport
©Pe
r-Er
ik S
and
ebäc
k Sm
ålan
dsp
ost
en
Forests, forestry and disasters 23
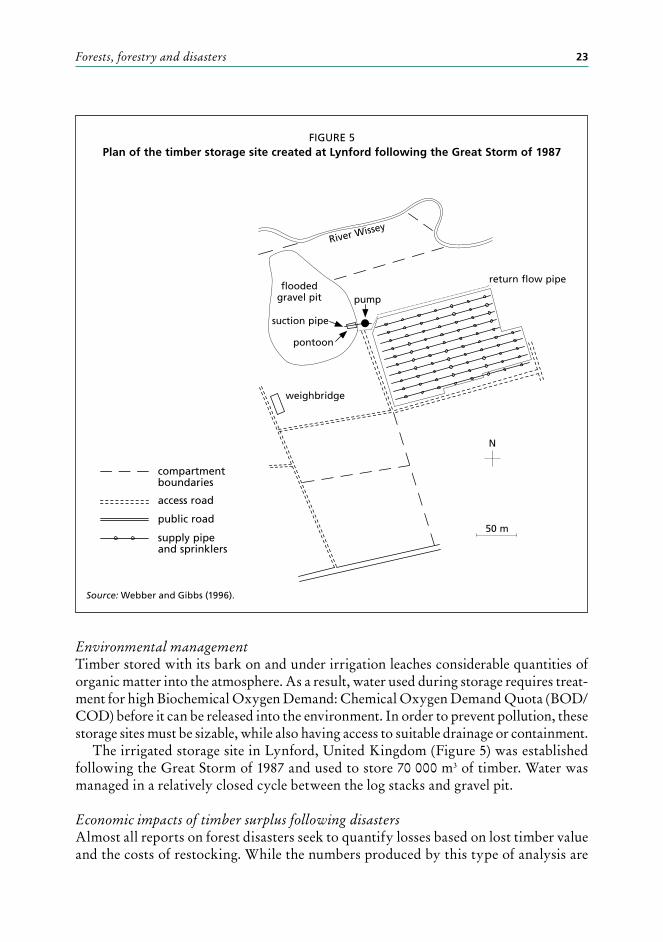
Environmental managementTimber stored with its bark on and under irrigation leaches considerable quantities of organic matter into the atmosphere. As a result, water used during storage requires treat-ment for high Biochemical Oxygen Demand: Chemical Oxygen Demand Quota (BOD/COD) before it can be released into the environment. In order to prevent pollution, these storage sites must be sizable, while also having access to suitable drainage or containment.
The irrigated storage site in Lynford, United Kingdom (Figure 5) was established following the Great Storm of 1987 and used to store 70 000 m3 of timber. Water was managed in a relatively closed cycle between the log stacks and gravel pit.
Economic impacts of timber surplus following disastersAlmost all reports on forest disasters seek to quantify losses based on lost timber value and the costs of restocking. While the numbers produced by this type of analysis are
FIGURE 5Plan of the timber storage site created at Lynford following the Great Storm of 1987
Source: Webber and Gibbs (1996).
compartment boundaries
supply pipe and sprinklers
access road
public road
flooded gravel pit pump
pontoon
suction pipe
weighbridge
return flow pipe
River Wissey
N
50 m
Forest-related disasters: Three case studies and lessons for management of extreme events24
impressive, they may be misleading, as they fail to properly consider where losses arise. Timber markets are complex. Timber value is dependent on the ability to process timber.
In most areas, the limiting factor is this processing capacity. With the exception of the most valuable timber types, timber transport over long distances is rarely economically viable and, even in these cases, local processing produces considerable savings.
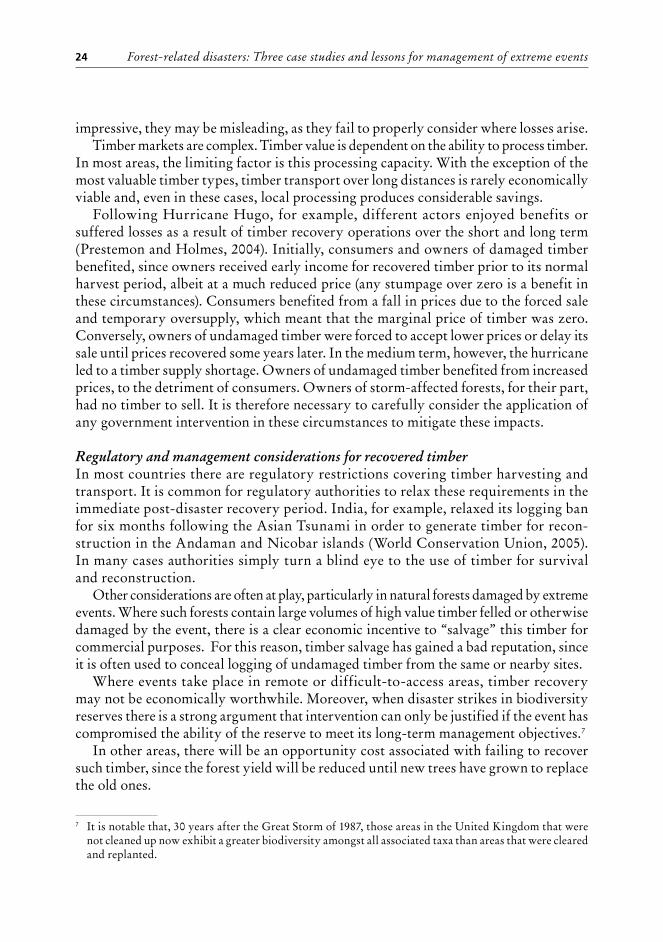
Following Hurricane Hugo, for example, different actors enjoyed benefits or suffered losses as a result of timber recovery operations over the short and long term (Prestemon and Holmes, 2004). Initially, consumers and owners of damaged timber benefited, since owners received early income for recovered timber prior to its normal harvest period, albeit at a much reduced price (any stumpage over zero is a benefit in these circumstances). Consumers benefited from a fall in prices due to the forced sale and temporary oversupply, which meant that the marginal price of timber was zero. Conversely, owners of undamaged timber were forced to accept lower prices or delay its sale until prices recovered some years later. In the medium term, however, the hurricane led to a timber supply shortage. Owners of undamaged timber benefited from increased prices, to the detriment of consumers. Owners of storm-affected forests, for their part, had no timber to sell. It is therefore necessary to carefully consider the application of any government intervention in these circumstances to mitigate these impacts.
Regulatory and management considerations for recovered timberIn most countries there are regulatory restrictions covering timber harvesting and transport. It is common for regulatory authorities to relax these requirements in the immediate post-disaster recovery period. India, for example, relaxed its logging ban for six months following the Asian Tsunami in order to generate timber for recon-struction in the Andaman and Nicobar islands (World Conservation Union, 2005). In many cases authorities simply turn a blind eye to the use of timber for survival and reconstruction.
Other considerations are often at play, particularly in natural forests damaged by extreme events. Where such forests contain large volumes of high value timber felled or otherwise damaged by the event, there is a clear economic incentive to “salvage” this timber for commercial purposes. For this reason, timber salvage has gained a bad reputation, since it is often used to conceal logging of undamaged timber from the same or nearby sites.
Where events take place in remote or difficult-to-access areas, timber recovery may not be economically worthwhile. Moreover, when disaster strikes in biodiversity reserves there is a strong argument that intervention can only be justified if the event has compromised the ability of the reserve to meet its long-term management objectives.7
In other areas, there will be an opportunity cost associated with failing to recover such timber, since the forest yield will be reduced until new trees have grown to replace the old ones.
7 It is notable that, 30 years after the Great Storm of 1987, those areas in the United Kingdom that were not cleaned up now exhibit a greater biodiversity amongst all associated taxa than areas that were cleared and replanted.
Forests, forestry and disasters 25
There will also be considerable controversy when the species involved are listed in categories of conservation concern or included in the appendices of the Convention on International Trade in Endangered Species of Wild Fauna and Flora (CITES). This is of particular concern to stakeholders who worry about the use of this timber as a smokescreen for illegal sources elsewhere.
In many cases, local industry is not capable of extracting or processing the large volumes of timber that might have fallen. The machinery required to haul heavy timber may simply be unavailable in the short term, since it will often be required elsewhere for reconstruction purposes.
In most tropical forests, the species of interest will be sparsely distributed. Under normal circumstances, the location of target trees will be identified during pre-harvest surveys a year or more prior to harvest. Such surveys may be difficult or impossible to carry out in a post-disaster context (due to the presence of large numbers of fallen trees or the destruction of forest roads).
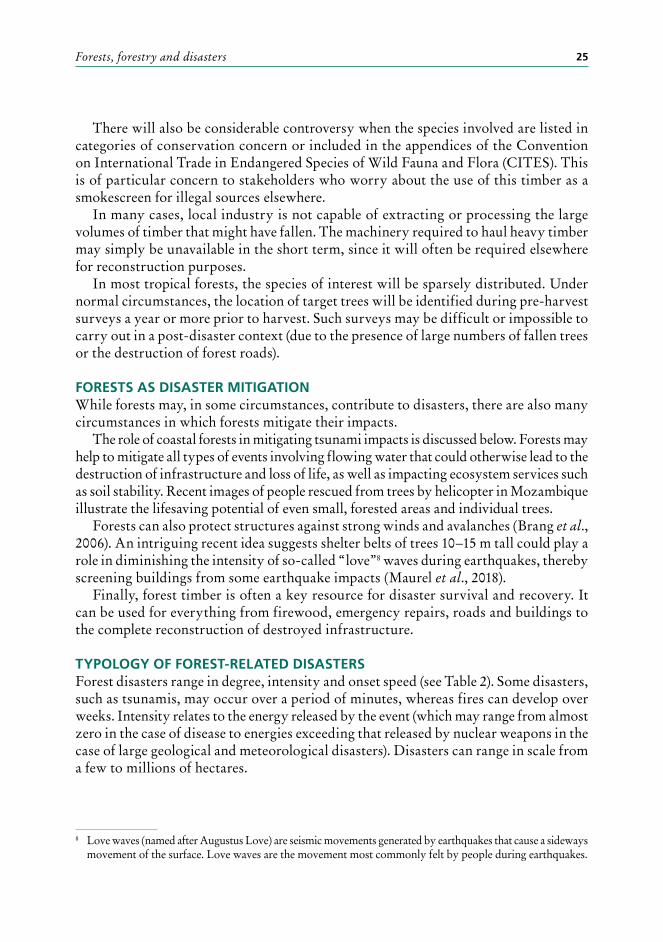
FORESTS AS DISASTER MITIGATIONWhile forests may, in some circumstances, contribute to disasters, there are also many circumstances in which forests mitigate their impacts.
The role of coastal forests in mitigating tsunami impacts is discussed below. Forests may help to mitigate all types of events involving flowing water that could otherwise lead to the destruction of infrastructure and loss of life, as well as impacting ecosystem services such as soil stability. Recent images of people rescued from trees by helicopter in Mozambique illustrate the lifesaving potential of even small, forested areas and individual trees.
Forests can also protect structures against strong winds and avalanches (Brang et al., 2006). An intriguing recent idea suggests shelter belts of trees 10–15 m tall could play a role in diminishing the intensity of so-called “love”8 waves during earthquakes, thereby screening buildings from some earthquake impacts (Maurel et al., 2018).
Finally, forest timber is often a key resource for disaster survival and recovery. It can be used for everything from firewood, emergency repairs, roads and buildings to the complete reconstruction of destroyed infrastructure.
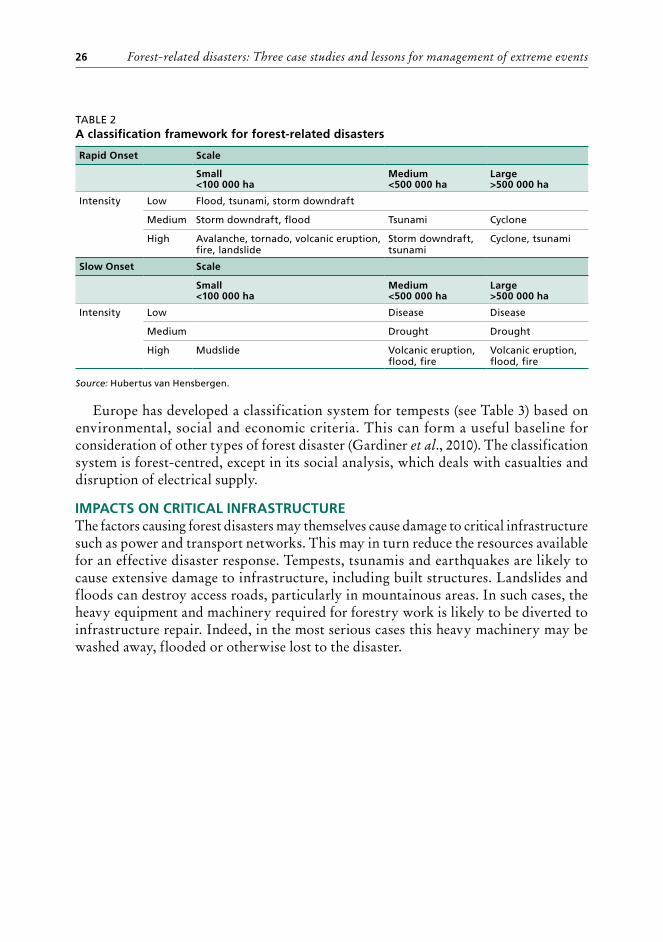
TYPOLOGY OF FOREST-RELATED DISASTERSForest disasters range in degree, intensity and onset speed (see Table 2). Some disasters, such as tsunamis, may occur over a period of minutes, whereas fires can develop over weeks. Intensity relates to the energy released by the event (which may range from almost zero in the case of disease to energies exceeding that released by nuclear weapons in the case of large geological and meteorological disasters). Disasters can range in scale from a few to millions of hectares.
8 Love waves (named after Augustus Love) are seismic movements generated by earthquakes that cause a sideways movement of the surface. Love waves are the movement most commonly felt by people during earthquakes.
Forest-related disasters: Three case studies and lessons for management of extreme events26
TABLE 2A classification framework for forest-related disasters
Rapid Onset Scale
Small <100 000 ha
Medium <500 000 ha
Large >500 000 ha
Intensity
Low Flood, tsunami, storm downdraft
Medium Storm downdraft, flood Tsunami Cyclone
High Avalanche, tornado, volcanic eruption, fire, landslide
Storm downdraft, tsunami
Cyclone, tsunami
Slow Onset Scale
Small <100 000 ha
Medium <500 000 ha
Large >500 000 ha
Intensity
Low Disease Disease
Medium Drought Drought
High Mudslide Volcanic eruption, flood, fire
Volcanic eruption, flood, fire
Source: Hubertus van Hensbergen.
Europe has developed a classification system for tempests (see Table 3) based on environmental, social and economic criteria. This can form a useful baseline for consideration of other types of forest disaster (Gardiner et al., 2010). The classification system is forest-centred, except in its social analysis, which deals with casualties and disruption of electrical supply.
IMPACTS ON CRITICAL INFRASTRUCTUREThe factors causing forest disasters may themselves cause damage to critical infrastructure such as power and transport networks. This may in turn reduce the resources available for an effective disaster response. Tempests, tsunamis and earthquakes are likely to cause extensive damage to infrastructure, including built structures. Landslides and floods can destroy access roads, particularly in mountainous areas. In such cases, the heavy equipment and machinery required for forestry work is likely to be diverted to infrastructure repair. Indeed, in the most serious cases this heavy machinery may be washed away, flooded or otherwise lost to the disaster.
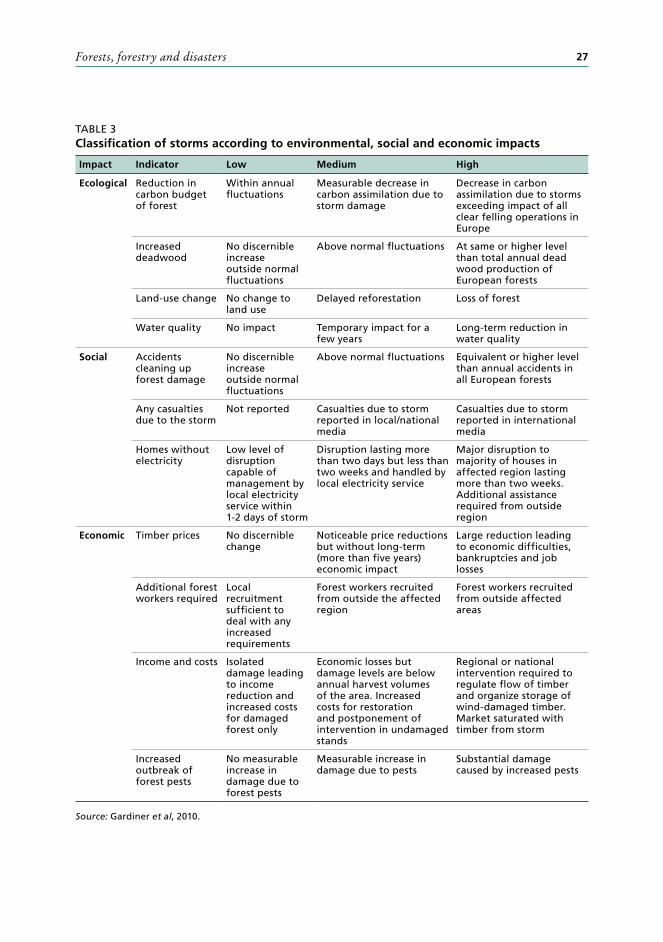
Forests, forestry and disasters 27
TABLE 3Classification of storms according to environmental, social and economic impacts
Impact Indicator Low Medium High
Ecological
Reduction in carbon budget of forest
Within annual fluctuations
Measurable decrease in carbon assimilation due to storm damage
Decrease in carbon assimilation due to storms exceeding impact of all clear felling operations in Europe
Increased deadwood
No discernible increase outside normal fluctuations
Above normal fluctuations At same or higher level than total annual dead wood production of European forests
Land-use change No change to land use
Delayed reforestation Loss of forest
Water quality No impact Temporary impact for a few years
Long-term reduction in water quality
Social
Accidents cleaning up forest damage
No discernible increase outside normal fluctuations
Above normal fluctuations Equivalent or higher level than annual accidents in all European forests
Any casualties due to the storm
Not reported Casualties due to storm reported in local/national media
Casualties due to storm reported in international media
Homes without electricity
Low level of disruption capable of management by local electricity service within 1-2 days of storm
Disruption lasting more than two days but less than two weeks and handled by local electricity service
Major disruption to majority of houses in affected region lasting more than two weeks. Additional assistance required from outside region
Economic
Timber prices No discernible change
Noticeable price reductions but without long-term (more than five years) economic impact
Large reduction leading to economic difficulties, bankruptcies and job losses
Additional forest workers required
Local recruitment sufficient to deal with any increased requirements
Forest workers recruited from outside the affected region
Forest workers recruited from outside affected areas
Income and costs Isolated damage leading to income reduction and increased costs for damaged forest only
Economic losses but damage levels are below annual harvest volumes of the area. Increased costs for restoration and postponement of intervention in undamaged stands
Regional or national intervention required to regulate flow of timber and organize storage of wind-damaged timber. Market saturated with timber from storm
Increased outbreak of forest pests
No measurable increase in damage due to forest pests
Measurable increase in damage due to pests
Substantial damage caused by increased pests
Source: Gardiner et al, 2010.
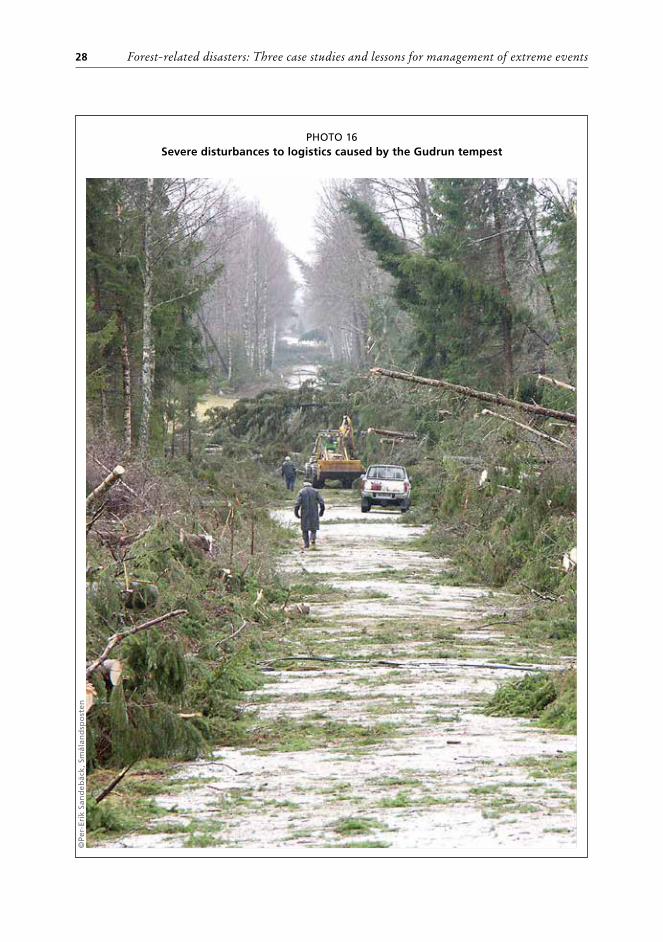
Forest-related disasters: Three case studies and lessons for management of extreme events28
PHOTO 16Severe disturbances to logistics caused by the Gudrun tempest
©Pe
r-Er
ik S
and
ebäc
k, S
mål
and
spo
sten

Forests, forestry and disasters 29
PHOTO 17Fire at Gortin Glen, Mullaghcarn Area of Special Scientific Interest, Northern Ireland.
The fire started in a forest and spread to a protected area causing widespread damage
©C
olu
m M
acDaid
©C
olu
m M
acDaid
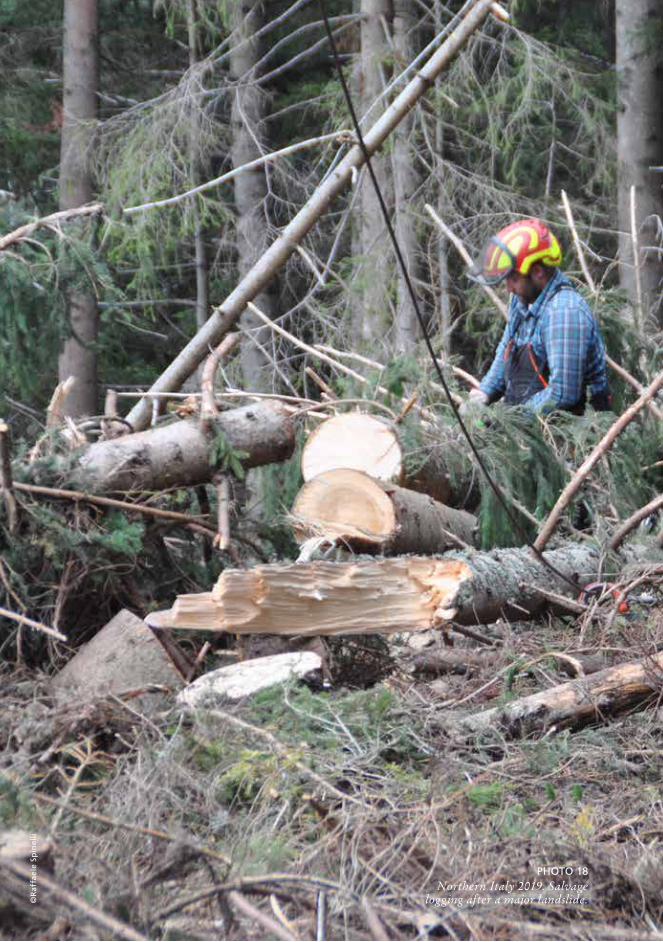
©R
affa
ele
Spin
elli
PHOTO 18Northern Italy 2019. Salvage
logging after a major landslide.
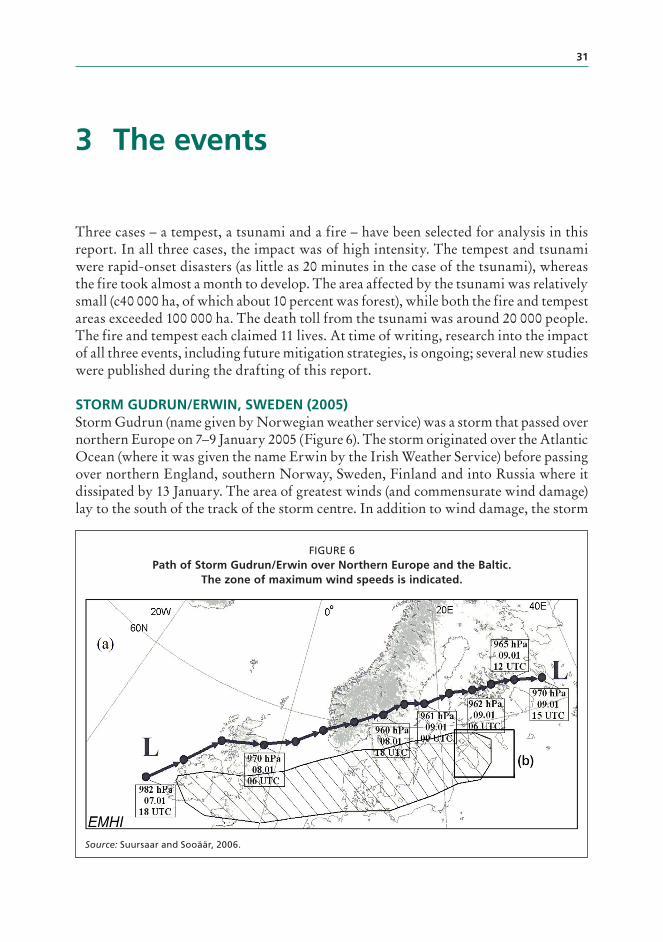
31
3 The events
Three cases – a tempest, a tsunami and a fire – have been selected for analysis in this report. In all three cases, the impact was of high intensity. The tempest and tsunami were rapid-onset disasters (as little as 20 minutes in the case of the tsunami), whereas the fire took almost a month to develop. The area affected by the tsunami was relatively small (c40 000 ha, of which about 10 percent was forest), while both the fire and tempest areas exceeded 100 000 ha. The death toll from the tsunami was around 20 000 people. The fire and tempest each claimed 11 lives. At time of writing, research into the impact of all three events, including future mitigation strategies, is ongoing; several new studies were published during the drafting of this report.
STORM GUDRUN/ERWIN, SWEDEN (2005)Storm Gudrun (name given by Norwegian weather service) was a storm that passed over northern Europe on 7–9 January 2005 (Figure 6). The storm originated over the Atlantic Ocean (where it was given the name Erwin by the Irish Weather Service) before passing over northern England, southern Norway, Sweden, Finland and into Russia where it dissipated by 13 January. The area of greatest winds (and commensurate wind damage) lay to the south of the track of the storm centre. In addition to wind damage, the storm
FIGURE 6Path of Storm Gudrun/Erwin over Northern Europe and the Baltic.
The zone of maximum wind speeds is indicated.
Source: Suursaar and Sooäär, 2006.
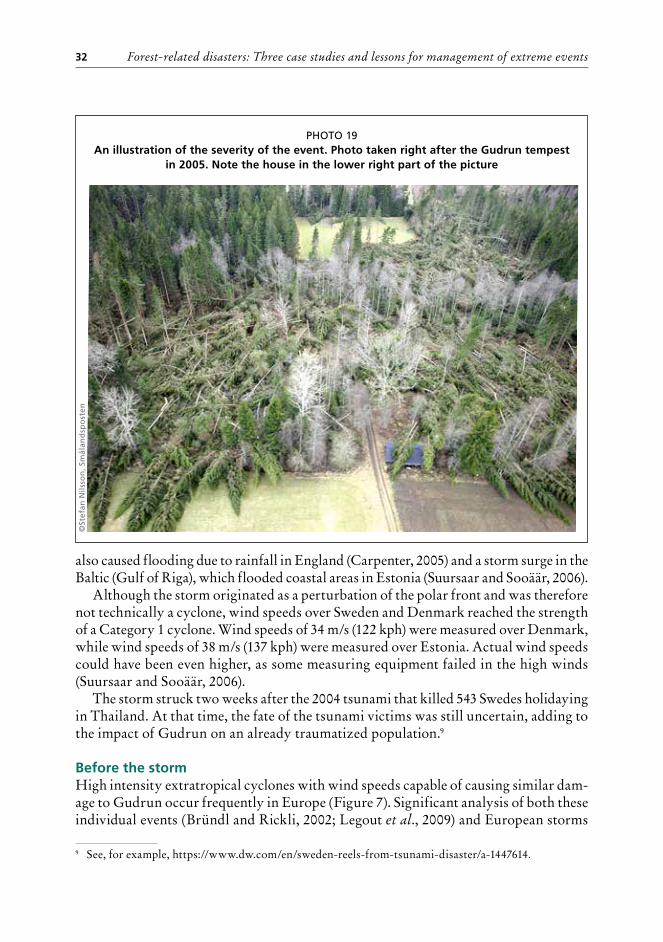
Forest-related disasters: Three case studies and lessons for management of extreme events32
PHOTO 19An illustration of the severity of the event. Photo taken right after the Gudrun tempest
in 2005. Note the house in the lower right part of the picture
©St
efan
Nil
sso
n, S
mål
and
spo
sten
also caused flooding due to rainfall in England (Carpenter, 2005) and a storm surge in the Baltic (Gulf of Riga), which flooded coastal areas in Estonia (Suursaar and Sooäär, 2006).
Although the storm originated as a perturbation of the polar front and was therefore not technically a cyclone, wind speeds over Sweden and Denmark reached the strength of a Category 1 cyclone. Wind speeds of 34 m/s (122 kph) were measured over Denmark, while wind speeds of 38 m/s (137 kph) were measured over Estonia. Actual wind speeds could have been even higher, as some measuring equipment failed in the high winds (Suursaar and Sooäär, 2006).
The storm struck two weeks after the 2004 tsunami that killed 543 Swedes holidaying in Thailand. At that time, the fate of the tsunami victims was still uncertain, adding to the impact of Gudrun on an already traumatized population.9
Before the stormHigh intensity extratropical cyclones with wind speeds capable of causing similar dam-age to Gudrun occur frequently in Europe (Figure 7). Significant analysis of both these individual events (Bründl and Rickli, 2002; Legout et al., 2009) and European storms
9 See, for example, https://www.dw.com/en/sweden-reels-from-tsunami-disaster/a-1447614.
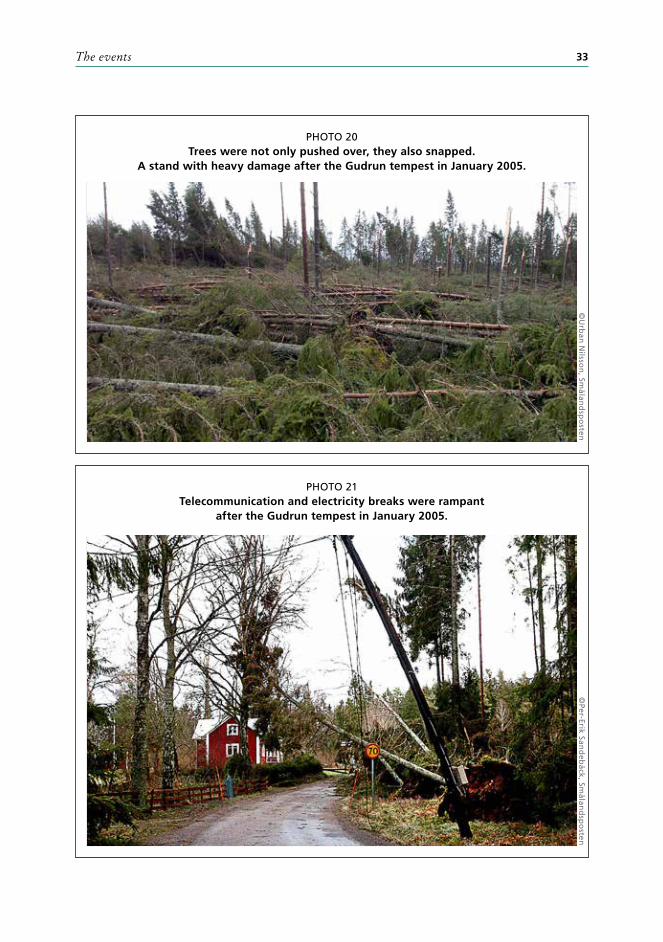
The events 33
PHOTO 20Trees were not only pushed over, they also snapped.
A stand with heavy damage after the Gudrun tempest in January 2005.
PHOTO 21Telecommunication and electricity breaks were rampant
after the Gudrun tempest in January 2005.
©U
rban
Nilsso
n, Sm
åland
spo
sten©
Per-Erik Sand
ebäck
, Smålan
dsp
osten
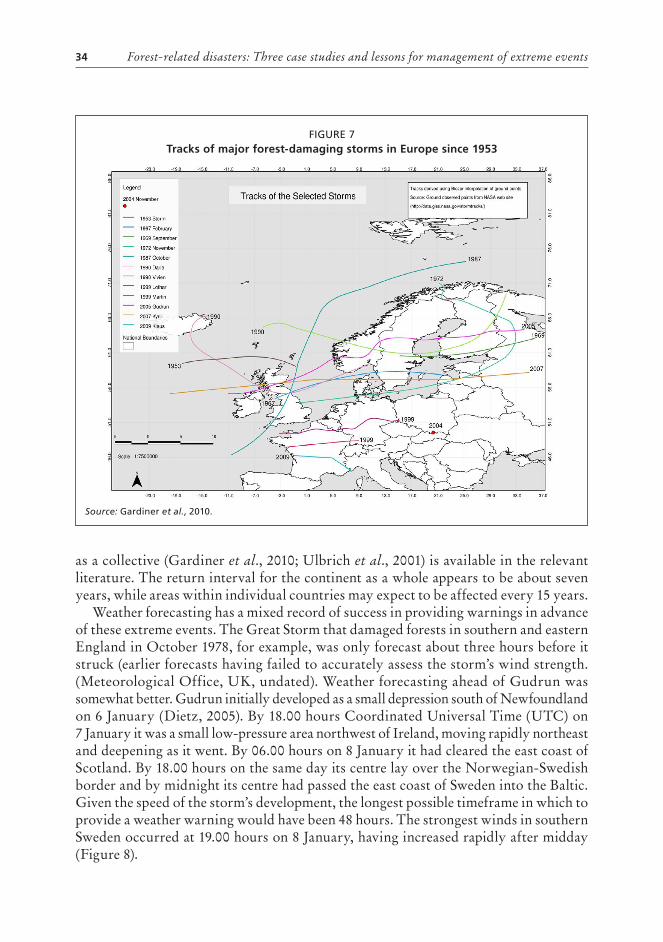
Forest-related disasters: Three case studies and lessons for management of extreme events34
as a collective (Gardiner et al., 2010; Ulbrich et al., 2001) is available in the relevant literature. The return interval for the continent as a whole appears to be about seven years, while areas within individual countries may expect to be affected every 15 years.
Weather forecasting has a mixed record of success in providing warnings in advance of these extreme events. The Great Storm that damaged forests in southern and eastern England in October 1978, for example, was only forecast about three hours before it struck (earlier forecasts having failed to accurately assess the storm’s wind strength. (Meteorological Office, UK, undated). Weather forecasting ahead of Gudrun was somewhat better. Gudrun initially developed as a small depression south of Newfoundland on 6 January (Dietz, 2005). By 18.00 hours Coordinated Universal Time (UTC) on 7 January it was a small low-pressure area northwest of Ireland, moving rapidly northeast and deepening as it went. By 06.00 hours on 8 January it had cleared the east coast of Scotland. By 18.00 hours on the same day its centre lay over the Norwegian-Swedish border and by midnight its centre had passed the east coast of Sweden into the Baltic. Given the speed of the storm’s development, the longest possible timeframe in which to provide a weather warning would have been 48 hours. The strongest winds in southern Sweden occurred at 19.00 hours on 8 January, having increased rapidly after midday (Figure 8).
FIGURE 7Tracks of major forest-damaging storms in Europe since 1953
Source: Gardiner et al., 2010.
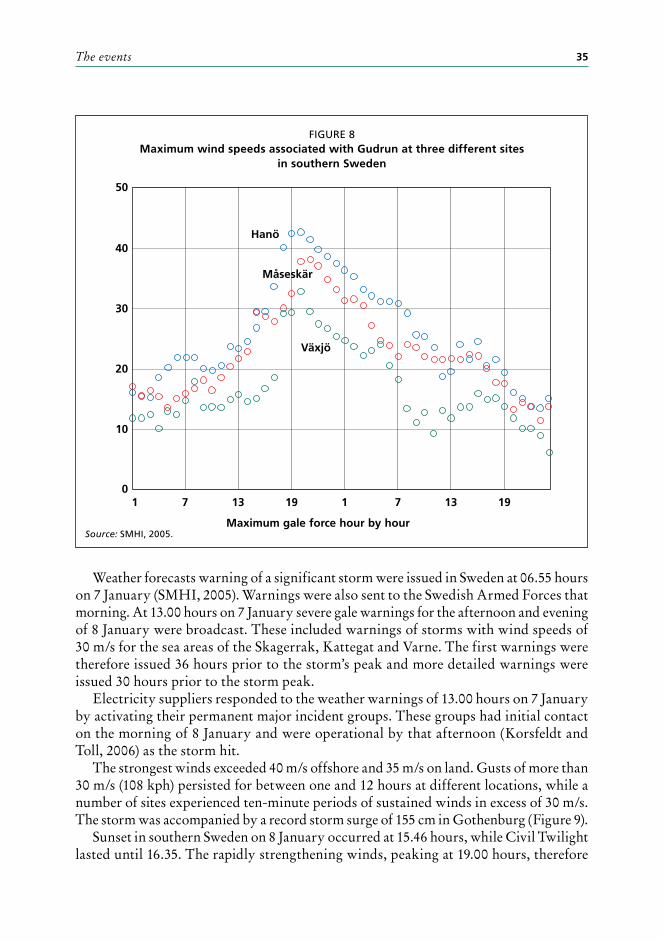
The events 35
Weather forecasts warning of a significant storm were issued in Sweden at 06.55 hours on 7 January (SMHI, 2005). Warnings were also sent to the Swedish Armed Forces that morning. At 13.00 hours on 7 January severe gale warnings for the afternoon and evening of 8 January were broadcast. These included warnings of storms with wind speeds of 30 m/s for the sea areas of the Skagerrak, Kattegat and Varne. The first warnings were therefore issued 36 hours prior to the storm’s peak and more detailed warnings were issued 30 hours prior to the storm peak.
Electricity suppliers responded to the weather warnings of 13.00 hours on 7 January by activating their permanent major incident groups. These groups had initial contact on the morning of 8 January and were operational by that afternoon (Korsfeldt and Toll, 2006) as the storm hit.
The strongest winds exceeded 40 m/s offshore and 35 m/s on land. Gusts of more than 30 m/s (108 kph) persisted for between one and 12 hours at different locations, while a number of sites experienced ten-minute periods of sustained winds in excess of 30 m/s. The storm was accompanied by a record storm surge of 155 cm in Gothenburg (Figure 9).
Sunset in southern Sweden on 8 January occurred at 15.46 hours, while Civil Twilight lasted until 16.35. The rapidly strengthening winds, peaking at 19.00 hours, therefore
FIGURE 8Maximum wind speeds associated with Gudrun at three different sites
in southern Sweden
Source: SMHI, 2005.
Hanö
Måseskär
Växjö
0
50
20
10
30
40
Maximum gale force hour by hour
1 7 713 1319 191
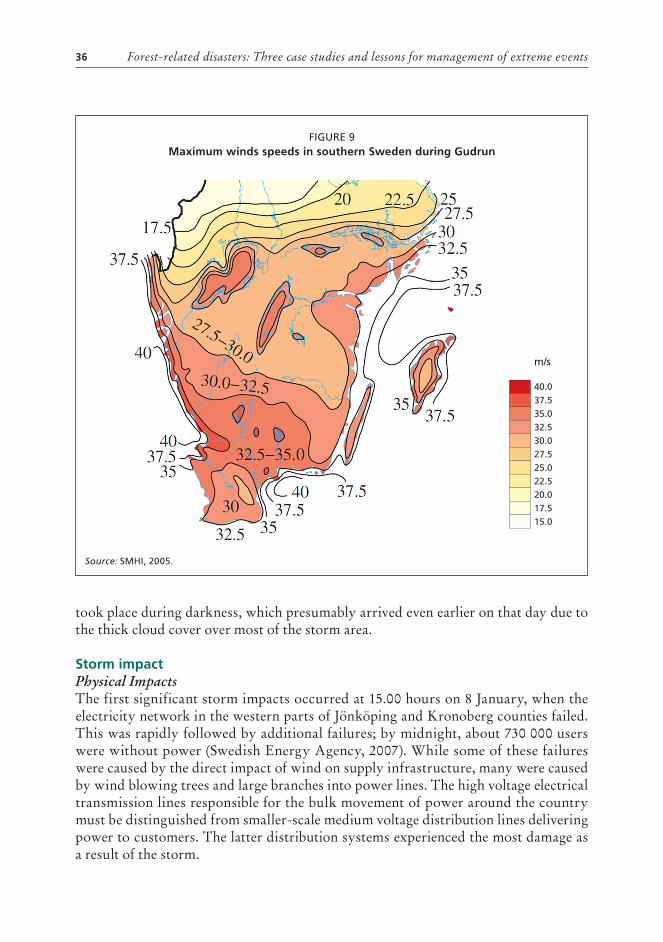
Forest-related disasters: Three case studies and lessons for management of extreme events36
took place during darkness, which presumably arrived even earlier on that day due to the thick cloud cover over most of the storm area.
Storm impact Physical ImpactsThe first significant storm impacts occurred at 15.00 hours on 8 January, when the electricity network in the western parts of Jönköping and Kronoberg counties failed. This was rapidly followed by additional failures; by midnight, about 730 000 users were without power (Swedish Energy Agency, 2007). While some of these failures were caused by the direct impact of wind on supply infrastructure, many were caused by wind blowing trees and large branches into power lines. The high voltage electrical transmission lines responsible for the bulk movement of power around the country must be distinguished from smaller-scale medium voltage distribution lines delivering power to customers. The latter distribution systems experienced the most damage as a result of the storm.
FIGURE 9Maximum winds speeds in southern Sweden during Gudrun
Source: SMHI, 2005.
m/s
40.037.535.0 32.5 30.0 27.5 25.0 22.5 20.017.515.0
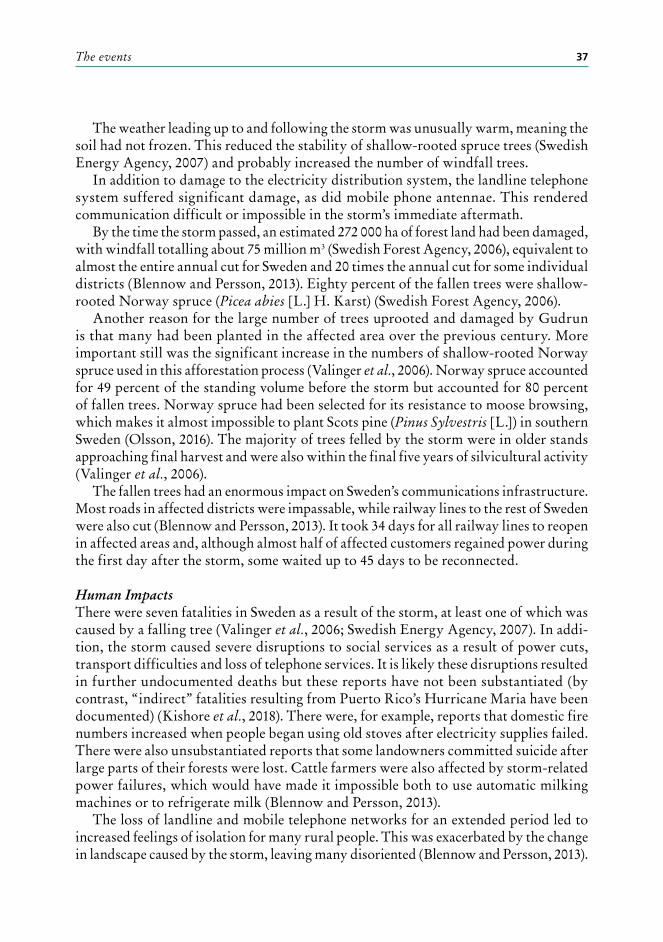
The events 37
The weather leading up to and following the storm was unusually warm, meaning the soil had not frozen. This reduced the stability of shallow-rooted spruce trees (Swedish Energy Agency, 2007) and probably increased the number of windfall trees.
In addition to damage to the electricity distribution system, the landline telephone system suffered significant damage, as did mobile phone antennae. This rendered communication difficult or impossible in the storm’s immediate aftermath.
By the time the storm passed, an estimated 272 000 ha of forest land had been damaged, with windfall totalling about 75 million m3 (Swedish Forest Agency, 2006), equivalent to almost the entire annual cut for Sweden and 20 times the annual cut for some individual districts (Blennow and Persson, 2013). Eighty percent of the fallen trees were shallow-rooted Norway spruce (Picea abies [L.] H. Karst) (Swedish Forest Agency, 2006).
Another reason for the large number of trees uprooted and damaged by Gudrun is that many had been planted in the affected area over the previous century. More important still was the significant increase in the numbers of shallow-rooted Norway spruce used in this afforestation process (Valinger et al., 2006). Norway spruce accounted for 49 percent of the standing volume before the storm but accounted for 80 percent of fallen trees. Norway spruce had been selected for its resistance to moose browsing, which makes it almost impossible to plant Scots pine (Pinus Sylvestris [L.]) in southern Sweden (Olsson, 2016). The majority of trees felled by the storm were in older stands approaching final harvest and were also within the final five years of silvicultural activity (Valinger et al., 2006).
The fallen trees had an enormous impact on Sweden’s communications infrastructure. Most roads in affected districts were impassable, while railway lines to the rest of Sweden were also cut (Blennow and Persson, 2013). It took 34 days for all railway lines to reopen in affected areas and, although almost half of affected customers regained power during the first day after the storm, some waited up to 45 days to be reconnected.
Human ImpactsThere were seven fatalities in Sweden as a result of the storm, at least one of which was caused by a falling tree (Valinger et al., 2006; Swedish Energy Agency, 2007). In addi-tion, the storm caused severe disruptions to social services as a result of power cuts, transport difficulties and loss of telephone services. It is likely these disruptions resulted in further undocumented deaths but these reports have not been substantiated (by contrast, “indirect” fatalities resulting from Puerto Rico’s Hurricane Maria have been documented) (Kishore et al., 2018). There were, for example, reports that domestic fire numbers increased when people began using old stoves after electricity supplies failed. There were also unsubstantiated reports that some landowners committed suicide after large parts of their forests were lost. Cattle farmers were also affected by storm-related power failures, which would have made it impossible both to use automatic milking machines or to refrigerate milk (Blennow and Persson, 2013).
The loss of landline and mobile telephone networks for an extended period led to increased feelings of isolation for many rural people. This was exacerbated by the change in landscape caused by the storm, leaving many disoriented (Blennow and Persson, 2013).
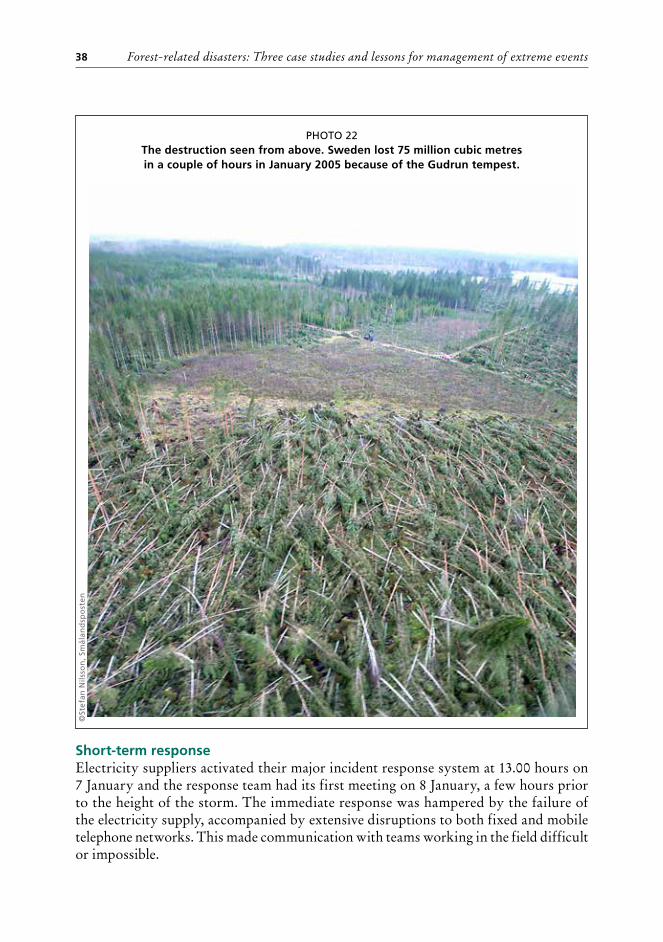
Forest-related disasters: Three case studies and lessons for management of extreme events38
Short-term responseElectricity suppliers activated their major incident response system at 13.00 hours on 7 January and the response team had its first meeting on 8 January, a few hours prior to the height of the storm. The immediate response was hampered by the failure of the electricity supply, accompanied by extensive disruptions to both fixed and mobile telephone networks. This made communication with teams working in the field difficult or impossible.
PHOTO 22The destruction seen from above. Sweden lost 75 million cubic metres in a couple of hours in January 2005 because of the Gudrun tempest.
©St
efan
Nil
sso
n, S
mål
and
spo
sten
The events 39
Electricity supplyThirteen companies and a total of 136 000 km of network supply cable were involved in the restoration of the electricity network. The two largest companies suffered damage to 30 000 km of cable, 2 000 km of which were beyond repair.
With the cooperation of the Swedish Air Force, electricity companies began mobilizing repair teams from other parts of Sweden on the morning after the storm (six flights were completed on that day alone). Over subsequent days, an additional 300 linesmen were brought in from six other European countries. Repair to the high voltage regional network was prioritized over repair to the distribution network (Swedish Energy Agency, 2007).
Road access blocked by fallen trees was a major problem on both major and minor roads. Clearing these trees would involve at least 10 000 workers, about half of whom were provided by the electricity companies themselves. The remainder were drawn from the Farmers’ Federation, the armed forces and the home guard. While the national road administration was nominally responsible for clearing roads, it had no contingency services available to respond to the storm. The Defence Force provided about 800 vehicles to assist with road clearing. Once these blocked roads had been cleared, priority was given to clearing trees from the rides10 of the electricity distribution network (Swedish Energy Agency, 2007).
A key impediment to restoring the power supply was the breakdown of the telephone and communication systems, which in turn relied on power for their operations. While electricity suppliers had their own radio networks, they did not have access to the emergency services radio network; subcontractors had access to neither. Customers without telephone or internet were unable to contact supply companies to get or transmit information. While broadcast radio communication was implemented in some districts, this was only available to those with either power or battery-powered radios who lived in the limited area with access to a signal. Approximately 800 remote telecommunication structures had been damaged during the storm, access to which was impossible due to fallen trees (Swedish Civil Contingencies Agency [MSB], 2015).
Centralized agencies (Rescue service, Emergency Management, county boards and the electricity supply Network) did not have access to adequate information about what was happening at the local level. There was, for example, no centralized register of working standby power units available at the municipal level (MSB, 2015).
Timber RecoveryDue to the scale of the damage and the inadequacy of the Swedish forest logistics system to cope with the enormous quantity of timber felled by the storm, foresters had to search for mechanized harvesting resources from outside Sweden to assist with recovery (Hubertus van Hensbergen, 2005). Transport equipment was ultimately sourced from Finland, Germany, Poland and the Baltic states (Broman, Frisk and Rönnqvist, 2009).
The capacity shortage shortfall was especially great because of the need to recover as much of the fallen timber as possible prior to the start of the pine beetle breeding and
10 Rides are the areas below the cables that are kept clear of trees to prevent electrical arcing to ground.
Forest-related disasters: Three case studies and lessons for management of extreme events40
dispersal season in spring. Domestic harvest and transport resources were also required to meet regular timber demands from processing plants in other parts of Sweden. In addition, it was not possible to assign all available harvesting machinery to the clean-up process.
Clean-up equipment and machinery was also required in Latvia and Lithuania, whose forests suffered significant damage as a result of the storm, further reducing the resources available to Sweden (Blennow and Persson, 2013).
Recovered timber was delivered to a number of markets. In some cases timber was transferred immediately, while some remained wet and in storage for some time. Södra (a Swedish forest owners’ association with large industries of its own), for example, was still using recovered timber up to four years after the storm (Södra, undated). Sveaskog (a major Swedish forest company), which suffered damage to 2.5–3 million m3 of timber, was forced to establish a complete new logistical framework including road and rail transport and national and international shipping methods. It also constructed 400 000 m3 of storage capacity at ten sites (Broman, Frisk and Rönnqvist, 2009).
Long-term impacts and responsesEffects on timber growthIn the period after the storm there was a sustained reduction in the growth rate of affected forests (Valinger, Kempe and Fridman, 2014). Growth in these forests was 1.8 million m3 less than surrounding unaffected areas. This reduced growth rate can be ascribed to a reduced growing stock of 33 million m3 as a direct result of Gudrun.
The storm also caused a significant change to the age class distribution of stands, with an increase in very old and very young stands and a decrease in mid rotation stands.
Thinning activities were also delayed, meaning the area in need of immediate pre-commercial thinning increased from 40 000 ha to 150 000 ha in 2008. This was despite an increase in the annual thinned area from 45 000 to 65 000 ha. Notably, prior thinning was one of the contributing factors to forest damage during the storm (Valinger, Kempe and Fridman, 2014). Prior to Gudrun, the annual thinned area had increased from 60 000 ha in 1997 to 90 000 ha in 2003. In the immediate post-Gudrun period almost no thinning occurred, as all resources were directed towards the initial clean-up and subsequent replanting of cleared areas.
However, not all lost growth can be ascribed to the loss of stock due to the storm or changed thinning regimes. Growth loss in affected forests amounted to up to 10 percent, correlating with the maximum wind speed at the site (Seidl and Blennow, 2012). It is possible this was caused by root disturbance, leading to reallocation of resources and/or poorer absorption. This loss of growth amounted to 3 million m3 in the first three years after the storm, exceeding losses caused by bark beetles.
Effects on spruce bark beetle infestationsBark beetle populations were intensively monitored following Gudrun and measures were put in place to control outbreaks by means of pheromone traps and insecticide treated logs. Throughout 2004 and immediately prior to the storm bark beetle populations
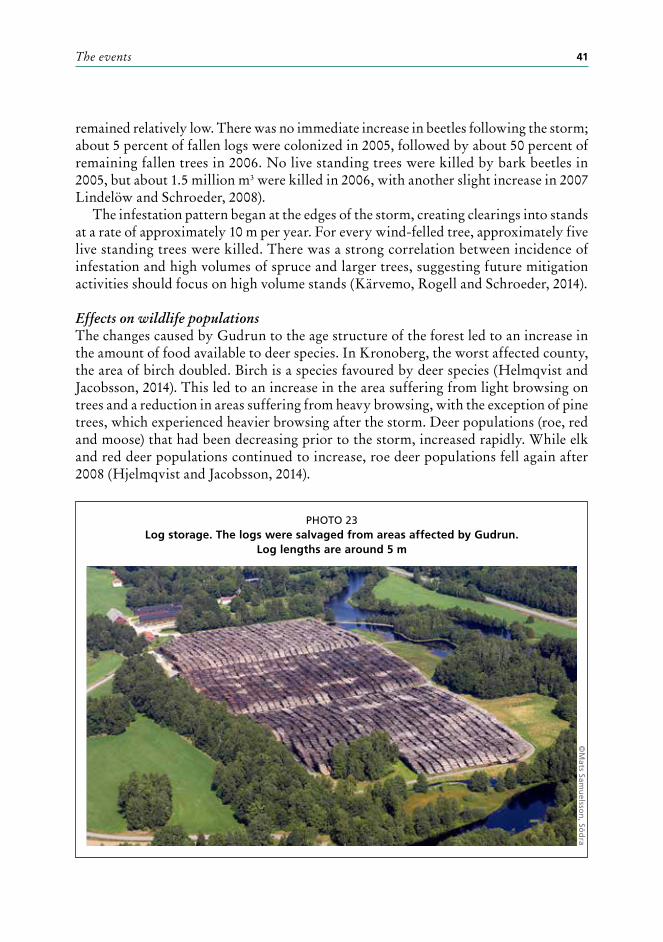
The events 41
remained relatively low. There was no immediate increase in beetles following the storm; about 5 percent of fallen logs were colonized in 2005, followed by about 50 percent of remaining fallen trees in 2006. No live standing trees were killed by bark beetles in 2005, but about 1.5 million m3 were killed in 2006, with another slight increase in 2007 Lindelöw and Schroeder, 2008).
The infestation pattern began at the edges of the storm, creating clearings into stands at a rate of approximately 10 m per year. For every wind-felled tree, approximately five live standing trees were killed. There was a strong correlation between incidence of infestation and high volumes of spruce and larger trees, suggesting future mitigation activities should focus on high volume stands (Kärvemo, Rogell and Schroeder, 2014).
Effects on wildlife populationsThe changes caused by Gudrun to the age structure of the forest led to an increase in the amount of food available to deer species. In Kronoberg, the worst affected county, the area of birch doubled. Birch is a species favoured by deer species (Helmqvist and Jacobsson, 2014). This led to an increase in the area suffering from light browsing on trees and a reduction in areas suffering from heavy browsing, with the exception of pine trees, which experienced heavier browsing after the storm. Deer populations (roe, red and moose) that had been decreasing prior to the storm, increased rapidly. While elk and red deer populations continued to increase, roe deer populations fell again after 2008 (Hjelmqvist and Jacobsson, 2014).
PHOTO 23Log storage. The logs were salvaged from areas affected by Gudrun.
Log lengths are around 5 m
©M
ats Samu
elsson
, Söd
ra
Forest-related disasters: Three case studies and lessons for management of extreme events42
Social impactsThe storm altered the landscape and livelihoods of affected people, leading to stress and associated health consequences. Only 40 percent of impacted small forest owners had storm damage insurance; prior to Gudrun they had not been fully aware of the relevant risks (Ingemarson et al., 2006).
In the storm’s aftermath, many people were disoriented. Police fielded calls from residents who had become lost in areas they had known since childhood. Those who had planted and tended forests saw their life’s work destroyed in a single night and there were reported suicides (Blennow and Persson, 2013).
Forest owners and workers experienced a variety of impacts with attendant psycho-social consequences (Svensson et al., 2011). Forest owners suffered as a result of the perceived economic losses caused by the storm; up to one-third became depressed in its aftermath (Alsnas, 2006).
The shortage of harvesting equipment meant equipment and operating teams were enlisted from other parts of Europe. This led to problems associated with language and communication differences. In addition, these workers were not familiar with Swedish rest and work cycles or Swedish field methods. In particular, they did not understand the environmental codes of practice with which Swedish forest workers were deeply familiar.
Accidents and fatalities during the forestry clean-upMany accidents occurred during clean-up operations, including 11 fatalities (see Figure 10). The accident rate was double that encountered during normal Swedish forestry operations. Moreover, it is likely far more than the 141 reported accidents occurred (Blennow and Persson, 2013) since this number did not include foreign workers.
This increased accident rate nevertheless remained lower than that of some other European countries. It has been recommended that timber recovery should be mechanized using heavy harvesting machinery as far as possible. Moreover, workers likely to become involved in timber recovery work should receive special, regular training to reduce accident rates (Svensson et al., 2011).
Economic impacts on farmers due to oversupply of timberStorm Gudrun damaged about 75 million m3 of timber, 40 million of which was recovered. About 10 million m3 of this recovered timber went into storage for later processing (Matzer, 2015). The economic impact on forest owners had several aspects. The storm-damaged timber was likely to be assigned to lower priced timber assortments due to both visible and hidden damage (Svensson et al., 2011). In particular, the processing costs for saw timber increased significantly due to hidden damage. Conversely, the price of fallen timber at pulp mills was not affected.
The cost of recovering fallen timber was about 50 percent higher than regular harvesting, resulting in a reduced net income for landowners. Buyers also bore the costs of preparing and maintaining timber storage sites by way of increased prices (Svensson et al., 2011).
Södra, an association of smaller private forest owners, as well as a major timber processing company, asked its timber growers living outside the storm-affected area to

The events 43
reduce deliveries to its mills over a period of years, thereby reducing growers’ income (Södra, 2018).
An attendant tendency to fell stands earlier reduced both their final volume and value, as more timber fell into smaller assortments (Svensson et al., 2011). These losses will also extend into the future. Farmers who lost large areas of mid rotation (30–60 years) timber will experience a future reduction in timber sales when these lost trees do not reach maturity (80–100 years).
Forest managementAlthough the forest damage caused by Gudrun disproportionately affected Norway spruce, this did not change the behaviour of forest owners. Conifers accounted for 96 percent of reforestation subsidies paid out after the storm, the remainder being for mixed species or broad-leafed stands (Wallstedt, 2013). Broad-leafed stands are harder to protect from herbivores but also carry a much higher subsidy reflecting the costs of protection.
The purpose of the subsidies was to promote establishment of more diverse and storm-resistant forests. Despite this, most of the damaged area – the majority of which had consisted of Norway spruce – was simply replaced with the same tree variety. This was because Scots pine was difficult to protect from herbivores and farmers had better experiences selling spruce than alternative species (Lodin, 2016). Large forest
FIGURE 10Accidents suffered by Swedish workers during clean-up operations after Storm Gudrun
Source: Blennow and Persson, 2013.
0
70
40
50
60
30
20
10
Jan
uar
y
Feb
ruar
y
Mar
ch
Ap
ril
May
Jun
e
July
Au
gu
st
Sep
tem
ber
Oct
ob
er
No
vem
ber
Dec
emb
er
Forest-related disasters: Three case studies and lessons for management of extreme events44
companies also advised farmers to replant with spruce, despite the risk of future storm losses.
Farmers’ perceptions of forestry as a safe investment also changed after the storm. An apparent tendency to undertake final fellings earlier has emerged since the storm, thereby reducing the amount of older stands in the area (Svensson et al., 2011).
Analysis and policy implications of the stormPolitical impactsThe public perception that the government had failed affected Swedish citizens in its response to both the Boxing Day Tsunami and the disruption caused by Gudrun is believed to have contributed to the fall of the Government, led by the Social Democratic Party, in 2006 (Eriksson, 2016). The effect of similar incidents on voter behaviour has been noted elsewhere (Cole, Healy and Werker, 2012).
Policy impactsThe failure of the electricity supply system during Gudrun led to reform of the governance structure and responsibilities of Sweden’s electricity supply companies (Palm, 2008). The new regulations (Government Bill 2005/06:27) strengthened the requirement for companies to make contingency provisions and ensured companies would be required to pay compensation when power outages exceeded 12 hours duration. This provides a strong economic incentive for suppliers to minimize prolonged outages.
Under Sweden’s Electricity Act, prioritization of electricity supply is not permitted during peacetime. For example, schools or hospitals have no greater right to supply than private consumers or shops. In practice, however, municipalities, which often have a backup supply derived from local generators, do have identified priorities. Moreover, municipalities are legally required to maintain services during crises and this has been interpreted as prioritizing municipal over private needs (Palm, 2008). By contrast, power companies had a strong financial incentive to avoid compensation payments by reconnecting as many private users as possible, thus prioritizing their needs over hospitals or aged care homes. After Gudrun, stakeholders questioned these respective approaches, in response to which each party attempted to deflect responsibility and blame to the other (Palm, 2008).
Gudrun exposed the failure of municipalities in affected areas to prepare and plan for disasters. Instead, their response relied on personal networks and informal problem solving. By the time Storm Per hit in 2007, affected municipalities had not reformed their operating methods.
In practice, electricity supply companies and municipalities have started to work more closely together to prepare for future events, although smaller municipalities do not have dedicated staff or resources to deal with electricity companies (Palm, 2008).
In response to the requirements for ensuring a stable energy supply, even during crises, electricity companies have started to bury a much higher proportion of their lines. In future, general disaster response would be well served by ensuring petrol stations continue to receive power, since most of the clean-up work is dependent on the supply of fuel (Swedish Energy Agency, 2007).
The events 45
In the short term, the Swedish Forest Agency provided support for forest owners affected by the storm, while the government provided a variety of financial benefits, including tax breaks and replanting subsidies, to support affected farmers (Swedish Forest Agency, 2006).
Changes to Sweden’s crisis management system The Swedish Civil Contingencies Agency (MSB) initially concluded that the crisis management system had worked efficiently. However, subsequent analysis identified two systemic flaws related to information and collaboration. The flow of information between relevant authorities and the public was not effective. In addition, the systems designed to ensure shared situational awareness were inadequate or absent. In 2006, a unit for preparedness and analysis was established in the Prime Minister’s Office. In 2007, the Emergency Management Agency and the Rescue Services Agency were merged, but were not absorbed into the Crisis Management Coordination Secretariat in the Prime Minister’s Office. Municipalities were also formally required to pass on situation reports to county boards (Nohrstedt and Parker, 2014).
The storm also led to reorganization of local and regional crisis management networks and, in particular, to the inclusion of private sector actors in power and communication companies’ crisis management networks.
By the time Storm Per struck two years later, Sweden’s crisis response methodology had improved. These can be ascribed to several factors:
• Many of the staff involved in the Per response had been involved in Gudrun and now knew what to do.
• Increased cooperation among some actors after Gudrun meant staff knew each other, helping them to communicate effectively.
• Collaboration between the private and public sector improved post-Gudrun, enabling a more effective response.
• Weather forecasting improved, meaning authorities took the Per threat much more seriously.
The improved response to Per was therefore the result of both organizational reform and experiential learning.
In order to better prepare for future disasters, the Swedish Forest Agency introduced a number of operational changes:
• develop a plan clarifying the responsibilities of different actors during crises, including cooperation between agencies and with the public;
• develop a system to streamline and normalizing the issue of harvest permissions following storms;
• develop a landscape-based risk assessment methodology for future storms to help guide interventions;
• develop guidelines to reduce the environmental impacts of clean-up activities, particularly in relation to soil damage and water resources, as well as heritage sites;
• improve the safety of workers involved in the clean-up and timber transport by introducing requirements for a simplified version of the “Green Card”
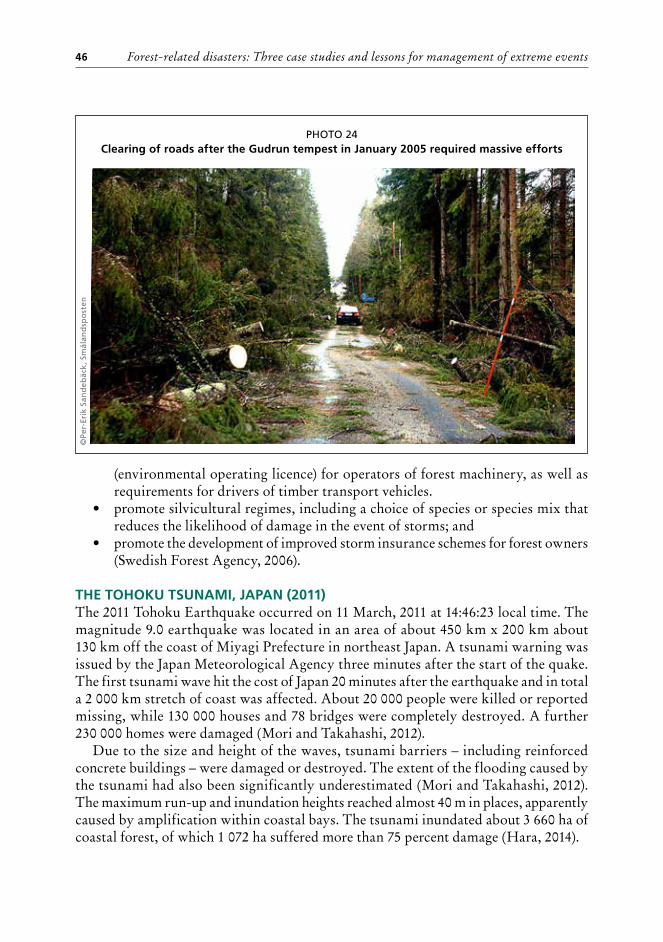
Forest-related disasters: Three case studies and lessons for management of extreme events46
(environmental operating licence) for operators of forest machinery, as well as requirements for drivers of timber transport vehicles.
• promote silvicultural regimes, including a choice of species or species mix that reduces the likelihood of damage in the event of storms; and
• promote the development of improved storm insurance schemes for forest owners (Swedish Forest Agency, 2006).
THE TOHOKU TSUNAMI, JAPAN (2011)The 2011 Tohoku Earthquake occurred on 11 March, 2011 at 14:46:23 local time. The magnitude 9.0 earthquake was located in an area of about 450 km x 200 km about 130 km off the coast of Miyagi Prefecture in northeast Japan. A tsunami warning was issued by the Japan Meteorological Agency three minutes after the start of the quake. The first tsunami wave hit the cost of Japan 20 minutes after the earthquake and in total a 2 000 km stretch of coast was affected. About 20 000 people were killed or reported missing, while 130 000 houses and 78 bridges were completely destroyed. A further 230 000 homes were damaged (Mori and Takahashi, 2012).
Due to the size and height of the waves, tsunami barriers – including reinforced concrete buildings – were damaged or destroyed. The extent of the flooding caused by the tsunami had also been significantly underestimated (Mori and Takahashi, 2012). The maximum run-up and inundation heights reached almost 40 m in places, apparently caused by amplification within coastal bays. The tsunami inundated about 3 660 ha of coastal forest, of which 1 072 ha suffered more than 75 percent damage (Hara, 2014).
PHOTO 24Clearing of roads after the Gudrun tempest in January 2005 required massive efforts
©Pe
r-Er
ik S
and
ebäc
k, S
mål
and
spo
sten
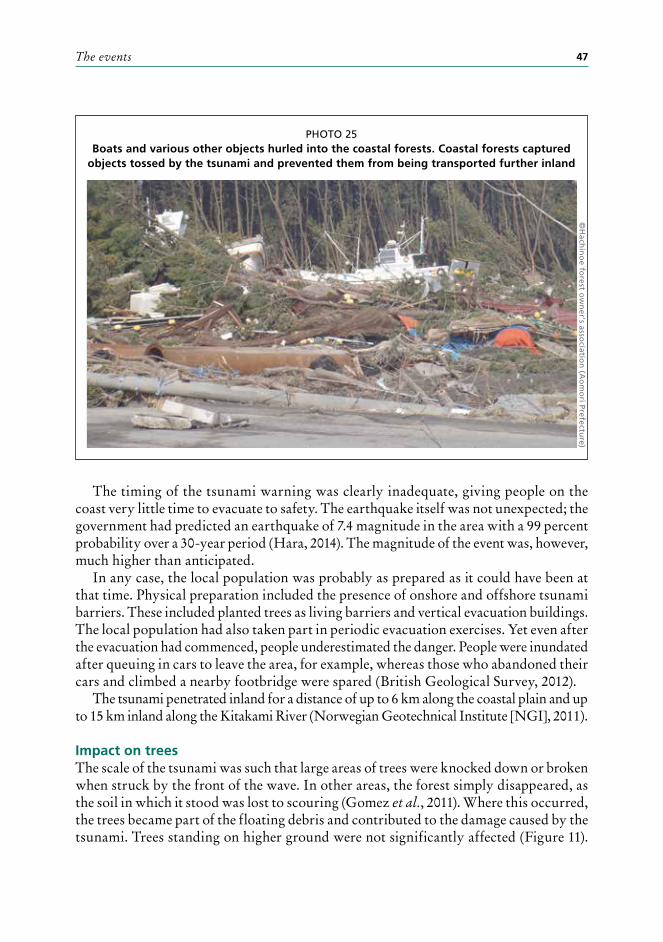
The events 47
PHOTO 25Boats and various other objects hurled into the coastal forests. Coastal forests captured
objects tossed by the tsunami and prevented them from being transported further inland
©H
achin
oe fo
rest ow
ner's asso
ciation
(Ao
mo
ri Prefecture)
The timing of the tsunami warning was clearly inadequate, giving people on the coast very little time to evacuate to safety. The earthquake itself was not unexpected; the government had predicted an earthquake of 7.4 magnitude in the area with a 99 percent probability over a 30-year period (Hara, 2014). The magnitude of the event was, however, much higher than anticipated.
In any case, the local population was probably as prepared as it could have been at that time. Physical preparation included the presence of onshore and offshore tsunami barriers. These included planted trees as living barriers and vertical evacuation buildings. The local population had also taken part in periodic evacuation exercises. Yet even after the evacuation had commenced, people underestimated the danger. People were inundated after queuing in cars to leave the area, for example, whereas those who abandoned their cars and climbed a nearby footbridge were spared (British Geological Survey, 2012).
The tsunami penetrated inland for a distance of up to 6 km along the coastal plain and up to 15 km inland along the Kitakami River (Norwegian Geotechnical Institute [NGI], 2011).
Impact on treesThe scale of the tsunami was such that large areas of trees were knocked down or broken when struck by the front of the wave. In other areas, the forest simply disappeared, as the soil in which it stood was lost to scouring (Gomez et al., 2011). Where this occurred, the trees became part of the floating debris and contributed to the damage caused by the tsunami. Trees standing on higher ground were not significantly affected (Figure 11).
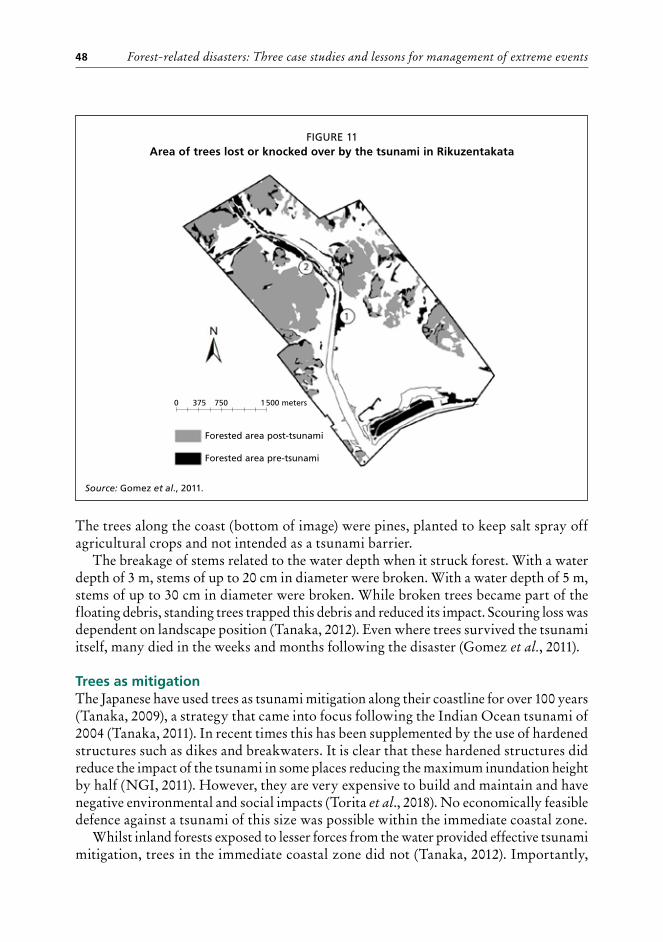
Forest-related disasters: Three case studies and lessons for management of extreme events48
FIGURE 11Area of trees lost or knocked over by the tsunami in Rikuzentakata
Source: Gomez et al., 2011.
Forested area post-tsunami
Forested area pre-tsunami
1 500 meters0 375 750
The trees along the coast (bottom of image) were pines, planted to keep salt spray off agricultural crops and not intended as a tsunami barrier.
The breakage of stems related to the water depth when it struck forest. With a water depth of 3 m, stems of up to 20 cm in diameter were broken. With a water depth of 5 m, stems of up to 30 cm in diameter were broken. While broken trees became part of the floating debris, standing trees trapped this debris and reduced its impact. Scouring loss was dependent on landscape position (Tanaka, 2012). Even where trees survived the tsunami itself, many died in the weeks and months following the disaster (Gomez et al., 2011).
Trees as mitigationThe Japanese have used trees as tsunami mitigation along their coastline for over 100 years (Tanaka, 2009), a strategy that came into focus following the Indian Ocean tsunami of 2004 (Tanaka, 2011). In recent times this has been supplemented by the use of hardened structures such as dikes and breakwaters. It is clear that these hardened structures did reduce the impact of the tsunami in some places reducing the maximum inundation height by half (NGI, 2011). However, they are very expensive to build and maintain and have negative environmental and social impacts (Torita et al., 2018). No economically feasible defence against a tsunami of this size was possible within the immediate coastal zone.
Whilst inland forests exposed to lesser forces from the water provided effective tsunami mitigation, trees in the immediate coastal zone did not (Tanaka, 2012). Importantly,

The events 49
PHOTO 26Forest showing clear limit of damaged area after the tsunami
PHOTO 27Coastal forest pushed down (Sendai city). Trees with stems broken at the base
and trees uprooted are mixed. Although the damage was massive, trees were not necessarily washed away, and thus did not become driftwood.
©To
mo
ti Sakamo
to©
Tom
oti Sakam
oto
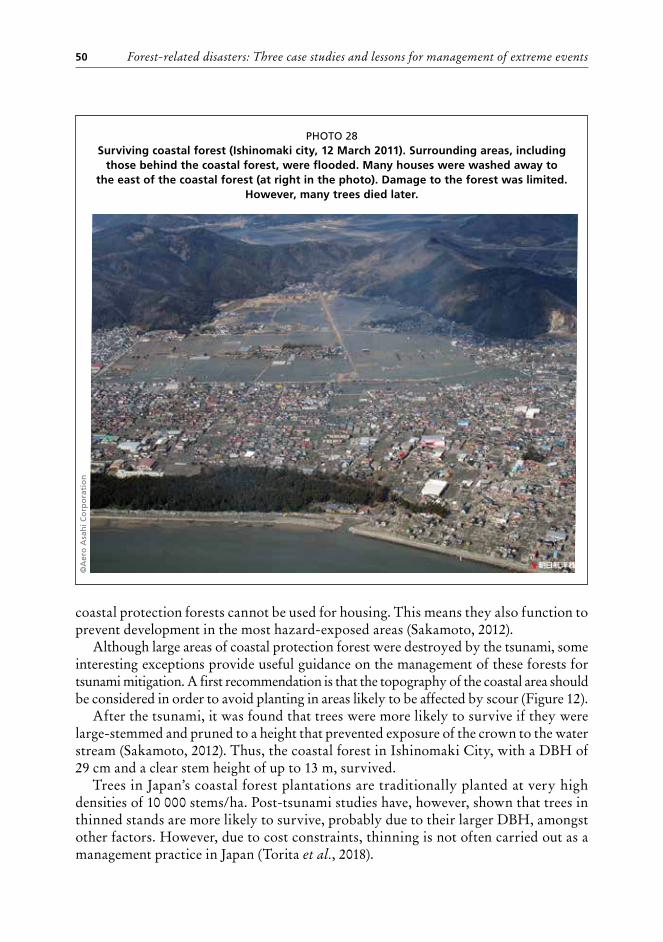
Forest-related disasters: Three case studies and lessons for management of extreme events50
PHOTO 28Surviving coastal forest (Ishinomaki city, 12 March 2011). Surrounding areas, including
those behind the coastal forest, were flooded. Many houses were washed away to the east of the coastal forest (at right in the photo). Damage to the forest was limited.
However, many trees died later.
©A
ero
Asa
hi C
orp
ora
tio
n
coastal protection forests cannot be used for housing. This means they also function to prevent development in the most hazard-exposed areas (Sakamoto, 2012).
Although large areas of coastal protection forest were destroyed by the tsunami, some interesting exceptions provide useful guidance on the management of these forests for tsunami mitigation. A first recommendation is that the topography of the coastal area should be considered in order to avoid planting in areas likely to be affected by scour (Figure 12).
After the tsunami, it was found that trees were more likely to survive if they were large-stemmed and pruned to a height that prevented exposure of the crown to the water stream (Sakamoto, 2012). Thus, the coastal forest in Ishinomaki City, with a DBH of 29 cm and a clear stem height of up to 13 m, survived.
Trees in Japan’s coastal forest plantations are traditionally planted at very high densities of 10 000 stems/ha. Post-tsunami studies have, however, shown that trees in thinned stands are more likely to survive, probably due to their larger DBH, amongst other factors. However, due to cost constraints, thinning is not often carried out as a management practice in Japan (Torita et al., 2018).
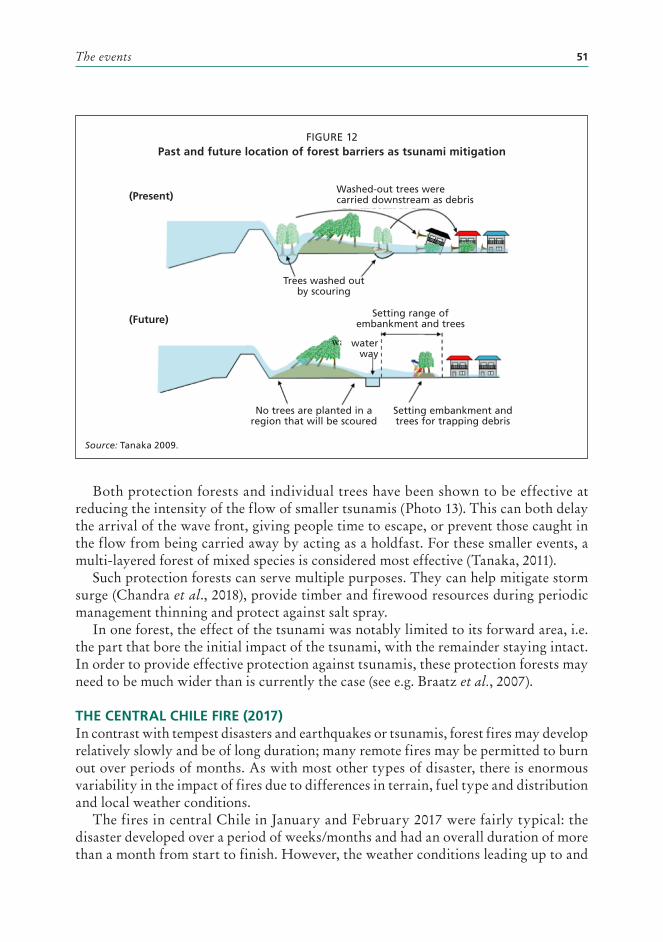
The events 51
Both protection forests and individual trees have been shown to be effective at reducing the intensity of the flow of smaller tsunamis (Photo 13). This can both delay the arrival of the wave front, giving people time to escape, or prevent those caught in the flow from being carried away by acting as a holdfast. For these smaller events, a multi-layered forest of mixed species is considered most effective (Tanaka, 2011).
Such protection forests can serve multiple purposes. They can help mitigate storm surge (Chandra et al., 2018), provide timber and firewood resources during periodic management thinning and protect against salt spray.
In one forest, the effect of the tsunami was notably limited to its forward area, i.e. the part that bore the initial impact of the tsunami, with the remainder staying intact. In order to provide effective protection against tsunamis, these protection forests may need to be much wider than is currently the case (see e.g. Braatz et al., 2007).
THE CENTRAL CHILE FIRE (2017)In contrast with tempest disasters and earthquakes or tsunamis, forest fires may develop relatively slowly and be of long duration; many remote fires may be permitted to burn out over periods of months. As with most other types of disaster, there is enormous variability in the impact of fires due to differences in terrain, fuel type and distribution and local weather conditions.
The fires in central Chile in January and February 2017 were fairly typical: the disaster developed over a period of weeks/months and had an overall duration of more than a month from start to finish. However, the weather conditions leading up to and
FIGURE 12Past and future location of forest barriers as tsunami mitigation
Source: Tanaka 2009.
(Present)
(Future)
Washed-out trees were carried downstream as debris
Trees washed out by scouring
No trees are planted in a region that will be scoured
Setting embankment and trees for trapping debris
Setting range of embankment and trees
water way
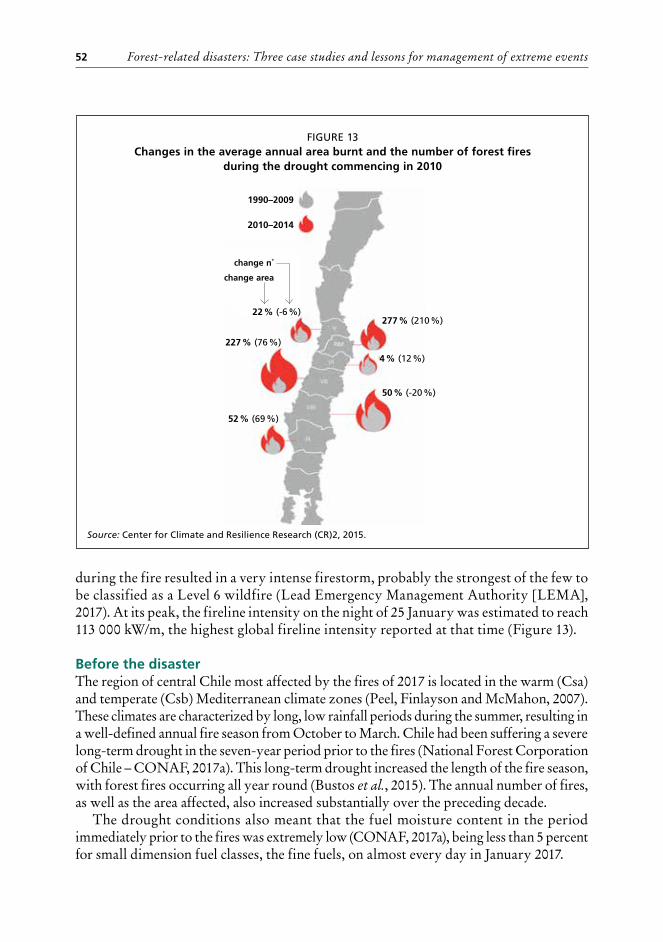
Forest-related disasters: Three case studies and lessons for management of extreme events52
during the fire resulted in a very intense firestorm, probably the strongest of the few to be classified as a Level 6 wildfire (Lead Emergency Management Authority [LEMA], 2017). At its peak, the fireline intensity on the night of 25 January was estimated to reach 113 000 kW/m, the highest global fireline intensity reported at that time (Figure 13).
Before the disasterThe region of central Chile most affected by the fires of 2017 is located in the warm (Csa) and temperate (Csb) Mediterranean climate zones (Peel, Finlayson and McMahon, 2007). These climates are characterized by long, low rainfall periods during the summer, resulting in a well-defined annual fire season from October to March. Chile had been suffering a severe long-term drought in the seven-year period prior to the fires (National Forest Corporation of Chile – CONAF, 2017a). This long-term drought increased the length of the fire season, with forest fires occurring all year round (Bustos et al., 2015). The annual number of fires, as well as the area affected, also increased substantially over the preceding decade.
The drought conditions also meant that the fuel moisture content in the period immediately prior to the fires was extremely low (CONAF, 2017a), being less than 5 percent for small dimension fuel classes, the fine fuels, on almost every day in January 2017.
FIGURE 13Changes in the average annual area burnt and the number of forest fires
during the drought commencing in 2010
Source: Center for Climate and Resilience Research (CR)2, 2015.
1990–2009
2010–2014
277 % (210 %)
4 % (12 %)
50 % (-20 %)
52 % (69 %)
227 % (76 %)
22 % (-6 %)
change n˚
change area
The events 53
Before the fires, the increased risk of damage to houses was beginning to attract attention, particularly at the Wildland-Urban Interface (WUI) of major cities such as Valparaiso (Ubeda and Sarricolea, 2016). Notably, there was a strong historical increase in the number of wildfires from the 1970s to the 2000s, coinciding with an expanded plantation area (Peña-Fernández and Valenzuela-Palma, 2008). This increased fire rate was attributed to greater land accessibility and population growth in the plantation areas. Most forest fires in Chile are of human origin (however, the few of natural origin tend to be larger). Poor regulation of rural housing development resulted in increased housing in forested areas, while replacement of wood fuel taken from the forest with more convenient alternatives led to a build-up of fuel close to these houses and across the forest estate (Ubeda and Sarricolea, 2016).
On 24 October 2016, the Chilean government issued an emergency decree to mobilize preventative fire control activities, with an additional budget allocation of about USD 5 million to the Chile National Forest Corporation (CONAF) for these activities (Ministry of the Interior and Public Safety, Chile, 2017).
In November 2016, attention in Chile was increasingly paid to the increased risk of fire disasters, the need for improved support for firefighters and the importance of fire-adapted land-use allocation to respond to this risk (Dominguez, 2016). California Fire Service (Cal Fire) and CONAF signed a wide-ranging cooperation agreement. A review of fire management in Chile found that the situation could not be resolved by using past methods. The fires were changing and fire management capacity was required to change with it, especially to address fires in remote areas and the urban-wildland interface. Fire management required integration (expansion and balance) to include research and analysis, risk reduction, readiness and recovery programs that complemented an efficient fire response system (Moore, 2019, personal communication).
The Government, acting on information about the severity of the drought conditions, began activating its emergency systems in November, while CONAF activated its Strategic Committee on Firefighting on 21 December.
It is clear from the above that the extreme conditions of the fire season were well anticipated.
Development of the firesAs noted previously, the development of the disaster was gradual; forest fires became increasingly common from November 2016 onwards, in response to which both the national authorities and private industry slowly but steadily increased their firefighting efforts. In October 2016, CONAF deployed six firefighting aircraft. By the end of the emergency on 5 February 2017, CONAF had deployed 64 aircraft, eight of which were sourced internationally (Ministry of the Interior and Public Safety, Chile, 2017).
Records from the private company Forestal Arauco (Figure 14) depict the development of the disaster as well as its eventual loss of control over the situation. Up until 13 January 2017, the company was able to extinguish fires as quickly as they occurred. From 14 January onwards, however, some fires could not be extinguished within hours. This was presumably due to the increased rate at which new fires were occurring from between 10 and 20 per day over the first fortnight to between 20 and 30 in the week 14–21 January.

Forest-related disasters: Three case studies and lessons for management of extreme events54
By the end of the first week of February, the fires had covered a total area of 518 000 ha. Of this, a little more than half consisted of exotic plantations, while less than 10 percent were agricultural crops or intended for other intensive human uses. Almost 40 percent consisted of Mediterranean scrublands (matorral, 18 percent) or native forest (20 percent) (CONAF, 2017b).
The distribution of the fires is shown above (Figure 15).January 2017 was unusually hot, with record high temperatures recorded in the
region where the fires occurred. The unprecedented average daily maximum of 33 ºC exceeded the long-term average by 3.2 ºC. On 26 January, most weather stations recorded temperatures exceeded only once in 50 to 100 years (Ministry of the Interior and Public Safety, Chile, 2017).
During the month of January, Chile was affected by a high-level temperature inversion caused by a Pacific high pressure system. This meant hot air was trapped in the central valley region, resulting in ever-increasing temperatures (CONAF, 2017a). Following the creation of a small area of low pressure the previous day, air was drawn in from the southeast and northwest on the night of 25–26 January, creating the conditions for an extreme firestorm. The hot air created by this firestorm was able to break through the inversion, leading to an increased convective airflow and cyclonic conditions associated with the fires. Although the wind speed measured at weather stations outside the storm area was in the 10–20 kph range, wind speeds inside the firestorm were estimated to reach 100–130 kph (LEMA, 2017).
The firestorms on the night of 25–26 January 2017 were gigantic. In one night, the area burnt was twice the size of Santiago or New York City and almost as big as greater London. In the Las Máquinas complex, 115 000 ha were burnt in 14 hours, while in the San Antonio complex 27 000 ha were burnt in 10 hours. This 14-hour period accounted
FIGURE 14Forestal Arauco’s firefighting activities each day in January 2017
Source: Arauco, 2017a.
0
20
5
25
10
30
40
50
15
35
45
01/0
1/20
17
9
13/0
1/20
17
17
07/0
1/20
17
15
19/0
1/20
17
28
26/0
1/20
17
21
04/0
1/20
17
21
16/0
1/20
17
13
10/0
1/20
17
12
22/0
1/20
17
32
29/0
1/20
17
8
03/0
1/20
17
10
15/0
1/20
17
21
09/0
1/20
17
8
21/0
1/20
17
26
28/0
1/20
17
7
06/0
1/20
17
11
18/0
1/20
17
26
25/0
1/20
17
25
12/0
1/20
17
13
24/0
1/20
17
25
31/0
1/20
17
8
02/0
1/20
17
14
14/0
1/20
17
27
08/0
1/20
17
6
20/0
1/20
17
31
27/0
1/20
17
9
05/0
1/20
17
15
17/0
1/20
17
2411
/01/
2017
15
23/0
1/20
17
14
30/0
1/20
17
14
under observation under suppression extinguished daily documentation
9 86
14 15 15 1510 11 12 13 13
7 7 79 9
18
13
8
14
23
2119
11
23
30
1925
27
28
30
13
19
15 12 18
31
15
27
20
2126
1 1 2 22 2 2 3 346 10 9
21 1 2 4 4
21
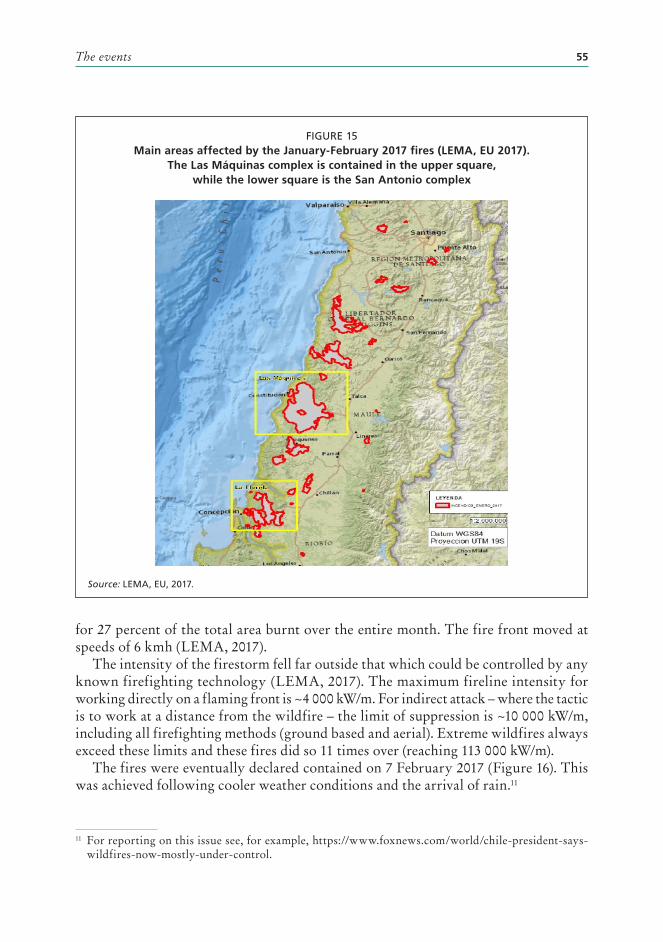
The events 55
for 27 percent of the total area burnt over the entire month. The fire front moved at speeds of 6 kmh (LEMA, 2017).
The intensity of the firestorm fell far outside that which could be controlled by any known firefighting technology (LEMA, 2017). The maximum fireline intensity for working directly on a flaming front is ~4 000 kW/m. For indirect attack – where the tactic is to work at a distance from the wildfire – the limit of suppression is ~10 000 kW/m, including all firefighting methods (ground based and aerial). Extreme wildfires always exceed these limits and these fires did so 11 times over (reaching 113 000 kW/m).
The fires were eventually declared contained on 7 February 2017 (Figure 16). This was achieved following cooler weather conditions and the arrival of rain.11
FIGURE 15Main areas affected by the January-February 2017 fires (LEMA, EU 2017).
The Las Máquinas complex is contained in the upper square, while the lower square is the San Antonio complex
Source: LEMA, EU, 2017.
11 For reporting on this issue see, for example, https://www.foxnews.com/world/chile-president-says-wildfires-now-mostly-under-control.

Forest-related disasters: Three case studies and lessons for management of extreme events56
Immediate responseFirefightingBoth the government and private entities steadily increased the resources directed towards firefighting as the crisis developed.
On 20 January, the President declared a disaster for Chile’s affected regions and requested international assistance (ReliefWeb, 2017). This arrived over subsequent days by way of additional firefighting aircraft, heavy equipment and 635 international firefighters, many of whom were volunteers. In total, 17 countries provided direct support.
On 7 February, CONAF had involved 15 973 people in the firefighting effort, including 8 683 members of the armed forces, 550 firefighters and international experts (ONEMI, 2017). By that time, 135 heavy machines had constructed 507 km of firebreaks.
Private companies also contributed to the firefighting effort. Forestal Arauco, for example, deployed 10 helicopters, 8 water bombers, 100 vehicles and 1 426 firefighters (Arauco, 2017a). It also brought in experienced firefighting relief pilots from Spain.
In total, 11 people were killed during the crisis. Four of these were civilians, while the rest were involved in fire-related activities (Ministry of the Interior and Public Safety, Chile, 2017).
/FIGURE 16
Key events during the firestorm at four sites
Source: LEMA, EU, 2017.
20/01/2017 22:56 hrs
detection of forest fire in Las Maquinas
21/01/2017 10:51 hrs
detection of forest fire in San Antonio
25-26/01/2017 the San Antonio
fire advances 27 000 ha in
10 hours
25/01/2017 18:38 hrs
fires detected in Tomeco 25-26/01/2017
The Las Maquinas fires advances
115 000 ha in 14 hours
09/02/2017 16:21 hrs
the Tomeco fires (13 954 ha) under control
05/02/2017 15:09 hrs
the fires in Chalmavida (15 493 ha) under
control
06/02/2017 14:42 hrs
detection of forest fire in Las Maquinas
03/02/2017 17:24 hrs
the fires in Las Maquinas (183 946 ha) under
control
26/01/2017 15:42
fires detected in Chalmavida

The events 57
Evacuation of populationThe evacuation of towns and villages appears to have been highly successful; there were only four civilian fatalities. The town of Santa Olga was completely destroyed by fire but all of its inhabitants were evacuated on 24 January before the firestorm struck. Four fatalities were recorded amongst firemen and police officers caught in the fire while helping civilians to escape (Online news from Chile – Emol, 2017).
ArsonDue to the low incidence of natural fires in Chile it had been assumed the majority of fires were of human – and mainly accidental – origin (Ubeda and Sarricolea, 2016). However, by the end of the emergency police had arrested and charged more than 40 people in association with the fires. Further investigation indicated the majority of cases were the result of negligence, some were due to pyromania and none were considered acts of terrorism (i.e. associated with Mapuche territorial claims) (Ministry of the Interior and Public Safety, Chile, 2017).
Government responseDuring the development of the fires the government issued 12 decrees covering most of the affected area. These decrees were of two types, which either declared a disaster area or issued an “exceptional decree.” The first provided for additional support as well as taking temporary central control of resources. The second limited individual rights and placed the affected region under the control of the head of the Defence Force to maintain public order (Ministry of the Interior and Public Safety, Chile, 2017).
Impacts of the fireThere was considerable spatial variation of the fire’s intensity. Of the total area affected, 29 percent experienced low intensity fire, 52 percent experienced medium intensity fire and 17 percent experienced high intensity fire. The fire intensity impacted every aspect of the damage, particularly to the soil (CONAF, 2017c).
Social impactsThe number of people affected by the fire grew steadily during the emergency and large numbers of people were moved to shelters. At the end of the emergency on 7 February, the United Nations Office in Chile reported that 7 157 people could be considered victims and 1 644 homes had been destroyed (ReliefWeb, 2017). A further 800 homes were damaged by the fire (CONAF, 2017a), while 441 people were accommodated in 46 shelters. The fire also cut or damaged electricity transmission infrastructure leading to power cuts, as well as cutting off roads in some areas.
The agriculture sector was significantly hit, with over 3 000 farmers experiencing damage. Fires affected 31 500 ha of agricultural land, including significant areas of high value vineyards. Approximately 100 vineyards suffered direct fire damage, while a significant wine yield was lost due to smoke taint (Balter, 2017). There was also significant
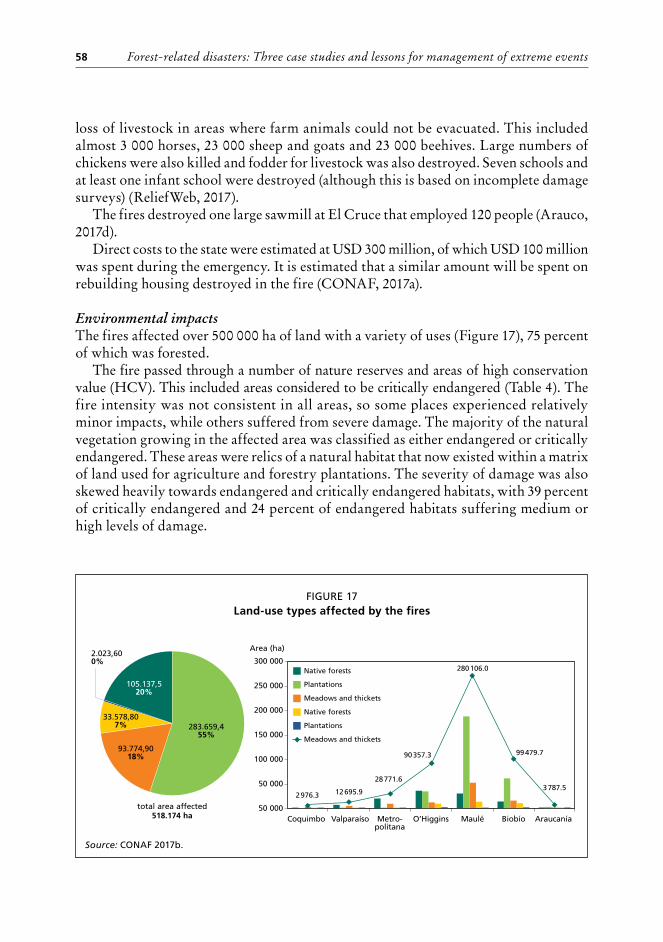
Forest-related disasters: Three case studies and lessons for management of extreme events58
loss of livestock in areas where farm animals could not be evacuated. This included almost 3 000 horses, 23 000 sheep and goats and 23 000 beehives. Large numbers of chickens were also killed and fodder for livestock was also destroyed. Seven schools and at least one infant school were destroyed (although this is based on incomplete damage surveys) (ReliefWeb, 2017).
The fires destroyed one large sawmill at El Cruce that employed 120 people (Arauco, 2017d).
Direct costs to the state were estimated at USD 300 million, of which USD 100 million was spent during the emergency. It is estimated that a similar amount will be spent on rebuilding housing destroyed in the fire (CONAF, 2017a).
Environmental impactsThe fires affected over 500 000 ha of land with a variety of uses (Figure 17), 75 percent of which was forested.
The fire passed through a number of nature reserves and areas of high conservation value (HCV). This included areas considered to be critically endangered (Table 4). The fire intensity was not consistent in all areas, so some places experienced relatively minor impacts, while others suffered from severe damage. The majority of the natural vegetation growing in the affected area was classified as either endangered or critically endangered. These areas were relics of a natural habitat that now existed within a matrix of land used for agriculture and forestry plantations. The severity of damage was also skewed heavily towards endangered and critically endangered habitats, with 39 percent of critically endangered and 24 percent of endangered habitats suffering medium or high levels of damage.
FIGURE 17Land-use types affected by the fires
Source: CONAF 2017b.
2.023,600%
total area affected518.174 ha
283.659,455%
93.774,9018%
105.137,520%
33.578,807%
50 000
150 000
250 000
300 000
50 000
100 000
200 000
Coquimbo Valparaíso O’Higgins Maulé Biobío AraucaníaMetro-politana
Native forests
Native forests
Plantations
Plantations
Meadows and thickets
Meadows and thickets
Area (ha)
2 976.3 12 695.9
28 771.6
90 357.3 99 479.7
3 787.5
280 106.0
The events 59
TABLE 4Level of impact in relation to the conservation status of natural ecosystems affected by the fires
Conservation status of ecosystem
Very low
Share of total
area affected
(%)
Low Share of total
area affected
(%)
Medium low
Share of total
area affected
(%)
Medium high
Share of total
area affected
(%)
High Share of total
area affected
(%)
Total
In critical danger
11 619 16 16 577 23 16 923 23 15 535 21 12 989 18 73 644
In danger 19 423 23 28 191 33 18 317 21 12 580 15 7 775 9 86 287
Vulnerable 3 883 10 10 660 27 12 573 32 9 679 24 2 718 7 39 513
Almost threatened
561 13 1 698 38 1 151 26 734 17 274 6 4 417
Minor concern 676 14 2 157 44 1 694 35 301 6 29 1 4 857
Total (ha) and percentage of area affected
36 162 17 59 283 28 50 657 24 38 829 19 23 786 11 208 717
Source: CONAF, 2017b.
Short-term responsesStrategic planningOne private sector company, Arauco, developed a strategic plan during the three months after the fires to guide its activities, with the aim of mitigating the long-term impacts of the fires and restoring forest productivity (Arauco, 2017c). This planning prioritized activities according to social and environmental risks, taking into account financial, human and physical resource constraints. Thus, factors such as the availability of nursery seedlings and capacity placed a clear constraint on the scale at which replanting could occur.
The plan addressed issues such as the risk of erosion and the supply of drinking water to local populations. It also considered new ways of mitigating long-term fire risks in cooperation with communities (a requirement of the government’s plantations protocol) (CONAF, 2017d).
The company prioritized actions to safeguard the supply of drinking water based on the numbers of people affected. Fourteen out of a total of 128 water extraction points provided water for 98 percent of all those affected. By May 2017, physical work to safeguard water quality at these points had commenced. The company also took action to promote the restoration of its identified HCV areas. The Chilean forest is, to some extent, adapted to fire. While many trees will re-sprout after fire, restoration also depends on soil maintenance, elimination of invasive alien plants and exclusion of livestock (Arauco, 2017c).
The company also collaborated with smaller producers by providing them with good quality seedlings to re-establish their plantations. It recognized the need to take a more nuanced landscape approach over the long term, as well as increase cooperation with local communities in order to reduce fire risks.
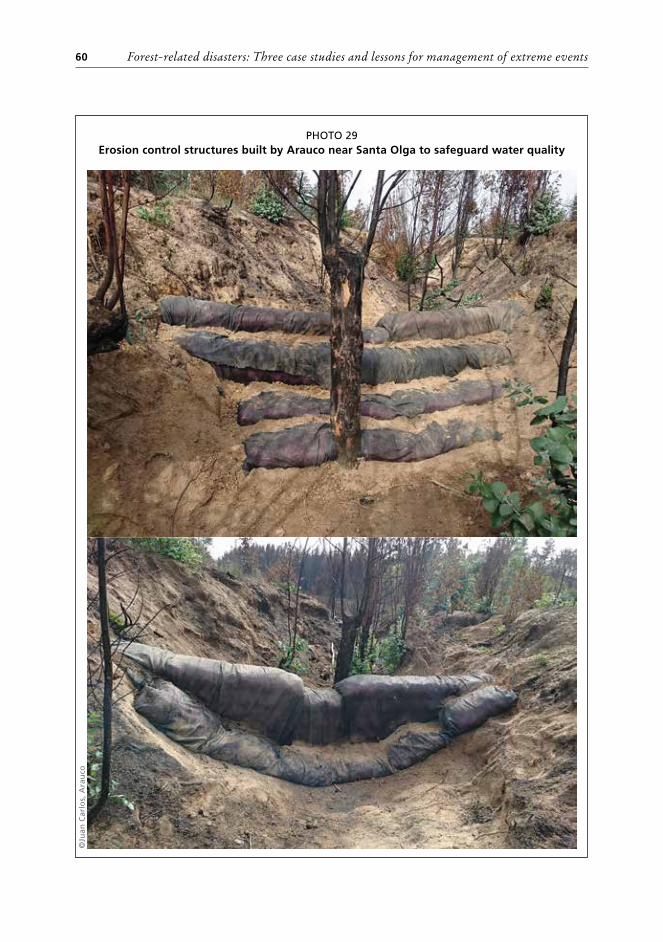
Forest-related disasters: Three case studies and lessons for management of extreme events60
PHOTO 29Erosion control structures built by Arauco near Santa Olga to safeguard water quality
©Ju
an C
arlo
s, A
rau
co
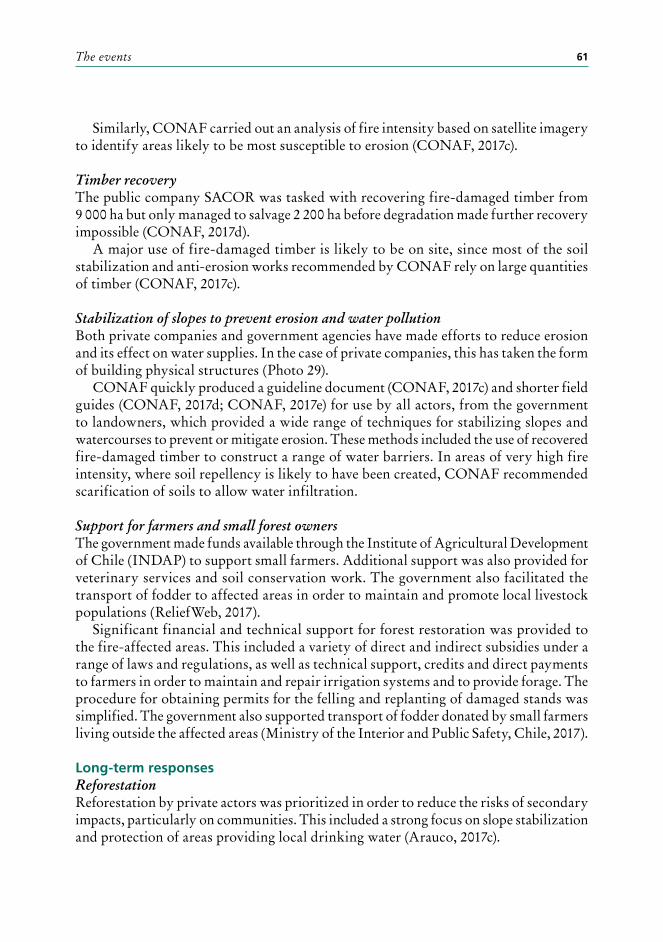
The events 61
Similarly, CONAF carried out an analysis of fire intensity based on satellite imagery to identify areas likely to be most susceptible to erosion (CONAF, 2017c).
Timber recoveryThe public company SACOR was tasked with recovering fire-damaged timber from 9 000 ha but only managed to salvage 2 200 ha before degradation made further recovery impossible (CONAF, 2017d).
A major use of fire-damaged timber is likely to be on site, since most of the soil stabilization and anti-erosion works recommended by CONAF rely on large quantities of timber (CONAF, 2017c).
Stabilization of slopes to prevent erosion and water pollutionBoth private companies and government agencies have made efforts to reduce erosion and its effect on water supplies. In the case of private companies, this has taken the form of building physical structures (Photo 29).
CONAF quickly produced a guideline document (CONAF, 2017c) and shorter field guides (CONAF, 2017d; CONAF, 2017e) for use by all actors, from the government to landowners, which provided a wide range of techniques for stabilizing slopes and watercourses to prevent or mitigate erosion. These methods included the use of recovered fire-damaged timber to construct a range of water barriers. In areas of very high fire intensity, where soil repellency is likely to have been created, CONAF recommended scarification of soils to allow water infiltration.
Support for farmers and small forest ownersThe government made funds available through the Institute of Agricultural Development of Chile (INDAP) to support small farmers. Additional support was also provided for veterinary services and soil conservation work. The government also facilitated the transport of fodder to affected areas in order to maintain and promote local livestock populations (ReliefWeb, 2017).
Significant financial and technical support for forest restoration was provided to the fire-affected areas. This included a variety of direct and indirect subsidies under a range of laws and regulations, as well as technical support, credits and direct payments to farmers in order to maintain and repair irrigation systems and to provide forage. The procedure for obtaining permits for the felling and replanting of damaged stands was simplified. The government also supported transport of fodder donated by small farmers living outside the affected areas (Ministry of the Interior and Public Safety, Chile, 2017).
Long-term responsesReforestation Reforestation by private actors was prioritized in order to reduce the risks of secondary impacts, particularly on communities. This included a strong focus on slope stabilization and protection of areas providing local drinking water (Arauco, 2017c).
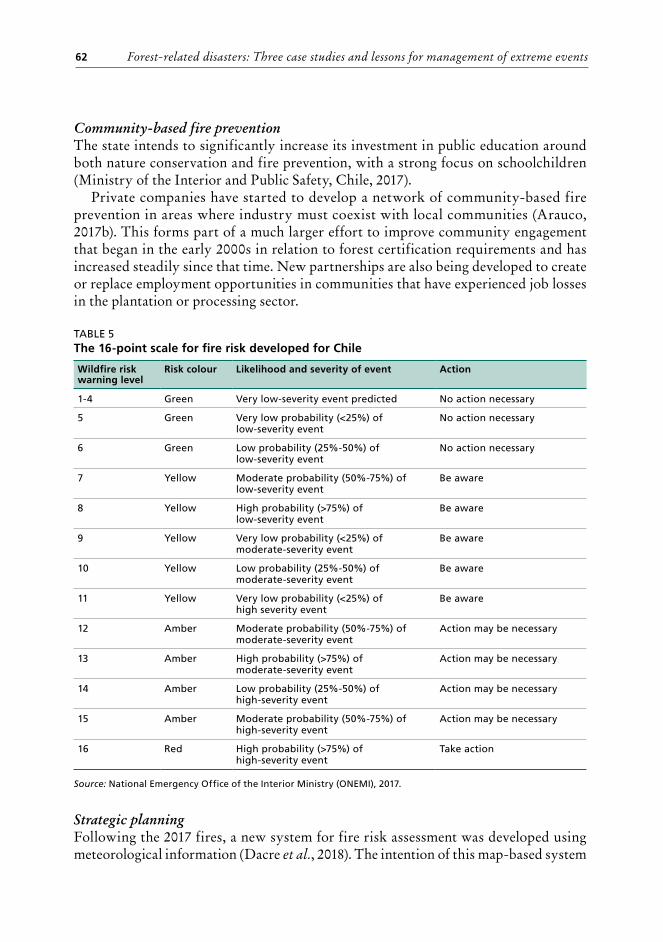
Forest-related disasters: Three case studies and lessons for management of extreme events62
Community-based fire preventionThe state intends to significantly increase its investment in public education around both nature conservation and fire prevention, with a strong focus on schoolchildren (Ministry of the Interior and Public Safety, Chile, 2017).
Private companies have started to develop a network of community-based fire prevention in areas where industry must coexist with local communities (Arauco, 2017b). This forms part of a much larger effort to improve community engagement that began in the early 2000s in relation to forest certification requirements and has increased steadily since that time. New partnerships are also being developed to create or replace employment opportunities in communities that have experienced job losses in the plantation or processing sector.
TABLE 5The 16-point scale for fire risk developed for Chile
Wildfire risk warning level
Risk colour Likelihood and severity of event Action
1-4 Green Very low-severity event predicted No action necessary
5 Green Very low probability (<25%) of low-severity event
No action necessary
6 Green Low probability (25%-50%) of low-severity event
No action necessary
7 Yellow Moderate probability (50%-75%) of low-severity event
Be aware
8 Yellow High probability (>75%) of low-severity event
Be aware
9 Yellow Very low probability (<25%) of moderate-severity event
Be aware
10 Yellow Low probability (25%-50%) of moderate-severity event
Be aware
11 Yellow Very low probability (<25%) of high severity event
Be aware
12 Amber Moderate probability (50%-75%) of moderate-severity event
Action may be necessary
13 Amber High probability (>75%) of moderate-severity event
Action may be necessary
14 Amber Low probability (25%-50%) of high-severity event
Action may be necessary
15 Amber Moderate probability (50%-75%) of high-severity event
Action may be necessary
16 Red High probability (>75%) of high-severity event
Take action
Source: National Emergency Office of the Interior Ministry (ONEMI), 2017.
Strategic planning Following the 2017 fires, a new system for fire risk assessment was developed using meteorological information (Dacre et al., 2018). The intention of this map-based system

The events 63
was to give authorities a few days additional warning about the location of risk in order to allocate resources and take necessary actions. This new methodology highlights the difficulty of communicating fire risk and necessary actions to the public. In particular, the 16-point scale for fire risk developed by the National Emergency Office of the Interior Ministry (ONEMI). (Table 5) is not easily understood by the general public.
Arauco developed a strategic plan for post-fire recovery known as de Raiz (from the roots) (Arauco, 2017b). This plan, which recognized the need to restructure its business from the ground up, was based on four pillars:
• Prevention - how to reduce fire frequency
• Protection - changes in the company model for firefighting - how to integrate fire variability into the design of the forest estate - how to ensure local populations feel safe
• Reforestation - how to restore the complete forest environment, including environmental
services• Boosting
- how to restore and increase local forest-based economies for the benefit of neighbouring communities.
Analysis and policy implications The fires caused large-scale economic, environmental and social damage.
Policy responsesChile’s Auditor General criticized CONAF’s decision to contract out firefighting aircraft during the emergency, which led to losses of almost USD 2 million (Emol, 2018). This criticism related to a public debate about whether aircraft were sufficiently effective in fighting fire to justify their high costs (Ministry of the Interior and Public Safety, Chile, 2017), and was based on an erroneous view that the role of aircraft was to extinguish fires. For the most part, aircraft is in fact used to create the conditions in which ground-based firefighters are able to access areas necessary for fire control (Excell, 2018). Both aircraft and ground crews are subject to the limits of suppression. Expensive resources should therefore only be used in situations where controlling fires is feasible. Otherwise, the protection of lives and property should be prioritized.
After the crisis passed, the practice of intensively planting pines and eucalyptus trees, particularly near residential areas, was criticized. The lack of adequate firebreak preparation was also noted (Kozak and Watts, 2017). Native trees not only burned more slowly but were easier to control due to their higher moisture content.
In the face of increasing risk due to climate change, there have been growing calls for greater regulation and improved land-use planning to increase landscape diversity and thereby reduce fire risk (Gómez-González, Ojeda and Fernandes, 2017; CONAF, 2017b).
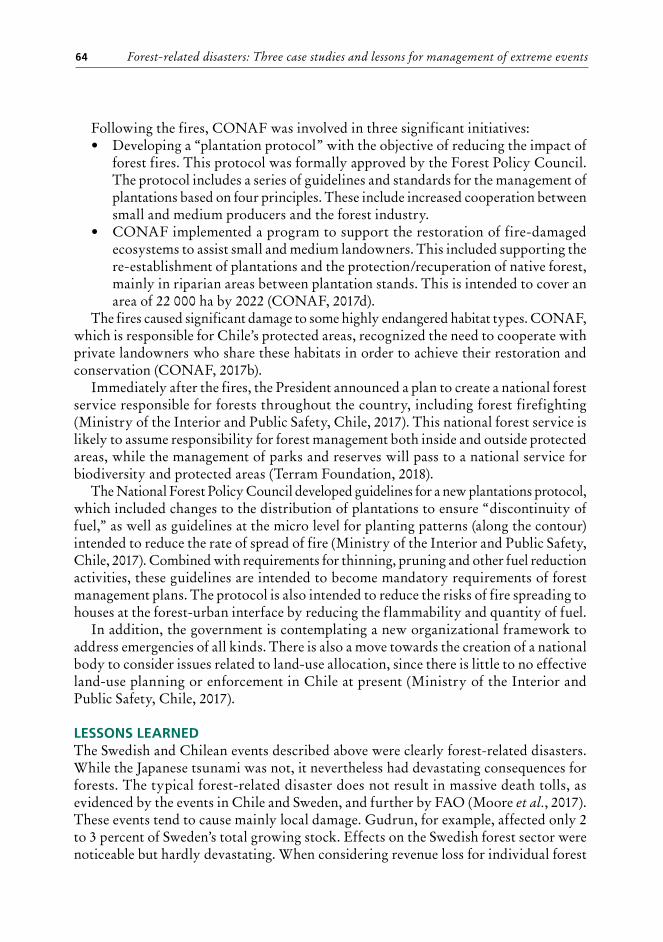
Forest-related disasters: Three case studies and lessons for management of extreme events64
Following the fires, CONAF was involved in three significant initiatives:• Developing a “plantation protocol” with the objective of reducing the impact of
forest fires. This protocol was formally approved by the Forest Policy Council. The protocol includes a series of guidelines and standards for the management of plantations based on four principles. These include increased cooperation between small and medium producers and the forest industry.
• CONAF implemented a program to support the restoration of fire-damaged ecosystems to assist small and medium landowners. This included supporting the re-establishment of plantations and the protection/recuperation of native forest, mainly in riparian areas between plantation stands. This is intended to cover an area of 22 000 ha by 2022 (CONAF, 2017d).
The fires caused significant damage to some highly endangered habitat types. CONAF, which is responsible for Chile’s protected areas, recognized the need to cooperate with private landowners who share these habitats in order to achieve their restoration and conservation (CONAF, 2017b).
Immediately after the fires, the President announced a plan to create a national forest service responsible for forests throughout the country, including forest firefighting (Ministry of the Interior and Public Safety, Chile, 2017). This national forest service is likely to assume responsibility for forest management both inside and outside protected areas, while the management of parks and reserves will pass to a national service for biodiversity and protected areas (Terram Foundation, 2018).
The National Forest Policy Council developed guidelines for a new plantations protocol, which included changes to the distribution of plantations to ensure “discontinuity of fuel,” as well as guidelines at the micro level for planting patterns (along the contour) intended to reduce the rate of spread of fire (Ministry of the Interior and Public Safety, Chile, 2017). Combined with requirements for thinning, pruning and other fuel reduction activities, these guidelines are intended to become mandatory requirements of forest management plans. The protocol is also intended to reduce the risks of fire spreading to houses at the forest-urban interface by reducing the flammability and quantity of fuel.
In addition, the government is contemplating a new organizational framework to address emergencies of all kinds. There is also a move towards the creation of a national body to consider issues related to land-use allocation, since there is little to no effective land-use planning or enforcement in Chile at present (Ministry of the Interior and Public Safety, Chile, 2017).
LESSONS LEARNEDThe Swedish and Chilean events described above were clearly forest-related disasters. While the Japanese tsunami was not, it nevertheless had devastating consequences for forests. The typical forest-related disaster does not result in massive death tolls, as evidenced by the events in Chile and Sweden, and further by FAO (Moore et al., 2017). These events tend to cause mainly local damage. Gudrun, for example, affected only 2 to 3 percent of Sweden’s total growing stock. Effects on the Swedish forest sector were noticeable but hardly devastating. When considering revenue loss for individual forest
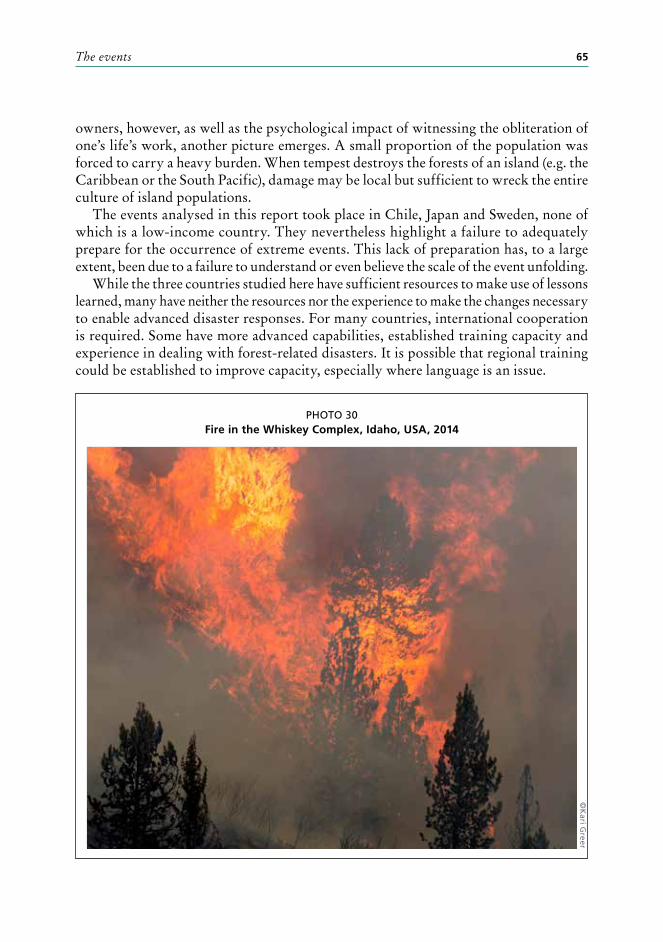
The events 65
PHOTO 30Fire in the Whiskey Complex, Idaho, USA, 2014
©K
ari Greer
owners, however, as well as the psychological impact of witnessing the obliteration of one’s life’s work, another picture emerges. A small proportion of the population was forced to carry a heavy burden. When tempest destroys the forests of an island (e.g. the Caribbean or the South Pacific), damage may be local but sufficient to wreck the entire culture of island populations.
The events analysed in this report took place in Chile, Japan and Sweden, none of which is a low-income country. They nevertheless highlight a failure to adequately prepare for the occurrence of extreme events. This lack of preparation has, to a large extent, been due to a failure to understand or even believe the scale of the event unfolding.
While the three countries studied here have sufficient resources to make use of lessons learned, many have neither the resources nor the experience to make the changes necessary to enable advanced disaster responses. For many countries, international cooperation is required. Some have more advanced capabilities, established training capacity and experience in dealing with forest-related disasters. It is possible that regional training could be established to improve capacity, especially where language is an issue.
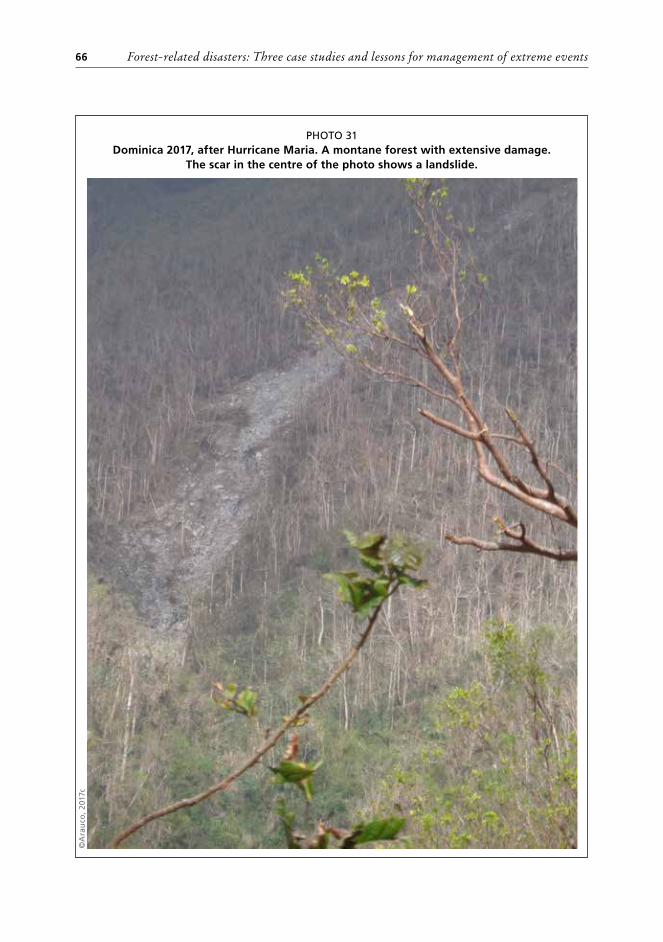
Forest-related disasters: Three case studies and lessons for management of extreme events66
PHOTO 31Dominica 2017, after Hurricane Maria. A montane forest with extensive damage.
The scar in the centre of the photo shows a landslide.
©A
rau
co, 2
017c
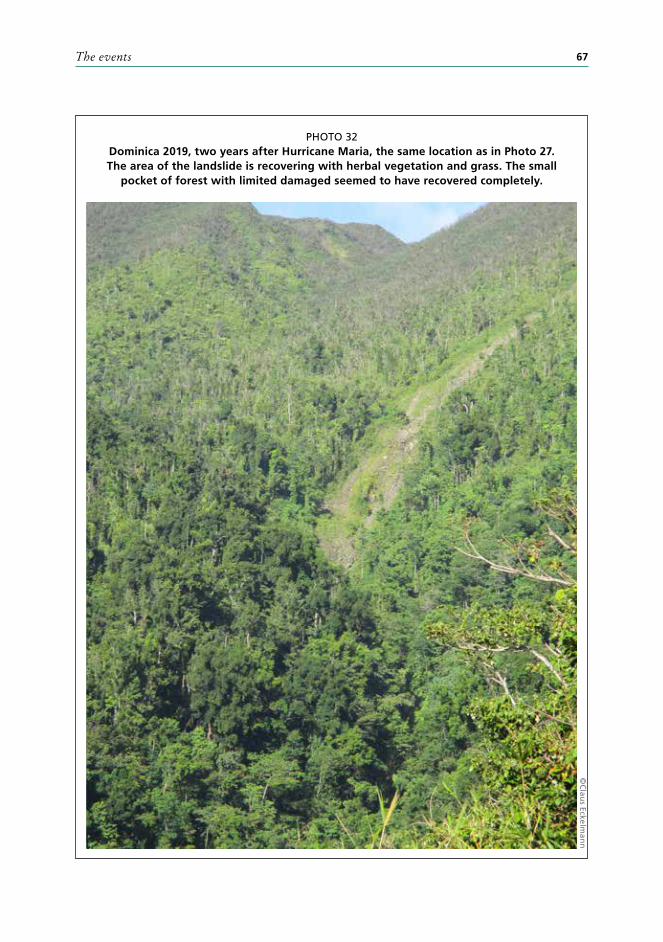
The events 67
PHOTO 32Dominica 2019, two years after Hurricane Maria, the same location as in Photo 27. The area of the landslide is recovering with herbal vegetation and grass. The small
pocket of forest with limited damaged seemed to have recovered completely.
©C
laus Eckelm
ann
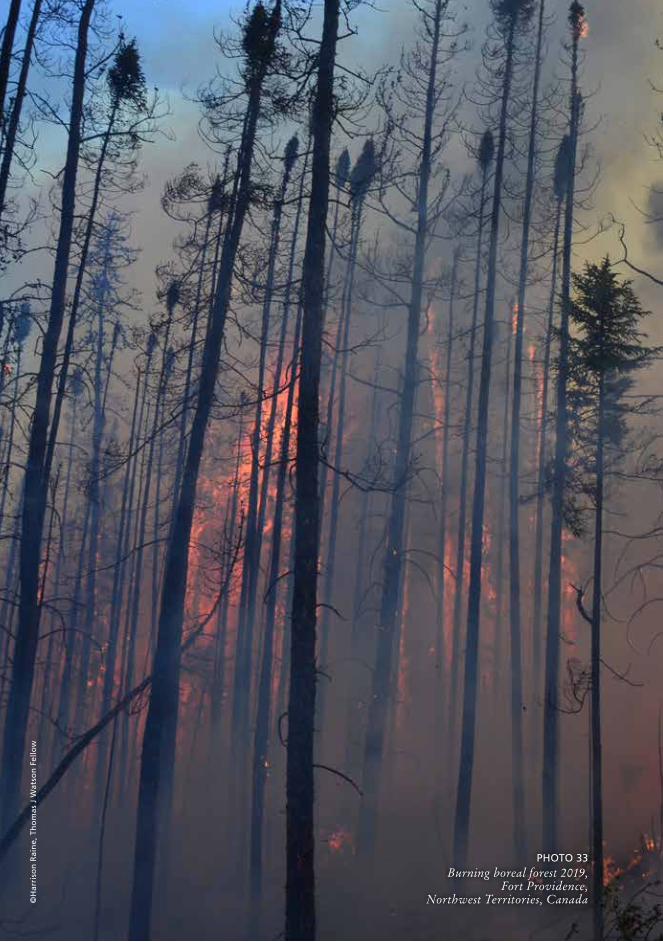
©H
arri
son
Rai
ne,
Th
om
as J
Wat
son
Fel
low
PHOTO 33Burning boreal forest 2019,
Fort Providence, Northwest Territories, Canada
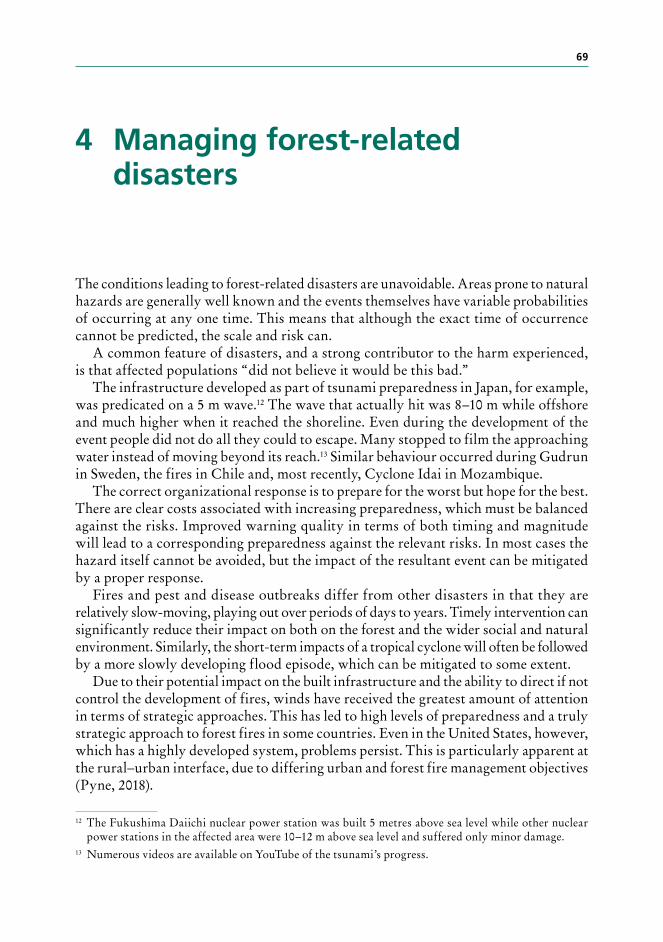
69
4 Managing forest-related disasters
The conditions leading to forest-related disasters are unavoidable. Areas prone to natural hazards are generally well known and the events themselves have variable probabilities of occurring at any one time. This means that although the exact time of occurrence cannot be predicted, the scale and risk can.
A common feature of disasters, and a strong contributor to the harm experienced, is that affected populations “did not believe it would be this bad.”
The infrastructure developed as part of tsunami preparedness in Japan, for example, was predicated on a 5 m wave.12 The wave that actually hit was 8–10 m while offshore and much higher when it reached the shoreline. Even during the development of the event people did not do all they could to escape. Many stopped to film the approaching water instead of moving beyond its reach.13 Similar behaviour occurred during Gudrun in Sweden, the fires in Chile and, most recently, Cyclone Idai in Mozambique.
The correct organizational response is to prepare for the worst but hope for the best. There are clear costs associated with increasing preparedness, which must be balanced against the risks. Improved warning quality in terms of both timing and magnitude will lead to a corresponding preparedness against the relevant risks. In most cases the hazard itself cannot be avoided, but the impact of the resultant event can be mitigated by a proper response.
Fires and pest and disease outbreaks differ from other disasters in that they are relatively slow-moving, playing out over periods of days to years. Timely intervention can significantly reduce their impact on both on the forest and the wider social and natural environment. Similarly, the short-term impacts of a tropical cyclone will often be followed by a more slowly developing flood episode, which can be mitigated to some extent.
Due to their potential impact on the built infrastructure and the ability to direct if not control the development of fires, winds have received the greatest amount of attention in terms of strategic approaches. This has led to high levels of preparedness and a truly strategic approach to forest fires in some countries. Even in the United States, however, which has a highly developed system, problems persist. This is particularly apparent at the rural–urban interface, due to differing urban and forest fire management objectives (Pyne, 2018).
12 The Fukushima Daiichi nuclear power station was built 5 metres above sea level while other nuclear power stations in the affected area were 10–12 m above sea level and suffered only minor damage.
13 Numerous videos are available on YouTube of the tsunami’s progress.
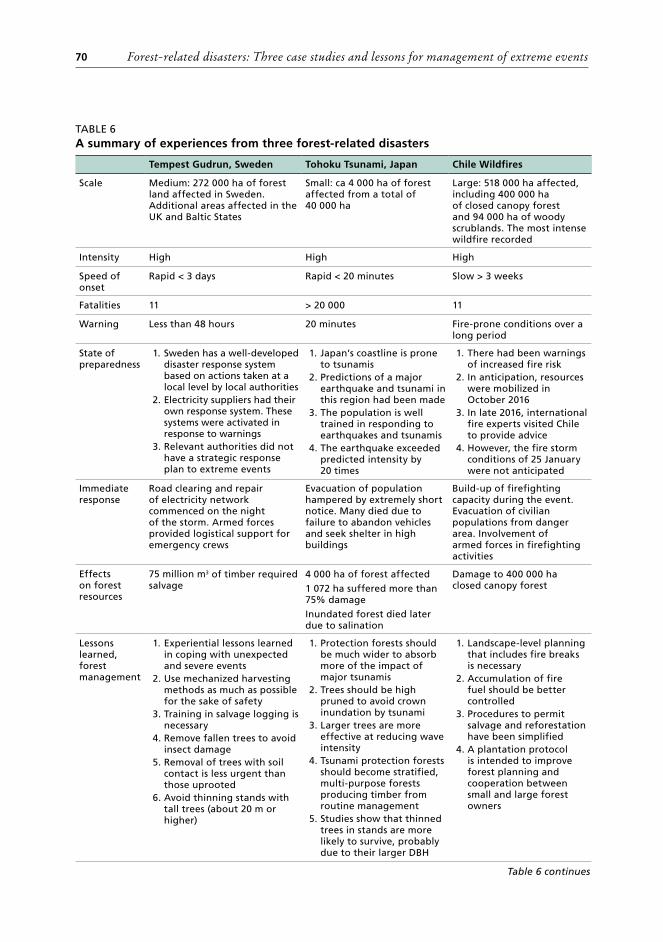
Forest-related disasters: Three case studies and lessons for management of extreme events70
TABLE 6A summary of experiences from three forest-related disasters
Tempest Gudrun, Sweden Tohoku Tsunami, Japan Chile Wildfires
Scale Medium: 272 000 ha of forest land affected in Sweden. Additional areas affected in the UK and Baltic States
Small: ca 4 000 ha of forest affected from a total of 40 000 ha
Large: 518 000 ha affected, including 400 000 ha of closed canopy forest and 94 000 ha of woody scrublands. The most intense wildfire recorded
Intensity High High High
Speed of onset
Rapid < 3 days Rapid < 20 minutes Slow > 3 weeks
Fatalities 11 > 20 000 11
Warning Less than 48 hours 20 minutes Fire-prone conditions over a long period
State of preparedness
1. Sweden has a well-developed disaster response system based on actions taken at a local level by local authorities
2. Electricity suppliers had their own response system. These systems were activated in response to warnings
3. Relevant authorities did not have a strategic response plan to extreme events
1. Japan’s coastline is prone to tsunamis
2. Predictions of a major earthquake and tsunami in this region had been made
3. The population is well trained in responding to earthquakes and tsunamis
4. The earthquake exceeded predicted intensity by 20 times
1. There had been warnings of increased fire risk
2. In anticipation, resources were mobilized in October 2016
3. In late 2016, international fire experts visited Chile to provide advice
4. However, the fire storm conditions of 25 January were not anticipated
Immediate response
Road clearing and repair of electricity network commenced on the night of the storm. Armed forces provided logistical support for emergency crews
Evacuation of population hampered by extremely short notice. Many died due to failure to abandon vehicles and seek shelter in high buildings
Build-up of firefighting capacity during the event. Evacuation of civilian populations from danger area. Involvement of armed forces in firefighting activities
Effects on forest resources
75 million m3 of timber required salvage
4 000 ha of forest affected
1 072 ha suffered more than 75% damage
Inundated forest died later due to salination
Damage to 400 000 ha closed canopy forest
Lessons learned, forest management
1. Experiential lessons learned in coping with unexpected and severe events
2. Use mechanized harvesting methods as much as possible for the sake of safety
3. Training in salvage logging is necessary
4. Remove fallen trees to avoid insect damage
5. Removal of trees with soil contact is less urgent than those uprooted
6. Avoid thinning stands with tall trees (about 20 m or higher)
1. Protection forests should be much wider to absorb more of the impact of major tsunamis
2. Trees should be high pruned to avoid crown inundation by tsunami
3. Larger trees are more effective at reducing wave intensity
4. Tsunami protection forests should become stratified, multi-purpose forests producing timber from routine management
5. Studies show that thinned trees in stands are more likely to survive, probably due to their larger DBH
1. Landscape-level planning that includes fire breaks is necessary
2. Accumulation of fire fuel should be better controlled
3. Procedures to permit salvage and reforestation have been simplified
4. A plantation protocol is intended to improve forest planning and cooperation between small and large forest owners
Table 6 continues
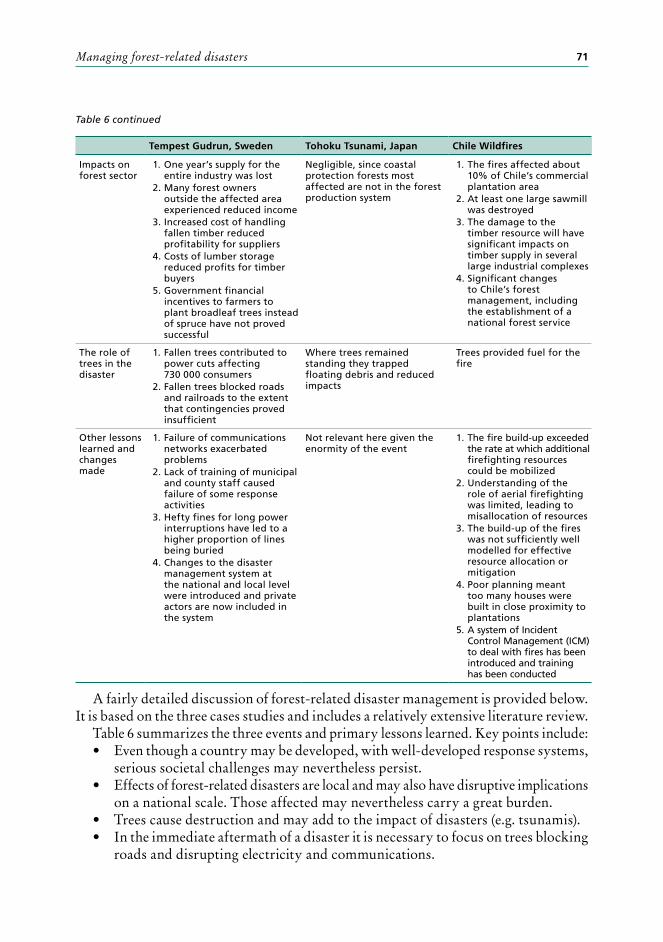
Managing forest-related disasters 71
Tempest Gudrun, Sweden Tohoku Tsunami, Japan Chile Wildfires
Impacts on forest sector
1. One year’s supply for the entire industry was lost
2. Many forest owners outside the affected area experienced reduced income
3. Increased cost of handling fallen timber reduced profitability for suppliers
4. Costs of lumber storage reduced profits for timber buyers
5. Government financial incentives to farmers to plant broadleaf trees instead of spruce have not proved successful
Negligible, since coastal protection forests most affected are not in the forest production system
1. The fires affected about 10% of Chile’s commercial plantation area
2. At least one large sawmill was destroyed
3. The damage to the timber resource will have significant impacts on timber supply in several large industrial complexes
4. Significant changes to Chile’s forest management, including the establishment of a national forest service
The role of trees in the disaster
1. Fallen trees contributed to power cuts affecting 730 000 consumers
2. Fallen trees blocked roads and railroads to the extent that contingencies proved insufficient
Where trees remained standing they trapped floating debris and reduced impacts
Trees provided fuel for the fire
Other lessons learned and changes made
1. Failure of communications networks exacerbated problems
2. Lack of training of municipal and county staff caused failure of some response activities
3. Hefty fines for long power interruptions have led to a higher proportion of lines being buried
4. Changes to the disaster management system at the national and local level were introduced and private actors are now included in the system
Not relevant here given the enormity of the event
1. The fire build-up exceeded the rate at which additional firefighting resources could be mobilized
2. Understanding of the role of aerial firefighting was limited, leading to misallocation of resources
3. The build-up of the fires was not sufficiently well modelled for effective resource allocation or mitigation
4. Poor planning meant too many houses were built in close proximity to plantations
5. A system of Incident Control Management (ICM) to deal with fires has been introduced and training has been conducted
A fairly detailed discussion of forest-related disaster management is provided below. It is based on the three cases studies and includes a relatively extensive literature review.
Table 6 summarizes the three events and primary lessons learned. Key points include:• Even though a country may be developed, with well-developed response systems,
serious societal challenges may nevertheless persist.• Effects of forest-related disasters are local and may also have disruptive implications
on a national scale. Those affected may nevertheless carry a great burden.• Trees cause destruction and may add to the impact of disasters (e.g. tsunamis).• In the immediate aftermath of a disaster it is necessary to focus on trees blocking
roads and disrupting electricity and communications.
Table 6 continued
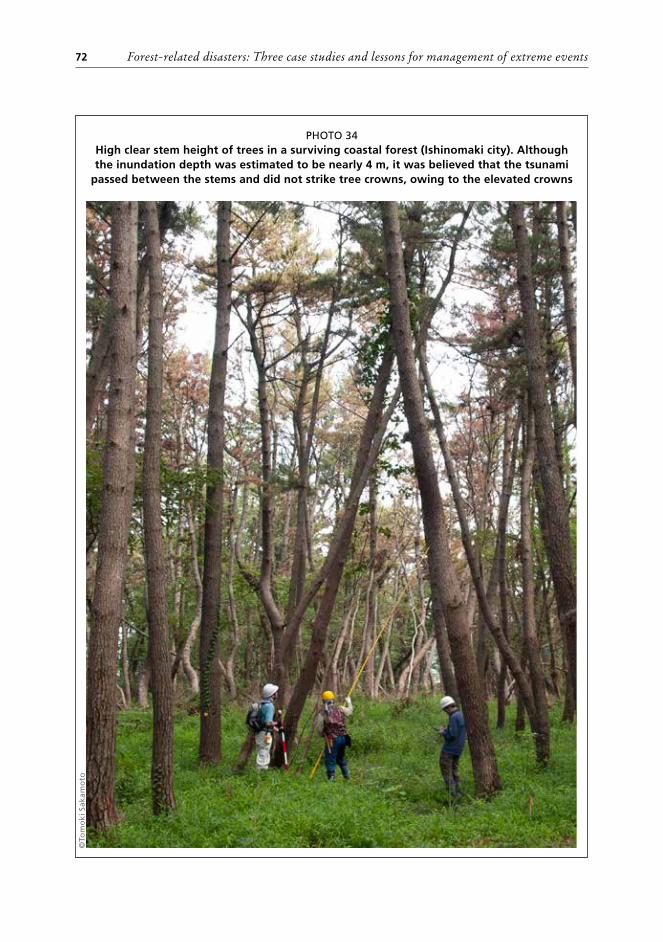
Forest-related disasters: Three case studies and lessons for management of extreme events72
PHOTO 34High clear stem height of trees in a surviving coastal forest (Ishinomaki city). Although the inundation depth was estimated to be nearly 4 m, it was believed that the tsunami
passed between the stems and did not strike tree crowns, owing to the elevated crowns
©To
mo
ki S
akam
oto
Managing forest-related disasters 73
STRATEGIC APPROACH TO FOREST DISASTERThe ISO standard 22320 deals with the management of emergencies (ISO, 2018). It is based on the incident command system formulated in the United States (Kishi et al., 2017) and highlights a number of key issues in strategic emergency management, including:
1. Command and control: Specifies command coordination, organizational structures and procedures and resource management within an organization.
2. Activity information: Specifies how to handle things like work processes and data capture and management to provide timely, relevant and accurate information.
3. Coordination and cooperation: Specifies command coordination processes, as well as coordination and cooperation both between organizations and within different parts of the same organization (Tanimura and Yoshikawa, 2014).
In common with most ISO standards, the standard requires a management feedback and review cycle.
DISASTER PREPAREDNESSInformation and communication frameworksThe Observe, Orient, Decide, Act (OODA) loop is a decision-making framework derived from military approaches. It is also highly relevant to disaster response, particularly in fast-moving disasters such as fires or floods where rapid decision-making is required (Radvanovsky and McDougall, 2018). However, this approach also requires excellent on-the-ground communication and is therefore of limited or no utility where com-munications have failed or a situation is changing rapidly.
Communications frameworks should be as robust as possible. Two-way radio communication is of limited use since most operatives will not have vehicles furnished with appropriate equipment or operators trained in radio protocols. Moreover, the limited number of available channels means the network will often become overloaded.
Tethered unmanned aerial vehicles (UAVs) could potentially be used to provide communications infrastructure in situations where the normal cell phone network has been destroyed by a disaster (Elistair, 2019). These can be used to provide interconnectivity to other networks; in some countries mobile operators are now obliged to open their services to all subscribers in the event of an emergency.
Following Cyclone Idai in March 2019, the United Nations Connectivity Charter was operationalized to allow rescue, recovery and aid agencies to communicate following the collapse of local communications structures in Beira (United Nations Office for Outer Space Affairs, 2018). The Emergency Telecommunications Cluster (ETC) was on the ground in Beira within 48 hours of the cyclone, providing 700 high-speed internet connections at Beira Airport for relief agencies.
The situation was poor for local people in the Idai-affected areas, even where the cellular system was functional. Users could not charge phones due to lack of power. Moreover, they could not buy mobile credit since their supply depended on many individual small retailers who were also affected by the disaster (Inmarsat, 2019).
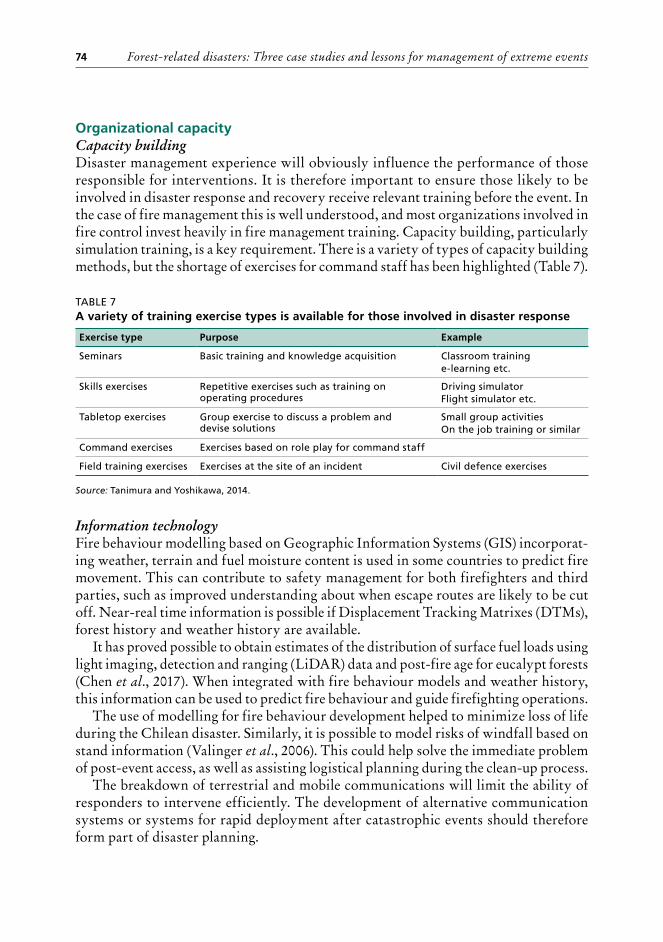
Forest-related disasters: Three case studies and lessons for management of extreme events74
Organizational capacityCapacity buildingDisaster management experience will obviously influence the performance of those responsible for interventions. It is therefore important to ensure those likely to be involved in disaster response and recovery receive relevant training before the event. In the case of fire management this is well understood, and most organizations involved in fire control invest heavily in fire management training. Capacity building, particularly simulation training, is a key requirement. There is a variety of types of capacity building methods, but the shortage of exercises for command staff has been highlighted (Table 7).
TABLE 7A variety of training exercise types is available for those involved in disaster response
Exercise type Purpose Example
Seminars Basic training and knowledge acquisition Classroom traininge-learning etc.
Skills exercises Repetitive exercises such as training on operating procedures
Driving simulatorFlight simulator etc.
Tabletop exercises Group exercise to discuss a problem and devise solutions
Small group activitiesOn the job training or similar
Command exercises Exercises based on role play for command staff
Field training exercises Exercises at the site of an incident Civil defence exercises
Source: Tanimura and Yoshikawa, 2014.
Information technologyFire behaviour modelling based on Geographic Information Systems (GIS) incorporat-ing weather, terrain and fuel moisture content is used in some countries to predict fire movement. This can contribute to safety management for both firefighters and third parties, such as improved understanding about when escape routes are likely to be cut off. Near-real time information is possible if Displacement Tracking Matrixes (DTMs), forest history and weather history are available.
It has proved possible to obtain estimates of the distribution of surface fuel loads using light imaging, detection and ranging (LiDAR) data and post-fire age for eucalypt forests (Chen et al., 2017). When integrated with fire behaviour models and weather history, this information can be used to predict fire behaviour and guide firefighting operations.
The use of modelling for fire behaviour development helped to minimize loss of life during the Chilean disaster. Similarly, it is possible to model risks of windfall based on stand information (Valinger et al., 2006). This could help solve the immediate problem of post-event access, as well as assisting logistical planning during the clean-up process.
The breakdown of terrestrial and mobile communications will limit the ability of responders to intervene efficiently. The development of alternative communication systems or systems for rapid deployment after catastrophic events should therefore form part of disaster planning.
Managing forest-related disasters 75
ResourcesPhysical resourcesThe pre-fire season planning of many forest management organizations involves preparing the physical resources necessary for fire control operations. This includes:
• opening access roads• maintaining fire towers• maintaining firefighting vehicles• pre-positioning field equipment• pre-positioning firefighting water supplies• preparing and maintaining firebreaks• identifying containment lines.Further preparatory actions are often taken as fire risk increases, including:• ceasing all forest activities and withdrawing forest workers to reduce the risk of
accidental ignition;• positioning first response teams at forward locations in the forest; • hourly communication checks to ensure communication lines are working; and• closing forest access to the public.It seems this approach is not replicated for many other types of disasters. Yet in the
case of large-scale storm damage to forests, for example, it would be useful for responders to pre-position equipment necessary for clearing access roads.
Information resourcesA lack of information is one of the biggest problems faced by disaster responders, usually exacerbated by a breakdown in communication systems. Terrestrial systems, followed by mobile communications, are usually worst hit when towers are damaged, destroyed or cut off from the power or fuel necessary to run generators. Satellite systems are more reliable, except in cases where heavy atmospheric moisture attenuates signals.
There are two means of helping to reduce these problems: the first is to create more robust communications systems both within and between the many agencies and organizations involved in disaster response. The second is to prepare as much critical information about resources and systems as possible and make it available to responders prior to the event. For forest aspects of disaster management this would include information such as:
• location of forest equipment, including light equipment such as chainsaws and heavy equipment such as harvesters and bulldozers;
• location and contact details of key forest operations staff and workers;• location of key timber haulage routes and sites for log landings and log stores;
and• logistics plans for clean-up operations.In addition, information technology-based systems may be useful in identifying areas
most likely to be impacted, as well as the type and severity of the impact. Drones (UAV) are an important tool to rapidly obtain information from remote or
inaccessible locations before, during and after a disaster. They can also play an important
Forest-related disasters: Three case studies and lessons for management of extreme events76
role in risk reduction.14 Following earthquakes, for example, the rapid mapping of building damage allows rescue workers to identify priority buildings for search and rescue based on the type of collapse and probability of human survival (Restas, 2015a). Drones have been used in firefighting operations (Restas, 2015b).
Human resourcesIt is clearly important that organizations and individuals responsible for responding to the impacts of natural hazards have clearly defined responsibilities, are aware of these responsibilities and have the capacity to carry them out.
It is also important to ensure the entire response required for a particular situation is covered and there are no gaps preventing effective intervention. This requires testing and analysis of systems as part of preparation.
In addition, all individuals require training in all aspects of their work. This training must be completed before the event and repeated often enough to remain current. For forestry-related disasters this training should, at a minimum, include the following:
• dealing with fallen timber blocking roads;• dealing with fallen timber in contact with electrical installations or cables;• dealing with fallen timber blocking watercourses or bridges;• forest clean-up operations
- fallen timber - snagged and leaning timber - root cutting;
• health and safety considerations for all operations dealing with timber damaged by disasters;
• decision-making concerning approaches to working with damaged forests, i.e manual vs mechanical approaches; and
• transport of damaged timber.
Organizational interactionLocal and national organizationsLack of coordination between agencies will result in an inadequate response. In many cases the delegation of responsibility to agencies with insufficient capacity is a major problem. Local knowledge and accountability should lead to responses that are both more effective and better attuned to the wishes of local people. However, this must be based on the ability of local authorities to draw on support as needed in times of crisis.
14 For further reading on drone use in this context, see A. Restas, Drone Applications for Supporting Disaster Management, (World Journal of Engineering and Technology, 3: 316-321) http://dx.doi.org/10.4236/wjet.2015.33C047; K.B. Sandvik and K. Lohne, The promise and perils of disaster drones, (2013) https://odihpn.org/magazine/the-promise-and-perils-of-%C2%91disaster-drones%C2%92/; and K. Sharma, R. Devarani, A. Gangwar and R. Chakrabarty, Efficacy and Utilization of Unmanned Aerial System (Uas) as Operational Tools for Disaster Management in India, (Preprints 2018, 2018100039), doi: 10.20944/preprints201810.0039.v1).
Managing forest-related disasters 77
It is therefore vital that the systems invoked to deal with natural hazards are tested prior to their occurrence. The work of those involved in dealing with natural hazards will generally be more efficient and effective if they know one another. Disaster training should therefore ensure key actors are introduced to give their subsequent interactions greater depth and understanding.
It is important that each layer (municipal, district, provincial, national) of the disaster response structure is aware of its respective responsibilities, resources and capabilities (in real time), including when each should either intervene or call for assistance.
International and multinational organizationsThe European Union has played a role in disaster recovery within Europe. The United Nations has some capacity through a number of its agencies in the planning and pre-paredness and response and recovery phases of disasters.
A strong international response has followed some disasters, although this often appears uncoordinated and the funds provided are not used in the short term (Apil and Sharma, 2016).
International support is quite common during slow-moving disasters such as fire. Logistical support such as firefighting aircraft or the provision of fire crews is often provided; however, there is probably an equal demand for technical and managerial firefighting support.
IMMEDIATE RESPONSEActions during the eventIn the case of rapid-onset and short-lived events such as earthquakes or tsunamis of local origin, it is practically impossible to do anything other than escape or seek shelter. In slow-moving events such as fires, floods or tempests, actions taken during the event can help to mitigate their impact.
Actions immediately following the eventManagement and controlThe first priority following an event must be to establish a system to manage the necessary intervention. In the United States wildland fire management by the US Forest Service has developed an Incident Command System (ICS) to ensure proper coordination between and within agencies. This system is now a component of the National Incident Management System (Auf der Heide, 2009; Dague and Hirami, 2015).
The ICS was introduced to overcome systematic problems that were also encountered in the responses to Storm Gudrun. Specifically, these problems were:
1. Each agency had a different organizational structure, making it difficult for fire-fighters to understand who was in charge.
2. The large number of employees assigned to each supervisor made it challenging for one individual to coordinate and oversee firefighters’ activities.
3. Due to incompatible radio frequencies and different radio codes, communication between firefighters during the same incident was nearly impossible.
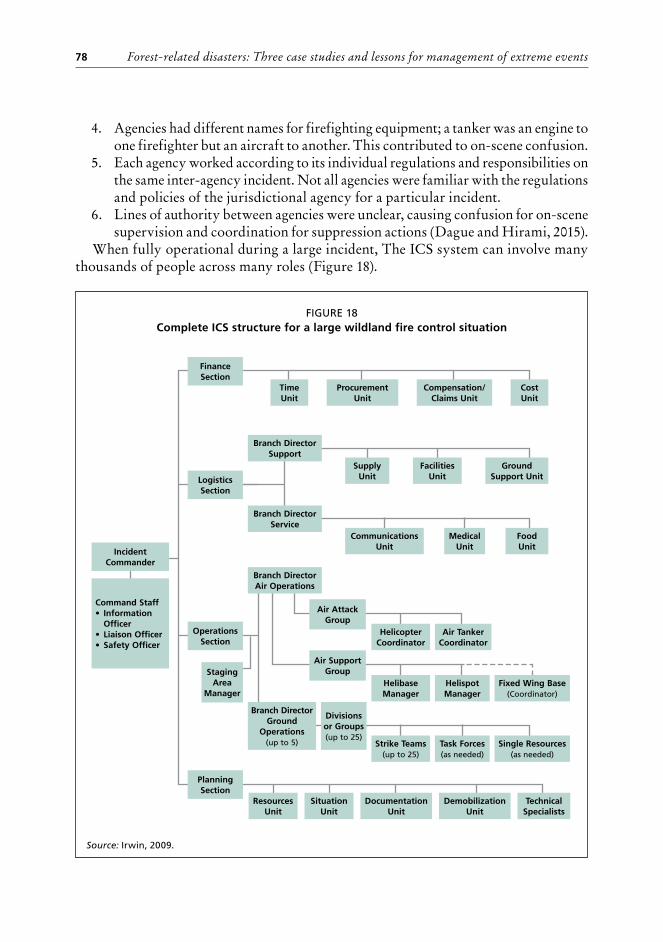
Forest-related disasters: Three case studies and lessons for management of extreme events78
4. Agencies had different names for firefighting equipment; a tanker was an engine to one firefighter but an aircraft to another. This contributed to on-scene confusion.
5. Each agency worked according to its individual regulations and responsibilities on the same inter-agency incident. Not all agencies were familiar with the regulations and policies of the jurisdictional agency for a particular incident.
6. Lines of authority between agencies were unclear, causing confusion for on-scene supervision and coordination for suppression actions (Dague and Hirami, 2015).
When fully operational during a large incident, The ICS system can involve many thousands of people across many roles (Figure 18).
FIGURE 18Complete ICS structure for a large wildland fire control situation
Source: Irwin, 2009.
Finance Section
Planning Section
Compensation/Claims Unit
Facilities Unit
Medical Unit
Task Forces (as needed)
Cost Unit
Ground Support Unit
Food Unit
Single Resources (as needed)
Time Unit
Branch Director Support
Branch Director Service
Divisions or Groups(up to 25)
Procurement Unit
Supply Unit
Communications Unit
Strike Teams (up to 25)
Helispot Manager
Air Tanker Coordinator
Air Support Group
Air Attack Group
Helibase Manager
Helicopter Coordinator
Demobilization Unit
Technical Specialists
Resources Unit
Situation Unit
Documentation Unit
Command Staff • Information Officer • Liaison Officer • Safety Officer
Incident Commander
Logistics Section
Operations Section
Staging Area
Manager
Branch Director Ground
Operations(up to 5)
Fixed Wing Base (Coordinator)
Branch Director Air Operations
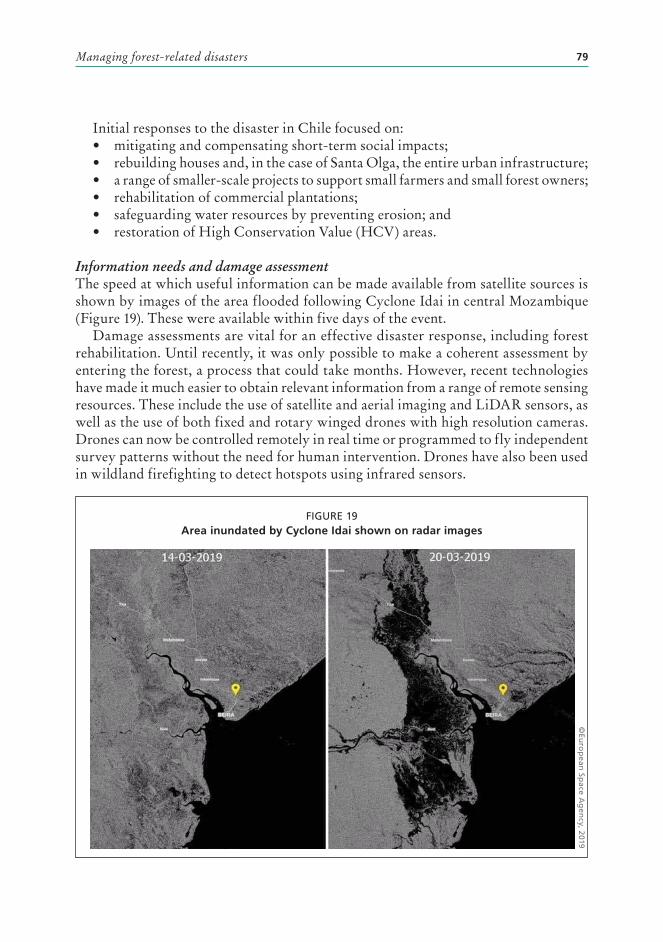
Managing forest-related disasters 79
Initial responses to the disaster in Chile focused on: • mitigating and compensating short-term social impacts;• rebuilding houses and, in the case of Santa Olga, the entire urban infrastructure;• a range of smaller-scale projects to support small farmers and small forest owners;• rehabilitation of commercial plantations;• safeguarding water resources by preventing erosion; and • restoration of High Conservation Value (HCV) areas.
Information needs and damage assessmentThe speed at which useful information can be made available from satellite sources is shown by images of the area flooded following Cyclone Idai in central Mozambique (Figure 19). These were available within five days of the event.
Damage assessments are vital for an effective disaster response, including forest rehabilitation. Until recently, it was only possible to make a coherent assessment by entering the forest, a process that could take months. However, recent technologies have made it much easier to obtain relevant information from a range of remote sensing resources. These include the use of satellite and aerial imaging and LiDAR sensors, as well as the use of both fixed and rotary winged drones with high resolution cameras. Drones can now be controlled remotely in real time or programmed to fly independent survey patterns without the need for human intervention. Drones have also been used in wildland firefighting to detect hotspots using infrared sensors.
FIGURE 19Area inundated by Cyclone Idai shown on radar images
©Eu
rop
ean Sp
ace Ag
ency, 2019
Forest-related disasters: Three case studies and lessons for management of extreme events80
While these technologies have the capacity to generate large amounts of information, they must be matched by commensurate decision-making capacity and the resources to act on the information provided. Thus, these new technologies also require new ways of organizing systems to enable better responses.
Actions in the weeks after the event Planning for recoveryIt is remarkable how quickly recovery plans were developed in all three case studies. Following the fires in Chile, strategic plans had been completed within a few weeks. These plans involved a complete change to the paradigm for cooperating with communities on fire management. In addition, rehabilitation and protection work was planned based on rational priorities for multiple objectives, including maintenance of water supply, biodiversity and soils, as well as societal needs such as employment and infrastructure.
In Sweden, timber extraction plans were developed within weeks, meaning an enormous unscheduled harvest was successfully carried out, with timber stored for later use.
This type of planning is only possible if sufficient human resources are available. This is likely to be the case in countries where forestry is an important economic activity but will be absent elsewhere.
LONG-TERM RESPONSEAlthough much of the response to disasters requires the repair of infrastructure and support for the redevelopment of societies and livelihoods, this section of the report will concentrate on the rehabilitation and restoration of forest systems.
The long-term response to disasters affecting forests will largely depend on the economic value of forests. The most rigorous responses occur in areas of intensive forest management for both natural forests and plantations. Intensive responses are also likely in urban forests such as parks. In these areas, a range of activities will ensure the rapid recovery of forest value, including:
• removal of fallen or damaged trees in stands with light damage• clear felling of heavily damaged stands• replanting• encouragement of natural regeneration• enrichment planting• selective thinning to guide stand dynamics.In some cases there is a desire to establish forest in new areas or re-establish forest
in areas already deforested at the time of the disaster. When envisaging these types of activities, it is important to properly assess their environmental impact. Upon ascertaining that coastal mangroves offer significant protection against tsunami damage, for example, there may be a desire to protect entire coastlines with mangrove forests. This could have negative consequences for marine biodiversity dependent on beach habitats and may hinder access to the sea by fishing communities.
Managing forest-related disasters 81
Policy responsesForest-related disasters form a subset of all disasters. Some disasters are caused by natural hazards, while others are directly caused or exacerbated by human activity. Many disasters have led to policy responses at the subnational, national and supranational level. These policy responses can be grouped into several types:
• Responses aimed at reducing the hazard itself: - forest management designs to reduce fire risk - forest management interventions to reduce fire risks - forest management designs and interventions to reduce pests.
• Responses aimed at mitigating the impact of future hazardous events: - improved early warning systems - forest management design and practices to reduce risk of blowdown - infrastructure to reduce impacts or absorb event energy - infrastructure to provide shelter during events - rebuilding more resilient infrastructure to reduce damage to housing etc. - development of evacuation systems to remove people from harm’s way.
• Responses aimed at improving organizational responses to future disasters: - reorganized governance structures to provide better responses - simplifying regulations to facilitate access to resources and financial support
following disaster - improved communications infrastructure.
• Responses aimed at increasing the resources and equipment available to responders in the case of disasters: - access to cooperation with military manpower and equipment - access to regional or global resources following disaster.
• Responses aimed at improving long-term disaster recovery interventions: - Build Back Better policies - policies to coordinate the allocation of resources provided for recovery.
Notably, it has proven difficult to move the most vulnerable out of harm’s way by redefining land-use patterns in very poor countries. This applies even in developed countries where residential development continues in flood-prone areas.
Policy changes at the local level and other localized responses appear to have a high success rate. The development of localized fire warning systems and fire control cooperation with communities in Chile after the 2017 fires provide a good example. In Nordic countries such local interventions are common, based around cooperation between individual landowners as the first line of defence against forest damage by tempest.
At the other end of the scale, international cooperation has an important role to play. The Civil Protection Mechanism established by the European Union in 2001 and the 2014 European Emergency Response Capacity provide both a response mechanism and resources for intervention during humanitarian disasters (European Union/European Community Humanitarian Aid Office – ECHO, 2019; 2019a).
Forest-related disasters: Three case studies and lessons for management of extreme events82
In 2017, almost one-third of all requests to the European Civil Protection Mechanism were for forest fires (mostly inside Europe but including Chile). In 2018, Sweden received support from this resource pool, receiving 360 firefighting personnel, seven fixed wing aircraft, six helicopters and 67 firefighting vehicles (European Commission/ECHO, 2018). The Copernicus satellite system also produced 135 maps for fire monitoring.
It has, however, proven far more difficult to achieve effective international cooperation and regulation where forest disasters are caused by pathogens and pests. In such cases, problems relate to the perceived relationship between man and “nature” and the environmental ethics of intervention. Finally, problems are caused by the difficulties of communicating obscure forest pathology and epidemiology concepts to decision-makers (Stenlid et al., 2011).
The use of damaged or fallen timber following disasters is usually governed by ad hoc relaxation of the regulatory framework to permit the use of controlled timber species or assortments over the short term. Use of recovered timber is not considered a priori part of forest or disaster recovery policy. Questions regarding this type of use include:
• Should disaster timber be used for reconstruction only or should wider commercial use be permitted?
• Should disaster timber be treated differently depending on whether it is sourced from public or private land?
• To what extent should biodiversity and environmental issues be considered in relation to the use of disaster timber?
It is clear that a proper policy framework for disaster timber would simplify decision-making and provide the necessary framework to prevent the need for ad hoc decisions, which frequently provide opportunities for corruption.
Build Back BetterBuild Back Better is a relatively new approach to disaster recovery and reconstruc-tion, which emerged following the 2004 Indian Ocean Tsunami (Mannakkara and Wilkinson, 2014). It is a response to the reconstruction practice of simply repairing damage or replacing “like with like.” The BBB concept seeks to produce more resilient communities better able to cope with future disasters by using better materials, better design, better land-use allocation planning, better local governance and improved economic conditions.
In many cases better materials include timber. In the immediate aftermath of Typhoon Yolanda in the Philippines, for example, 80 percent of shelters were constructed with coconut wood, even though alternative tropical timber species would have been more durable and resistant. However, local forest conservation regulations prohibited its use for this purpose (Opdyke et al., 2016). Restrictions on the use of hardwood timber from fallen trees on private land were subsequently lifted and people did make use of this to obtain hardwood timber from both private and public land (Durst, 2015).
There is a need for improved housing design to build homes capable of resisting expected hazards.

Managing forest-related disasters 83
Building Back Better timber housing requires knowledge about the best timber to use in different circumstances and the best methods of timber processing for construction. The building design will determine the dimensions of the timber required and this in turn will determine the recovery rate from damaged timber to end product. This is a far more efficient use of logs (even broken logs) compared to designs using heavy long pieces. This has the added advantage of substantially reducing the costs of raw materials.
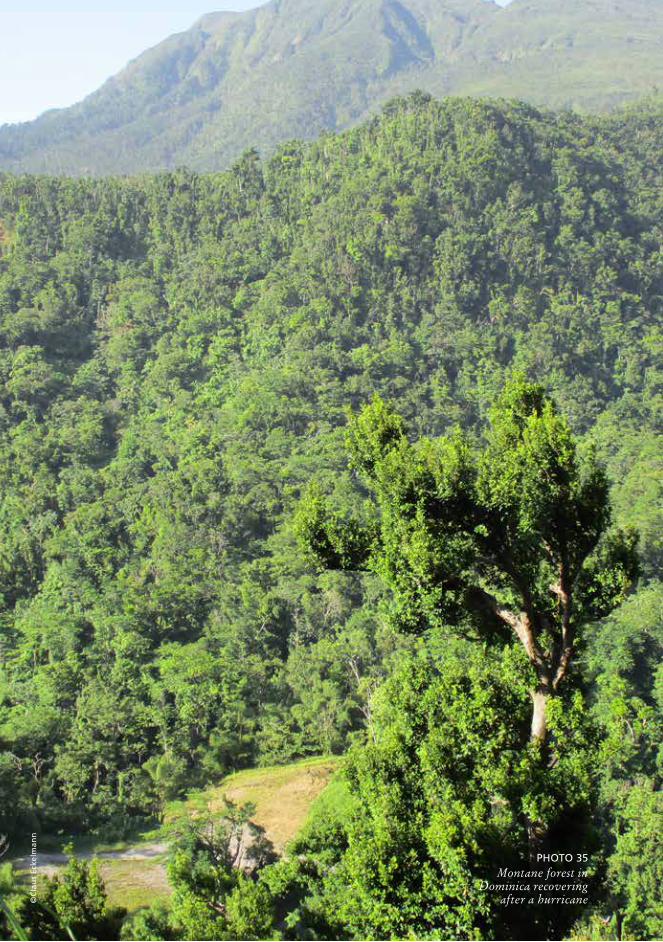
©C
lau
s Ec
kelm
ann
PHOTO 35Montane forest in
Dominica recovering after a hurricane
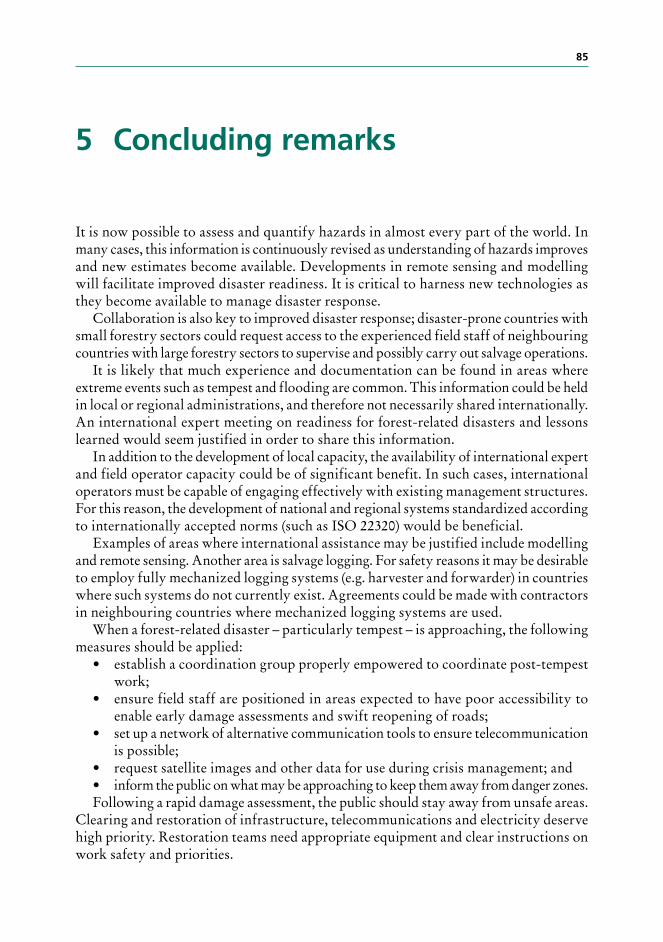
85
5 Concluding remarks
It is now possible to assess and quantify hazards in almost every part of the world. In many cases, this information is continuously revised as understanding of hazards improves and new estimates become available. Developments in remote sensing and modelling will facilitate improved disaster readiness. It is critical to harness new technologies as they become available to manage disaster response.
Collaboration is also key to improved disaster response; disaster-prone countries with small forestry sectors could request access to the experienced field staff of neighbouring countries with large forestry sectors to supervise and possibly carry out salvage operations.
It is likely that much experience and documentation can be found in areas where extreme events such as tempest and flooding are common. This information could be held in local or regional administrations, and therefore not necessarily shared internationally. An international expert meeting on readiness for forest-related disasters and lessons learned would seem justified in order to share this information.
In addition to the development of local capacity, the availability of international expert and field operator capacity could be of significant benefit. In such cases, international operators must be capable of engaging effectively with existing management structures. For this reason, the development of national and regional systems standardized according to internationally accepted norms (such as ISO 22320) would be beneficial.
Examples of areas where international assistance may be justified include modelling and remote sensing. Another area is salvage logging. For safety reasons it may be desirable to employ fully mechanized logging systems (e.g. harvester and forwarder) in countries where such systems do not currently exist. Agreements could be made with contractors in neighbouring countries where mechanized logging systems are used.
When a forest-related disaster – particularly tempest – is approaching, the following measures should be applied:
• establish a coordination group properly empowered to coordinate post-tempest work;
• ensure field staff are positioned in areas expected to have poor accessibility to enable early damage assessments and swift reopening of roads;
• set up a network of alternative communication tools to ensure telecommunication is possible;
• request satellite images and other data for use during crisis management; and• inform the public on what may be approaching to keep them away from danger zones.Following a rapid damage assessment, the public should stay away from unsafe areas.
Clearing and restoration of infrastructure, telecommunications and electricity deserve high priority. Restoration teams need appropriate equipment and clear instructions on work safety and priorities.

Forest-related disasters: Three case studies and lessons for management of extreme events86
TABLE 8
Effects of the selected events on forests
Tempest Gudrun, Sweden Tohoku Tsunami, Japan Chile wildfires
Effects on society
730 000 users were without power. The high winds and falling trees also damaged telephone lines and mobile phone antennae, making communication difficult. It took 34 days to reopen all railway lines
130 000 houses destroyed and 230 000 damaged. There was a major nuclear accident.
Tsunami mitigation infrastructure was overwhelmed, with run-up heights of up to 40 m. Any feasible infrastructure would be overwhelmed by an event of this magnitude
The town of Santa Olga was destroyed. Over 7 000 people were affected, many of whom were forced to house in shelters. 1 644 homes were destroyed. Electrical supply network was affected and some roads were cut off. About 50 000 heads of livestock, and a much larger number of chickens, were killed
Warning Less than 48 hours 20 minutes Fire-prone conditions over a long period
Fatalities 11 More than 20 000 11
Effects on forest resources
272 000 ha of forest were affected by storm damage, resulting in the windfall of about 70 million trees, with a volume of 75 million m3
4 000 ha of forest affected, 1 072 ha suffered more than 75% damage, inundated forest subsequently died due to salination
400 000 ha of closed canopy forest and 94 000 ha of woody scrubland were affected
Lessons for forest management
Experiential lessons learned in coping with severe events;
Use mechanized harvesting methods as much as possible to maximize safety;
Training in salvage logging is necessary;
Remove fallen trees to avoid insect damage;
Removal of trees with soil contact is less urgent than those uprooted;
Avoid thinning stands with tall trees (about 20 m or higher).
Protection forests should be widened to absorb impact of major tsunamis;
Trees should be high pruned to avoid crown inundation by tsunami;
Larger trees are more effective at reducing wave intensity;
Tsunami protection forests should become stratified, multi-purpose forests producing timber;
Studies show that thinned trees in stands are more likely to survive, probably due to their larger DBH.
Landscape-level planning that includes fire breaks is necessary;
Accumulation of fire fuel should be better controlled;
Procedures to permit salvage and reforestation have been simplified;
A plantation protocol is intended to improve forest planning and cooperation between small and large forest owners.
Following this initial stage, it is important to obtain a more detailed damage assessment to plan for salvage operations. Wood degradation may mean some species should be given priority. Planning for wood storage should preferably occur before disaster strikes.
The amount of timber required for reconstruction can be very large. Reconstruction in Aceh following the Indian Ocean Tsunami was estimated to require timber from 260 000 ha of forest (World Conservation Union, 2005).
There is some controversy surrounding the use of post-disaster timber. This is largely based on philosophical arguments about man and nature (Brissett, 2002). Experience in both the United Kingdom and the United States indicates that areas left untouched have higher tree biodiversity than areas where storm-damaged timber is extracted (Barker et al., 2013). It is therefore arguably unwise to attempt to recover timber throughout the damaged area. In practice, it is rarely feasible to recover all damaged timber due to
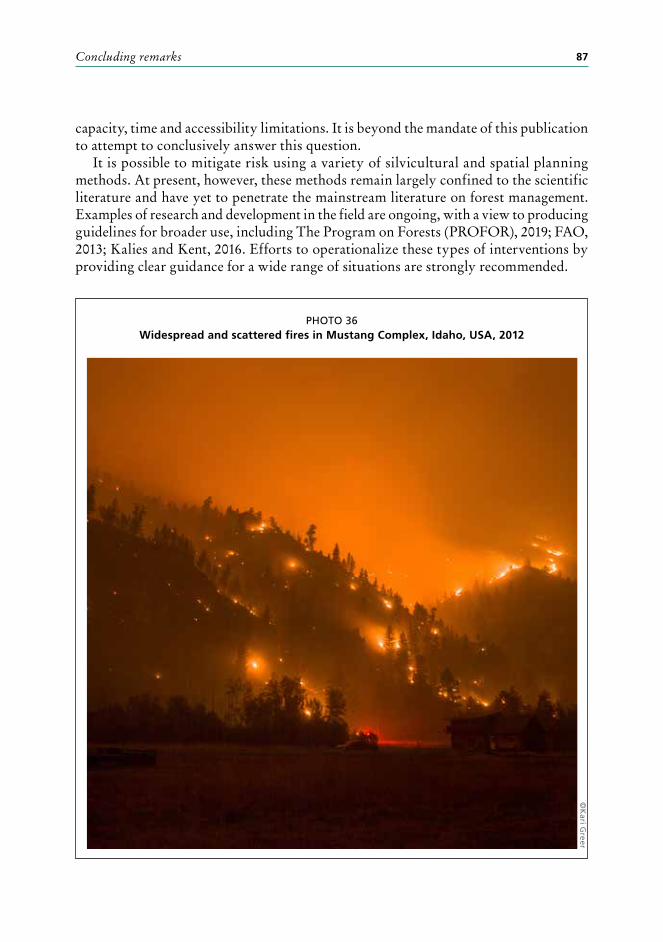
Concluding remarks 87
PHOTO 36Widespread and scattered fires in Mustang Complex, Idaho, USA, 2012
©K
ari Greer
capacity, time and accessibility limitations. It is beyond the mandate of this publication to attempt to conclusively answer this question.
It is possible to mitigate risk using a variety of silvicultural and spatial planning methods. At present, however, these methods remain largely confined to the scientific literature and have yet to penetrate the mainstream literature on forest management. Examples of research and development in the field are ongoing, with a view to producing guidelines for broader use, including The Program on Forests (PROFOR), 2019; FAO, 2013; Kalies and Kent, 2016. Efforts to operationalize these types of interventions by providing clear guidance for a wide range of situations are strongly recommended.
©C
lau
s Ec
kelm
ann
PHOTO 37Floodwater washed off
the bark, Bahamas

8989
References
Acosta, R. J. & Irizarry, R. A. Forthcoming publication. Post-hurricane vital statistics expose fragility of Puerto Rico's health system. Cold Spring, Harbour Laboratory. [Cited 23 January, 2020]. https://www.biorxiv.org/content/early/2018/09/18/407874.
Alsnas (2006) cit. Eriksson, L. M. 2016. Winds of change: Voter blame and Storm Gudrun in the 2006 Swedish parliamentary election. Electoral Studies, 41, 129-142.
Apil K.C & Sharma, K. 2016. Challenges for Reconstruction [online]. Nepal. http://setopati.net/opinion/22285/Challenges-for-reconstruction/.
Arauco. 2017a. Untitled. Arauco internal presentation to Certfor auditors.Arauco. 2017b. “The original project.” Arauco internal presentation.Arauco. 2017c. “Initiatives for productive recovery and ecological restoration.” Arauco
internal presentation. Arauco. 2017d. “The 2017 great fires.” Arauco internal presentation.Arora, V.K. & Melton, J.R. 2018. Reduction in global area burned and wildfire emissions
since 1930s enhances carbon uptake by land. Nature Communications, 9: Article number 1326.
Auf der Heide, E. 2009. Disaster response: Principles of preparation and coordination [online]. https://web.archive.org/web/20071213164736/http://orgmail2.coe-dmha.org/dr/static.htm.
Balter, E. 2017. After Fires, Chile Rebuilds Devastated Wine Regions. Wine Spectator. https://www.winespectator.com/articles/chile-rebuilds-devastated-wine-regions. Accessed on 15 May 2020.
Barker, P.A. et al. 2013. Survivors, not invaders, control forest development following simulated hurricane, Ecology, 94: 414-23.
Bilici, E. & Akay, A.E. 2015. Risks factors associated with post-fire salvage logging operations. European Journal of Forest Engineering, 1(2): 93-100.
Blennow, K. & Persson, E. 2013. Societal impacts of storm damage. In Gardiner, B., Schuck, A., Schelhaas, M., Orazio, C., Blennow, K. & Nicoll, B., eds. Living with storm damage to forests. Joensuu, Finland, European Forest Institute.
Brang, P., Schönenberger, W., Frehner, M., Schwitter, R., Thormann, J.J. & Wasser, B. 2006. Management of protection forests in the European Alps: An overview. Forest Snow and Landscape Research, 80: 23-44.
Brissett, J. 2002. After disaster: Salvage or savage logging? Opposing views on the value of timber harvests after natural disasters. Federal Reserve Bank of Minneapolis. Accessed 10 May 2010 at https://www.minneapolisfed.org/article/2002/after-disaster-salvage-or-savage-logging
British Geological Survey. Anonymous, 2012. Tohoku-oki tsunami of 11 March 2011 | One year on. British Geological Survey. http://www.earthquakes.bgs.ac.uk/research/events/tohoku/tohoku-okiMarch2012.html Accessed on 15 May 2020.

Forest-related disasters: Three case studies and lessons for management of extreme events90
Broman, H., Frisk, M. & Rönnqvist, M. 2009. Supply chain planning of harvest and transportation operations after the storm Gudrun. Information Systems and Operational Research (INFOR), 47(3): 235-245.
Brooks, H.E. & Doswell III, C.A. 1993. Extreme winds in high-precipitation supercells. Paper presented at the “Seventeenth Conference on Severe Local Storms,” St. Louis, Missouri, American Meteorological Society.
Bründl, M. & Rickli, C. 2002. The storm Lothar 1999 in Switzerland: An incident analysis. Forest, Snow and Landscape Research, 77(1-2): 207-216.
Bruijnzeel, L.A. 2004. Hydrological functions of tropical forests: Not seeing the soil for the trees? Agriculture, Ecosystems and Environment, 104: 185-228.
Bustos, S., Gallardo, L., Garreaud, R. & Tondreau, N., eds. 2015. Report to the Nation: The 2010-2015 mega-drought: A lesson for the future. Santiago, Center for Climate and Resilience Research Chile.
Calder, I., Hofer, T., Vermont, S. & Warren, P. 2007. Towards a new understanding of forests and water. Unasylva, 58(229). Rome, FAO. (also available at http://www.fao.org/docrep/010/a1598e/a1598e02.htm).
Carpenter, G. 2005. Windstorm Erwin/Gudrun. January 2005 Specialty Practice Briefing Issue No 2: An update from the Property Speciality.
Center for Climate and Resilience Research (CR)2. 2015. Report to the Nation – The 2010-2015 mega-drought: A lesson for the future. Center for Climate and Resilience Research (CR)2. http://www.cr2.cl/wp-content/uploads/2015/11/Megadrought_report.pdf Accessed at May 27, 2020
Chen, J., Saunders, S.C., Crow, T.R., Naiman, R.J., Brosofske, K.D., Mroz, G.D., Brookshire, B.L. & Franklin, J.F. 1999. Microclimate in forest ecosystems and landscape ecology: Variations in local climate can be used to monitor and compare the effects of different management regimes. BioScience, 49: 288-297.
Chen, Y., Zhu, X., Yebra, M., Harris, S. and Tapper N. 2017. Development of a predictive model for estimating forest surface fuel load in Australian eucalypt forests with LiDAR data. Environmental Modelling and Software 97: 61-71.
Coastal protection in the aftermath of the Indian Ocean tsunami: What role for forests and trees? Proceedings of the Regional Technical Workshop, Khao Lak, Thailand, 28–31 August 2006. Compiled and edited by Susan Braatz, Serena Fortuna, Jeremy Broadhead and Robin Leslie. Food and Agriculture Organization of the United Nations, Regional Office for Asia and the Pacific Bangkok, 2007.
CONAF. 2017a. “Description and effects of fire storm, January 18 to February 5, 2017, in the O'Higgins, El Maule and Biobío regions.” Santiago, CONAF Press briefing.
CONAF. 2017b. “Analysis of the effects and severity of forest fires in January and February 2017 on land uses and natural ecosystems present between the regions of Coquimbo and Los Ríos of Chile.” Santiago, CONAF Technical Meeting.
CONAF. 2017c. Guide to application of techniques to rehabilitate soils and river basins after forest fires. CONAF internal document.
CONAF. 2017d. Soil and water conservation techniques to control erosion by forest fires. CONAF internal document.
References 91
CONAF. 2017e. Options for regeneration of pine and eucalyptus after a forest fire. CONAF internal document.
Cole, S., Healy, A. & Werker, E. 2012. Do voters demand responsive governments? Evidence from Indian disaster relief. Journal of Development Economics, 97(2): 167-181.
CTBA. 2004. Technical guide on harvesting and conservation of storm damaged timber [online]. [Cited 20 January 2019]. https://videntjenesten.ku.dk/filer/Technical-Guide-on-harvesting-and-conservation-of-storm-damaged-timber.pdf.
Dacre, H.F., Crawford, B.R., Charlton-Perez, A.J., Lopez-Saldana, G., Griffiths, G.H. & Vicencio Veloso, J. 2018. Chilean wildfires: Probabilistic prediction, emergency response and public communication. Bulletin of the American Meteorological Society: 2259-2274 [online]. [Cited 27 January 2020]. https://doi.org/10.1175/BAMS-D-17-0111.1.
Dague, D. & Hirami, P. 2015. The United States Forest Service’s Incident Command System 40 years on: From domestic wildfires to international disaster response. Unasylva 243-244, 66(1-2): 79-85.
DeBano, L.F. 2000. The role of fire and soil heating on water repellency in wildland environments: A review. Journal of Hydrology 231-232: 195-206.
Dietz, S. 2005. Erwin low pressure area, named January 7, 2005. Biography [online]. [Cited 20 January 2019]. www.met.fu-berlin.de/wetterpate/Lebensgeschichten/Tief_ERWIN_07_01_05.htm.
Doerr, S.H. & Santı´n, C. 2016. Global trends in wildfire and its impacts: Perceptions versus realities in a changing world. Philosophical Transactions of the Royal Society B, 371: 20150345 [online]. [Cited 28 January 2020]. http://dx.doi.org/10.1098/rstb.2015.0345.
Doerr, S.H., Shakesby, R.A. & Macdonald, L.H. 2011. Soil water repellency: A key factor in post-fire erosion? In Cerda, A. & Robichaud, P., eds. Restoration strategies after forest fires. New Hampshire, Science Publishers.
Dominguez, F. 2016. US expert on forest fires: "In Chile this problem is just emerging" [online]. Emol, 11 November 2016. Also available at https://www.emol.com/noticias/Nacional/2016/11/11/830598/Experto-de-EEUU-sobre-incendios-forestales-En-Chile-esta-recien-emergiendo-en-este-problema.html.
Doyle, T.W., Krauss, K.W. & Wells, C.J. 2009. Landscape analysis and pattern of hurricane impact and circulation on mangrove forests of the Everglades. Wetlands, 29(1): 44–53.
Durst, P.B. 2015. Trees and forests contribute to recovery from the world’s most powerful typhoon in the Philippines. Unasylva 243-244, 66(1-2): 6-16.
Elistair. Anonymous, 2019. Drone Tethers for Emergency Services Applications. Elistair – Innovative Airborne Solutuins https://elistair.com/drone-tethers-for-emergency-services-applications/
Emol. Anonymous, 2017. Cronología de la catástrofe: Cómo se quemaron 250 mil hectáreas en Chile en sólo 5 días Fuente: https://www.emol.com/noticias/Nacional/2017/01/27/842191/Cronologia-de-los-incendios-Como-se-quemaron-250-mil-hectareas-en-Chile-en-solo-5-dias.html Accessed on May 15, 2020.
Emol. 2018. El duro informe de Contraloría sobre el plan de Conaf para el manejo de incendios forestales. https://www.emol.com/noticias/Nacional/2018/05/30/908067/Conaf-recibe-observaciones-de-Contraloria-por-plan-de-manejo-de-incendios-forestales-y-alista-medidas-para-subsanarlas.html Accessed on May15.
Forest-related disasters: Three case studies and lessons for management of extreme events92
Erickson-Davis, M. 2016. Massive wildfire rips through Congo rainforest – is logging to blame? [online]. Eco Business [Cited 16 January 2019]. https://www.eco-business.com/news/massive-wildfire-rips-through-congo-rainforest-is-logging-to-blame/.
Eriksson, L. M. 2016. Winds of change: Voter blame and Storm Gudrun in the 2006 Swedish parliamentary election. Electoral Studies, 41: 129-142.
Excell, J. 2018. Wildfire warriors: the latest developments in aerial firefighting technology. The Engineer. https://www.theengineer.co.uk/aerial-firefighting-technology/. Accessed on May 18, 2020.
Fairhead, J. & Leach, M. 1996. Misreading the African landscape: Society and ecology in a forest-savanna mosaic. Cambridge, United Kingdom, Cambridge University Press.
FAO. 2013. Forests and natural disaster risk reduction in Asia and the Pacific [online]. FAO policy brief also available at http://www.fao.org/asiapacific/events/detail-events/ru/c/888/.
Gardiner, B., Blennow, K., Carnus, J.M., Fleischer, P., Ingemarson, F., Landmann, G., Lindner, M. et al. 2010. Destructive storms in European forests: Past and forthcoming impacts. Report to the European Commission by the Atlantic European Regional Office of the European Forest Institute.
Garstang, M., White, S. & Shugart, H.H. 1998. Convective cloud downdrafts as the cause of large blowdowns in the Amazon rainforest. Meteorology and Atmospheric Physics, 67: 199 [online]. [Cited 28 January 2020]. https://doi.org/10.1007/BF01277510.
Gomez, C., Wassmer, P., Kain, C., De Villiers, M. & Campbell, K. 2011. GIS evaluation of the impacts on the built and the “natural” environment of the 11 March 2011 Tsunami in Rikuzentakata, Iwate Prefecture, Japan. 2011 Researchgate <hal-00655023> [online]. [Cited 28 January 2020]. https://www.researchgate.net/publication/266892418_GIS_Evaluation_of_the_Impacts_on_the_Built_and_the_‘Natural’_Environment_of_the_11_March_2011_Tsunami_in_Rikuzentakata_Iwate_Prefecture_Japan.
Gómez-González, S., Ojeda, F. & Fernandes, P.M. 2017. Portugal and Chile: Longing for sustainable forestry while rising from the ashes. Environmental Science and Policy, 81: 104-107 [online]. [Cited 28 January 2020]. https://www.sciencedirect.com/science/article/pii/S1462901117307694.
Granged, A.J.P., Jordán, A., Zavala, L. & Bárcenas, G. 2011. Fire-induced changes in soil water repellency increased fingered flow and runoff rates following the 2004 Huelva wildfire. Hydrological Processes, 25(10): 1614-1629.
Grayson, A.J. 1989. The 1987 storm impacts and responses. Forestry Commission United Kingdom Bulletin No. 87. London, Forestry Commission.
Grobler, R.R. 2003. A framework for modelling losses arising from natural catastrophes in South Africa. Pretoria, University of Pretoria.
Hara, K. 2014. Damage to coastal vegetation due to the 2011 tsunami in northeast Japan and subsequent restoration process: Analyses using remotely sensed data. Global Environmental Research, 18: 27-34.
Hjelmqvist, R. & Jacobsson, l. 2014. Grazing damage before and after the storm Gudrun. Swedish University of Agricultural Sciences, Department of Forest Ecology and Management. Umeå, Sweden.
References 93
Huang, C.L. 2010. Industry prospective of delamination in wood and wood products. In Bucur, V., ed. Delamination in wood, wood products and wood-based composites. Springer Dordrecht.
Ingemarson, F., Jansson, V., Malmhäll, J., Merkell, B., Nasic, S. & Svensson, S. 2006. Effects of the Gudrun tempest on private forest owners. Survey Results, Report 13. Jönköping, Sweden, Swedish Forest Agency.
Inmarsat. Anonymous, 2019. Satellite connectivity supports Cyclone Idai relief. Inmarsat. https://investors.inmarsat.com/2019/03/28/satellite-connectivity-supports-cyclone-idai-relief-effort/. Accessed on May 15, 2020.
IPCC. 2012. Managing the Risks of Extreme Events and Disasters to Advance Climate Change Adaptation. A Special Report of Working Groups I and II of the Intergovernmental Panel on Climate Change [Field, C.B., V. Barros, T.F. Stocker, D. Qin, D.J. Dokken, K.L. Ebi, M.D. Mastrandrea, K.J. Mach, G.-K. Plattner, S.K. Allen, M. Tignor, and P.M. Midgley (eds.)]. Cambridge University Press, Cambridge, UK, and New York, NY, USA, 582 pp.
Irwin, R. 2009. The incident command system. In Auf der Heide, E., ed. Disaster response: Principles of preparation and coordination. Center of Excellence in Disaster Management & Human Assistance [online]. [Cited 28 January 2020]. https://web.archive.org/web/20071213164736/http://orgmail2.coe-dmha.org/dr/static.htm.
International Organization for Standardization (ISO). 2018. ISO Standard 22320: Societal Security – Emergency Management [online]. [Cited 28 January 2020]. https://www.iso.org/obp/ui/#iso:std:iso:22320:ed-1:v1:en.
Japan for Sustainability. 2013. Volunteers building “great forest wall” tsunami barrier from earthquake debris [online]. [Cited 14 January 2019]. https://www.japanfs.org/en/news/archives/news_id032922.html.
Kalies, E.L. & Kent, L.L. 2016. Tamm Review: Are fuel treatments effective at achieving ecological and social objectives? A systematic review. Forest Ecology and Management, 375(1) 84-95.
Kärvemo, S., Rogell, B. & Schroeder, M. 2014. Dynamics of spruce bark beetle infestation spots: Importance of local population size and landscape characteristics after a storm disturbance. Forest Ecology and Management, 334: 232–240.
Kishore, N., Marqués, D., Mahmud, A., Kiang, M. V., Rodriguez, I., Fuller, A., Ebner, P. et al. 2018. Mortality in Puerto Rico after Hurricane Maria. The New England Journal of Medicine, 379: 162-170.
Koplitz, S.N., Mickley, L.J., Marlier, M., Buonocore, J., Kim, P., Liu, T., Sulprizio, M. et al. 2016. Public health impacts of the severe haze in Equatorial Asia in September-October 2015: Demonstration of a new framework for informing fire management strategies to reduce downwind smoke exposure. Environmental Research Letters, 11(9) [online]. [Cited 11 February 2020]. https://iopscience.iop.org/article/10.1088/1748-9326/11/9/094023.
Korsfeldt, T. & Toll, M. 2006. Storm Gudrun: What can be learnt from the natural disaster of 2005? Stockholm, Swedish Energy Agency.
Kozak, P. & Watts, J. 2017. Chile's forest fires partly due to poor planning, say fire chiefs. The Guardian. https://www.theguardian.com/world/2017/jan/29/chiles-forest-fires-poor-planning-fire-chiefs-monoculture-fire-breaks. Accessed on 18 May 2020.
Forest-related disasters: Three case studies and lessons for management of extreme events94
Larsen, I.J., MacDonald, L.H., Brown, E., Rough, D., Welsh, M.J., Pietraszek, J.H., Libohova, Z., et al. 2009. Causes of post-fire runoff and erosion: water repellency, cover, or soil sealing? Soil Science Society of America Journal, 73: 1393-1407.
Legout, A., Nys, C., Picard, J.F., Turpault, M.P., & Dambrine, E. 2009. Effects of storm Lothar (1999) on the chemical composition of soil solutions and on herbaceous cover, humus and soils (Fougères, France) Forest Ecology and Management, 257(3): 800-811.
Lead Emergency Management Authority (LEMA), European Union. 2017. Analysis of forest fires in Maule and Biobío regions. Technical report delivered to the EU following the LEMA expert mission to Chile in 2017.
Lindelöw, A. & Schroeder, M. 2008. The storm “Gudrun” and the spruce bark beetle in Sweden. Forstschutz Aktuell, 44: 5-7.
Lodin, I. 2016. Choice of tree species in the aftermath of two major storms: A qualitative study of private forest owners in southern Sweden. Uppsala, Swedish University of Agricultural Sciences. (Masters Thesis No. 248).
Magnabosco Marra, D., Trumbore, S.E., Higuchi, N. et al. 2018. Windthrows control biomass patterns and functional composition of Amazon forests. Global Change Biology [online]. [Cited 28 January 2020]. https://doi.org/10.1111/gcb.14457.
Mannakkara, S. & Wilkinson, S. 2014. Re-conceptualising "Building Back Better" to improve post-disaster recovery. International Journal of Managing Projects in Business, 7(3): 1-22 [online]. [Cited 28 January 2020]. https://www.researchgate.net/publication/263286408_Re-conceptualising_Building_Back_Better_to_improve_post-disaster_recovery.
Matzer, M. 2015. Ten years after Hurricane Gudrun - Favourable weather kept beetle-damage in Swedish forests smaller than feared. Timber Online.net. https://www.timber-online.net/rundholz/2015/01/ten_years_after_hurricanegudrun.html. Accessed on May 15, 2020.
Maurel, A., Marigo, J.-J., Pham, K. & Guenneau, S. 2018. Conversion of Love waves in a forest of trees Phys. Rev. B 98, 134311.
McCarthy, J. 2001. Gap dynamics of forest trees: A review with particular attention to boreal forests. Environmental Review, 9: 1-59.
McSweeney, K. 2005. Natural insurance, forest access and compounded misfortune: Forest resources in smallholder coping strategies before and after Hurricane Mitch, Northeastern Honduras. World Development, 33(9): 1453-1471.
Meteorological Office, UK. Anonymous, undated. The great storm of 1987 - A powerful storm ravaged many parts of the UK in the middle of October 1987. https://www.metoffice.gov.uk/learning/learn-about-the-weather/weather-phenomena/case-studies/great-storm. Accessed on May 15, 2020.
Moore, P. 2019. Personal communication Norwegian Geotechnical Institute (NGI). 2011. Analysis of the 2011 Tohoku tsunami.
Oslo, NGI GBV.Negrón-Juárez, R.I., Chambers, J., Guimaraes, G., Zeng, H., Raupp, C., Magnabosco
Marra, D., Pires de Mello Ribeiro, G. et al. 2010. Widespread Amazon forest tree mortality from a single cross-basin squall line event. Geophysical Research Letters, 37: 1-5.
References 95
Nikolov, C., Konôpka, B., Kajba, M., Galko, J. & Kunca, A. 2014. Post-disaster forest management and bark beetle outbreak in Tatra National Park, Slovakia. Mountain Research and Development, 34(4): 326-335.
Nohrstedt, D. & Parker, C. 2014. The public policy dimension of resilience in natural disaster management: Sweden’s Gudrun and Per storms. In Kapucu, N. & Liou, K.T., eds. Disaster and development: Examining global issues and cases. New York, Springer.
Olsson, O. 2016. Cyclone Gudrun and the future of Swedish forestry: thoughts from the Swedish Forestry Association’s Annual Excursion 2014. Stockholm. https://www.sei.org/perspectives/cyclone-gudrun-swedish-forestry/ Environment Institute. Accessed on May 15, 2020.
ONEMI. Anonymous, 2017. Resumen nacional de incendios forestales. ONEMI http://www.onemi.cl/alerta/resumen-nacional-de-incendios-forestales-3/. Accessed on May 15, 2020.
Opdyke, A., Javernick-Will, A., Koschmann, M. & Moench, H. 2016. “Characterizing Post-Disaster Shelter Design and Material Selections: Lessons from Typhoon Yolanda in the Philippines.” Delivered at the proceedings of the 2016 Construction Research Congress, May 31–June 2, 2016, San Juan, Puerto Rico, pp. 1475-1485. American Society of Civil Engineers.
Palm, J. 2008. Emergency management in the Swedish electricity market: The need to challenge the responsibility gap. Energy Policy, 36(2): 843-849.
Paumgarten, F. 2007. The significance of the safety-net role of NTFPs in rural livelihoods, South Africa. Rhodes University. (Unpublished Masters of Science Thesis).
Paumgarten, F., Locatelli, B. & Witkowski, E.T.F. 2018. Wild foods: Safety net or poverty trap? A South African case study. Human Ecology, 46: 183–195.
Peel, M.C., Finlayson, B.L. & McMahon, T.A. 2007. Updated world map of the Köppen-Geiger climate classification. Hydrology and Earth System Sciences, 11: 1633-1644.
Peña-Fernández, E. & Valenzuela-Palma, L. 2008. Increase of forest fires in natural forests and forest plantations in Chile. In González, A., ed. Memories of the Second International Symposium on Policies, Planning and Economics of Forest Fire Protection Programs: A global vision. USDA Forest Service GTR-PSW-208, 595-612.
Prestemon, J.P. & Holmes, T. 2004. Market dynamics and optimal timber salvage after a natural catastrophe. Forest Science, 50(4): 495-511.
Pyne, S. 2018. All wildfires are not alike, but the US is fighting them that way. The Conversation, 12 July 2018 [online]. http://theconversation.com/all-wildfires-are-not-alike-but-the-us-is-fighting-them-that-way-99251.
Radvanovsky, R.S. & McDougall, A. 2018. Critical infrastructure: Homeland security and emergency preparedness, (Fourth Edition). Florida, CRC Press.
Relief Web. Anonymous, 2017. Chile: Incendios forestales –enero 2017 Reporte de Situación No. 02 (al 07 de febrero de 2017) https://reliefweb.int/sites/reliefweb.int/files/resources/CL-Info_de_Situacion_No_2_Incendios_forestales.pdf Accessed on May 15, 2020.
Restas, A. 2015a. Thematic division and tactical analysis of the UAS application supporting forest fire management. In Viegas, X.D., ed. Advances in Forest Fire Research. Coimbra, Portugal. (Also available online at http://dx.doi.org/10.14195/978-989-26-0884-6_172).
Forest-related disasters: Three case studies and lessons for management of extreme events96
Restas, A. 2015b. Drone Applications for Supporting Disaster Management. World Journal of Engineering and Technology, 3: 316-321 [online]. [Cited 20 January 2020]. http://dx.doi.org/10.4236/wjet.2015.33C047).
Sakamoto, T. 2012. Regeneration of coastal forests affected by tsunami. Water Science, 326: 40-61.
Schmidlin, T. 2009. Human fatalities from wind-related tree failures in the United States, 1995–2007. Natural Hazards, 50: 13-25.
Schneider, S.H. 1996. Encyclopaedia of climate and weather. Oxford, Oxford University Press. Seidl, R. & Blennow, K. 2012. Pervasive growth reduction in Norway spruce forests following
wind disturbance. PLoS ONE, 7(3): e33301 [online]. [Cited 20 January 2020]. doi:10.1371/journal.pone.0033301.
Sharma, K., Devarani, R., Gangwar, A. & Chakrabarty, R. 2018. Efficacy and utilization of unmanned aerial system (UAS) as operational tools for disaster management in India [online]. doi:10.20944/preprints201810.0039.v1) [forthcoming publication].
Sills, E., Shanley, P., Paumgarten, F., de Beer, J. & Pierce, A. 2011. Evolving perspectives on non-timber forest products. In Shackleton, S., ed. Non-timber forest products in the global context. Berlin, Springer.
Singleton, A.T. & Reason, C.J.C. 2006. A numerical model study of an intense cutoff low pressure system over South Africa. Monthly Weather Review, 135: 1128-1150.
Smith, N. 2006. There’s no such thing as a natural disaster. In Understanding Katrina: Perspectives from the Social Sciences, [online]. New York, Social Sciences Research Council, https://items.ssrc.org/understanding-katrina/theres-no-such-thing-as-a-natural-disaster/
Södra. Anonymous, undated. The worst storm. Sodra Forest Owners Association. www.sodra.com/en/sodra-history/the-forest/the-worst-storm/. Accessed on May 15, 2020.
Stenlid, J., Oliva, J., Boberg, J. & Hopkins, A. 2011. Emerging diseases in European forest ecosystems and responses in society. Forests, 2: 486-504.
Suursaar, Ü. & Sooäär, J. 2006. Storm surge induced by extratropical cyclone Gudrun: Hydrodynamic reconstruction of the event, assessment of mitigation actions and analysis of future flood risks in Pärnu, Estonia. WIT Transactions on Ecology and the Environment, 241-250.
Svarrer, K. & Olsen, C.S. 2005. The economic value of non-timber forest products: A case study from Malaysia. Journal of Sustainable Forestry, 20(1): 17-41.
Svensson, S., Bohlin, F., Bäck, J.O., Hultåker, O., Ingemarson, F., Karlsson, S. & Malmhäll, J. 2011. Economic and social repercussions in the forest sector by the Gudrun tempest: Report 12, 2006. Stockholm, Swedish Forest Agency.
Swedish Civil Contingencies Agency (MSB). Anonymous, 2015. Tio år sedan stormen Gudrun. Swedish Civil Contingencies Agency. https://www.msb.se/sv/Om-MSB/Nyheter-och-press/Nyheter/Nyhetsarkiv/Nyhetsarkiv-2015/Tio-ar-sedan-stormen-Gudrun/. Accessed on May 15, 2020
Swedish Energy Agency. Anonymous, 2007. Storm Gudrun: What can be learnt from the natural disaster of 2005? Pp72 Eskilstuna, Sweden.
Swedish Forest Agency. 2006. The 2005 tempest: A forestry centred analysis. Stockholm, Swedish Forest Agency.
References 97
Swedish Forest Agency. 2006a. After the Gudrun tempest: Lessons learnt and recommendations for the future. Stockholm, Swedish Forest Agency.
Tanaka, N. 2009. Vegetation bioshields for tsunami mitigation: Review of effectiveness, limitations, construction, and sustainable management. Landscape and Ecological Engineering, 5(1): 71-79.
Tanaka, N. 2011. Effectiveness and limitations of vegetation bioshield in coast for tsunami disaster mitigation. In Morner, N.A., ed. The tsunami threat: Research and technology. London, IntechOpen.
Tanaka, N. 2012. Effectiveness and limitations of coastal forest in large tsunami: Conditions of Japanese pine trees on coastal sand dunes in tsunami caused by great east Japan earthquake. Journal of Japan Society of Civil Engineers, Series B1 (Hydraulic Engineering), 68(4): 7-15.
Tanimura, K. & Yoshikawa, K. 2014. Crisis Management System for Large-scale Disasters. Hitachi Review Vol. 63 (2014), No. 5 35-39.
Terram Foundation. Anonymous, 2018. José Manuel Rebolledo: “No concebimos un Servicio Nacional Forestal sin bosque”. Fundacion Terram. https://www.terram.cl/2018/06/jose-manuel-rebolledo-no-concebimos-un-servicio-nacional-forestal-sin-bosque/. Accessed on 15 May 2020.
Torita, H., Tanaka, N., Masaka, K. & Iwasaki, K. 2018. Effects of forest management on resistance against tsunamis in coastal forests. Ocean Engineering, 169: 379-387.
Ubeda, X. & Sarricolea, P. 2016: Wildfires in Chile: A review. Global Planetary Change, 146: 152-161 [online]. {Cited 20 January 2020]. https://www.sciencedirect.com/science/article/pii/S0921818116302090?via%3Dihub.
Ulbrich, U., Fink, A.H., Klawa, M. & Pinto, J.G. 2001. Three extreme storms over Europe in December 1999. Weather, 56: 70-80.
United Nations Office for Disaster Risk Reduction (UNDRR, formerly UNISDR). 2015. Sendai Framework for Disaster Risk Reduction 2015-2030. Geneva, UNDRR. 32 pp.
United Nations General Assembly (UNGA). 2016. Report of the open-ended intergovernmental expert working group on indicators and terminology relating to disaster risk reduction [online]. [Cited 20 January 2020]. https://www.unisdr.org/we/inform/publications/51748.
United Press International. 2006. Africa leads globe in forest fires. Phys. Org. April 2. https://phys.org/news/2006-04-africa-globe-forest.html. Accessed on June 1, 2020.
Unites States Geological Survey. 2015. Volcanic Ash Impacts & Mitigation. Volcanic ashfall impact group. https://volcanoes.usgs.gov/volcanic_ash/. Accessed on June 1, 2020.
United Press International. 2006. Africa leads globe in forest fires. Phys. Org. April 2. https://phys.org/news/2006-04-africa-globe-forest.html. Accessed on June 1, 2020.
Valinger, E., Kempe, G. & Fridman, J. 2014. Forest management and forest state in southern Sweden before and after the impact of Storm Gudrun in the winter of 2005. Scandinavian Journal of Forest Research, 29(5): 466-472 [online]. DOI: 10.1080/02827581.2014.927528.
Valinger, E., Lövenius, M., Johansson, U., Fridman, J., Claeson, S. & Gustafsson, A. 2006. Analyses of risk factors after the Gudrun tempest: Report No.8, 2006. Stockholm, Swedish Forest Agency.
van Hensbergen, H. 2005. Personal experience.
Forest-related disasters: Three case studies and lessons for management of extreme events98
Vandermeer, J., de la Cerda, I.G., Boucher, D., Perfecto, I. & Ruiz, J. 2000. Hurricane disturbance and tropical tree species diversity. Science, 190: 788-791.
Warner, K. 2000. Forestry and sustainable livelihoods. Unasylva, 51: 3-12. Webber, J.F. & Gibbs, J.N. 1996. Water storage of timber: Experience in Britain. Bulletin 117.
London, Her Majesty’s Stationary Office. Weber, B. 2017. Costs of Alberta wildfire reach USD 9.5 billion. BNN Bloomberg [online].
[Cited 20 January 2020]. https://www.bnnbloomberg.ca/costs-of-alberta-wildfire-reach-9-5-billion-study-1.652292.
World Conservation Union. Anonymous. 2005. Forests and natural disasters. Arbor Vitae-The IUCN/WWF Conservation Newsletter. https://www.iucn.org/sites/dev/files/import/downloads/arborvitae27.pdf, Accessed on May 15.
Worrall, J.J., Lee T.D & Harrington, T.C. 2004. Forest dynamics and agents that initiate and expand canopy gaps in Picea-Abies forests of Crawford Notch, New Hampshire. USA Journal of Ecology, 93(1): 178-190 [online]. [Cited 17 January 2020]. DOI: 10.1111/j.1365-2745.2004.00937.x.
Yang, C., Zhu, X., Yebra, M., Harris, S. & Tapper, N. 2017. Development of a predictive model for estimating forest surface fuel load in Australian eucalypt forests with LiDAR data. Environmental Modelling and Software, 97: 61-71 [online]. [Cited 17 January 2020]. DOI: 10.1016/j.envsoft.2017.07.007.

For more information, please contact:
Forestry – Natural Resources and Sustainable ProductsE-mail: [email protected] address: www.fao.org/forestry/en
Food and Agriculture Organization of the United NationsViale delle Terme di Caracalla00153 Rome, Italy CB0686EN/1/11.20
ISBN 978-92-5-133185-9 ISSN 2664-1062
9 7 8 9 2 5 1 3 3 1 8 5 9