Embed Size (px)
Citation preview


3
FOREWORD
Multilateral co-operation plays a vital role in responding to today’s global development challenges. Donors and governments use the multilateral system to invest and channel large amounts of money to help countries develop, and they have a responsibility to ensure that the people they are targeting reap the benefits. Yet this is an increasingly difficult task. The multilateral system is growing in complexity, with many types of organisations delivering assistance in a variety of forms. Today, more than 200 multilateral donors manage 40% of all aid in a complex mix of types, sizes and delivery systems that is often referred to as the “aid architecture”. Understanding the functioning of this architecture – and its effects on aid efficiency – is a major, but essential challenge.
This fourth DAC Report on Multilateral Aid brings to light an important finding: the possible start of a downward trend in funding for multilateral aid, which reverses a trend of sustained growth over the past decade. Severe budget constraints in many OECD countries have brought all aid – including that provided through the multilateral system – under increasing scrutiny. This has led to increasing emphasis on – and proliferation of – criteria to measure the performance of these systems. Granted, aid “fragmentation” – a lack of coherence that limits its effectiveness – stems mostly from the policies and practices of bilateral providers. Yet multilateral aid is not beyond reproach. This report shows just how multilateral aid contributes to fragmentation. There are – of course – solutions, and these are outlined in this report: seven guiding principles that can limit the proliferation of multilateral channels, a leading source of fragmentation. These principles build on the commitments agreed in Busan in 2011 at the Fourth High level Forum on Aid Effectiveness.
The DAC Chair’s annual Development Co-operation Report (DCR) focuses this year on an urgent task: the unfinished business of ending extreme poverty in the world. By providing a snapshot of individual DAC donors’ policies and contributions to the multilateral system, the DAC Report on Multilateral Aid complements the DCR, helping readers understand global trends in multilateral funding and how this system can deliver more and better results.
The valuable information and guidance in this report can support collective efforts to improve aid, shaping policy decisions to forge a multilateral system that fulfils its goals fully and contributing to a more equitable world where extreme poverty is a thing of the past.
Erik Solheim, DAC Chair

4

5
TABLE OF CONTENTS
FOREWORD ................................................................................................................................................... 3
ACRONYMS AND ABBREVIATION .......................................................................................................... 9
EXECUTIVE SUMMARY ........................................................................................................................... 11
CHAPTER 1. RECENT TRENDS IN MULTILATERAL AID ................................................................... 13
Recent trends in multilateral ODA ............................................................................................................ 15 Total use of the multilateral system ........................................................................................................... 15 Future trends in multilateral aid ................................................................................................................. 19 Multilateral aid concentrated in top five clusters ....................................................................................... 20 Non-DAC multilateral aid .......................................................................................................................... 21 Notes .......................................................................................................................................................... 23 References .................................................................................................................................................. 24
CHAPTER 2. FRAGMENTATION OF AID EFFORTS ............................................................................. 27
Fragmentation of multilateral and bilateral outflows ................................................................................. 28 Reattributing non-core funding to multilaterals ......................................................................................... 31 More fragmentation – for good reason? ..................................................................................................... 34 Notes .......................................................................................................................................................... 35 References .................................................................................................................................................. 35
CHAPTER 3. ASSESSMENTS OF MULTILATERAL ORGANISATIONS ............................................. 37
Types of assessments ................................................................................................................................. 38 Comprehensive assessments of multilateral organisations ........................................................................ 39 Challenges of multiple assessments ........................................................................................................... 45 How can evidence from assessments be used in policy making? .............................................................. 47 Conclusions ................................................................................................................................................ 48 Notes .......................................................................................................................................................... 48 References .................................................................................................................................................. 49
CHAPTER 4. TOWARDS GUIDING PRINCIPLES FOR MULTILATERAL AID .................................. 51
Managing multilateral organisations: global level ..................................................................................... 53 Effective delivery of multilateral aid ......................................................................................................... 57 Country-level harmonisation among multilateral and bilateral donors ...................................................... 59 Emerging guiding principles ...................................................................................................................... 60 Notes .......................................................................................................................................................... 61 References .................................................................................................................................................. 62
ANNEX A. STATISTICAL FIGURES AND TABLES ............................................................................... 63
ANNEX B. COUNTRY TABLES AND FIGURES ..................................................................................... 71
Australia ..................................................................................................................................................... 72 Austria ........................................................................................................................................................ 73 Belgium ...................................................................................................................................................... 74 Canada ....................................................................................................................................................... 75 Denmark ..................................................................................................................................................... 76 European Union Institutions ...................................................................................................................... 77 Finland ....................................................................................................................................................... 78
6
France ......................................................................................................................................................... 79 Germany ..................................................................................................................................................... 80 Greece ........................................................................................................................................................ 81 Ireland ........................................................................................................................................................ 82 Italy ............................................................................................................................................................ 83 Japan .......................................................................................................................................................... 84 Korea .......................................................................................................................................................... 85 Luxembourg ............................................................................................................................................... 86 Netherlands ................................................................................................................................................ 87 New Zealand .............................................................................................................................................. 88 Norway ....................................................................................................................................................... 89 Portugal ...................................................................................................................................................... 90 Spain .......................................................................................................................................................... 91 Sweden ....................................................................................................................................................... 92 Switzerland ................................................................................................................................................ 93 United Kingdom ........................................................................................................................................ 94 United States .............................................................................................................................................. 95
ANNEX C. GLOBAL BILATERAL DONOR FRAGMENTATION .......................................................... 97
Table C.1. Global bilateral donor fragmentation on the basis of CPA data: 2010 disbursements in current USD ........................................................................................................................................................... 98 Table C.2. Global multilateral donor fragmentation on the basis of CPA data: 2010 disbursements in current USD ............................................................................................................................................. 104
ANNEX D. FRAGMENTATION ON THE BASIS OF CPA .................................................................... 111
Table D.1. Concentration of multilateral agencies (core resources) ........................................................ 111 Table D.2. Impact of non-core multilateral aid on fragmentation ........................................................... 112
ANNEX E. THE MOPAN COMMON APPROACH METHODOLOGY ................................................. 113
ANNEX F. FRAGILE STATES ................................................................................................................. 117
Tables
Table 1.1. Advantages and disadvantages of non-core contributions ..................................................... 16 Table 1.2. Core and non-core contributions to multilateral organisations .............................................. 20 Table 1.3. Non-DAC gross ODA disbursements, 2010 .......................................................................... 21 Table 2.1. Concentration of multilateral agencies (core resources)........................................................ 30 Table 2.2. Impact of non-core funding on fragmentation ....................................................................... 33 Table 3.1. Elements of different multilateral assessments...................................................................... 40 Table 3.2. A comparison of how Australia’s Multilateral Assessment and the UK’s Multilateral Aid Review rate multilateral agencies ............................................................................................................. 46
7
Figures
Figure 1.1. Gross ODA provided by DAC member countries (2001-2011) ........................................ 15 Figure 1.2. Gross ODA disbursements (2010) ..................................................................................... 16 Figure 1.3. Total use of the multilateral system, gross ODA disbursements (2010) ........................... 17 Figure 1.4. Total contributions to EU institutions as % gross ODA disbursements (2010) ................ 18 Figure 1.5. Total use of the multilateral system as % gross ODA disbursements (2010) .................... 19 Figure 2.1. Opportunities for concentration (2010) ............................................................................. 29 Figure 2.2. Trend in concentration (2000-2010) .................................................................................. 31 Figure 2.3. Impact of re-attribution (2007-10) ..................................................................................... 32 Figure 3.1. Findings of the Australian Multilateral Assessment .......................................................... 43 Figure 3.2. The problem-solving model used in assessment research ....................................................... 47 Figure 4.1. Conceptual framework for classifying key initiatives for multilateral effectiveness to date ............................................................................................................................................................. 53
Boxes
Principles to reduce the proliferation of multilateral channels .................................................................. 12 Box 1.1. How terms are used in this report ................................................................................................ 14 Box 1.2. Chinese contributions to international organisations in 2010 ..................................................... 22 Box 2.1. Measuring aid fragmentation and concentration of aid ............................................................... 28 Box 2.2. Two scenarios for classifying non-core funding ......................................................................... 31 Box 3.1. Methodology of the Australian Multilateral Assessment ............................................................ 44 Box 4.1. Busan HLF4 commitment to reducing the proliferation of aid channels .................................... 52 Box 4.2. The World Bank’s notion of thinking twice for improved selectivity ........................................ 54 Box 4.3. Think twice: recommendation from OECD’s Task Team on Health as a Tracer Sector ............ 54 Box 4.4. Eight good practice lessons for good multilateral donorship from the DAC .............................. 56 Box 4.5. Recommendations from the Health as a Tracer Sector initiative ................................................ 57 Box 4.6. Accra Agenda for Action, Paragraph 19c ................................................................................... 57 Box 4.7. Best practice principles for engagement of global health partnerships at country level ............. 58 Box 4.8. Building partnerships .................................................................................................................. 59 Box 4.9. Harmonisation – excerpts from Draft Good Practice Guidance for Integration and Effectiveness of Global Programmes at the Country Level ................................................................ 60 Box 4.10. Principles to reduce the proliferation of multilateral channels .................................................. 61 Box E.1. Organisational effectiveness according to MOPAN ................................................................. 113

8

9
ACRONYMS AND ABBREVIATIONS
AfDB – African Development Bank
AfDF – African Development Fund
AFESD – Arab Fund for Economic and Social Development
AsDB – Asian Development Bank
AsDF – Asian Development Fund
BADEA – Arab Bank for Economic Development in Africa
COMPAS – Common Performance Assessment System
CPA – Country Programmable Aid
DAC – Development Assistance Committee
DAW – UN Division for the Advancement of Women
DFID – Department for International Development
EDF – European Development Fund
EU – European Union
EVALNET – OECD/DAC Evaluation Network
FAO – Food and Agriculture Organisation
GAVI – Global Alliance for Vaccines and Immunisation
GEF – Global Environment Facility
IADB – Inter-American Development Bank
IBRD – International Bank for Reconstruction and Development
ICDO – International Civil Defence Organisation
ICRC – International Committee of the Red Cross
IDA – International Development Association
IFAD – International Fund for Agricultural Development
IFC – International Finance Corporation
ILO – International Labour Organisation
IMF – International Monetary Fund
LIC – Low-income country
MAR – Multilateral Aid Review
MIGA – Multilateral Investment Guarantee Agency
MO – Multilateral organisation
MOFCOM – Ministry of Commerce (China)
MOPAN – Multilateral Organisation Performance Assessment Network
NGO – Non-governmental organisation
OCHA - Office for the Co-ordination of Humanitarian Affairs
ODA – Official Development Assistance
OFID – OPEC Fund for International Development
OPEC – Organisation of Petroleum Exporting Countries
OSAGI – UN Office of the Special Adviser on Gender Issues
TCPR – Triennial Comprehensive Policy Review (UN General Assembly)
TT HAT – OECD Task Team on Health as a Tracer Sector
UK – United Kingdom
UNAIDS – Joint United Nations Programme on HIV/AIDS
UNDPKO – United Nations Department of Peacekeeping Operations
UNCTAD - United Nations Conference on Trade and Development
UNDP – United Nations Development Programme
UNEP – United Nations Environment Programme
UNESCO – United National Education Social and Cultural Organisation
UNHCR – United Nations High Commissioner for Refugees
UNICEF – United Nations’ Children’s Fund
UNFPA – United Nations Population Fund
UNIDO – United Nations Industrial Development Organisation
UNIFEM – UN Development Fund for Women
UN-INSTRAW – UN International Research and Training Institute for the Advancement of Women
UN-OCHA – UN Office for the Coordination of Humanitarian Affairs
UNRWA – United Nations Relief and Works Agency
WFP – World Food Programme
WHO – World Health Organisation
WIPO – World Intellectual Property Organisation
WMO – World Maritime Organisation

10

11
EXECUTIVE SUMMARY
Never before have donors relied on the multilateral system as much as they do today: the total use of the multilateral system (core as well as non-core resources) represents 40% of gross ODA. Multilateral aid plays a vital role in promoting governance based on global principles and standards, and in encouraging international co-operation. It is not surprising, therefore, that the multilateral system is becoming increasingly complex. Donors and governments that manage the system – and invest large amounts of money and resources in it – must ensure that it maintains its legitimacy and effectiveness.
This fourth OECD report on multilateral aid contributes to this effort by examining the increasingly fragmented nature of contributions to the multilateral system, and by offering a way forward in the form of guiding principles that can help limit the proliferation of channels (see box).
Multilateral core aid is still on the rise, but slowing
Multilateral ODA has grown over the past 20 years. In 2011, it reached almost USD 38 billion in core resources. Although 2011 saw the first drop in global ODA since 1997 (by 2.7%), there was in fact a 1% increase in real terms in multilateral aid compared to the previous year, which is likely to lead to increased outflows from the multilateral system to partner countries in 2012.
Nonetheless, the rate at which multilateral ODA is growing has slowed over recent years, mirroring the slowing overall growth in gross ODA: from 9% in 2008 it dropped to 5% in 2010 and then to only 1% in 2011. This slowing trend promises to continue as governments come under increasing pressure from legislative bodies and civil society to scrutinise and even limit multilateral aid. The OECD 2012-2015 Survey on Donors’ Forward Spending Plans reported that seven DAC members expect to decrease their multilateral ODA in real terms in the coming years.
While investment in the multilateral system remains a significant part of almost every country’s aid budget, within the current climate of budget restrictions governments are increasingly careful to choose channels where funds will target global priorities and where the risk of loss of influence over funds is limited.
Reducing proliferation is an agreed objective
At the Fourth High-Level Forum in Busan in 2011, countries and organisations agreed to “improve the coherence of our policies on multilateral institutions, global funds and programmes”. They set out to “reduce the proliferation of these channels and […], by the end of 2012, agree on principles and guidelines to guide our joint efforts”. To do so, they pledged to “make effective use of multilateral channels, focusing on those that are performing well […]”. This commitment follows a decade of efforts facilitated by the UN, the OECD-DAC, the health sector and others to identify good practices in funding, assessing, and delivering multilateral co-operation.
Today, however, two out of every five aid relationships are not “significant” in relative quantitative terms and is therefore a source of fragmentation of aid (the methodology used to measure fragmentation of aid assesses the financial significance of each aid relation in the context of the growing concern of having too many donors contributing too little in too many countries). Based on the analysis of such non-significance, this report finds that the rising non-core (earmarked) aid to multilateral organisations contributes to further fragmentation. Because it may not always be relevant, desirable or possible to increase (or shift) disbursements where aid relations are “non-significant”, it is important to understand the rationale behind non-core funding to live up to the Busan commitments, bilateral donors

12
will need to carefully consider their motivation and rationale in channelling financially “non-significant” levels of non-core funding through multilateral agencies.
At the same time, the number of assessments of multilateral organisations has multiplied. Over and above the regular evaluations undertaken by multilateral organisations’ own evaluation groups and divisions, numerous important bilateral and joint assessments of multilateral agencies have been undertaken over the past two years. Among these, the following have been key to understanding the current effectiveness of multilateral organisations: Australia’s Multilateral Assessment (2012); Denmark’s Engagement in Multilateral Organisations (2012); Sweden’s assessments of multilateral organisations (2011); the Netherlands’ scorecards of multilateral organisations (2011); the United Kingdom’s Multilateral Aid Review (2011); and, finally, the annual Assessments of organisational effectiveness by the Multilateral Organisation Performance Assessment Network (MOPAN). A comparative analysis of these assessments shows a striking convergence in the criteria adopted.
The OECD encourages donors to enhance existing joint assessments rather than promoting new bilateral assessments. This can help to ensure that organisations are assessed against common objectives, enabling their recommendations to carry more weight in the broader governance context of the institution under review and inciting greater reform. In line with existing aid effectiveness commitments, these assessments would also place stronger emphasis on the evidence provided by developing countries or other “end-users” of the multilateral system.
The OECD work on good practices – related to different entry points in the relationship between bilateral and multilateral donors – has led to the following guiding principles for reducing proliferation of multilateral channels, in response to the Busan commitments.
Principles to reduce the proliferation of multilateral channels
In line with the commitment set out in the Busan Partnership for Effective Development Co-operation (Paragraph 25), we welcome the diversity of development co-operation actors, and agree to work to reduce the proliferation of multilateral channels by using existing channels and frameworks for programme design, delivery and assessments, drawing on the following principles:
1 Use existing channels as the default, adjusting channels where necessary, and address any legal and administrative barriers that may prevent their use.
2 Use the international community’s appetite for new initiatives to innovate and reform the existing multilateral system, allowing for donor visibility.
3 Regularly review the number of multilateral organisations, funds and programmes with the aim of reducing their number through consolidation without decreasing the overall volume of resources.
4 Provide core or un-earmarked contributions to multilateral organisation, where relevant and possible.
5 Ensure that new multilateral programmes and channels are multi-donor arrangements; are time-bound, and should contain provisions for a mid-term review; and do not impose excessive reporting requirements if the creation of multilateral programmes and channels is unavoidable.
6 Support country-level harmonisation among all providers of development co-operation, including through representation on governing boards of multilateral organisations, funds and programmes.
7 Monitor trends and progress to curb the proliferation of channels at the global level; inform monitoring in partner countries.

13
CHAPTER 1. RECENT TRENDS IN MULTILATERAL AID
In 2011 members of the OECD’s Development Assistance Committee (DAC) increased their level of multilateral aid, despite an overall decrease in ODA in 2011, as a consequence of fiscal austerity in OECD countries. Reinforcing this trend is the fact that country programmable aid (CPA) is set to recover in 2012, thanks mainly to multilateral outflows to developing countries. The role of the multilateral system is considerably more important than the volume of multilateral official development assistance might suggest. When earmarked flows are included, it covers as much as 40% of all aid delivered worldwide. Such earmarked flows remain an important channel for donors to reach the poorest and most fragile countries. Key to the future of multilateral aid is how the multilateral organisations are responding to an expected reduction in multilateral aid in the future. To date, they have been making an effort to diversify their funding base in order to mobilise more resources from middle-income countries, private foundations, and through innovative financing. This chapter also looks at the multilateral contributions of 21 countries that are not members of the DAC, as well as China’s multilateral funding.

14
The level of donor investment in the multilateral system continued to increase in 2011 and is likely to lead to growth in outflows to partner countries in 2012. Although 2011 saw an overall decrease of 2.7% in official aid development (ODA) for the first time since 19971, there was a 1% real term increase in multilateral ODA – i.e. DAC members’ un-earmarked contributions to multilateral agencies. So, while fiscal austerity in OECD countries put pressure on overall aid levels, multilateral ODA was spared the decrease.
Reinforcing that trend is the fact that, as the 2012-15 Survey on Donors’ Forward Spending Plans (OECD, 2012a) indicates, country programmable aid (CPA)2 will recover in 2012, thanks mainly to multilateral outflows3 to developing countries, which are expected to increase by 13% in real terms. This increase reflects the delayed effect since donors’ previous replenishment efforts and – to some extent – the inclusion of contributions from outside the OECD’s Development Assistance Committee (DAC).
Sources: OECD (2010), Reporting Directives for the Creditor Reporting System, OECD, Paris; OECD (2007), Reporting Directives, paragraph 9, OECD, Paris; DAC Glossary of Key Terms and Concepts, www.oecd.org/dac/glossary.
Box 1.1. How terms are used in this report
The following OECD/DAC definitions regarding multilateral organisations and multilateral aid are used in this report.
Multilateral organisations
“Multilateral organisations are international institutions with governmental membership. They include organisations to which donors’ contributions may be reported, either in whole or in part, as multilateral ODA as well as organisations that serve only as channels for bilateral ODA” (OECD, 2010).
The DAC maintains the list of organisations to which donors’ contributions may be reported either in whole or in part as multilateral ODA (see the “List of ODA-eligible international organisations”: http://www.oecd.org/dac/stats/listofoda-eligibleorganisations.htm). Contributions should only be recorded as multilateral ODA if the recipient agency is included on the List.
In the context of DAC statistics and publications, the terms “agency”, “organisation”, or “institution” are used interchangeably. As the DAC reporting directives state, a “fund managed autonomously by such an agency” can also be considered a multilateral organisation in DAC statistics (OECD, 2007).
Flows: multilateral ODA, outflows, and non-core multilateral (multi-bi or earmarked) aid
A distinction is made between (a) multilateral ODA, which measures funding to multilateral organisations (i.e. inflows); and (b) outflows from those agencies to partner countries.
a) Multilateral ODA comprises official concessional contributions to multilateral agencies. These flows are also referred to as “core” contributions to multilateral organisations so as to distinguish them from “non-core” contributions described in detail below. They are sometimes also called “multilateral inflows”. According to the statistical directives, if a contribution is to be classified as multilateral, it must be made to an institution that:
• “conducts all or part of its activities in favour of development; • is an international agency, institution, or organisation whose members are governments or a fund
managed autonomously by such an agency; and • pools contributions so that they lose their identity and become an integral part of its financial
assets” (OECD, 2007).

15
Recent trends in multilateral ODA
Nonetheless, there appears to be a slowing-down and levelling-off of multilateral ODA. In the past decade, multilateral ODA has risen from USD 27 billion to USD 38 billion, accounting for close to one-third of gross ODA. Since 2007, however, the multilateral share of ODA has levelled off to 28% from a high of 32% in 2001. Along with the slow-down in overall growth of gross ODA, multilateral aid, too, has seen a deceleration in its annual growth rate – from 9% in 2008 to 5% in 2010, and down to only 1% in 2011.
Figure 1.1 represents the composition of DAC members’ gross bilateral and multilateral ODA over the past decade. The bottom (yellow) dotted line shows multilateral aid, excluding contributions to EU Institutions. The amount that goes to EU Institutions4 (the darker portion above the yellow dotted line) is a growing trend, which accounted for the largest share (35%) of DAC members’ multilateral ODA, estimated at USD 13.2 billion in 2010. Figure A.1 and Table A.1 in Annex A, which give overviews of disbursements to selected multilateral agencies from 2006 to 2010, bear out the rising trend of aid to EU Institutions.
Figure 1.1 Gross ODA provided by DAC member countries (2001-11) (in constant 2010 prices)
* 2011 data are provisional Source: OECD (2012b), DAC Aggregate Statistics, OECD, Paris.
Total use of the multilateral system
In 2010, USD 37.6 billion was spent on funding multilateral agencies’ core functions. An additional 12% of total ODA (USD 16.7 billion), though scored as bilateral, was in fact earmarked aid that was channelled through and implemented by multilateral agencies (Figure 1.2). Taken as a whole, use of the multilateral system (core and non-core multilateral aid) accounted for 40% of gross ODA, or USD 54.3 billion, in 2010, compared to USD 51.2 billion in 2009.

16
Figure 1.2 Gross ODA disbursements (2010) (excluding debt relief and contributions from EU Institutions, in constant 2010 prices)
Source: OECD (2012b) DAC Aggregate Statistics, OECD, Paris; OECD (2012b), OECD (2012c), Creditor Reporting System Database, OECD, Paris.
Non-core multilateral aid continued to grow in 2010, increasing by 8% in real terms from 2009. Humanitarian aid makes up 29% of non-core multilateral aid. Forty-five per cent of multi-bi aid is not allocated by country, but is earmarked for a specific region, theme, and/or sector (e.g. sub-Saharan Africa, food security, climate change, or education). Of the 55% that does go to countries, the bulk is disbursed to fragile and conflict-affected low-income countries (83%). The multi-bi channel has thus maintained its importance as a channel for donors to reach the poorest and most fragile countries.
Table 1.1 Advantages and disadvantages of non-core contributions
From the perspective of:
Advantages of non-core Disadvantages of non-core
Developing countries
• can lead to more representative governance; • results in better harmonisation compared to
bilateral initiatives.
• could lead to less representative governance;
• might blur lines of accountability.
Multilateral organisations
• preferable to numerous parallel bilateral initiatives when there are multiple donors;
• preferable to the creation of new organisations or initiatives for specific, critical, time-bound purposes.
• may weaken established governance mechanism by bypassing board decisions;
• increases transaction costs (including reporting), especially for single-donor trust funds;
• may conflict with the organisation’s core policies or strategy;
• may lead to the “bilateralisation” of multilateral aid.
Bilateral donors
• can be focused on specific sectors, regions or countries (including fragile states) where the bilateral donor may lack expertise or has no presence;
• can make contributions more visible as the funding “keeps its identity” by not being pooled;
• can bypass cumbersome board decisions; • can serve as “pilot” for stand-alone funds.
• core contributions may subsidise administrative costs of non-core funds.
Source: Based on: OECD (2011), DAC Report on Multilateral Aid, OECD, Paris.
Multilateral ODA = 28% of ODA
2010 Total ODA (excl. debt relief) = 136.7 bn
Bilateral ODA (excl. multi-bi) = 82.4 billion
Multi-bi / non-core = 16.7 billion
Multilateral ODA = 37.6 billion
Total use of multilateral organisations = 40 % of ODA
Total bilateral ODA = 72% of ODA

17
As can be seen in Figure 1.3, the largest volume of non-core or multi-bi flows is channelled through UN Funds and Programmes. In fact, according to the annual report of the UN Secretary-General on the funding of activities for development, 74% of total funding of UN operational activities for development (which includes humanitarian assistance) is non-core, a share that is still growing (UN, 2012). The second-largest recipient of earmarked ODA is the World Bank Group – International Bank for Reconstruction and Development (IBRD), International Development Association (IDA), International Finance Corporation (IFC), Multilateral Investment Guarantee Agency (MIGA). It received over USD 4 billion in non-core funding in 2010. In an effort to consolidate its existing trust funds, the Bank has worked to group funds under umbrella arrangements, transform single-donor trust funds into multi-donor trust funds, and close empty trust funds. The EU only recently started to accept earmarked funds, which explains their very small share of non-core multilateral aid.
Figure 1.3 Total use of the multilateral system, gross ODA disbursements (2010) (excluding debt relief and contributions from EU Institutions, in constant 2010 prices)
Note: Percentages refer to the share of multi-bi (non-core) aid as a proportion of multilateral and multi-bi ODA in that category. Source: OECD (2012c), Creditor Reporting System Database, OECD, Paris; OECD (2012b), DAC Aggregate Statistics, OECD, Paris.
In 2010 as Figure 2.4 shows, EU member states provided 19% of their total gross ODA to EU Institutions5, which includes core multilateral aid and earmarked contributions to the EU. Total earmarked ODA to the EU was USD 192 million in 2010. It was in Greece and Italy that had the highest shares of gross ODA to EU Institutions and the lowest were in Sweden and Luxembourg. In volume, Germany (USD 2.9 billion), France (USD 2.7 billion), and the United Kingdom (USD 2.1 billion) were the biggest ODA contributors to EU Institutions. Luxembourg (USD 36 million), Ireland (USD 166 million), and Portugal (USD 190 million) were the smallest.
-
2
4
6
8
10
12
14
16
EU institutions World Bank Group UN Funds and Programmes
Other UN Regional Development Banks
Other multilaterals
In 2
010
USD
bill
ion
Multilateral ODA Multi-bi ODA
WFP
UNDP
UNICEF
UNHCR
UNRWAUNFPA
WHO
FAOUNOCHA
ILO
34%
18%
23%
25%
16%
12%
10%

18
Figure 1.4 Total contributions to EU institutions (core and non-core) as percentages of gross ODA disbursements (2010)
(excluding debt relief, in constant 2010 prices)
Source: OECD (2012b), DAC Aggregate Statistics, OECD, Paris; OECD (2012c), Creditor Reporting System Database, OECD, Paris.
Comparing and contrasting the share of multilateral aid in DAC members’ gross ODA produces different results depending on whether the share includes or excludes ODA to the EU. Figure 1.5 shows members’ share of multilateral and multi-bi ODA, excluding contributions to the EU. Although the DAC average is 33%, some donors – like Germany and France, whose share of multilateral ODA is normally high and multi-bi low – appear to contribute lower than expected proportions of the total use of the multilateral system, given the inclusion of multi-bi or non-core multilateral aid in the total. The total share of the non-EU multilateral system accounts for the highest portion of gross ODA in Italy (57%), Luxembourg (55%), and the United Kingdom (53%), and the lowest in Portugal (23%), Germany (22%), and Greece (11%). Figure A.3 in Annex A shows members’ share of the total use of multilateral and multi-bi ODA, including contributions to the EU6.
While it may not be possible to draw conclusions as to donor preferences, donors on the right-hand side of the graph in Figure 1.5 tend to have bilateral programmes that are large relative to their multilateral aid and/or to contribute relatively less multilateral aid to non-EU Institutions. For example, some of the DAC members with an above-average share of aid to EU institutions7 (like Portugal, Belgium, France and Germany) fall well below the DAC average when contributions to EU institutions are excluded. That signifies, in this case, that multilateral contributions to EU Institutions as a proportion of their total multilateral aid portfolio are large.
0%
10%
20%
30%
40%
50%
60% 278 m1.6 bn
339 m190 m
566 m 2.7 bn 2.9 bn 166 m 1 bn 222 m DAC EU average = 19%
2.1 bn618 m 281 m 408 m 36 m

19
Figure 1.5 Total use of the multilateral system as % gross ODA disbursements (2010) (excluding debt relief and contributions to EU Institutions, in constant 2010 prices)
Source: OECD (2012b), DAC Aggregate Statistics, OECD, Paris.
Future trends in multilateral aid
The 2012-15 Survey on Donors’ Forward Spending Plans (OECD, 2012a) asked donors to report their multilateral spending intentions. Sixteen donors were able to provide this information through 2013.8 Compared to a baseline of 2010, 9 of the 16 planned to increase their multilateral ODA in real terms by 2013, while 7 predicted a fall in their multilateral spend. Although their estimates could be conservative, they constitute a clear break from the historic disbursement pattern where 12 of the same DAC donors had regularly increased their annual multilateral aid.
Estimates of a future reduction in multilateral aid are in line with the predicted fall in overall ODA, even if multilateral aid has not yet been affected by the overall fall in bilateral ODA confirmed in 2011. These projections may indicate the beginning of a drying-up of the traditional source of multilateral funding, a trend evidenced by multilateral organisations’ effort to diversify their funding base in order to mobilise more resources from middle-income countries, private foundations, and through innovative financing. It is a path that United Nations operations for development appear to be pursuing: 17% of contributions to them in 2010 came from non-governmental organisations, public-private partnerships, and other multilateral organisations (including global funds) (UN, 2012). As an example of a broadening of the resource base, the 2011 DAC Report on Multilateral Aid cited the record of IDA’s 16th Replenishment, of which 4.2% came from non-DAC members. The recent Asian Development Fund replenishment period, known as AsDF XI, attained a record USD 4.6 billion, with non-DAC members supplying 2%.
0%
10%
20%
30%
40%
50%
60%
core, excl. contributions to EU institutions non-core, excl. contributions to EU institutions
DAC Average = 33%

20
Table 1.2 Core and non-core contributions to multilateral organisations***
***The European Union (EU) has provided the following clarification: “The EU is unique among DAC members in that it plays a dual role in development assistance. Although the EU is a full DAC member and a donor of ODA in its own right, with its own development policy and own resources, it is often presented as a multilateral in DAC publications for statistical purposes. This report reflects this dichotomy.”
Source: OECD DAC secretariat.
Multilateral aid concentrated in top five clusters
As in previous years, data from 2010 confirm the historical pattern of DAC members directing most of their multilateral aid to five clusters of multilaterals. The total between 2006 and 2010 was 81%, which can be broken down as follows: the European Development Fund (EDF)-plus-European Union (EU) budget (36%)9; International Development Association (IDA) (22%); UN Funds and Programmes (9%), the African and Asian Development Banks (AfDB and AsDB) (5% and 3%), and the Global Fund to Fight AIDS, Tuberculosis and Malaria (7%). Only 19% of total multilateral aid was allocated to the remaining 212 multilateral organisations, funds or trust funds, many of which have research or policy functions or serve a norms-based or standard-setting purpose. Table A.2 in Annex A shows the percentages contributed by each DAC member to these groups of organisations over the five-year period.
The many recent bilateral and joint reviews of multilateral organisations that co-exist alongside more comprehensive evaluations of multilateral organisations suggest that multilateral system funders are in search of suitable methods of comparing the effectiveness or efficiency of multilateral organisations in order to influence their multilateral spending decisions. At the same time, funders realise that it is particularly difficult to compare norms-based or standard-setting agencies that do not implement country programmes or for which results are less easily measured. The next chapter provides more detail on recent reviews of multilateral agencies.
Voluntary core contributions Assessed core contributions as a function of membership
EDF IAEAGlobal Fund EC-BudgetGAVI AsDBMontreal Protocol Fund AfDBIDA IBRDAfDF IMFAsDF FAOIDB Special Funds ICAOIFAD ILOIMF-PRGT ITUUNAIDS UNDPKOUNCTAD UNESCOUNDP UNIDOUNFPA UN SecretariatUNEP** UPUUN-HABITAT* WHO*UNHCR** WIPOUNICEF WMOUNRWA**UN-WOMENWFPWHO*
*Both assessed and voluntary**Small annual subsidy from regular budget of the UN used for administration

21
Non-DAC multilateral aid
Twenty-one countries that are not members of the DAC reported their 2010 aid flows to the DAC. The eleven non-DAC EU members allocated 69% of their total ODA to multilaterals (25% excluding multilateral aid to EU institutions), while the average multilateral share of non-DAC donor states was 22%. In 2010, Saudi Arabia reported 17% (USD 609 million) of its total aid as multilateral and the UAE 7% (USD 32 million). The Russian Federation, the latest country to report its aid provision to the DAC, allotted 36% (USD 170 million) of its total aid to multilateral organisations. Table 1.3 sets out the total DAC and multilateral share of non-DAC donors that report to the OECD.
Table 1.3 Non-DAC gross ODA disbursements, 2010*** (excluding debt relief)
* Footnote by the European Union Member States of the OECD and the European Commission: “The Republic of Cyprus is recognised by all members of the United Nations with the exception of Turkey. The information in this document relates to the area under the effective control of the Government of the Republic of Cyprus.” Footnote by Turkey: “The information in this document under the heading ‘Cyprus’ relates to the southern part of the island. There is no single authority representing both Turkish and Greek Cypriot people on the island. Turkey recognises the Turkish Republic of Northern Cyprus (TRNC). Until a lasting and equitable solution is found within the context of the United Nations, Turkey shall preserve its position concerning the ‘Cyprus’ issue.” ** The statistical data for Israel are supplied by and under the responsibility of the relevant Israeli authorities. The use of such data by the OECD is without prejudice to the status of the Golan Heights, East Jerusalem and Israeli settlements in the West Bank under the terms of international law. *** The European Union (EU) has provided the following clarification: “The EU is unique among DAC members in that it plays a dual role in development assistance. Although the EU is a full DAC member and a donor of ODA in its own right, with its own development policy and own resources, it is often presented as a multilateral in DAC publications for statistical purposes. This report reflects this dichotomy.”
Source: OECD (2012b), DAC Aggregate Statistics, OECD, Paris.
Non-DAC donorTotal ODA,
excl. debt relief(in USD m)
Multilateral ODA
(in USD m)
Multilateral ODA as share of gross
ODA (%)
Multilateral ODA as share of gross
ODA, excl. contributions to EU
institutions (%)
Cyprus* 51 21 41 19 Czech Republic 228 148 65 32 Estonia 19 14 74 36 Hungary 114 86 75 40 Latvia 16 14 90 90 Lithuania 37 20 55 5 Malta 14 5 39 39 Poland 384 282 73 11 Romania 114 88 77 11 Slovak Republic 74 54 73 16 Slovenia 59 36 62 26 EU 11 total 1 108 768 69 25 Chinese Taipei 381 55 14 Iceland 29 8 28 Israel** 145 17 12 Liechtenstein 27 5 18 Russia 472 170 36 Thailand 45 14 31 Turkey 967 47 5 Non-DAC (excl. Kuwait, Saudi, UAE) 4 378 1 357 31 Kuwait (KFAED) 617 - - Saudi Arabia 3 494 609 17 UAE 571 32 6 Total 9 060 1 999 22

22
Neither Brazil, India, South Africa, nor China reported their development assistance to the DAC in 2010. The 2011 DAC Report on Multilateral Aid (OECD, 2011a) highlighted Brazil’s use of multilateral agencies for supplying aid to neighbouring countries and circumventing laws against the provision of bilateral aid. In contrast, India and China have large bilateral programmes and very probably channel a share of aid through multilateral organisations that is well below the DAC average of 28%.
Any increase in the multilateral contributions of emerging donors is inextricably linked to governance and voice reform, at least as far as contributions to international financial institutions goes. In the absence of data from some of the emerging donors, it is difficult to ascertain whether the strong political support that they lend to the United Nations translates into large financial commitments. Box 1.2 shows, at a glance, which multilateral organisations received funding from China in 2010 and how much.
Box 1.2. Chinese contributions to international organisations in 2010 (disbursements in constant 2010 prices)
Organisation Core funding (USD million)
AsDB 277.4 AsDF 6.4 AfDF 34.2 FAO 13.2 IDA 4.7 WHO* 12.4 UNDP 3.6 WFP 3.1 Global Fund 2.0 UNICEF 1.2 UN-PBF 1.0 UNRWA 0.1
* Note: Assessed WHO contributions have an ODA coefficient of 76%. Source: AfDB (2010, 2011), ADB (2010, 2011a, 2011b), FAO (2012), Global Fund (2011), IFAD (2011), IDA (2011), PRC (2011), UNDP (2011, 2012), WFP (2012a, 2012b), WHO (2011).
China has extended aid outside its borders since 1950 in the form of grants, interest-free loans and concessional loans. The Ministry of Commerce (MOFCOM) manages outgoing bilateral aid and contributions to major United Nations institutions (such as the UN Development Programme [UNDP] and Children’s Fund [UNICEF]), the Ministry of Finance co-ordinates China’s multilateral contributions to the World Bank and the Asian Development Bank (AsDB), and the People’s Bank of China oversees contributions to the regional development banks (with the exception of the AsDB). In April 2011, China issued its first white paper on aid, “China's Foreign Aid" (PRC, 2011). According to the white paper, China had supplied aid to 161 countries and to more than 30 international and regional organisations by the end of 2009. It describes China's foreign aid as "South-South co-operation" and "mutual help between developing countries”.
The amounts in the table are based on information published in the main multilateral agencies' financial statements and annual reports for 2010. China contributes predominantly core resources to the multilateral system. After becoming a donor to the 15th replenishment round of the International Development Association (IDA15) in 2007, it pledged USD 160.8 million to the 16th round in 2010. China also provided USD 22 million to the 8th replenishment of the International Fund for Agricultural Development (IFAD) in 2009 and contributes some non-core, or earmarked, funding to multilateral agencies. As a new donor to FAO in 2009, it released USD 10 million for the China Trust Fund for South-South co-operation over three successive years. This fund is used to provide developing countries – predominantly in Africa – with technical assistance, training, agricultural inputs, and small equipment from China. Further non-core funding went to UNDP (USD 3.7 million), the Food and Agriculture Organisation (FAO) multi-donor trust funds (USD 200 000), the Asian Development Bank's Technical Assistance Special Fund (USD 1.6m), World Food Programme (WFP) assistance to Haiti and Niger (USD 1 million), and the International Committee for the Red Cross (ICRC) which received USD 565 838.

23
Notes
1 At the time of writing this report, only aggregate DAC data were available (including multilateral aid) for
2011. Disaggregated data (which include non-core contributions) will be available in early 2013.
2 Disregarding years of exceptional debt relief.
3 Country Programmable Aid (CPA) is a sub-set of aid that measures actual transfers to partner countries. CPA is critical for delivering international aid commitments in support of the MDGs, but also represents the proportion of aid that is subject to country allocation decisions by the donor. For more information on CPA see Annex B and www.oecd.org/dac/cpa.
4 Based on outturns from 24 different multilateral agencies.
5 The European Union (EU) has provided the following clarification: “The EU is unique among DAC members in that it plays a dual role in development assistance. Although the EU is a full DAC member and a donor of ODA in its own right, with its own development policy and own resources, it is often presented as a multilateral in DAC publications for statistical purposes. This report reflects this dichotomy.”
6 Ibid.
7 Ibid.
8 Ibid.
9 Of the nine providing estimates through 2015, four predicted a real decrease of 11% and five a real increase of 16%.
10 The European Union (EU) has provided the following clarification: “The EU is unique among DAC members in that it plays a dual role in development assistance. Although the EU is a full DAC member and a donor of ODA in its own right, with its own development policy and own resources, it is often presented as a multilateral in DAC publications for statistical purposes. This report reflects this dichotomy.”
24
References
African Development Bank (2010), Annual Report 2009, Chapter 6, http://www.afdb.org/fileadmin/uploads/afdb/Documents/Financial-Information/ADB.pdf
African Development Bank (2011), Financial Statements and Report of the Independent Auditor, May 2010, Chapter 6, http://www.afdb.org/fileadmin/uploads/afdb/Documents/Financial-Information/AfDB_Eng%202011.pdf
Asian Development Bank (2011a), Annual Report 2010, Volume 2: Financial Report, http://www.adb.org/sites/default/files/adb-ar2010-v2.pdf
Asian Development Bank (2011b), Annual Report 2010, Jakarta, http://www.afdb.org/fileadmin/uploads/afdb/Documents/Financial-Information/ADB.pdf
Asian Development Bank (2010), Annual Report 2009, Volume 2 – Financial Report, Jakarta, http://www.adb.org/sites/default/files/adb-ar2009-v2.pdf
Food and Agricultural Organisation (2012), Information from Resource Mobilization and Operations Support Service, June 2012
Global Fund (2011), Annual Report 2010, May 2011, http://www.theglobalfund.org/documents/publications/annual_reports/Corporate_2010Annual_Report_en/
IFAD (2011), Annual Report 2010, Rome, 2011, http://www.ifad.org/pub/ar/2010/e/11.pdf
International Development Association (2011), Financial Statements and Internal Control Reports, Washington DC, June 2011, http://siteresources.worldbank.org/EXTANNREP2011/Resources/8070616-1315496634380/8136490-1315496813876/IDAFinancialStatementsandInternalControlReports.pdf
OECD (2 012a), 2012-2015 Survey on Donors’ Forward Spending Plans, OECD, Paris, www.oecd.org/development/aideffectiveness/50056866.pdf
OECD (2012b), DAC Aggregate Statistics, OECD, Paris
OECD (2012c), Creditor Reporting System Database, OECD, Paris
OECD (2011), DAC Report on Multilateral Aid, OECD, Paris
OECD (2010), Reporting Directives for the Creditor Reporting System, OECD, Paris
OECD (2007), Reporting Directives for the Creditor Reporting System, Paragraph 9, OECD, Paris, http://www.oecd.org/development/stats/1948102.pdf
OECD, DAC Glossary of Key Terms and Concepts, www.oecd.org/dac/glossary
The People’s Republic of China (2011), Information Office of the State Council, China’s Foreign Aid, Beijing, April 2011

25
UN (United Nations) (2012), “Analysis of funding of operational activities for development of the United Nations system for the year 2010”, Report of the Secretary-General, Development Cooperation Policy Branch, Office for ECOSOC Support and Coordination Department of Economic and Social Affairs United Nations, May
UNDP (2011), People-Centred Development, UNDP in Action – Annual Report 2010/2011, New York, 2011, http://web.undp.org/annualreport2011/downloads/undp_AR_2010-2011_ENGLISH.pdf
UNDP (2012), Multi-Partner Trustfund Office Gateway (website), Contributor / Partner Factsheet, http://mptf.undp.org/factsheet/donor/00089?bar_metric=deposit
UNICEF (2011), Annual Report 2010, New York, http://www.unicef.org/lac/UNICEF_Annual_Report_2010_EN_052711.pdf
World Food Programme (2012a), website: Contributions to WFP 2010, http://www.wfp.org/about/donors/year/2010, and Donor Profiles: China, at http://www.wfp.org/about/donors/china?year=2010
World Food Programme (2012b), Contributions to WFP: Comparative Figures, as of 19 Jun 2012 http://documents.wfp.org/stellent/groups/public/documents/research/wfp216777.pdf
World Health Organisation (2011), Assessed Contribution Status Report, as at 31 December 2010, http://www.who.int/about/resources_planning/AC_Status.pdf

26

27
CHAPTER 2. FRAGMENTATION OF AID EFFORTS
This Chapter analyses the fragmentation of multilateral and bilateral outflows to partner countries. It finds that non-core (or earmarked) aid to multilateral organisations contributes to fragmentation and further complexity on the ground. Although this finding is based on a purely quantitative measure of fragmentation and does not question the motivation behind such non-core funding nor whether fragmentation actually causes problems on the ground, it is safe to conclude that the motivation and rationale behind both multilateral core and non-core funding should be given close consideration. Further work on the ground could help answer some of the open questions.

28
As Chapter 1 argued, the role of the multilateral system is considerably more important than the volume of multilateral official development assistance (ODA) alone would suggest. Multi-bi (or non-core) funding for multilateral organisations is becoming increasingly significant. In response to the commitment made by partners in Paragraph 25(b) of the Busan Partnership for Effective Development Co-operation to “make effective use of existing multilateral channels”, it is useful to examine just how fragmented aid implemented by multilateral organisations at the country level is – and what role non-core aid plays in that regard. This chapter considers how non-core multilateral aid affects fragmentation and reviews fragmentation in partner countries by region and income group.
Its analysis of concentration and fragmentation is, however, purely quantitative. It considers only financial relations between the 24 DAC donors, 26 multilateral agencies (shown in Table 1.2) and partner countries – not the political or qualitative aspects of these relations. This report fully recognises that the volume of ODA cannot alone determine whether an aid relationship is significant. Nevertheless, quantitative analysis is a necessary component of any comprehensive desk study and draws on the only comparable evidence available in examining relations between donor and ODA-eligible countries at the global level.
Fragmentation of multilateral and bilateral outflows
This section analyses the fragmentation of multilateral and bilateral outflows in partner countries and reviews it in partner countries by region and income group. Box 2.1 briefly describes how aid is measured and on what basis it is considered fragmented or concentrated.
Box 2.1. Measuring aid fragmentation and concentration of aid
The analysis is based on Country Programmable Aid (CPA) plus humanitarian aid and developmental food aid. An expanded concept hereafter referred to as CPA+, it reflects outflows of both multilateral and bilateral agencies to partner countries. Applied to multilateral agencies, CPA+ represents the outflows of their core-funded expenditure on operational activities.
Highlighting patterns of aid fragmentation and concentration requires close examination of how multilateral and bilateral agencies operate and the financial weight they carry at country level. A “significant” aid relationship is determined in one of two ways:
1. by comparing the volume of aid to a partner country to those of other donors in the same partner country,
2. by comparing the donor’s share of aid to a partner country relative to the same donor’s overall share of global aid.
A donor’s concentration ratio is determined by the number of “significant” as opposed to “non-significant” aid relationships it maintains.
For more information on the methodology, see the 2011 OECD Report on Division of Labour at www.oecd.org/development/effectiveness/aidfragmentation.html. For the same analysis based on CPA alone, see Annex B.
Source: OECD DAC secretariat.
The measures described in Box 2.1 are used in Annex D of this report to illustrate fragmentation of CPA+ (Country Programmable Aid [CPA] plus humanitarian aid plus developmental food aid) supplied by bilateral and multilateral donors. The matrices highlight donors’ significant aid relations in partner countries, and show that two out every five donor-partner country relationships are not financially significant. Although fragmentation stems mostly from bilateral sources (OECD, 2011a), multilateral agencies together represent over one-third of resource outflows at the global level. Consequently, they, too, are beginning to contribute to the global fragmentation picture.
29
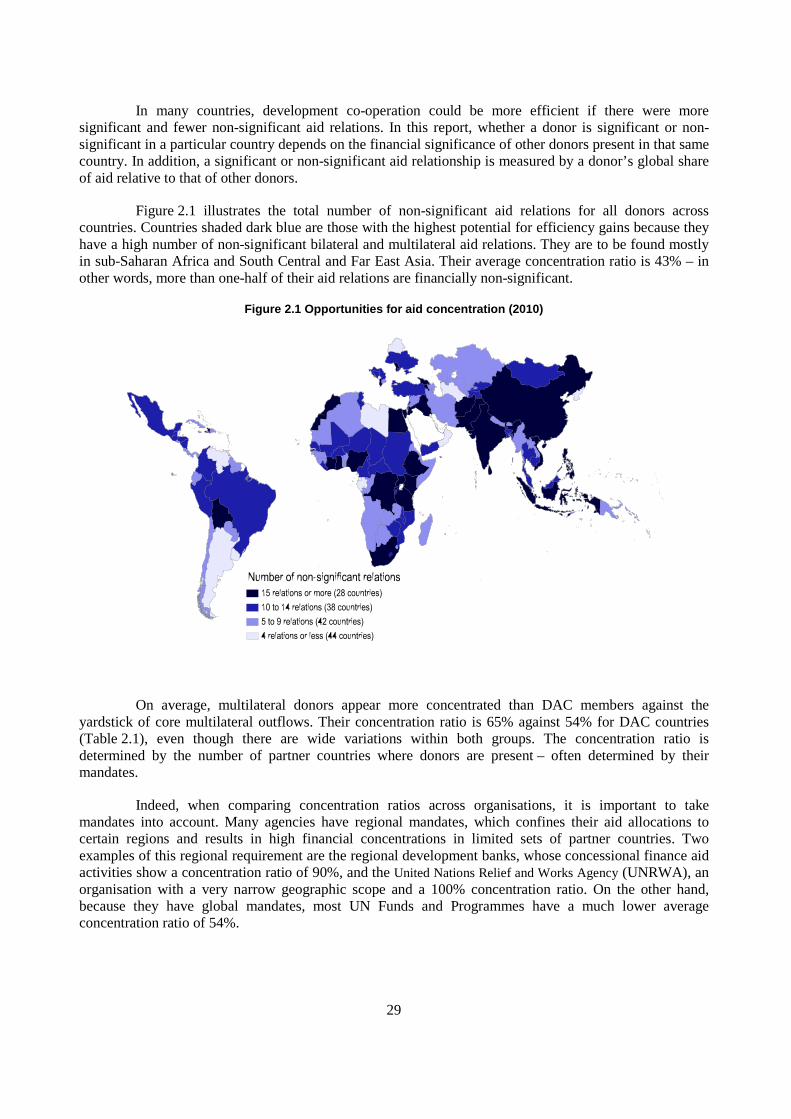
In many countries, development co-operation could be more efficient if there were more significant and fewer non-significant aid relations. In this report, whether a donor is significant or non-significant in a particular country depends on the financial significance of other donors present in that same country. In addition, a significant or non-significant aid relationship is measured by a donor’s global share of aid relative to that of other donors.
Figure 2.1 illustrates the total number of non-significant aid relations for all donors across countries. Countries shaded dark blue are those with the highest potential for efficiency gains because they have a high number of non-significant bilateral and multilateral aid relations. They are to be found mostly in sub-Saharan Africa and South Central and Far East Asia. Their average concentration ratio is 43% – in other words, more than one-half of their aid relations are financially non-significant.
Figure 2.1 Opportunities for aid concentration (2010)
On average, multilateral donors appear more concentrated than DAC members against the yardstick of core multilateral outflows. Their concentration ratio is 65% against 54% for DAC countries (Table 2.1), even though there are wide variations within both groups. The concentration ratio is determined by the number of partner countries where donors are present – often determined by their mandates.
Indeed, when comparing concentration ratios across organisations, it is important to take mandates into account. Many agencies have regional mandates, which confines their aid allocations to certain regions and results in high financial concentrations in limited sets of partner countries. Two examples of this regional requirement are the regional development banks, whose concessional finance aid activities show a concentration ratio of 90%, and the United Nations Relief and Works Agency (UNRWA), an organisation with a very narrow geographic scope and a 100% concentration ratio. On the other hand, because they have global mandates, most UN Funds and Programmes have a much lower average concentration ratio of 54%.

30
Geographically speaking, multilateral outflows probably contribute to the higher number of non-significant aid relations – i.e. greater fragmentation – in some countries in sub-Saharan Africa and Asia. In these regions, the average multilateral concentration ratio is 45% – well below multilateral agencies’ average concentration ratio of 65% – with the most fragmented agencies being UN Funds and Programmes.
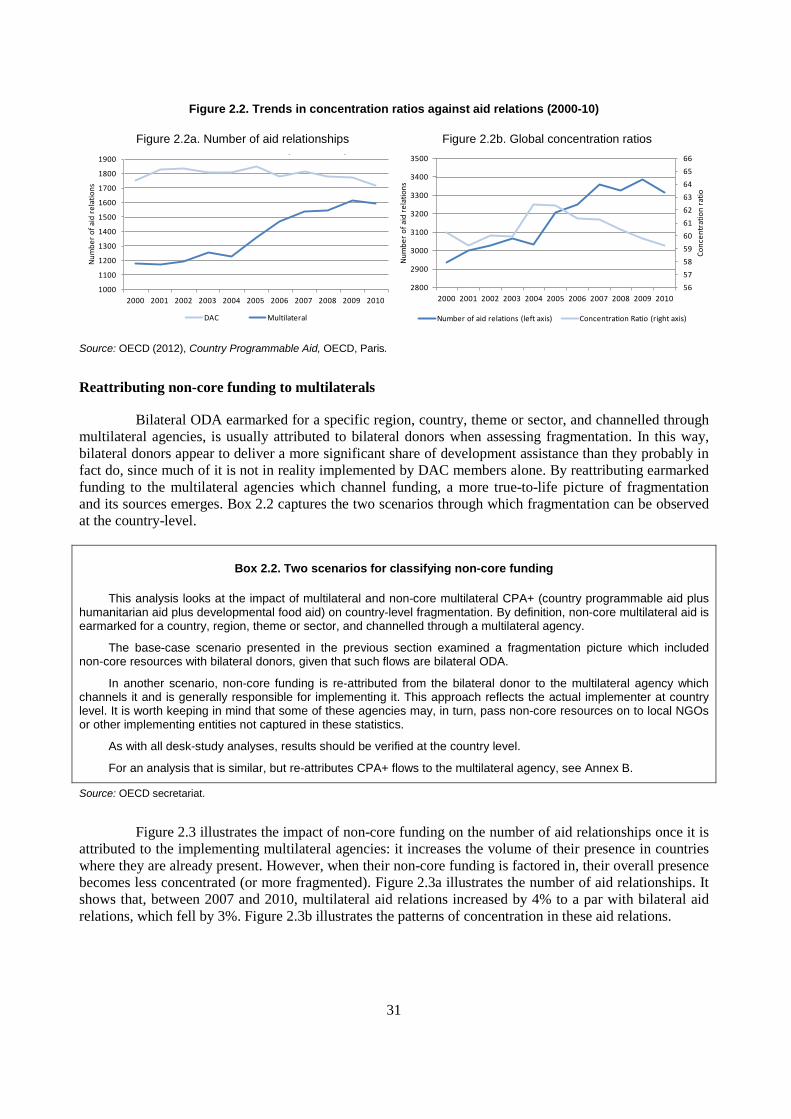
Figure 2.2 illustrates the overriding trend in fragmentation and concentration between 2000 and 2010: the growth in aid relations has plainly increased fragmentation. There was a 50% increase in the number of non-significant aid relationships in low-income countries (LICs) and fragile and conflict-affected states. Over the same time span, significant relations increased by 14%, resulting in a six percentage point drop in the concentration ratio. In sub-Saharan Africa, each country had, on average, four more aid relationships in 2010 than in 2000, and 60% of those new relationships were non-significant.
Table 2.1 Measuring concentrations of multilateral agencies’ country programmable aid (core resources)
*** The European Union (EU) has provided the following clarification: “The EU is unique among DAC members in that it plays a dual role in development assistance. Although the EU is a full DAC member and a donor of ODA in its own right, with its own development policy and own resources, it is often presented as a multilateral in DAC publications for statistical purposes. This report reflects this dichotomy.”
Source: OECD (2012), Country Programmable Aid, OECD, Paris.
CPA+*(USD 2010
million)
Share of Global CPA+*
(in %)
No. of relations
No. of significant relations
Concentration ratio (in %)
Arab Agencies** 1 820 1.9 99 38 38EU institutions*** 9 875 10.3 149 128 86GAVI 590 0.6 67 32 48GEF 359 0.4 87 53 61Global Fund 2 997 3.1 113 73 65IDA 10 074 10.5 78 70 90IMF (Concessional Trust Funds) 1 346 1.4 37 29 78Montreal Protocol 21 0.02 10 7 70Nordic Dev. Fund 52 0.1 18 17 94Regional Development Bank Funds: 4 174 4.3 104 94 90
AfDF 1 515 1.6 38 31 82AsDF 1 927 2.0 27 25 93CarDB 69 0.1 14 14 100IaDB 662 0.7 25 24 96
UN Funds and Programmes: 2 438 2.5 534 288 54UNDP 515 0.5 136 75 55UNFPA 282 0.3 117 75 64UNHCR 187 0.2 86 43 50UNICEF 768 0.8 120 51 43UNRWA 452 0.5 4 4 100WFP 235 0.2 71 40 56
Other UN: 615 0.6 298 201 67IAEA 51 0.05 98 67 68IFAD 462 0.48 79 53 67UNAIDS 51 0.05 103 65 63UN Peacebuilding Fund 51 0.05 18 16 89
Total multilaterals 34 360 35.7 1 594 1 030 65Total multilaterals excl. EU 24 485 25.5 1 445 902 62Total DAC countries 61 764 64.3 1 719 933 54Total DAC members incl. EU 71 639 74.5 1 868 1 061 57
* Note that this analysis also includes humanitarian and food aid, but excludes regional allocations from CPA. ** Arab Agencies are BADEA, Isl. Dev Bank, OFID and Arab Fund (AFESD).
31
Figure 2.2. Trends in concentration ratios against aid relations (2000-10)
Figure 2.2a. Number of aid relationships Figure 2.2b. Global concentration ratios
Source: OECD (2012), Country Programmable Aid, OECD, Paris.
Reattributing non-core funding to multilaterals
Bilateral ODA earmarked for a specific region, country, theme or sector, and channelled through multilateral agencies, is usually attributed to bilateral donors when assessing fragmentation. In this way, bilateral donors appear to deliver a more significant share of development assistance than they probably in fact do, since much of it is not in reality implemented by DAC members alone. By reattributing earmarked funding to the multilateral agencies which channel funding, a more true-to-life picture of fragmentation and its sources emerges. Box 2.2 captures the two scenarios through which fragmentation can be observed at the country-level.
Box 2.2. Two scenarios for classifying non-core funding
This analysis looks at the impact of multilateral and non-core multilateral CPA+ (country programmable aid plus humanitarian aid plus developmental food aid) on country-level fragmentation. By definition, non-core multilateral aid is earmarked for a country, region, theme or sector, and channelled through a multilateral agency.
The base-case scenario presented in the previous section examined a fragmentation picture which included non-core resources with bilateral donors, given that such flows are bilateral ODA.
In another scenario, non-core funding is re-attributed from the bilateral donor to the multilateral agency which channels it and is generally responsible for implementing it. This approach reflects the actual implementer at country level. It is worth keeping in mind that some of these agencies may, in turn, pass non-core resources on to local NGOs or other implementing entities not captured in these statistics.
As with all desk-study analyses, results should be verified at the country level.
For an analysis that is similar, but re-attributes CPA+ flows to the multilateral agency, see Annex B.
Source: OECD secretariat.
Figure 2.3 illustrates the impact of non-core funding on the number of aid relationships once it is attributed to the implementing multilateral agencies: it increases the volume of their presence in countries where they are already present. However, when their non-core funding is factored in, their overall presence becomes less concentrated (or more fragmented). Figure 2.3a illustrates the number of aid relationships. It shows that, between 2007 and 2010, multilateral aid relations increased by 4% to a par with bilateral aid relations, which fell by 3%. Figure 2.3b illustrates the patterns of concentration in these aid relations.
1000
1100
1200
1300
1400
1500
1600
1700
1800
1900
2000 2001 2002 2003 2004 2005 2006 2007 2008 2009 2010
Num
ber
of a
id r
elat
ions
( )
DAC Multilateral
56
57
58
59
60
61
62
63
64
65
66
2800
2900
3000
3100
3200
3300
3400
3500
2000 2001 2002 2003 2004 2005 2006 2007 2008 2009 2010
Conc
entr
atio
n ra
tio
Num
ber
of a
id r
elat
ions
Number of aid relations (left axis) Concentration Ratio (right axis)

32
Figure 2.3. How re-classifying core and non-core funding affects the number and concentration ratios of aid relationships (2007-10)
Figure 2.3a. Number of aid relationships Figure 2.3b. Concentration ratios
Source: OECD (2012), Country Programmable Aid, OECD, Paris.
Table 2.2 shows that, when non-core multilateral aid is reattributed to multilateral agencies, the concentration ratio for multilateral ODA dropped from 65% to 58%, while for bilateral aid it fell from 54% to 53%. Over time, the concentration ratio has fallen across all partner-country income groupings, but is particularly dragged further down by increased fragmentation in LICs. One reason why re-attributing non-core or multi-bi funding reduces multilateral donors’ overall concentration ratio is as follows: reattribution increases their global share of aid and, at the same time, the threshold of resources required to attain significance as measured against the yardstick of the donor’s relative concentration at country level. Despite higher volumes and in contrast to the base-case scenario, multilateral agencies and bilateral donors see their concentration ratios drop as they fall short of the level of resources required to be among the top donors that together provide 90% of all aid to partner countries.
1500
1550
1600
1650
1700
1750
1800
1850
2007 2008 2009 2010
Num
ber
of a
id r
elat
ions
( )
DAC MultilateralDAC countries (excl. non-core) Multilaterals (incl. non-core)
50
52
54
56
58
60
62
64
66
68
70
2007 2008 2009 2010
Conc
entr
atio
n ra
tio
( )
DAC MultilateralDAC countries (excl. non-core) Multilaterals (incl. non-core)

33
Table 2.2. Impact of non-core ODA on fragmentation
***The European Union (EU) has provided the following clarification: “The EU is unique among DAC members in that it plays a dual role in development assistance. Although the EU is a full DAC member and a donor of ODA in its own right, with its own development policy and own resources, it is often presented as a multilateral in DAC publications for statistical purposes. This report reflects this dichotomy.”
Source: OECD (2012), Country Programmable Aid, OECD, Paris.
Interestingly, DAC countries’ average concentration ratio also slipped slightly to 53% after non-core aid was attributed to multilateral agencies. This was primarily due to the fact that bilateral donors provided some aid in many partner countries to which they also channelled multi-bi aid through multilateral agencies. Re-attributing this aid from bilateral to multilateral donors thus means that the bilateral donor is likely to be displaced from the top 90% of donors because of the larger flows emanating from multilateral and non-core funding.
To test whether humanitarian aid earmarked for a specific crisis response is behind the increased fragmentation that occurs when non-core multilateral aid is reattributed from bilateral to multilateral donors, analysis was replicated without humanitarian aid by the DAC secretariat. The findings confirmed that multilateral agencies were more fragmented when non-core contributions were taken into account,
No. of relations
No. of additional relations due to
earmarked funding
Donor's share of Global
CPA+*
Concentration ratio (in %)
Arab Agencies** 99 0 1.9% 37EU institutions*** 149 0 10.4% 86GAVI 67 0 0.6% 48GEF 87 0 0.4% 61Global Fund 113 0 3.1% 65IDA 96 18 12.0% 79IMF (Concessional Trust Funds) 48 11 1.4% 60Montreal Protocol 10 0 0.0% 70Nordic Dev. Fund 18 0 0.1% 94Regional Development Bank Funds: 112 8 4.5% 86
AfDF 40 2 1.6% 80AsDF 33 6 2.1% 79CarDB 14 0 0.1% 100IaDB 25 0 0.7% 96
UN Funds and Programmes: 558 24 8.2% 39UNDP 144 8 2.0% 26UNFPA 119 2 0.4% 60UNHCR 94 8 0.7% 38UNICEF 123 3 1.8% 33UNRWA 4 0 0.6% 100WFP 74 3 2.7% 42
Other UN: 300 2 0.7% 67IAEA 98 0 0.1% 68IFAD 79 0 0.5% 66UNAIDS 105 2 0.1% 62UN Peacebuilding Fund 18 0 0.1% 89
Total multilaterals 1 657 63 43.2% 58Total multilaterals excl. EU 1 508 63 32.9% 56Total DAC countries 1 670 - 49 56.8% 53Total DAC members incl. EU 1 819 - 49 67.1% 56* Note that this analysis also includes humanitarian and food aid, but excludes regional allocations from CPA. ** Arab Agencies are BADEA, Isl. Dev Bank, OFID and Arab Fund (AFESD). *** The EU is a member of the DAC and has its own development policy. It is presented in this report as a multilateral agency since contributions to the EU are considered multilateral ODA.
34
even when humanitarian non-core aid was not included. Without humanitarian aid, the multilateral concentration ratio dropped from 66% to 61% after reattribution (rather than sliding from 65% to 58%, as in Table 2.2), while the bilateral concentration ratio stays the same at 54%. The impact on individual agencies is detailed in Annex B.
More fragmentation – for good reason?
To recapitulate: the fragmentation of bilateral and multilateral aid increases when multi-bi aid is attributed to the multilateral implementer. Even in comparison to a theoretical baseline scenario, where bilateral and multilateral disbursements are examined without the inclusion of multi-bi aid in either category, fragmentation increases. If both bilateral and multilateral donors are relatively worse off when non-core funding is taken into consideration, how can sense be made of the benefits of multi-bi aid? It is important to keep in mind that this reattribution-based measure of fragmentation, as with most quantitative desk studies, does not capture other important factors, such as the motivation behind funding or whether fragmentation is the cause of real co-ordination problems on the ground. Further DAC-led work could examine fragmentation directly at the country level.
Previous reports (e.g. OECD, 2011b) have examined the manifold, context-specific advantages and disadvantages of non-core multilateral aid. In reality, however, non-core aid has many positive effects. In 57% of the multilateral aid relations that evolved from financially significant to non-significant after reattribution, resources actually increased – though not enough to meet the new (higher) benchmarks, or to make it into the top 90% of donors in a given country. There are also some cases where multi-bi funding has made existing non-significant aid relations between a multilateral and a partner country significant. This development is true of 33 aid relations of which 21 are in fragile or conflict-affected states.1 Assuming that managing aid from different sources within one multilateral agency does not add to transaction costs, reattribution analysis demonstrates that multi-bi aid strengthens a multilateral agency’s existing presence.
Re-classifying non-core funding to multilateral organisations creates 50 new, but non-significant, multilateral aid relations. Many of these relations are in countries that otherwise receive non-concessional or blend financing from the multilateral development banks and where non-core disbursements can have an important leveraging effect (e.g. South Africa and China). Other countries are in arrears, and thus non-eligible for additional concessional financing from core resources (e.g. Zimbabwe), or unable to receive core resources due to their non-sovereign status (West Bank and Gaza). Geographically isolated regions like the Pacific Island States (Fiji, Kiribati, Nauru and Vanuatu) would have extremely limited sources of external assistance without earmarked assistance channelled through multilateral organisations. Finally, many such non-significant aid relations also include specific targeted technical assistance programmes that typically operate on the basis of earmarked funding.
In conclusion, analysis finds that multi-bi or bilateral ODA channelled through multilateral agencies contributes to fragmentation, whether or not humanitarian aid is included. In many cases, it may render the delivery of resources more complex on the ground. In others, non-core resources are an important lifeline. Similarly, increasing disbursements where aid relations are “non-significant” may be neither relevant, desirable, or possible. It is therefore impossible to generalise on the value of non-core funding from data alone. What is clear is that the motivation and rationale behind both multilateral ODA and multi-bi funding should be given close consideration. Further work on the ground could enlarge on the reattribution analysis, with future editions of this report examining the results. Such work could include:
• deepening the analysis of fragmentation among different multilateral agencies (see Table 1.2);
• analysing the effect of non-core funding on the institutional dynamics of multilateral organisations, including their corporate strategies and transaction costs;

35
• exploring the effects of institutional fragmentation in partner countries and the conditions under which fragmentation poses a problem to different categories of partner countries.
The UN’s “Delivering as One”2 and the EU’s Joint Programming Initiative3 are both schemes designed to reduce the adverse impact of too many country-level aid channels and reducing the load on partner country governments. Chapter 4 considers these initiatives and concludes with suggestions on emerging principles to reduce proliferation.
Notes
1 Examples include UNDP, UNICEF and the World Food Programme (WFP) in Afghanistan; the UN
Population Fund (UNFPA), UNICEF and WFP in Haiti; IDA in Timor-Leste; the Global Fund in Honduras and Mongolia; and IFAD in Mali.
2 For more on “Delivering As One”, go to www.un.org/en/ga/deliveringasone/.
3 For more on European Union Joint Programming Initiatives, see http://ec.europa.eu/research/era/joint-programming_en.html.
References
OECD (2012), Country Programmable Aid, OECD, Paris
OECD (2011a), OECD Report on Division of Labour: Addressing cross-country fragmentation of aid, background material for the Fourth High Level Forum on Aid Effectiveness, www.oecd.org/development/effectiveness/aidfragmentation.html
OECD (2011b), DAC Report on Multilateral Aid, OECD, Paris

36

37
CHAPTER 3. ASSESSMENTS OF MULTILATERAL ORGANISATIONS
The proliferation of bilateral assessments reflects today’s increased scrutiny of public financial resources and heightened demand for directing scarce aid towards the most effective multilateral channels. This chapter looks at the bilateral and joint assessments of multilateral organisations that DAC members have undertaken in the past year. Even though some of these assessments play a role in domestic policy insofar as they make the case for multilateralism vis-à-vis taxpayers, this chapter finds that different reviews and assessments strongly converge in the criteria they adopt. It therefore suggests that there is great potential for more joint approaches and assessments. Such approaches would enable assessments to carry more weight and incite greater reform. In going forward, mutual and international accountability would also require evidence from clients or “end-users” of the multilateral system.
38
There have been a number of major bilateral and joint assessments of multilateral organisations in the past year: Australian Multilateral Assessment (AusAID, 2012); Denmark’s engagement in multilateral development and humanitarian organisations 2012; Sweden’s assessments of multilateral organisations; the Netherlands’ scorecards of multilateral organisations in 2011; the United Kingdom’s Multilateral Aid Review (DFID, 2011); and, finally, assessments by the annual Multilateral Organisation Performance Assessment Network (MOPAN, 2012). Some of these reviews are more comprehensive than others and/or serve different purposes, as will be discussed below. These efforts come in addition to the regular assessment by the evaluation groups and departments of multilateral organisations themselves.
While assessment methodologies vary, the three areas that they generally consider are organisational effectiveness, development results, and how well an organisation matches donor preferences. (The 2011 DAC Report on Multilateral Aid terms the donor-organisation match the “principal-agent model”). This chapter reports on DAC members’ approaches to assessing the multilateral development system, suggests points of methodological convergence, and takes a special look at the Australian Multilateral Assessment (AusAID, 2012). Also addressed is how results from assessments could and should be used in future policy making.
Types of assessments
The assessments of multilateral organisations discussed in this chapter are not necessarily formal evaluations undertaken by aid agencies and ministries.1 Rather, they have involved officials from across a wide range of departments within bilateral governments. While few can claim to be rigorous evaluations of multilateral organisations’ performance, they do nonetheless afford a diversified base of facts, perceptions and experience that may guide donors’ multilateral investment decisions. These assessments were based on already existing information, interviews with stakeholders, document reviews and focus groups, and on new and proven analytical tools. As such, they offer a body of evidence upon which government policies can draw.
The bilateral and joint assessments of multilateral organisations that DAC members have undertaken in the past year can be classified into three categories:
• comprehensive assessments of some or all the major multilateral agencies to which the DAC member contributes and based in part on own methodologies – e.g. Australia, the Netherlands, Sweden, and the United Kingdom, together with MOPAN;
• annual information updates, as practiced by Norway;
• analyses of multilateral engagement by the Danish government.
Although comprehensive assessments are the primary focus of this chapter, the Norwegian and Danish practices are examples of the kind of evaluation of engagement with multilateral organisations that many DAC donors regularly undertake.
Norway’s updated information sheets on specific multilateral agencies draw on information from embassy officials in partner countries, multilateral agency headquarters, and existing documentation published by agencies and other actors. They contain each organisation’s history, mandate, financial information (including Norway’s contributions), results achieved in the past year, and organisational effectiveness and financial accountability.
Denmark’s strategy for engagement aims to reinforce the multilateral system and ensure it supplies multilateral assistance primarily as core or non-earmarked contributions where organisations’ core mandates align with Danish development policy priorities. These priorities include a co-ordinated, coherent multilateral system to address the challenge of conflict-affected and fragile states; a holistic approach to security, humanitarian needs and development; and transition to a green economy through

39
channels such as the formulation of sustainable development goals. Its engagement strategy encourages continued monitoring of organisations’ contributions to development results.
Some DAC members (such as France, Germany and Spain) stated that they were currently reviewing their multilateral aid policies or developing strategies. Others, like Switzerland and Ireland, said they were using existing reviews, particularly those of MOPAN, to inform their decision making and did not therefore find it necessary to undertake assessments of their own. Canada conducted a comprehensive review of the different multilateral organisations to which it contributes, while an outsourced report aimed at improving the Government of Japan’s assessments of multilateral organizations was published in 2010.The next section addresses comprehensive assessments of multilateral organisations.
Comprehensive assessments of multilateral organisations
This section analyses what the existing comprehensive assessments have in common. Australia, the Netherlands, Sweden, and the United Kingdom2 have all conducted assessments built in part on their own methodologies. As for MOPAN, it, too, has its own methodology, known as the “Common Approach”, which it adopted since 2009. In 2011, it used the Common Approach to evaluate five multilateral agencies in 2011 – the Inter-American Development Bank (IADB), the Food and Agriculture Organisation (FAO), the United Nations Environment Programme (UNEP,) United Nations High Commissioner for Refugees (UNHCR), and the United Nations Relief and Works Agency (UNRWA). It assessed a further six in 2012 – the World Bank, the African Development Bank (AfDB), the UNDP, UNICEF, Joint United Nations Programme on HIV/AIDS (UNAIDS), and Global Alliance for Vaccines and Immunisation (GAVI).
Close examination reveals considerable overlap between the Australian, Dutch, Swedish, British, and MOPAN assessments. Table 3.1 shows the criteria and benchmarks against which the four donors and MOPAN evaluated multilateral agencies. They share core commonalities even though their priorities within the multilateral system differ.

40
Table 3.1. Commonalities between five multilateral assessments
Source: DAC secretariat.
Points of convergence
First among the shared assessment criteria is an organisation’s strategic management and its capacity to manage for results – i.e. to incorporate results-based management in planning, managing, and developing programmes that deliver the best results. Almost all assessments take the Millennium Development Goals (MDGs) and poverty reduction objectives as benchmarks of success and all consider whether human resource policies are designed for optimal organisational and operational effectiveness. Measuring an organisation’s impact through an evaluation function, assessing its financial accountability and how closely it meets its mandate and international commitments are also common to all assessments. Finally, all five appraise the partnership behaviour of multilateral agencies. “Partnership behaviour” denotes an agency’s contribution to policy dialogue with its various partners, its ability to co-ordinate and
Australia Netherlands Sweden United Kingdom MOPAN
Effective leadership x x xGoverning body effective in guiding management x x xInnovative approaches xLikelihood of change x xLesson learning x xManaging for results x x x x xStrategic management x x x x xTransparency and accountability x x xCorruption x xCost / value consciousness x xDelegated decision-making xEffective HR x x x x xEvaluation function for delivery and external results x x x x xEvidence-based programming xFinancial accountability x x x x xTransparent information sharing x xOperates within mandate, international commitments x x x x xOrganisational performance x xPromotes transparency in partners xAlign and contribute to national country priorities / systems x x xPartnership behaviour x x x x xParticipatory approach with partners, marginalised groups x xProgress towards results x xRelevant to major stakeholders xResults at country level x x x xTransparency, predictability of allocations x x xEnvironment / Climate Change / Sustainability x x x xEconomic growth x xFills a policy gap xFragility x x xGender x x x xGood governance x x xFocus on poor countries xFood security xHuman rights xHumanitarian x xMDGs x x xPeople with disabilities xPoverty reduction x xSecurity / legal x xSocial development xSexual and reproductive health xWater x
Mac
ro-le
vel
Coun
try-le
vel
Ope
ratio
nal
Rele
vanc
e to
don
ors'
na
tiona
l aid
obj
ectiv
es
41
harmonise approaches with other programming partners, and how it seeks to improve the wider international aid architecture.
Most of the assessments also examined organisations’ leadership, the effectiveness of its governing body, and how easily it aligns with and contributes to countries’ priorities and systems. The results agencies achieved at the country level, the transparency and predictability of their allocations, and the relevance of their action to the MDGs were also shared considerations. Some criteria in the table refer specifically to donors’ own national aid objectives, which encompass a wide range of thematic and geographic preferences.
The convergence in all five assessments is significant, especially when the elements unique to each donor’s national aid objectives are discounted. Of course, joint evaluations tend to look at a larger number of components and cross-cutting themes, partners, and modalities in order to reflect the different donors’ priorities, which can increase the methodological challenges. Joint evaluations may also be associated with high transaction costs for donors. However, if the alternative is a large number of single-donor evaluations for multilateral organisations and partner countries, cost is less of an argument against joint assessments (Andersen and Broegaard, 2012). There thus appears to be a significant rationale for undertaking joint assessments such as MOPAN.
Despite significant convergence, some of the challenges of comprehensive assessments lie in determining the effectiveness of organisations with normative mandates (e.g. human rights, health, sanitary and phyto-sanitary measures, etc.) for which there is no suitable measure of performance on the ground, which is where most comprehensive assessments are concentrated. Another challenge is the question of how to address “path dependence”, whereby an organisation whose mandate may still be relevant suffers from the adverse effects of past political decisions. This may lead to inefficiencies that are difficult to reverse (Isenman, 2012). Adopting an analytical framework may go some way towards adapting the analytical tools to address these and other challenges that arise from assessing development results.
Against the background of the assessment criteria described above, their degrees of convergence, and the challenges they may raise, the following sections explore the Dutch, Swedish, Australian, and MOPAN assessments in further detail.
The Netherlands’ scorecards
The Netherlands use scorecards in their assessments of multilateral organisations. They start from the premise that multilateral aid is a government priority for complementing its bilateral co-operation, but needs to be justified and better co-ordinated. The 2011 assessment looked at agencies’ organisational effectiveness – co-operation with other stakeholders, lesson-learning and evaluation function, transparency, the fight against corruption, internal financial control, and focus on the mandate and its implementation. The other chief component of the assessment was how well an organisation’s mandate reflected the geographic and thematic priorities of the Netherlands – food security, water, security and the rule of law, sexual and reproductive health and rights, gender, good governance, sustainability, and international development architecture. Based on reports from embassy officials, multilateral agencies themselves, and MOPAN, assessments evaluate an organisation against the criteria of its effectiveness and mandate, as well as on how likely it is to effect change.
As a consequence of the assessment, IDA, UNDP and UNICEF will remain pillars of the Netherlands’ multilateral aid provision. The country considers other agencies to be critical in delivering its objectives and priorities and will remain an important channel: the International Fund for Agricultural Development (IFAD), the International Finance Corporation (IFC), GAVI, the Global Fund, UNHCR, Office for the Co-ordination of Humanitarian Affairs (OCHA) and the WFP. Equally, the mandates of the United Nations Population Fund (UNFPA) and UNAIDS continue to make them important channels of
42
Dutch aid even if there is still room for improvement in their performance. In contrast, the Netherlands will carefully monitor its contributions to UNIDO, UN-HABITAT, and IaDB and may even reduce them.
Sweden’s organisational assessments
Sweden evaluated four organisations in 2011 (GAVI, IFAD, OCHA, and UNICEF) against three broad criteria. The first criterion was an organisation’s relevance to eight priority themes: human rights, democracy and good governance, gender equality, sustainable use of natural resources and concern for the environment, economic growth, social development and security, conflict management, and humanitarian operations. On that score, Sweden found all four organisations highly relevant in 2011.
The second criterion focused on internal effectiveness examined against the yardsticks of organisational structural factors, results-based management and evaluation, and transparency, auditing and procurement. The third criterion assessed external effectiveness through aid effectiveness principles and actual results based on internal documents, external evaluations, and the impressions of Sweden’s representatives in the field.
The results of the Swedish assessment were:
• UNICEF – high internal and external effectiveness;
• OCHA – good internal effectiveness and high external effectiveness;
• GAVI – very high internal and external effectiveness;
• IFAD – good internal and external effectiveness.
Finally, the fourth criterion assessed the likelihood of change in the overall direction of the multilateral organisation – whether it had changed for better or worse over the past three years.
Australia’s Multilateral Assessment
Australia published the Australian Multilateral Assessment (AMA) on 30 March 2012 after agreeing a methodology in August 2011. The AMA was prompted by the independent review of Australia’s aid programme commissioned in November 2010. The independent review recommended that Australia make greater use of the multilateral system, and that it indicate the rationale for the funding of different multilateral organisations.

43
Figure 3.1. Findings of the Australian Multilateral Assessment
Source: AusAID (Australian Aid) (2012), Australian Multilateral Assessment, Government of Australia, Canberra, www.ausaid.gov.au/Publications/Pages/693_6999_8205_7111_6531.aspx.
The AMA found that 13 of the 42 organisations rated very strongly or strongly across at least six of the seven components; 16 were very strong or strong across at least four of the components; 8 were at least satisfactory on every component; and 5 rated as weak on at least one component. Broadly speaking and with some exceptions, ratings place most development banks and humanitarian organisations in the strong-to-very strong zone, most UN agencies and global funds in the satisfactory-to-strong zone, and a few UN agencies in the weak zone.
The findings of the AMA will feed into the Australian Government’s aid budget process and will be an important element in informing funding decisions related to core funding. Other key factors include existing funding levels; the organisation’s need for additional funding; sectorial, thematic or geographic priorities; and the prospects for reform. The findings of the AMA are also helped inform the development of the Multilateral Engagement Strategy for the Australian aid programme. The Strategy highlights the rationale for Australia’s work with multilateral organisations in the aid programme and the high-level priorities for engaging with multilateral organisations through to 2016.
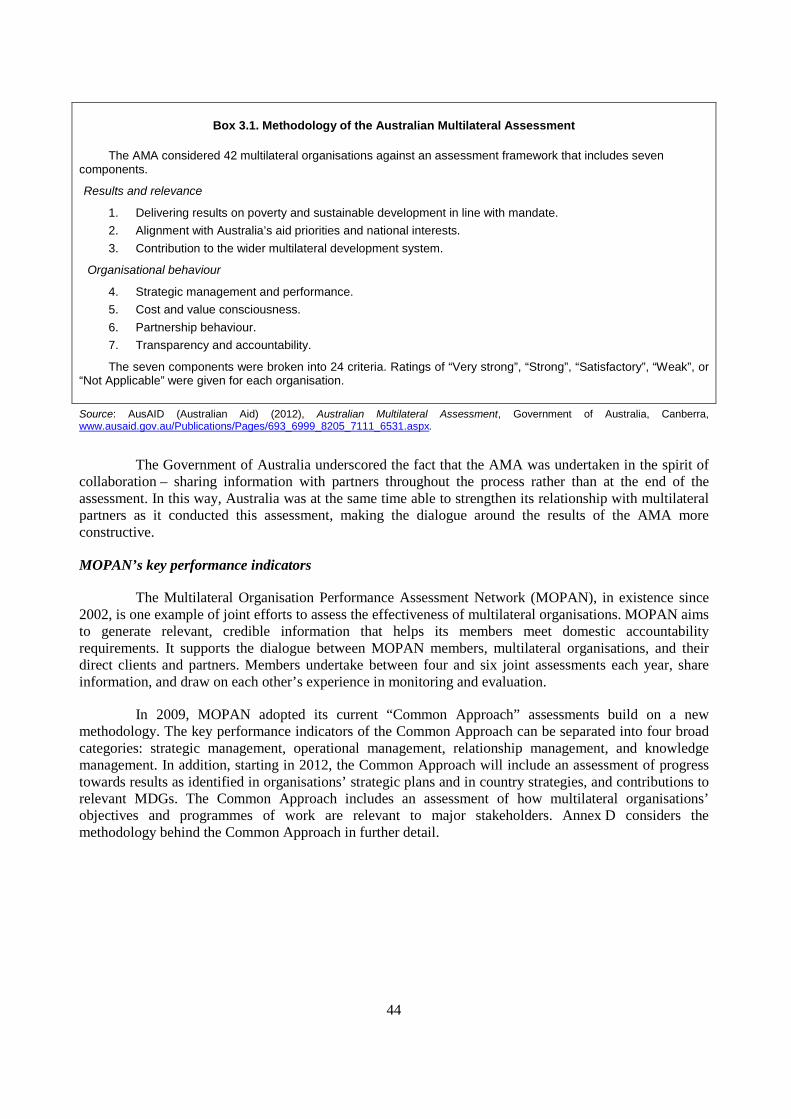
44
Box 3.1. Methodology of the Australian Multilateral Assessment
The AMA considered 42 multilateral organisations against an assessment framework that includes seven components.
Results and relevance
1. Delivering results on poverty and sustainable development in line with mandate. 2. Alignment with Australia’s aid priorities and national interests. 3. Contribution to the wider multilateral development system.
Organisational behaviour
4. Strategic management and performance. 5. Cost and value consciousness. 6. Partnership behaviour. 7. Transparency and accountability.
The seven components were broken into 24 criteria. Ratings of “Very strong”, “Strong”, “Satisfactory”, “Weak”, or “Not Applicable” were given for each organisation.
Source: AusAID (Australian Aid) (2012), Australian Multilateral Assessment, Government of Australia, Canberra, www.ausaid.gov.au/Publications/Pages/693_6999_8205_7111_6531.aspx.
The Government of Australia underscored the fact that the AMA was undertaken in the spirit of collaboration – sharing information with partners throughout the process rather than at the end of the assessment. In this way, Australia was at the same time able to strengthen its relationship with multilateral partners as it conducted this assessment, making the dialogue around the results of the AMA more constructive.
MOPAN’s key performance indicators
The Multilateral Organisation Performance Assessment Network (MOPAN), in existence since 2002, is one example of joint efforts to assess the effectiveness of multilateral organisations. MOPAN aims to generate relevant, credible information that helps its members meet domestic accountability requirements. It supports the dialogue between MOPAN members, multilateral organisations, and their direct clients and partners. Members undertake between four and six joint assessments each year, share information, and draw on each other’s experience in monitoring and evaluation.
In 2009, MOPAN adopted its current “Common Approach” assessments build on a new methodology. The key performance indicators of the Common Approach can be separated into four broad categories: strategic management, operational management, relationship management, and knowledge management. In addition, starting in 2012, the Common Approach will include an assessment of progress towards results as identified in organisations’ strategic plans and in country strategies, and contributions to relevant MDGs. The Common Approach includes an assessment of how multilateral organisations’ objectives and programmes of work are relevant to major stakeholders. Annex D considers the methodology behind the Common Approach in further detail.

45
The Common Approach is informed through responses to survey questions based on the key performance indicators. Respondents to the surveys are donors in headquarters and partner countries, and direct partners or clients at the country-level (partner government, civil society, etc.). In addition, a review of documents, as well as interviews and consultations with multilateral organisations at headquarters and in partner countries, complement the survey results.
DAC Evaluation Network’s development effectiveness reviews
The OECD/DAC Evaluation Network (EVALNET) works with members of the Evaluation Co-operation Group and the United Nations Evaluation Group (which bring together the evaluation departments of multilateral development organisations) to strengthen existing systems in ways that include peer reviews of UN organisations’ assessment functions. New joint reviews were also developed by a group of DAC EVALNET members, led by Canada, to examine the development effectiveness of multilaterals. The group tried out the joint approach on the Asian Development Bank (AsDF) and the World Health Organisation (WHO). The reviews produced independent, evidence-based assessments of the two multilaterals’ development effectiveness and, at its June 2011 meeting, DAC EVALNET endorsed the joint methodology. It was used for development effectiveness reviews of the United Nations Development Programme (UNDP), the World Food Programme (WFP) and, in 2012, the Netherlands-led review of UNICEF. The reviews are co-ordinated with other assessment efforts like those of MOPAN.
Challenges of multiple assessments
By nature, bilateral assessments are anchored in donor priorities, so it is not unusual for different assessments by the same multilateral agency to prioritise different criteria and/or for similar criteria to yield different results. Of course, political motives should not be understated. Donors that have invested substantially in reviews have done so partly to make the case for maintaining or increasing aid budgets in a time of tight fiscal constraints; increased scrutiny of public spending would likely exist even if donors found that existing assessments produced adequate and relevant results. Some donors have suggested that a regularly updated “menu” of indicators of organisations’ multilateral effectiveness would enable them to prioritise and weigh elements according to their own priorities.
Notwithstanding the understandable rationale for multiple assessments, divergent scores for the same multilateral agency may send mixed signals to agencies, especially those which are serious about change and reform. Two broad approaches appear to drive multiple assessments:
1. the “value for money” approach that measures the intrinsic value of an agency by direct return on investment;
2. the approach that sees an organisation’s value in its ability to deliver its mandate.
While these approaches are not mutually exclusive, a donor seeking value for money may be prompted by its government’s domestic accountability over a given public investment to stand firm on increasing or withholding funds. A donor leaning more towards the second approach may advocate a strengthening of the agency in question, perhaps relying more on collective action of donors and the agency to lead reform efforts.
The approach, methodology, presentation of results, and the conclusions drawn from multiple assessments depend to a large extent upon how the donor country views its engagement. As Table 3.2 shows, a donor’s thematic or geographical priorities often determine its preferences and can greatly influence the conclusions it draws from assessments. For example, the United Kingdom’s multilateral aid reviews, examined in the 2011 DAC Report on Multilateral Aid, uses agencies’ focus on poor countries as one of its chief assessment criteria, while Australia looks at multilaterals’ presence in the Asia-Pacific
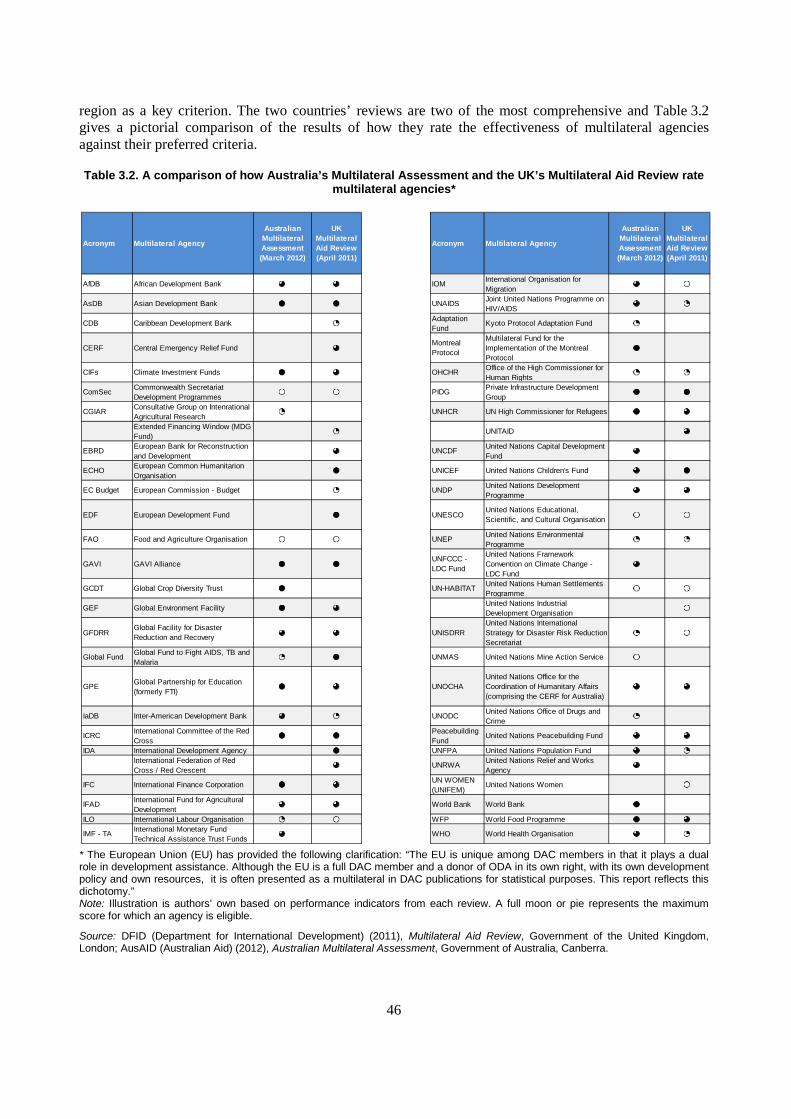
46
region as a key criterion. The two countries’ reviews are two of the most comprehensive and Table 3.2 gives a pictorial comparison of the results of how they rate the effectiveness of multilateral agencies against their preferred criteria.
Table 3.2. A comparison of how Australia’s Multilateral Assessment and the UK’s Multilateral Aid Review rate multilateral agencies*
* The European Union (EU) has provided the following clarification: “The EU is unique among DAC members in that it plays a dual role in development assistance. Although the EU is a full DAC member and a donor of ODA in its own right, with its own development policy and own resources, it is often presented as a multilateral in DAC publications for statistical purposes. This report reflects this dichotomy.” Note: Illustration is authors’ own based on performance indicators from each review. A full moon or pie represents the maximum score for which an agency is eligible.
Source: DFID (Department for International Development) (2011), Multilateral Aid Review, Government of the United Kingdom, London; AusAID (Australian Aid) (2012), Australian Multilateral Assessment, Government of Australia, Canberra.
Acronym Multilateral Agency
Australian Multilateral Assessment (March 2012)
UK Multilateral Aid Review (April 2011)
Acronym Multilateral Agency
Australian Multilateral Assessment (March 2012)
UK Multilateral Aid Review (April 2011)
AfDB African Development Bank IOM International Organisation for Migration
AsDB Asian Development Bank UNAIDS Joint United Nations Programme on HIV/AIDS
CDB Caribbean Development Bank Adaptation Fund
Kyoto Protocol Adaptation Fund
CERF Central Emergency Relief FundMontreal Protocol
Multilateral Fund for the Implementation of the Montreal Protocol
CIFs Climate Investment Funds OHCHR Office of the High Commissioner for Human Rights
ComSec Commonwealth Secretariat Development Programmes
PIDG Private Infrastructure Development Group
CGIAR Consultative Group on Intenrational Agricultural Research
UNHCR UN High Commissioner for Refugees
Extended Financing Window (MDG Fund)
UNITAID
EBRD European Bank for Reconstruction and Development
UNCDF United Nations Capital Development Fund
ECHO European Common Humanitarion Organisation
UNICEF United Nations Children's Fund
EC Budget European Commission - Budget UNDP United Nations Development Programme
EDF European Development Fund UNESCOUnited Nations Educational, Scientific, and Cultural Organisation
FAO Food and Agriculture Organisation UNEP United Nations Environmental Programme
GAVI GAVI AllianceUNFCCC - LDC Fund
United Nations Framework Convention on Climate Change - LDC Fund
GCDT Global Crop Diversity Trust UN-HABITAT United Nations Human Settlements Programme
GEF Global Environment Facility United Nations Industrial Development Organisation
GFDRRGlobal Facility for Disaster Reduction and Recovery UNISDRR
United Nations International Strategy for Disaster Risk Reduction Secretariat
Global Fund Global Fund to Fight AIDS, TB and Malaria
UNMAS United Nations Mine Action Service
GPE Global Partnership for Education (formerly FTI)
UNOCHAUnited Nations Office for the Coordination of Humanitary Affairs (comprising the CERF for Australia)
IaDB Inter-American Development Bank UNODC United Nations Office of Drugs and Crime
ICRC International Committee of the Red Cross
Peacebuilding Fund
United Nations Peacebuilding Fund
IDA International Development Agency UNFPA United Nations Population FundInternational Federation of Red Cross / Red Crescent
UNRWA United Nations Relief and Works Agency
IFC International Finance Corporation UN WOMEN (UNIFEM)
United Nations Women
IFAD International Fund for Agricultural Development
World Bank World Bank
ILO International Labour Organisation WFP World Food Programme
IMF - TA International Monetary Fund Technical Assistance Trust Funds
WHO World Health Organisation

47
How can evidence from assessments be used in policy making?
It is too early to tell whether there will be any discernible shift in aid allocation patterns to multilateral organisations arising from assessments of multilateral organisations. How research ultimately informs policy has been studied extensively by social researchers in the past decades, notably by Weiss (1979). Three models may help explain the different influences at play in decision-making: the problem solving, the interactive and the political models.
The reason for a problem-solving model is that policy-makers will look for information when faced with a decision. This information may already be accessible or require further research to fill the knowledge gap. Figure 3.2 illustrates the logical sequence of progression in the problem-solving model.
Figure 3.2. The problem-solving model used in assessment research
Source: Weiss, C. (1979), “The Many Meanings of Research Utilization”, Public Administration Review, Volume 39, No. 5, pp. 426-431.
In practice, the sequence leads to over-optimistic expectations because its completion relies on the convergence of a number of factors and circumstances that seldom occurs. They are: a set of policy makers with the authority to make policy decisions; clear, unambiguous research findings at an opportune time; and findings that do not contradict powerful political interests. The model is not necessarily ideally suited to illustrating how decisions on multilateral aid allocations are made since such decisions, where they are discretionary,3 already take place regularly. In other words, the need for information is not new. There is, however, arising from the budget constraints faced by the large investors in the multilateral system, a greater need for assurance that money is well-spent.
In this regard, less linear research models – where assessments, reviews and other forms of research are just one element among others (such as experience, political insight, pressure, social technologies and judgment) – may offer a model that more realistically reflects the actual process of aid-allocation decision making within governments. Weiss refers to this as the interactive model of decision-making. The value and importance of bilateral assessments of multilateral organisations, for example, are best seen in this context – as one piece of the puzzle that guides decisions on contributions to multilateral agencies. Tracing the direct effect of evidence to decision-making from start to finish – as the problem-solving model suggests is possible – is not a realistic option when diffuse decision points and politics enter into the equation.
The political model would also suggest that information such as assessments may also help support and/or debunk past levels of contributions to specific multilaterals. The few agencies that rated poorly in the Australian Multilateral Assessment and the United Kingdom’s Multilateral Aid Review are not generally being singled out for the first time. Thus, even if the findings are not surprising for these agencies, making them “official” may spur serious reform that would not otherwise have been politically justified. Whatever the original motivation for assessing multilateral organisations, looking at areas of divergence and convergence may help prompt some complementary and even collective action.
Definition of pending decision
Identification of missing
knowledge
Acquisition of social science
research
Interpretation of research for
decision context Policy choice

48
Conclusions
The proliferation of bilateral assessments reflects today’s increased scrutiny of public financial resources and heightened demand for directing scarce aid towards the most effective multilateral channels. In line with aid effectiveness commitments, mutual and international accountability requires assessments to put a stronger emphasis on the evidence from partner countries or “end-users” of the multilateral system.
While there is certainly a political dimension to assessments and the demand for evidence, this chapter has sought to demonstrate that there is a strong degree of convergence in the criteria adopted by different reviews and assessments. This suggests that there is great potential for joint approaches and assessments.
Collective efforts (such as MOPAN) to assess the effectiveness of multilateral organisations, or (like the DAC EVALNET initiative) their evaluation functions, require collective work to define methodology, frameworks, financing, and other parameters of joint assessments. They therefore have higher initial transaction costs. On the other hand, they also offer a number of significant advantages. Enhancing existing joint assessments – for example, through a shared, regularly updated “menu” of assessment criteria – rather than promoting comprehensive bilateral assessments with new criteria stems the proliferation of assessments, thereby easing the significant administrative burden for development actors, who include partner countries and multilateral agencies themselves. Also, joint approaches can help ensure that an organisation is assessed against collective objectives and that collective efforts, undertaken to make tough decisions within its broader governance setting, incite reform.
The following concluding points could be a basis for further discussion and reflection towards increased donor collaboration on multilateral assessments:
• Continue to work within the DAC membership and with multilateral partners to develop more coherent approaches multilateral effectiveness assessments that build on existing frameworks.
• Place greater emphasis on partner country perspectives in assessing the effectiveness of multilateral organisations’ delivery on the ground, where possible. For organisations without country operations, agree on a framework that can measure its effectiveness.
• Use the results of multilateral assessments systematically as part of funding members’ formal and informal decision-making processes.
Notes
1 For more information, the DAC Evaluation Research Centre (DEReC) is a respository of different
evaluations.
2 The UK completed its Multilateral Aid Review in 2011, as highlighted in the 2011 DAC Report on Multilateral Aid.
3 This includes all voluntary contributions to UN Funds and Programmes (UNICEF, UNDP, WFP, UNFPA, and UNRWA), replenishments of large concessional funds (IDA, EDF, AfDF, AsDF), and to global funds (Global Fund, GEF, and GAVI).
49
References
Andersen, O.W. and E. Broegaard (2012), “The Political Economy of Joint-Donor Evaluations”, Evaluation, Vol. 18, No. 1, pp. 47-59
AusAID (Australian Aid) (2012), Australian Multilateral Assessment, Government of Australia, Canberra, www.ausaid.gov.au/Publications/Pages/693_6999_8205_7111_6531.aspx
DFID (Department for International Development) (2011), Multilateral Aid Review, Government of the United Kingdom, London, www.dfid.gov.uk/Documents/publications1/mar/multilateral_aid_review.pdf
Dutch Scorecards of Multilateral Organisations
Government Offices of Sweden (2012), “Swedish assessment of multilateral organisations”, www.government.se/sb/d/11747/a/122004
Isenman, P. (2012), Learning from Assessments of Overall Effectiveness of Multilateral Organisations, Paper submitted to the Swedish Agency for Development Evaluation (SADEV), Stockholm
Ministry of Foreign Affairs (2012), Denmark’s engagement in multilateral development and humanitarian organisations 2012, Government of Denmark
MOPAN (Multilateral Organisation Performance Assessment Network), (2012), Assessments of organisational effectiveness, www.mopanonline.org/publications
OECD (2011), 2011 DAC Report on Multilateral Aid, OECD, Paris
Weiss, C. (1979), “The Many Meanings of Research Utilization”, Public Administration Review, Volume 39, No. 5, pp. 426-431

50
51
CHAPTER 4. TOWARDS GUIDING PRINCIPLES FOR MULTILATERAL AID
Governments jointly govern and fund multilateral organisations and therefore have a responsibility to ensure their effectiveness for the benefit of developing countries. Building on a decade of efforts by many actors, at the Fourth High Level Forum (HLF4) in Busan in 2011 the international community agreed on collective action to make the multilateral system more effective. This Chapter reviews the key initiatives within the conceptual framework for multilateral effectiveness: funding and governance of multilateral organisations, effective delivery of multilateral aid and country-level harmonisation and alignment. It concludes by putting forward “emerging guiding principles to reduce multilateral proliferation” as part of the DAC’s efforts to help meet the commitment made in Paragraph 25(b) of the Busan Partnership for Effective Development Co-operation.
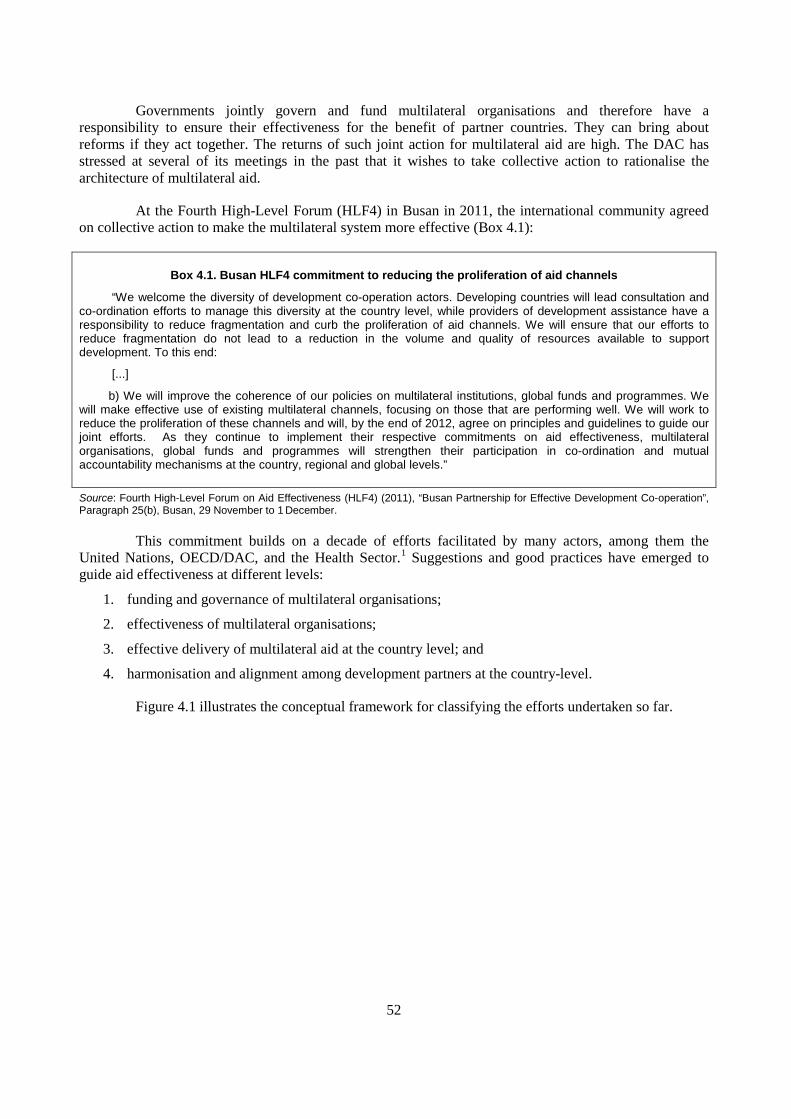
52
Governments jointly govern and fund multilateral organisations and therefore have a responsibility to ensure their effectiveness for the benefit of partner countries. They can bring about reforms if they act together. The returns of such joint action for multilateral aid are high. The DAC has stressed at several of its meetings in the past that it wishes to take collective action to rationalise the architecture of multilateral aid.
At the Fourth High-Level Forum (HLF4) in Busan in 2011, the international community agreed on collective action to make the multilateral system more effective (Box 4.1):
Box 4.1. Busan HLF4 commitment to reducing the proliferation of aid channels
“We welcome the diversity of development co-operation actors. Developing countries will lead consultation and co-ordination efforts to manage this diversity at the country level, while providers of development assistance have a responsibility to reduce fragmentation and curb the proliferation of aid channels. We will ensure that our efforts to reduce fragmentation do not lead to a reduction in the volume and quality of resources available to support development. To this end:
[...]
b) We will improve the coherence of our policies on multilateral institutions, global funds and programmes. We will make effective use of existing multilateral channels, focusing on those that are performing well. We will work to reduce the proliferation of these channels and will, by the end of 2012, agree on principles and guidelines to guide our joint efforts. As they continue to implement their respective commitments on aid effectiveness, multilateral organisations, global funds and programmes will strengthen their participation in co-ordination and mutual accountability mechanisms at the country, regional and global levels.”
Source: Fourth High-Level Forum on Aid Effectiveness (HLF4) (2011), “Busan Partnership for Effective Development Co-operation”, Paragraph 25(b), Busan, 29 November to 1 December.
This commitment builds on a decade of efforts facilitated by many actors, among them the United Nations, OECD/DAC, and the Health Sector.1 Suggestions and good practices have emerged to guide aid effectiveness at different levels:
1. funding and governance of multilateral organisations;
2. effectiveness of multilateral organisations;
3. effective delivery of multilateral aid at the country level; and
4. harmonisation and alignment among development partners at the country-level.
Figure 4.1 illustrates the conceptual framework for classifying the efforts undertaken so far.
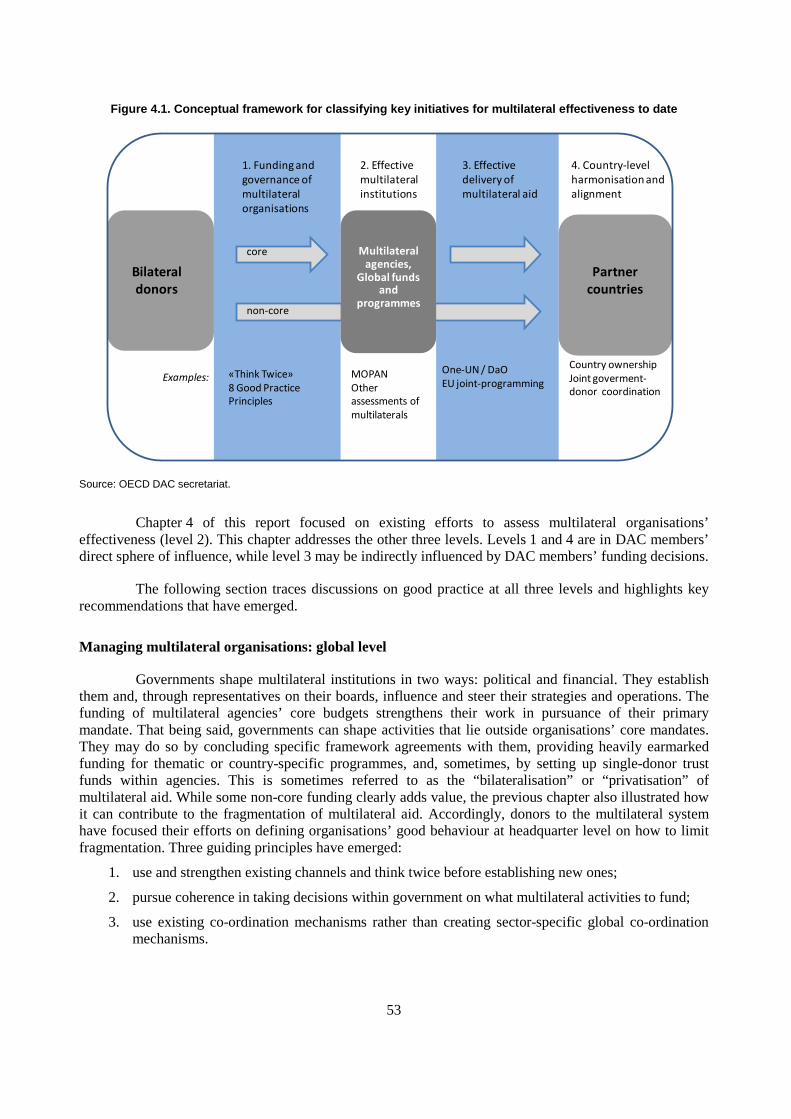
53
Figure 4.1. Conceptual framework for classifying key initiatives for multilateral effectiveness to date
Source: OECD DAC secretariat.
Chapter 4 of this report focused on existing efforts to assess multilateral organisations’ effectiveness (level 2). This chapter addresses the other three levels. Levels 1 and 4 are in DAC members’ direct sphere of influence, while level 3 may be indirectly influenced by DAC members’ funding decisions.
The following section traces discussions on good practice at all three levels and highlights key recommendations that have emerged.
Managing multilateral organisations: global level
Governments shape multilateral institutions in two ways: political and financial. They establish them and, through representatives on their boards, influence and steer their strategies and operations. The funding of multilateral agencies’ core budgets strengthens their work in pursuance of their primary mandate. That being said, governments can shape activities that lie outside organisations’ core mandates. They may do so by concluding specific framework agreements with them, providing heavily earmarked funding for thematic or country-specific programmes, and, sometimes, by setting up single-donor trust funds within agencies. This is sometimes referred to as the “bilateralisation” or “privatisation” of multilateral aid. While some non-core funding clearly adds value, the previous chapter also illustrated how it can contribute to the fragmentation of multilateral aid. Accordingly, donors to the multilateral system have focused their efforts on defining organisations’ good behaviour at headquarter level on how to limit fragmentation. Three guiding principles have emerged:
1. use and strengthen existing channels and think twice before establishing new ones;
2. pursue coherence in taking decisions within government on what multilateral activities to fund;
3. use existing co-ordination mechanisms rather than creating sector-specific global co-ordination mechanisms.
«Think Twice»8 Good Practice Principles
Multilateral agencies,
Global funds and
programmes
Examples:
core
1. Funding and governance ofmultilateral organisations
non-core
Bilateral donors
MOPANOther assessments of multilaterals
2. Effectivemultilateral institutions
3. Effectivedelivery of multilateral aid
4. Country-level harmonisation and alignment
One-UN / DaOEU joint-programming
Country ownershipJoint goverment-donor coordination
Partner countries

54
Use and strengthen existing channels by “thinking twice”
At the Busan HLF4, supporters of the Building Block on Managing Diversity and Reducing Fragmentation2 reconfirmed Paragraph 19c of the Accra Agenda for Action (2008), which urges donors to “think twice” before creating new (separate) aid delivery channels.
“As new global challenges emerge, donors will ensure that existing channels for aid delivery are used and, if necessary, strengthened before creating separate new channels that risk further fragmentation and complicate co-ordination at country level.”3
They called on donors to use evidence to work towards a more coherent, less fragmented multilateral (and bilateral) system for development co-operation. While innovative finance could address funding and aid problems, it should not be channelled through new, single-purpose institutions.
This call was not the first of its kind. In December 2006, at a pre-meeting of the Global Forum on Development Activities, which focused on global programmes in the health sector, the World Bank (2008) tabled a Draft Good Practice Guidance for Integration and Effectiveness of Global Programmes at the Country Level. It went beyond the health sector to make recommendations for global programmes on selectivity, the governance of global programmes, ownership, alignment, harmonisation, and results and accountability. On selectivity, it put forward a checklist and introduced the notion of “thinking twice” presented in Box 4.2.
Box 4.2. The World Bank’s notion of thinking twice for improved selectivity
Think twice. Funders, in consultation with partner countries and other concerned stakeholders, give serious analytic and decision-making attention to the need for another global programme.
• Is there a compelling need for a new collective global or regional action?
• If so, does that global action require earmarked global financing for country programmes?
• If so, can the financing be channelled through an existing institution, or is a new global programme needed?
• If so, is there a clear rationale for the scale of financing proposed?
Source: World Bank (2006), Draft Good Practice Guidance for Integration and Effectiveness of Global Programs at the Country Level – “Work in Progress”, World Bank contribution, Policy Workshop on Global Programmes and the Paris Agenda, Paris, 5 December, www.oecd.org/dataoecd/30/51/37739410.pdf.
Five years later, in June 2011, the OECD’s Task Team on Health as a Tracer Sector (TT HATS) recommended in its final report, Progress and challenges in aid effectiveness – what can we learn from the health sector?, that the principle of thinking twice should be pursued (Box 4.3).
Box 4.3. Think twice: recommendation from OECD’s Task Team on Health as a Tracer Sector
Think twice: Avoid establishing new global funds and programmes that potentially duplicate or compete with existing organisational mandates and programmes, leading to fragmentation. Recognise that global approaches to country problems must be based on a clear analysis of the existing global and national institutional context.
Source : OECD (2011a), Progress and challenges in aid effectiveness – what can we learn from the health sector?, final report of Task Team on Health as a Tracer Sector, Development Assistance Committee (DAC), OECD, Paris, p. 11, June.

55
Despite the call to “think twice” before launching new programmes, the number of separate channels has continued to increase in recent years. Why is the problem getting worse, not better?
One reason is that there are a multitude of – often very legitimate – factors that drive individual donors’ decisions to supply earmarked funding to an increasing number of multilateral programmes or establish new delivery channels. These include the need to respond quickly to pledges; leverage and channel more resources; innovate and take risks; overcome administrative and legal requirements; gain greater political visibility; and, circumvent problems within existing organisations.4 It is therefore important for donors to be clear about the rationale or incentive for a new multilateral programme and determine first whether it can be satisfied through other means.
Using existing channels as the default course of action requires finding or creating incentives, adjusting channels where necessary, and addressing any legal and administrative barriers (e.g. through governing bodies) that may prevent their use. To harness the political appetite for new initiatives and the desire for visibility, it is important that donors innovate within the existing multilateral system, and support reform where needed.
Working towards a more coherent, less fragmented multilateral system also requires multilateral organisations themselves to find innovative ways of using existing structures. This report does not look at the efforts made by executive boards or management structures of multilateral agencies. However, this chapter does mention a number of recent initiatives to consolidate multilateral channels – including those of the World Bank and the UN.
Coherence in government decisions on what multilateral activities to fund
A second set of efforts to define good donor behaviour at headquarter level and reduce fragmentation has focused on decision processes within donor governments. Donors’ individual policies in funding multilateral organisations have remained fragmented and contribute to the incoherence of the system as a whole. The 2011 DAC Report on Multilateral Aid (2011b) found that most DAC member countries have a number of ministries that have the competence to supply multilateral aid. However, they make what often appear to be very separate funding decisions because they lack structured opportunities for joint decision making in their national governments’ budget arbitration and policy bodies. To improve the multilateral system, a more closely co-ordinated approach among ministries will be necessary to reach the common agreements that will enable aid allocations to become strategic investments. The World Bank’s Good Practice Guidance for Integration and Effectiveness of Global Programs at the Country Level (2006) suggests donors pursue coherence in selecting the programmes they fund: “Donor governments establish internal processes in deciding on support for global programs among relevant ministries or agencies.”
The 2011 DAC Report on Multilateral Aid listed eight good-practice lessons for bilateral donors striving for greater coherence within their governments (Box 4.4).

56
Box 4.4. Eight good practice lessons for good multilateral donorship from the DAC
1 Articulate, publicise and regularly revisit your specific national case for multilateral contributions. Stating and publicising the national case for multilateralism is important: the general public, legislators, and civil society should know what they are getting in exchange for less direct control.
2 Review the balance between your multilateral and bilateral programmes. Explicitly reviewing and revisiting the balance between multilateral and bilateral aid allocations helps inform public debate.
3 If fixed shares guide spending decisions, ensure they have broad coverage and are evidence-based. While they may be used as a tool to focus aid, caps, or ceilings, on multilateral aid, can also generate disproportionate transaction costs, or distort budgets. Where they exist, they should have a clear rationale and be amended when new evidence becomes available.
4 Make maximum use of joint assessments, independent evaluation findings and third-party analyses. Before considering additional analytical work it makes sense to use common assessments, databases and evaluations so as to minimise transaction cost and duplication.
5 State clearly and publicly the indicators and ratings that influence your future multilateral allocations. This is important for transparency vis-à-vis taxpayers, and allows other donors to repeat or upgrade the exercise.
6 Assess multilateral performance against collective international, as well as national, priorities. Performance of multilateral agencies is best measured against its mandate; but individual donors’ spending decisions also depend on the extent to which the programmes of the multilateral agency dovetail with the donor’s national priorities.
7 Periodically scrutinise allocations to all parts of the multilateral spectrum, even if they are semi-automatic. Assess allocations to multilateral organisations rather than taking preceding funding levels from past arrangements (including replenishments) as a default.
8 Have a dedicated body periodically review all public spending through multilaterals. It is important for cross-government discussions to take place in a single manageable (and, ideally, existing) body at sub-ministerial level to regularly review all contributions to multilateral agencies, to as to ensure an overview of all – core and earmarked – contributions made to each agency.
Adapted from OECD (2011b), 2011 DAC Report on Multilateral Aid, OECD, Paris, www.oecd.org/dataoecd/5/61/49014277.pdf.
Group multilateral organisations and use existing co-ordination mechanisms
A third component in the drive to control fragmentation relates to grouping and co-ordination within the multilateral sector. Over recent years, new agencies or umbrella facilities have grouped agencies and funds. In November 2010, for example, UN Women was created to merge the UN Development Fund for Women (UNIFEM), the Division for the Advancement of Women (DAW), the Office of the Special Adviser on Gender Issues (OSAGI), and the UN International Research and Training Institute for the Advancement of Women (UN-INSTRAW). In the same way, merging single-donor trust funds into multi-donor trust funds can create stronger organisations and, at the same time, reduce fragmentation. In this context, the World Bank’s efforts to consolidate existing trust funds, group funds under umbrella arrangements, transform several single-donor trust funds into multi-donor trust funds, and close empty trust funds, are noteworthy initiatives in the right direction.
Co-ordination among multilateral organisations within the same sector must be improved. The final report of the Task Team on Health as a Tracer Sector (OECD, 2011a) advised against creating separate, sector-specific global co-ordination initiatives. Drawing on the experience of the Health Systems

57
Funding Platform,5 it called for a stronger mandate for existing co-ordination mechanisms, emphasising that they should be sufficiently flexible to incorporate new actors (Box 4.5).
Box 4.5. Recommendations from the Health as a Tracer Sector initiative
Improve co-ordination of the global aid architecture – There is an urgent need for more efficient co-ordination of the global aid architecture for health and for more effective collaboration on policy and decision-making concerning global initiatives … This requires high-level leadership, greater alignment of accountabilities and incentives, and a stronger mandate for existing mechanisms such as the OECD-DAC, rather than the creation of a separate global co-ordination initiative. Measures to ensure that countries are in the lead and their perspectives are taken into account, need to be more consistent … Greater efforts are also needed to capitalise on the experience and comparative advantage of the diversity of actors in the health sector.
Source: OECD (2011-1), Progress and challenges in aid effectiveness – what can we learn from the health sector?, final report of Task Team on Health as a Tracer Sector, Development Assistance Committee (DAC), OECD, Paris, June, p.11.
Of course, efforts to reduce fragmentation at the government-to-multilateral level inevitably have to contend with limited room for manoeuvre. At a seminar on multilateral aid effectiveness held in October 2011 in Paris, stakeholders cautioned that gaps and overlaps, fragmentation and inequality cannot be reduced by information alone. Much hinges on political will and realistic expectations for change when both inclusiveness and strategic management are highly sought after.
Effective delivery of multilateral aid
There have also been significant initiatives to improve the multilateral system in the field. While DAC donors do not have a direct say in implementation. Rather, they influence the design stage through multilateral agencies’ (inter-governmental) governing boards, as well as through their support and funding of specific initiatives.
Efforts led by OECD/DAC for aid effectiveness in the field
The past decade has seen much work aimed at bringing multilateral co-operation into line with the principles of aid effectiveness. At the First High-Level Forum on Aid Effectiveness in Rome in 2002, participants committed to promote “harmonised approaches in global and regional programmes. The Statement of Resolve of the Paris Declaration two years later included a commitment to address the “insufficient integration of global programmes and initiatives into partner countries’ broader development agendas”, and the Accra Agenda for Action (2008) reiterated similar concerns (Box 4.6).
Box 4.6. Accra Agenda for Action, Paragraph 19c
The contributions of all development actors are more effective when developing countries are in a position to manage and co-ordinate them. We welcome the role of new contributors and will improve the way all development actors work together by taking the following actions:
[…]
c) Global funds and programmes make an important contribution to development. The programmes they fund are most effective in conjunction with complementary efforts to improve the policy environment and to strengthen the institutions in the sectors in which they operate. We call upon all global funds to support country ownership, to align and harmonise their assistance proactively, and to make good use of mutual accountability frameworks, while continuing their emphasis on achieving results. As new global challenges emerge, donors will ensure that existing channels for aid delivery are used and, if necessary, strengthened before creating separate new channels that risk further fragmentation and complicate co-ordination at country level.

58
In support of the Paris Declaration, Global Health Partnerships adopted Best Practice Principles for Engagement of Global Health Partnerships at Country Level at their High-Level Forum on Health Millennium Development Goals (MDGs) in Paris in 2005. These were health-specific guidelines based on the Paris Declaration that outlined how Global Health Partnerships should implement the five principles of effective aid at the country level. These principles, outlined in Box 4.7, segue towards another global initiative: the International Health Partnership (IHP+), established in 2007 to bring together public and private entities to improve aid effectiveness. It sought to achieve the health-related MDGs, guided by country ownership and using existing planning, co-ordination, delivery and management mechanisms at the country level. The responsibilities of international organisations, bilateral donors, governments, and other funders were spelled out in IHP+’s global compact and endorsed by 26 signatories.
Box 4.7. Best practice principles for engagement of global health partnerships at country level
The following “best practice principles” have been derived from the Global Health Partnership’s adaptation of the five key areas in the Paris Declaration on Aid Effectiveness:
• Ownership: Global Health Partnerships respect partner country leadership and help strengthen their capacity to exercise it.
• Alignment: Global Health Partnerships base their overall support on partner countries’ national development strategies, institutions and procedures.
• Harmonisation: Global Health Partnerships’ actions are more harmonised, transparent and collectively effective; Global Health Partnerships collaborate at the global level with other partners to address cross-cutting challenges such as health system strengthening.
• Managing for results: Global Health Partnerships work with countries to adopt and strengthen national results-based management.
• Accountability: Global Health Partnerships provide timely, clear and comprehensive information.
Source: Global Health Partnerships (2005), Best practice principles for global health partnership activities at country level, report of the Working Group on Global Health Partnerships, High-Level Forum on the Health Millennium Development Goals, Paris, 14-15 November.
Towards more effective UN operations: “One UN” and “Delivering as One”
The most prominent efforts in improving the delivery of multilateral aid have been those of the UN. Thirty-six UN bodies – including funds, programmes, specialised agencies and entities of the UN Secretariat – have been involved. In the General Assembly’s triennial comprehensive policy reviews (TCPR) on operational activities for development of the UN system in 2001, 2004, and 2007, and in the Outcome Statement of the 2005 World Summit (A/RES/60/1), UN member states called for reforms to bring about a more effective, coherent, and better-performing United Nations. In response, the Secretary-General appointed the High-Level Panel on UN System-Wide Coherence in the areas of development, humanitarian assistance and the environment. In its report, Delivering as One (UN, 2006) the Panel put forward a series of recommendations for overcoming the fragmentation of the UN and developing approaches that would enhance its coherence, efficiency and effectiveness at country level and reduce transaction costs for host countries.
Eight countries originally piloted the “One-UN” scheme from 2006. Others soon followed suit and voluntarily adopted the recommendations of Delivering as One, which involved adopting the “four ones” – one leader, one programme, one budget and, where appropriate, one office.
Though never adopted, the recommendations of Delivering as One triggered an “intense debate among Member States on system-wide coherence between 2007 and 2010” (UN, 2012a) and catalysed the adoption of resolutions on system-wide coherence in 2008, 2009 and 2010. An independent evaluation of

59
UN “Delivering as One” pilots in 2011 concluded that there had been moderate success (2012b). Reforms had enhanced national ownership, moderately reduced competition for funds, and enhanced capacity for strategic approaches. However, they had achieved little progress towards reducing fragmentation and duplication or towards reducing transaction costs for countries, the UN system, and other partners (ibid.).
To some extent, the evaluation found that the reason for the limited impact of reforms at country-office level lay in the lack of accompanying reform “higher up” the UN system. The Fifth High-Level Forum on Delivering as One, held in June 2012, concluded that an appropriate framework at headquarters was needed to enable UN country teams to successfully implement the Delivering as One approach (UN, 2012a). To this end, UN member states are engaged in the Quadrennial Comprehensive Policy Review (QCPR) to assess the effectiveness, efficiency, coherence and impact of UN operational activities for development and to establish system-wide policy orientations for the development co-operation and country-level modalities of the UN system.
The example of One-UN is a good reminder for the DAC in its discussions on guiding principles that bilateral donors have an important role to play in mandating (and funding) multilateral organisations to co-ordinate implementation in the field. But it also demonstrates that efforts to reduce fragmentation in the field cannot make up for the lack of co-ordination at headquarter level.
Country-level harmonisation among multilateral and bilateral donors
The third level at which donors will be looking for guidance is in their interaction with multilateral agencies in the field. Only when donors – both bi- and multilateral – achieve coherence and work together can they bring about effective change. The co-operation between bilateral and multilateral aid at country level is an area where little “good practice” has been in evidence, but where the DAC could discuss what has worked best. The examples in Boxes 4.7 and 4.8 could be inputs for such discussion.
Broadly speaking, efforts to build co-operation between bilateral and multilateral donors should naturally be in line with suggestions for “building more effective partnerships” set out in Paragraph 16 of the 2008 Accra Agenda for Action and endorsed by both donor countries and heads of multilateral agencies.
Box 4.8. Building partnerships
Aid is about building partnerships for development. Such partnerships are most effective when they fully harness the energy, skills and experience of all development actors - bilateral and multilateral donors, global funds, CSOs, and the private sector. To support developing countries’ efforts to build for the future, we resolve to create partnerships that will include all these actors.
Source: Accra Agenda for Action (2008), www.oecd.org/dac/effectiveness/parisdeclarationandaccraagendaforaction.htm. The Draft Good Practice Guidance for Integration and Effectiveness of Global Programmes at the Country Level (World Bank, 2006) has spelled out what some of these commitments mean in practice.

60
Box 4.9. Harmonisation – excerpts from Draft Good Practice Guidance for Integration and Effectiveness of Global Programmes at the Country Level
Harmonise pro-actively.
• Join with other donors in simplified and common arrangements to support and strengthen government-led processes and systems. These include joint reporting, analyses, strategies, missions, and capacity development.
• Participate actively in multi-donor coordination mechanisms. This may include delegation to a relevant donor with adequate field presence.
Take global programmes seriously. Donor agencies (bilateral and multilateral) take account of global programmes in country support strategies and work closely with them for better integrated support of national development programmes.
Source: World Bank (2006), Draft Good Practice Guidance for Integration and Effectiveness of Global Programs at the Country Level – “Work in Progress”, contribution by World Bank, Policy Workshop on Global Programmes and the Paris Agenda, Paris, 5 December.
The DAC could look into practical examples of in-country efforts to co-ordinate harmonisation among development partners. In this regard, recent efforts to ensure a better division of labour between various United Nations and World Bank thematic funds and financing instruments in fragile states are a step in the right direction. In addition, countries such as Rwanda, Bangladesh, Ghana, Bolivia, or Mozambique may have lessons on harmonisation to teach donors. In that respect, it could be helpful to consider the following two issues:
• What is the donor experience with obligatory programming where all donors must verify that their programmes do not contradict, overlap with, or duplicate other programmes?
• How can bilateral staff in the field be incentivised to co-ordinate their work with that of multilateral agencies and how might funds better co-ordinate implementation on the ground? How can such co-ordination be rewarded?
Emerging guiding principles
Stakeholders of different multilateral agencies, funds, and programmes have a collective responsibility to address the most important challenges of the multilateral architecture that they fund and govern and to ensure effective funding, delivery and results at country level. In response to the commitment made in Paragraph 25(b) of the Busan Partnership for Effective Development Co-operation to “agree on principles and guidelines to guide our joint efforts to reduce the proliferation of multilateral channels,” the DAC drew on a first draft of this report to hold a workshop in October 2012 on how to reduce the proliferation of multilateral channels. Participants attending the workshop drew up seven emerging principles, informed by the commitments of the Busan Partnership for Effective Development:
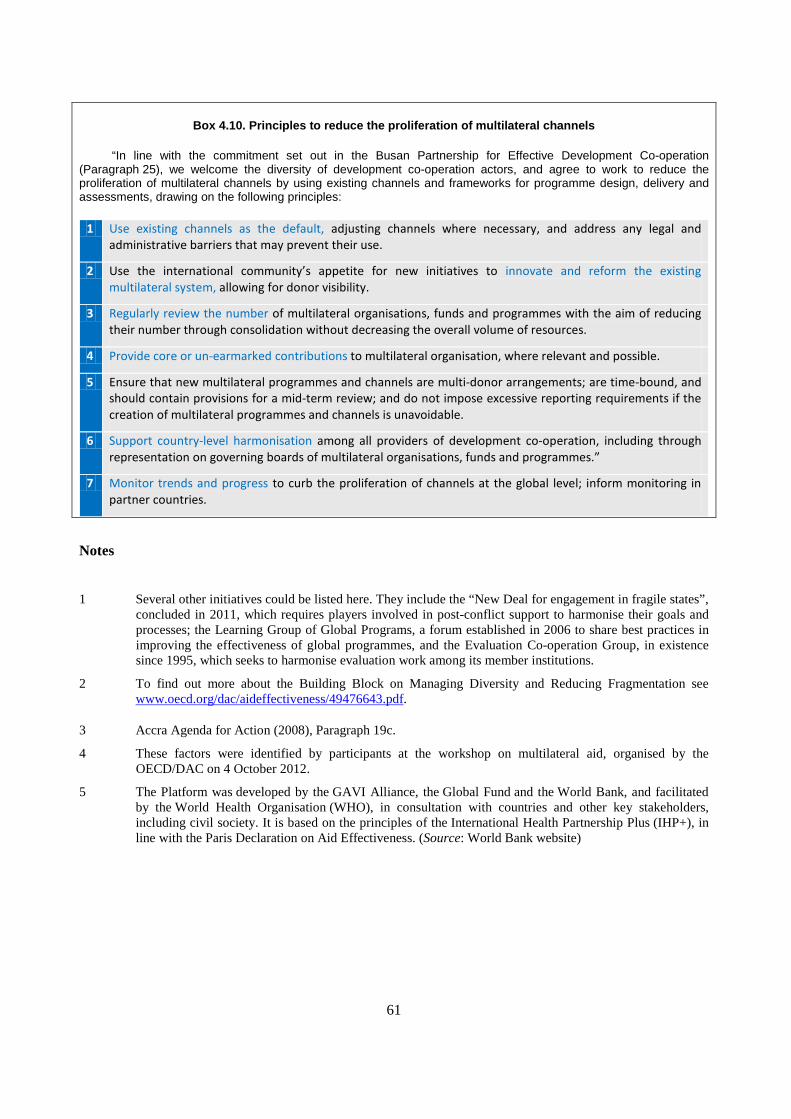
61
Box 4.10. Principles to reduce the proliferation of multilateral channels
“In line with the commitment set out in the Busan Partnership for Effective Development Co-operation (Paragraph 25), we welcome the diversity of development co-operation actors, and agree to work to reduce the proliferation of multilateral channels by using existing channels and frameworks for programme design, delivery and assessments, drawing on the following principles:
1 Use existing channels as the default, adjusting channels where necessary, and address any legal and administrative barriers that may prevent their use.
2 Use the international community’s appetite for new initiatives to innovate and reform the existing multilateral system, allowing for donor visibility.
3 Regularly review the number of multilateral organisations, funds and programmes with the aim of reducing their number through consolidation without decreasing the overall volume of resources.
4 Provide core or un-earmarked contributions to multilateral organisation, where relevant and possible.
5 Ensure that new multilateral programmes and channels are multi-donor arrangements; are time-bound, and should contain provisions for a mid-term review; and do not impose excessive reporting requirements if the creation of multilateral programmes and channels is unavoidable.
6 Support country-level harmonisation among all providers of development co-operation, including through representation on governing boards of multilateral organisations, funds and programmes.”
7 Monitor trends and progress to curb the proliferation of channels at the global level; inform monitoring in partner countries.
Notes
1 Several other initiatives could be listed here. They include the “New Deal for engagement in fragile states”,
concluded in 2011, which requires players involved in post-conflict support to harmonise their goals and processes; the Learning Group of Global Programs, a forum established in 2006 to share best practices in improving the effectiveness of global programmes, and the Evaluation Co-operation Group, in existence since 1995, which seeks to harmonise evaluation work among its member institutions.
2 To find out more about the Building Block on Managing Diversity and Reducing Fragmentation see www.oecd.org/dac/aideffectiveness/49476643.pdf.
3 Accra Agenda for Action (2008), Paragraph 19c.
4 These factors were identified by participants at the workshop on multilateral aid, organised by the OECD/DAC on 4 October 2012.
5 The Platform was developed by the GAVI Alliance, the Global Fund and the World Bank, and facilitated by the World Health Organisation (WHO), in consultation with countries and other key stakeholders, including civil society. It is based on the principles of the International Health Partnership Plus (IHP+), in line with the Paris Declaration on Aid Effectiveness. (Source: World Bank website)

DCD/DAC(2012)33/FINAL
62
References
Accra Agenda for Action (2008), www.oecd.org/dataoecd/11/41/34428351.pdf
Global Health Partnerships (2005), Best practice principles for global health partnership activities at country level, report of the Working Group on Global Health Partnerships, High-Level Forum on the Health Millennium Development Goals, Paris, 14-15 November
HLF4, Fourth High-Level Forum on Aid Effectiveness (2011-1), “Busan Partnership for Effective Development Co-operation”, statement, 29 November to 1st December, www.aideffectiveness.org/busanhlf4/images/stories/hlf4/OUTCOME_DOCUMENT_-_FINAL_EN.pdf
HLF4, (2011-2)“Managing Diversity and Reducing Fragmentation”, Busan, 29 November to 1 December
HLF1 (2003), Rome Declaration on Harmonisation, Rome, 24-25 February, www.oecd.org/dataoecd/54/50/31451637.pdf
OECD (2011a), Progress and challenges in aid effectiveness – what can we learn from the health sector?, final report of Task Team on Health as a Tracer Sector, Development Assistance Committee (DAC), OECD, Paris, June
OECD (2011b), 2011 DAC Report on Multilateral Aid, OECD, Paris, www.oecd.org/dataoecd/5/61/49014277.pdf
United Nations (2006), Delivering as One, Report of the Secretary-General’s High-Level Panel, New York
United Nations (2012a), “The United Nations We Want - Our commitment to the way forward”, outcome document, Fifth High Level Intergovernmental Conference on Delivering as One, Tirana, June 2012, http://dao5conference.org/ckfinder/userfiles/files/Outcome%20Document%20-%20Tirana%20Conference.pdf
United Nations (2012b), Independent Evaluation of Lessons Learned from Delivering as One, draft final report, International Evaluation Team for the Evaluation Management Group, www.un.org/en/ga/deliveringasone/pdf/draftreport.pdf
World Bank (2006), Draft Good Practice Guidance for Integration and Effectiveness of Global Programs at the Country Level – “Work in Progress”, contribution by World Bank, Policy Workshop on Global Programmes and the Paris Agenda, Paris, 5 December 2006, www.oecd.org/dataoecd/30/51/37739410.pdf
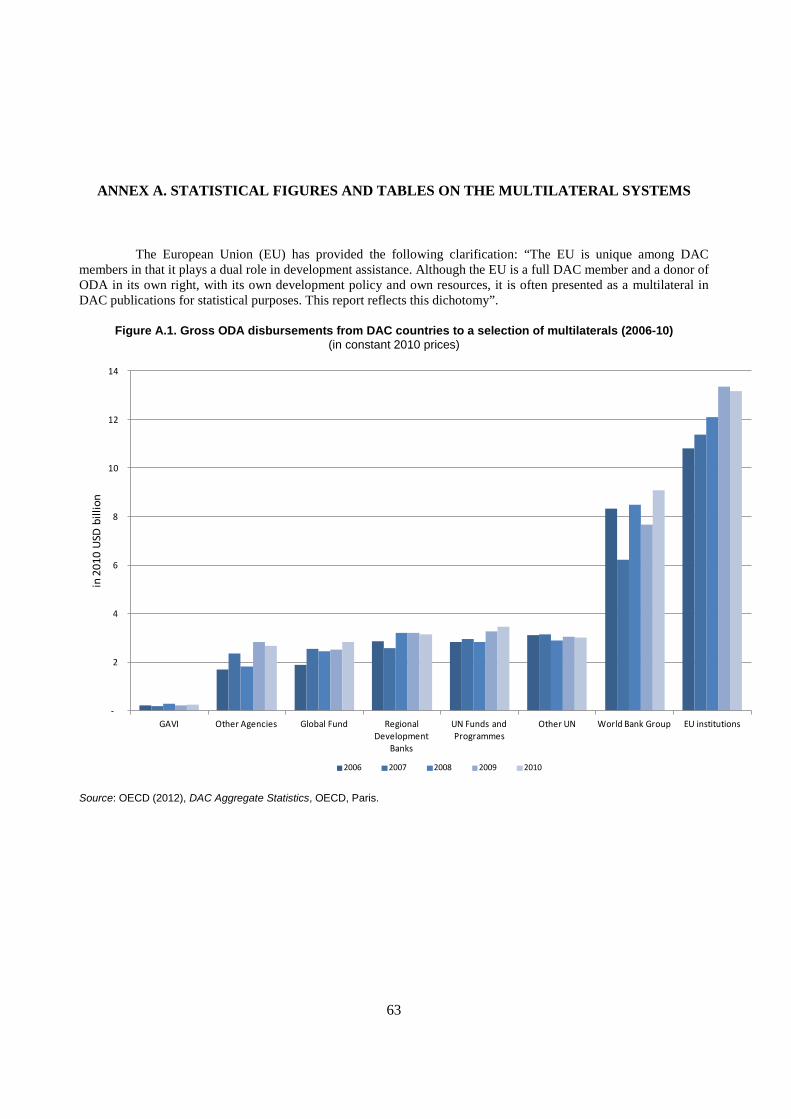
63
ANNEX A. STATISTICAL FIGURES AND TABLES ON THE MULTILATERAL SYSTEMS
The European Union (EU) has provided the following clarification: “The EU is unique among DAC members in that it plays a dual role in development assistance. Although the EU is a full DAC member and a donor of ODA in its own right, with its own development policy and own resources, it is often presented as a multilateral in DAC publications for statistical purposes. This report reflects this dichotomy”.
Figure A.1. Gross ODA disbursements from DAC countries to a selection of multilaterals (2006-10) (in constant 2010 prices)
Source: OECD (2012), DAC Aggregate Statistics, OECD, Paris.
-
2
4
6
8
10
12
14
GAVI Other Agencies Global Fund Regional Development
Banks
UN Funds and Programmes
Other UN World Bank Group EU institutions
in 2
010
USD
bill
ion
2006 2007 2008 2009 2010

64
Table A.1. Total use of the multilateral system (2010) (excluding debt relief)
Source: OECD (2012), DAC Aggregate Statistics, OECD, Paris; and OECD (2012), Creditor Reporting System Database, OECD, Paris.
Dono
r
Bila
tera
l OD
A
of w
hich
, ch
anne
lled
thro
ugh
mul
tilat
eral
ag
enci
es (n
on-
core
)
Mul
tilat
eral
OD
A(in
USD
m)
Tota
l use
of t
he
mul
tilat
eral
sy
stem
Cor
e m
ultil
ater
al
OD
A a
s %
of
gros
s O
DA
Mul
tilat
eral
OD
A
and
non-
core
as
% o
f tot
al O
DA
Cor
e as
% o
f tot
al
use
of th
e m
ultil
ater
al
syst
em
(A) (B) (C) (B+C) (C/(A+C)) ((B+C)/(A+C)) (C/(B+C))Australia 3,234 813 585 1,397 15% 37% 42%Austria 462 99 597 697 56% 66% 86%Belgium 1,543 234 953 1,187 38% 48% 80%Canada 3,912 1,367 1,282 2,650 25% 51% 48%Denmark 2,139 241 790 1,032 27% 35% 77%Finland 839 250 494 744 37% 56% 66%France 7,446 39 5,220 5,259 41% 42% 99%Germany 9,220 480 4,950 5,430 35% 38% 91%Greece 212 6 296 302 58% 59% 98%Ireland 585 103 310 413 35% 46% 75%Italy 694 92 2,237 2,329 76% 79% 96%Japan 14,954 1,251 3,684 4,935 20% 26% 75%Korea 931 45 273 318 23% 26% 86%Luxembourg 262 98 141 239 35% 59% 59%Netherlands 4,453 719 1,516 2,235 25% 37% 68%New Zealand 271 31 71 102 21% 30% 70%Norway 3,544 1,035 1,019 2,053 22% 45% 50%Portugal 428 51 253 304 37% 45% 83%Spain 3,933 1,349 1,951 3,300 33% 56% 59%Sweden 2,923 736 1,618 2,355 36% 52% 69%Switzerland 1,698 292 588 879 26% 38% 67%United Kingdom 8,200 2,961 5,037 7,997 38% 60% 63%United States 27,199 4,383 3,775 8,157 12% 26% 46%Total DAC donors 99,083 16,677 37,638 54,316 28% 40% 69%

65
Figure A.2. Gross multilateral ODA provided by DAC member countries as share of total ODA (1991-2010) (in constant 2010 prices, excluding debt relief)
Source: OECD (2012), DAC Aggregate Statistics, OECD, Paris.
10
15
20
25
30
35
1991
1992
1993
1994
1995
1996
1997
1998
1999
2000
2001
2002
2003
2004
2005
2006
2007
2008
2009
2010
Perc
enta
ge (%
)
Multilateral as share of gross ODA Multilateral as share of gross ODA, excl. contributions to EU
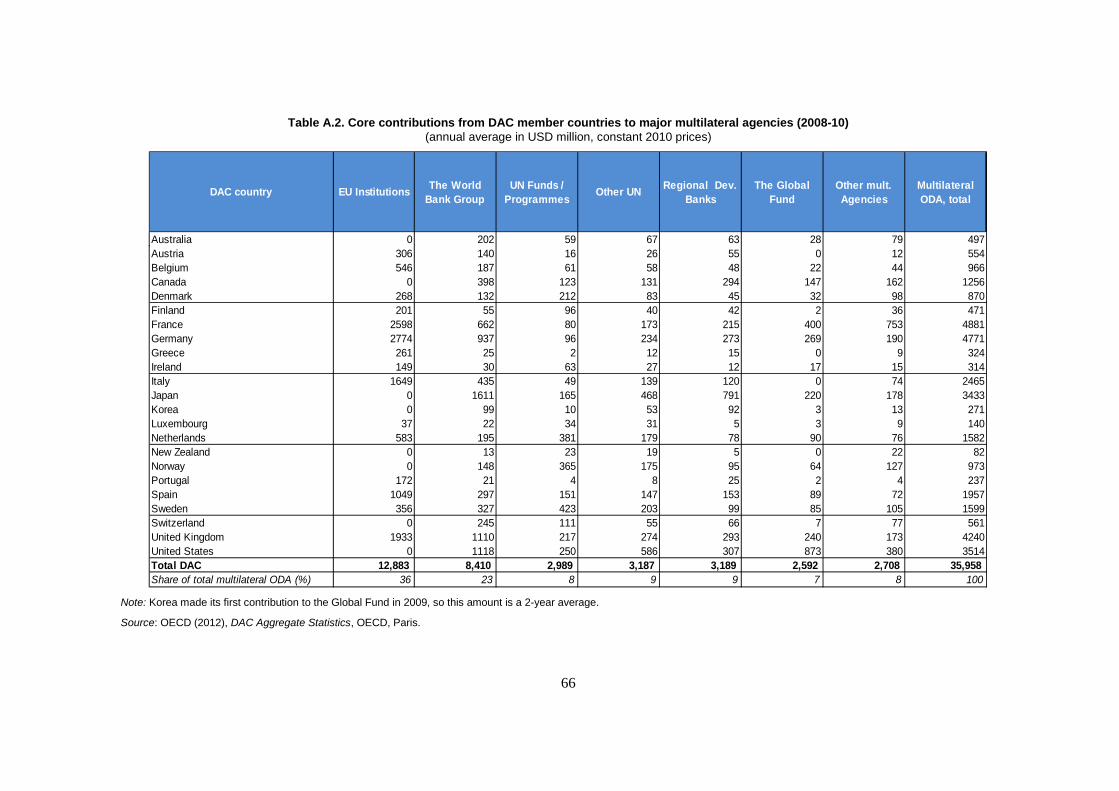
66
Table A.2. Core contributions from DAC member countries to major multilateral agencies (2008-10) (annual average in USD million, constant 2010 prices)
Note: Korea made its first contribution to the Global Fund in 2009, so this amount is a 2-year average.
Source: OECD (2012), DAC Aggregate Statistics, OECD, Paris.
DAC country EU Institutions The World Bank Group
UN Funds / Programmes Other UN Regional Dev.
BanksThe Global
FundOther mult. Agencies
Multilateral ODA, total
Australia 0 202 59 67 63 28 79 497Austria 306 140 16 26 55 0 12 554Belgium 546 187 61 58 48 22 44 966Canada 0 398 123 131 294 147 162 1256Denmark 268 132 212 83 45 32 98 870Finland 201 55 96 40 42 2 36 471France 2598 662 80 173 215 400 753 4881Germany 2774 937 96 234 273 269 190 4771Greece 261 25 2 12 15 0 9 324Ireland 149 30 63 27 12 17 15 314Italy 1649 435 49 139 120 0 74 2465Japan 0 1611 165 468 791 220 178 3433Korea 0 99 10 53 92 3 13 271Luxembourg 37 22 34 31 5 3 9 140Netherlands 583 195 381 179 78 90 76 1582New Zealand 0 13 23 19 5 0 22 82Norway 0 148 365 175 95 64 127 973Portugal 172 21 4 8 25 2 4 237Spain 1049 297 151 147 153 89 72 1957Sweden 356 327 423 203 99 85 105 1599Switzerland 0 245 111 55 66 7 77 561United Kingdom 1933 1110 217 274 293 240 173 4240United States 0 1118 250 586 307 873 380 3514Total DAC 12,883 8,410 2,989 3,187 3,189 2,592 2,708 35,958 Share of total multilateral ODA (%) 36 23 8 9 9 7 8 100

67
Figure A.3. Total UN operational activities for development (2010) Main UN entities: comparison core, non-core and total
Note: These figures include total contributions to the UN agencies identified. Contributions include resources from non-DAC members and other multilateral organisations. For this reason, the figures differ from those reported to the OECD/DAC and published elsewhere in this report.
Source: United Nations (2012b), Independent Evaluation of Lessons Learned from Delivering as One, draft final report, International Evaluation Team for the Evaluation Management Group, www.un.org/en/ga/deliveringasone/pdf/draftreport.pdf).
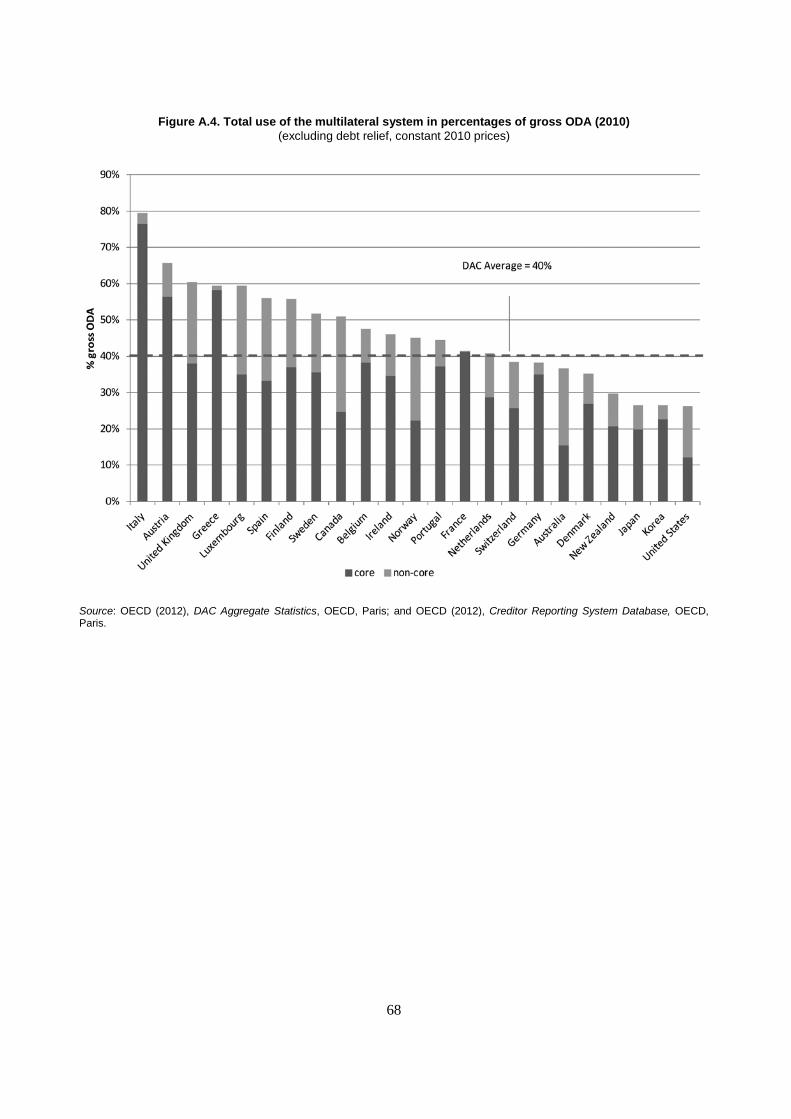
68
Figure A.4. Total use of the multilateral system in percentages of gross ODA (2010) (excluding debt relief, constant 2010 prices)
Source: OECD (2012), DAC Aggregate Statistics, OECD, Paris; and OECD (2012), Creditor Reporting System Database, OECD, Paris.

69
Table A.3. DAC gross multilateral ODA disbursements over the five year period (2006-10) (in USD million, constant 2010 prices)
Source: OECD (2012), DAC Aggregate Statistics, OECD, Paris.
Tota
l mul
tilat
eral
ODA
20
06-2
010
Shar
e of
EU
budg
et +
EDF
200
6-20
10
Dono
r's s
hare
of g
loba
l m
ultil
ater
al O
DA,
excl
udin
g to
the
EC
Dono
r's s
hare
of g
loba
l m
ultil
ater
al O
DA
IDA
EU b
udge
t + E
DF
UN F
unds
and
Prog
ram
mes
*
Glo
bal F
und
AfDB
AsDB
% a
lloca
ted
to la
rges
t six
m
ultil
ater
al c
lust
ers
Number of DAC donors 24 15 24 23 21 23Non-EU members 51,359 - 47% 30% 34% 11% 12% 6% 8% 71%Australia 2,439 - 2% 1% 37% 10% 5% 0% 16% 68%Canada 6,157 - 6% 4% 31% 11% 11% 11% 5% 70%Japan 17,702 - 16% 10% 40% 6% 6% 5% 14% 71%Korea 1,099 - 1% 1% 28% 4% 1% 7% 17% 56%New Zealand 391 - 0% 0% 15% 29% 0% 0% 7% 51%Norway 4,766 - 4% 3% 15% 40% 6% 9% 1% 71%Switzerland 2,678 - 2% 2% 43% 21% 1% 10% 2% 77%United States 16,127 - 15% 9% 33% 8% 23% 5% 3% 72%EU members 119,625 60,702 53% 70% 16% 51% 8% 5% 4% 1% 85%Austria 2,611 1,446 1% 2% 25% 55% 3% 0% 8% 2% 92%Belgium 4,330 2,456 2% 3% 18% 57% 6% 2% 4% 1% 88%Denmark 4,462 1,348 3% 3% 11% 30% 26% 3% 4% 1% 75%Finland 2,245 956 1% 1% 12% 43% 20% 0% 7% 1% 83%France 22,273 12,139 9% 13% 12% 55% 2% 9% 4% 1% 82%Germany 22,362 13,117 8% 13% 20% 59% 2% 5% 4% 1% 91%Greece 1,519 1,211 0% 1% 9% 80% 1% 0% 0% 0% 89%Ireland 1,647 649 1% 1% 15% 39% 20% 5% 0% 4% 82%Italy 12,000 7,946 4% 7% 10% 66% 3% 5% 2% 1% 86%Luxembourg 653 163 0% 0% 10% 25% 19% 2% 0% 5% 61%Netherlands 7,616 2,795 4% 4% 8% 37% 24% 6% 2% 0% 77%Portugal 1,118 781 0% 1% 8% 70% 2% 1% 7% 3% 92%Spain 9,594 5,015 4% 6% 14% 52% 7% 5% 4% 2% 84%Sweden 7,441 1,649 5% 4% 18% 22% 28% 6% 6% 1% 81%United Kingdom 19,753 9,030 10% 12% 25% 46% 6% 5% 5% 2% 88%DAC Total 170,984 60,702 100% 100% 22% 36% 9% 7% 5% 3% 81%

70

71
ANNEX B. COUNTRY TABLES AND FIGURES ON MULTILATERAL AND NON-MULTILATERAL ODA
The European Union (EU) has provided the following clarification: “The EU is unique among DAC members in that it plays a dual role in development assistance. Although the EU is a full DAC member and a donor of ODA in its own right, with its own development policy and own resources, it is often presented as a multilateral in DAC publications for statistical purposes. This report reflects this dichotomy.”

72
Australia
Table B.1. 2010 non-core multilateral ODA by region, sector and fragility status
(in 2010 USD million)
Source: OECD (2012), Creditor Reporting System Database, OECD, Paris.
Figure B.1. 2010 multilateral and non-multilateral ODA (in 2010 USD million)
Table B.2. 2010 multilateral and non-core multilateral ODA
(in 2010 USD million)
Source: OECD (2012), Creditor Reporting System Database, OECD, Paris; OECD (2012), DAC Aggregate Statistics, OECD, Paris.
Bilateral, unallocated / unspecified 200 25%Country / region specific 613 75% - of which regional allocations 73 9%REGIONSAfrica, unspecified 14 3%South of Sahara 68 13%North of Sahara 0 0%Americas, unspecified 0 0%South America 3 1%North & Central America 17 3%Asia, unspecified 5 1%Far East Asia 178 35%Middle East 45 9%South & Central Asia 189 38%Europe 0 0%Oceania 95 19%SECTORSAgriculture 50 6%Developmental Food Aid 12 1%Economic Infrastructure and Services 64 8%Education 65 8%Environment 26 3%General Budget Support 43 5%Government and Civil Society 92 11%Health 62 8%Humanitarian Aid 183 22%Multi-sector 41 5%Other Production Sectors (forestry, fishing, industry, mining, construction, trade policy, tourism)
34 4%
Other Social infrastructure 37 5%Population Policies and Reproductive Health 26 3%Water Supply and Sanitation 77 9%Other (admin., promotion development awareness, refugeees in donor countries)
0 0%
FRAGILE / CONFLICT*Fragile 320 59%Other 220 41%
Australia
-
100
200
300
400
500
600
World Bank Group UN Funds and Programmes*
Other UN Regional Development Banks
Other multilaterals
Core Non-Core
Total use of the multilateral system in 2010 Core Non-CoreEU - - World Bank Group 202 303 UN Funds and Programmes* 103 267 of which:
UNDP 17 49 WFP 32 53 UNICEF 23 103 UNFPA 8 10 UNHCR 13 29 UNRWA 9 9
Other UN 60 82 of which:
FAO 5 6 IFAD - - ILO 3 21 OHCHR 2 0 UNDPKO - - UNECE - - UNESCO 4 1 UN 5 - UNOCHA n/a 7 WHO 24 18
Regional Development Banks 94 71 of which:
African Development Bank 5 10 Asian Development Bank 89 59 Inter-American Development Bank - -
Other multilaterals 126 89 Total 585 813

73
Austria
Table B.3. 2010 non-core multilateral ODA by region, sector and fragility status
(in 2010 USD million)
Source: OECD (2012), Creditor Reporting System Database, OECD, Paris. OECD.
Figure 1. Figure B.2. 2010 multilateral and non-multilateral ODA (in 2010 USD million)
Table B.4. 2010 multilateral and non-core multilateral ODA
(in 2010 USD million)
Source: OECD (2012), Creditor Reporting System Database, OECD, Paris; OECD (2012), DAC Aggregate Statistics, OECD, Paris.
Bilateral, unallocated / unspecified 18 18%Country / region specific 81 82% - of which regional allocations 55 55%REGIONSAfrica, unspecified 8 12%South of Sahara 15 20%North of Sahara 0 0%Americas, unspecified 3 4%South America 0 0%North & Central America 5 7%Asia, unspecified 1 1%Far East Asia 0 0%Middle East 2 3%South & Central Asia 11 15%Europe 36 50%Oceania 0 0%SECTORSAgriculture 3 3%Developmental Food Aid 0 0%Economic Infrastructure and Services 38 39%Education 0 0%Environment 3 3%General Budget Support - 0%Government and Civil Society 11 11%Health 0 0%Humanitarian Aid 10 10%Multi-sector 18 18%Other Production Sectors (forestry, fishing, industry, mining, construction, trade policy, tourism)
6 6%
Other Social infrastructure 2 2%Population Policies and Reproductive Health 1 1%Water Supply and Sanitation 8 8%Other (admin., promotion development awareness, refugeees in donor countries)
0 0%
FRAGILE / CONFLICT*Fragile 16 59%Other 11 41%
Austria
-
50
100
150
200
250
300
350
400
EU World Bank Group
UN Funds and Programmes*
Other UN Regional Development
Banks
Other multilaterals
Core Non-Core
Total use of the multilateral system in 2010 Core Non-CoreEU 325 15 World Bank Group 151 39 UN Funds and Programmes* 16 12 of which:
UNDP 10 4 WFP 0 1 UNICEF 2 3 UNFPA 2 1 UNHCR 1 2 UNRWA 1 -
Other UN 36 8 of which:
FAO 2 1 IFAD 15 - ILO 2 1 OHCHR - 1 UNDPKO 5 - UNECE 0 - UNESCO 2 0 UN 2 - UNOCHA n/a 2 WHO 3 0
Regional Development Banks 58 14 of which:
African Development Bank 44 6 Asian Development Bank 11 3 Inter-American Development Bank - -
Other multilaterals 12 12 Total 597 99

74
Belgium
Table B.5. 2010 non-core multilateral ODA by region, sector and fragility status
(in 2010 USD million)
Source: OECD (2012), Creditor Reporting System Database, OECD, Paris.
Figure B.3. 2010 multilateral and non-multilateral ODA (in 2010 USD million)
Table B.6. 2010 multilateral and non-core multilateral ODA
(in 2010 USD million)
Source: OECD (2012), Creditor Reporting System Database, OECD, Paris; OECD (2012), DAC Aggregate Statistics, OECD, Paris.
Bilateral, unallocated / unspecified 58 25%Country / region specific 177 75% - of which regional allocations 16 7%REGIONSAfrica, unspecified 1 1%South of Sahara 120 69%North of Sahara 6 3%Americas, unspecified 0 0%South America 1 1%North & Central America 11 6%Asia, unspecified 3 2%Far East Asia 0 0%Middle East 16 9%South & Central Asia 17 10%Europe 1 1%Oceania 0 0%SECTORSAgriculture 12 5%Developmental Food Aid 4 2%Economic Infrastructure and Services 6 2%Education 7 3%Environment 16 7%General Budget Support 12 5%Government and Civil Society 38 16%Health 4 2%Humanitarian Aid 91 39%Multi-sector 9 4%Other Production Sectors (forestry, fishing, industry, mining, construction, trade policy, tourism)
15 6%
Other Social infrastructure 8 3%Population Policies and Reproductive Health 6 2%Water Supply and Sanitation 0 0%Other (admin., promotion development awareness, refugeees in donor countries)
7 3%
FRAGILE / CONFLICT*Fragile 122 76%Other 38 24%
-
100
200
300
400
500
600
EU World Bank Group
UN Funds and Programmes*
Other UN Regional Development
Banks
Other multilaterals
Core Non-Core
Total use of the multilateral system in 2010 Core Non-CoreEU 546 20 World Bank Group 151 13 UN Funds and Programmes* 71 102 of which:
UNDP 26 29 WFP - 38 UNICEF 25 12 UNFPA 7 - UNHCR 11 12 UNRWA 3 11
Other UN 75 43 of which:
FAO 6 22 IFAD 9 6 ILO 3 1 OHCHR 1 0 UNDPKO 5 - UNECE - - UNESCO 2 2 UN 3 - UNOCHA n/a 1 WHO 12 3
Regional Development Banks 39 3 of which:
African Development Bank 35 - Asian Development Bank 2 - Inter-American Development Bank - -
Other multilaterals 70 53 Total 952 234
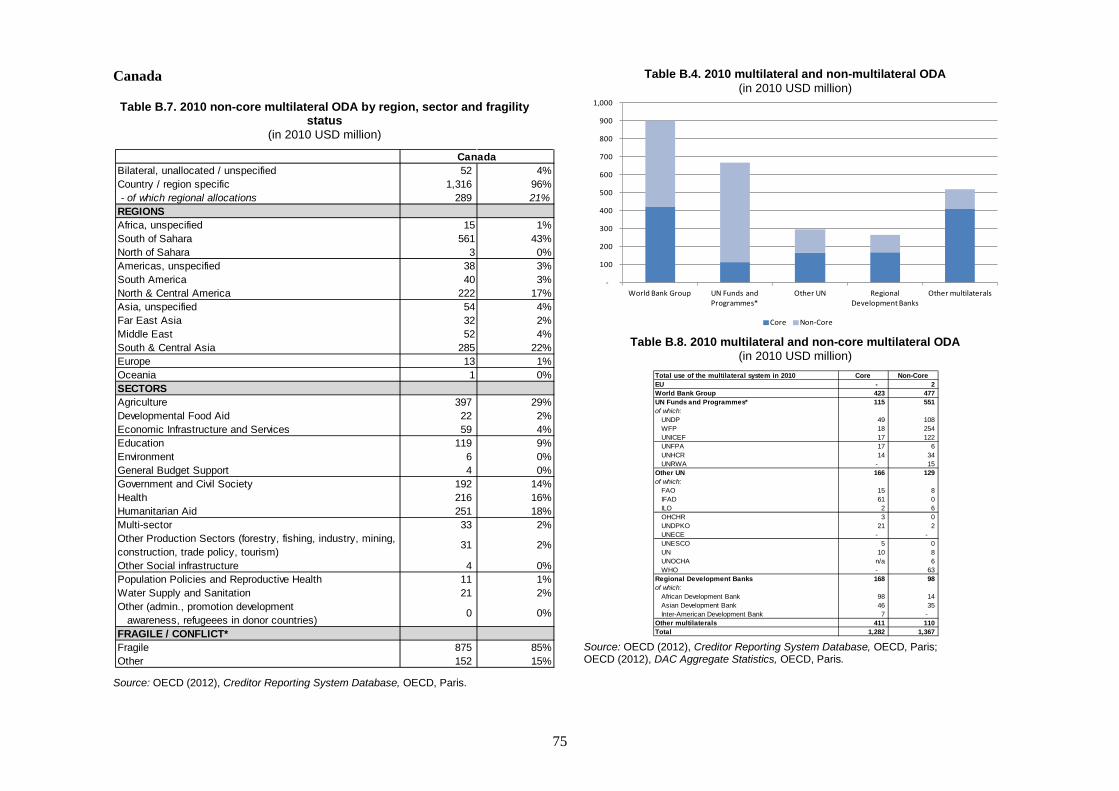
75
Canada
Table B.7. 2010 non-core multilateral ODA by region, sector and fragility status
(in 2010 USD million)
Source: OECD (2012), Creditor Reporting System Database, OECD, Paris.
Table B.4. 2010 multilateral and non-multilateral ODA (in 2010 USD million)
Table B.8. 2010 multilateral and non-core multilateral ODA
(in 2010 USD million)
Source: OECD (2012), Creditor Reporting System Database, OECD, Paris; OECD (2012), DAC Aggregate Statistics, OECD, Paris.
Bilateral, unallocated / unspecified 52 4%Country / region specific 1,316 96% - of which regional allocations 289 21%REGIONSAfrica, unspecified 15 1%South of Sahara 561 43%North of Sahara 3 0%Americas, unspecified 38 3%South America 40 3%North & Central America 222 17%Asia, unspecified 54 4%Far East Asia 32 2%Middle East 52 4%South & Central Asia 285 22%Europe 13 1%Oceania 1 0%SECTORSAgriculture 397 29%Developmental Food Aid 22 2%Economic Infrastructure and Services 59 4%Education 119 9%Environment 6 0%General Budget Support 4 0%Government and Civil Society 192 14%Health 216 16%Humanitarian Aid 251 18%Multi-sector 33 2%Other Production Sectors (forestry, fishing, industry, mining, construction, trade policy, tourism)
31 2%
Other Social infrastructure 4 0%Population Policies and Reproductive Health 11 1%Water Supply and Sanitation 21 2%Other (admin., promotion development awareness, refugeees in donor countries)
0 0%
FRAGILE / CONFLICT*Fragile 875 85%Other 152 15%
Canada
-
100
200
300
400
500
600
700
800
900
1,000
World Bank Group UN Funds and Programmes*
Other UN Regional Development Banks
Other multilaterals
Core Non-Core
Total use of the multilateral system in 2010 Core Non-CoreEU - 2 World Bank Group 423 477 UN Funds and Programmes* 115 551 of which:
UNDP 49 108 WFP 18 254 UNICEF 17 122 UNFPA 17 6 UNHCR 14 34 UNRWA - 15
Other UN 166 129 of which:
FAO 15 8 IFAD 61 0 ILO 2 6 OHCHR 3 0 UNDPKO 21 2 UNECE - - UNESCO 5 0 UN 10 8 UNOCHA n/a 6 WHO - 63
Regional Development Banks 168 98 of which:
African Development Bank 98 14 Asian Development Bank 46 35 Inter-American Development Bank 7 -
Other multilaterals 411 110 Total 1,282 1,367
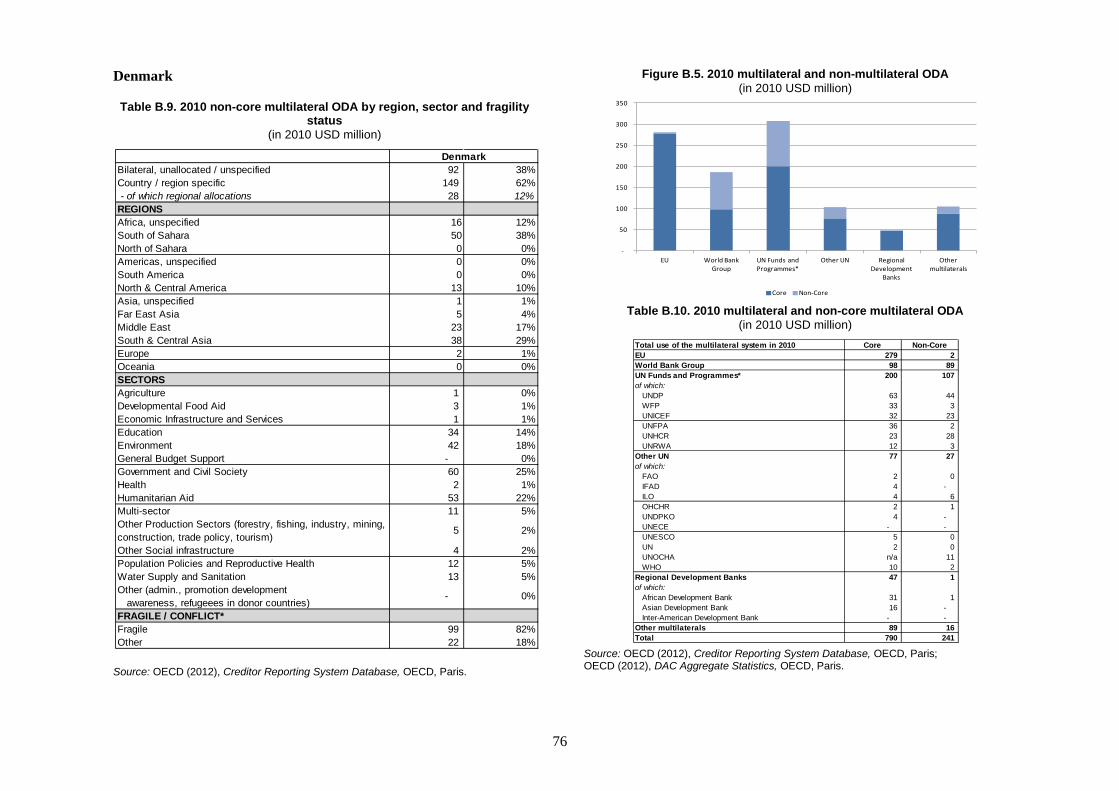
76
Denmark
Table B.9. 2010 non-core multilateral ODA by region, sector and fragility status
(in 2010 USD million)
Source: OECD (2012), Creditor Reporting System Database, OECD, Paris.
Figure B.5. 2010 multilateral and non-multilateral ODA (in 2010 USD million)
Table B.10. 2010 multilateral and non-core multilateral ODA
(in 2010 USD million)
Source: OECD (2012), Creditor Reporting System Database, OECD, Paris; OECD (2012), DAC Aggregate Statistics, OECD, Paris.
Bilateral, unallocated / unspecified 92 38%Country / region specific 149 62% - of which regional allocations 28 12%REGIONSAfrica, unspecified 16 12%South of Sahara 50 38%North of Sahara 0 0%Americas, unspecified 0 0%South America 0 0%North & Central America 13 10%Asia, unspecified 1 1%Far East Asia 5 4%Middle East 23 17%South & Central Asia 38 29%Europe 2 1%Oceania 0 0%SECTORSAgriculture 1 0%Developmental Food Aid 3 1%Economic Infrastructure and Services 1 1%Education 34 14%Environment 42 18%General Budget Support - 0%Government and Civil Society 60 25%Health 2 1%Humanitarian Aid 53 22%Multi-sector 11 5%Other Production Sectors (forestry, fishing, industry, mining, construction, trade policy, tourism)
5 2%
Other Social infrastructure 4 2%Population Policies and Reproductive Health 12 5%Water Supply and Sanitation 13 5%Other (admin., promotion development awareness, refugeees in donor countries)
- 0%
FRAGILE / CONFLICT*Fragile 99 82%Other 22 18%
Denmark
-
50
100
150
200
250
300
350
EU World Bank Group
UN Funds and Programmes*
Other UN Regional Development
Banks
Other multilaterals
Core Non-Core
Total use of the multilateral system in 2010 Core Non-CoreEU 279 2 World Bank Group 98 89 UN Funds and Programmes* 200 107 of which:
UNDP 63 44 WFP 33 3 UNICEF 32 23 UNFPA 36 2 UNHCR 23 28 UNRWA 12 3
Other UN 77 27 of which:
FAO 2 0 IFAD 4 - ILO 4 6 OHCHR 2 1 UNDPKO 4 - UNECE - - UNESCO 5 0 UN 2 0 UNOCHA n/a 11 WHO 10 2
Regional Development Banks 47 1 of which:
African Development Bank 31 1 Asian Development Bank 16 - Inter-American Development Bank - -
Other multilaterals 89 16 Total 790 241

77
European Union Institutions
Table B.11. 2010 non-core multilateral ODA by region, sector and fragility status
(in 2010 USD million)
Source: OECD (2012), Creditor Reporting System Database, OECD, Paris.
Figure B.6. 2010 multilateral and non-multilateral ODA (in 2010 USD million)
Table B.12. 2010 multilateral and non-core multilateral ODA (in 2010 USD million)
Source: OECD (2012), Creditor Reporting System Database, OECD, Paris. OECD (2012), DAC Aggregate Statistics, OECD, Paris.
Bilateral, unallocated / unspecified 301 13%Country / region specific 1,976 87% - of which regional allocations 455 20%REGIONSAfrica, unspecified 51 3%South of Sahara 898 47%North of Sahara 49 3%Americas, unspecified 11 1%South America 30 2%North & Central America 96 5%Asia, unspecified 8 0%Far East Asia 76 4%Middle East 169 9%South & Central Asia 412 21%Europe 171 9%Oceania 5 0%SECTORSAgriculture 170 7%Developmental Food Aid 231 10%Economic Infrastructure and Services 126 6%Education 112 5%Environment 55 2%General Budget Support - 0%Government and Civil Society 416 18%Health 81 4%Humanitarian Aid 623 27%Multi-sector 210 9%Other Production Sectors (forestry, fishing, industry, mining, construction, trade policy, tourism)
132 6%
Other Social infrastructure 49 2%Population Policies and Reproductive Health 24 1%Water Supply and Sanitation 45 2%Other (admin., promotion development awareness, refugeees in donor countries)
3 0%
FRAGILE / CONFLICT*Fragile 1,181 78%Other 340 22%
EU Institutions
-
200
400
600
800
1,000
1,200
EU World Bank Group
UN Funds and Programmes*
Other UN Regional Development
Banks
Other multilaterals
Core Non-Core
Total use of the multilateral system in 2010 Core Non-CoreEU - 191 World Bank Group - 334 UN Funds and Programmes* 113 1,020 of which:
UNDP - 374 WFP - 283 UNICEF - 133 UNFPA - 17 UNHCR - 110 UNRWA 113 71
Other UN 9 436 of which:
FAO 0 179 IFAD - 32 ILO - 18 OHCHR 3 1 UNDPKO - - UNECE 0 - UNESCO - 9 UN - 20 UNOCHA n/a 20 WHO - 46
Regional Development Banks 55 107 of which:
African Development Bank - - Asian Development Bank - 32 Inter-American Development Bank - -
Other multilaterals 75 189 Total 251 2,277
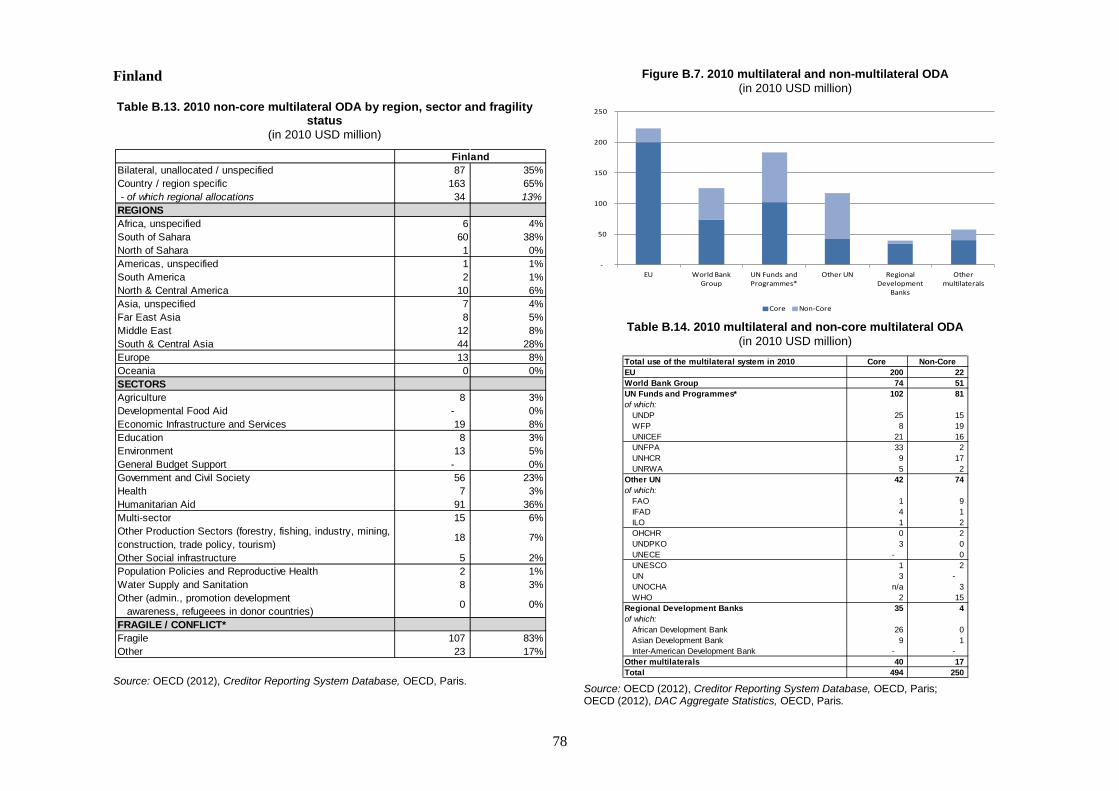
78
Finland
Table B.13. 2010 non-core multilateral ODA by region, sector and fragility status
(in 2010 USD million)
Source: OECD (2012), Creditor Reporting System Database, OECD, Paris.
Figure B.7. 2010 multilateral and non-multilateral ODA (in 2010 USD million)
Table B.14. 2010 multilateral and non-core multilateral ODA
(in 2010 USD million)
Source: OECD (2012), Creditor Reporting System Database, OECD, Paris; OECD (2012), DAC Aggregate Statistics, OECD, Paris.
Bilateral, unallocated / unspecified 87 35%Country / region specific 163 65% - of which regional allocations 34 13%REGIONSAfrica, unspecified 6 4%South of Sahara 60 38%North of Sahara 1 0%Americas, unspecified 1 1%South America 2 1%North & Central America 10 6%Asia, unspecified 7 4%Far East Asia 8 5%Middle East 12 8%South & Central Asia 44 28%Europe 13 8%Oceania 0 0%SECTORSAgriculture 8 3%Developmental Food Aid - 0%Economic Infrastructure and Services 19 8%Education 8 3%Environment 13 5%General Budget Support - 0%Government and Civil Society 56 23%Health 7 3%Humanitarian Aid 91 36%Multi-sector 15 6%Other Production Sectors (forestry, fishing, industry, mining, construction, trade policy, tourism)
18 7%
Other Social infrastructure 5 2%Population Policies and Reproductive Health 2 1%Water Supply and Sanitation 8 3%Other (admin., promotion development awareness, refugeees in donor countries)
0 0%
FRAGILE / CONFLICT*Fragile 107 83%Other 23 17%
Finland
-
50
100
150
200
250
EU World Bank Group
UN Funds and Programmes*
Other UN Regional Development
Banks
Other multilaterals
Core Non-Core
Total use of the multilateral system in 2010 Core Non-CoreEU 200 22 World Bank Group 74 51 UN Funds and Programmes* 102 81 of which:
UNDP 25 15 WFP 8 19 UNICEF 21 16 UNFPA 33 2 UNHCR 9 17 UNRWA 5 2
Other UN 42 74 of which:
FAO 1 9 IFAD 4 1 ILO 1 2 OHCHR 0 2 UNDPKO 3 0 UNECE - 0 UNESCO 1 2 UN 3 - UNOCHA n/a 3 WHO 2 15
Regional Development Banks 35 4 of which:
African Development Bank 26 0 Asian Development Bank 9 1 Inter-American Development Bank - -
Other multilaterals 40 17 Total 494 250

79
France
Table B.15. 2010 non-core multilateral ODA by region, sector and fragility status
(in 2010 USD million)
Source: OECD (2012), Creditor Reporting System Database, OECD, Paris.
Figure B. 8. 2010 multilateral and non-multilateral ODA (in 2010 USD million)
Table B.16. 2010 multilateral and non-core multilateral ODA
(in 2010 USD million)
Source: OECD (2012), Creditor Reporting System Database, OECD, Paris; OECD (2012), DAC Aggregate Statistics, OECD, Paris.
Bilateral, unallocated / unspecified 1 4%Country / region specific 38 96% - of which regional allocations 7 18%REGIONSAfrica, unspecified 5 16%South of Sahara 19 59%North of Sahara 0 0%Americas, unspecified 0 0%South America 0 0%North & Central America 2 7%Asia, unspecified 0 0%Far East Asia 0 0%Middle East 5 14%South & Central Asia 1 3%Europe 5 16%Oceania 0 0%SECTORSAgriculture - 0%Developmental Food Aid 22 56%Economic Infrastructure and Services 5 13%Education - 0%Environment 0 0%General Budget Support - 0%Government and Civil Society 5 12%Health - 0%Humanitarian Aid 0 1%Multi-sector 3 7%Other Production Sectors (forestry, fishing, industry, mining, construction, trade policy, tourism)
1 3%
Other Social infrastructure 3 7%Population Policies and Reproductive Health - 0%Water Supply and Sanitation - 0%Other (admin., promotion development awareness, refugeees in donor countries)
0 0%
FRAGILE / CONFLICT*Fragile 21 69%Other 9 31%
France
-
500
1,000
1,500
2,000
2,500
3,000
EU World Bank Group
UN Funds and Programmes*
Other UN Regional Development
Banks
Other multilaterals
Core Non-Core
Total use of the multilateral system in 2010 Core Non-CoreEU 2,661 5 World Bank Group 872 - UN Funds and Programmes* 66 26 of which:
UNDP 24 3 WFP - 17 UNICEF 13 2 UNFPA 3 - UNHCR 20 - UNRWA 7 3
Other UN 189 4 of which:
FAO 15 - IFAD 15 - ILO 14 3 OHCHR - - UNDPKO 32 - UNECE - - UNESCO 14 - UN 17 - UNOCHA n/a - WHO 30 -
Regional Development Banks 210 3 of which:
African Development Bank 175 3 Asian Development Bank 32 - Inter-American Development Bank 2 -
Other multilaterals 1,223 1 Total 5,220 39

80
Germany
Table B.17. 2010 non-core multilateral ODA by region, sector and fragility status
(in 2010 USD million)
Source: OECD (2012), Creditor Reporting System Database, OECD, Paris.
Figure B.9. 2010 multilateral and non-multilateral ODA (in 2010 USD million)
Table B.18. 2010 multilateral and non-core multilateral ODA
(in 2010 USD million)
Source: OECD (2012), Creditor Reporting System Database, OECD, Paris; OECD (2012), DAC Aggregate Statistics, OECD, Paris.
Bilateral, unallocated / unspecified 211 44%Country / region specific 269 56% - of which regional allocations 32 7%REGIONSAfrica, unspecified 8 3%South of Sahara 82 31%North of Sahara 11 4%Americas, unspecified 0 0%South America 2 1%North & Central America 7 3%Asia, unspecified 1 0%Far East Asia 6 2%Middle East 23 9%South & Central Asia 114 44%Europe 16 6%Oceania 0 0%SECTORSAgriculture 4 1%Developmental Food Aid 11 2%Economic Infrastructure and Services 126 26%Education 5 1%Environment 45 9%General Budget Support - 0%Government and Civil Society 145 30%Health 12 2%Humanitarian Aid 89 18%Multi-sector 16 3%Other Production Sectors (forestry, fishing, industry, mining, construction, trade policy, tourism)
8 2%
Other Social infrastructure 9 2%Population Policies and Reproductive Health 7 1%Water Supply and Sanitation 1 0%Other (admin., promotion development awareness, refugeees in donor countries)
0 0%
FRAGILE / CONFLICT*Fragile 215 91%Other 22 9%
Germany
-
500
1,000
1,500
2,000
2,500
3,000
EU World Bank Group
UN Funds and Programmes*
Other UN Regional Development
Banks
Other multilaterals
Core Non-Core
Total use of the multilateral system in 2010 Core Non-CoreEU 2,926 18 World Bank Group 763 166 UN Funds and Programmes* 110 148 of which:
UNDP 30 66 WFP 31 46 UNICEF 9 1 UNFPA 20 3 UNHCR 11 9 UNRWA 11 2
Other UN 261 42 of which:
FAO 21 10 IFAD 21 - ILO 19 7 OHCHR 3 0 UNDPKO 44 0 UNECE 0 0 UNESCO 18 1 UN 19 1 UNOCHA n/a - WHO 34 4
Regional Development Banks 299 7 of which:
African Development Bank 205 - Asian Development Bank 75 - Inter-American Development Bank - -
Other multilaterals 591 99 Total 4,950 480

81
Greece
Table B.19. 2010 non-core multilateral ODA by region, sector and fragility status
(in 2010 USD million)
Source: OECD (2012), Creditor Reporting System Database, OECD, Paris.
Figure B.10. 2010 multilateral and non-multilateral ODA (in 2010 USD million)
Table B.20. 2010 multilateral and non-core multilateral ODA
(in 2010 USD million)
Source: OECD (2012), Creditor Reporting System Database, OECD, Paris; OECD (2012), DAC Aggregate Statistics, OECD, Paris.
Bilateral, unallocated / unspecified 4 63%Country / region specific 2 37% - of which regional allocations 2 33%REGIONSAfrica, unspecified 0 0%South of Sahara 0 0%North of Sahara 0 0%Americas, unspecified 0 0%South America 0 0%North & Central America 2 70%Asia, unspecified 0 0%Far East Asia 0 0%Middle East 0 0%South & Central Asia 0 0%Europe 1 29%Oceania 0 0%SECTORSAgriculture - 0%Developmental Food Aid - 0%Economic Infrastructure and Services - 0%Education 0 0%Environment 4 65%General Budget Support - 0%Government and Civil Society - 0%Health - 0%Humanitarian Aid 1 12%Multi-sector 1 22%Other Production Sectors (forestry, fishing, industry, mining, construction, trade policy, tourism)
- 0%
Other Social infrastructure - 0%Population Policies and Reproductive Health - 0%Water Supply and Sanitation - 0%Other (admin., promotion development awareness, refugeees in donor countries)
- 0%
FRAGILE / CONFLICT*Fragile 0 97%Other 0 3%
Greece
-
50
100
150
200
250
300
EU World Bank Group
UN Funds and Programmes*
Other UN Regional Development
Banks
Other multilaterals
Core Non-Core
Total use of the multilateral system in 2010 Core Non-CoreEU 278 - World Bank Group - - UN Funds and Programmes* 1 0 of which:
UNDP - - WFP - 0 UNICEF 0 - UNFPA 0 - UNHCR 1 - UNRWA 0 -
Other UN 12 2 of which:
FAO 1 - IFAD - - ILO - - OHCHR - - UNDPKO 2 - UNECE 0 - UNESCO 2 - UN 2 - UNOCHA n/a - WHO 2 -
Regional Development Banks 1 1 of which:
African Development Bank - - Asian Development Bank - - Inter-American Development Bank - -
Other multilaterals 4 3 Total 296 6
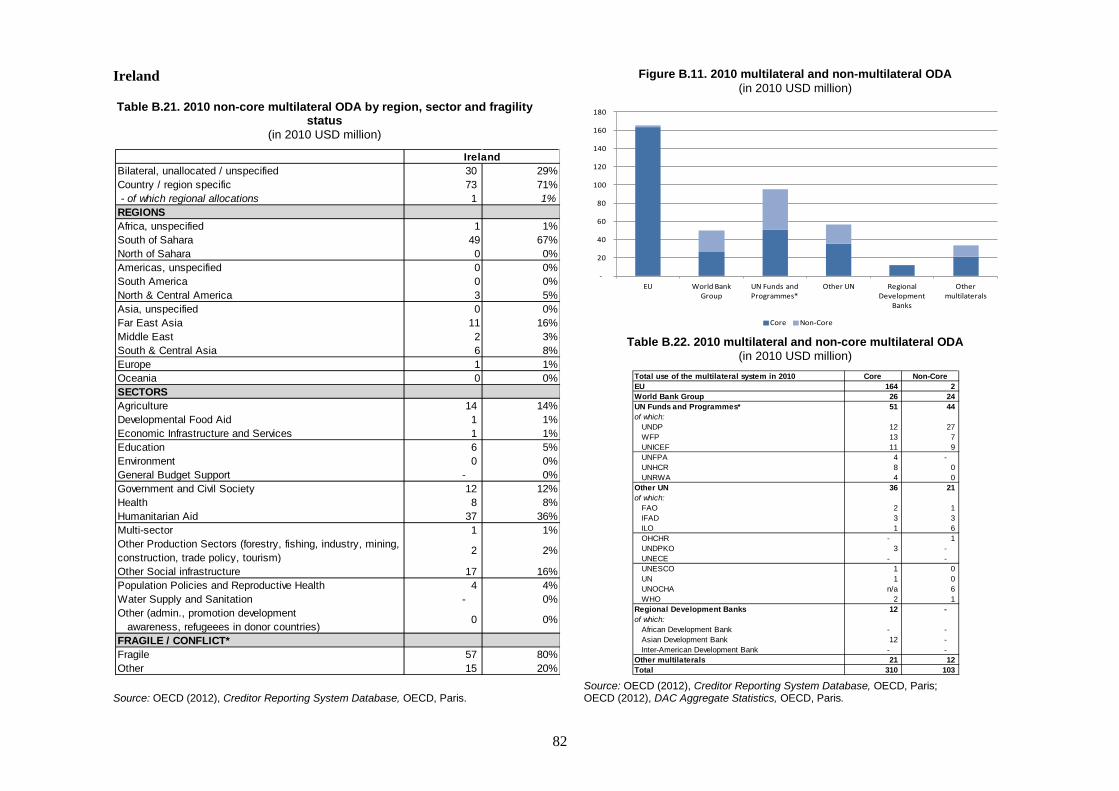
82
Ireland
Table B.21. 2010 non-core multilateral ODA by region, sector and fragility status
(in 2010 USD million)
Source: OECD (2012), Creditor Reporting System Database, OECD, Paris.
Figure B.11. 2010 multilateral and non-multilateral ODA (in 2010 USD million)
Table B.22. 2010 multilateral and non-core multilateral ODA
(in 2010 USD million)
Source: OECD (2012), Creditor Reporting System Database, OECD, Paris; OECD (2012), DAC Aggregate Statistics, OECD, Paris.
Bilateral, unallocated / unspecified 30 29%Country / region specific 73 71% - of which regional allocations 1 1%REGIONSAfrica, unspecified 1 1%South of Sahara 49 67%North of Sahara 0 0%Americas, unspecified 0 0%South America 0 0%North & Central America 3 5%Asia, unspecified 0 0%Far East Asia 11 16%Middle East 2 3%South & Central Asia 6 8%Europe 1 1%Oceania 0 0%SECTORSAgriculture 14 14%Developmental Food Aid 1 1%Economic Infrastructure and Services 1 1%Education 6 5%Environment 0 0%General Budget Support - 0%Government and Civil Society 12 12%Health 8 8%Humanitarian Aid 37 36%Multi-sector 1 1%Other Production Sectors (forestry, fishing, industry, mining, construction, trade policy, tourism)
2 2%
Other Social infrastructure 17 16%Population Policies and Reproductive Health 4 4%Water Supply and Sanitation - 0%Other (admin., promotion development awareness, refugeees in donor countries)
0 0%
FRAGILE / CONFLICT*Fragile 57 80%Other 15 20%
Ireland
-
20
40
60
80
100
120
140
160
180
EU World Bank Group
UN Funds and Programmes*
Other UN Regional Development
Banks
Other multilaterals
Core Non-Core
Total use of the multilateral system in 2010 Core Non-CoreEU 164 2 World Bank Group 26 24 UN Funds and Programmes* 51 44 of which:
UNDP 12 27 WFP 13 7 UNICEF 11 9 UNFPA 4 - UNHCR 8 0 UNRWA 4 0
Other UN 36 21 of which:
FAO 2 1 IFAD 3 3 ILO 1 6 OHCHR - 1 UNDPKO 3 - UNECE - - UNESCO 1 0 UN 1 0 UNOCHA n/a 6 WHO 2 1
Regional Development Banks 12 - of which:
African Development Bank - - Asian Development Bank 12 - Inter-American Development Bank - -
Other multilaterals 21 12 Total 310 103
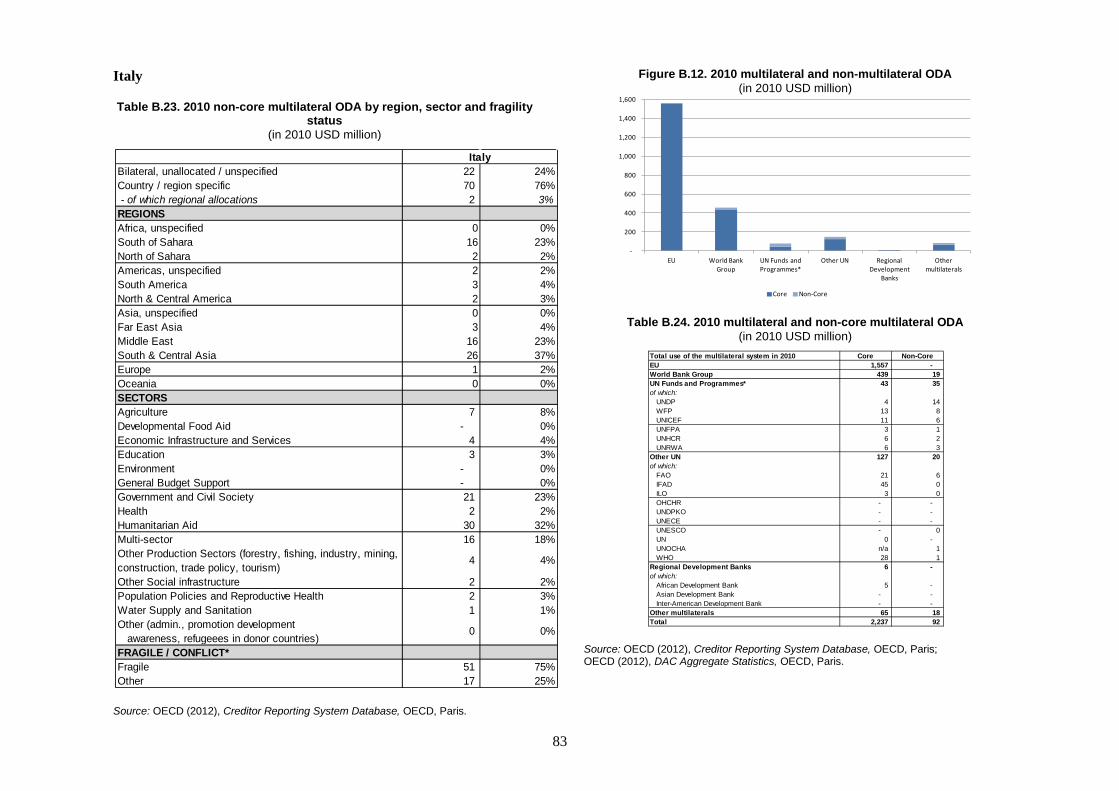
83
Italy
Table B.23. 2010 non-core multilateral ODA by region, sector and fragility status
(in 2010 USD million)
Source: OECD (2012), Creditor Reporting System Database, OECD, Paris.
Figure B.12. 2010 multilateral and non-multilateral ODA (in 2010 USD million)
Table B.24. 2010 multilateral and non-core multilateral ODA (in 2010 USD million)
Source: OECD (2012), Creditor Reporting System Database, OECD, Paris; OECD (2012), DAC Aggregate Statistics, OECD, Paris.
Bilateral, unallocated / unspecified 22 24%Country / region specific 70 76% - of which regional allocations 2 3%REGIONSAfrica, unspecified 0 0%South of Sahara 16 23%North of Sahara 2 2%Americas, unspecified 2 2%South America 3 4%North & Central America 2 3%Asia, unspecified 0 0%Far East Asia 3 4%Middle East 16 23%South & Central Asia 26 37%Europe 1 2%Oceania 0 0%SECTORSAgriculture 7 8%Developmental Food Aid - 0%Economic Infrastructure and Services 4 4%Education 3 3%Environment - 0%General Budget Support - 0%Government and Civil Society 21 23%Health 2 2%Humanitarian Aid 30 32%Multi-sector 16 18%Other Production Sectors (forestry, fishing, industry, mining, construction, trade policy, tourism)
4 4%
Other Social infrastructure 2 2%Population Policies and Reproductive Health 2 3%Water Supply and Sanitation 1 1%Other (admin., promotion development awareness, refugeees in donor countries)
0 0%
FRAGILE / CONFLICT*Fragile 51 75%Other 17 25%
Italy
-
200
400
600
800
1,000
1,200
1,400
1,600
EU World Bank Group
UN Funds and Programmes*
Other UN Regional Development
Banks
Other multilaterals
Core Non-Core
Total use of the multilateral system in 2010 Core Non-CoreEU 1,557 - World Bank Group 439 19 UN Funds and Programmes* 43 35 of which:
UNDP 4 14 WFP 13 8 UNICEF 11 6 UNFPA 3 1 UNHCR 6 2 UNRWA 6 3
Other UN 127 20 of which:
FAO 21 6 IFAD 45 0 ILO 3 0 OHCHR - - UNDPKO - - UNECE - - UNESCO - 0 UN 0 - UNOCHA n/a 1 WHO 28 1
Regional Development Banks 6 - of which:
African Development Bank 5 - Asian Development Bank - - Inter-American Development Bank - -
Other multilaterals 65 18 Total 2,237 92

84
Japan
Table B.25. 2010 non-core multilateral ODA by region, sector and fragility status
(in 2010 USD million)
Source: OECD (2012), Creditor Reporting System Database, OECD, Paris.
Figure B.13. 2010 multilateral and non-multilateral ODA (in 2010 USD million)
Table B.26. 2010 multilateral and non-core multilateral ODA
(in 2010 USD million)
Source: OECD (2012), Creditor Reporting System Database, OECD, Paris; OECD (2012), DAC Aggregate Statistics, OECD, Paris.
Bilateral, unallocated / unspecified 45 4%Country / region specific 1,206 96% - of which regional allocations 70 6%REGIONSAfrica, unspecified 46 4%South of Sahara 295 26%North of Sahara 0 0%Americas, unspecified 0 0%South America 0 0%North & Central America 49 4%Asia, unspecified 20 2%Far East Asia 8 1%Middle East 35 3%South & Central Asia 741 64%Europe 1 0%Oceania 11 1%SECTORSAgriculture 49 4%Developmental Food Aid 215 17%Economic Infrastructure and Services 27 2%Education 68 5%Environment 2 0%General Budget Support - 0%Government and Civil Society 388 31%Health 90 7%Humanitarian Aid 346 28%Multi-sector 41 3%Other Production Sectors (forestry, fishing, industry, mining, construction, trade policy, tourism)
5 0%
Other Social infrastructure 19 1%Population Policies and Reproductive Health 1 0%Water Supply and Sanitation 1 0%Other (admin., promotion development awareness, refugeees in donor countries)
- 0%
FRAGILE / CONFLICT*Fragile 1,104 97%Other 32 3%
Japan
-
200
400
600
800
1,000
1,200
1,400
1,600
1,800
2,000
World Bank Group UN Funds and Programmes*
Other UN Regional Development Banks
Other multilaterals
Core Non-Core
Total use of the multilateral system in 2010 Core Non-CoreEU - - World Bank Group 1,931 - UN Funds and Programmes* 159 1,005 of which:
UNDP 75 331 WFP 7 295 UNICEF 16 197 UNFPA 26 2 UNHCR 16 131 UNRWA 18 7
Other UN 359 125 of which:
FAO 42 37 IFAD - - ILO 37 - OHCHR 0 - UNDPKO 67 - UNECE - - UNESCO 26 26 UN 35 7 UNOCHA n/a 3 WHO 59 7
Regional Development Banks 924 24 of which:
African Development Bank 182 24 Asian Development Bank 719 - Inter-American Development Bank 23 -
Other multilaterals 311 98 Total 3,684 1,251

85
Korea
Table B.27. 2010 non-core multilateral ODA by region, sector and fragility status
(in 2010 USD million)
Source: OECD (2012), Creditor Reporting System Database, OECD, Paris.
Figure B.14. 2010 multilateral and non-multilateral ODA (in 2010 USD million)
Table B.28. 2010 multilateral and non-core multilateral ODA
(in 2010 USD million)
Source: OECD (2012), Creditor Reporting System Database, OECD, Paris; OECD (2012), DAC Aggregate Statistics, OECD, Paris.
Bilateral, unallocated / unspecified 11 25%Country / region specific 34 75% - of which regional allocations 29 65%REGIONSAfrica, unspecified 7 30%South of Sahara 12 49%North of Sahara 0 0%Americas, unspecified 0 0%South America 0 1%North & Central America 1 3%Asia, unspecified 5 22%Far East Asia 0 2%Middle East 0 1%South & Central Asia 2 7%Europe 4 16%Oceania 2 9%SECTORSAgriculture 0 0%Developmental Food Aid - 0%Economic Infrastructure and Services - 0%Education 1 2%Environment 0 0%General Budget Support - 0%Government and Civil Society 1 3%Health 4 8%Humanitarian Aid 5 12%Multi-sector 25 56%Other Production Sectors (forestry, fishing, industry, mining, construction, trade policy, tourism)
- 0%
Other Social infrastructure 1 3%Population Policies and Reproductive Health 0 1%Water Supply and Sanitation - 0%Other (admin., promotion development awareness, refugeees in donor countries)
7 15%
FRAGILE / CONFLICT*Fragile 3 72%Other 1 28%
Korea
-
20
40
60
80
100
120
World Bank Group UN Funds and Programmes*
Other UN Regional Development Banks
Other multilaterals
Core Non-Core
Total use of the multilateral system in 2010 Core Non-CoreEU - - World Bank Group 111 2 UN Funds and Programmes* 11 14 of which:
UNDP 6 7 WFP 0 3 UNICEF 3 3 UNFPA 0 - UNHCR 3 1 UNRWA 0 0
Other UN 66 12 of which:
FAO 7 1 IFAD 2 0 ILO 5 2 OHCHR - 0 UNDPKO 10 - UNECE - - UNESCO 5 1 UN 6 0 UNOCHA n/a 0 WHO 11 5
Regional Development Banks 67 11 of which:
African Development Bank 14 7 Asian Development Bank 43 - Inter-American Development Bank 8 -
Other multilaterals 18 7 Total 273 45

86
Luxembourg
Table B.29. 2010 non-core multilateral ODA by region, sector and fragility status
(in 2010 USD million)
Source: OECD (2012), Creditor Reporting System Database, OECD, Paris.
Figure B.15. 2010 multilateral and non-multilateral ODA (in 2010 USD million)
Table B.30. 2010 multilateral and non-core multilateral ODA
(in 2010 USD million)
Source: OECD (2012), Creditor Reporting System Database, OECD, Paris; OECD (2012), DAC Aggregate Statistics, OECD, Paris.
Bilateral, unallocated / unspecified 41 47%Country / region specific 46 53% - of which regional allocations 8 9%REGIONSAfrica, unspecified 6 14%South of Sahara 19 47%North of Sahara 1 2%Americas, unspecified 0 0%South America 1 2%North & Central America 3 7%Asia, unspecified 0 0%Far East Asia 6 16%Middle East 2 5%South & Central Asia 5 12%Europe 4 9%Oceania 0 0%SECTORSAgriculture 2 2%Developmental Food Aid 1 2%Economic Infrastructure and Services 4 4%Education 5 6%Environment 2 2%General Budget Support - 0%Government and Civil Society 4 5%Health 15 17%Humanitarian Aid 21 24%Multi-sector 14 16%Other Production Sectors (forestry, fishing, industry, mining, construction, trade policy, tourism)
3 3%
Other Social infrastructure 1 1%Population Policies and Reproductive Health 14 16%Water Supply and Sanitation 1 1%Other (admin., promotion development awareness, refugeees in donor countries)
- 0%
FRAGILE / CONFLICT*Fragile 20 54%Other 18 46%
Luxembourg
-
10
20
30
40
50
60
70
80
90
EU World Bank Group UN Funds and Programmes*
Other UN Regional Development
Banks
Other multilaterals
Core Non-Core
Total use of the multilateral system in 2010 Core Non-CoreEU 36 3 World Bank Group 27 4 UN Funds and Programmes* 33 53 of which:
UNDP 11 16 WFP 5 12 UNICEF 7 5 UNFPA 8 8 UNHCR 2 8 UNRWA - 2
Other UN 28 24 of which:
FAO 0 3 IFAD 1 1 ILO - 2 OHCHR 0 - UNDPKO - - UNECE - - UNESCO 0 - UN - 0 UNOCHA n/a 0 WHO 11 13
Regional Development Banks 6 1 of which:
African Development Bank 0 - Asian Development Bank 3 - Inter-American Development Bank - -
Other multilaterals 11 3 Total 141 88
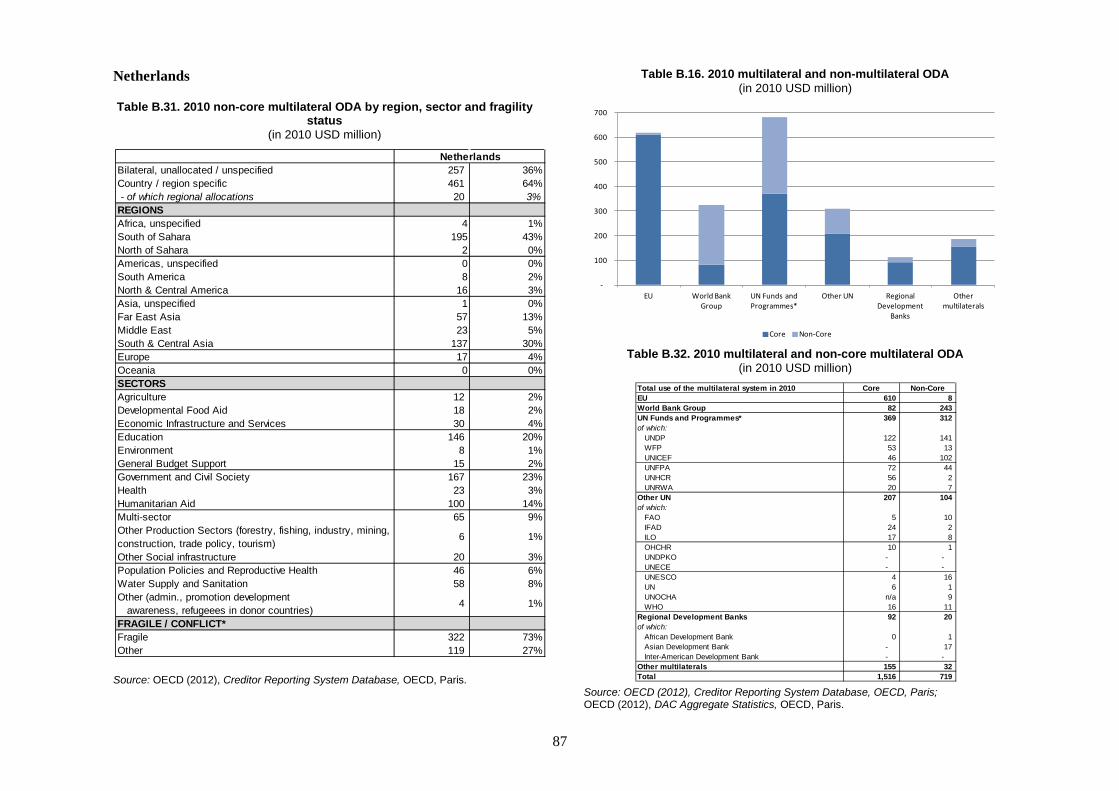
87
Netherlands
Table B.31. 2010 non-core multilateral ODA by region, sector and fragility status
(in 2010 USD million)
Source: OECD (2012), Creditor Reporting System Database, OECD, Paris.
Table B.16. 2010 multilateral and non-multilateral ODA (in 2010 USD million)
Table B.32. 2010 multilateral and non-core multilateral ODA
(in 2010 USD million)
Source: OECD (2012), Creditor Reporting System Database, OECD, Paris; OECD (2012), DAC Aggregate Statistics, OECD, Paris.
Bilateral, unallocated / unspecified 257 36%Country / region specific 461 64% - of which regional allocations 20 3%REGIONSAfrica, unspecified 4 1%South of Sahara 195 43%North of Sahara 2 0%Americas, unspecified 0 0%South America 8 2%North & Central America 16 3%Asia, unspecified 1 0%Far East Asia 57 13%Middle East 23 5%South & Central Asia 137 30%Europe 17 4%Oceania 0 0%SECTORSAgriculture 12 2%Developmental Food Aid 18 2%Economic Infrastructure and Services 30 4%Education 146 20%Environment 8 1%General Budget Support 15 2%Government and Civil Society 167 23%Health 23 3%Humanitarian Aid 100 14%Multi-sector 65 9%Other Production Sectors (forestry, fishing, industry, mining, construction, trade policy, tourism)
6 1%
Other Social infrastructure 20 3%Population Policies and Reproductive Health 46 6%Water Supply and Sanitation 58 8%Other (admin., promotion development awareness, refugeees in donor countries)
4 1%
FRAGILE / CONFLICT*Fragile 322 73%Other 119 27%
Netherlands
-
100
200
300
400
500
600
700
EU World Bank Group
UN Funds and Programmes*
Other UN Regional Development
Banks
Other multilaterals
Core Non-Core
Total use of the multilateral system in 2010 Core Non-CoreEU 610 8 World Bank Group 82 243 UN Funds and Programmes* 369 312 of which:
UNDP 122 141 WFP 53 13 UNICEF 46 102 UNFPA 72 44 UNHCR 56 2 UNRWA 20 7
Other UN 207 104 of which:
FAO 5 10 IFAD 24 2 ILO 17 8 OHCHR 10 1 UNDPKO - - UNECE - - UNESCO 4 16 UN 6 1 UNOCHA n/a 9 WHO 16 11
Regional Development Banks 92 20 of which:
African Development Bank 0 1 Asian Development Bank - 17 Inter-American Development Bank - -
Other multilaterals 155 32 Total 1,516 719

88
New Zealand
Table B.33. 2010 non-core multilateral aid by region, sector and fragility status
(in 2010 USD million)
Source: OECD (2012), Creditor Reporting System Database, OECD, Paris.
Figure B.17. 2010 multilateral and non-multilateral ODA (in 2010 USD million)
Table B.34. 2010 multilateral and non-core multilateral ODA
(in 2010 USD million)
Source: OECD (2012), Creditor Reporting System Database, OECD, Paris; OECD (2012), DAC Aggregate Statistics, OECD, Paris.
Bilateral, unallocated / unspecified 1 3%Country / region specific 30 97% - of which regional allocations 12 38%REGIONSAfrica, unspecified 0 0%South of Sahara 4 31%North of Sahara 0 0%Americas, unspecified 0 0%South America 1 4%North & Central America 1 5%Asia, unspecified 0 0%Far East Asia 6 39%Middle East 0 1%South & Central Asia 3 20%Europe 0 0%Oceania 16 107%SECTORSAgriculture 0 1%Developmental Food Aid - 0%Economic Infrastructure and Services 5 15%Education 2 8%Environment 0 0%General Budget Support - 0%Government and Civil Society 10 31%Health 3 8%Humanitarian Aid 6 18%Multi-sector 1 3%Other Production Sectors (forestry, fishing, industry, mining, construction, trade policy, tourism)
3 8%
Other Social infrastructure 0 1%Population Policies and Reproductive Health 2 7%Water Supply and Sanitation 0 1%Other (admin., promotion development awareness, refugeees in donor countries)
- 0%
FRAGILE / CONFLICT*Fragile 9 50%Other 9 50%
New Zealand
-
5
10
15
20
25
30
35
40
World Bank Group UN Funds and Programmes*
Other UN Regional Development Banks
Other multilaterals
Core Non-Core
Total use of the multilateral system in 2010 Core Non-CoreEU - - World Bank Group 12 6 UN Funds and Programmes* 20 14 of which:
UNDP 6 8 WFP - 2 UNICEF 4 4 UNFPA 4 - UNHCR 4 - UNRWA 1 -
Other UN 15 4 of which:
FAO 1 0 IFAD - - ILO 0 - OHCHR 2 - UNDPKO 1 - UNECE - - UNESCO 1 0 UN 1 - UNOCHA n/a 1 WHO 1 2
Regional Development Banks - 2 of which:
African Development Bank - - Asian Development Bank - 2 Inter-American Development Bank - -
Other multilaterals 24 5 Total 71 31

89
Norway
Table B.35. 2010 non-core multilateral aid by region, sector and fragility status
(in 2010 USD million)
Source: OECD (2012), Creditor Reporting System Database, OECD, Paris.
Figure B.18. 2010 multilateral and non-multilateral ODA (in 2010 USD million)
Table B.36. 2010 multilateral and non-core multilateral ODA
(in 2010 USD million)
Source: OECD (2012), Creditor Reporting System Database, OECD, Paris; OECD (2012), DAC Aggregate Statistics, OECD, Paris.
Bilateral, unallocated / unspecified 437 42%Country / region specific 598 58% - of which regional allocations 74 7%REGIONSAfrica, unspecified 48 9%South of Sahara 160 29%North of Sahara 0 0%Americas, unspecified 1 0%South America 35 6%North & Central America 58 11%Asia, unspecified 7 1%Far East Asia 40 7%Middle East 73 13%South & Central Asia 157 29%Europe 17 3%Oceania 0 0%SECTORSAgriculture 13 1%Developmental Food Aid 1 0%Economic Infrastructure and Services 40 4%Education 126 12%Environment 77 7%General Budget Support 60 6%Government and Civil Society 189 18%Health 22 2%Humanitarian Aid 123 12%Multi-sector 144 14%Other Production Sectors (forestry, fishing, industry, mining, construction, trade policy, tourism)
180 17%
Other Social infrastructure 16 2%Population Policies and Reproductive Health 17 2%Water Supply and Sanitation 28 3%Other (admin., promotion development awareness, refugeees in donor countries)
0 0%
FRAGILE / CONFLICT*Fragile 412 79%Other 112 21%
Norway
-
100
200
300
400
500
600
700
800
900
World Bank Group UN Funds and Programmes*
Other UN Regional Development Banks
Other multilaterals
Core Non-Core
Total use of the multilateral system in 2010 Core Non-CoreEU - 0 World Bank Group 147 320 UN Funds and Programmes* 359 460 of which:
UNDP 127 227 WFP 24 18 UNICEF 74 144 UNFPA 55 19 UNHCR 54 26 UNRWA 25 12
Other UN 218 149 of which:
FAO 2 20 IFAD 13 0 ILO 0 15 OHCHR 26 8 UNDPKO - 1 UNECE - 0 UNESCO 1 10 UN 2 2 UNOCHA n/a 20 WHO 42 13
Regional Development Banks 95 45 of which:
African Development Bank 83 40 Asian Development Bank 12 1 Inter-American Development Bank - -
Other multilaterals 200 61 Total 1,019 1,035
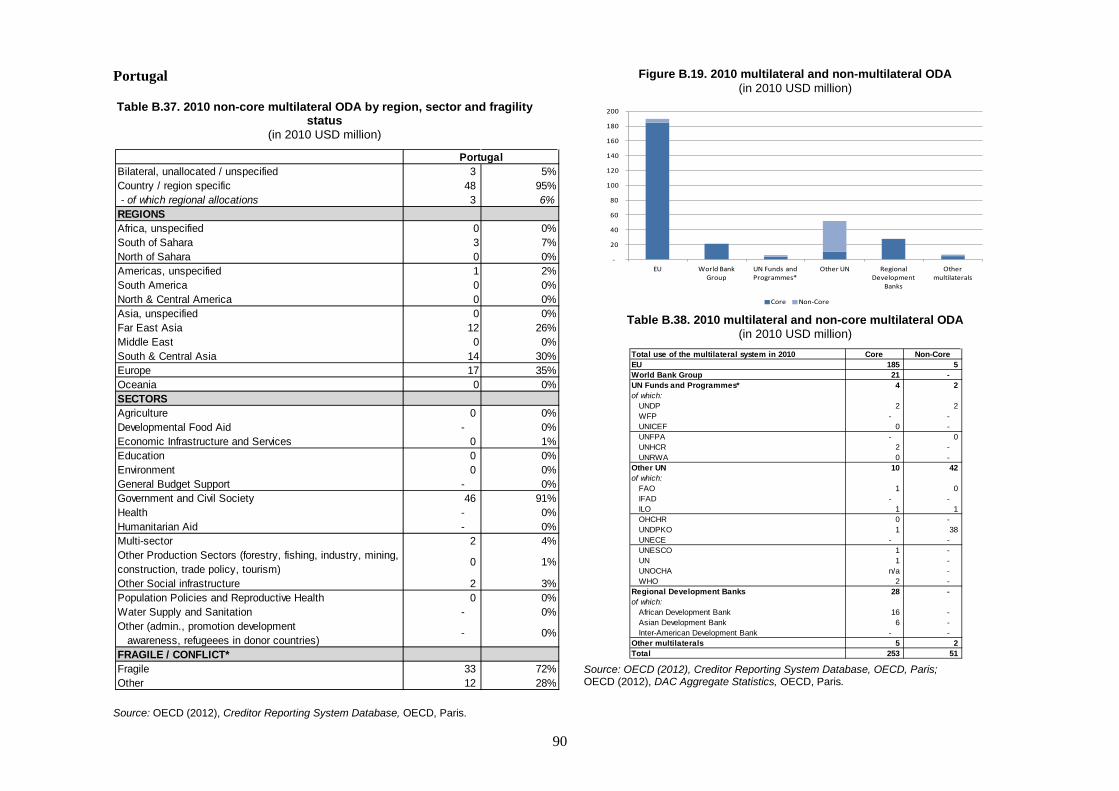
90
Portugal
Table B.37. 2010 non-core multilateral ODA by region, sector and fragility status
(in 2010 USD million)
Source: OECD (2012), Creditor Reporting System Database, OECD, Paris.
Figure B.19. 2010 multilateral and non-multilateral ODA (in 2010 USD million)
Table B.38. 2010 multilateral and non-core multilateral ODA
(in 2010 USD million)
Source: OECD (2012), Creditor Reporting System Database, OECD, Paris; OECD (2012), DAC Aggregate Statistics, OECD, Paris.
Bilateral, unallocated / unspecified 3 5%Country / region specific 48 95% - of which regional allocations 3 6%REGIONSAfrica, unspecified 0 0%South of Sahara 3 7%North of Sahara 0 0%Americas, unspecified 1 2%South America 0 0%North & Central America 0 0%Asia, unspecified 0 0%Far East Asia 12 26%Middle East 0 0%South & Central Asia 14 30%Europe 17 35%Oceania 0 0%SECTORSAgriculture 0 0%Developmental Food Aid - 0%Economic Infrastructure and Services 0 1%Education 0 0%Environment 0 0%General Budget Support - 0%Government and Civil Society 46 91%Health - 0%Humanitarian Aid - 0%Multi-sector 2 4%Other Production Sectors (forestry, fishing, industry, mining, construction, trade policy, tourism)
0 1%
Other Social infrastructure 2 3%Population Policies and Reproductive Health 0 0%Water Supply and Sanitation - 0%Other (admin., promotion development awareness, refugeees in donor countries)
- 0%
FRAGILE / CONFLICT*Fragile 33 72%Other 12 28%
Portugal
-
20
40
60
80
100
120
140
160
180
200
EU World Bank Group
UN Funds and Programmes*
Other UN Regional Development
Banks
Other multilaterals
Core Non-Core
Total use of the multilateral system in 2010 Core Non-CoreEU 185 5 World Bank Group 21 - UN Funds and Programmes* 4 2 of which:
UNDP 2 2 WFP - - UNICEF 0 - UNFPA - 0 UNHCR 2 - UNRWA 0 -
Other UN 10 42 of which:
FAO 1 0 IFAD - - ILO 1 1 OHCHR 0 - UNDPKO 1 38 UNECE - - UNESCO 1 - UN 1 - UNOCHA n/a - WHO 2 -
Regional Development Banks 28 - of which:
African Development Bank 16 - Asian Development Bank 6 - Inter-American Development Bank - -
Other multilaterals 5 2 Total 253 51
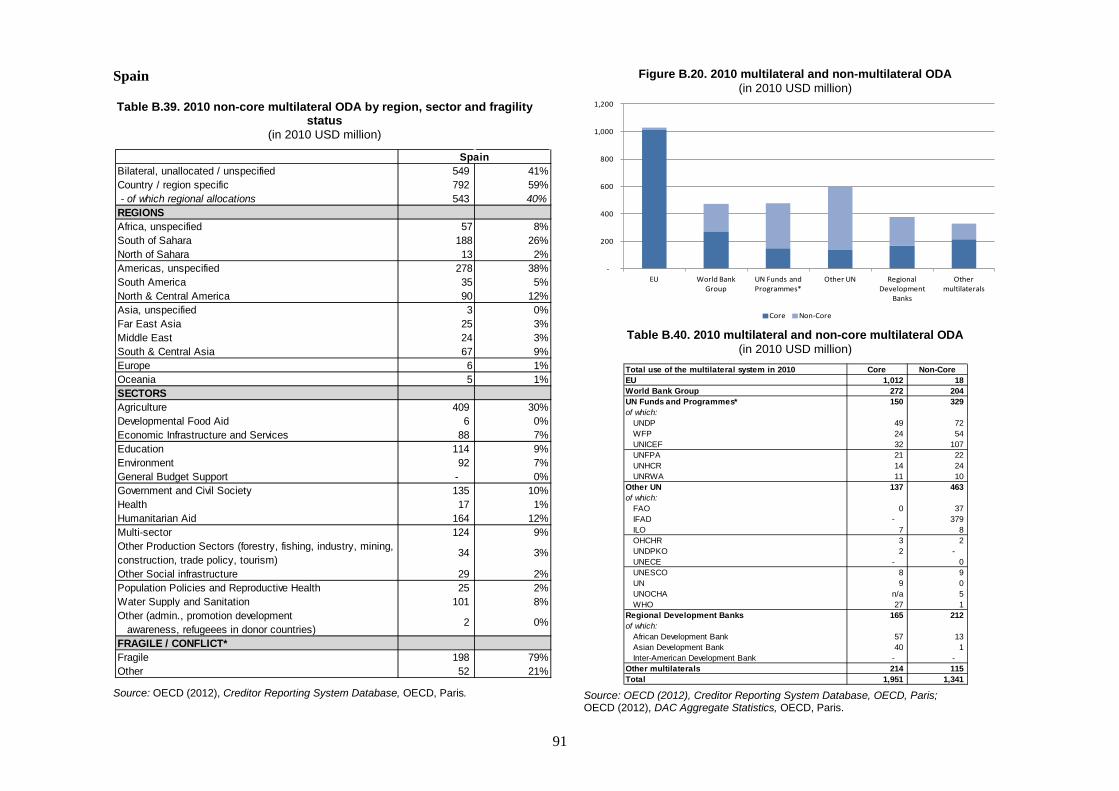
91
Spain
Table B.39. 2010 non-core multilateral ODA by region, sector and fragility status
(in 2010 USD million)
Source: OECD (2012), Creditor Reporting System Database, OECD, Paris.
Figure B.20. 2010 multilateral and non-multilateral ODA (in 2010 USD million)
Table B.40. 2010 multilateral and non-core multilateral ODA
(in 2010 USD million)
Source: OECD (2012), Creditor Reporting System Database, OECD, Paris; OECD (2012), DAC Aggregate Statistics, OECD, Paris.
Bilateral, unallocated / unspecified 549 41%Country / region specific 792 59% - of which regional allocations 543 40%REGIONSAfrica, unspecified 57 8%South of Sahara 188 26%North of Sahara 13 2%Americas, unspecified 278 38%South America 35 5%North & Central America 90 12%Asia, unspecified 3 0%Far East Asia 25 3%Middle East 24 3%South & Central Asia 67 9%Europe 6 1%Oceania 5 1%SECTORSAgriculture 409 30%Developmental Food Aid 6 0%Economic Infrastructure and Services 88 7%Education 114 9%Environment 92 7%General Budget Support - 0%Government and Civil Society 135 10%Health 17 1%Humanitarian Aid 164 12%Multi-sector 124 9%Other Production Sectors (forestry, fishing, industry, mining, construction, trade policy, tourism)
34 3%
Other Social infrastructure 29 2%Population Policies and Reproductive Health 25 2%Water Supply and Sanitation 101 8%Other (admin., promotion development awareness, refugeees in donor countries)
2 0%
FRAGILE / CONFLICT*Fragile 198 79%Other 52 21%
Spain
-
200
400
600
800
1,000
1,200
EU World Bank Group
UN Funds and Programmes*
Other UN Regional Development
Banks
Other multilaterals
Core Non-Core
Total use of the multilateral system in 2010 Core Non-CoreEU 1,012 18 World Bank Group 272 204 UN Funds and Programmes* 150 329 of which:
UNDP 49 72 WFP 24 54 UNICEF 32 107 UNFPA 21 22 UNHCR 14 24 UNRWA 11 10
Other UN 137 463 of which:
FAO 0 37 IFAD - 379 ILO 7 8 OHCHR 3 2 UNDPKO 2 - UNECE - 0 UNESCO 8 9 UN 9 0 UNOCHA n/a 5 WHO 27 1
Regional Development Banks 165 212 of which:
African Development Bank 57 13 Asian Development Bank 40 1 Inter-American Development Bank - -
Other multilaterals 214 115 Total 1,951 1,341
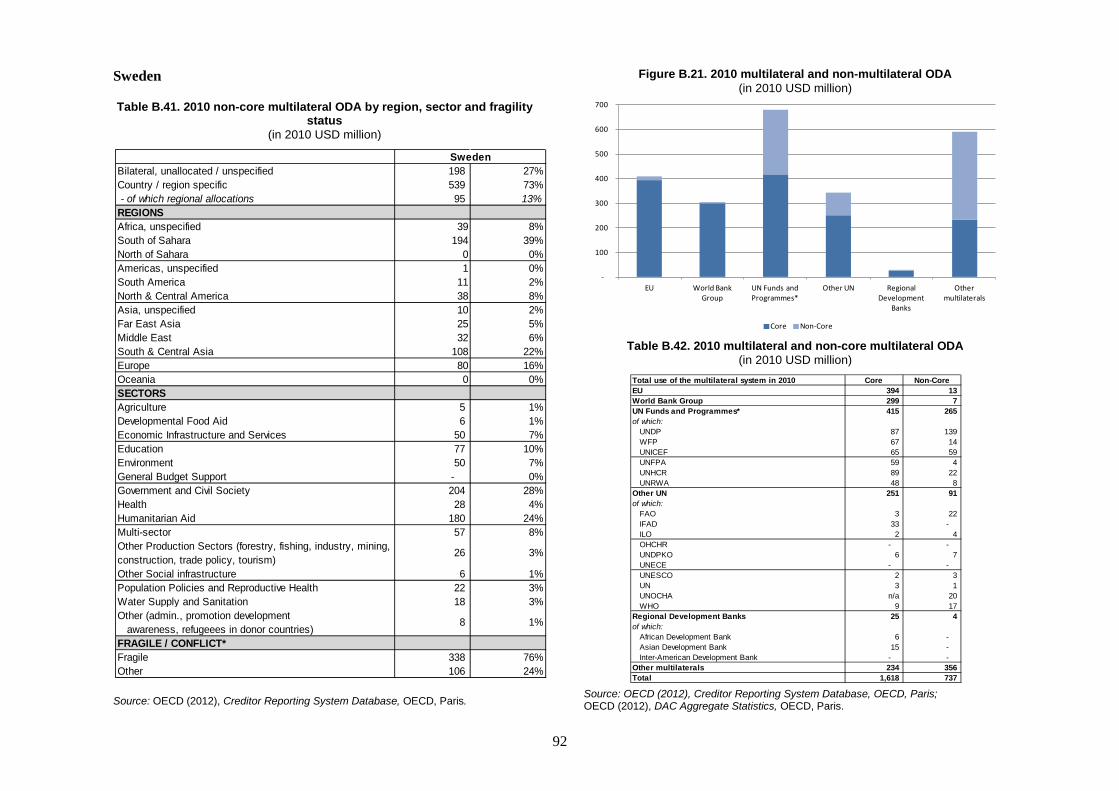
92
Sweden
Table B.41. 2010 non-core multilateral ODA by region, sector and fragility status
(in 2010 USD million)
Source: OECD (2012), Creditor Reporting System Database, OECD, Paris.
Figure B.21. 2010 multilateral and non-multilateral ODA (in 2010 USD million)
Table B.42. 2010 multilateral and non-core multilateral ODA
(in 2010 USD million)
Source: OECD (2012), Creditor Reporting System Database, OECD, Paris; OECD (2012), DAC Aggregate Statistics, OECD, Paris.
Bilateral, unallocated / unspecified 198 27%Country / region specific 539 73% - of which regional allocations 95 13%REGIONSAfrica, unspecified 39 8%South of Sahara 194 39%North of Sahara 0 0%Americas, unspecified 1 0%South America 11 2%North & Central America 38 8%Asia, unspecified 10 2%Far East Asia 25 5%Middle East 32 6%South & Central Asia 108 22%Europe 80 16%Oceania 0 0%SECTORSAgriculture 5 1%Developmental Food Aid 6 1%Economic Infrastructure and Services 50 7%Education 77 10%Environment 50 7%General Budget Support - 0%Government and Civil Society 204 28%Health 28 4%Humanitarian Aid 180 24%Multi-sector 57 8%Other Production Sectors (forestry, fishing, industry, mining, construction, trade policy, tourism)
26 3%
Other Social infrastructure 6 1%Population Policies and Reproductive Health 22 3%Water Supply and Sanitation 18 3%Other (admin., promotion development awareness, refugeees in donor countries)
8 1%
FRAGILE / CONFLICT*Fragile 338 76%Other 106 24%
Sweden
-
100
200
300
400
500
600
700
EU World Bank Group
UN Funds and Programmes*
Other UN Regional Development
Banks
Other multilaterals
Core Non-Core
Total use of the multilateral system in 2010 Core Non-CoreEU 394 13 World Bank Group 299 7 UN Funds and Programmes* 415 265 of which:
UNDP 87 139 WFP 67 14 UNICEF 65 59 UNFPA 59 4 UNHCR 89 22 UNRWA 48 8
Other UN 251 91 of which:
FAO 3 22 IFAD 33 - ILO 2 4 OHCHR - - UNDPKO 6 7 UNECE - - UNESCO 2 3 UN 3 1 UNOCHA n/a 20 WHO 9 17
Regional Development Banks 25 4 of which:
African Development Bank 6 - Asian Development Bank 15 - Inter-American Development Bank - -
Other multilaterals 234 356 Total 1,618 737
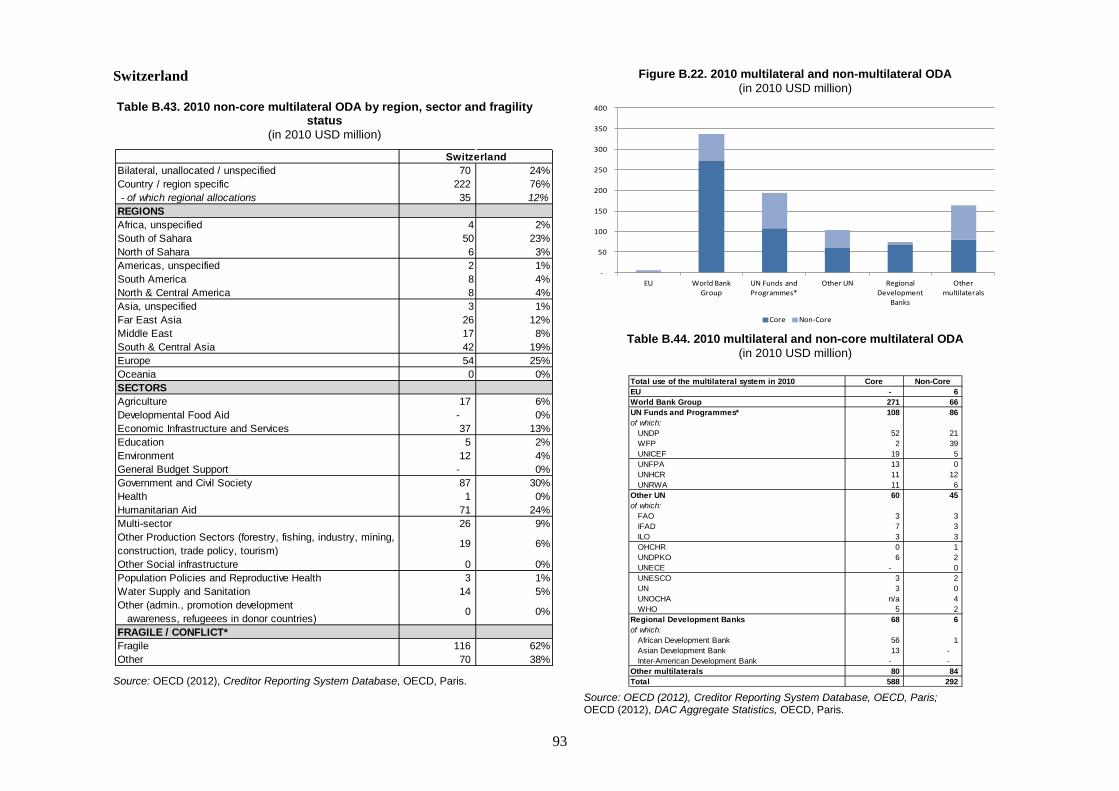
93
Switzerland
Table B.43. 2010 non-core multilateral ODA by region, sector and fragility status
(in 2010 USD million)
Source: OECD (2012), Creditor Reporting System Database, OECD, Paris.
Figure B.22. 2010 multilateral and non-multilateral ODA (in 2010 USD million)
Table B.44. 2010 multilateral and non-core multilateral ODA
(in 2010 USD million)
Source: OECD (2012), Creditor Reporting System Database, OECD, Paris; OECD (2012), DAC Aggregate Statistics, OECD, Paris.
Bilateral, unallocated / unspecified 70 24%Country / region specific 222 76% - of which regional allocations 35 12%REGIONSAfrica, unspecified 4 2%South of Sahara 50 23%North of Sahara 6 3%Americas, unspecified 2 1%South America 8 4%North & Central America 8 4%Asia, unspecified 3 1%Far East Asia 26 12%Middle East 17 8%South & Central Asia 42 19%Europe 54 25%Oceania 0 0%SECTORSAgriculture 17 6%Developmental Food Aid - 0%Economic Infrastructure and Services 37 13%Education 5 2%Environment 12 4%General Budget Support - 0%Government and Civil Society 87 30%Health 1 0%Humanitarian Aid 71 24%Multi-sector 26 9%Other Production Sectors (forestry, fishing, industry, mining, construction, trade policy, tourism)
19 6%
Other Social infrastructure 0 0%Population Policies and Reproductive Health 3 1%Water Supply and Sanitation 14 5%Other (admin., promotion development awareness, refugeees in donor countries)
0 0%
FRAGILE / CONFLICT*Fragile 116 62%Other 70 38%
Switzerland
-
50
100
150
200
250
300
350
400
EU World Bank Group
UN Funds and Programmes*
Other UN Regional Development
Banks
Other multilaterals
Core Non-Core
Total use of the multilateral system in 2010 Core Non-CoreEU - 6 World Bank Group 271 66 UN Funds and Programmes* 108 86 of which:
UNDP 52 21 WFP 2 39 UNICEF 19 5 UNFPA 13 0 UNHCR 11 12 UNRWA 11 6
Other UN 60 45 of which:
FAO 3 3 IFAD 7 3 ILO 3 3 OHCHR 0 1 UNDPKO 6 2 UNECE - 0 UNESCO 3 2 UN 3 0 UNOCHA n/a 4 WHO 5 2
Regional Development Banks 68 6 of which:
African Development Bank 56 1 Asian Development Bank 13 - Inter-American Development Bank - -
Other multilaterals 80 84 Total 588 292
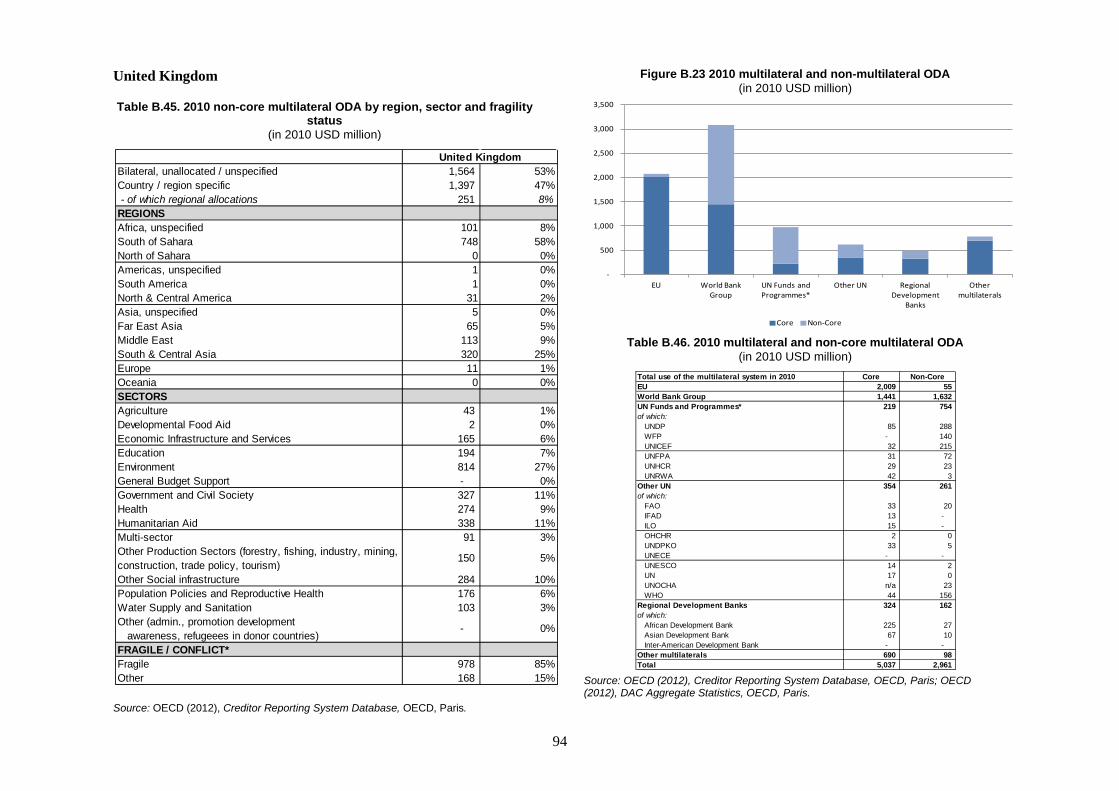
94
United Kingdom
Table B.45. 2010 non-core multilateral ODA by region, sector and fragility status
(in 2010 USD million)
Source: OECD (2012), Creditor Reporting System Database, OECD, Paris.
Figure B.23 2010 multilateral and non-multilateral ODA (in 2010 USD million)
Table B.46. 2010 multilateral and non-core multilateral ODA
(in 2010 USD million)
Source: OECD (2012), Creditor Reporting System Database, OECD, Paris; OECD (2012), DAC Aggregate Statistics, OECD, Paris.
Bilateral, unallocated / unspecified 1,564 53%Country / region specific 1,397 47% - of which regional allocations 251 8%REGIONSAfrica, unspecified 101 8%South of Sahara 748 58%North of Sahara 0 0%Americas, unspecified 1 0%South America 1 0%North & Central America 31 2%Asia, unspecified 5 0%Far East Asia 65 5%Middle East 113 9%South & Central Asia 320 25%Europe 11 1%Oceania 0 0%SECTORSAgriculture 43 1%Developmental Food Aid 2 0%Economic Infrastructure and Services 165 6%Education 194 7%Environment 814 27%General Budget Support - 0%Government and Civil Society 327 11%Health 274 9%Humanitarian Aid 338 11%Multi-sector 91 3%Other Production Sectors (forestry, fishing, industry, mining, construction, trade policy, tourism)
150 5%
Other Social infrastructure 284 10%Population Policies and Reproductive Health 176 6%Water Supply and Sanitation 103 3%Other (admin., promotion development awareness, refugeees in donor countries)
- 0%
FRAGILE / CONFLICT*Fragile 978 85%Other 168 15%
United Kingdom
-
500
1,000
1,500
2,000
2,500
3,000
3,500
EU World Bank Group
UN Funds and Programmes*
Other UN Regional Development
Banks
Other multilaterals
Core Non-Core
Total use of the multilateral system in 2010 Core Non-CoreEU 2,009 55 World Bank Group 1,441 1,632 UN Funds and Programmes* 219 754 of which:
UNDP 85 288 WFP - 140 UNICEF 32 215 UNFPA 31 72 UNHCR 29 23 UNRWA 42 3
Other UN 354 261 of which:
FAO 33 20 IFAD 13 - ILO 15 - OHCHR 2 0 UNDPKO 33 5 UNECE - - UNESCO 14 2 UN 17 0 UNOCHA n/a 23 WHO 44 156
Regional Development Banks 324 162 of which:
African Development Bank 225 27 Asian Development Bank 67 10 Inter-American Development Bank - -
Other multilaterals 690 98 Total 5,037 2,961

95
United States
Table B.47. 2010 non-core multilateral ODA by region, sector and fragility status
(in 2010 USD million)
Source: OECD (2012), Creditor Reporting System Database, OECD, Paris.
Figure B.24. 2010 multilateral and non-multilateral ODA (in 2010 USD million)
Table B.48. 2010 multilateral and non-core multilateral ODA
(in 2010 USD million)
Source: OECD (2012), Creditor Reporting System Database, OECD, Paris; OECD (2012), DAC Aggregate Statistics, OECD, Paris.
Bilateral, unallocated / unspecified 1,427 33%Country / region specific 2,956 67% - of which regional allocations 373 9%REGIONSAfrica, unspecified 0 0%South of Sahara 1564 53%North of Sahara 17 1%Americas, unspecified 8 0%South America 87 3%North & Central America 173 6%Asia, unspecified 18 1%Far East Asia 116 4%Middle East 112 4%South & Central Asia 795 27%Europe 65 2%Oceania 1 0%SECTORSAgriculture 173 4%Developmental Food Aid 108 2%Economic Infrastructure and Services 30 1%Education 55 1%Environment 408 9%General Budget Support - 0%Government and Civil Society 282 6%Health 258 6%Humanitarian Aid 2,689 61%Multi-sector 10 0%Other Production Sectors (forestry, fishing, industry, mining, construction, trade policy, tourism)
7 0%
Other Social infrastructure 144 3%Population Policies and Reproductive Health 99 2%Water Supply and Sanitation 2 0%Other (admin., promotion development awareness, refugeees in donor countries)
118 3%
FRAGILE / CONFLICT*Fragile 2,254 87%Other 329 13%
United States
-
500
1,000
1,500
2,000
2,500
3,000
3,500
World Bank Group UN Funds and Programmes*
Other UN Regional Development Banks
Other multilaterals
Core Non-Core
Total use of the multilateral system in 2010 Core Non-CoreEU - 0 World Bank Group 1,263 687 UN Funds and Programmes* 288 2,818 of which:
UNDP 101 91 WFP - 1,546 UNICEF 132 174 UNFPA 55 1 UNHCR - 709 UNRWA - 278
Other UN 660 429 of which:
FAO 57 101 IFAD 30 - ILO 50 51 OHCHR 7 2 UNDPKO 144 - UNECE - - UNESCO 50 1 UN 72 1 UNOCHA n/a 31 WHO 81 202
Regional Development Banks 389 7 of which:
African Development Bank 155 1 Asian Development Bank - - Inter-American Development Bank 234 -
Other multilaterals 1,176 442 Total 3,775 4,383

96
97
ANNEX C. GLOBAL BILATERAL DONOR FRAGMENTATION
The European Union (EU) has provided the following clarification: “The EU is unique among DAC members in that it plays a dual role in development assistance. Although the EU is a full DAC member and a donor of ODA in its own right, with its own development policy and own resources, it is often presented as a multilateral in DAC publications for statistical purposes. This report reflects this dichotomy.”
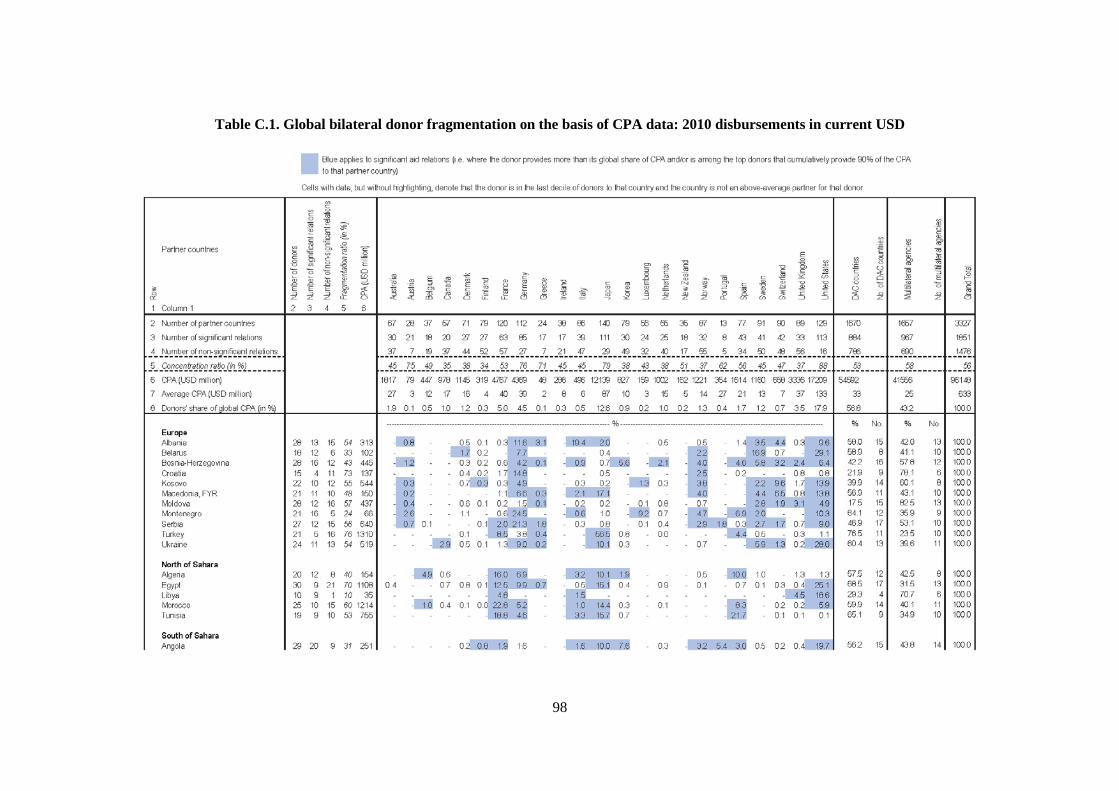
98
Table C.1. Global bilateral donor fragmentation on the basis of CPA data: 2010 disbursements in current USD
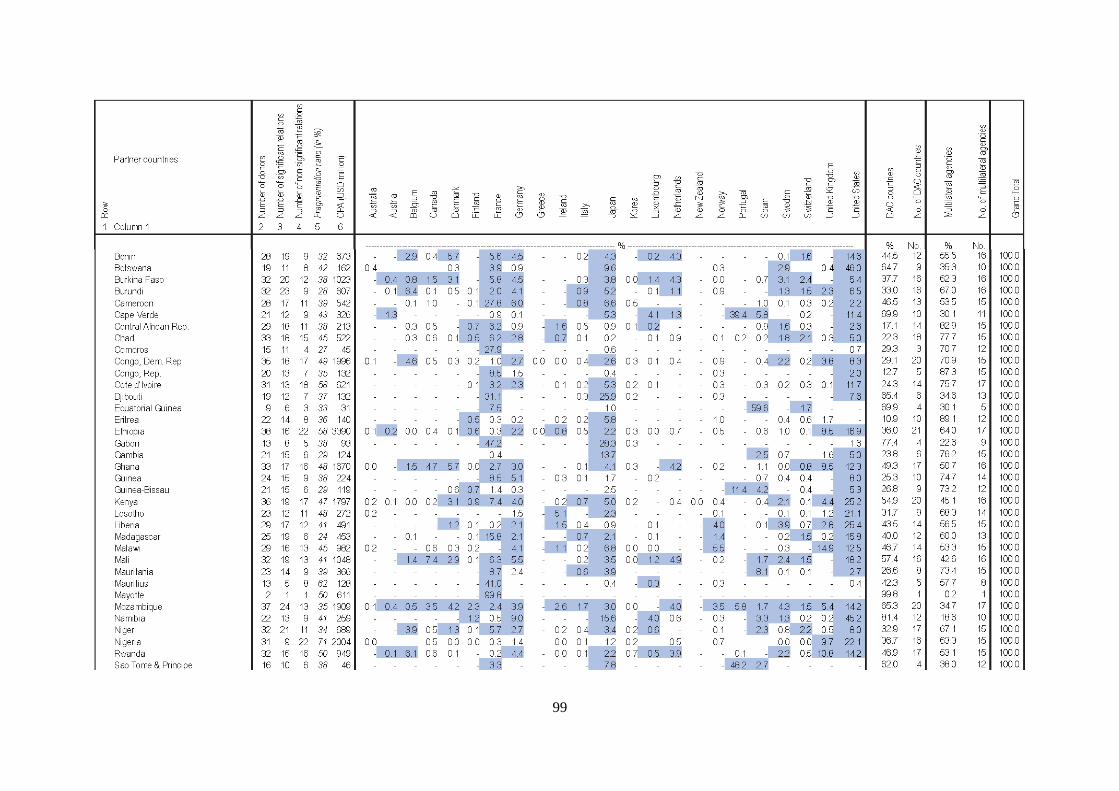
99
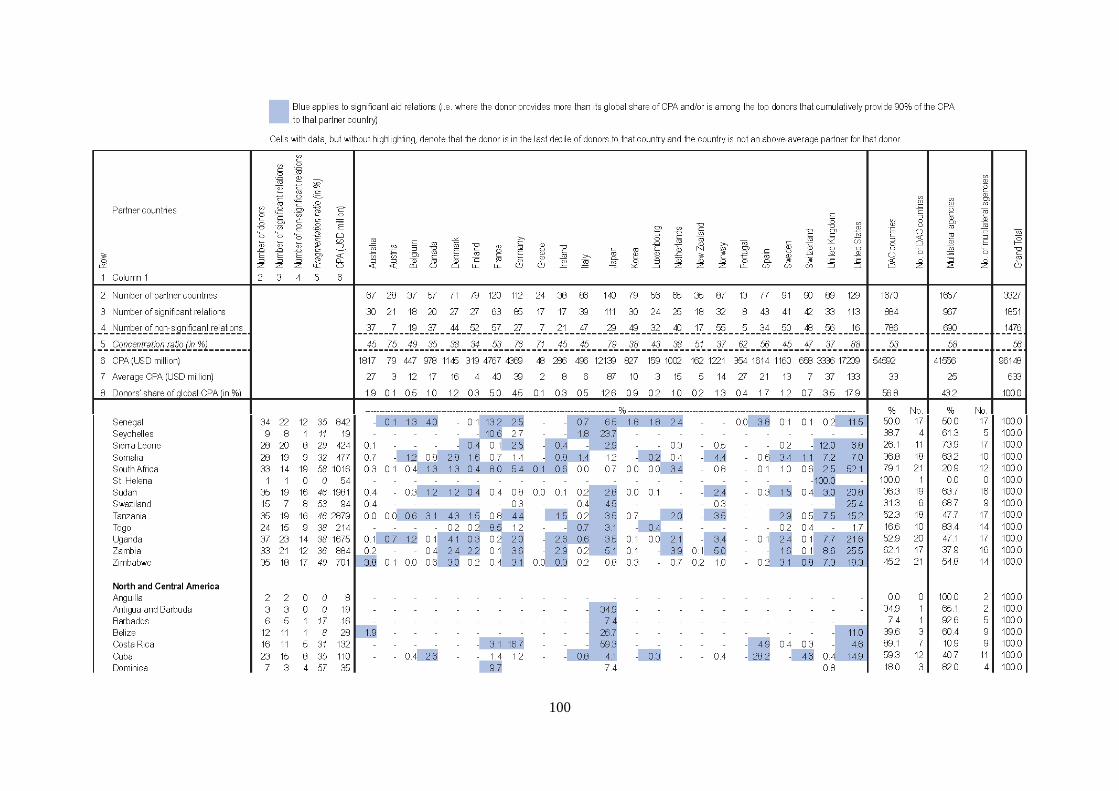
100

101
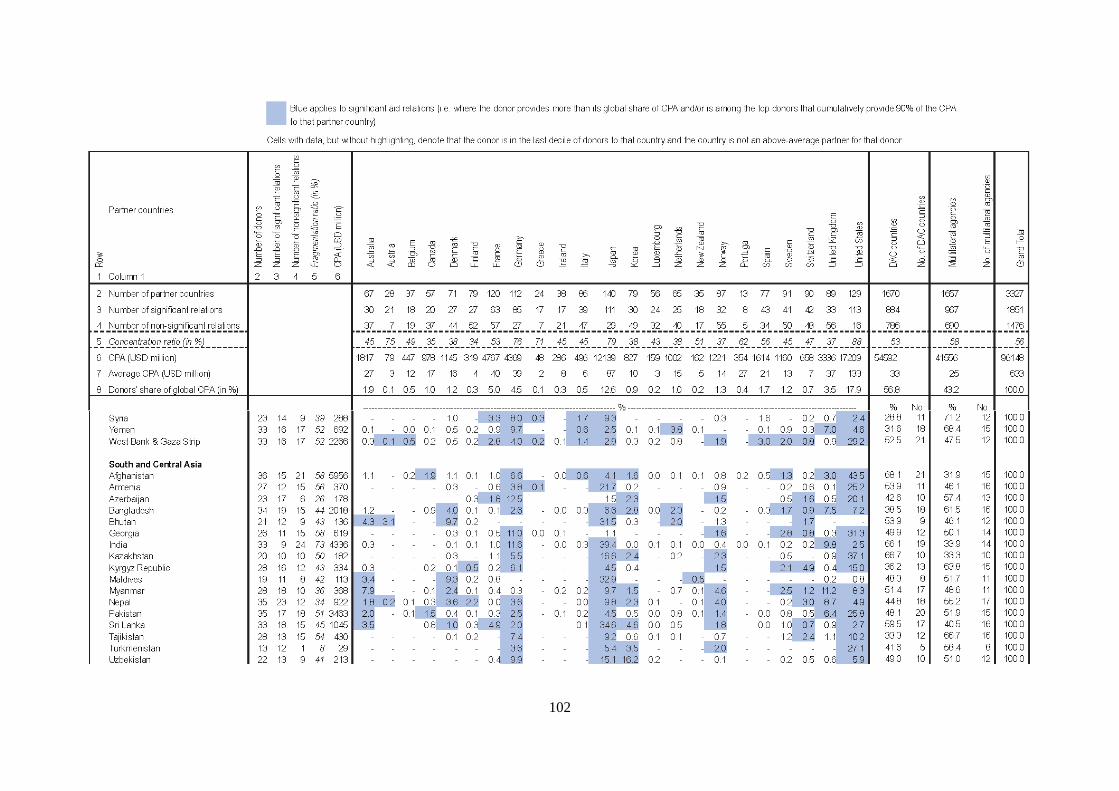
102

103
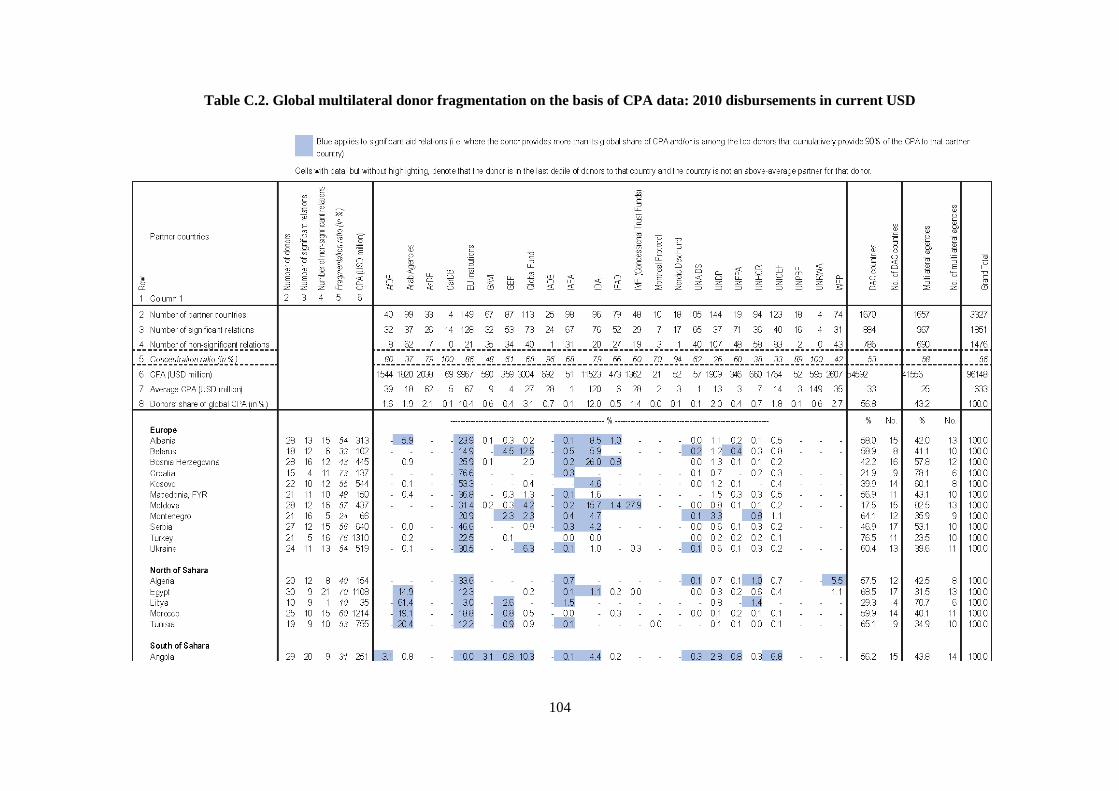
104
Table C.2. Global multilateral donor fragmentation on the basis of CPA data: 2010 disbursements in current USD

105
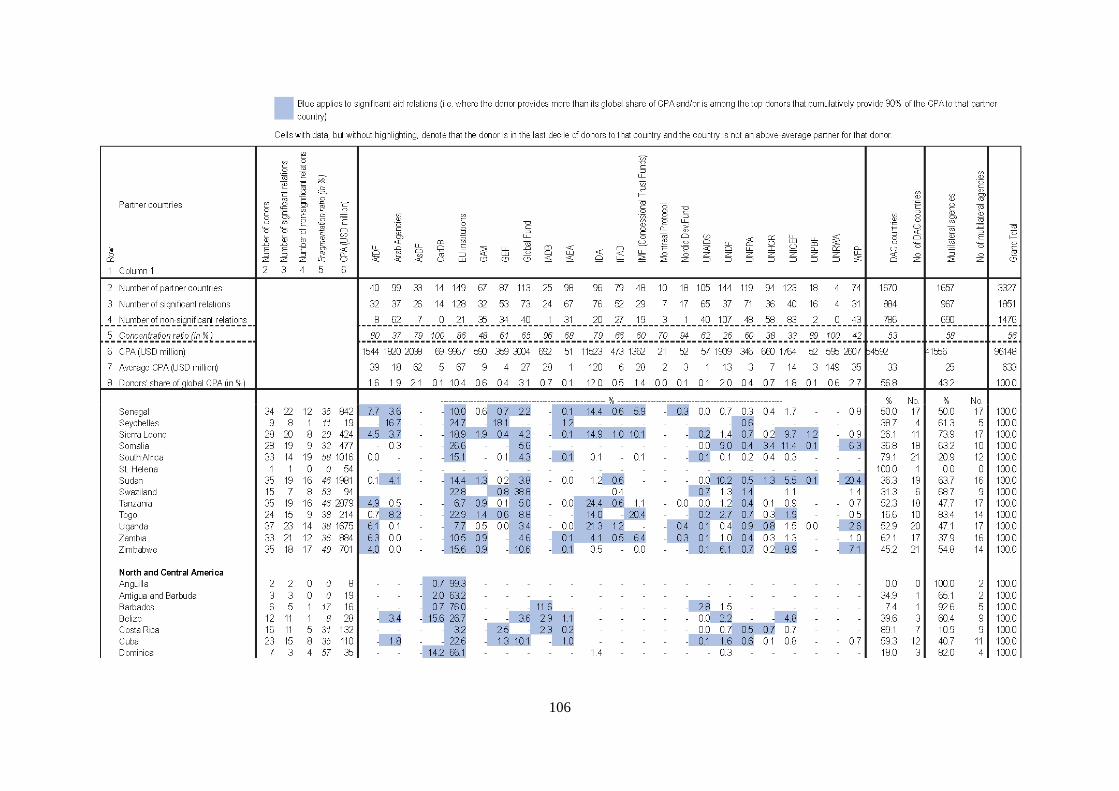
106
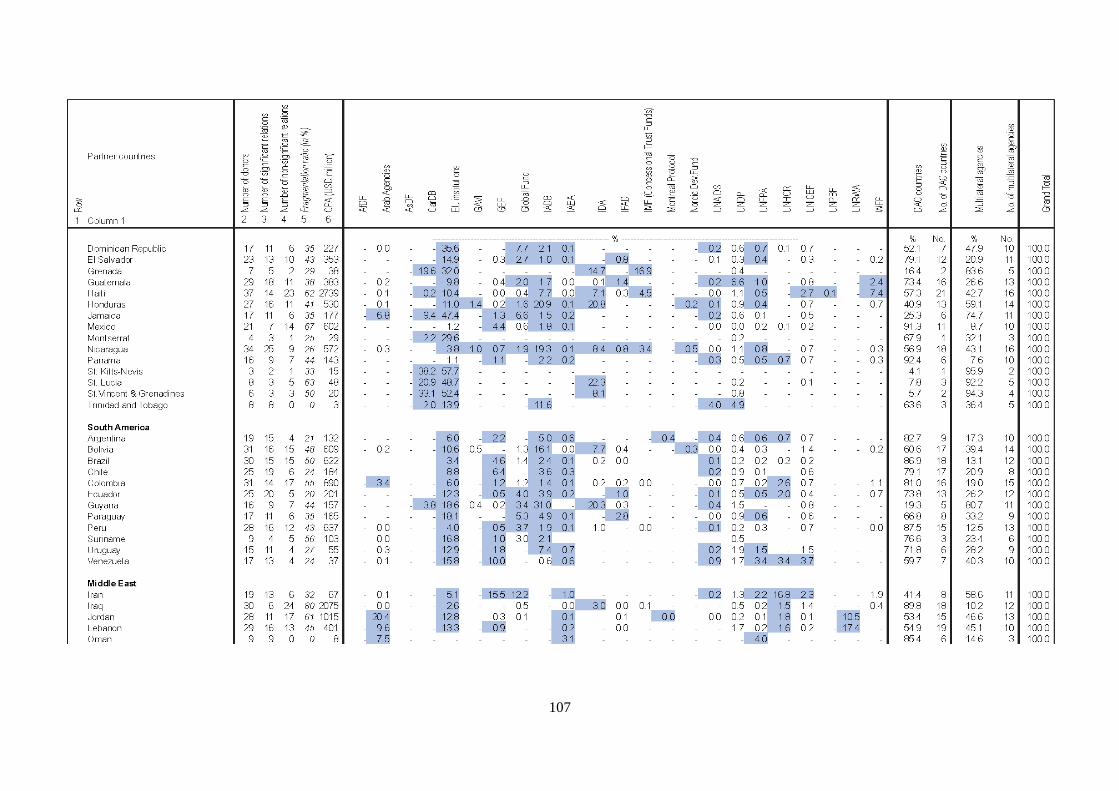
107
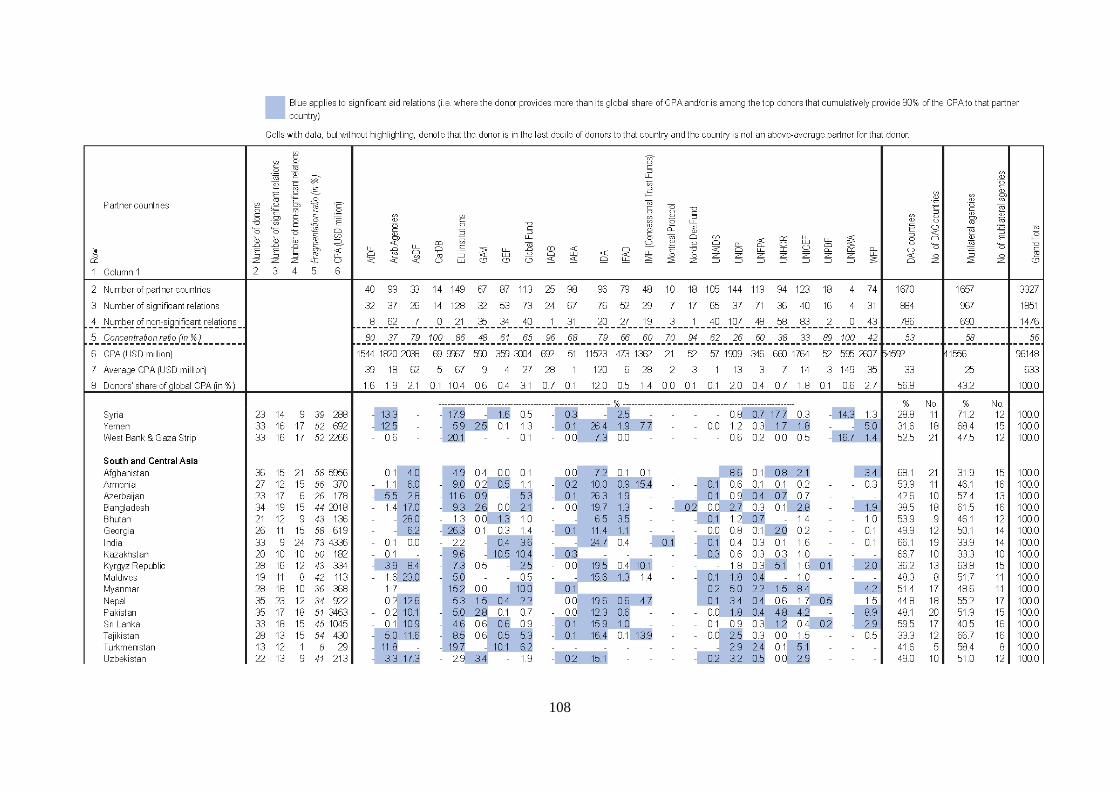
108

109

110

111
ANNEX D. FRAGMENTATION ON THE BASIS OF CPA
Tables D.1 and D.2 two consider country programmable aid (CPA). They look at the concentration of core resource outflows of multilateral agencies (Table D.1) and how the re-allocation of non-core resources from bilateral agencies to multilateral agencies affects fragmentation (Table D.2).
This data complement the analysis undertaken in Chapter 2 of this report, where the same comparison is made on the basis of CPA+ (which includes humanitarian aid).
Table D.1. Concentration of multilateral agencies (core resources)
*** The European Union (EU) has provided the following clarification: “The EU is unique among DAC members in that it plays a dual role in development assistance. Although the EU is a full DAC member and a donor of ODA in its own right, with its own development policy and own resources, it is often presented as a multilateral in DAC publications for statistical purposes. This report reflects this dichotomy.”
CPA*(USD 2010
million)
Share of Global CPA*
(in %)
No. of relations
No. of significant relations
Concentration ratio (in %)
Arab Agencies** 1 812 2.1 98 38 39EU institutions*** 8 113 9.5 149 123 83GAVI 590 0.7 67 33 49GEF 359 0.4 87 55 63Global Fund 2 997 3.5 113 72 64IDA 10 068 11.8 78 70 90IMF (Concessional Trust Funds) 1 346 1.6 37 31 84Montreal Protocol 21 0.02 10 7 70Nordic Dev. Fund 52 0.1 18 16 89Regional Development Bank Funds: 4 161 4.9 104 93 89
AfDF 1 515 1.8 38 31 82AsDF 1 921 2.2 27 24 89CarDB 69 0.1 14 14 100IaDB 656 0.8 25 24 96
UN agencies: 1 909 2.2 377 205 54UNDP 458 0.5 136 74 54UNFPA 282 0.3 117 76 65UNHCR 0 0.0 0 0UNICEF 740 0.9 120 51 43UNRWA 429 0.5 4 4 100WFP 0 0.0 0 0
Other UN: 611 0.7 296 201 68IAEA 51 0.06 98 67 68IFAD 462 0.54 79 51 65UNAIDS 51 0.06 103 68 66UN Peacebuilding Fund 47 0.06 16 15 94
Total multilaterals 32 040 37.4 1 434 944 66Total multilaterals excl. EU 23 926 27.9 1 285 821 64Total DAC countries 53 469 62.5 1 605 865 54Total DAC members incl. EU 61 582 71.9 1 754 988 56
* Note that this CPA analysis excludes regional allocations. ** Arab Agencies are BADEA, Isl. Dev Bank, OFID and Arab Fund (AFESD).
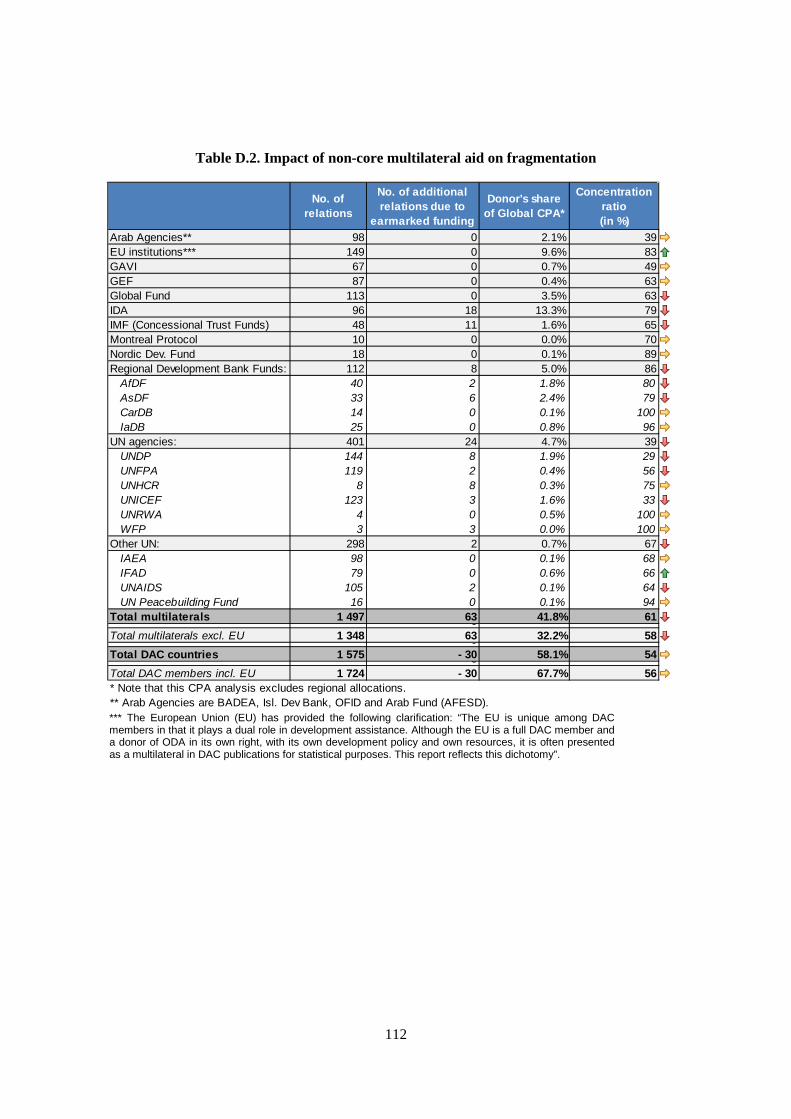
112
Table D.2. Impact of non-core multilateral aid on fragmentation
*** The European Union (EU) has provided the following clarification: “The EU is unique among DAC members in that it plays a dual role in development assistance. Although the EU is a full DAC member and a donor of ODA in its own right, with its own development policy and own resources, it is often presented as a multilateral in DAC publications for statistical purposes. This report reflects this dichotomy”.
No. of relations
No. of additional relations due to
earmarked funding
Donor's share of Global CPA*
Concentration ratio (in %)
Arab Agencies** 98 0 2.1% 39EU institutions*** 149 0 9.6% 83GAVI 67 0 0.7% 49GEF 87 0 0.4% 63Global Fund 113 0 3.5% 63IDA 96 18 13.3% 79IMF (Concessional Trust Funds) 48 11 1.6% 65Montreal Protocol 10 0 0.0% 70Nordic Dev. Fund 18 0 0.1% 89Regional Development Bank Funds: 112 8 5.0% 86
AfDF 40 2 1.8% 80AsDF 33 6 2.4% 79CarDB 14 0 0.1% 100IaDB 25 0 0.8% 96
UN agencies: 401 24 4.7% 39UNDP 144 8 1.9% 29UNFPA 119 2 0.4% 56UNHCR 8 8 0.3% 75UNICEF 123 3 1.6% 33UNRWA 4 0 0.5% 100WFP 3 3 0.0% 100
Other UN: 298 2 0.7% 67IAEA 98 0 0.1% 68IFAD 79 0 0.6% 66UNAIDS 105 2 0.1% 64UN Peacebuilding Fund 16 0 0.1% 94
Total multilaterals 1 497 63 41.8% 610Total multilaterals excl. EU 1 348 63 32.2% 580Total DAC countries 1 575 - 30 58.1% 540Total DAC members incl. EU 1 724 - 30 67.7% 56* Note that this CPA analysis excludes regional allocations. ** Arab Agencies are BADEA, Isl. Dev Bank, OFID and Arab Fund (AFESD).

113
ANNEX E. THE MOPAN COMMON APPROACH METHODOLOGY
The MOPAN Common Approach was designed to assess the organisational effectiveness of multilateral organisations (MOs). The objective of the approach is to generate relevant, credible information which MOPAN members can use to meet their domestic accountability requirements and fulfil their responsibilities and obligations as bilateral donors. The Common Approach also seeks to support dialogue between donor countries, MOs, and their direct clients and partners in order to improve organisational effectiveness and learning over time.
Box E.1. Organisational effectiveness according to MOPAN
MOPAN defines organisational effectiveness as the extent to which a multilateral organisation is organised to contribute to development results in the countries where it operates. It examines the organisation systems, practices and behaviours that MOPAN believes are important for aid effectiveness and that are likely to contribute to results at the country level.
Source: Mopan website, www.mopanonline.org.
In 2012, MOPAN tested an expanded assessment framework for evaluating multilateral organisations’ effectiveness and the results. The assessment of results focused on the degree to which progress was being made towards the organisations’ stated objectives and the relevance of its programming.
The MOPAN Common Approach is not meant as a formal evaluation. Instead, its aim is to respond to the information needs of a group of donors by collecting and producing information that would not otherwise be available about the organisational effectiveness of an MO. It does not compare multilateral organisations since their mandates and structures vary too much in scope and nature. Nonetheless, since MOPAN assessments are repeated at regular intervals, they can help determine the direction of an MO’s performance over time.
The following sections below cover the objective, survey structure, survey respondents, choice of MOs and partner countries, and finally, a brief description of the complementary document review.
Objective
Findings of the MOPAN Common Approach are used to:
• build a better understanding of the effectiveness of the multilateral organisation;
• support discussions between partner country governments, bilateral donors and MOs as part of an ongoing dialogue process to strengthen mutual accountability, in particular at country-level;
• inform the direction and discussion as well as to enhance participation in the governance of MOs (e.g. at an executive board or governing body meeting);
• strengthen relationships between bilateral donors, MOs, and countries where they operate;
• contribute to policy-making; and
• contribute to wider debates about MO effectiveness.

114
Survey structure and organisation
The instrument used to conduct the survey is a computer-aided web interviewing (CAWI) package. It is administered online and can be completed in English, French or Spanish. When it is not possible for respondents to complete the online survey, off-line methods are used. Intellectual service providers manage the survey process.
The main part of the survey consists of a series of closed questions based on the key performance indicators below. Respondents are asked to rate the performance of the multilateral organisation on a scale from 1 (very weak) to 6 (very strong). In addition, respondents are invited to respond to open-ended questions on what they consider to be the particular strengths and areas for improving the organisation.
The Common Approach framework examines four quadrants of performance, which includes the key performance indicators. In addition, it complements respondents’ survey data with a review of documents published by the multilateral organisations assessed. From 2012 it also includes consultation with the relevant staff in multilateral organisations. The key performance indicators (KPIs) listed in each category below are tailored to both the type of respondent and the type of multilateral organisation assessed.
Key performance indicators
Strategic management
• The MO executive management provides direction for the achievement of external result. • The MO’s corporate strategies and plans are focused on the achievement of result. • The MO maintains focus on the cross-cutting priorities identified in its strategic framework, and/or
based on its mandate and international commitments. • The MO’s work in countries and regions is focused on results.
Operational management
• The MO makes transparent and predictable resource allocations. • The MO’s financial management is linked to performance management. • The MO has policies and processes for financial accountability (audit, risk management, anti-
corruption). • Performance information on results is used by the MO to (a) revise and adjust policies and strategies:
(b) plan new interventions; (c) manage poorly performing programmes, projects or initiatives; (d) report to the executive committee and acted upon by responsible units.
• The MO manages HR using methods to improve organisational performance. • The MO’s programming processes are performance-oriented. • The MO delegates decision-making authority (to the regional- or country-level).
Relationship management
• The MO coordinates and directs its programming (including capacity building) at the country-level in support of agreed national plans or partner plans.
• The MO’s procedures take into account local conditions and capacities. • The MO adds value to policy dialogue with its partners. • The MO harmonises arrangements and procedures with other programming partners.
Knowledge management
• The MO consistently evaluates its delivery and external results. • The MO presents performance information on its effectiveness. • The MO encourages identification, documentation and dissemination of lessons learned.
115
Demonstrating progress towards results
• Extent of MO progress towards its institutional / organisation-wide outcomes (identified in strategic plans).
• Extent of MO contributions to country-level goals and priorities (identified in country strategy). • Extent of MO contributions to relevant MDGs.
Relevance to an organisation’s stakeholders
• MO objectives and programme of work are relevant to major stakeholders.
Survey respondents
Depending on the indicator, different respondents or groups of respondents are targeted. Respondents include:
• Donors in headquarters: Professional staff working for a MOPAN (donor) government with responsibility for overseeing and observing a multilateral organisation at the institutional level (in the donor capital or permanent mission of the MO).
• Donors in country offices: Professional staff working for a MOPAN (donor) government in a partner country who work closely with the multilateral organisation at the country level; and
• Direct partners / clients: partner country government, civil society, other relevant stakeholders.
Respondents are identified either by MOPAN members or the multilateral organisations themselves on the basis of familiarity of the organisation assessed. This is confirmed by a “screener” question at the start of the survey asking respondents to identify their level of familiarity with the assessed MO.
Selection of organisations and partner countries
MOPAN selects multilateral organisations for the Common Approach assessment on the basis of three criteria:
1. Perceived importance and interest to all MOPAN members;
2. Medium-term strategic planning and replenishment cycles so that organisations are assessed before the beginning of the planning process, or prior to the start of the replenishment negotiations; and
3. MOs should be selected on the basis of the criteria above and re-assessed on a 3-5 year cycle.
Partner countries cannot be surveyed two years in a row and must be representative of a wide geographical spread. They also must have a significant number of MOPAN donors and selected multilateral organisations present in that country.
Document review
Included in the MOPAN Common Approach is a review of documents to complement the survey data. The MOPAN document review explores evidence that the multilateral organisations have the necessary systems in place for an organisation to be effective. The review examines publicly available documents, including those that the organisations provide.
116
Three types of documents are reviewed: (i) documents from the multilateral organisation relevant to the indicators above; (ii) organisational reviews or assessments – both external and internal – about the organisation’s performance on the dimensions of the MOPAN framework; and (iii) external assessments such as the Survey on Monitoring the Paris Declaration (2008), the Common Performance Assessment (COMPAS) report (2008), and previous MOPAN surveys. In effect, the document review serves to triangulate the survey data with other sources of available information.
Interviews
In 2012, MOPAN complemented the survey data and document review with selected consultations and interviews at the Headquarters and country offices of the multilateral organisations being assessed.
Finalisation and dissemination of the reports
The findings from the survey, the document review, and the interviews are triangulated to prepare the draft reports which are shared with the multilateral organisations. The response from the multilateral organisations constitutes the final stage of the data validation process. The MOPAN Steering Committee approves the final version of the reports which are published on the MOPAN website together with the associated management responses from the multilateral organisation.
The final reports provide the basis for consultations with the multilateral organisation at their headquarters and at country level to discuss the findings and identify how the recommendations can best be implemented. Representatives from partner country governments which have participated in the survey are included in these consultation meetings.
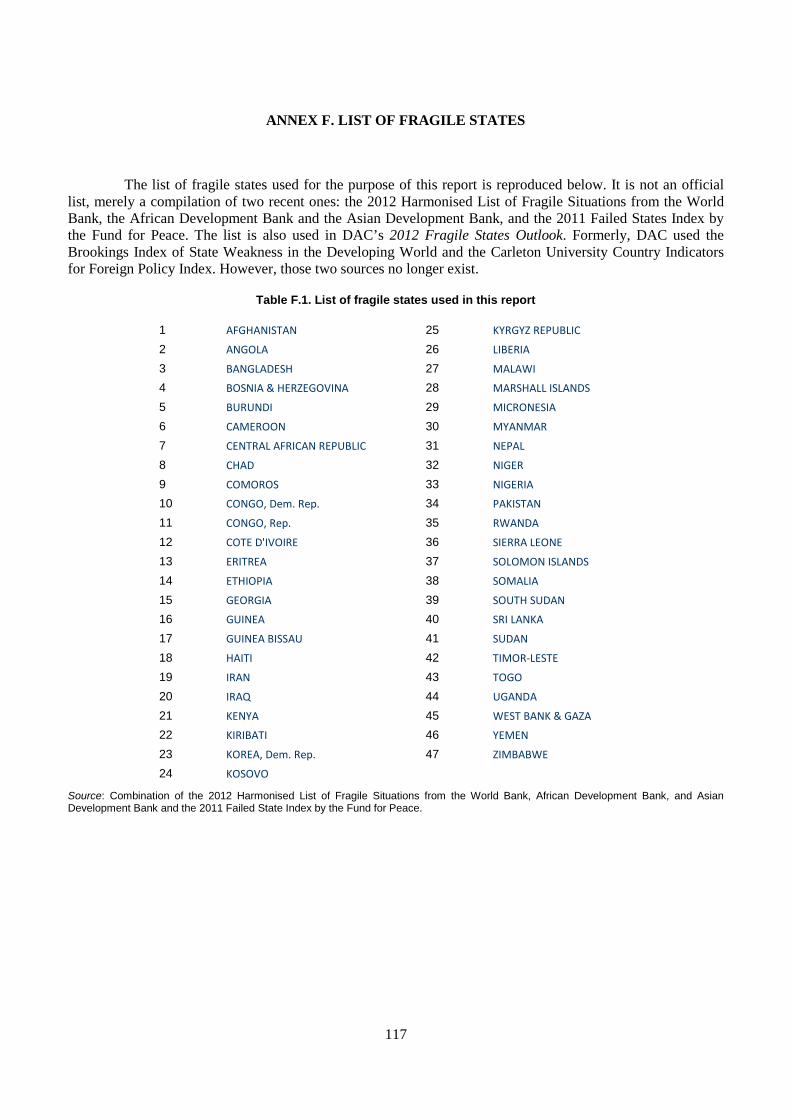
117
ANNEX F. LIST OF FRAGILE STATES
The list of fragile states used for the purpose of this report is reproduced below. It is not an official list, merely a compilation of two recent ones: the 2012 Harmonised List of Fragile Situations from the World Bank, the African Development Bank and the Asian Development Bank, and the 2011 Failed States Index by the Fund for Peace. The list is also used in DAC’s 2012 Fragile States Outlook. Formerly, DAC used the Brookings Index of State Weakness in the Developing World and the Carleton University Country Indicators for Foreign Policy Index. However, those two sources no longer exist.
Table F.1. List of fragile states used in this report
1 AFGHANISTAN 25 KYRGYZ REPUBLIC
2 ANGOLA 26 LIBERIA
3 BANGLADESH 27 MALAWI
4 BOSNIA & HERZEGOVINA 28 MARSHALL ISLANDS
5 BURUNDI 29 MICRONESIA
6 CAMEROON 30 MYANMAR
7 CENTRAL AFRICAN REPUBLIC 31 NEPAL
8 CHAD 32 NIGER
9 COMOROS 33 NIGERIA
10 CONGO, Dem. Rep. 34 PAKISTAN
11 CONGO, Rep. 35 RWANDA
12 COTE D'IVOIRE 36 SIERRA LEONE
13 ERITREA 37 SOLOMON ISLANDS
14 ETHIOPIA 38 SOMALIA
15 GEORGIA 39 SOUTH SUDAN
16 GUINEA 40 SRI LANKA
17 GUINEA BISSAU 41 SUDAN
18 HAITI 42 TIMOR-LESTE
19 IRAN 43 TOGO
20 IRAQ 44 UGANDA
21 KENYA 45 WEST BANK & GAZA
22 KIRIBATI 46 YEMEN
23 KOREA, Dem. Rep. 47 ZIMBABWE
24 KOSOVO
Source: Combination of the 2012 Harmonised List of Fragile Situations from the World Bank, African Development Bank, and Asian Development Bank and the 2011 Failed State Index by the Fund for Peace.