Embed Size (px)
Citation preview

FORM 8-KPhilip Morris International Inc. - PMFiled: October 22, 2009 (period: October 22, 2009)
Report of unscheduled material events or corporate changes.

Table of Contents
8-K - FORM 8-K
Item 2.02. Results of Operations and Financial Condition.
SIGNATURES
EX-99.1 (PHILIP MORRIS INTERNATIONAL INC. PRESS RELEASE DATEDOCTOBER 22)
EX-99.2 (CONFERENCE CALL TRANSCRIPT DATED OCTOBER 22)
EX-99.3 (WEBCAST SLIDES DATED OCTOBER 22)

UNITED STATESSECURITIES AND EXCHANGE COMMISSION
Washington, D.C. 20549
FORM 8-K
CURRENT REPORTPursuant to Section 13 or 15(d) of
The Securities Exchange Act of 1934
Date of Report (Date of earliest event reported): October 22, 2009
Philip Morris International Inc.(Exact name of registrant as specified in its charter)
Virginia 1-33708 13-3435103(State or other jurisdiction
of incorporation) (Commission File Number)
(I.R.S. Employer
Identification No.)
120 Park Avenue, New York, New York 10017-5592(Address of principal executive offices) (Zip Code)
Registrant’s telephone number, including area code: (917) 663-2000
(Former name or former address, if changed since last report.)
Check the appropriate box below if the Form 8-K filing is intended to simultaneously satisfy the filing obligation of the registrant under any of the followingprovisions:
� Written communications pursuant to Rule 425 under the Securities Act (17 CFR 230.425)
� Soliciting material pursuant to Rule 14a-12 under the Exchange Act (17 CFR 240.14a-12)
� Pre-commencement communications pursuant to Rule 14d-2(b) under the Exchange Act (17 CFR 240.14d-2(b))
� Pre-commencement communications pursuant to Rule 13e-4(c) under the Exchange Act (17 CFR 240.13e-4(c))
Source: Philip Morris International Inc., 8-K, October 22, 2009

Item 2.02. Results of Operations and Financial Condition.
On October 22, 2009, Philip Morris International Inc. (the “Company”) issued a press release announcing its financial results for the quarter ended September 30,2009 and held a live audio webcast to discuss such results. In connection with this webcast, the Company is furnishing to the Securities and ExchangeCommission the following documents attached as exhibits to this Current Report on Form 8-K and incorporated herein by reference to this Item 2.02: theearnings release attached as Exhibit 99.1 hereto, the conference call transcript attached as Exhibit 99.2 hereto and the webcast slides attached as Exhibit 99.3hereto.
In accordance with General Instruction B.2 of Form 8-K, the information in Item 2.02 of this Current Report on Form 8-K, including Exhibits 99.1, 99.2 and99.3, shall not be deemed “filed” for the purposes of Section 18 of the Securities Exchange Act of 1934, as amended, or otherwise subject to the liabilities of thatsection. The information in Item 2.02 of this Current Report on Form 8-K shall not be incorporated by reference into any filing or other document pursuant to theSecurities Act of 1933, as amended, except as shall be expressly set forth by specific reference in such filing or document.
Item 9.01. Financial Statements and Exhibits.
(d) Exhibits
99.1 Philip Morris International Inc. Press Release dated October 22, 2009 (furnished pursuant to Item 2.02)
99.2 Conference Call Transcript dated October 22, 2009 (furnished pursuant to Item 2.02)
99.3 Webcast Slides dated October 22, 2009 (furnished pursuant to Item 2.02)
Source: Philip Morris International Inc., 8-K, October 22, 2009

SIGNATURES
Pursuant to the requirements of the Securities Exchange Act of 1934, the registrant has duly caused this report to be signed on its behalf by theundersigned hereunto duly authorized.
PHILIP MORRIS INTERNATIONAL INC.
By: /S/ G. PENN HOLSENBECK
Name: G. Penn HolsenbeckTitle: Vice President & Corporate Secretary
DATE: October 22, 2009
Source: Philip Morris International Inc., 8-K, October 22, 2009

EXHIBIT INDEX
Exhibit No. Description
99.1 Philip Morris International Inc. Press Release dated October 22, 2009 (furnished pursuant to Item 2.02)
99.2 Conference Call Transcript dated October 22, 2009 (furnished pursuant to Item 2.02)
99.3 Webcast Slides dated October 22, 2009 (furnished pursuant to Item 2.02)
Source: Philip Morris International Inc., 8-K, October 22, 2009

EXHIBIT 99.1
NEWS RELEASE
PHILIP MORRIS INTERNATIONAL INC. (PMI) REPORTS2009 THIRD-QUARTER RESULTS
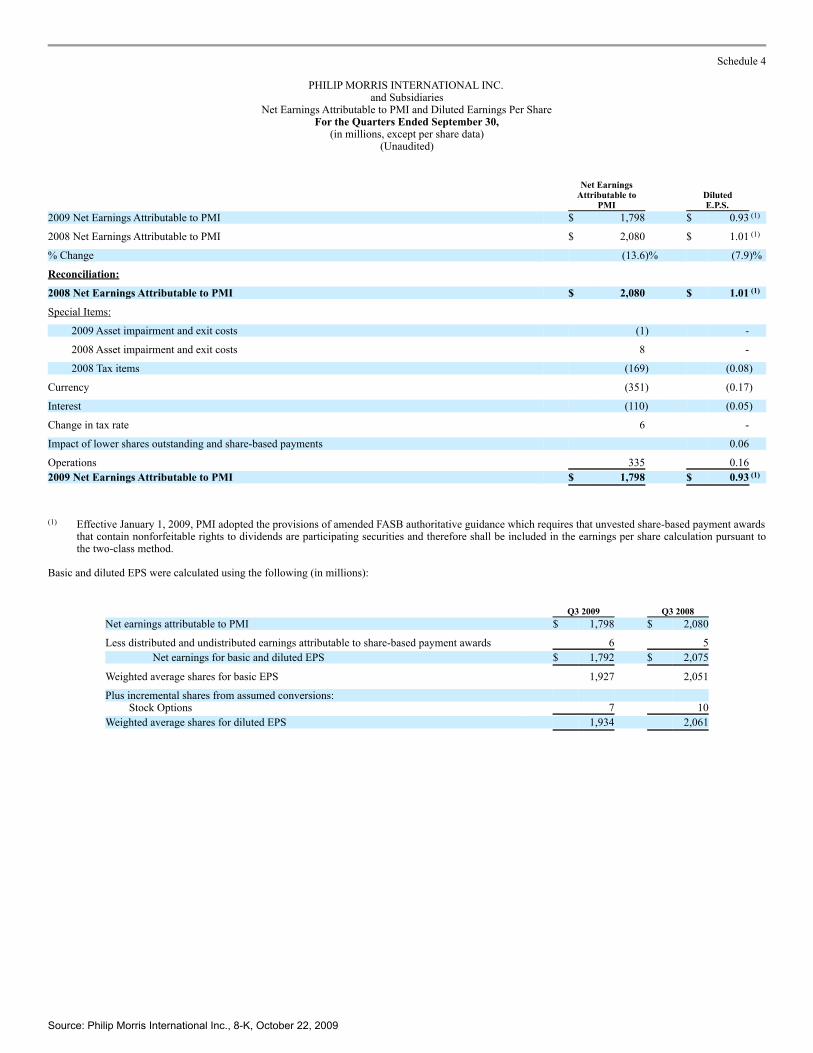
� Reported diluted earnings per share of $0.93 versus $1.01 in 2008, principally due to a $0.08 tax benefit recorded in 2008, as detailed on Schedules4 and 13
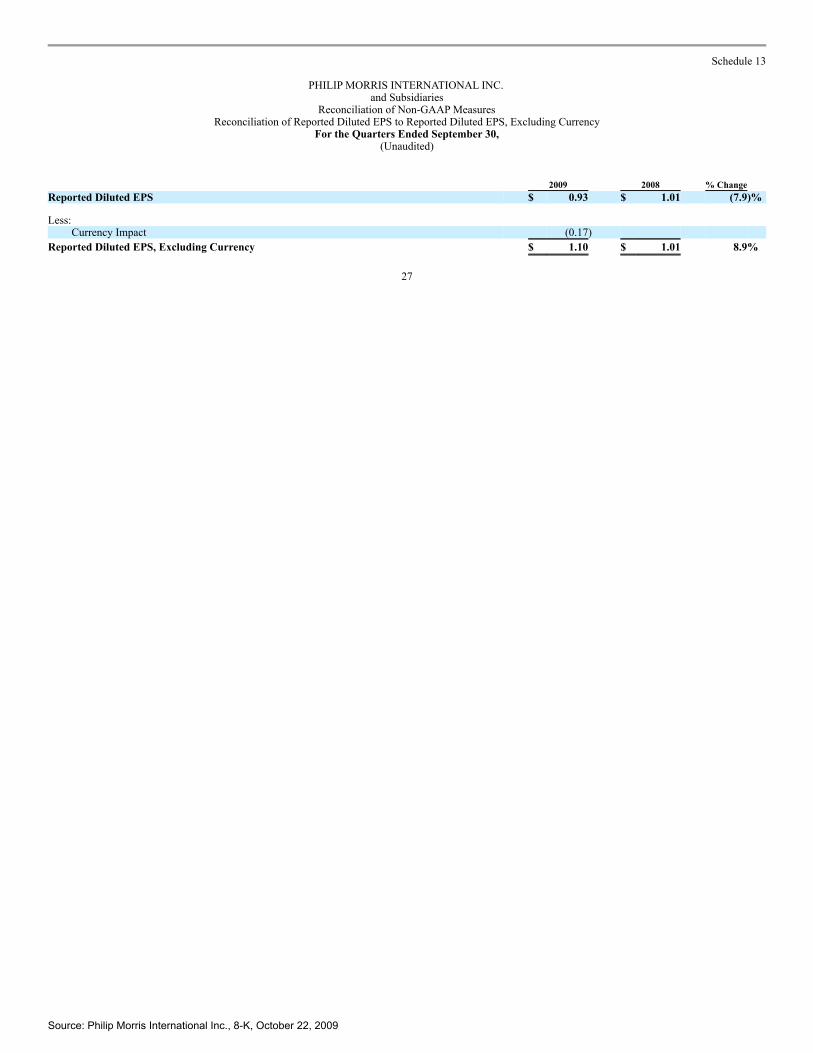
• Excluding currency, reported diluted earnings per share up 8.9%
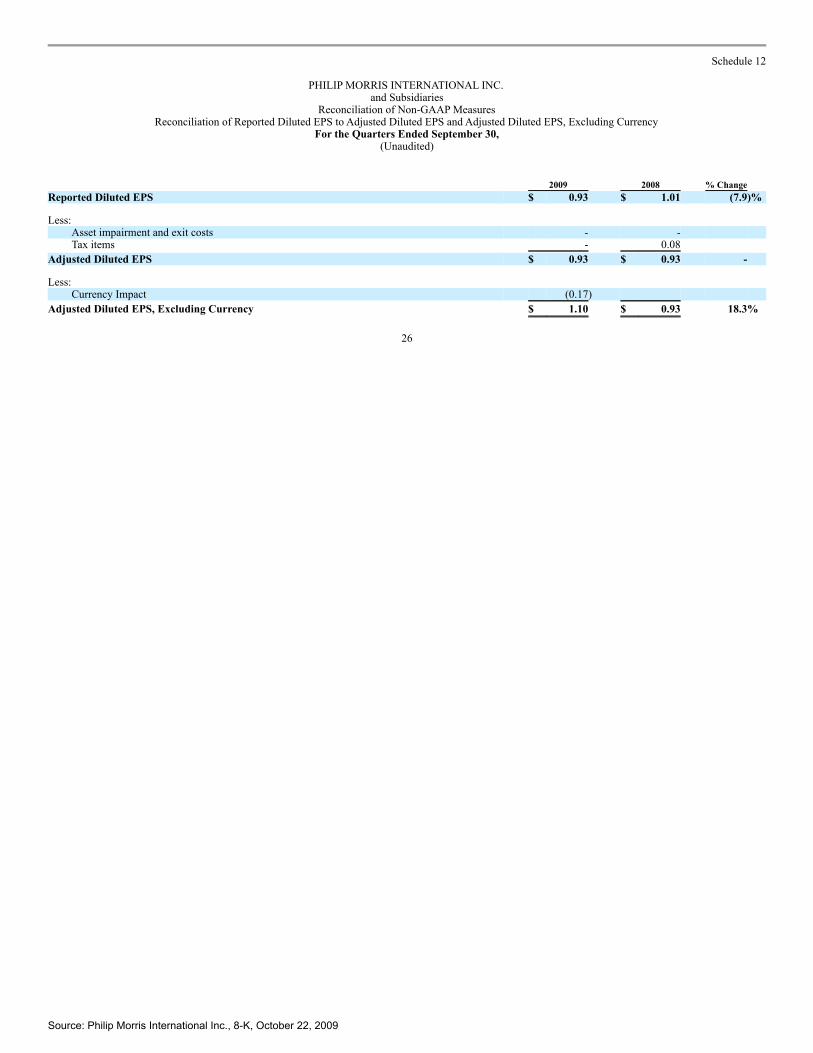
� Adjusted diluted earnings per share of $0.93 versus the same amount in 2008, including the items detailed on Schedule 12
• Excluding currency, adjusted diluted earnings per share up 18.3%
� Increases its forecast for 2009 full-year reported diluted earnings per share to a range of $3.20 to $3.25, from $3.10 to $3.20. Excluding currency,diluted earnings per share are projected to increase by approximately 12%-14%
� Increased its regular quarterly dividend during the quarter to $0.58 per common share, up by 7.4% from $0.54
� Spent a total of $1.5 billion to repurchase 31.5 million shares of its common stock in the quarter
� Completed the purchase of the South African affiliate of Swedish Match for ZAR 1.98 billion (approximately $262 million)
NEW YORK, October 22, 2009 – Philip Morris International Inc. (NYSE / Euronext Paris: PM) today announced reported diluted earnings per share of$0.93 in the third quarter of 2009, down by 7.9% from $1.01 in the third quarter of 2008, principally due to a $0.08 tax benefit recorded in 2008 as detailed onthe attached Schedules 4 and 13. Excluding currency,
Source: Philip Morris International Inc., 8-K, October 22, 2009

reported diluted earnings per share were up by 8.9%. Adjusted diluted earnings per share in the third quarter of 2009 and 2008 were $0.93, including the itemsdetailed on the attached Schedule 12. Excluding currency, adjusted diluted earnings per share were up by 18.3%.
“The third quarter underscored our proven ability to deliver excellent results and improve our operating margins, with net revenues, adjusted operatingcompanies income and earnings per share up, on a constant currency basis, by a strong 6.9%, 13.7% and 18.3%, respectively,” said Louis Camilleri, Chairmanand Chief Executive Officer.
“While we experienced lower organic volume in the quarter, this was largely anticipated given our pricing actions and the on-going impact of theeconomic crisis on total consumption levels, notably in Spain and Ukraine. Our year-to-date volume decline of 2.1% better reflects our estimated full-yearorganic volume performance.”
“Our strong operating cash flow of $6.4 billion year-to-date enabled us to reward shareholders with a 7.4% increase in the dividend and our robust sharerepurchase program has remained uninterrupted since its inception.”
Conference Call
A conference call, hosted by Hermann Waldemer, Chief Financial Officer, with members of the investment community and news media will be webcast at9:00 a.m. Eastern Time on October 22, 2009. Access is available at www.pmintl.com.
2009 Full-Year Forecast
PMI increases its forecast for 2009 full-year reported diluted earnings per share to a range of $3.20 to $3.25, from $3.10 to $3.20, which includes, atcurrent exchange rates, an unfavorable currency impact of approximately $0.52 per share. Excluding currency, diluted earnings per share are projected toincrease by approximately 12%-14%. This guidance includes a pre-tax charge of $135 million ($93 million after-tax), equivalent to $0.04 per share, relating tothe Colombian Investment and Cooperation Agreement announced during the second quarter of 2009, and excludes the impact of any potential futureacquisitions, asset impairment and exit cost charges, and any unusual events.
The factors described in the Forward-Looking and Cautionary Statements section of this release represent continuing risks to these projections.
2
Source: Philip Morris International Inc., 8-K, October 22, 2009

Dividends and Share Repurchase Program
PMI increased its regular quarterly dividend during the quarter to $0.58, up 7.4% from $0.54, which represents an annualized rate of $2.32 per commonshare.
During the third quarter, PMI spent $1.5 billion to repurchase 31.5 million shares of its common stock. Since May 2008, when PMI began itspreviously-announced $13 billion, two-year share repurchase program, the company has spent a total of $9.6 billion to repurchase 209.6 million shares.
Acquisitions and Agreements
On September 14, 2009, PMI completed the purchase of Swedish Match South Africa (Proprietary) Limited (SMSA) for ZAR 1.98 billion (approximately$262 million), including acquired cash and working capital. While this acquisition did not impact third quarter results, it is anticipated to be immediatelymarginally accretive to PMI’s earnings per share.
2009 THIRD-QUARTER CONSOLIDATED RESULTS
Management reviews operating companies income (OCI), which is defined as operating income before corporate expenses and amortization ofintangibles, to evaluate segment performance and to allocate resources. In the following discussion, the term “net revenues” refers to net revenues, excludingexcise taxes, unless otherwise stated. Management also reviews OCI, operating margins and EPS on an adjusted basis (which may exclude the impact ofcurrency and other items such as acquisitions or asset impairment and exit charges), EBITDA and net debt. Management believes it is appropriate to disclosethese measures to help investors analyze business performance and trends. For a reconciliation of operating companies income to operating income, see theCondensed Statements of Earnings contained in this release. Reconciliations of adjusted measures to corresponding GAAP measures are also provided in thisrelease. References to total international cigarette market, total cigarette market, total market and market shares are PMI estimates based on a number ofsources. Comparisons are to the same prior-year period unless otherwise stated.
3
Source: Philip Morris International Inc., 8-K, October 22, 2009

NET REVENUES
PMI Net Revenues* ($ Millions) Third Quarter
2009 2008 Change Excl.
Currency European Union $ 2,408 $ 2,671 (9.8)% 1.5% Eastern Europe, Middle East & Africa 1,830 2,109 (13.2)% 6.9% Asia 1,651 1,610 2.5% 3.0% Latin America & Canada 698 563 24.0% 43.5%
Total PMI $ 6,587 $ 6,953 (5.3)% 6.9%
* Net revenues, excluding excise taxes.
Net revenues of $6.6 billion were down by 5.3% due to unfavorable currency of $846 million. Excluding currency, net revenues increased by 6.9%,primarily driven by favorable pricing of $590 million across all business segments, and the favorable impact of the 2008 Rothmans Inc., Canada acquisition,partly offset by unfavorable volume/mix, primarily in the EU and EEMA Regions. Excluding currency and acquisitions, net revenues increased by 4.1%.
OPERATING COMPANIES INCOME
PMI Operating Companies Income ($ Millions) Third Quarter
2009 2008 Change Excl.
Currency European Union $ 1,267 $ 1,325 (4.4)% 6.7% Eastern Europe, Middle East & Africa 761 946 (19.6)% 11.1% Asia 653 558 17.0% 9.1% Latin America & Canada 226 110 +100.0% +100.0%
Total PMI $ 2,907 $ 2,939 (1.1)% 14.2%
Operating income declined 1.4% to $2.9 billion as shown on Schedule 1. Reported operating companies income declined 1.1% to $2.9 billion, due tounfavorable currency of $449 million. Excluding currency and the favorable impact of acquisitions of 3.1 percentage points of growth, operating companiesincome was up by 11.1%, driven by higher pricing, partly offset by unfavorable volume/mix.
4
Source: Philip Morris International Inc., 8-K, October 22, 2009

Adjusted operating companies income declined 1.5% as shown in the table below and detailed on Schedule 11.
PMI Operating Companies Income ($ Millions) Third Quarter 2009 2008 Change Reported Operating Companies Income $ 2,907 $ 2,939 (1.1)% Asset impairment and exit costs 1 13 Adjusted Operating Companies Income $ 2,908 $ 2,952 (1.5)% Adjusted OCI Margin* 44.1% 42.5% 1.6 p.p.
* Margins are calculated as adjusted operating companies income, divided by net revenues, excluding excise taxes.
Excluding the unfavorable impact of currency, adjusted operating companies income margin was up by 2.7 percentage points to 45.2% as detailed onSchedule 11.
SHIPMENT VOLUME & MARKET SHARE
PMI Cigarette Shipment Volume by Segment (Million Units) Third Quarter 2009 2008 Change European Union 61,047 64,063 (4.7)% Eastern Europe, Middle East & Africa 77,769 81,405 (4.5)% Asia 54,484 55,946 (2.6)% Latin America & Canada 25,978 24,500 6.0%
Total PMI 219,278 225,914 (2.9)%
PMI’s cigarette shipment volume of 219.3 billion units was down by 2.9%, reflecting: gains in Latin America & Canada, from the acquisition of RothmansInc., offset by declines in the EU and EEMA due to the impact of the economic crisis, primarily in Spain and Ukraine; unfavorable comparisons due to a strongthird quarter in 2008, mainly in EEMA; and declines in Asia due to trade inventory movements in Pakistan subsequent to the excise tax increase of June 2009.On an organic basis, which excludes acquisitions, PMI’s cigarette shipment volume was down by 4.0%. However, on a year-to-date basis through September2009, organic volume was down by 2.1%, which is more in line with PMI’s expectations for the full year 2009.
Despite strong growth in Asia, total cigarette shipments of Marlboro of 76.9 billion units were down by 4.3%, primarily due to market declines in the EUand EEMA, largely due to the
5
Source: Philip Morris International Inc., 8-K, October 22, 2009
effects of the economic crisis in Spain and a softening of the premium segment in Russia and Ukraine. Total cigarette shipments of L&M of 23.4 billion unitswere down by 2.8%, with double-digit growth in the EU, offset primarily by a decline in Russia. Driven by a decrease in shipments in Russia and Ukraine, totalcigarette shipments of Chesterfield declined 15.1%. Total cigarette shipments of Parliament were down by 4.1%, driven by declines in EEMA, partly offset bydouble-digit growth in Asia. Total cigarette shipments of Virginia Slims declined 5.5%, reflecting a decline in EEMA, partly offset by growth in all other regions.Total cigarette shipments of Lark increased by 9.1%, driven by strong growth in Turkey, and Bond Street increased by 4.3%, primarily in Russia.
Total shipment volume of other tobacco products (OTP), in cigarette equivalent units, grew by 4.7%, primarily fueled by Canada and the Nordics.Excluding acquisitions, shipment volume of OTP was down by 9.8%, primarily due to lower volume in Poland, reflecting the impact of the excise tax alignmentof pipe tobacco to roll-your-own in the first quarter of 2009. Total shipment volume for cigarettes and OTP was down by 2.8%, and down by 4.1% excludingacquisitions.
PMI’s market share performance improved in a number of markets, including Algeria, Argentina, Belgium, Brazil, Bulgaria, Canada, the DominicanRepublic, Egypt, Hungary, Korea, Mexico, Pakistan, the Philippines, Portugal, Russia, Slovakia, Switzerland, Turkey and Ukraine.
EUROPEAN UNION (EU)
2009 Third-Quarter Results
In the EU, net revenues declined by 9.8% to $2.4 billion, mainly due to unfavorable currency of $304 million. Excluding the impact of currency andacquisitions, net revenues increased by 1.1%, primarily reflecting higher pricing of $173 million across most markets, including a favorable comparison with2008 in the Czech Republic, which more than offset unfavorable volume/mix of $144 million, largely due to total market declines and unfavorable distributorinventory movements.
Operating companies income declined by 4.4% to $1.3 billion, primarily due to unfavorable currency of $147 million. Excluding the impact of currencyand acquisitions, operating companies income grew by 6.0%, primarily reflecting favorable pricing that more than offset unfavorable volume/mix.
6
Source: Philip Morris International Inc., 8-K, October 22, 2009

Adjusted operating companies income declined by 5.0% as shown in the table below and detailed on Schedule 11.
EU Operating Companies Income ($ Millions)
Third Quarter 2009 2008 Change Reported Operating Companies Income $ 1,267 $ 1,325 (4.4)% Asset impairment and exit costs 1 10 Adjusted Operating Companies Income $ 1,268 $ 1,335 (5.0)% Adjusted OCI Margin* 52.7% 50.0% 2.7 p.p.
* Margins are calculated as adjusted operating companies income, divided by net revenues, excluding excise taxes.
Excluding the unfavorable impact of currency, adjusted operating companies income margin was up by 2.2 percentage points to 52.2% as detailed onSchedule 11.
The total cigarette market in the EU declined by 1.6%. Adjusted for the favorable impact of the trade inventory distortion in the Czech Republic inanticipation of the January 2008 excise tax increase, the total cigarette market declined by 2.3%. The decline primarily reflects the impact of worsening economicconditions in Spain that were compounded by tax-driven price increases in June 2009.
PMI’s cigarette shipment volume in the EU declined by 4.7%, primarily reflecting a lower total market as described above, and unfavorable distributorinventory movements, mainly in Spain.
PMI’s market share in the EU was down by 0.2 share points to 38.9%. Adjusted for the trade inventory movements in the Czech Republic, PMI’s marketshare was flat, as gains, primarily in Austria, Belgium and the Czech Republic, were offset by share declines in France, Poland, Spain and the U.K. Marlboro’sshare in the EU was down by 0.4 share points, reflecting a lower share in France, Germany and Spain, partially offset by a higher share in Italy, Poland andPortugal. The continuing roll-out of brand initiatives included, during the quarter, the Marlboro Red pack upgrade in Austria, France and Italy, the nationwidelaunch of Marlboro Gold Original in Belgium and the Netherlands, Marlboro Gold Advance in Norway and Portugal and Marlboro Gold Touch in Hungary.L&M continued to perform well in the EU, with market share up by 0.9 points to 5.7%, primarily driven by gains in Germany, Slovakia and Spain.
In the Czech Republic, the total cigarette market was up 10.3%, reflecting a favorable comparison to 2008, which was adversely affected by tradeinventory movements related to the
7
Source: Philip Morris International Inc., 8-K, October 22, 2009

January 2008 excise tax increase. Adjusted for this distortion, the total market is estimated to have declined by 10.8%, due mainly to tax-driven price increases inthe third quarter of 2008 and industry price increases in 2009. PMI’s shipments were flat and adjusted market share increased by an estimated 3.6 points to50.5%.
In France, the total cigarette market was up by 4.7%, primarily due to reduced travel abroad as a result of the economic crisis. PMI’s shipments were up by2.9%. Market share decreased by 0.5 points to 40.1%, driven by a lower share for Marlboro, down by 0.9 points to 26.2%, reflecting an overall decline in thepremium segment. However, PMI’s share of the premium segment was stable due to a higher share for the Philip Morris brand, up by 0.5 market share points.
In Germany, the total cigarette market was down by 2.8%, primarily reflecting the impact of the June 2009 price increase. PMI’s shipments were down by3.1%, whilst market share was essentially flat at 35.3%, despite the extended availability of certain competitor products at old retail prices and in the 17 cigarettesper pack format. PMI’s share performance reflected a higher share for L&M, up 1.4 share points, largely offset by a lower Marlboro share, down by 1.2 sharepoints to 21.8%.
In Italy, the total cigarette market was down by 1.9%, mainly reflecting the impact of price increases in February 2009. Although PMI’s shipments weredown by 3.4%, mainly due to the total market decline and adverse distributor inventory movements, market share was flat at 54.5%, primarily reflecting a 0.5share point growth by Marlboro to 23.1%, fueled by the recent successful launch of Marlboro Gold Touch, offset by a share decline for Diana.
In Poland, the total cigarette market was up by 8.3%, primarily reflecting the favorable impact of trade inventory movements following the depletion ofold tax sticker inventories, during the second quarter of 2009, in compliance with anti-forestalling regulation. Although PMI’s shipments were up by 5.5%,market share was down by 0.9 points to 36.1%, primarily reflecting lower share in the super low price segment, partly offset by higher Marlboro share, up by 1.7share points to 9.5%.
In Spain, the total cigarette market was down by 10.2%, due primarily to the adverse economic environment, the price increases of January and June 2009and a decline in tourism. PMI’s shipments were down by 23.5%, reflecting the lower total market and the impact of unfavorable distributor inventorymovements. Although PMI’s market share was down by 0.2 points to 32.1%, share was up 0.3 points compared to the second quarter 2009. Marlboro share,
8
Source: Philip Morris International Inc., 8-K, October 22, 2009

whilst down by 1.5 points to 15.3%, was essentially flat compared to the second quarter 2009. Market share of L&M was up by 2.3 share points.
EASTERN EUROPE, MIDDLE EAST & AFRICA (EEMA)
2009 Third-Quarter Results
In EEMA, net revenues decreased by 13.2% to $1.8 billion, due to unfavorable currency of $425 million. Excluding the impact of currency andacquisitions, net revenues grew by 6.7%, driven by favorable pricing of $263 million, primarily in Russia, Turkey and Ukraine, which more than offsetunfavorable volume/mix of $121 million.
Operating companies income decreased by 19.6% to $761 million, due to unfavorable currency of $290 million. Excluding the impact of currency andacquisitions, operating companies income was up by a robust 10.6%, driven by strong growth in profitability in Russia, Turkey and Ukraine, mainly due tohigher pricing.
EEMA Operating Companies Income ($ Millions) Third Quarter 2009 2008 Change Reported Operating Companies Income $ 761 $ 946 (19.6)% Asset impairment and exit costs 0 0 Adjusted Operating Companies Income $ 761 $ 946 (19.6)% Adjusted OCI Margin* 41.6% 44.9% (3.3) p.p.
* Margins are calculated as adjusted operating companies income, divided by net revenues, excluding excise taxes.
Excluding the impact of unfavorable currency, adjusted operating companies income margin was up by 1.7 percentage points to 46.6% as detailed onSchedule 11.
PMI’s cigarette shipment volume decreased by 4.5%, principally due to: Ukraine, which suffered from the unfavorable impact of a series of tax-drivenprice increases, the largest of which was implemented in May of this year that raised PMI’s prices by 22% to 50%, and worsening economic conditions;Romania, reflecting a double-digit total cigarette market decline following tax-driven price increases in 2009; and Turkey, reflecting unfavorable trade inventorymovements following price increases in 2009. This decline was partially offset by increased cigarette shipment volume in Algeria, Egypt and several markets inthe Middle East.
9
Source: Philip Morris International Inc., 8-K, October 22, 2009

In Russia, PMI’s shipment volume decreased by 0.8%. Shipment volume of PMI’s premium portfolio was down by 15.2%, primarily due to declines inMarlboro and Parliament of 20.8% and 8.0%, respectively, reflecting down-trading from the premium segment. In the mid-price segment, shipment volume ofChesterfield was down by 10.7%, partially offset by Muratti, up by 1.5%. In the low-price segment, shipment volume of Bond Street and Optima was up by32.4% and 22.7%, respectively. According to a new retail audit panel implemented with AC Nielsen this year, which more accurately reflects the coverage of themarket, PMI’s market share of 25.6% was up by 0.6 points. Parliament, in the super-premium segment, was up by 0.1 share point and Marlboro, in the premiumsegment, was down 0.2 share points, but stable compared to the second quarter 2009.
In Turkey, PMI’s shipment volume was down by 4.1%, driven by trade inventory movements following the price increase in early July 2009. Total PMI’smarket share of 43.2% grew by 1.6 points, driven by Parliament, up by 0.6 share points, and Lark Recess Blue, launched in the fourth-quarter of 2008, with ashare of 4.2%.
In Ukraine, PMI’s shipment volume declined 23.0%, broadly in line with the total market contraction, reflecting a worsening economy and the impact ofsignificant tax-driven price increases. Total PMI’s market share was up by 0.1 share point to 35.6%, with share gains for both premium Parliament and mid-priceChesterfield offset by lower Marlboro share.
ASIA
2009 Third-Quarter Results
In Asia, net revenues increased by 2.5% to $1.7 billion. Excluding the impact of unfavorable currency of $7 million, net revenues grew by 3.0%, driven byfavorable pricing of $72 million, which more than offset unfavorable volume/mix of $24 million.
Operating companies income grew by 17.0% to reach $653 million, primarily fueled by higher pricing and favorable currency. Excluding the impact ofcurrency, driven by the Japanese Yen, operating companies income grew by 9.1%.
10
Source: Philip Morris International Inc., 8-K, October 22, 2009

Asia Operating Companies Income ($ Millions) Third Quarter 2009 2008 Change Reported Operating Companies Income $ 653 $ 558 17.0% Asset impairment and exit costs 0 0 Adjusted Operating Companies Income $ 653 $ 558 17.0% Adjusted OCI Margin* 39.6% 34.7% 4.9 p.p.
* Margins are calculated as adjusted operating companies income, divided by net revenues, excluding excise taxes.
Excluding the impact of favorable currency, adjusted operating companies income margin was up by 2.0 percentage points to 36.7% as detailed onSchedule 11.
PMI’s cigarette shipment volume decreased by 2.6%, mainly due to declines in Indonesia, reflecting the timing of the Ramadan holiday, Japan, reflecting alower total market, and Pakistan, resulting from a trade inventory correction subsequent to the June 2009 excise tax increase, partially offset by growth in Korea.Shipment volume of Marlboro grew by 5.9%, reflecting a strong performance across the region, particularly in Indonesia, Japan, Korea and the Philippines.
In Indonesia, PMI’s shipment volume declined by 1.1%, reflecting the timing of the Ramadan holiday, partly offset by growth from Marlboro, up by2.9%, benefiting from the launch of Marlboro Black Menthol in March, and A Mild, which has established itself as Indonesia’s leading cigarette brand franchisein terms of market share with shipment volume up by 9.4%.
In Japan, the total cigarette market declined by 3.0%. Adjusting for various factors, including the impact of the nationwide implementation of vendingmachine age verification in July 2008 and trade inventory movements, the total market is estimated to have declined by approximately 3.9%. PMI’s shipmentswere down by 3.2%, broadly in line with the total market decline. PMI’s market share of 24.0% was flat and share of Marlboro increased by 0.4 points to 10.6%,driven by the August 2008 launch of Marlboro Black Menthol, the November 2008 launch of Marlboro Filter Plus One and the June 2009 launch of MarlboroBlack Menthol One. Market share of Lark was flat at 6.6%, but up versus the second quarter 2009, benefiting from the March 2009 national roll-out of LarkClassic Milds, and the introduction of Lark Mint Splash which was launched nationally in September 2009.
11
Source: Philip Morris International Inc., 8-K, October 22, 2009

In Korea, the total cigarette market was up by 1.9%. PMI’s shipment volume surged 21.4%, driven by market share increases. PMI’s market share reached14.6%, up by 2.4 points, driven by strong performances from Marlboro, Parliament and Virginia Slims, up by 1.2, 0.9 and 0.3 share points, respectively.
LATIN AMERICA & CANADA
2009 Third-Quarter Results
In Latin America & Canada, despite unfavorable currency of $110 million, net revenues increased by 24.0% to reach $698 million, primarily driven by the2008 Rothmans Inc., Canada acquisition and higher pricing of $82 million, which more than offset unfavorable volume/mix of $17 million. Excluding the impactof currency and the Canadian acquisition, net revenues increased by 11.5%.
Operating companies income increased by more than 100.0% to $226 million, driven by the favorable impact of the Canadian acquisition of $77 million,and a favorable comparison to 2008 attributable to the one-time, pre-tax charge of $61 million, related to a previous distribution agreement in Canada, partiallyoffset by unfavorable currency of $56 million.
Adjusted operating companies income increased by 100.0% as shown in the table below and detailed on Schedule 11.
Latin America & Canada Operating Companies Income ($ Millions) Third Quarter 2009 2008 Change Reported Operating Companies Income $ 226 $ 110 +100.0% Asset impairment and exit costs 0 3 Adjusted Operating Companies Income $ 226 $ 113 100.0% Adjusted OCI Margin* 32.4% 20.1% 12.3 p.p.
* Margins are calculated as adjusted operating companies income, divided by net revenues, excluding excise taxes.
Excluding the impact of unfavorable currency, adjusted operating companies income margin was up by 14.8 percentage points to 34.9% as detailed onSchedule 11.
Cigarette shipment volume of 26.0 billion units increased by 6.0%, reflecting the Canadian acquisition. Excluding acquisition volume, shipmentsdecreased by 3.8%.
12
Source: Philip Morris International Inc., 8-K, October 22, 2009
In Argentina, PMI’s cigarette shipment volume increased by 0.7% and July/August market share increased by 2.6 points to 73.4%, fueled by the PhilipMorris brand, up by 2.5 share points. Marlboro’s share was up by 0.1 share point.
In Canada, the total tax-paid cigarette market was up by 6.1%, primarily reflecting stronger government enforcement measures to reduce contraband sales.On a pro forma basis, PMI’s cigarette shipment volume increased by 7.1% and market share grew by 0.3 points to 33.9%, led by premium price Belmont, up by0.3 points, and value brands Next and Quebec Classique, up by 1.2 and 1.7 share points, respectively, partially offset by mid-price Number 7 and CanadianClassics, down by 1.3 and 0.9 share points, respectively.
In Mexico, the total cigarette market was down by 0.8%, primarily reflecting the impact of tax-driven price increases in January and December 2008.PMI’s cigarette shipment volume increased by 0.5% and market share increased by 0.9 points to 69.4%, fueled by Delicados, up by 1.3 points, partially offset byMarlboro, down by 0.3 points.
Philip Morris International Inc. Profile
Philip Morris International Inc. (PMI) is the leading international tobacco company, with seven of the world’s top 15 brands, including Marlboro, thenumber one cigarette brand worldwide. PMI has more than 75,000 employees and its products are sold in approximately 160 countries. In 2008, the companyheld an estimated 15.6% share of the total international cigarette market outside of the U.S. For more information, see www.pmintl.com.
Trademarks and service marks mentioned in this release are the property of, or licensed by, the subsidiaries of Philip Morris International Inc.
Forward-Looking and Cautionary Statements
This press release contains projections of future results and other forward-looking statements that involve a number of risks and uncertainties and are madepursuant to the Safe Harbor Provisions of the Private Securities Litigation Reform Act of 1995. The following important factors could cause actual results andoutcomes to differ materially from those contained in such forward-looking statements.
Philip Morris International Inc. and its tobacco subsidiaries (PMI) are subject to intense price competition; changes in consumer preferences and demandfor their products; fluctuations in levels of customer inventories; increases in raw material costs; the effects of foreign
13
Source: Philip Morris International Inc., 8-K, October 22, 2009

economies and local economic and market conditions; unfavorable currency movements and changes to income tax laws. Their results are dependent upon theircontinued ability to promote brand equity successfully; to anticipate and respond to new consumer trends; to develop new products and markets and to broadenbrand portfolios in order to compete effectively; and to improve productivity.
PMI is also subject to legislation and governmental regulation, including actual and potential excise tax increases; discriminatory excise tax structures;increasing marketing and regulatory restrictions; the effects of price increases related to excise tax increases on consumption rates and consumer preferenceswithin price segments; health concerns relating to the use of tobacco products and exposure to environmental tobacco smoke; privately imposed smokingrestrictions; and governmental investigations.
PMI is subject to litigation, including risks associated with adverse jury and judicial determinations, and courts reaching conclusions at variance with thecompany’s understanding of applicable law.
PMI is further subject to other risks detailed from time to time in its publicly filed documents, including the Form 10-K for the year ended December 31,2008 and the Form 10-Q for the quarter ended June 30, 2009. PMI cautions that the foregoing list of important factors is not complete and does not undertake toupdate any forward-looking statements that it may make, except in the normal course of its public disclosure obligations.
Contact: Investor Relations New York: +1 (917) 663 2233 Lausanne: +41 (0)58 242 4666
14
Source: Philip Morris International Inc., 8-K, October 22, 2009
Schedule 1
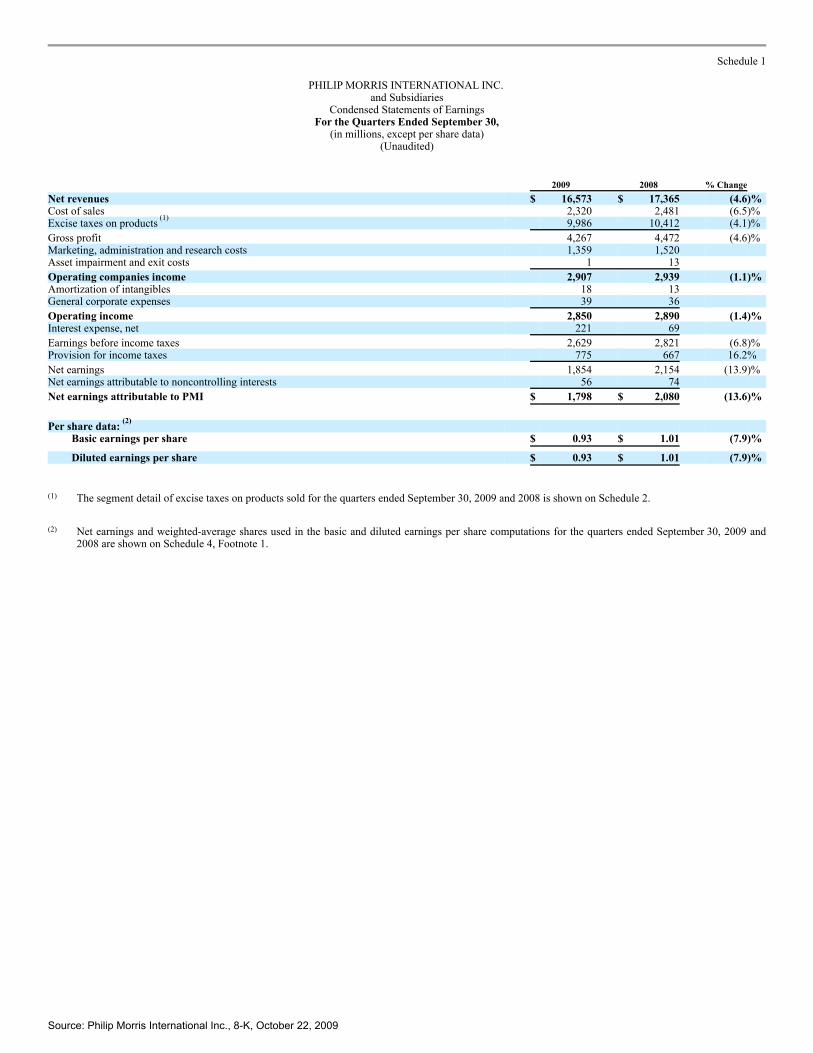
PHILIP MORRIS INTERNATIONAL INC.and Subsidiaries
Condensed Statements of EarningsFor the Quarters Ended September 30,
(in millions, except per share data)(Unaudited)
2009 2008 % Change
Net revenues $ 16,573 $ 17,365 (4.6)% Cost of sales 2,320 2,481 (6.5)% Excise taxes on products (1)
9,986 10,412 (4.1)%
Gross profit 4,267 4,472 (4.6)% Marketing, administration and research costs 1,359 1,520 Asset impairment and exit costs 1 13
Operating companies income 2,907 2,939 (1.1)% Amortization of intangibles 18 13 General corporate expenses 39 36
Operating income 2,850 2,890 (1.4)% Interest expense, net 221 69
Earnings before income taxes 2,629 2,821 (6.8)% Provision for income taxes 775 667 16.2%
Net earnings 1,854 2,154 (13.9)% Net earnings attributable to noncontrolling interests 56 74
Net earnings attributable to PMI $ 1,798 $ 2,080 (13.6)%
Per share data: (2)
Basic earnings per share $ 0.93 $ 1.01 (7.9)%
Diluted earnings per share $ 0.93 $ 1.01 (7.9)%
(1) The segment detail of excise taxes on products sold for the quarters ended September 30, 2009 and 2008 is shown on Schedule 2.
(2) Net earnings and weighted-average shares used in the basic and diluted earnings per share computations for the quarters ended September 30, 2009 and2008 are shown on Schedule 4, Footnote 1.
Source: Philip Morris International Inc., 8-K, October 22, 2009
Schedule 2
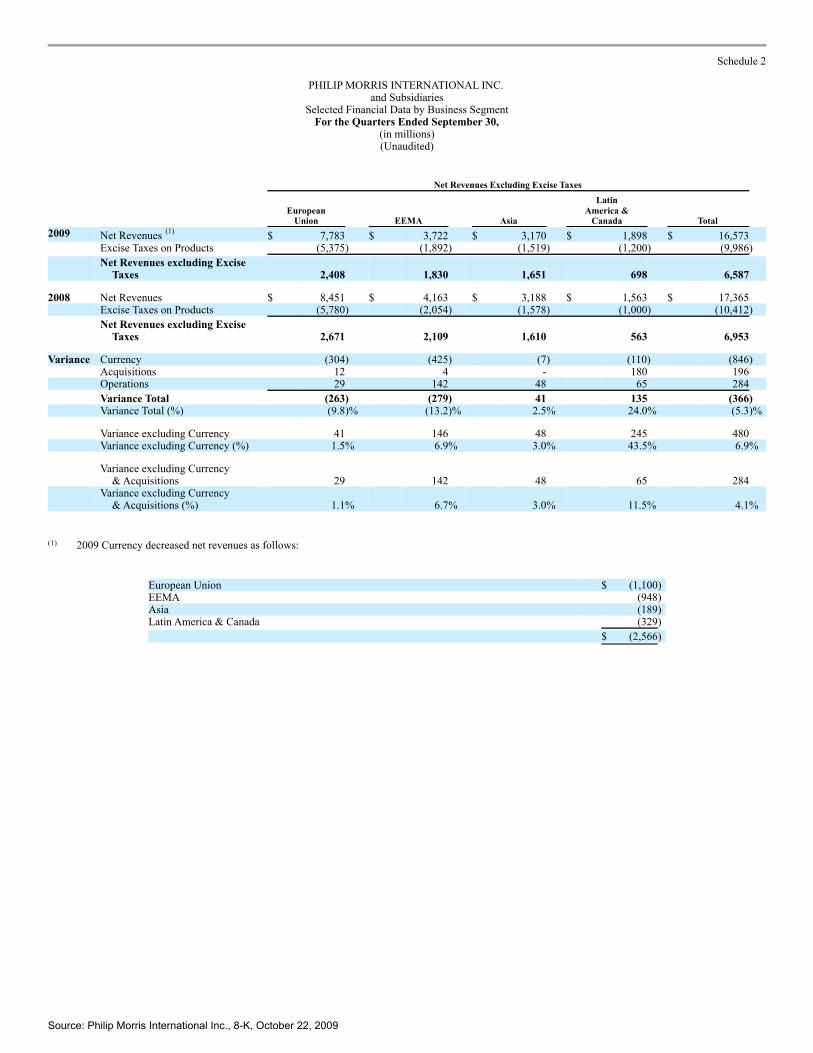
PHILIP MORRIS INTERNATIONAL INC.and Subsidiaries
Selected Financial Data by Business SegmentFor the Quarters Ended September 30,
(in millions)(Unaudited)
Net Revenues Excluding Excise Taxes
European
Union EEMA Asia
LatinAmerica &
Canada Total 2009 Net Revenues (1)
$ 7,783 $ 3,722 $ 3,170 $ 1,898 $ 16,573 Excise Taxes on Products (5,375) (1,892) (1,519) (1,200) (9,986)
Net Revenues excluding Excise
Taxes 2,408 1,830 1,651 698 6,587
2008 Net Revenues $ 8,451 $ 4,163 $ 3,188 $ 1,563 $ 17,365 Excise Taxes on Products (5,780) (2,054) (1,578) (1,000) (10,412)
Net Revenues excluding Excise
Taxes 2,671 2,109 1,610 563 6,953
Variance Currency (304) (425) (7) (110) (846) Acquisitions 12 4 - 180 196 Operations 29 142 48 65 284
Variance Total (263) (279) 41 135 (366) Variance Total (%) (9.8)% (13.2)% 2.5% 24.0% (5.3)%
Variance excluding Currency 41 146 48 245 480 Variance excluding Currency (%) 1.5% 6.9% 3.0% 43.5% 6.9%
Variance excluding Currency
& Acquisitions 29 142 48 65 284
Variance excluding Currency
& Acquisitions (%) 1.1% 6.7% 3.0% 11.5% 4.1%
(1) 2009 Currency decreased net revenues as follows:
European Union $ (1,100) EEMA (948) Asia (189) Latin America & Canada (329)
$ (2,566)
Source: Philip Morris International Inc., 8-K, October 22, 2009

Schedule 3
PHILIP MORRIS INTERNATIONAL INC.and Subsidiaries
Selected Financial Data by Business SegmentFor the Quarters Ended September 30,
(in millions)(Unaudited)
Operating Companies Income
European Union EEMA Asia
LatinAmerica &
Canada Total
2009 $ 1,267 $ 761 $ 653 $ 226 $ 2,907
2008 1,325 946 558 110 2,939
% Change (4.4)% (19.6)% 17.0% 100+% (1.1)%
Reconciliation:
For the quarter ended September 30, 2008 $ 1,325 $ 946 $ 558 $ 110 $ 2,939
Asset impairment and exit costs – 2009 (1) - - - (1)
Asset impairment and exit costs – 2008 10 - - 3 13
Acquired businesses 9 5 - 77 91
Currency (147) (290) 44 (56) (449)
Operations 71 100 51 92 314
For the quarter ended September 30, 2009 $ 1,267 $ 761 $ 653 $ 226 $ 2,907
Source: Philip Morris International Inc., 8-K, October 22, 2009
Schedule 4
PHILIP MORRIS INTERNATIONAL INC.and Subsidiaries
Net Earnings Attributable to PMI and Diluted Earnings Per ShareFor the Quarters Ended September 30,
(in millions, except per share data)(Unaudited)
Net EarningsAttributable to
PMI Diluted
E.P.S. 2009 Net Earnings Attributable to PMI $ 1,798 $ 0.93 (1)
2008 Net Earnings Attributable to PMI $ 2,080 $ 1.01 (1)
% Change (13.6)% (7.9)%
Reconciliation:
2008 Net Earnings Attributable to PMI $ 2,080 $ 1.01 (1)
Special Items:
2009 Asset impairment and exit costs (1) -
2008 Asset impairment and exit costs 8 -
2008 Tax items (169) (0.08)
Currency (351) (0.17)
Interest (110) (0.05)
Change in tax rate 6 -
Impact of lower shares outstanding and share-based payments 0.06
Operations 335 0.16
2009 Net Earnings Attributable to PMI $ 1,798 $ 0.93 (1)
(1) Effective January 1, 2009, PMI adopted the provisions of amended FASB authoritative guidance which requires that unvested share-based payment awardsthat contain nonforfeitable rights to dividends are participating securities and therefore shall be included in the earnings per share calculation pursuant tothe two-class method.
Basic and diluted EPS were calculated using the following (in millions):
Q3 2009 Q3 2008 Net earnings attributable to PMI $ 1,798 $ 2,080
Less distributed and undistributed earnings attributable to share-based payment awards 6 5
Net earnings for basic and diluted EPS $ 1,792 $ 2,075
Weighted average shares for basic EPS 1,927 2,051
Plus incremental shares from assumed conversions: Stock Options 7 10
Weighted average shares for diluted EPS 1,934 2,061
Source: Philip Morris International Inc., 8-K, October 22, 2009

Schedule 5
PHILIP MORRIS INTERNATIONAL INC.and Subsidiaries
Condensed Statements of EarningsFor the Nine Months Ended September 30,
(in millions, except per share data)(Unaudited)
2009 2008 (1) % Change
Net revenues $ 45,072 $ 48,422 (6.9)% Cost of sales 6,476 7,124 (9.1)% Excise taxes on products
(2) 26,754 28,839 (7.2)%
Gross profit 11,842 12,459 (5.0)% Marketing, administration and research costs 4,075 4,244 Asset impairment and exit costs 3 84
Operating companies income 7,764 8,131 (4.5)% Amortization of intangibles 54 29 General corporate expenses 111 80
Operating income 7,599 8,022 (5.3)% Interest expense, net 572 205
Earnings before income taxes 7,027 7,817 (10.1)% Provision for income taxes 2,059 2,182 (5.6)%
Net earnings 4,968 5,635 (11.8)% Net earnings attributable to noncontrolling interests 148 190
Net earnings attributable to PMI $ 4,820 $ 5,445 (11.5)%
Per share data: (3)
Basic earnings per share $ 2.45 $ 2.61 (6.1)%
Diluted earnings per share $ 2.44 $ 2.60 (6.2)%
(1) As discussed in Note 1. Background and Basis of Presentation of our 2008 consolidated financial statements which appears in our Annual Report on Form10-K, prior to 2008, certain of our subsidiaries reported their results up to ten days before the end of December, rather than on December 31. During 2008,these subsidiaries moved to a December 31 closing date. As a result, certain amounts in the first quarter of 2008 were revised to reflect this change.
(2) The segment detail of excise taxes on products sold for the nine months ended September 30, 2009 and 2008 is shown on Schedule 6.
(3) Net earnings and weighted-average shares used in the basic and diluted earnings per share computations for the nine months ended September 30, 2009and 2008 are shown on Schedule 8, Footnote 2.
Source: Philip Morris International Inc., 8-K, October 22, 2009
Schedule 6
PHILIP MORRIS INTERNATIONAL INC.and Subsidiaries
Selected Financial Data by Business SegmentFor the Nine Months Ended September 30,
(in millions)(Unaudited)
Net Revenues Excluding Excise Taxes
European
Union EEMA Asia
LatinAmerica &
Canada Total
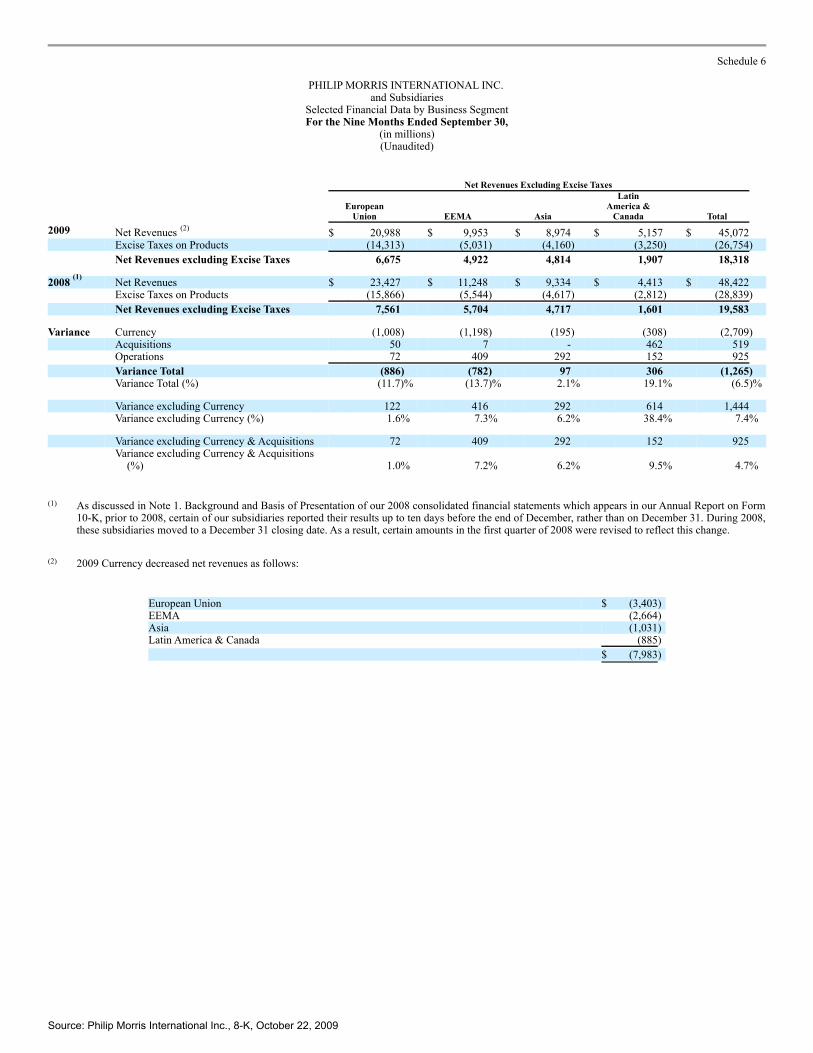
2009 Net Revenues (2) $ 20,988 $ 9,953 $ 8,974 $ 5,157 $ 45,072
Excise Taxes on Products (14,313) (5,031) (4,160) (3,250) (26,754)
Net Revenues excluding Excise Taxes 6,675 4,922 4,814 1,907 18,318
2008 (1) Net Revenues $ 23,427 $ 11,248 $ 9,334 $ 4,413 $ 48,422 Excise Taxes on Products (15,866) (5,544) (4,617) (2,812) (28,839)
Net Revenues excluding Excise Taxes 7,561 5,704 4,717 1,601 19,583
Variance Currency (1,008) (1,198) (195) (308) (2,709) Acquisitions 50 7 - 462 519 Operations 72 409 292 152 925
Variance Total (886) (782) 97 306 (1,265) Variance Total (%) (11.7)% (13.7)% 2.1% 19.1% (6.5)%
Variance excluding Currency 122 416 292 614 1,444 Variance excluding Currency (%) 1.6% 7.3% 6.2% 38.4% 7.4%
Variance excluding Currency & Acquisitions 72 409 292 152 925
Variance excluding Currency & Acquisitions
(%) 1.0% 7.2% 6.2% 9.5% 4.7%
(1) As discussed in Note 1. Background and Basis of Presentation of our 2008 consolidated financial statements which appears in our Annual Report on Form10-K, prior to 2008, certain of our subsidiaries reported their results up to ten days before the end of December, rather than on December 31. During 2008,these subsidiaries moved to a December 31 closing date. As a result, certain amounts in the first quarter of 2008 were revised to reflect this change.
(2) 2009 Currency decreased net revenues as follows:
European Union $ (3,403) EEMA (2,664) Asia (1,031) Latin America & Canada (885)
$ (7,983)
Source: Philip Morris International Inc., 8-K, October 22, 2009

Schedule 7
PHILIP MORRIS INTERNATIONAL INC.and Subsidiaries
Selected Financial Data by Business SegmentFor the Nine Months Ended September 30,
(in millions)(Unaudited)
Operating Companies Income
European
Union EEMA Asia
LatinAmerica &
Canada Total
2009 $ 3,397 $ 1,982 $ 1,933 $ 452 $ 7,764
2008 (1) 3,779 2,439 1,631 282 8,131
% Change (10.1)% (18.7)% 18.5% 60.3% (4.5)%
Reconciliation:
For the nine months ended September 30, 2008 (1) $ 3,779 $ 2,439 $ 1,631 $ 282 $ 8,131
Colombian investment and cooperation agreement charge -2009 - - - (135) (135)
Asset impairment and exit costs - 2009 (3) - - - (3)
Asset impairment and exit costs - 2008 66 1 14 3 84
Equity loss from RBH legal settlement - 2008 - - - 124 124
Acquired businesses 36 7 - 202 245
Currency (572) (758) 67 (138) (1,401)
Operations 91 293 221 114 719
For the nine months ended September 30, 2009 $ 3,397 $ 1,982 $ 1,933 $ 452 $ 7,764
(1) As discussed in Note 1. Background and Basis of Presentation of our 2008 consolidated financial statements which appears in our Annual Report on Form10-K, prior to 2008, certain of our subsidiaries reported their results up to ten days before the end of December, rather than on December 31. During 2008,these subsidiaries moved to a December 31 closing date. As a result, certain amounts in the first quarter of 2008 were revised to reflect this change.
Source: Philip Morris International Inc., 8-K, October 22, 2009

Schedule 8
PHILIP MORRIS INTERNATIONAL INC.and Subsidiaries
Net Earnings Attributable to PMI and Diluted Earnings Per ShareFor the Nine Months Ended September 30,
(in millions, except per share data)(Unaudited)
Net EarningsAttributable to
PMI Diluted E.P.S. 2009 Net Earnings Attributable to PMI $ 4,820 $ 2.44 (2) 2008 Net Earnings Attributable to PMI $ 5,445 (1) $ 2.60 (2) % Change (11.5)% (6.2)%
Reconciliation: 2008 Net Earnings Attributable to PMI $ 5,445 (1) $ 2.60 (2)
Special Items: 2009 Colombian investment and cooperation agreement charge (93) (0.04) 2009 Asset impairment and exit costs (2) - 2008 Asset impairment and exit costs 54 0.02 2008 Equity loss from RBH legal settlement 124 0.06 2008 Tax Items (169) (0.08)
Currency (1,081) (0.52) Interest (267) (0.13) Change in tax rate 28 0.01 Impact of lower shares outstanding and share-based payments 0.15 Operations 781 0.37
2009 Net Earnings Attributable to PMI $ 4,820 $ 2.44 (2)
(1) As discussed in Note 1. Background and Basis of Presentation of our 2008 consolidated financial statements which appears in our Annual Report on Form10-K, prior to 2008, certain of our subsidiaries reported their results up to ten days before the end of December, rather than on December 31. During 2008,these subsidiaries moved to a December 31 closing date. As a result, certain amounts in the first quarter of 2008 were revised to reflect this change.
(2) Effective January 1, 2009, PMI adopted the provisions of amended FASB authoritative guidance which requires that unvested share-based payment awardsthat contain nonforfeitable rights to dividends are participating securities and therefore shall be included in the earnings per share calculation pursuant tothe two-class method.
Basic and diluted EPS were calculated using the following (in millions):
2009 2008Net earnings attributable to PMI $ 4,820 $ 5,445
Less distributed and undistributed earnings attributable to share-based payment awards 17 11
Net earnings for basic and diluted EPS $ 4,803 $ 5,434
Weighted average shares for basic EPS 1,958 2,084
Plus incremental shares from assumed conversions: Stock Options 7 8
Weighted average shares for diluted EPS 1,965 2,092
Source: Philip Morris International Inc., 8-K, October 22, 2009

Schedule 9
PHILIP MORRIS INTERNATIONAL INC.and Subsidiaries
Condensed Balance Sheets(in millions, except ratios)
(Unaudited)
September 30,
2009 December 31,
2008 Assets Cash and cash equivalents $ 1,602 $ 1,531 All other current assets 12,675 13,408 Property, plant and equipment, net 6,358 6,348 Goodwill 8,992 8,015 Other intangible assets, net 3,494 3,084 Other assets 584 586
Total assets $ 33,705 $ 32,972
Liabilities and Stockholders’ Equity Short-term borrowings $ 313 $ 375 Current portion of long-term debt 197 209 All other current liabilities 9,328 9,560 Long-term debt 13,741 11,377 Deferred income taxes 1,513 1,401 Other long-term liabilities 1,899 2,146
Total liabilities 26,991 25,068 Total PMI stockholders’ equity 6,340 7,500 Noncontrolling interests 374 404
Total stockholders’ equity 6,714 7,904
Total liabilities and stockholders’ equity $ 33,705 $ 32,972
Total debt $ 14,251 $ 11,961 Total debt to EBITDA 1.34 (1) 1.08 (1) Net debt to EBITDA 1.19 (1) 0.94 (1)
(1) For the calculation of Total Debt to EBITDA and Net Debt to EBITDA ratios, refer to Schedule 18.
Source: Philip Morris International Inc., 8-K, October 22, 2009

Schedule 10
PHILIP MORRIS INTERNATIONAL INC.and Subsidiaries
Reconciliation of Non-GAAP MeasuresAdjustments for the Impact of Currency and Acquisitions
For the Quarters Ended September 30,(in millions)(Unaudited)
2009
2008 % Change in Reported Net
Revenues excluding Excise Taxes
Reported NetRevenues
LessExciseTaxes
ReportedNet
Revenuesexcluding
ExciseTaxes
LessCurrency
Reported NetRevenuesexcluding
Excise Taxes& Currency
LessAcquisi-
tions
Reported NetRevenuesexcluding
Excise Taxes,Currency &Acquisitions
ReportedNet
Revenues
LessExciseTaxes
ReportedNet
Revenuesexcluding
Excise Taxes Reported
ReportedexcludingCurrency
Reportedexcluding
Currency &Acquisitions
$ 7,783 $ 5,375 $ 2,408 $ (304) $ 2,712 $ 12 $ 2,700 European Union $ 8,451 $ 5,780 $ 2,671 (9.8)% 1.5% 1.1% 3,722 1,892 1,830 (425) 2,255 4 2,251 EEMA 4,163 2,054 2,109 (13.2)% 6.9% 6.7% 3,170 1,519 1,651 (7) 1,658 - 1,658 Asia 3,188 1,578 1,610 2.5% 3.0% 3.0% 1,898 1,200 698 (110) 808 180 628 Latin America & Canada 1,563 1,000 563 24.0% 43.5% 11.5%
$ 16,573 $ 9,986 $ 6,587 $ (846) $ 7,433 $ 196 $ 7,237 PMI Total $ 17,365 $ 10,412 $ 6,953 (5.3)% 6.9% 4.1%
2009
2008 % Change in Reported Operating
Companies Income
ReportedOperatingCompanies
Income Less
Currency
ReportedOperatingCompanies
IncomeexcludingCurrency
LessAcquisi-
tions
ReportedOperatingCompanies
Incomeexcluding
Currency &Acquisitions
ReportedOperatingCompanies
Income Reported
ReportedexcludingCurrency
Reportedexcluding
Currency &Acquisitions
$ 1,267 $ (147) $ 1,414 $ 9 $ 1,405 European Union $ 1,325 (4.4)% 6.7% 6.0% 761 (290) 1,051 5 1,046 EEMA 946 (19.6)% 11.1% 10.6% 653 44 609 - 609 Asia 558 17.0% 9.1% 9.1% 226 (56) 282 77 205 Latin America & Canada 110 100+% 100+% 86.4%
$ 2,907 $ (449) $ 3,356 $ 91 $ 3,265 PMI Total $ 2,939 (1.1)% 14.2% 11.1%
Source: Philip Morris International Inc., 8-K, October 22, 2009

Schedule 11
PHILIP MORRIS INTERNATIONAL INC.and Subsidiaries
Reconciliation of Non-GAAP MeasuresReconciliation of Reported Operating Companies Income to Adjusted Operating Companies Income &
Reconciliation of Adjusted Operating Companies Income Margin, Excluding CurrencyFor the Quarters Ended September 30,
(in millions)(Unaudited)
2009
2008 % Change in Adjusted Operating
Companies Income
ReportedOperatingCompanies
Income
LessAsset
Impairment& Exit Costs
AdjustedOperatingCompanies
Income Less
Currency
AdjustedOperatingCompanies
IncomeexcludingCurrency
LessAcquisi-
tions
AdjustedOperatingCompanies
Incomeexcluding
Currency &Acquisitions
ReportedOperatingCompanies
Income
Less AssetImpairment& Exit Costs
AdjustedOperatingCompanies
Income Adjusted
AdjustedexcludingCurrency
Adjustedexcluding
Currency &Acquisitions
$ 1,267 $ (1) $ 1,268 $ (147) $ 1,415 $ 9 $ 1,406 European Union $ 1,325 $ (10) $ 1,335 (5.0)% 6.0% 5.3% 761 - 761 (290) 1,051 5 1,046 EEMA 946 - 946 (19.6)% 11.1% 10.6% 653 - 653 44 609 - 609 Asia 558 - 558 17.0% 9.1% 9.1% 226 - 226 (56) 282 77 205 Latin America & Canada 110 (3) 113 100.0% 100+% 81.4%
$ 2,907 $ (1) $ 2,908 $ (449) $ 3,357 $ 91 $ 3,266 PMI Total $ 2,939 $ (13) $ 2,952 (1.5)% 13.7% 10.6%
2009 2008 % Points Change
AdjustedOperatingCompanies
IncomeexcludingCurrency
NetRevenuesexcluding
ExciseTaxes
&Currency (1)
AdjustedOperatingCompanies
IncomeMargin
excludingCurrency
AdjustedOperatingCompanies
Income
NetRevenuesexcluding
ExciseTaxes (1)
AdjustedOperatingCompanies
IncomeMargin
AdjustedOperatingCompanies
IncomeMargin
excludingCurrency
$ 1,415 $ 2,712 52.2% European Union $ 1,335 $ 2,671 50.0% 2.2 pp 1,051 2,255 46.6% EEMA 946 2,109 44.9% 1.7 pp 609 1,658 36.7% Asia 558 1,610 34.7% 2.0 pp 282 808 34.9% Latin America & Canada 113 563 20.1% 14.8 pp
$ 3,357 $ 7,433 45.2% PMI Total $ 2,952 $ 6,953 42.5% 2.7 pp
(1) For the calculation of net revenues excluding excise taxes and currency, refer to Schedule 10.
Source: Philip Morris International Inc., 8-K, October 22, 2009
Schedule 12
PHILIP MORRIS INTERNATIONAL INC.and Subsidiaries
Reconciliation of Non-GAAP MeasuresReconciliation of Reported Diluted EPS to Adjusted Diluted EPS and Adjusted Diluted EPS, Excluding Currency
For the Quarters Ended September 30,(Unaudited)
2009 2008 % Change Reported Diluted EPS $ 0.93 $ 1.01 (7.9)%
Less: Asset impairment and exit costs - - Tax items - 0.08
Adjusted Diluted EPS $ 0.93 $ 0.93 -
Less: Currency Impact (0.17)
Adjusted Diluted EPS, Excluding Currency $ 1.10 $ 0.93 18.3%
26
Source: Philip Morris International Inc., 8-K, October 22, 2009
Schedule 13
PHILIP MORRIS INTERNATIONAL INC.and Subsidiaries
Reconciliation of Non-GAAP MeasuresReconciliation of Reported Diluted EPS to Reported Diluted EPS, Excluding Currency
For the Quarters Ended September 30,(Unaudited)
2009 2008 % Change Reported Diluted EPS $ 0.93 $ 1.01 (7.9)%
Less: Currency Impact (0.17)
Reported Diluted EPS, Excluding Currency $ 1.10 $ 1.01 8.9%
27
Source: Philip Morris International Inc., 8-K, October 22, 2009

Schedule 14
PHILIP MORRIS INTERNATIONAL INC.and Subsidiaries
Reconciliation of Non-GAAP MeasuresAdjustments for the Impact of Currency and Acquisitions
For the Nine Months Ended September 30,(in millions)(Unaudited)
2009 2008 (1) % Change in Reported Net
Revenues excluding Excise Taxes
ReportedNet
Revenues
LessExciseTaxes
ReportedNet
Revenuesexcluding
ExciseTaxes
LessCurrency
ReportedNet
Revenuesexcluding
ExciseTaxes
& Currency
LessAcquisi-
tions
ReportedNet
Revenuesexcluding
ExciseTaxes,
Currency &Acquisitions
ReportedNet
Revenues
LessExciseTaxes
ReportedNet
Revenuesexcluding
ExciseTaxes Reported
ReportedexcludingCurrency
Reportedexcluding
Currency &Acquisitions
$ 20,988 $ 14,313 $ 6,675 $ (1,008) $ 7,683 $ 50 $ 7,633 European Union $ 23,427 $ 15,866 $ 7,561 (11.7)% 1.6% 1.0% 9,953 5,031 4,922 (1,198) 6,120 7 6,113 EEMA 11,248 5,544 5,704 (13.7)% 7.3% 7.2% 8,974 4,160 4,814 (195) 5,009 - 5,009 Asia 9,334 4,617 4,717 2.1% 6.2% 6.2% 5,157 3,250 1,907 (308) 2,215 462 1,753 Latin America & Canada 4,413 2,812 1,601 19.1% 38.4% 9.5%
$ 45,072 $ 26,754 $ 18,318 $ (2,709) $ 21,027 $ 519 $ 20,508 PMI Total $ 48,422 $ 28,839 $ 19,583 (6.5)% 7.4% 4.7%
2009 2008 (1) % Change in Reported Operating
Companies Income
ReportedOperatingCompanies Income
LessCurrency
ReportedOperatingCompanies
IncomeexcludingCurrency
LessAcquisi-
tions
ReportedOperatingCompanies
Incomeexcluding
Currency &Acquisitions
ReportedOperatingCompanies
Income Reported
ReportedexcludingCurrency
Reportedexcluding
Currency &Acquisitions
$ 3,397 $ (572) $ 3,969 $ 36 $ 3,933 European Union $ 3,779 (10.1)% 5.0% 4.1% 1,982 (758) 2,740 7 2,733 EEMA 2,439 (18.7)% 12.3% 12.1% 1,933 67 1,866 - 1,866 Asia 1,631 18.5% 14.4% 14.4% 452 (138) 590 202 388 Latin America & Canada 282 60.3% 100+% 37.6%
$ 7,764 $ (1,401) $ 9,165 $ 245 $ 8,920 PMI Total $ 8,131 (4.5)% 12.7% 9.7%
(1) As discussed in Note 1. Background and Basis of Presentation of our 2008 consolidated financial statements which appears in our Annual Report on Form10-K, prior to 2008, certain of our subsidiaries reported their results up to ten days before the end of December, rather than on December 31. During 2008,these subsidiaries moved to a December 31 closing date. As a result, certain amounts in the first quarter of 2008 were revised to reflect this change.
Source: Philip Morris International Inc., 8-K, October 22, 2009

Schedule 15
PHILIP MORRIS INTERNATIONAL INC.and Subsidiaries
Reconciliation of Non-GAAP MeasuresReconciliation of Reported Operating Companies Income to Adjusted Operating Companies Income &
Reconciliation of Adjusted Operating Companies Income Margin Excluding CurrencyFor the Nine Months Ended September 30,
(in millions)(Unaudited)
2009 2008 (1) % Change in Adjusted Operating
Companies Income
ReportedOperatingCompanies
Income
Less AssetImpairment/
Exit Costsand Other
AdjustedOperatingCompanies
Income Less
Currency
AdjustedOperatingCompanies
IncomeexcludingCurrency
LessAcquisi-
tions
AdjustedOperatingCompanies
Incomeexcluding
Currency &Acquisitions
ReportedOperatingCompanies
Income
Less AssetImpairment/Exit
Costs andOther
AdjustedOperatingCompanies
Income Adjusted
AdjustedexcludingCurrency
Adjustedexcluding
Currency &Acquisitions
$ 3,397 $ (3) $ 3,400 $ (572) $ 3,972 $ 36 $ 3,936 European Union $ 3,779 $ (66) $ 3,845 (11.6)% 3.3% 2.4% 1,982 - 1,982 (758) 2,740 7 2,733 EEMA 2,439 (1) 2,440 (18.8)% 12.3% 12.0% 1,933 - 1,933 67 1,866 - 1,866 Asia 1,631 (14) 1,645 17.5% 13.4% 13.4% 452 (135) (2) 587 (138) 725 202 523 Latin America & Canada 282 (127) (3) 409 43.5% 77.3% 27.9%
$ 7,764 $ (138) $ 7,902 $ (1,401) $ 9,303 $ 245 $ 9,058 PMI Total $ 8,131 $ (208) $ 8,339 (5.2)% 11.6% 8.6%
2009 2008 % Points Change
AdjustedOperatingCompanies
IncomeexcludingCurrency
NetRevenuesexcluding
ExciseTaxes
&Currency (4)
AdjustedOperatingCompanies
IncomeMargin
excludingCurrency
AdjustedOperatingCompanies
Income
NetRevenuesexcluding
ExciseTaxes (4)
AdjustedOperatingCompanies
IncomeMargin
AdjustedOperatingCompanies
IncomeMargin
excludingCurrency
$ 3,972 $ 7,683 51.7% European Union $ 3,845 $ 7,561 50.9% 0.8 pp 2,740 6,120 44.8% EEMA 2,440 5,704 42.8% 2.0 pp 1,866 5,009 37.3% Asia 1,645 4,717 34.9% 2.4 pp 725 2,215 32.7% Latin America & Canada 409 1,601 25.5% 7.2 pp
$ 9,303 $ 21,027 44.2% PMI Total $ 8,339 $ 19,583 42.6% 1.6 pp
(1) As discussed in Note 1. Background and Basis of Presentation of our 2008 consolidated financial statements which appears in our Annual Report on Form10-K, prior to 2008, certain of our subsidiaries reported their results up to ten days before the end of December, rather than on December 31. During 2008,these subsidiaries moved to a December 31 closing date. As a result, certain amounts in the first quarter of 2008 were revised to reflect this change.
(2) Represents 2009 Colombian investment and cooperation agreement charge.
(3) Represents 2008 equity loss from RBH legal settlement ($124 million) and asset impairment and exit costs ($3 million).
(4) For the calculation of net revenues excluding excise taxes and currency, refer to Schedule 14.
Source: Philip Morris International Inc., 8-K, October 22, 2009

Schedule 16
PHILIP MORRIS INTERNATIONAL INC.and Subsidiaries
Reconciliation of Non-GAAP MeasuresReconciliation of Reported Diluted EPS to Adjusted Diluted EPS and Adjusted Diluted EPS, Excluding Currency
For the Nine Months Ended September 30,(Unaudited)
2009 2008 % Change Reported Diluted EPS $ 2.44 $ 2.60 (6.2)%
Less: Colombian investment and cooperation agreement charge (0.04) - Asset impairment and exit costs - (0.02) Equity loss from RBH legal settlement - (0.06) Tax items - 0.08
Adjusted Diluted EPS $ 2.48 $ 2.60 (4.6)%
Less: Currency Impact (0.52)
Adjusted Diluted EPS, Excluding Currency $ 3.00 $ 2.60 15.4%
30
Source: Philip Morris International Inc., 8-K, October 22, 2009

Schedule 17
PHILIP MORRIS INTERNATIONAL INC.and Subsidiaries
Reconciliation of Non-GAAP MeasuresReconciliation of Reported Diluted EPS to Reported Diluted EPS, Excluding Currency
For the Nine Months Ended September 30,(Unaudited)
2009 2008 % Change Reported Diluted EPS $ 2.44 $ 2.60 (6.2)%
Less: Currency Impact (0.52)
Reported Diluted EPS, Excluding Currency $ 2.96 $ 2.60 13.8%
31
Source: Philip Morris International Inc., 8-K, October 22, 2009

Schedule 18
PHILIP MORRIS INTERNATIONAL INC.and Subsidiaries
Reconciliation of Non-GAAP MeasuresCalculation of Total Debt to EBITDA and Net Debt to EBITDA Ratios
(in millions, except ratios)(Unaudited)
September 30, 2009
For the Year EndedDecember 31,
2008
October-December
2008 January-September
2009 12 months
rolling Earnings before income taxes $ 2,120 $ 7,027 $ 9,147 $ 9,937Interest expense, net 106 572 678 311Depreciation and amortization 217 607 824 842
EBITDA $ 2,443 $ 8,206 $ 10,649 $ 11,090
September 30,
2009 December 31,
2008Short-term borrowings $ 313 $ 375Current portion of long-term debt 197 209Long-term debt 13,741 11,377
Total debt $ 14,251 $ 11,961Less: Cash and cash equivalents 1,602 1,531
Net Debt $ 12,649 $ 10,430
Ratios Total Debt to EBITDA 1.34 1.08
Net Debt to EBITDA 1.19 0.94
32
Source: Philip Morris International Inc., 8-K, October 22, 2009

EXHIBIT 99.2
Philip Morris International Inc.2009 Third-Quarter Earnings Conference Call
October 22, 2009
NICK ROLLI(SLIDE 1.)
Welcome. Thank you for joining us. Earlier today, we issued a news release containing detailed information on our 2009 third-quarter results. Youmay access the release on our web site at www.pmintl.com.
(SLIDE 2.)As we take you through our call today, we will be talking about results in the third quarter of 2009 and comparing them with the same period in2008 unless specified otherwise. References to volumes are for PMI shipments. Industry volume and share data is sourced from A.C. Nielsen,other third party sources and internal estimates. Organic volume refers to volume excluding acquisitions. Net revenue data excludes excise taxes.
You will find data tables showing how we made adjustments to revenues and Operating Companies Income, or “OCI”, for currency andacquisitions, adjustments to EPS as well as other reconciliations to U.S. GAAP measures at the end of today’s web cast slides, which are postedon our web site.
(SLIDE 3.)Today’s remarks contain forward-looking statements and projections of future results, and I direct your attention to the Forward-Looking andCautionary Statements disclosure in today’s presentation and news release for a review of the various factors that could cause actual results todiffer materially from projections.
It’s now my pleasure to introduce Hermann Waldemer, Chief Financial Officer.
Hermann,
HERMANN WALDEMER
(SLIDE 4.)Welcome to our third-quarter earnings call. In spite of the impact of the global economic recession, I am pleased to announce that PMI hasachieved very strong third-quarter results that confirm our company’s ability to grow profitability even in these difficult times.
We have achieved excellent financial results in the quarter, thanks to our strong pricing initiatives, with net revenues excluding currency up 6.9%and excluding currency and acquisitions up 4.1%, adjusted operating companies income, or
1
Source: Philip Morris International Inc., 8-K, October 22, 2009
OCI, excluding currency up 13.7% and excluding currency and acquisitions up 10.6%, and adjusted diluted EPS excluding currency up 18.3%.
(SLIDE 5.)While we expect volume in 2009 to fall below last year’s levels, the 4.0% organic decline in the quarter was amplified by specific circumstances ina few markets. Therefore, our year-to-date organic volume decline of 2.1% better reflects our anticipated full year volume performance.
(SLIDE 6.)On a year-to-date basis through the end of September, we have achieved a 4.7% increase in net revenues excluding currency and acquisitions,an 8.6% increase in adjusted OCI excluding currency and acquisitions, and a 15.4% increase in adjusted diluted EPS excluding currency.
This chart shows that in 2009 we have delivered consistently against our mid to long-term currency neutral financial targets in spite ofrecession-driven weaker volumes, thus demonstrating our ability to generate strong results even in the most turbulent of economic times.
(SLIDE 7.)We are today revising our EPS guidance for the full year 2009 to a level of $3.20 to $3.25. Compared to our previous guidance of $3.10 to $3.20,this represents both an increase in our guidance and a narrowing of the range.
The improved and narrowed guidance reflects the continued strength of our underlying business and a more favorable currency environment. Weexpect the currency impact to be neutral in the fourth quarter of this year and, at current exchange rates, it would be a tailwind in 2010. However,we will continue to focus on our constant currency growth rates as PMI will continue to manage its business in the long term interests of itsshareholders.
(SLIDE 8.)The key driver of our improved profitability in 2009 has been our ability to successfully increase prices across nearly all our major markets whilesafeguarding our competitive position. I would like to emphasize again that our pricing decisions are established on a market by market basis,taking into account the competitive environment, consumer affordability and the fiscal and economic situation. We are confident that our priceincreases are sustainable and we will continue to balance revenue growth with volume growth going forward as, at the end of the day,shareholders are interested in Earnings Per Share rather than cigarettes per share.
Boosted by recent price increases in Germany and Spain, our pricing variance was $590 million in the third quarter for a total year-to-datevariance of $1.5 billion.
2
Source: Philip Morris International Inc., 8-K, October 22, 2009

(SLIDE 9.)Even though we increased prices this year at a somewhat faster rate than previously, consumer behavior has remained resilient during thisrecession. Consumer downtrading, which was a major concern of investors in the first half of the year, has remained a globally manageablephenomenon. It has had a substantial impact in three of our key markets that have been particularly affected by the economic crisis, namelyRussia, Spain and Ukraine. The situation in the latter has been severely exacerbated by very large excise tax increases. Positive trends have,however, continued in other emerging markets, such as Argentina, Indonesia and Mexico.
In most markets the key economic component that tends to impact consumer behavior is unemployment, and in particular any sharp increasesthereof. In this context, the consumer downtrading in Spain was therefore no surprise as unemployment has climbed to above 18% nationally andto 25% in the south of the country.
(SLIDE 10.)With the exception of Brazil and Ukraine, nearly all governments across the world have treated excise taxes so far in 2009 in a rational mannerand they have benefitted from the positive impact on excise tax yields of higher retail prices.
We remain optimistic that such a rational approach will generally prevail as governments prepare their budget plans for 2010. Although we doexpect some VAT increases, in addition to excise tax increases, as governments seek to boost their revenues, we believe that these should beglobally manageable.
(SLIDE 11.)Let me now highlight our performance in some of our key markets. As I mentioned earlier, the magnitude of the organic volume decline in thequarter can be attributed to exceptional factors, with nearly two thirds of the decline coming from three markets: Ukraine, Spain and Pakistan.
In Ukraine, the massive excise tax increase in May this year, which led to retail prices increases that month alone of 22% to 50% on PMI brands,resulted in a severe market disruption and our shipments were down by 23.0% in the quarter, broadly in line with the total market contraction.While our share declined slightly in June due to the greater availability of old price competitive products in the market, it has since recovered toreach 35.6% in the third quarter, 0.1 share points above last year’s level.
In Spain, the total cigarette market was down an estimated 10.2% in the quarter, due to the recession and higher retail prices, exacerbated byweak tourism. Our shipments declined by 23.5% due to unfavorable distributor inventory movements, as well as the overall market decline. Ourmarket share in the
3
Source: Philip Morris International Inc., 8-K, October 22, 2009

quarter was off just 0.2 points at 32.1%, with gains for L&M nearly completely offsetting the decline of Marlboro and Chesterfield.
The 16.1% shipment volume decline in Pakistan is attributable to trade inventory movements subsequent to the excise tax increase of June 2009.
(SLIDE 12.)In Russia, the total market, which grew at an estimated rate of some 4% in 2008, is declining at an estimated 3 to 4% this year, reflecting theeconomic downturn and the departure of an estimated two million migrant workers. In the third quarter, PMI shipments were down just 0.8%. Ourmarket share was, however, up 0.6 points in the third quarter to reach 25.6%. This strong performance is attributable to the growth of Bond Streetin the value and Optima in the low price segments, the resilience of Parliament, and the overall strength and range of our brand portfolio.
(SLIDE 13.)In Indonesia, market growth is trending at 3 to 4% this year, compared to an estimated 10% last year, even though the Indonesian economy hassuffered less than others from the global economic downturn. Due to the timing of Ramadan this year, PMI shipments were down 1.1% in thequarter. PMI’s key brand, A Mild, continued to grow share and was up 0.5 share points in July/August to 10.7%, while Marlboro’s share was alsohigher. Excluding currency, our OCI increased in Indonesia at a double-digit rate in the quarter.
(SLIDE 14.)Marlboro continued to perform strongly in Japan in the third quarter, gaining 0.4 share points to 10.6% behind the success of Marlboro BlackMenthol and Marlboro Filter Plus. During the quarter, we rolled-out Lark Mint Splash nationally. Along with the previously launched Lark ClassicMilds, this new launch has helped to stabilize the market share of the Lark family at 6.6% in the third quarter. These innovative new products fromMarlboro and Lark have helped consolidate our leadership in the growing menthol segment, which was up 1.1 share points to 23.2% in a totalmarket that was down 3.0% in the quarter.
With respect to the intentions of the new Government in Japan as to the future of the tobacco sector, there is, at this stage, much speculation butnothing concrete. We expect clarification of their plans early next year. We continue to advocate regular, moderate excise tax increases combinedwith manufacturers’ pricing freedom.
(SLIDE 15.)The highlight of our strong quarter in Asia was Korea. Our shipments increased by 21.4% and we gained 2.4 share points to a record quarterlylevel of 14.6%, due mainly to the continued strong performance of Marlboro and Parliament.
4
Source: Philip Morris International Inc., 8-K, October 22, 2009

(SLIDE 16.)I will now turn to our improved results in the European Union Region. Adjusted OCI excluding currency and acquisitions increased by 5.3% in thethird quarter, helped by price increases in Germany and Spain that more than offset negative volume and mix. On a constant currency basis, ouradjusted OCI margin grew by 2.2 points to 52.2%. Our market share was down slightly by 0.2 points at 38.9%, due to a weaker performance ofMarlboro in France, Germany and Spain. However, we are continuing to strengthen our second pillar in the EU Region: L&M, already the Region’ssecond best selling brand, gained 0.9 share points to reach a 5.7% regional share behind strong performances notably in Germany, Poland andSpain. We are optimistic that the roll-out in the EU Region of our innovation pipeline behind Marlboro will start to bear fruit next year.
(SLIDE 17.)We are very pleased by the strong performance of Marlboro in Italy. We succeeded in growing the market share of Marlboro during the thirdquarter from 22.6% last year to 23.1% this year and thus stabilized our overall market share at 54.5%. This achievement was made possible bythe successful launch of Marlboro Gold Touch , a new innovative offering in an unprecedented cigarette format, designed with a slightly slimmerdiameter to provide a smooth taste and comfort in the hand. Marlboro Gold Touch achieved a 1.4% market share in Italy in the third quarter andcontinues to grow.
(SLIDE 18.)On a global basis, we have continued to benefit from the strength of our overall portfolio. Where downtrading has occurred, we have generallybeen successful in keeping our consumer base thanks to our range of strong value international and local heritage brands.
Our best performing international brands in this recessionary environment have been Bond Street, particularly in Russia, and Lark, particularly inTurkey, which are in the lower price categories.
In the premium segment, the rate of decline in the shipments of Parliament and Marlboro during the third quarter was in line with our overallorganic volume trend. Both brands achieved volume growth in the quarter in Asia, primarily driven by their strong performance in Korea, and theyhave been gaining share in the premium segment in most key markets.
(SLIDE 19.)We have continued to invest strongly behind our key brands, increasing the level of our spending this year in the EU Region behind Marlboro. Thenew architecture for Marlboro is being successfully deployed in two steps. We are strengthening the core Red and Gold variants through anupgrade of the Red pack, so far available in Austria, France and Italy, and the modernization of the
5
Source: Philip Morris International Inc., 8-K, October 22, 2009

Gold pack, now available in 26 countries. Consumer perception of the new Gold packaging is very positive.
(SLIDE 20.)The second aspect of the roll-out of the Marlboro architecture is the development and launch of innovative line extensions appropriate for eachfamily and in line with adult consumer preferences. These new products have not been deployed globally, but rather we have focused on one ortwo of them per market, establishing priorities on a country by country basis in line with our enhanced consumer understanding and engagement.In total, we have launched Red line extensions in 34 markets, Gold line extensions in 17 markets and Fresh line extensions in 33 markets.
(SLIDE 21.)Let me give you some examples of our successful innovative Marlboro line extensions. Marlboro Filter and Flavor Plus have an innovative fourchamber filter that includes a tobacco plug intended to enhance the flavor experience in a low tar cigarette, and is sold in an innovative slidingpack. Marlboro Filter and Flavor Plus is available in 6, 3 and 1 mg variants. In July/August this year, Marlboro Filter Plus notably achieved a 2.4%share in Romania, 2.3% in Kuwait, 1.8% in Paraguay and 1.3% in Kazakhstan.
(SLIDE 22.)Under the Marlboro Gold umbrella, we have launched a range of different line extensions.
Marlboro Gold Advance is a smoother tasting full-flavor product in a very elegant anthracite pack. This variant is now available in four markets andachieved a promising 0.3% national share in France and Portugal in September following its launch this June and July respectively.
Marlboro Gold Touch is available in eight markets in addition to Italy. In Greece, based on in-market sales data, Marlboro Gold Touch already hada 0.5% market share in September and initial consumer research learning in July showed that over 40% of early adopters were Legal Age(minimum 18) – 24 year old smokers.
Marlboro Gold Edge is a super-slims variant that is sold mainly in Central and Eastern Europe. During the third quarter, it achieved a 3.4% shareof the fast growing super-slims segment in Poland and a 4.8% segment share in Hungary, and is performing well in duty-free outlets.
Marlboro Gold Smooth 1mg has been launched in the Middle East. In August, it achieved market shares of 0.7% in Kuwait, 0.5% in the UAE and0.3% in Saudi Arabia.
6
Source: Philip Morris International Inc., 8-K, October 22, 2009

(SLIDE 23.)In the Marlboro Fresh family, our most successful innovation has been Marlboro Black Menthol with its refreshing high menthol content andattractive pack. In the third quarter this year, Marlboro Black Menthol obtained a 1.4% market share in Japan and a 3.3% market share in HongKong. Marlboro Black Menthol has also been launched this year in Indonesia, Malaysia and the Philippines.
(SLIDE 24.)Our latest innovative line extension is Marlboro Superpremium. The cigarette is made using top grade flue-cured and burley tobaccos. Thedistinctive pack, with its red metallic interior, was designed by Pininfarina, the world famous Italian designer of cars, notably Ferrari models.Marlboro Superpremium was launched in the exclusive setting of the Singapore Formula One Grand Prix last month.
(SLIDE 25.)Our strength in the premium segment underpins our profitability and positions us very well to further grow profitably as the world economygradually moves out of a recession, during which our cash flow has remained formidable. In the third quarter, our free cash flow totaled $1.7 billionand year-to-date it has reached $5.9 billion. Excluding the impact of currency on net earnings, free cash flow was 17.0% higher in the quarter and12.4% higher in 2009 through the end of September.
(SLIDE 26.)Our commitment to enhance shareholder returns remains as strong as ever. Reflecting the strength of our underlying business, we increased ourquarterly dividend in September by 7.4% to a level of $0.58 per share. At our current stock price of $50.82 per share, this represents an attractiveyield of 4.6%.
We have continued to steadily implement our share repurchase program, spending a further $1.5 billion in the third quarter to buy back anadditional 31.5 million shares. We now have $3.4 billion remaining in our $13 billion program, which runs through the end of April next year.
In 2009, we have so far returned a total of $7.4 billion to our shareholders through dividends and share repurchases. Since we were spun off inMarch 2008, the number rises to $15.0 billion, representing more than 15% of our current market cap.
(SLIDE 27.)Our financial strength is a key component of our success in the current difficult economic environment. It is reinforced by our excellent businessmomentum. The third quarter has illustrated again our ability to deliver against all our currency neutral financial targets. While volumes remainweaker than last year, we have more than offset this by higher prices, strong performances in most key markets, the continued benefits of ourproductivity and cost saving programs and we have intensified our efforts to optimize working capital levels.
7
Source: Philip Morris International Inc., 8-K, October 22, 2009
Today, we have raised our 2009 EPS guidance for 2009 to $3.20 to $3.25, representing an increase of 12% to 14% compared to 2008 on acurrency neutral basis.
(SLIDE 28.)Thank you for your interest in our company. I will now be happy to take your questions.
8
Source: Philip Morris International Inc., 8-K, October 22, 2009

2009 Third-Quarter Results22 October 2009
Exhibit 99.3
Source: Philip Morris International Inc., 8-K, October 22, 2009

Philip Morris International
2
IntroductionIntroductionUnless otherwise stated, we will be talking about results in thethird quarter 2009 and comparing them with the same period in2008References to PMI volumes refer to shipment dataIndustry volume and market shares are sourced from A.C.Nielsen, other third party sources and internal estimatesOrganic volume refers to volume excluding acquisitionsNet revenues exclude excise taxesData tables showing adjustments to revenues and OperatingCompanies Income (OCI) for currency and acquisitions,adjustments to EPS, and other reconciliations to U.S. GAAPmeasures are at the end of today’s web cast slides and areposted on our web site
Source: Philip Morris International Inc., 8-K, October 22, 2009

Philip Morris International
3
Forward-Looking and Cautionary StatementsForward-Looking and Cautionary Statements
This presentation and related discussion contain statements that, tothe extent they do not relate strictly to historical or current facts,constitute “forward-looking statements” within the meaning of thePrivate Securities Litigation Reform Act of 1995. Such forward-looking statements are based on current plans, estimates andexpectations, and are not guarantees of future performance. Theyare based on management’s expectations that involve a number ofbusiness risks and uncertainties, any of which could cause actualresults to differ materially from those expressed in or implied by theforward-looking statements. PMI undertakes no obligation topublicly update or revise any forward-looking statements, except inthe normal course of its public disclosure obligations. The risks anduncertainties relating to the forward-looking statements in thispresentation include those described under Item 1A. “Risk Factors”in PMI’s Form 10-K for the year ended December 31, 2008, and Form10-Q for the quarter ended June 30, 2009, filed with the Securitiesand Exchange Commission.
Source: Philip Morris International Inc., 8-K, October 22, 2009

Philip Morris International
4
Third-Quarter 2009 ResultsThird-Quarter 2009 Results
Excluding
18.3%
13.7%
6.9%
Currency
- %0.93Adjusted Diluted EPS ($ / share)
10.6%(1.5)%2.9Adjusted OCI ($ billion) (b)
4.1%(5.3)%6.6Net Revenues ($ billion) (a)
(4.0)%(2.9)%219.3Cigarette Volume (units billion)
Currency &Acquisitions
Increase /(Decrease)Q3, 2009
Growth Q3, 2009 vs. Q3, 2008
(a) Excluding excise taxes(b) Less asset impairment and exit costsSource: PMI Financials
Source: Philip Morris International Inc., 8-K, October 22, 2009

Philip Morris International
5
2009 Results2009 Results
2009 Growth Rates
Q3Q2Q1YTD Sept
(4.0)%(1.1)%(1.1)%(2.1)%1 %Cigarette Volume (a)
Mid to Long-TermGrowth Targets
(a) Excluding acquisitionsSource: PMI Financials
Source: Philip Morris International Inc., 8-K, October 22, 2009

Philip Morris International
6
2009 Results2009 Results
2009 Growth Rates
Q3(d)Q2(d)Q1(d)YTD Sept
18.3 %17.2 %11.3 %15.4 %10 – 12 %Adjusted Diluted EPS (c)
10.6 %9.5 %5.3 %8.6 %6 – 8 %Adjusted OCI (b)
4.1 %6.1 %3.9 %4.7 %4 – 6 %Net Revenues (a)(b)
Mid to Long-TermGrowth Targets
(a) Excluding excise taxes(b) Excluding currency and acquisitions(c) Excluding currency(d) Please see relevant quarterly reconciliation slides, posted on our web siteSource: PMI Financials
Source: Philip Morris International Inc., 8-K, October 22, 2009

Philip Morris International
7
2009 EPS Guidance2009 EPS GuidanceRevised guidance: $3.20 - $3.25Previous guidance: $3.10 - $3.20Revised guidance represents both an increase and anarrowing of the rangeIncreased guidance reflects both the strength of ourunderlying business and slightly more favorableexchange rates
Source: PMI Financials
Source: Philip Morris International Inc., 8-K, October 22, 2009

Philip Morris International
8
PricingPricingIn 2009, PMI implemented price increases notably in:
Pricing variance was $590 million in the third quarterof 2009 and $1.5 billion YTD September 2009
ArgentinaBrazil
CanadaDominican Rep.
AustraliaIndonesiaPakistan
PhilippinesThailand
RomaniaRussia
South AfricaTurkeyUkraine
GermanyItaly
PolandSpain
UK
LA & CanadaAsiaEEMAEU
Source: PMI Financials
Source: Philip Morris International Inc., 8-K, October 22, 2009
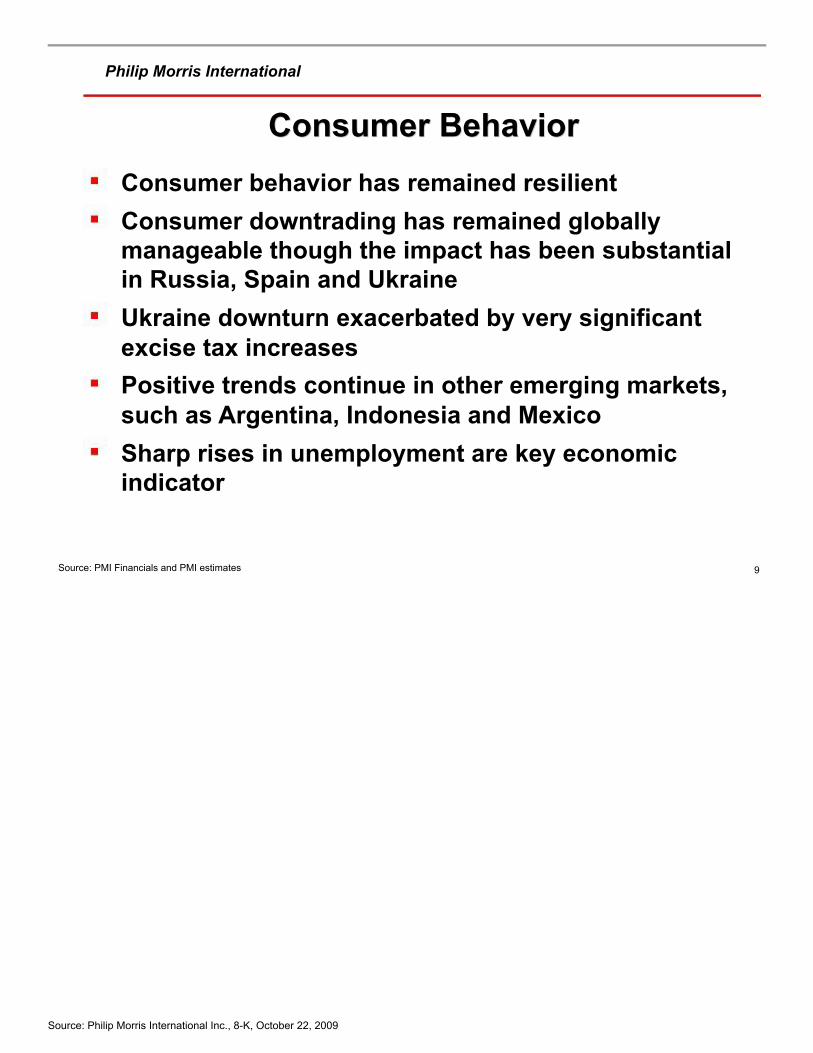
Philip Morris International
9
Consumer BehaviorConsumer BehaviorConsumer behavior has remained resilientConsumer downtrading has remained globallymanageable though the impact has been substantialin Russia, Spain and UkraineUkraine downturn exacerbated by very significantexcise tax increasesPositive trends continue in other emerging markets,such as Argentina, Indonesia and MexicoSharp rises in unemployment are key economicindicator
Source: PMI Financials and PMI estimates
Source: Philip Morris International Inc., 8-K, October 22, 2009

Philip Morris International
10
Excise Taxes and VATExcise Taxes and VATGovernments treating excise taxes rationally in 2009(key exceptions: Brazil and Ukraine)Rational approach expected to continue in 2010Although we expect some VAT increases, as well asexcise tax increases, next year, as governments seekto boost revenues, we expect them to remain globallymanageable
Source: Philip Morris International Inc., 8-K, October 22, 2009

Philip Morris International
11
Volume AnalysisVolume AnalysisOrganic volume decline in Q3, 2009, is notrepresentative of expected full-year performanceNearly two thirds of Q3, 2009, organic volume declinecan be attributed to:– Ukraine: market disruption resulting from massive excise tax
driven price increase in May– Spain: recession and price increases, exacerbated by weak
tourism and the impact of unfavorable distributor inventorymovements on PMI shipments
– Pakistan: trade inventory movements subsequent to theexcise tax increase of June 2009
Source: PMI Financials and PMI estimates
Source: Philip Morris International Inc., 8-K, October 22, 2009

Philip Morris International
12
RussiaRussia
PMI Market ShareTotal market trendingdown 3-4% in 2009PMI shipments in Q3, 2009,decreased by just 0.8%PMI market share in Q3,2009, was up 0.6 pp to25.6%:– growth of Bond Street in
the value and Optima inthe low price segment
– resilience of Parliament– overall strength and range
of brand portfolioSource: A.C. Nielsen, PMI estimates and PMI Financials
(%)
25.0 25.6
0
30
Q3, 2008 Q3, 2009
Source: Philip Morris International Inc., 8-K, October 22, 2009

Philip Morris International
13
IndonesiaIndonesiaTotal industry growing by 3-4%in 2009Timing of Ramadan resulted inPMI volume decline of 1.1% inQ3, 2009A Mild continued to gain share,up 0.5 pp to 10.7% in July/Aug2009OCI increased at double-digitrate, excluding currency, in Q3,2009
Source: AC Nielsen, PMI estimates and PMI Financials
Source: Philip Morris International Inc., 8-K, October 22, 2009

Philip Morris International
14
22.1 23.2
Q32008
Q32009
45%
34%
21%
10.2 10.6
6.6 6.6
Q32008
Q32009
Q32008
Q32009
JapanJapan
JT
PMIBAT
Menthol SoM (%)
Menthol Segment
Market Shares (%)
Source: Tobacco Institute of Japan and PMI estimates
Share of Segment
Marlboro Lark
Q3, 2009
Marlboro growth driven bysuccess of Marlboro BlackMenthol and MarlboroFilter PlusNational roll-out of LarkMint Splash, as well asLark Classic Milds, helpingto stabilize the brandTotal market down 3.0% inQ3, 2009No decisions yet ontobacco issues by newJapanese government
Source: Philip Morris International Inc., 8-K, October 22, 2009

Philip Morris International
15
2.7 3.3 3.6 3.5 4.0 4.0 4.5
4.54.8 4.8 5.0
5.8 5.66.011.0
11.8 12.2 12.3
13.8 13.614.6
0
15
Q1 Q2 Q3 Q4 Q1 Q2 Q3
KoreaKorea
(%)Market Shares
Parliament
Marlboro
PMI Total
2008 2009Source: PMI estimates
Other
Source: Philip Morris International Inc., 8-K, October 22, 2009
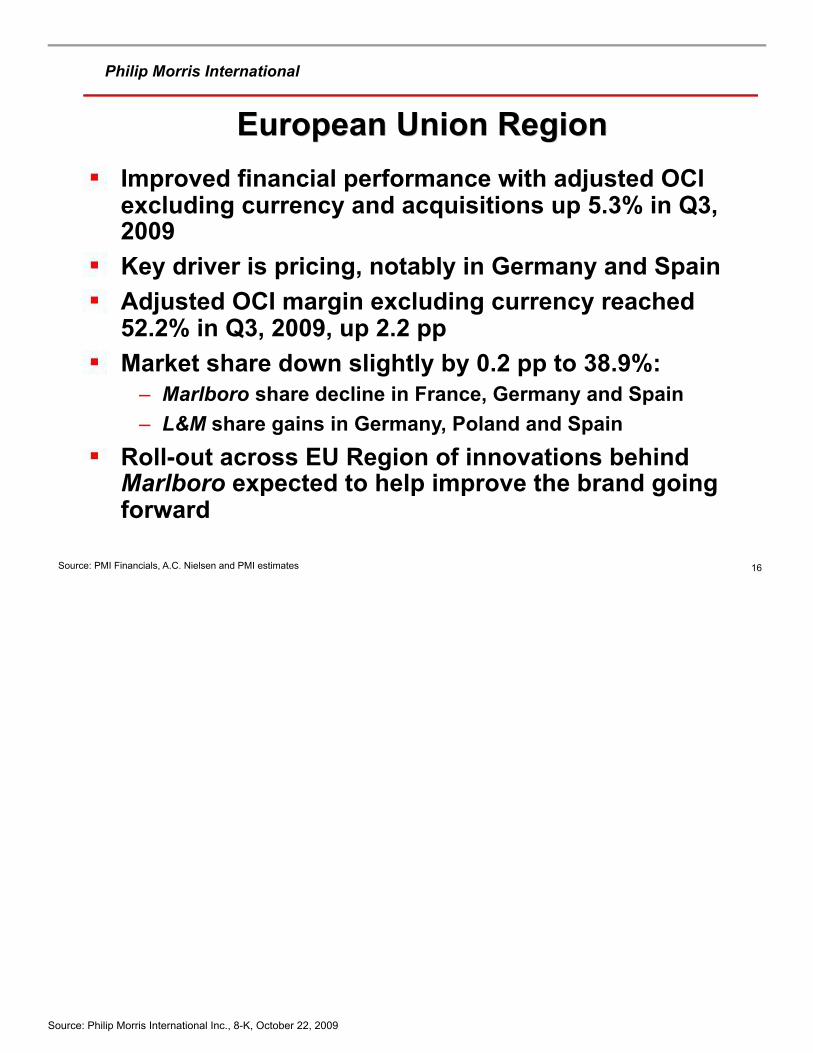
Philip Morris International
16
European Union RegionEuropean Union RegionImproved financial performance with adjusted OCIexcluding currency and acquisitions up 5.3% in Q3,2009Key driver is pricing, notably in Germany and SpainAdjusted OCI margin excluding currency reached52.2% in Q3, 2009, up 2.2 ppMarket share down slightly by 0.2 pp to 38.9%:
– Marlboro share decline in France, Germany and Spain– L&M share gains in Germany, Poland and Spain
Roll-out across EU Region of innovations behindMarlboro expected to help improve the brand goingforward
Source: PMI Financials, A.C. Nielsen and PMI estimates
Source: Philip Morris International Inc., 8-K, October 22, 2009

Philip Morris International
17
22.6 23.1
54.5 54.5
0
60
Q3 Q3 Q3 Q3
ItalyItaly
(%)
Market Shares
PMI
Marlboro
2008 2009 2008 2009
Source: PMI estimates
1.4% market sharein Q3, 2009
Source: Philip Morris International Inc., 8-K, October 22, 2009

Philip Morris International
18
Brand PortfolioBrand Portfolio
Mid Price
Premium &Above
Local HeritageInternational
Low Price
Source: Philip Morris International Inc., 8-K, October 22, 2009

Philip Morris International
19
MarlboroMarlboro ArchitectureArchitecture
“Smooth tasteand style”
“Fresh tastesensations”
Red Gold Fresh
“Flavorenjoyment”
Source: Philip Morris International Inc., 8-K, October 22, 2009
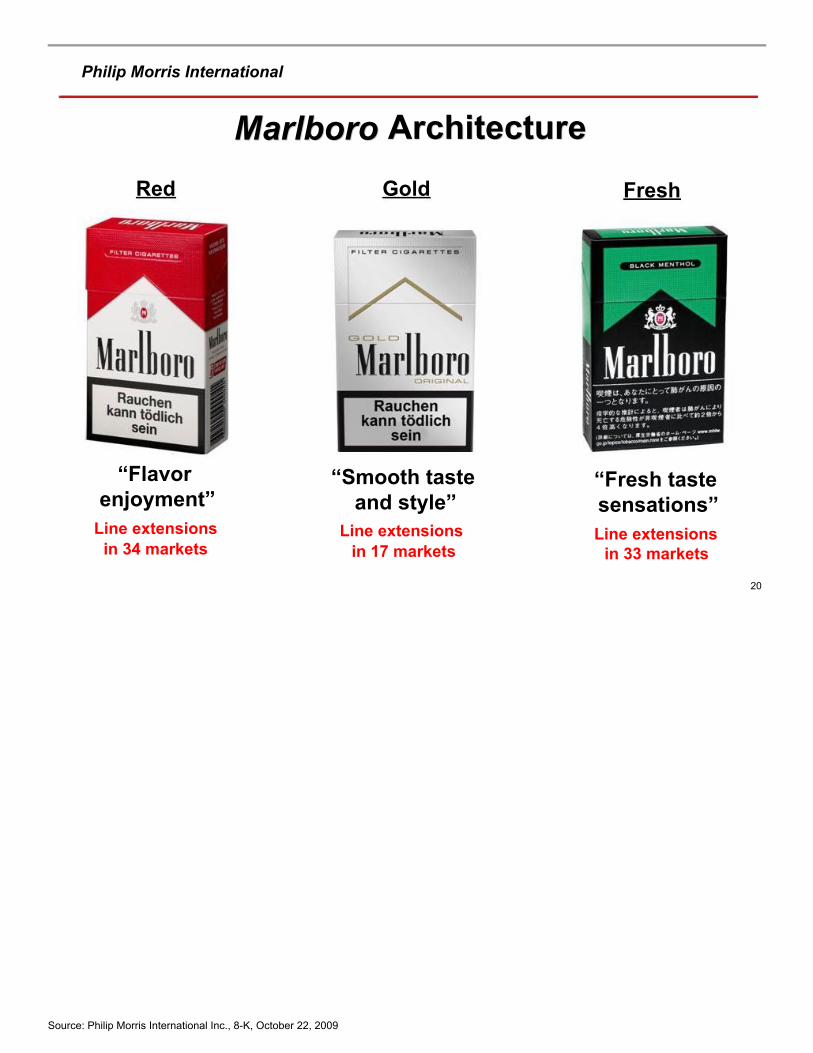
Philip Morris International
20
MarlboroMarlboro ArchitectureArchitecture
“Flavorenjoyment”
Line extensionsin 34 markets
“Smooth tasteand style”
Line extensionsin 17 markets
“Fresh tastesensations”Line extensions
in 33 markets
Red Gold Fresh
Source: Philip Morris International Inc., 8-K, October 22, 2009

Philip Morris International
21
Red Line: Marlboro Filter / Flavor PlusRed Line: Marlboro Filter / Flavor PlusTobacco included in filterto enhance flavorInnovative sliding packMarket shares (July/Aug):– Romania 2.4%– Kuwait 2.3%– Paraguay 1.8%– Kazakhstan 1.3%
Source: AC Nielsen, PMI estimates and Business Analytica
Source: Philip Morris International Inc., 8-K, October 22, 2009

Philip Morris International
22
Marlboro GoldMarlboro Gold
Source: Philip Morris International Inc., 8-K, October 22, 2009

Philip Morris International
23
Fresh Line: Marlboro Black MentholFresh Line: Marlboro Black MentholAvailable at different tarlevelsRefreshing high mentholcontentAttractive packMarket shares in Q3, 2009:– Hong Kong 3.3% – Japan 1.4%
Launched this year also inIndonesia, Malaysia andPhilippines
Source: A.C. Nielsen and Tobacco Institute of Japan
Source: Philip Morris International Inc., 8-K, October 22, 2009

Philip Morris International
24
Marlboro SuperpremiumMarlboro Superpremium
Source: Philip Morris International Inc., 8-K, October 22, 2009
Philip Morris International
25
Cash FlowCash FlowFree cash flow in the third quarter totaled $1.7 billionand reached $5.9 billion year-to-date (a)
Excluding the impact of currency on net earnings, freecash flow was 17.0% higher in the quarter and 12.4%higher in 2009 through the end of September
(a) Free cash flow equals net cash provided by operating activities less capital expenditures. In Q3, 2009, net cash flow provided by operating activitieswas $1,846 million and capital expenditures $160 million. YTD September 2009, net cash flow provided by operating activities was $6,419 millionand capital expenditures $483 million.
Source: PMI Financials
Source: Philip Morris International Inc., 8-K, October 22, 2009

Philip Morris International
26
Shareholder ReturnsShareholder ReturnsQuarterly dividend increased in September by 7.4% to$0.58 per shareA further $1.5 billion in share repurchases in Q3, 2009This year so far, $7.4 billion returned to shareholdersthrough dividends and share repurchasesSince March 2008 spin-off, $15.0 billion returned toshareholders, representing more than 15% of ourcurrent market capitalization
Source: PMI Financials
Source: Philip Morris International Inc., 8-K, October 22, 2009
Philip Morris International
27
ConclusionsConclusionsFinancial strength is a key component of oursuccessExcellent business momentumConsistently delivering against our constantcurrency financial targetsHigher pricing, good business performance inmost key markets and cost savings driving ourprofitability growthIncreased 2009 EPS guidance of $3.20 - $3.25,representing a currency neutral growth rate of 12% - 14%
Source: PMI Financials
Source: Philip Morris International Inc., 8-K, October 22, 2009
Questions & Answers
Source: Philip Morris International Inc., 8-K, October 22, 2009

Philip Morris International
29
PHILIP MORRIS INTERNATIONAL INC.
(in millions)(Unaudited)
For the Quarters Ended September 30,
and SubsidiariesReconciliation of Non-GAAP Measures
Adjustments for the Impact of Currency and Acquisitions
Reported NetRevenues
LessExciseTaxes
Reported NetRevenuesexcluding
Excise TaxesLess
Currency
Reported NetRevenuesexcluding
Excise Taxes& Currency
LessAcquisi-
tions
Reported NetRevenuesexcluding
Excise Taxes, Currency &
AcquisitionsReported Net
Revenues
LessExciseTaxes
Reported NetRevenuesexcluding
Excise Taxes Reported
ReportedexcludingCurrency
Reportedexcluding
Currency &Acquisitions
7,783$ 5,375$ 2,408$ (304)$ 2,712$ 12$ 2,700$ European Union 8,451$ 5,780$ 2,671$ (9.8)% 1.5% 1.1%3,722 1,892 1,830 (425) 2,255 4 2,251 EEMA 4,163 2,054 2,109 (13.2)% 6.9% 6.7%3,170 1,519 1,651 (7) 1,658 - 1,658 Asia 3,188 1,578 1,610 2.5 % 3.0% 3.0%1,898 1,200 698 (110) 808 180 628 Latin America & Canada 1,563 1,000 563 24.0 % 43.5% 11.5%
16,573$ 9,986$ 6,587$ (846)$ 7,433$ 196$ 7,237$ PMI Total 17,365$ 10,412$ 6,953$ (5.3)% 6.9% 4.1%
ReportedOperating
CompaniesIncome
LessCurrency
ReportedOperating
CompaniesIncome
excludingCurrency
LessAcquisi-
tions
ReportedOperating
CompaniesIncome
excludingCurrency &
Acquisitions
ReportedOperating
CompaniesIncome Reported
ReportedexcludingCurrency
Reportedexcluding
Currency &Acquisitions
1,267$ (147)$ 1,414$ 9$ 1,405$ European Union 1,325$ (4.4)% 6.7% 6.0%761 (290) 1,051 5 1,046 EEMA 946 (19.6)% 11.1% 10.6%653 44 609 - 609 Asia 558 17.0 % 9.1% 9.1%226 (56) 282 77 205 Latin America & Canada 110 100+% 100+% 86.4%
2,907$ (449)$ 3,356$ 91$ 3,265$ PMI Total 2,939$ (1.1)% 14.2% 11.1%
2009 2008% Change in Reported Operating
Companies Income
2009 2008% Change in Reported Net Revenues
excluding Excise Taxes
Source: Philip Morris International Inc., 8-K, October 22, 2009

Philip Morris International
30
Reconciliation of Adjusted Operating Companies Income Margin, Excluding Currency
(in millions)
PHILIP MORRIS INTERNATIONAL INC.and Subsidiaries
Reconciliation of Non-GAAP Measures
(Unaudited)
Reconciliation of Reported Operating Companies Income to Adjusted Operating Companies Income &
For the Quarters Ended September 30,
(1) For the calculation of net revenues excluding excise taxes and currency, refer to slide 28
ReportedOperating
CompaniesIncome
LessAsset
Impairment& ExitCosts
AdjustedOperating
CompaniesIncome
LessCurrency
AdjustedOperating
CompaniesIncome
excludingCurrency
LessAcquisi-
tions
AdjustedOperating
CompaniesIncome
excludingCurrency &
Acquisitions
ReportedOperating
CompaniesIncome
LessAsset
Impairment& ExitCosts
AdjustedOperating
CompaniesIncome Adjusted
AdjustedexcludingCurrency
Adjustedexcluding
Currency &Acquisitions
1,267$ (1)$ 1,268$ (147)$ 1,415$ 9$ 1,406$ European Union 1,325$ (10)$ 1,335$ (5.0)% 6.0% 5.3%761 - 761 (290) 1,051 5 1,046 EEMA 946 - 946 (19.6)% 11.1% 10.6%653 - 653 44 609 - 609 Asia 558 - 558 17.0 % 9.1% 9.1%226 - 226 (56) 282 77 205 Latin America & Canada 110 (3) 113 100.0 % 100+% 81.4%
2,907$ (1)$ 2,908$ (449)$ 3,357$ 91$ 3,266$ PMI Total 2,939$ (13)$ 2,952$ (1.5)% 13.7% 10.6%
% Points Change
AdjustedOperating
CompaniesIncome
excludingCurrency
NetRevenuesexcluding
ExciseTaxes &
Currency (1)
AdjustedOperating
CompaniesIncomeMargin
excludingCurrency
AdjustedOperating
CompaniesIncome
NetRevenuesexcluding
ExciseTaxes (1)
AdjustedOperating
CompaniesIncomeMargin
AdjustedOperating
CompaniesIncome Margin
excludingCurrency
1,415$ 2,712$ 52.2% European Union 1,335$ 2,671$ 50.0% 2.2 pp1,051 2,255 46.6% EEMA 946 2,109 44.9% 1.7 pp
609 1,658 36.7% Asia 558 1,610 34.7% 2.0 pp282 808 34.9% Latin America & Canada 113 563 20.1% 14.8 pp
3,357$ 7,433$ 45.2% PMI Total 2,952$ 6,953$ 42.5% 2.7 pp
20082009
2009 2008% Change in Adjusted Operating
Companies Income
Source: Philip Morris International Inc., 8-K, October 22, 2009

Philip Morris International
31
Reconciliation of Reported Diluted EPS to Adjusted Diluted EPS and Adjusted Diluted EPS, Excluding CurrencyFor the Quarters Ended September 30,
(Unaudited)
PHILIP MORRIS INTERNATIONAL INC.and Subsidiaries
Reconciliation of Non-GAAP Measures
2009 2008 % Change
Reported Diluted EPS 0.93$ 1.01$ (7.9)%
Less:Asset impairment and exit costs - -
Tax items - 0.08
Adjusted Diluted EPS 0.93$ 0.93$ -
Less:Currency Impact (0.17)
Adjusted Diluted EPS, Excluding Currency 1.10$ 0.93$ 18.3 %
Source: Philip Morris International Inc., 8-K, October 22, 2009
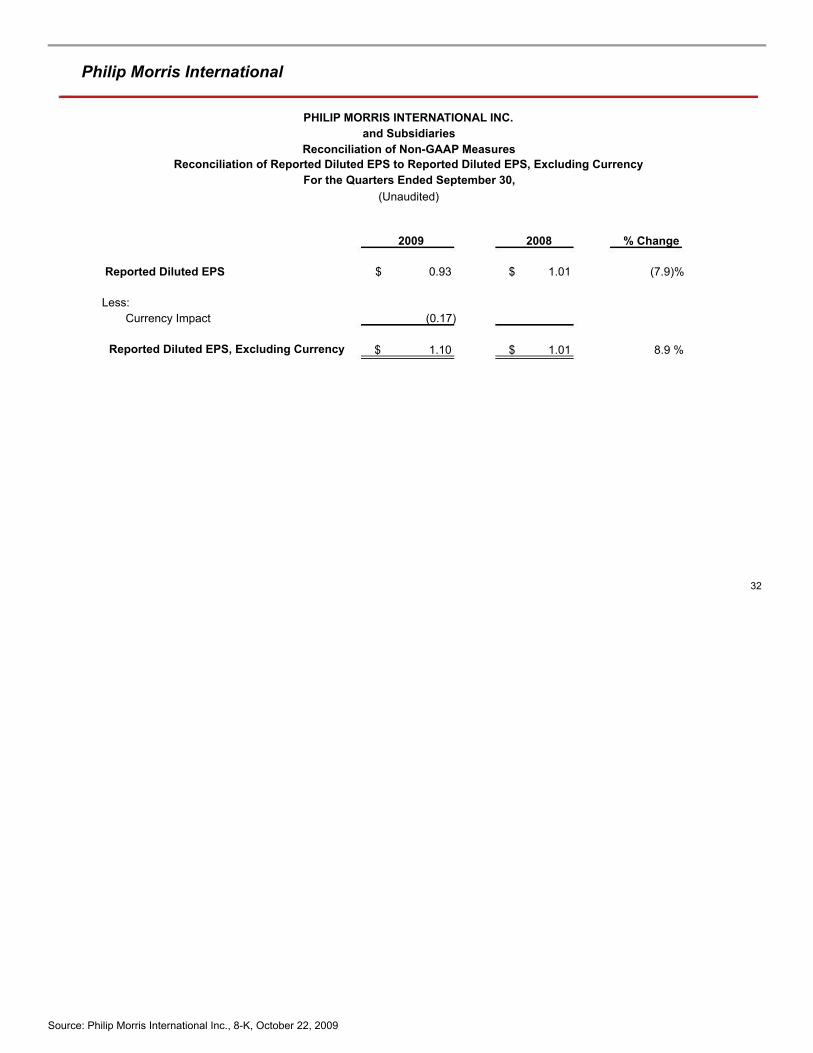
Philip Morris International
32
Reconciliation of Reported Diluted EPS to Reported Diluted EPS, Excluding CurrencyFor the Quarters Ended September 30,
(Unaudited)
PHILIP MORRIS INTERNATIONAL INC.and Subsidiaries
Reconciliation of Non-GAAP Measures
2009 2008 % Change
Reported Diluted EPS 0.93$ 1.01$ (7.9)%
Less:Currency Impact (0.17)
Reported Diluted EPS, Excluding Currency 1.10$ 1.01$ 8.9 %
Source: Philip Morris International Inc., 8-K, October 22, 2009

Philip Morris International
33
(in millions)For the Nine Months Ended September 30,
and SubsidiariesReconciliation of Non-GAAP Measures
Adjustments for the Impact of Currency and Acquisitions
(Unaudited)
PHILIP MORRIS INTERNATIONAL INC.
Reported NetRevenues
LessExciseTaxes
Reported NetRevenuesexcluding
Excise TaxesLess
Currency
Reported NetRevenuesexcluding
Excise Taxes& Currency
LessAcquisi-
tions
Reported NetRevenuesexcluding
Excise Taxes, Currency &
AcquisitionsReported Net
Revenues
LessExciseTaxes
ReportedNet
Revenuesexcluding
ExciseTaxes Reported
ReportedexcludingCurrency
Reportedexcluding
Currency &Acquisitions
20,988$ 14,313$ 6,675$ (1,008)$ 7,683$ 50$ 7,633$ European Union 23,427$ 15,866$ 7,561$ (11.7)% 1.6% 1.0%9,953 5,031 4,922 (1,198) 6,120 7 6,113 EEMA 11,248 5,544 5,704 (13.7)% 7.3% 7.2%8,974 4,160 4,814 (195) 5,009 - 5,009 Asia 9,334 4,617 4,717 2.1 % 6.2% 6.2%5,157 3,250 1,907 (308) 2,215 462 1,753 Latin America & Canada 4,413 2,812 1,601 19.1 % 38.4% 9.5%
45,072$ 26,754$ 18,318$ (2,709)$ 21,027$ 519$ 20,508$ PMI Total 48,422$ 28,839$ 19,583$ (6.5)% 7.4% 4.7%
ReportedOperating
CompaniesIncome
LessCurrency
ReportedOperating
CompaniesIncome
excludingCurrency
LessAcquisi-
tions
ReportedOperating
CompaniesIncome
excludingCurrency &
Acquisitions
ReportedOperating
CompaniesIncome Reported
ReportedexcludingCurrency
Reportedexcluding
Currency &Acquisitions
3,397$ (572)$ 3,969$ 36$ 3,933$ European Union 3,779$ (10.1)% 5.0% 4.1%1,982 (758) 2,740 7 2,733 EEMA 2,439 (18.7)% 12.3% 12.1%1,933 67 1,866 - 1,866 Asia 1,631 18.5 % 14.4% 14.4%
452 (138) 590 202 388 Latin America & Canada 282 60.3 % 100+% 37.6%
7,764$ (1,401)$ 9,165$ 245$ 8,920$ PMI Total 8,131$ (4.5)% 12.7% 9.7%
(1) As discussed in Note 1. Background and Basis of Presentation of our 2008 consolidated financial statements which appears in our Annual Report on Form 10-K, prior to 2008, certain of our subsidiaries reported theirresults up to ten days before the end of December, rather than on December 31. During 2008, these subsidiaries moved to a December 31 closing date. As a result, certain amounts in the first quarter of 2008 were revisedto reflect this change.
2009 2008 (1)% Change in Reported Net Revenues
excluding Excise Taxes
2009 2008 (1)% Change in Reported Operating
Companies Income
Source: Philip Morris International Inc., 8-K, October 22, 2009

Philip Morris International
34
Reconciliation of Adjusted Operating Companies Income Margin, Excluding Currency
(Unaudited)
For the Nine Months Ended September 30,(in millions)
PHILIP MORRIS INTERNATIONAL INC.and Subsidiaries
Reconciliation of Non-GAAP MeasuresReconciliation of Reported Operating Companies Income to Adjusted Operating Companies Income &
(3) Represents 2008 equity loss from RBH legal settlement ($124 million) and asset impairment and exit costs ($3 million).(4) For the calculation of net revenues excluding excise taxes and currency, refer to slide 32.
(2) Represents 2009 Colombian investment and cooperation agreement charge.
(1) As discussed in Note 1. Background and Basis of Presentation of our 2008 consolidated financial statements which appears in our Annual Report on Form 10-K, prior to 2008, certain of our subsidiaries reported theirresults up to ten days before the end of December, rather than on December 31. During 2008, these subsidiaries moved to a December 31 closing date. As a result, certain amounts in the first quarter of 2008 were revised toreflect this change.
ReportedOperating
CompaniesIncome
LessAsset
Impairment/Exit Costsand Other
AdjustedOperating
CompaniesIncome
LessCurrency
AdjustedOperating
CompaniesIncome
excludingCurrency
LessAcquisi-
tions
AdjustedOperating
CompaniesIncome
excludingCurrency &Acquisitions
ReportedOperating
CompaniesIncome
LessAsset
Impairment/Exit Costsand Other
AdjustedOperating
CompaniesIncome Adjusted
AdjustedexcludingCurrency
Adjustedexcluding
Currency &Acquisitions
3,397$ (3)$ 3,400$ (572)$ 3,972$ 36$ 3,936$ European Union 3,779$ (66)$ 3,845$ (11.6)% 3.3% 2.4%1,982 - 1,982 (758) 2,740 7 2,733 EEMA 2,439 (1) 2,440 (18.8)% 12.3% 12.0%1,933 - 1,933 67 1,866 - 1,866 Asia 1,631 (14) 1,645 17.5 % 13.4% 13.4%
452 (135) (2) 587 (138) 725 202 523 Latin America & Canada 282 (127) (3) 409 43.5 % 77.3% 27.9%
7,764$ (138)$ 7,902$ (1,401)$ 9,303$ 245$ 9,058$ PMI Total 8,131$ (208)$ 8,339$ (5.2)% 11.6% 8.6%
% Points Change
AdjustedOperating
CompaniesIncome
excludingCurrency
NetRevenuesexcluding
ExciseTaxes &
Currency (4)
AdjustedOperating
CompaniesIncomeMargin
excludingCurrency
AdjustedOperating
CompaniesIncome
NetRevenuesexcluding
ExciseTaxes (4)
AdjustedOperating
CompaniesIncomeMargin
AdjustedOperating
CompaniesIncome Margin
excludingCurrency
3,972$ 7,683$ 51.7% European Union 3,845$ 7,561$ 50.9% 0.8 pp2,740 6,120 44.8% EEMA 2,440 5,704 42.8% 2.0 pp1,866 5,009 37.3% Asia 1,645 4,717 34.9% 2.4 pp
725 2,215 32.7% Latin America & Canada 409 1,601 25.5% 7.2 pp
9,303$ 21,027$ 44.2% PMI Total 8,339$ 19,583$ 42.6% 1.6 pp
2009 2008
2009 2008 (1)% Change in Adjusted Operating
Companies Income
Source: Philip Morris International Inc., 8-K, October 22, 2009

Philip Morris International
35
PHILIP MORRIS INTERNATIONAL INC.and Subsidiaries
Reconciliation of Non-GAAP MeasuresReconciliation of Reported Diluted EPS to Adjusted Diluted EPS and Adjusted Diluted EPS, Excluding Currency
For the Nine Months Ended September 30,(Unaudited)
2009 2008 % Change
Reported Diluted EPS 2.44$ 2.60$ (6.2)%
Less:Colombian investment and cooperation agreement charge (0.04) -Asset impairment and exit costs - (0.02)Equity loss from RBH legal settlement - (0.06)Tax items - 0.08
Adjusted Diluted EPS 2.48$ 2.60$ (4.6)%
Less:Currency Impact (0.52)
Adjusted Diluted EPS, Excluding Currency 3.00$ 2.60$ 15.4 %
Source: Philip Morris International Inc., 8-K, October 22, 2009

Philip Morris International
36
Reconciliation of Reported Diluted EPS to Reported Diluted EPS, Excluding CurrencyFor the Nine Months Ended September 30,
(Unaudited)
PHILIP MORRIS INTERNATIONAL INC.and Subsidiaries
Reconciliation of Non-GAAP Measures
2009 2008 % Change
Reported Diluted EPS 2.44$ 2.60$ (6.2)%
Less:Currency Impact (0.52)
Reported Diluted EPS, Excluding Currency 2.96$ 2.60$ 13.8 %
Source: Philip Morris International Inc., 8-K, October 22, 2009
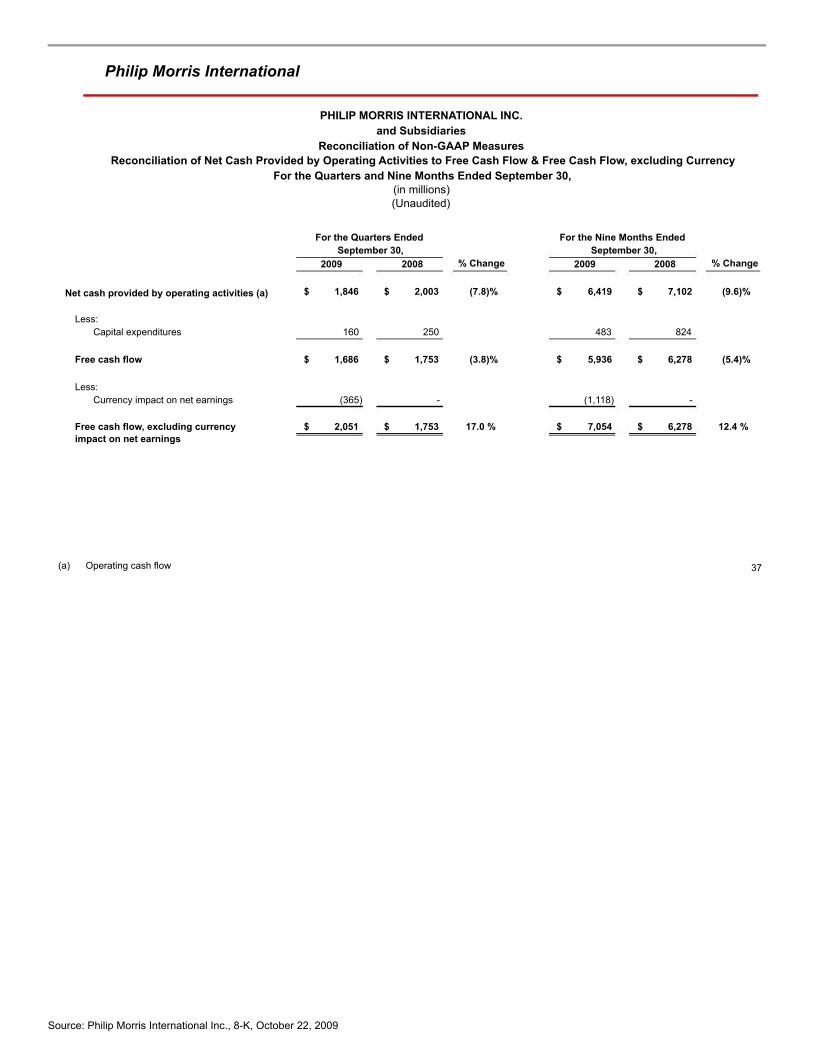
Philip Morris International
37
PHILIP MORRIS INTERNATIONAL INC.and Subsidiaries
Reconciliation of Non-GAAP MeasuresReconciliation of Net Cash Provided by Operating Activities to Free Cash Flow & Free Cash Flow, excluding Currency
For the Quarters and Nine Months Ended September 30,
(Unaudited)(in millions)
2009 2008 % Change 2009 2008 % Change
Net cash provided by operating activities (a) 1,846$ 2,003$ (7.8)% 6,419$ 7,102$ (9.6)%
Less:Capital expenditures 160 250 483 824
Free cash flow 1,686$ 1,753$ (3.8)% 5,936$ 6,278$ (5.4)%
Less:Currency impact on net earnings (365) - (1,118) -
Free cash flow, excluding currencyimpact on net earnings
2,051$ 1,753$ 17.0 % 7,054$ 6,278$ 12.4 %
September 30, September 30,For the Quarters Ended For the Nine Months Ended
(a) Operating cash flow
Source: Philip Morris International Inc., 8-K, October 22, 2009

Philip Morris International
38
Calculation of Total Debt to EBITDA and Net Debt to EBITDA Ratios(in millions, except ratios)
(Unaudited)
PHILIP MORRIS INTERNATIONAL INC.and Subsidiaries
Reconciliation of Non-GAAP Measures
For the Year EndedSeptember 30, December 31,
2009 2008October~December January~September 12 months
2008 2009 rolling
Earnings before income taxes 2,120$ 7,027$ 9,147$ 9,937$ Interest expense, net 106 572 678 311Depreciation and amortization 217 607 824 842EBITDA 2,443$ 8,206$ 10,649$ 11,090$
September 30, December 31,2009 2008
Short-term borrowings 313$ 375$ Current portion of long-term debt 197 209Long-term debt 13,741 11,377Total debt 14,251$ 11,961$ Less: Cash and cash equivalents 1,602 1,531Net Debt 12,649$ 10,430$
RatiosTotal Debt to EBITDA 1.34 1.08Net Debt to EBITDA 1.19 0.94
Source: Philip Morris International Inc., 8-K, October 22, 2009

2009 Third-Quarter Results22 October 2009
_______________________________________________Created by Morningstar Document Research documentresearch.morningstar.com
Source: Philip Morris International Inc., 8-K, October 22, 2009