Embed Size (px)
Citation preview
Private Bag 0024, Gaborone. Tel: 3671300 Fax: 3952201 Toll Free: 0800 600 200E-mail: [email protected] Website: http://www.statsbots.org.bw
Survey SEPTEMBER 2018
Formal Sector Employment
2 Formal Sector Employment Stats Brief SEPTEMBER 2018 STATISTICS BOTSWANA
PrefaceThis Stats Brief presents formal sector employment figures during the month of September 2018. The information for this brief is collected quarterly from business establishments through a mailed questionnaire. The brief also presents average earning or wages for all establishments in Government, Parastatals and the Private sector.
The brief shows that overall, formal sector employment increased by 1.0 percent between June 2018 and September 2018 with Local Government recording the highest increase of 1.8 percent, followed by Central Government and Parastatals with 1.4 percent and 1.1 percent respectively. The increase in Local Government was mainly prompted by the increase in employment of the Ipelegeng Programme, recording an increase of 2.5 percent.
On the other hand, Agriculture sector had recorded an increase in employment of 1.2 percent between the two quarters, followed by Real Estate and Hotels & Restaurants with 1.0 percent and 0.9 percent respectively. Employee earnings decreased from P6,430 in June 2018 to P6,347 in September 2018, which is a decrease of 1.3 percent.
We hope stakeholders find this brief helpful in informing their periodic planning and policy formulation. The brief owes a lot to the business establishments who continue to respond to our questionnaire on employment and employee remuneration. However, Statistics Botswana continues to face serious challenges of some business establishments not responding to the questionnaire thereby, soliciting rigorous and costly follow ups. The non-response may also compromise the accuracy of the figures generated and consequently the decisions based on those figures.
Business entities are, therefore, encouraged to report their employment figures quarterly to enable Statistics Botswana to provide information that will guide informed decision making at all levels.
Thank you
______________________Malebogo KerekangActing Statistician General January 2019
Formal Sector Employment Stats Brief SEPTEMBER 2018 STATISTICS BOTSWANA 3
1. INTRODUCTION
This Stats Brief presents results of the September 2018 Formal Sector Employment Survey. The results give summary estimates of formal sector employment, monthly average cash earnings, and minimum hourly wage rates as well as estimates for the Ipelegeng Programme.
2. EMPLOYMENT
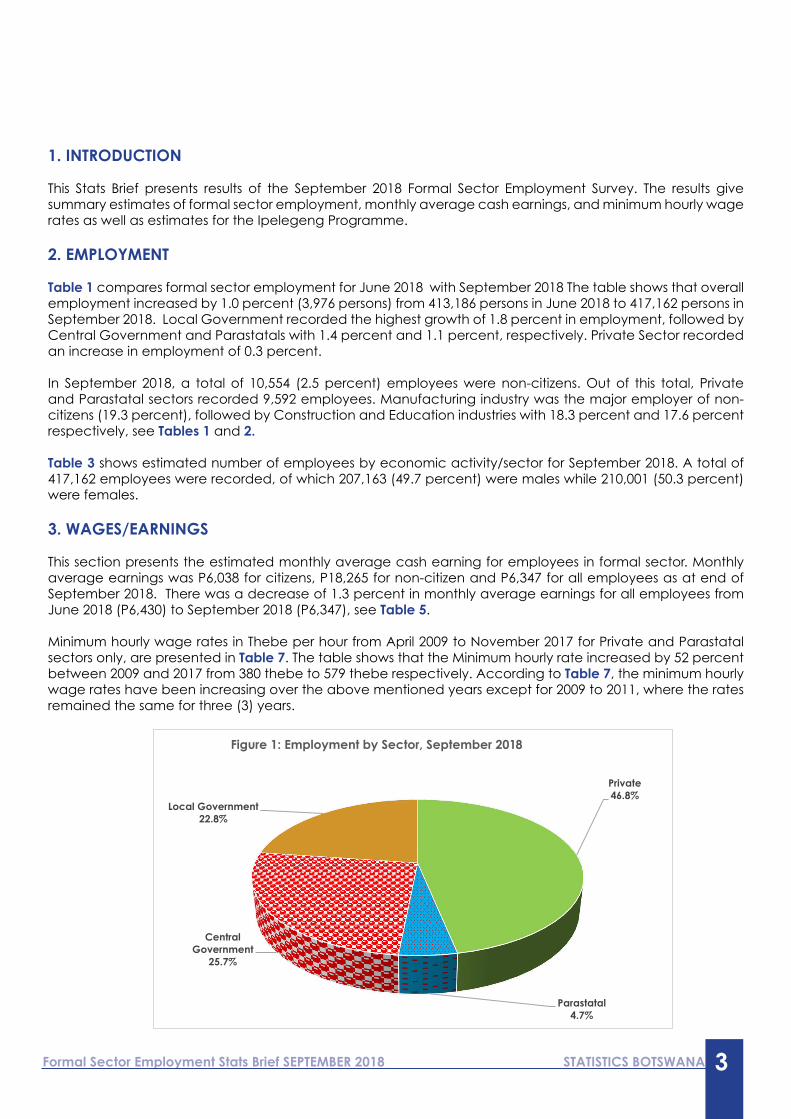
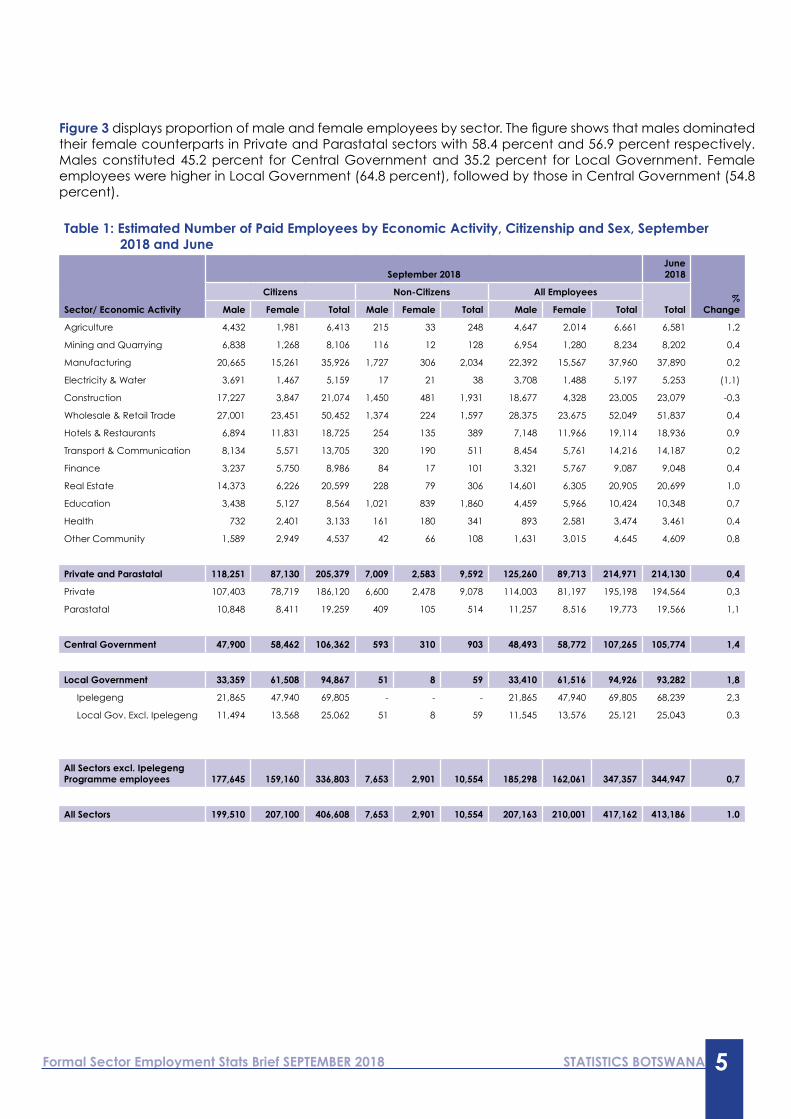
Table 1 compares formal sector employment for June 2018 with September 2018 The table shows that overall employment increased by 1.0 percent (3,976 persons) from 413,186 persons in June 2018 to 417,162 persons in September 2018. Local Government recorded the highest growth of 1.8 percent in employment, followed by Central Government and Parastatals with 1.4 percent and 1.1 percent, respectively. Private Sector recorded an increase in employment of 0.3 percent.
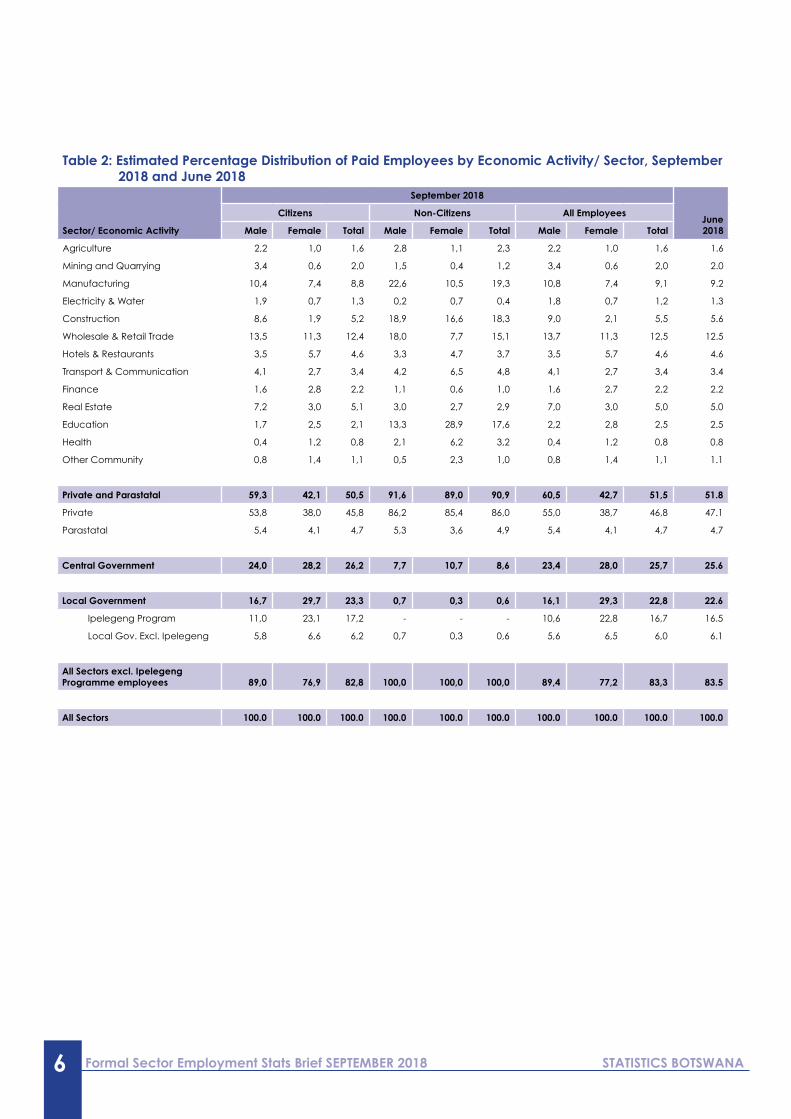
In September 2018, a total of 10,554 (2.5 percent) employees were non-citizens. Out of this total, Private and Parastatal sectors recorded 9,592 employees. Manufacturing industry was the major employer of non-citizens (19.3 percent), followed by Construction and Education industries with 18.3 percent and 17.6 percent respectively, see Tables 1 and 2.
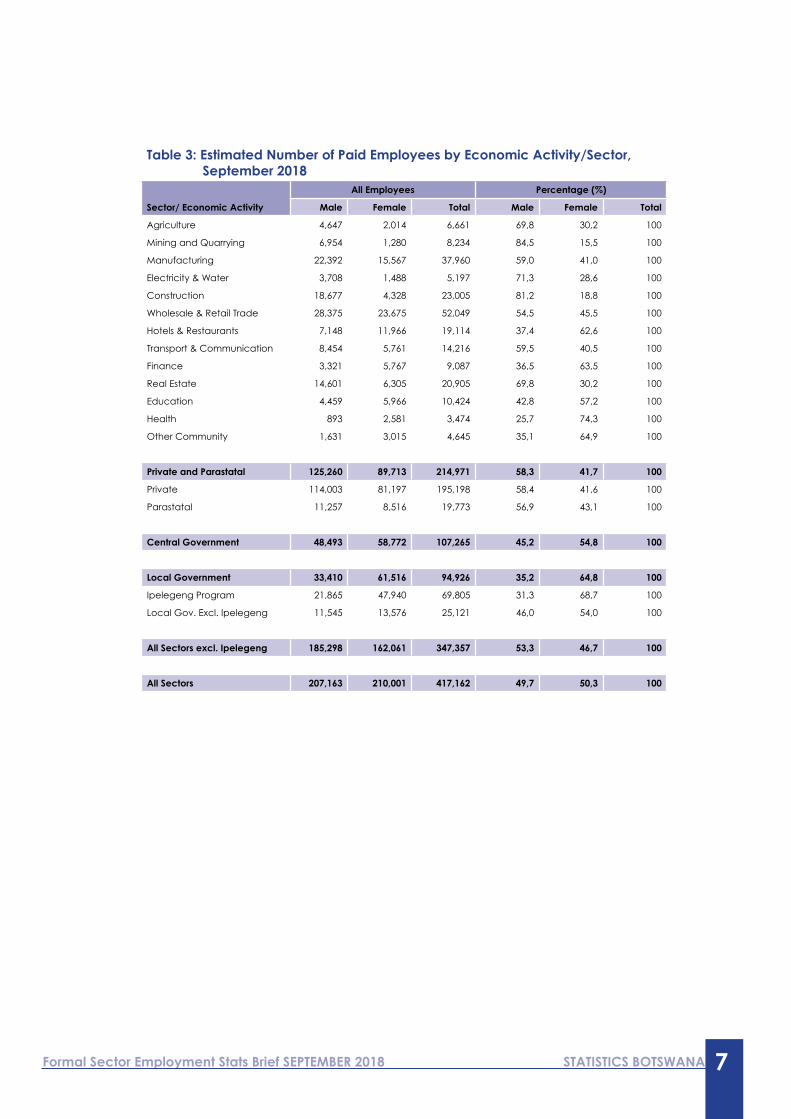
Table 3 shows estimated number of employees by economic activity/sector for September 2018. A total of 417,162 employees were recorded, of which 207,163 (49.7 percent) were males while 210,001 (50.3 percent) were females.
3. WAGES/EARNINGS
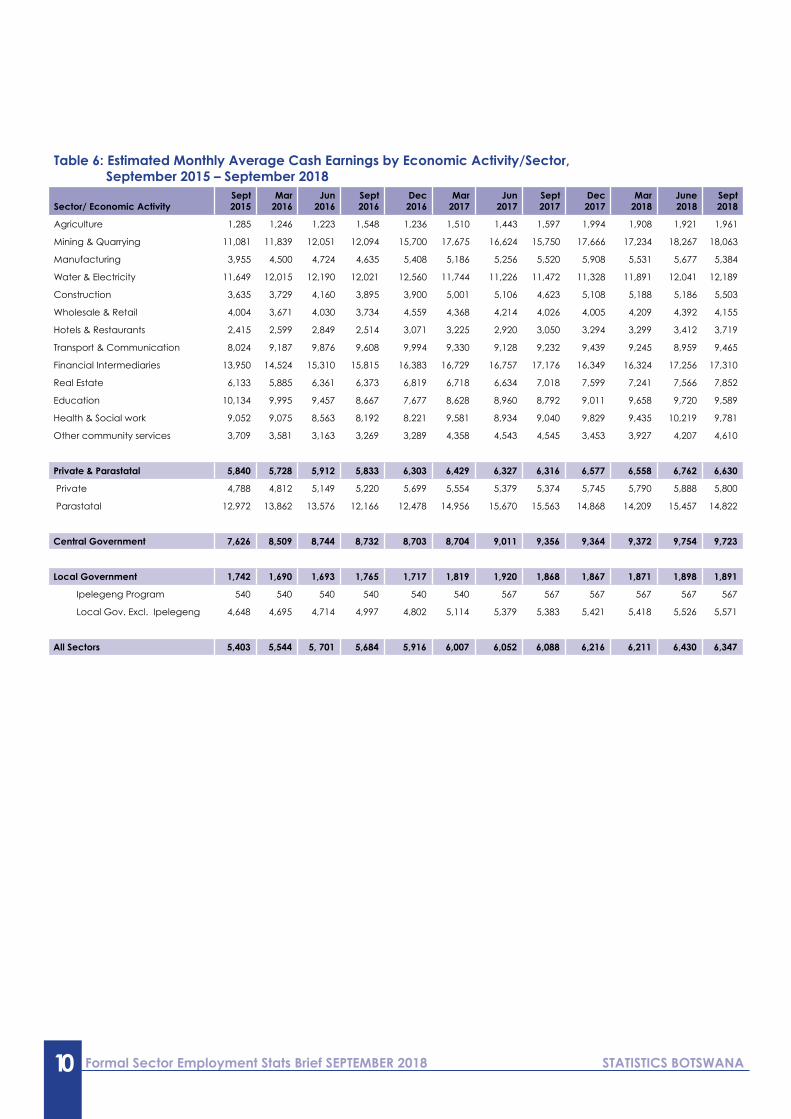
This section presents the estimated monthly average cash earning for employees in formal sector. Monthly average earnings was P6,038 for citizens, P18,265 for non-citizen and P6,347 for all employees as at end of September 2018. There was a decrease of 1.3 percent in monthly average earnings for all employees from June 2018 (P6,430) to September 2018 (P6,347), see Table 5.
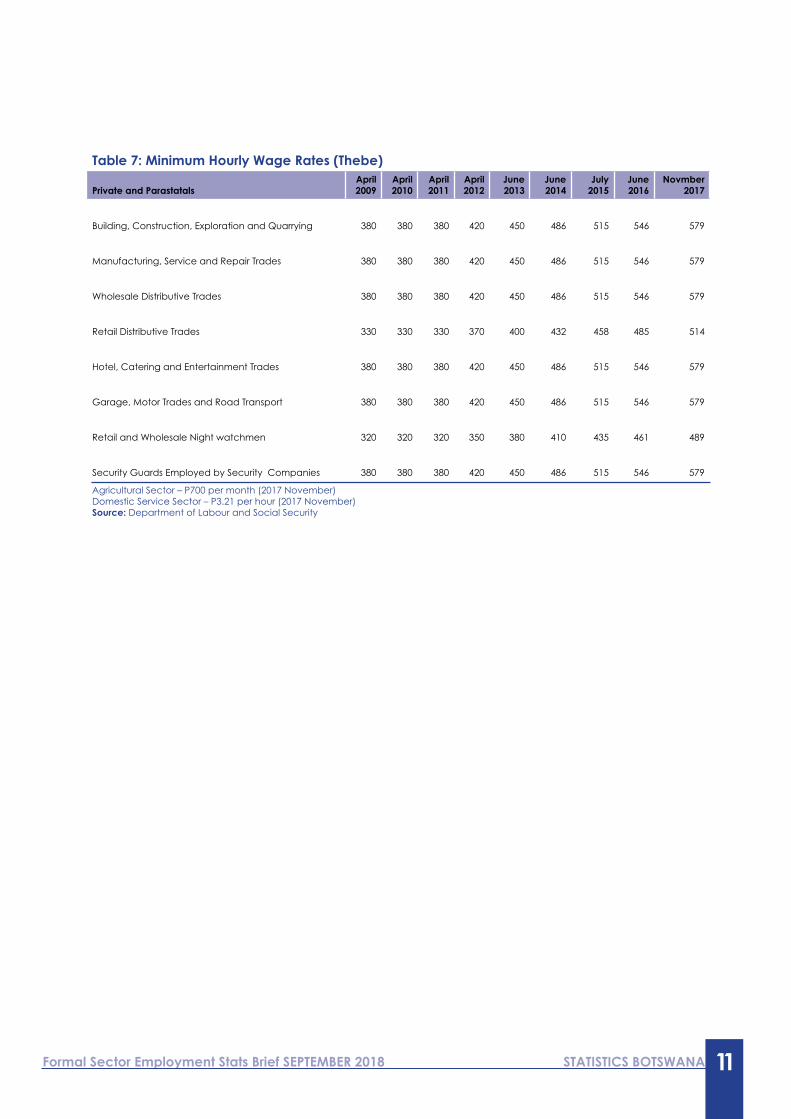
Minimum hourly wage rates in Thebe per hour from April 2009 to November 2017 for Private and Parastatal sectors only, are presented in Table 7. The table shows that the Minimum hourly rate increased by 52 percent between 2009 and 2017 from 380 thebe to 579 thebe respectively. According to Table 7, the minimum hourly wage rates have been increasing over the above mentioned years except for 2009 to 2011, where the rates remained the same for three (3) years.
Private46.8%
Parastatal4.7%
Central Government
25.7%
Local Government22.8%
Figure 1: Employment by Sector, September 2018
4 Formal Sector Employment Stats Brief SEPTEMBER 2018 STATISTICS BOTSWANA
Figure 1 shows September 2018 formal employment by sector. Private sector had the largest share (46.8 percent), followed by Central Government with 25.7 percent. Local Government and Parastatal recorded 22.8 percent and 4.7 percent, respectively.
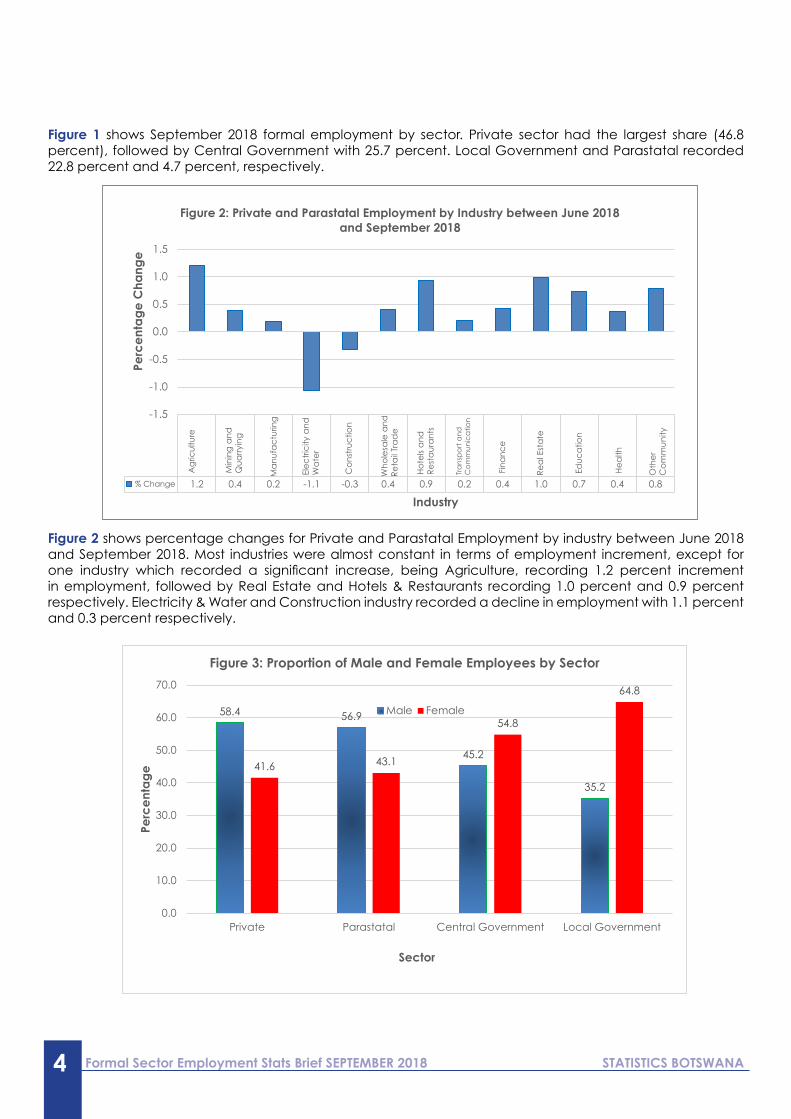
Figure 2 shows percentage changes for Private and Parastatal Employment by industry between June 2018 and September 2018. Most industries were almost constant in terms of employment increment, except for one industry which recorded a significant increase, being Agriculture, recording 1.2 percent increment in employment, followed by Real Estate and Hotels & Restaurants recording 1.0 percent and 0.9 percent respectively. Electricity & Water and Construction industry recorded a decline in employment with 1.1 percent and 0.3 percent respectively.
Formal Sector Employment Stats Brief SEPTEMBER 2018 STATISTICS BOTSWANA 5
Figure 3 displays proportion of male and female employees by sector. The figure shows that males dominated their female counterparts in Private and Parastatal sectors with 58.4 percent and 56.9 percent respectively. Males constituted 45.2 percent for Central Government and 35.2 percent for Local Government. Female employees were higher in Local Government (64.8 percent), followed by those in Central Government (54.8 percent).
Table 1: Estimated Number of Paid Employees by Economic Activity, Citizenship and Sex, September 2018 and June
Sector/ Economic Activity
September 2018June 2018
%Change
Citizens Non-Citizens All Employees
TotalMale Female Total Male Female Total Male Female Total
Agriculture 4,432 1,981 6,413 215 33 248 4,647 2,014 6,661 6,581 1,2
Mining and Quarrying 6,838 1,268 8,106 116 12 128 6,954 1,280 8,234 8,202 0,4
Manufacturing 20,665 15,261 35,926 1,727 306 2,034 22,392 15,567 37,960 37,890 0,2
Electricity & Water 3,691 1,467 5,159 17 21 38 3,708 1,488 5,197 5,253 (1,1)
Construction 17,227 3,847 21,074 1,450 481 1,931 18,677 4,328 23,005 23,079 -0,3
Wholesale & Retail Trade 27,001 23,451 50,452 1,374 224 1,597 28,375 23,675 52,049 51,837 0,4
Hotels & Restaurants 6,894 11,831 18,725 254 135 389 7,148 11,966 19,114 18,936 0,9
Transport & Communication 8,134 5,571 13,705 320 190 511 8,454 5,761 14,216 14,187 0,2
Finance 3,237 5,750 8,986 84 17 101 3,321 5,767 9,087 9,048 0,4
Real Estate 14,373 6,226 20,599 228 79 306 14,601 6,305 20,905 20,699 1,0
Education 3,438 5,127 8,564 1,021 839 1,860 4,459 5,966 10,424 10,348 0,7
Health 732 2,401 3,133 161 180 341 893 2,581 3,474 3,461 0,4
Other Community 1,589 2,949 4,537 42 66 108 1,631 3,015 4,645 4,609 0,8
Private and Parastatal 118,251 87,130 205,379 7,009 2,583 9,592 125,260 89,713 214,971 214,130 0,4
Private 107,403 78,719 186,120 6,600 2,478 9,078 114,003 81,197 195,198 194,564 0,3
Parastatal 10,848 8,411 19,259 409 105 514 11,257 8,516 19,773 19,566 1,1
Central Government 47,900 58,462 106,362 593 310 903 48,493 58,772 107,265 105,774 1,4
Local Government 33,359 61,508 94,867 51 8 59 33,410 61,516 94,926 93,282 1,8
Ipelegeng 21,865 47,940 69,805 - - - 21,865 47,940 69,805 68,239 2,3
Local Gov. Excl. Ipelegeng 11,494 13,568 25,062 51 8 59 11,545 13,576 25,121 25,043 0,3
All Sectors excl. Ipelegeng Programme employees
177,645 159,160 336,803 7,653 2,901 10,554 185,298 162,061 347,357 344,947 0,7
All Sectors 199,510 207,100 406,608 7,653 2,901 10,554 207,163 210,001 417,162 413,186 1.0
6 Formal Sector Employment Stats Brief SEPTEMBER 2018 STATISTICS BOTSWANA
Table 2: Estimated Percentage Distribution of Paid Employees by Economic Activity/ Sector, September 2018 and June 2018
Sector/ Economic Activity
September 2018
June 2018
Citizens Non-Citizens All Employees
Male Female Total Male Female Total Male Female Total
Agriculture 2,2 1,0 1,6 2,8 1,1 2,3 2,2 1,0 1,6 1.6
Mining and Quarrying 3,4 0,6 2,0 1,5 0,4 1,2 3,4 0,6 2,0 2.0
Manufacturing 10,4 7,4 8,8 22,6 10,5 19,3 10,8 7,4 9,1 9.2
Electricity & Water 1,9 0,7 1,3 0,2 0,7 0,4 1,8 0,7 1,2 1.3
Construction 8,6 1,9 5,2 18,9 16,6 18,3 9,0 2,1 5,5 5.6
Wholesale & Retail Trade 13,5 11,3 12,4 18,0 7,7 15,1 13,7 11,3 12,5 12.5
Hotels & Restaurants 3,5 5,7 4,6 3,3 4,7 3,7 3,5 5,7 4,6 4.6
Transport & Communication 4,1 2,7 3,4 4,2 6,5 4,8 4,1 2,7 3,4 3.4
Finance 1,6 2,8 2,2 1,1 0,6 1,0 1,6 2,7 2,2 2.2
Real Estate 7,2 3,0 5,1 3,0 2,7 2,9 7,0 3,0 5,0 5.0
Education 1,7 2,5 2,1 13,3 28,9 17,6 2,2 2,8 2,5 2.5
Health 0,4 1,2 0,8 2,1 6,2 3,2 0,4 1,2 0,8 0.8
Other Community 0,8 1,4 1,1 0,5 2,3 1,0 0,8 1,4 1,1 1.1
Private and Parastatal 59,3 42,1 50,5 91,6 89,0 90,9 60,5 42,7 51,5 51.8
Private 53,8 38,0 45,8 86,2 85,4 86,0 55,0 38,7 46,8 47.1
Parastatal 5,4 4,1 4,7 5,3 3,6 4,9 5,4 4,1 4,7 4.7
Central Government 24,0 28,2 26,2 7,7 10,7 8,6 23,4 28,0 25,7 25.6
Local Government 16,7 29,7 23,3 0,7 0,3 0,6 16,1 29,3 22,8 22.6
Ipelegeng Program 11,0 23,1 17,2 - - - 10,6 22,8 16,7 16.5
Local Gov. Excl. Ipelegeng 5,8 6,6 6,2 0,7 0,3 0,6 5,6 6,5 6,0 6.1
All Sectors excl. Ipelegeng Programme employees 89,0 76,9 82,8 100,0 100,0 100,0 89,4 77,2 83,3 83.5
All Sectors 100.0 100.0 100.0 100.0 100.0 100.0 100.0 100.0 100.0 100.0
Formal Sector Employment Stats Brief SEPTEMBER 2018 STATISTICS BOTSWANA 7
Table 3: Estimated Number of Paid Employees by Economic Activity/Sector, September 2018
Sector/ Economic Activity
All Employees Percentage (%)
Male Female Total Male Female Total
Agriculture 4,647 2,014 6,661 69,8 30,2 100
Mining and Quarrying 6,954 1,280 8,234 84,5 15,5 100
Manufacturing 22,392 15,567 37,960 59,0 41,0 100
Electricity & Water 3,708 1,488 5,197 71,3 28,6 100
Construction 18,677 4,328 23,005 81,2 18,8 100
Wholesale & Retail Trade 28,375 23,675 52,049 54,5 45,5 100
Hotels & Restaurants 7,148 11,966 19,114 37,4 62,6 100
Transport & Communication 8,454 5,761 14,216 59,5 40,5 100
Finance 3,321 5,767 9,087 36,5 63,5 100
Real Estate 14,601 6,305 20,905 69,8 30,2 100
Education 4,459 5,966 10,424 42,8 57,2 100
Health 893 2,581 3,474 25,7 74,3 100
Other Community 1,631 3,015 4,645 35,1 64,9 100
Private and Parastatal 125,260 89,713 214,971 58,3 41,7 100
Private 114,003 81,197 195,198 58,4 41,6 100
Parastatal 11,257 8,516 19,773 56,9 43,1 100
Central Government 48,493 58,772 107,265 45,2 54,8 100
Local Government 33,410 61,516 94,926 35,2 64,8 100
Ipelegeng Program 21,865 47,940 69,805 31,3 68,7 100
Local Gov. Excl. Ipelegeng 11,545 13,576 25,121 46,0 54,0 100
All Sectors excl. Ipelegeng 185,298 162,061 347,357 53,3 46,7 100
All Sectors 207,163 210,001 417,162 49,7 50,3 100

8 Formal Sector Employment Stats Brief SEPTEMBER 2018 STATISTICS BOTSWANA

Formal Sector Employment Stats Brief SEPTEMBER 2018 STATISTICS BOTSWANA 9
Table 5: Estimated Monthly Average Cash Earnings by Economic Activity, Citizenship and Sex, September 2018 and June 2018
Sector/ Economic Activity
September 2018 June 2018
% Change
Citizens Non-Citizens All Employees
TotalMale Female Total Male Female Total Male Female Total
Agriculture 1,947 1,781 1,720 3,538 4,349 3,718 2,020 1,823 1,961 1,921 2,1
Mining and Quarrying 17,054 20,131 17,535 53,315 33,830 51,489 17,659 20,260 18,063 18,267 -1,1
Manufacturing 5,596 3,767 4,819 16,054 11,568 15,371 6,402 3,921 5,384 5,677 -5,2
Electricity & Water 12,405 11,458 12,133 30,679 10,942 19,771 12,489 11,450 12,189 12,041 1,2
Construction 3,235 12,461 4,919 14,049 5,325 11,875 4,074 11,668 5,503 5,186 6,1
Wholesale & Retail Trade 3,963 3,108 3,583 23,405 13,209 22,250 4,905 3,203 4,155 4,392 -5,4
Hotels & Restaurants 3,459 3,015 3,456 17,118 15,064 16,406 3,944 3,151 3,719 3,412 9,0
Transport & Communication 9,958 7,906 9,124 14,481 25,633 18,600 10,129 8,491 9,465 8,959 5,6
Finance 18,882 15,836 16,979 48,694 47,624 48,514 19,636 15,921 17,310 17,256 0,3
Real Estate 5,906 8,363 6,950 53,861 20,537 44,912 6,935 9,973 7,852 7,566 3,8
Education 9,277 7,512 8,222 17,192 14,290 15,883 11,089 8,465 9,589 9,720 -1,4
Health 9,839 6,773 7,490 35,553 26,601 30,828 14,475 8,156 9,781 10,219 -4,3
Other Community 6,092 3,587 4,465 13,989 8,567 10,676 6,295 3,696 4,610 4,207 9,6
Private and Parastatal 6,187 5,871 6,082 19,849 14,160 18,360 6,951 6,109 6,630 6,762 -2,0
Private 5,297 4,984 5,197 19,833 13,549 18,163 6,138 5,245 5,800 5,888 -1,5
Parastatal 14,997 14,167 14,634 20,112 28,581 21,842 15,183 14,344 14,822 15,457 -4,1
Central Government 9,278 9,970 9,658 18,505 15,213 17,375 9,391 9,998 9,723 9,754 -0,3
Local Government 2,465 1,566 1,882 16,498 14,902 16,288 2,486 1,568 1,891 1,898 1,4
Ipelegeng Program 567 567 567 - - - 567 567 567 567 0
Local Gov. Excl. Ipelegeng 6,075 5,097 5,546 16,498 14,902 16,288 6122 5,103 5,571 5,526 0,8
All Sectors excl. Ipelegeng Programme employees 7,013 7,311 7,172 19,723 14,274 18,265 7,538 7,435 7,509 7,590 -1,1
All Sectors 6,307 5,750 6,038 19,723 14,274 18,265 6,802 5,867 6,347 6,430 -1,3
10 Formal Sector Employment Stats Brief SEPTEMBER 2018 STATISTICS BOTSWANA
Table 6: Estimated Monthly Average Cash Earnings by Economic Activity/Sector, September 2015 – September 2018
Sector/ Economic ActivitySept2015
Mar2016
Jun2016
Sept 2016
Dec2016
Mar2017
Jun2017
Sept2017
Dec2017
Mar2018
June2018
Sept2018
Agriculture 1,285 1,246 1,223 1,548 1,236 1,510 1,443 1,597 1,994 1,908 1,921 1,961
Mining & Quarrying 11,081 11,839 12,051 12,094 15,700 17,675 16,624 15,750 17,666 17,234 18,267 18,063
Manufacturing 3,955 4,500 4,724 4,635 5,408 5,186 5,256 5,520 5,908 5,531 5,677 5,384
Water & Electricity 11,649 12,015 12,190 12,021 12,560 11,744 11,226 11,472 11,328 11,891 12,041 12,189
Construction 3,635 3,729 4,160 3,895 3,900 5,001 5,106 4,623 5,108 5,188 5,186 5,503
Wholesale & Retail 4,004 3,671 4,030 3,734 4,559 4,368 4,214 4,026 4,005 4,209 4,392 4,155
Hotels & Restaurants 2,415 2,599 2,849 2,514 3,071 3,225 2,920 3,050 3,294 3,299 3,412 3,719
Transport & Communication 8,024 9,187 9,876 9,608 9,994 9,330 9,128 9,232 9,439 9,245 8,959 9,465
Financial Intermediaries 13,950 14,524 15,310 15,815 16,383 16,729 16,757 17,176 16,349 16,324 17,256 17,310
Real Estate 6,133 5,885 6,361 6,373 6,819 6,718 6,634 7,018 7,599 7,241 7,566 7,852
Education 10,134 9,995 9,457 8,667 7,677 8,628 8,960 8,792 9,011 9,658 9,720 9,589
Health & Social work 9,052 9,075 8,563 8,192 8,221 9,581 8,934 9,040 9,829 9,435 10,219 9,781
Other community services 3,709 3,581 3,163 3,269 3,289 4,358 4,543 4,545 3,453 3,927 4,207 4,610
Private & Parastatal 5,840 5,728 5,912 5,833 6,303 6,429 6,327 6,316 6,577 6,558 6,762 6,630
Private 4,788 4,812 5,149 5,220 5,699 5,554 5,379 5,374 5,745 5,790 5,888 5,800
Parastatal 12,972 13,862 13,576 12,166 12,478 14,956 15,670 15,563 14,868 14,209 15,457 14,822
Central Government 7,626 8,509 8,744 8,732 8,703 8,704 9,011 9,356 9,364 9,372 9,754 9,723
Local Government 1,742 1,690 1,693 1,765 1,717 1,819 1,920 1,868 1,867 1,871 1,898 1,891
Ipelegeng Program 540 540 540 540 540 540 567 567 567 567 567 567
Local Gov. Excl. Ipelegeng 4,648 4,695 4,714 4,997 4,802 5,114 5,379 5,383 5,421 5,418 5,526 5,571
All Sectors 5,403 5,544 5, 701 5,684 5,916 6,007 6,052 6,088 6,216 6,211 6,430 6,347
Formal Sector Employment Stats Brief SEPTEMBER 2018 STATISTICS BOTSWANA 11
Table 7: Minimum Hourly Wage Rates (Thebe)
Private and ParastatalsApril2009
April2010
April2011
April2012
June2013
June2014
July2015
June2016
Novmber2017
Building, Construction, Exploration and Quarrying 380 380 380 420 450 486 515 546 579
Manufacturing, Service and Repair Trades 380 380 380 420 450 486 515 546 579
Wholesale Distributive Trades 380 380 380 420 450 486 515 546 579
Retail Distributive Trades 330 330 330 370 400 432 458 485 514
Hotel, Catering and Entertainment Trades 380 380 380 420 450 486 515 546 579
Garage, Motor Trades and Road Transport 380 380 380 420 450 486 515 546 579
Retail and Wholesale Night watchmen 320 320 320 350 380 410 435 461 489
Security Guards Employed by Security Companies 380 380 380 420 450 486 515 546 579
Agricultural Sector – P700 per month (2017 November)Domestic Service Sector – P3.21 per hour (2017 November)Source: Department of Labour and Social Security
12 Formal Sector Employment Stats Brief SEPTEMBER 2018 STATISTICS BOTSWANAPrivate Bag 0024, Gaborone. Tel: 3671300 Fax: 3952201 Toll Free: 0800 600 200E-mail: [email protected] Website: http://www.statsbots.org.bw