Embed Size (px)
Citation preview
Formal Sector Employment Survey September 2017
Private Bag 0024, Gaborone. Tel: 3671300 Fax: 3952201 Toll Free: 0800 600 200E-mail: [email protected] Website: http://www.statsbots.org.bw
2 Formal Sector Employment Stats Brief September 2017 STATISTICS BOTSWANA
PrefaceThis Stats Brief presents formal employment figures during the month of September 2017. The information for this brief is collected quarterly from business establishments through a mailed questionnaire. The brief also presents average earning or wages for all establishments in Government, parastatals and the private sector.
The brief shows that overall, formal employment increased by 1.1 percent between June 2017 and September 2017 with Local Government recording the highest increase of 4.3 percent, followed by Central Government and Private with 0.4 percent and 0.3 percent respectfully. The increase in Local Government was mainly prompted by the increase in employment of the Ipelegeng Programme, recording an increase of 6.0. The Parastatal Organisations recorded a decrease in employment of 0.6 percent.
On the other hand, the Health and Wholesale & Retail Trade sectors recorded an increase in employment of 0.9 percent and 0.8 percent between the two quarters. Employee earnings increased from P6,052 in June 2017 to P 6,088 in September 2017, which is an increase of 0.6 percent.
We hope stakeholders find this brief helpful in informing their periodic planning and policy formulation. The brief owes a lot to the business establishments who continue to respond to our questionnaire on employment and employee remuneration. However, Statistics Botswana continues to face serious challenges of some business establishments not responding to the questionnaire thereby, soliciting rigorous and costly follow ups. The non-response may also compromise the accuracy of the figures generated and consequently the decisions based on those figures. Business entities are, therefore, encouraged to report their employment figures quarterly to enable Statistics Botswana to provide information that will guide informed decision making at all levels.
Thank you
______________________Anna Majelantle Statistician General February 2018
Formal Sector Employment Stats Brief September 2017 STATISTICS BOTSWANA 3
1. INTRODUCTION
This Stats Brief presents results of the September 2017 Employment Survey. The results give summary estimates of formal sector employment, monthly average cash earnings, and minimum hourly wage rates as well as estimates for the Ipelegeng Programme.
2. EMPLOYMENT
Table 1 compares formal sector employment for June 2017 and September 2017. The table shows that overall employment increased by 1.1 percent (4,627 persons) from 404,556 persons in June 2017 to 409,184 persons in September 2017. Local Government recorded the highest increase in employment of 4.3 percent, followed by Central Government and Private with 0.4 percent and 0.3 percent increase in employment respectively. Parastatal recorded a decrease in employment of 0.6 percent.
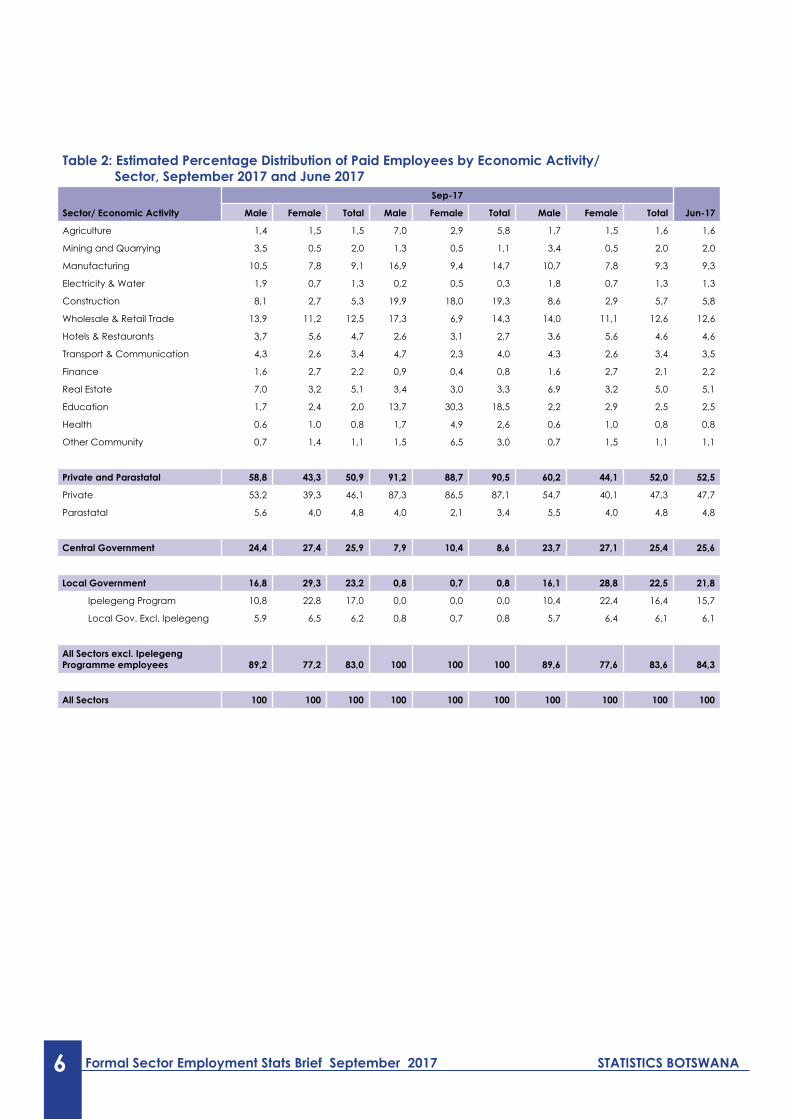
In June 2017, a total of 12,166 (3.0 percent) employees were non-citizens. Out of this total, Private and Parastatal sectors recorded 11,009 employees. Construction industry was the major employer of non-citizens (19.3 percent), followed by Education industry (18.5 percent) and Manufacturing industry (14.7 percent). See tables 1 and 2.
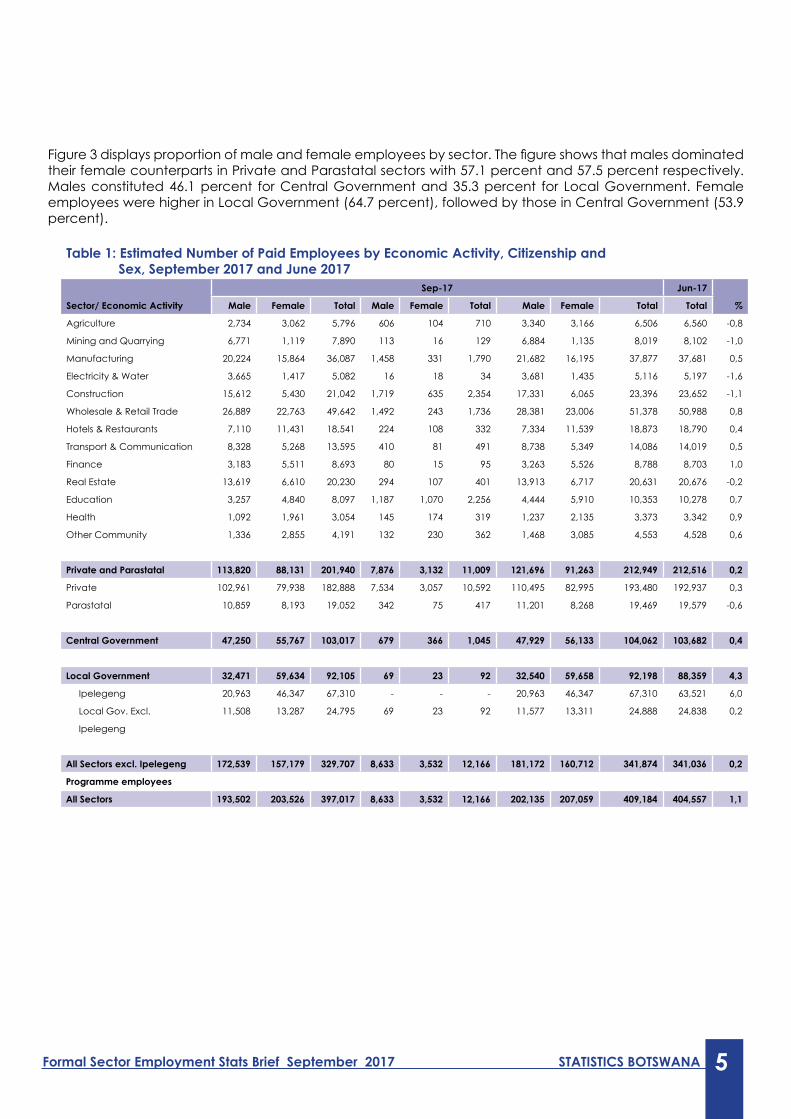
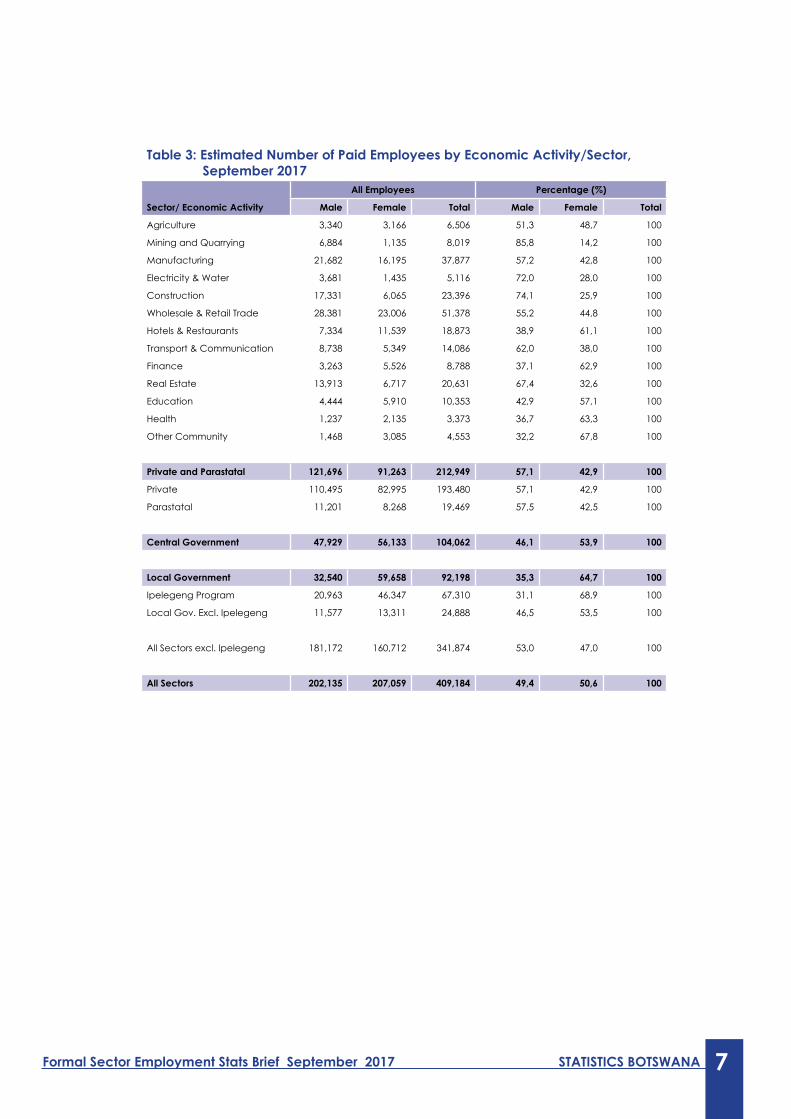
Table 3 shows estimated number of employees by economic activity/sector for September 2017. A total of 409,184 employees were recorded, of which 202,135 (49.4 percent) were males while 207,059 (50.6 percent) were females.
3. WAGES/EARNINGS
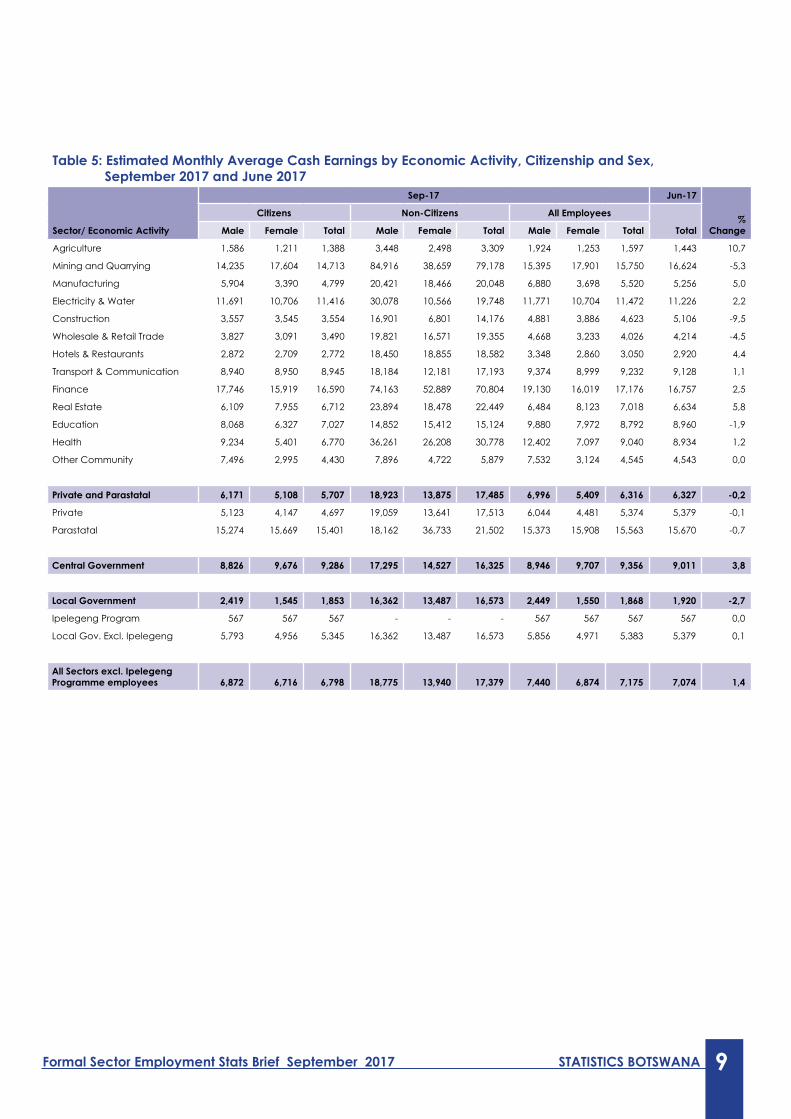
This section presents the estimated monthly average cash earning for employees in formal sector. Monthly average earnings for citizens stood at P5,742, P17,379 for non-citizen and P6,088 for all employees as at end of September 2017. There was an increase of 0.6 percent in monthly average earnings for all employees from June 2017 (P6,052) to September 2017 (P6,088). See table 5.
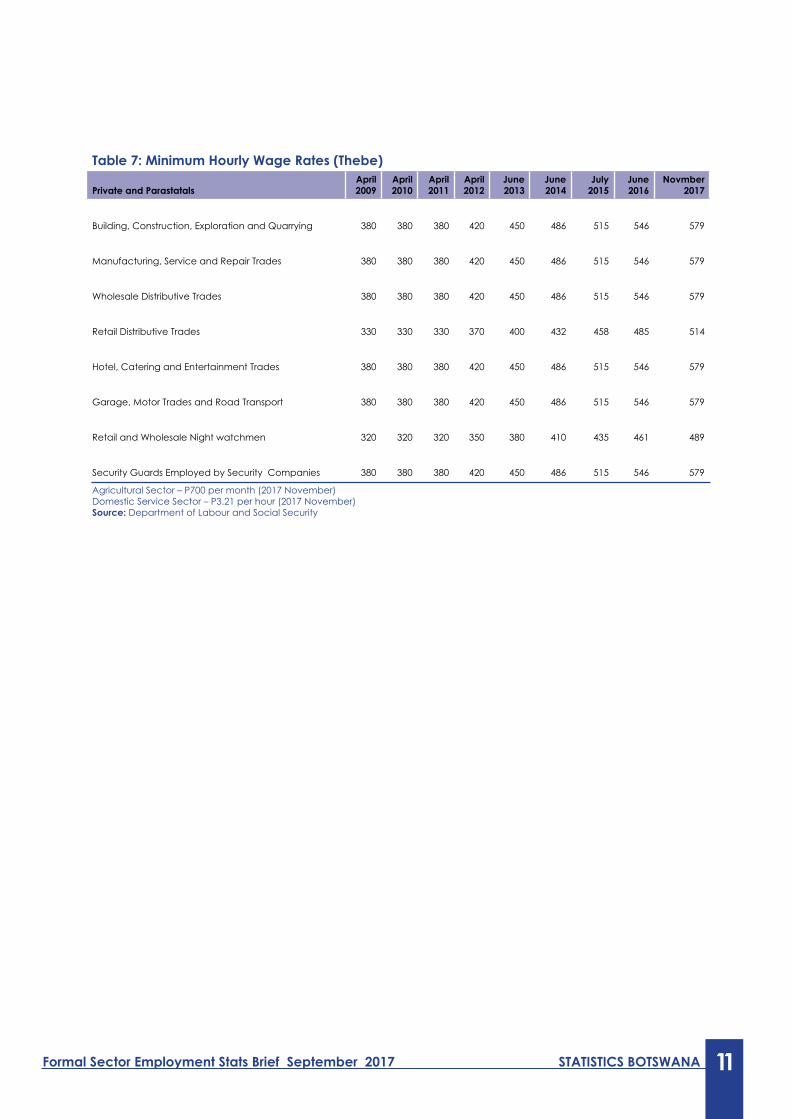
Minimum hourly wage rates in Thebe per hour from April 2009 to November 2017 for Private and Parastatal sectors only, are presented in Table 7. The table shows that the Minimum hourly rate increased by 52 percent between 2009 and 2017 from 380 thebe to 579 thebe respectively. According to table 7, the minimum hourly wage rates have been increasing over the above mentioned years except for 2009 to 2011, where the rates remained the same for three (3) years.
4 Formal Sector Employment Stats Brief September 2017 STATISTICS BOTSWANA
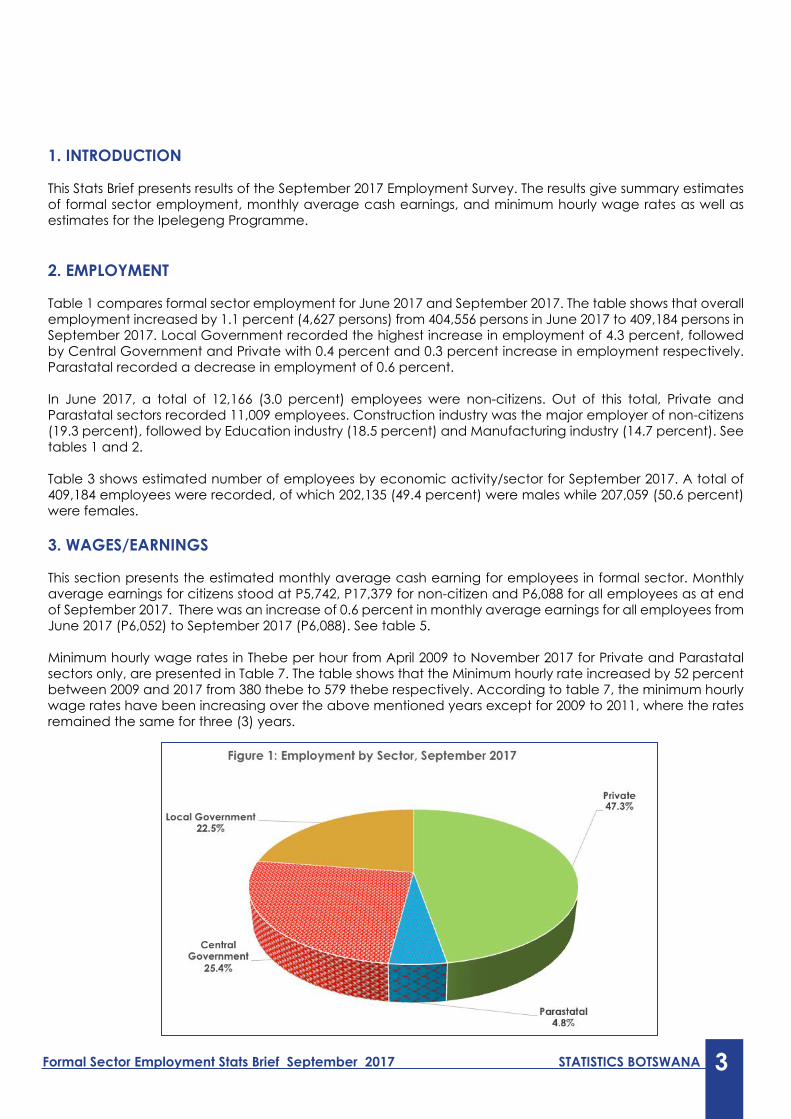
Figure 1 shows September 2017 formal employment by sector. Private sector had the largest share (47.3 percent), followed by Central Government with 25.4 percent. Local Government and Parastatal recorded 22.5 percent and 4.8 percent respectively.
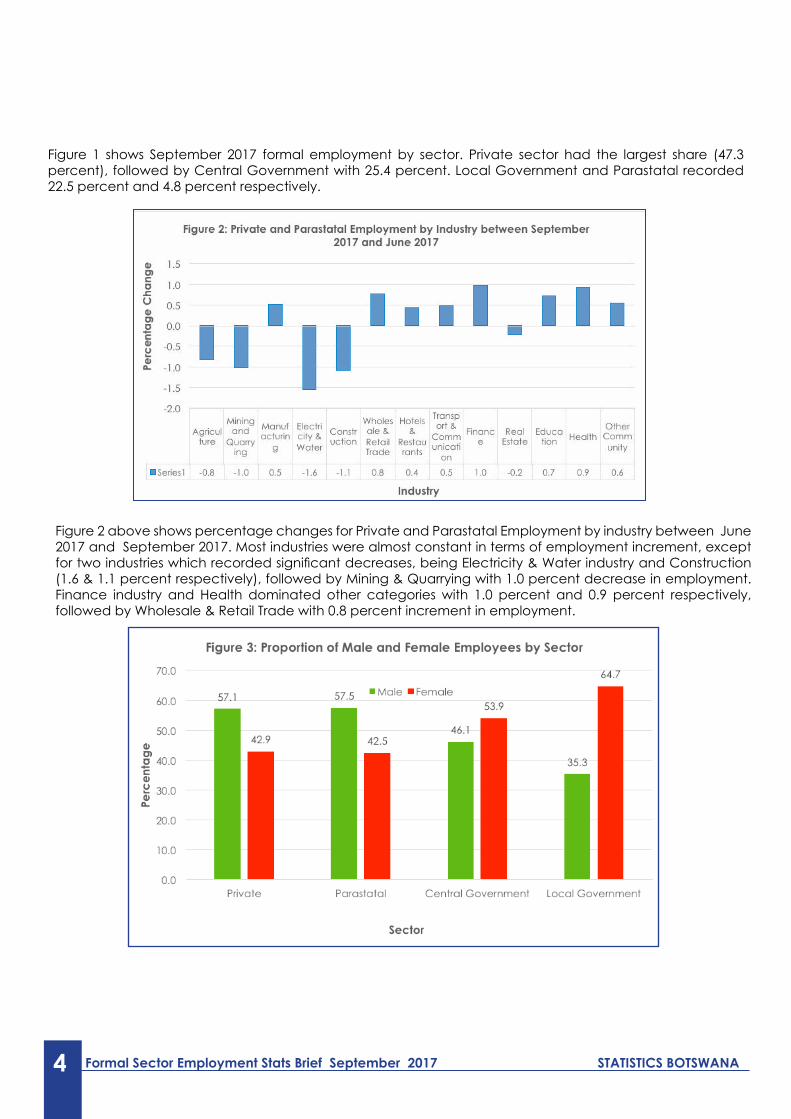
Figure 2 above shows percentage changes for Private and Parastatal Employment by industry between June 2017 and September 2017. Most industries were almost constant in terms of employment increment, except for two industries which recorded significant decreases, being Electricity & Water industry and Construction (1.6 & 1.1 percent respectively), followed by Mining & Quarrying with 1.0 percent decrease in employment. Finance industry and Health dominated other categories with 1.0 percent and 0.9 percent respectively, followed by Wholesale & Retail Trade with 0.8 percent increment in employment.
Formal Sector Employment Stats Brief September 2017 STATISTICS BOTSWANA 5
Figure 3 displays proportion of male and female employees by sector. The figure shows that males dominated their female counterparts in Private and Parastatal sectors with 57.1 percent and 57.5 percent respectively. Males constituted 46.1 percent for Central Government and 35.3 percent for Local Government. Female employees were higher in Local Government (64.7 percent), followed by those in Central Government (53.9 percent).
Table 1: Estimated Number of Paid Employees by Economic Activity, Citizenship and Sex, September 2017 and June 2017
Sector/ Economic Activity
Sep-17 Jun-17
%Male Female Total Male Female Total Male Female Total Total
Agriculture 2,734 3,062 5,796 606 104 710 3,340 3,166 6,506 6,560 -0,8
Mining and Quarrying 6,771 1,119 7,890 113 16 129 6,884 1,135 8,019 8,102 -1,0
Manufacturing 20,224 15,864 36,087 1,458 331 1,790 21,682 16,195 37,877 37,681 0,5
Electricity & Water 3,665 1,417 5,082 16 18 34 3,681 1,435 5,116 5,197 -1,6
Construction 15,612 5,430 21,042 1,719 635 2,354 17,331 6,065 23,396 23,652 -1,1
Wholesale & Retail Trade 26,889 22,763 49,642 1,492 243 1,736 28,381 23,006 51,378 50,988 0,8
Hotels & Restaurants 7,110 11,431 18,541 224 108 332 7,334 11,539 18,873 18,790 0,4
Transport & Communication 8,328 5,268 13,595 410 81 491 8,738 5,349 14,086 14,019 0,5
Finance 3,183 5,511 8,693 80 15 95 3,263 5,526 8,788 8,703 1,0
Real Estate 13,619 6,610 20,230 294 107 401 13,913 6,717 20,631 20,676 -0,2
Education 3,257 4,840 8,097 1,187 1,070 2,256 4,444 5,910 10,353 10,278 0,7
Health 1,092 1,961 3,054 145 174 319 1,237 2,135 3,373 3,342 0,9
Other Community 1,336 2,855 4,191 132 230 362 1,468 3,085 4,553 4,528 0,6
Private and Parastatal 113,820 88,131 201,940 7,876 3,132 11,009 121,696 91,263 212,949 212,516 0,2
Private 102,961 79,938 182,888 7,534 3,057 10,592 110,495 82,995 193,480 192,937 0,3
Parastatal 10,859 8,193 19,052 342 75 417 11,201 8,268 19,469 19,579 -0,6
Central Government 47,250 55,767 103,017 679 366 1,045 47,929 56,133 104,062 103,682 0,4
Local Government 32,471 59,634 92,105 69 23 92 32,540 59,658 92,198 88,359 4,3
Ipelegeng 20,963 46,347 67,310 - - - 20,963 46,347 67,310 63,521 6,0
Local Gov. Excl. 11,508 13,287 24,795 69 23 92 11,577 13,311 24,888 24,838 0,2
Ipelegeng
All Sectors excl. Ipelegeng 172,539 157,179 329,707 8,633 3,532 12,166 181,172 160,712 341,874 341,036 0,2
Programme employees
All Sectors 193,502 203,526 397,017 8,633 3,532 12,166 202,135 207,059 409,184 404,557 1,1
6 Formal Sector Employment Stats Brief September 2017 STATISTICS BOTSWANA
Table 2: Estimated Percentage Distribution of Paid Employees by Economic Activity/ Sector, September 2017 and June 2017
Sector/ Economic Activity
Sep-17
Jun-17Male Female Total Male Female Total Male Female Total
Agriculture 1,4 1,5 1,5 7,0 2,9 5,8 1,7 1,5 1,6 1,6
Mining and Quarrying 3,5 0,5 2,0 1,3 0,5 1,1 3,4 0,5 2,0 2,0
Manufacturing 10,5 7,8 9,1 16,9 9,4 14,7 10,7 7,8 9,3 9,3
Electricity & Water 1,9 0,7 1,3 0,2 0,5 0,3 1,8 0,7 1,3 1,3
Construction 8,1 2,7 5,3 19,9 18,0 19,3 8,6 2,9 5,7 5,8
Wholesale & Retail Trade 13,9 11,2 12,5 17,3 6,9 14,3 14,0 11,1 12,6 12,6
Hotels & Restaurants 3,7 5,6 4,7 2,6 3,1 2,7 3,6 5,6 4,6 4,6
Transport & Communication 4,3 2,6 3,4 4,7 2,3 4,0 4,3 2,6 3,4 3,5
Finance 1,6 2,7 2,2 0,9 0,4 0,8 1,6 2,7 2,1 2,2
Real Estate 7,0 3,2 5,1 3,4 3,0 3,3 6,9 3,2 5,0 5,1
Education 1,7 2,4 2,0 13,7 30,3 18,5 2,2 2,9 2,5 2,5
Health 0,6 1,0 0,8 1,7 4,9 2,6 0,6 1,0 0,8 0,8
Other Community 0,7 1,4 1,1 1,5 6,5 3,0 0,7 1,5 1,1 1,1
Private and Parastatal 58,8 43,3 50,9 91,2 88,7 90,5 60,2 44,1 52,0 52,5
Private 53,2 39,3 46,1 87,3 86,5 87,1 54,7 40,1 47,3 47,7
Parastatal 5,6 4,0 4,8 4,0 2,1 3,4 5,5 4,0 4,8 4,8
Central Government 24,4 27,4 25,9 7,9 10,4 8,6 23,7 27,1 25,4 25,6
Local Government 16,8 29,3 23,2 0,8 0,7 0,8 16,1 28,8 22,5 21,8
Ipelegeng Program 10,8 22,8 17,0 0,0 0,0 0,0 10,4 22,4 16,4 15,7
Local Gov. Excl. Ipelegeng 5,9 6,5 6,2 0,8 0,7 0,8 5,7 6,4 6,1 6,1
All Sectors excl. IpelegengProgramme employees 89,2 77,2 83,0 100 100 100 89,6 77,6 83,6 84,3
All Sectors 100 100 100 100 100 100 100 100 100 100
Formal Sector Employment Stats Brief September 2017 STATISTICS BOTSWANA 7
Table 3: Estimated Number of Paid Employees by Economic Activity/Sector, September 2017
Sector/ Economic Activity
All Employees Percentage (%)
Male Female Total Male Female Total
Agriculture 3,340 3,166 6,506 51,3 48,7 100
Mining and Quarrying 6,884 1,135 8,019 85,8 14,2 100
Manufacturing 21,682 16,195 37,877 57,2 42,8 100
Electricity & Water 3,681 1,435 5,116 72,0 28,0 100
Construction 17,331 6,065 23,396 74,1 25,9 100
Wholesale & Retail Trade 28,381 23,006 51,378 55,2 44,8 100
Hotels & Restaurants 7,334 11,539 18,873 38,9 61,1 100
Transport & Communication 8,738 5,349 14,086 62,0 38,0 100
Finance 3,263 5,526 8,788 37,1 62,9 100
Real Estate 13,913 6,717 20,631 67,4 32,6 100
Education 4,444 5,910 10,353 42,9 57,1 100
Health 1,237 2,135 3,373 36,7 63,3 100
Other Community 1,468 3,085 4,553 32,2 67,8 100
Private and Parastatal 121,696 91,263 212,949 57,1 42,9 100
Private 110,495 82,995 193,480 57,1 42,9 100
Parastatal 11,201 8,268 19,469 57,5 42,5 100
Central Government 47,929 56,133 104,062 46,1 53,9 100
Local Government 32,540 59,658 92,198 35,3 64,7 100
Ipelegeng Program 20,963 46,347 67,310 31,1 68,9 100
Local Gov. Excl. Ipelegeng 11,577 13,311 24,888 46,5 53,5 100
All Sectors excl. Ipelegeng 181,172 160,712 341,874 53,0 47,0 100
All Sectors 202,135 207,059 409,184 49,4 50,6 100
8 Formal Sector Employment Stats Brief September 2017 STATISTICS BOTSWANA
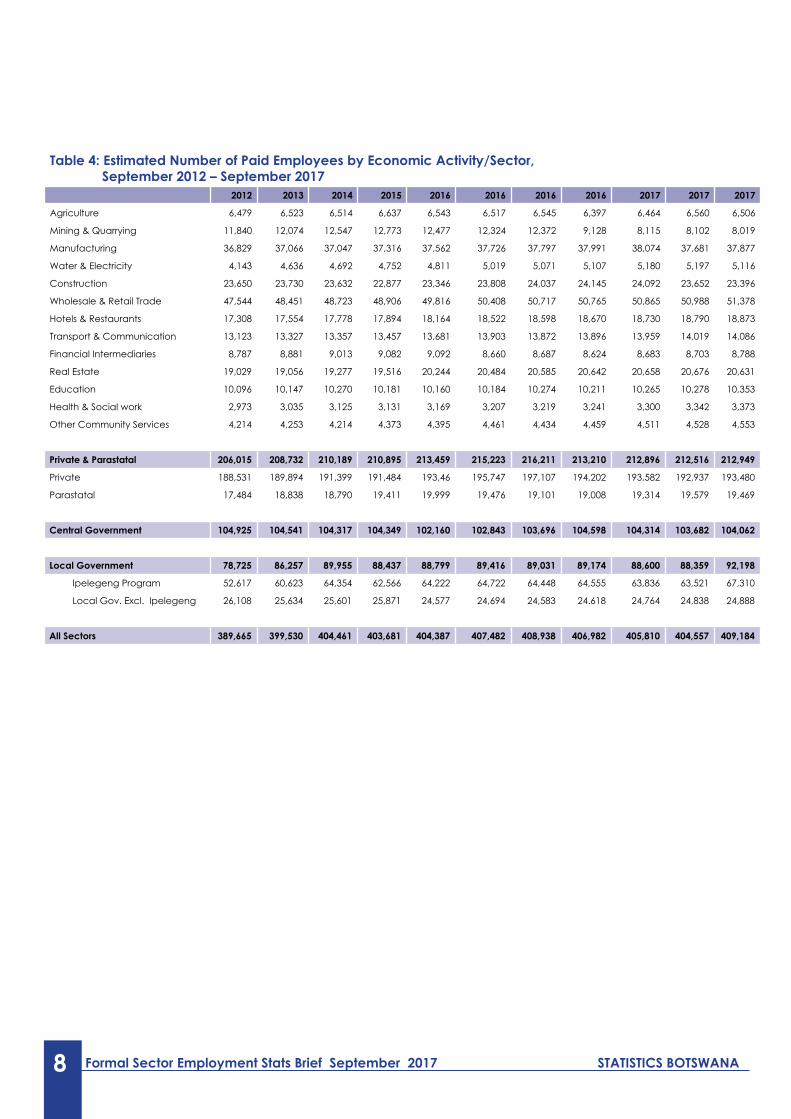
Table 4: Estimated Number of Paid Employees by Economic Activity/Sector, September 2012 – September 2017
2012 2013 2014 2015 2016 2016 2016 2016 2017 2017 2017
Agriculture 6,479 6,523 6,514 6,637 6,543 6,517 6,545 6,397 6,464 6,560 6,506
Mining & Quarrying 11,840 12,074 12,547 12,773 12,477 12,324 12,372 9,128 8,115 8,102 8,019
Manufacturing 36,829 37,066 37,047 37,316 37,562 37,726 37,797 37,991 38,074 37,681 37,877
Water & Electricity 4,143 4,636 4,692 4,752 4,811 5,019 5,071 5,107 5,180 5,197 5,116
Construction 23,650 23,730 23,632 22,877 23,346 23,808 24,037 24,145 24,092 23,652 23,396
Wholesale & Retail Trade 47,544 48,451 48,723 48,906 49,816 50,408 50,717 50,765 50,865 50,988 51,378
Hotels & Restaurants 17,308 17,554 17,778 17,894 18,164 18,522 18,598 18,670 18,730 18,790 18,873
Transport & Communication 13,123 13,327 13,357 13,457 13,681 13,903 13,872 13,896 13,959 14,019 14,086
Financial Intermediaries 8,787 8,881 9,013 9,082 9,092 8,660 8,687 8,624 8,683 8,703 8,788
Real Estate 19,029 19,056 19,277 19,516 20,244 20,484 20,585 20,642 20,658 20,676 20,631
Education 10,096 10,147 10,270 10,181 10,160 10,184 10,274 10,211 10,265 10,278 10,353
Health & Social work 2,973 3,035 3,125 3,131 3,169 3,207 3,219 3,241 3,300 3,342 3,373
Other Community Services 4,214 4,253 4,214 4,373 4,395 4,461 4,434 4,459 4,511 4,528 4,553
Private & Parastatal 206,015 208,732 210,189 210,895 213,459 215,223 216,211 213,210 212,896 212,516 212,949
Private 188,531 189,894 191,399 191,484 193,46 195,747 197,107 194,202 193,582 192,937 193,480
Parastatal 17,484 18,838 18,790 19,411 19,999 19,476 19,101 19,008 19,314 19,579 19,469
Central Government 104,925 104,541 104,317 104,349 102,160 102,843 103,696 104,598 104,314 103,682 104,062
Local Government 78,725 86,257 89,955 88,437 88,799 89,416 89,031 89,174 88,600 88,359 92,198
Ipelegeng Program 52,617 60,623 64,354 62,566 64,222 64,722 64,448 64,555 63,836 63,521 67,310
Local Gov. Excl. Ipelegeng 26,108 25,634 25,601 25,871 24,577 24,694 24,583 24.618 24,764 24,838 24,888
All Sectors 389,665 399,530 404,461 403,681 404,387 407,482 408,938 406,982 405,810 404,557 409,184
Formal Sector Employment Stats Brief September 2017 STATISTICS BOTSWANA 9
Table 5: Estimated Monthly Average Cash Earnings by Economic Activity, Citizenship and Sex, September 2017 and June 2017
Sector/ Economic Activity
Sep-17 Jun-17
% Change
Citizens Non-Citizens All Employees
TotalMale Female Total Male Female Total Male Female Total
Agriculture 1,586 1,211 1,388 3,448 2,498 3,309 1,924 1,253 1,597 1,443 10,7
Mining and Quarrying 14,235 17,604 14,713 84,916 38,659 79,178 15,395 17,901 15,750 16,624 -5,3
Manufacturing 5,904 3,390 4,799 20,421 18,466 20,048 6,880 3,698 5,520 5,256 5,0
Electricity & Water 11,691 10,706 11,416 30,078 10,566 19,748 11,771 10,704 11,472 11,226 2,2
Construction 3,557 3,545 3,554 16,901 6,801 14,176 4,881 3,886 4,623 5,106 -9,5
Wholesale & Retail Trade 3,827 3,091 3,490 19,821 16,571 19,355 4,668 3,233 4,026 4,214 -4,5
Hotels & Restaurants 2,872 2,709 2,772 18,450 18,855 18,582 3,348 2,860 3,050 2,920 4,4
Transport & Communication 8,940 8,950 8,945 18,184 12,181 17,193 9,374 8,999 9,232 9,128 1,1
Finance 17,746 15,919 16,590 74,163 52,889 70,804 19,130 16,019 17,176 16,757 2,5
Real Estate 6,109 7,955 6,712 23,894 18,478 22,449 6,484 8,123 7,018 6,634 5,8
Education 8,068 6,327 7,027 14,852 15,412 15,124 9,880 7,972 8,792 8,960 -1,9
Health 9,234 5,401 6,770 36,261 26,208 30,778 12,402 7,097 9,040 8,934 1,2
Other Community 7,496 2,995 4,430 7,896 4,722 5,879 7,532 3,124 4,545 4,543 0,0
Private and Parastatal 6,171 5,108 5,707 18,923 13,875 17,485 6,996 5,409 6,316 6,327 -0,2
Private 5,123 4,147 4,697 19,059 13,641 17,513 6,044 4,481 5,374 5,379 -0,1
Parastatal 15,274 15,669 15,401 18,162 36,733 21,502 15,373 15,908 15,563 15,670 -0,7
Central Government 8,826 9,676 9,286 17,295 14,527 16,325 8,946 9,707 9,356 9,011 3,8
Local Government 2,419 1,545 1,853 16,362 13,487 16,573 2,449 1,550 1,868 1,920 -2,7
Ipelegeng Program 567 567 567 - - - 567 567 567 567 0,0
Local Gov. Excl. Ipelegeng 5,793 4,956 5,345 16,362 13,487 16,573 5,856 4,971 5,383 5,379 0,1
All Sectors excl. Ipelegeng Programme employees 6,872 6,716 6,798 18,775 13,940 17,379 7,440 6,874 7,175 7,074 1,4
10 Formal Sector Employment Stats Brief September 2017 STATISTICS BOTSWANA
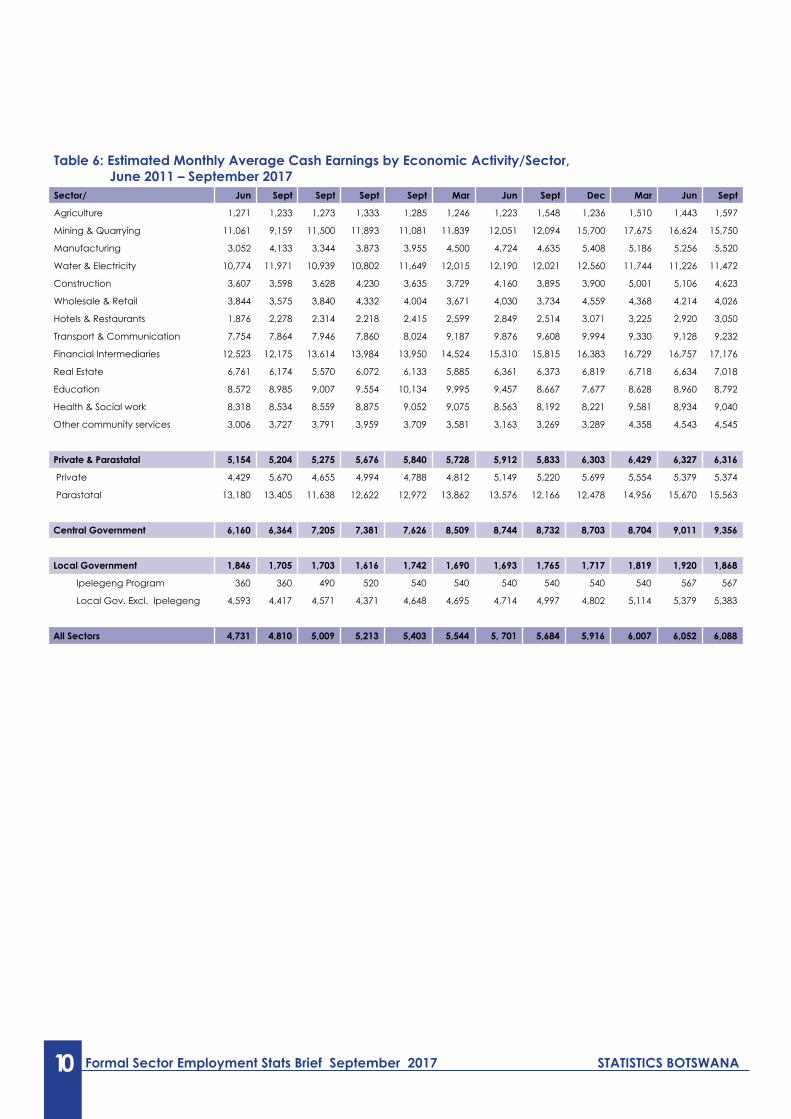
Table 6: Estimated Monthly Average Cash Earnings by Economic Activity/Sector, June 2011 – September 2017Sector/ Jun Sept Sept Sept Sept Mar Jun Sept Dec Mar Jun Sept
Agriculture 1,271 1,233 1,273 1,333 1,285 1,246 1,223 1,548 1,236 1,510 1,443 1,597
Mining & Quarrying 11,061 9,159 11,500 11,893 11,081 11,839 12,051 12,094 15,700 17,675 16,624 15,750
Manufacturing 3,052 4,133 3,344 3,873 3,955 4,500 4,724 4,635 5,408 5,186 5,256 5,520
Water & Electricity 10,774 11,971 10,939 10,802 11,649 12,015 12,190 12,021 12,560 11,744 11,226 11,472
Construction 3,607 3,598 3,628 4,230 3,635 3,729 4,160 3,895 3,900 5,001 5,106 4,623
Wholesale & Retail 3,844 3,575 3,840 4,332 4,004 3,671 4,030 3,734 4,559 4,368 4,214 4,026
Hotels & Restaurants 1,876 2,278 2,314 2,218 2,415 2,599 2,849 2,514 3,071 3,225 2,920 3,050
Transport & Communication 7,754 7,864 7,946 7,860 8,024 9,187 9,876 9,608 9,994 9,330 9,128 9,232
Financial Intermediaries 12,523 12,175 13,614 13,984 13,950 14,524 15,310 15,815 16,383 16,729 16,757 17,176
Real Estate 6,761 6,174 5,570 6,072 6,133 5,885 6,361 6,373 6,819 6,718 6,634 7,018
Education 8,572 8,985 9,007 9,554 10,134 9,995 9,457 8,667 7,677 8,628 8,960 8,792
Health & Social work 8,318 8,534 8,559 8,875 9,052 9,075 8,563 8,192 8,221 9,581 8,934 9,040
Other community services 3,006 3,727 3,791 3,959 3,709 3,581 3,163 3,269 3,289 4,358 4,543 4,545
Private & Parastatal 5,154 5,204 5,275 5,676 5,840 5,728 5,912 5,833 6,303 6,429 6,327 6,316
Private 4,429 5,670 4,655 4,994 4,788 4,812 5,149 5,220 5,699 5,554 5,379 5,374
Parastatal 13,180 13,405 11,638 12,622 12,972 13,862 13,576 12,166 12,478 14,956 15,670 15,563
Central Government 6,160 6,364 7,205 7,381 7,626 8,509 8,744 8,732 8,703 8,704 9,011 9,356
Local Government 1,846 1,705 1,703 1,616 1,742 1,690 1,693 1,765 1,717 1,819 1,920 1,868
Ipelegeng Program 360 360 490 520 540 540 540 540 540 540 567 567
Local Gov. Excl. Ipelegeng 4,593 4,417 4,571 4,371 4,648 4,695 4,714 4,997 4,802 5,114 5,379 5,383
All Sectors 4,731 4,810 5,009 5,213 5,403 5,544 5, 701 5,684 5,916 6,007 6,052 6,088
Formal Sector Employment Stats Brief September 2017 STATISTICS BOTSWANA 11
Table 7: Minimum Hourly Wage Rates (Thebe)
Private and ParastatalsApril2009
April2010
April2011
April2012
June2013
June2014
July2015
June2016
Novmber2017
Building, Construction, Exploration and Quarrying 380 380 380 420 450 486 515 546 579
Manufacturing, Service and Repair Trades 380 380 380 420 450 486 515 546 579
Wholesale Distributive Trades 380 380 380 420 450 486 515 546 579
Retail Distributive Trades 330 330 330 370 400 432 458 485 514
Hotel, Catering and Entertainment Trades 380 380 380 420 450 486 515 546 579
Garage, Motor Trades and Road Transport 380 380 380 420 450 486 515 546 579
Retail and Wholesale Night watchmen 320 320 320 350 380 410 435 461 489
Security Guards Employed by Security Companies 380 380 380 420 450 486 515 546 579
Agricultural Sector – P700 per month (2017 November)Domestic Service Sector – P3.21 per hour (2017 November)Source: Department of Labour and Social Security
12 Formal Sector Employment Stats Brief September 2017 STATISTICS BOTSWANA
Private Bag 0024, Gaborone. Tel: 3671300 Fax: 3952201 Toll Free: 0800 600 200E-mail: [email protected] Website: http://www.statsbots.org.bw