Embed Size (px)
Citation preview
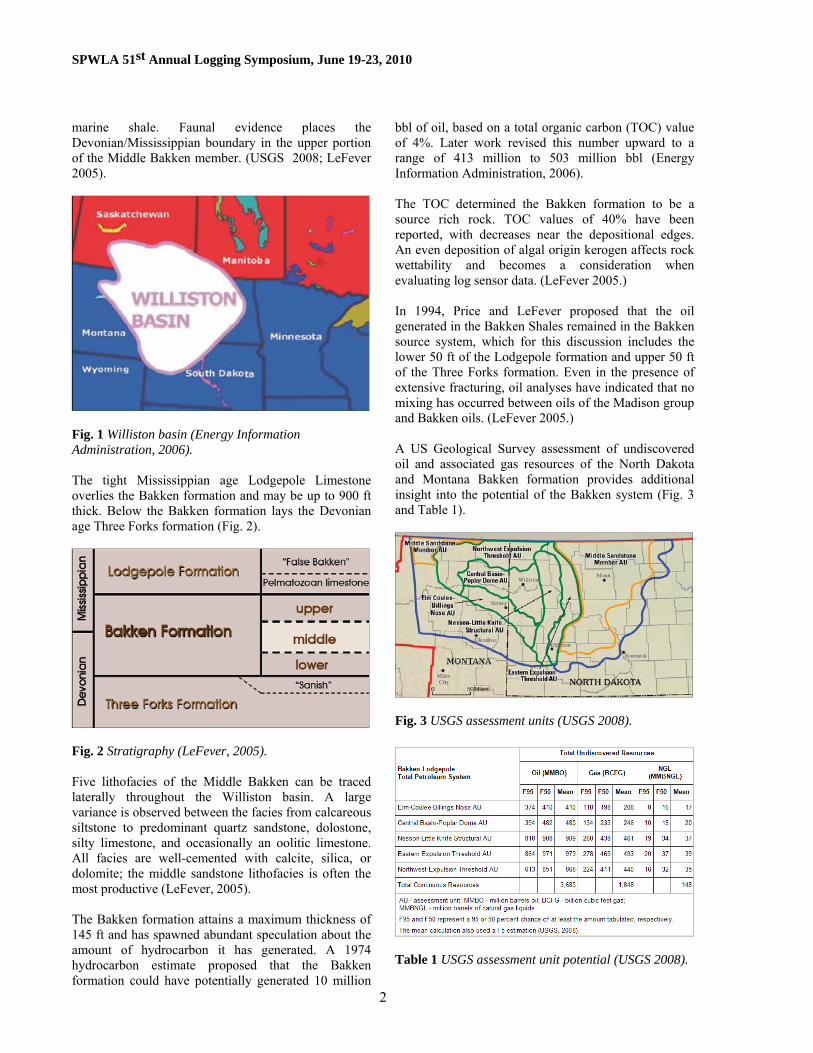
SPWLA 51st Annual Logging Symposium, June 19-23, 2010
Formation Evaluation in the Bakken Complex Using Laboratory Core Data and Advanced Logging Technologies
Sandeep Ramakrishna, Ron Balliet, Danny Miller, Shriram Sarvotham, Halliburton;
Dick Merkel, Newfield Exploration Company
Copyright 2010, held jointly by the Society of Petrophysicists and Well Log Analysts (SPWLA) and the submitting authors.
This paper was prepared for presentation at the SPWLA 51st Annual Logging Symposium held Perth, Australia, June 19-23, 2010.
1
ABSTRACT There is intense interest in the oil and gas potential of unconventional reservoirs, such as the Bakken Shale and its adjoining formations, the Three Forks dolomite, Sanish mudstone (below), and Lodgepole limestone (above). The primary oil targets within the Upper Devonian Bakken complex include the Middle Bakken dolomitic sand/siltstone and the Three Forks dolomite. The Upper and Lower Bakken Shales are organic rich source rocks. Hydrocarbon fluid identification, volumes, and permeability are necessary input data for a strategy to determine horizontal well placement, well steering, and completions with the Bakken complex. The challenges to formation evaluation, including hydrocarbon identification, are multifold. Formation porosities and permeabilities are low, ranging from 5 to 10 pu and 0.001 to 0.1 mD, respectively. A complex distribution of reservoir and clay mineralogies, formation fluids, and reservoir quality are present in the four formations. In wells drilled with oil-based mud (OBM), filtrate invasion complicates the identification of light to medium native oil. OBM invasion may also hinder core analysis as a result of dehydration and wettability alteration during the drilling and coring process. An accurate determination of fluid volumes and permeability in this challenging environment requires an unconventional solution with a greater level of reservoir understanding. A suite of advanced logging sensors (including dipole sonic, NMR, micro-imaging, spectral gamma ray, and geochemical elemental analysis) in addition to conventional measurements were used to acquire a significant body of data for analysis. These data were then compared and calibrated to laboratory core measurements. Logs and core were taken from vertical pilot wells, which were subsequently sidetracked into laterals in the most prospective intervals. Laboratory core measurements were beneficial to understanding the range of mineralogies, formation fluids, and porosities/permeabilities present in the four formations.
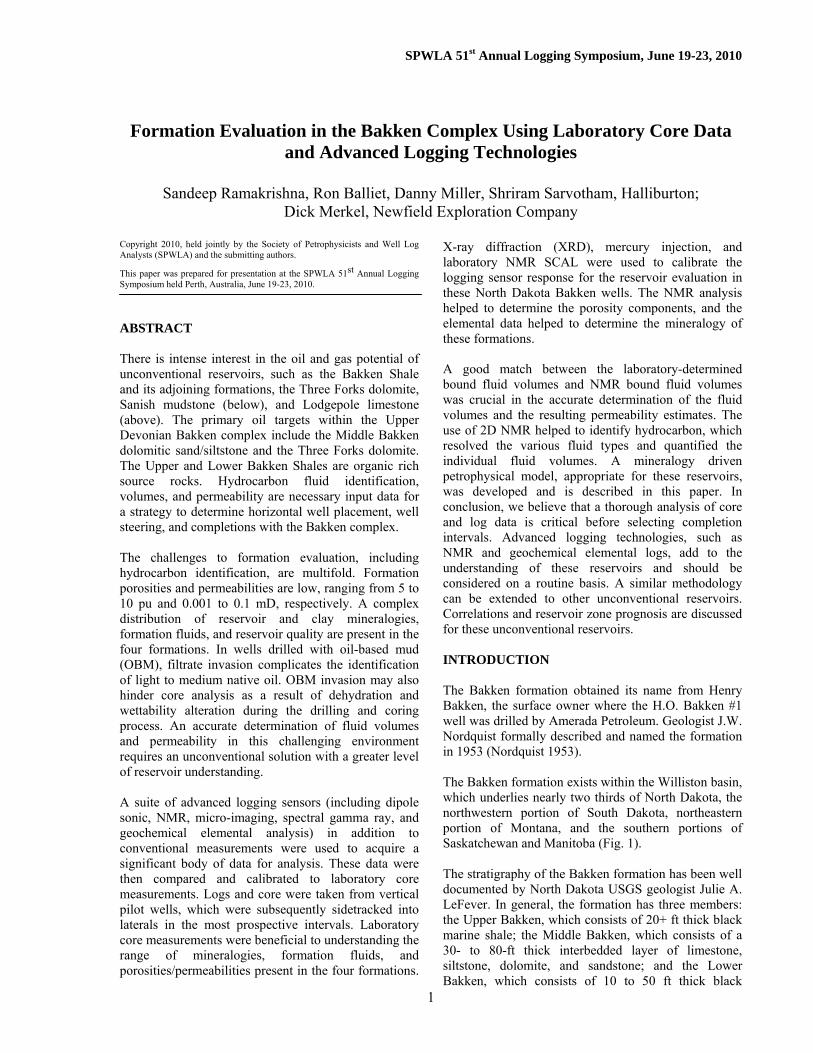
X-ray diffraction (XRD), mercury injection, and laboratory NMR SCAL were used to calibrate the logging sensor response for the reservoir evaluation in these North Dakota Bakken wells. The NMR analysis helped to determine the porosity components, and the elemental data helped to determine the mineralogy of these formations. A good match between the laboratory-determined bound fluid volumes and NMR bound fluid volumes was crucial in the accurate determination of the fluid volumes and the resulting permeability estimates. The use of 2D NMR helped to identify hydrocarbon, which resolved the various fluid types and quantified the individual fluid volumes. A mineralogy driven petrophysical model, appropriate for these reservoirs, was developed and is described in this paper. In conclusion, we believe that a thorough analysis of core and log data is critical before selecting completion intervals. Advanced logging technologies, such as NMR and geochemical elemental logs, add to the understanding of these reservoirs and should be considered on a routine basis. A similar methodology can be extended to other unconventional reservoirs. Correlations and reservoir zone prognosis are discussed for these unconventional reservoirs. INTRODUCTION The Bakken formation obtained its name from Henry Bakken, the surface owner where the H.O. Bakken #1 well was drilled by Amerada Petroleum. Geologist J.W. Nordquist formally described and named the formation in 1953 (Nordquist 1953). The Bakken formation exists within the Williston basin, which underlies nearly two thirds of North Dakota, the northwestern portion of South Dakota, northeastern portion of Montana, and the southern portions of Saskatchewan and Manitoba (Fig. 1). The stratigraphy of the Bakken formation has been well documented by North Dakota USGS geologist Julie A. LeFever. In general, the formation has three members: the Upper Bakken, which consists of 20+ ft thick black marine shale; the Middle Bakken, which consists of a 30- to 80-ft thick interbedded layer of limestone, siltstone, dolomite, and sandstone; and the Lower Bakken, which consists of 10 to 50 ft thick black
SPWLA 51st Annual Logging Symposium, June 19-23, 2010
marine shale. Faunal evidence places the Devonian/Mississippian boundary in the upper portion of the Middle Bakken member. (USGS 2008; LeFever 2005).
Fig. 1 Williston basin (Energy Information Administration, 2006). The tight Mississippian age Lodgepole Limestone overlies the Bakken formation and may be up to 900 ft thick. Below the Bakken formation lays the Devonian age Three Forks formation (Fig. 2).
Fig. 2 Stratigraphy (LeFever, 2005). Five lithofacies of the Middle Bakken can be traced laterally throughout the Williston basin. A large variance is observed between the facies from calcareous siltstone to predominant quartz sandstone, dolostone, silty limestone, and occasionally an oolitic limestone. All facies are well-cemented with calcite, silica, or dolomite; the middle sandstone lithofacies is often the most productive (LeFever, 2005).
2
The Bakken formation attains a maximum thickness of 145 ft and has spawned abundant speculation about the amount of hydrocarbon it has generated. A 1974 hydrocarbon estimate proposed that the Bakken formation could have potentially generated 10 million
bbl of oil, based on a total organic carbon (TOC) value of 4%. Later work revised this number upward to a range of 413 million to 503 million bbl (Energy Information Administration, 2006). The TOC determined the Bakken formation to be a source rich rock. TOC values of 40% have been reported, with decreases near the depositional edges. An even deposition of algal origin kerogen affects rock wettability and becomes a consideration when evaluating log sensor data. (LeFever 2005.) In 1994, Price and LeFever proposed that the oil generated in the Bakken Shales remained in the Bakken source system, which for this discussion includes the lower 50 ft of the Lodgepole formation and upper 50 ft of the Three Forks formation. Even in the presence of extensive fracturing, oil analyses have indicated that no mixing has occurred between oils of the Madison group and Bakken oils. (LeFever 2005.) A US Geological Survey assessment of undiscovered oil and associated gas resources of the North Dakota and Montana Bakken formation provides additional insight into the potential of the Bakken system (Fig. 3 and Table 1).
Fig. 3 USGS assessment units (USGS 2008).
Table 1 USGS assessment unit potential (USGS 2008).

SPWLA 51st Annual Logging Symposium, June 19-23, 2010
RESERVOIR CHARACTERIZATION CHALLENGES Characterizing the Bakken complex poses several challenges. Because this complex comprises reservoir rocks, organic rich source beds, and several seals, we must understand the petrophysical characteristics to assess the potential of these formations for oil production. The most important objective was to understand the mineralogical assemblages within this complex because these variations are below the vertical resolution of most logging tools used in our industry. Another objective of characterizing these reservoirs was to delineate the natural fracture system so that horizontal wells could be guided to intersect a large number of open fractures. The third objective was to optimize the drilling and completion strategies to improve cost recovery. Based on a preliminary basin model, the operator was considering Three Forks as the primary target and the Middle Bakken as a secondary target for these wells. CORE AND LOG ACQUISITION Data acquisition in these wells consisted of acquiring a full suite of data with advanced logging technologies along with a full core. Because of the extremely low permeability of these reservoir rocks, the completion of many of the laboratory core measurements requires weeks or even months. Consequently, during the initial development phase of this acreage, the core analysis was not completed, and the data were not available for petrophysical analyses. The interpretation of advanced logging technologies, such as NMR and geochemical elemental data, were in the preliminary stages because they must be calibrated with core. Considering these constraints and using the available information, it was decided to drill horizontally in the Three Forks reservoir. Since then, the core data have become available, and we have completed the core-log integration to develop a petrophysical model. In this paper, we have used wireline logs and core data from two wells to discuss the Middle Bakken and the Three Forks formations as potential targets for horizontal drilling and hydraulic stimulation treatments. In this paper, we have used the data from Well #1 to define and characterize the fluids in the pore space; we used the data from Well #2 to characterize the mineral assemblages, identify the beddings and fracture system, as well as compute the rock mechanical properties. The two example wells described in this paper were drilled during the initial development of this acreage. Well #1 was drilled with an OBM system, and Well #2 was drilled with a salt-saturated mud system. The
logging suite in Well #1 consisted of a triple combo (gamma ray, array induction, and density and neutron), dipole sonic, NMR, and borehole imager. The geochemical elemental tool was not available; consequently, it was not run in this wellbore. The logging suite for Well #2 included a triple combo (gamma ray, laterolog with MSFLTM, and density and neutron), dipole sonic, borehole imager, and geochemical elemental tool. Well conditions were not favorable for NMR acquisition in this wellbore. CORE DATA ANALYSIS Conventional full cores were taken and analyzed in the laboratory for porosity, permeability, mercury injection, XRD, thin section petrography, and NMR properties. One of the objectives was to evaluate the composition and diagenetic features with a particular focus on pore types, fractures, dolomitization, clay composition, and cementation. This objective was met through thin section point-count descriptions and XRD analysis (bulk and clay) of the selected samples. Another objective was to measure the pore throat radius using mercury injection data, enabling us to understand the producibility of these reservoirs. Fig. 4 and Fig. 5 show the pore throat radius classification of the Three Forks and the Middle Bakken, respectively. Using the Winland R35 technique (Kolodzie 1980) and Rinflex technique (Katz and Thompson 1986), the Three Forks was found to have a R35 value of 0.0140 microns and a R50 value of 0.0118 microns. The Middle Bakken has a R35 value of 0.0272 microns and a R50 value of 0.02 microns.
Fig. 4 Pore throat distribution of Three Forks.
3

SPWLA 51st Annual Logging Symposium, June 19-23, 2010
4
Fig. 5 Pore throat distribution of Middle Bakken. Both formations show a bimodal pore throat distribution, but the Middle Bakken shows a distribution weighted to larger pore throats. Fig. 6 and Fig. 7 show the mercury injection pressure vs. saturation plots for the Three Forks and Middle Bakken, respectively. The inserts in the two figures show the pressure vs. saturation plots converted to a gas/water system. Based on these plots, the irreducible water saturation can be estimated in both reservoirs; we also used these data to validate our T2 BVI cut-off from NMR. The pore throat distributions and mercury injection data indicate that the Middle Bakken has superior productivity and better flow units, as compared to the Three Forks, and would provide a better target for completions.
Fig. 6 Mercury injection of Three Forks.
Fig. 7 Mercury injection of Middle Bakken. Thin section petrography was performed on samples from the Middle Bakken; the results indicate that it includes sandstones, argillaceous sandstones, argillaceous siltstones, and calcareous silty shale. Fig. 8 shows a ternary diagram of the distribution of these sandstones (modified from Folk 1980). These samples contain varying amounts of calcite and dolomite cement/replacement, as well as faint to well-defined clay-rich laminations. The framework grains were moderately well sorted; the average grain size ranges from 0.038 to 0.139 mm (coarse silt to lower fine sand). Some of the samples were found to contain fractures.
Fig. 8 Ternary diagram of sandstone distribution in Middle Bakken.

SPWLA 51st Annual Logging Symposium, June 19-23, 2010
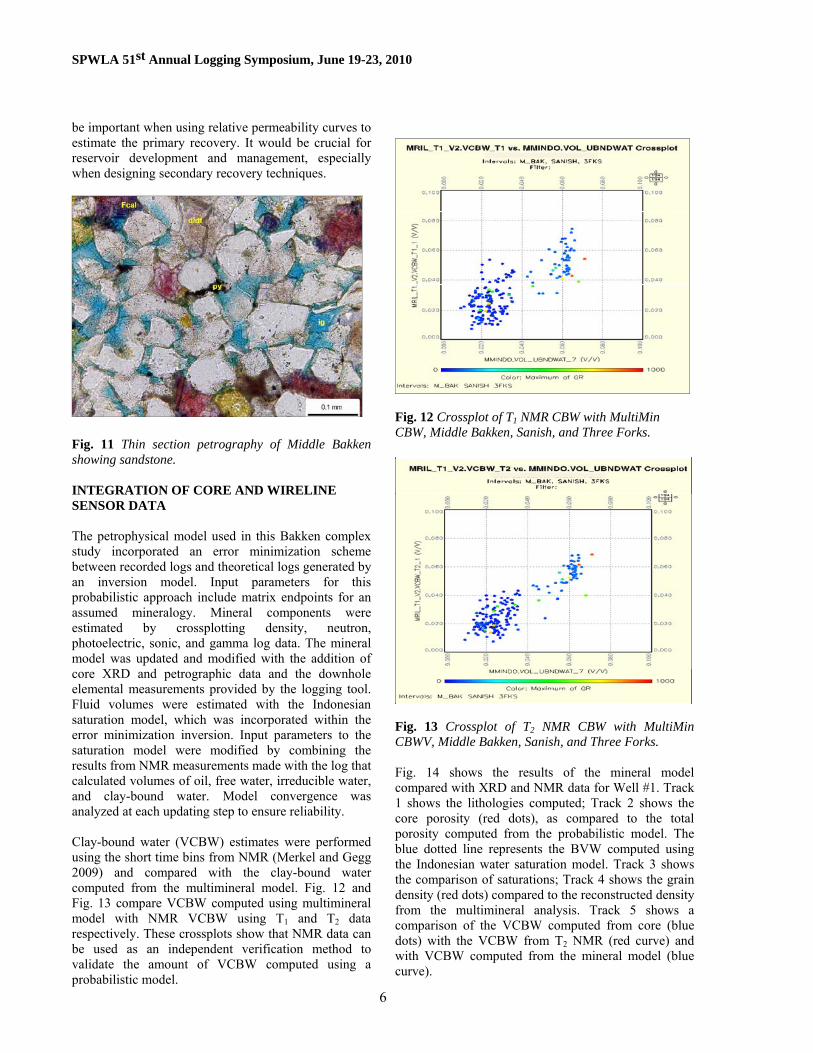
The fractures (Fig. 9) were typically discontinuous and parallel to bedding; they were found to be open (contain no cement). Monocrystalline quartz (Fig. 10) is the most abundant framework grain with lesser quantities of plagioclase, potassium feldspar, and calcareous grains. The calcareous grains include limestone fragments, peloids, and other recrystallized non-skeletal carbonate grains. Detrital matrix is abundant in the argillaceous siltstones and sandstones. The XRD data indicate that these samples contain 2 to 18% total clay. Most of the clay was identified as illite. Other clay minerals found in much smaller quantities include chlorite, mixed-layer illite/smectites, and traces of kaolinites. Dolomite exists as authigenic cement and is slightly ferroan (d/df, Fig. 11). The ferroan dolomite exists as entire crystals and as rims around non-ferroan dolomites. Calcite cement (ca, Fig. 10), found in some of samples, had filled all of the primary pore space. Syntaxial quartz overgrowths and minor amounts of pyrite were observed. Core analysis was performed under a net confining stress of 3,700 psi, which is representative of the reservoir conditions. The samples contain 1.1 to 10.2% porosity and permeabilities ranging from <0.001 to 0.215 mD. The sandstones and slightly argillaceous sandstones that have not been extensively cemented by calcite contain the highest porosities and permeabilities. Most of the porosity comes from the intergranular pores (e.g., Fig. 11). Secondary intragranular pores (Fig. 10) have been formed by the partial dissolution of feldspar grains and rock fragments, but are observed only in trace amounts and do not significantly contribute to total porosity. Some of the argillaceous sandstones have relatively high porosities, but very low permeabilities. Most of the porosity in these samples is attributable to the micropores in the clay matrix. Fig. 9 shows a thin section of an argillaceous siltstone. Monocrystalline quartz grains are abundant with minor amounts of potassium feldspars, plagioclase, volcanic rock fragments, muscovite, calcareous grains, and other skeletal fragments. Detrital clay matrix is present along with dolomite cement. Thin, discontinuous parallel fractures are observed in thin section, but it is unclear whether these are natural or drilling-induced. Fig. 10 shows a thin section of well sorted, fine grained sandstone that has been extensively cemented with calcite. Monocrystalline quartz grains are abundant with non-skeletal calcareous grains. Skeletal grains, such as bryozoans, brachiopods, and echinoderms are observed in minor amounts. Dolomite cements, grain replacement, and pyrite were also found. Rare intergranular pores were found within partially dissolved feldspar grains and lithic fragments.
Fig. 11 shows a thin section of moderately sorted, fine-grained sandstone. Monocrystalline quartz grains are abundant, with minor amounts of potassium feldspar, plagioclase, argillaceous rock fragments, muscovite, and brachiopod fragments. Dolomite is found in moderate amounts as replaced grains and as intergranular cement. Other minor cements include pyrite, calcite, and syntaxial quartz overgrowths.
Fig. 9 Thin section petrography of Middle Bakken showing argillaceous sandstone.
Fig. 10 Thin section petrography of Middle Bakken showing sandstone with abundant calcite cement. Preliminary core examinations indicate that wettability could be an issue in the Bakken complex. Additional analysis is required to understand the extent of wettability. Drilling with OBM could alter the wettability of the rock; in such cases, it would not be possible to know the original wettability from core studies. In-situ wettability measurements may be possible with the use of NMR logging. Understanding the wettability characteristics of these reservoirs would
5
SPWLA 51st Annual Logging Symposium, June 19-23, 2010
be important when using relative permeability curves to estimate the primary recovery. It would be crucial for reservoir development and management, especially when designing secondary recovery techniques.
Fig. 12 Crossplot of T1 NMR CBW with MultiMin CBW, Middle Bakken, Sanish, and Three Forks.
Fig. 11 Thin section petrography of Middle Bakken showing sandstone.
INTEGRATION OF CORE AND WIRELINE SENSOR DATA The petrophysical model used in this Bakken complex study incorporated an error minimization scheme between recorded logs and theoretical logs generated by an inversion model. Input parameters for this probabilistic approach include matrix endpoints for an assumed mineralogy. Mineral components were estimated by crossplotting density, neutron, photoelectric, sonic, and gamma log data. The mineral model was updated and modified with the addition of core XRD and petrographic data and the downhole elemental measurements provided by the logging tool. Fluid volumes were estimated with the Indonesian saturation model, which was incorporated within the error minimization inversion. Input parameters to the saturation model were modified by combining the results from NMR measurements made with the log that calculated volumes of oil, free water, irreducible water, and clay-bound water. Model convergence was analyzed at each updating step to ensure reliability.
Fig. 13 Crossplot of T2 NMR CBW with MultiMin CBWV, Middle Bakken, Sanish, and Three Forks. Fig. 14 shows the results of the mineral model compared with XRD and NMR data for Well #1. Track 1 shows the lithologies computed; Track 2 shows the core porosity (red dots), as compared to the total porosity computed from the probabilistic model. The blue dotted line represents the BVW computed using the Indonesian water saturation model. Track 3 shows the comparison of saturations; Track 4 shows the grain density (red dots) compared to the reconstructed density from the multimineral analysis. Track 5 shows a comparison of the VCBW computed from core (blue dots) with the VCBW from T2 NMR (red curve) and with VCBW computed from the mineral model (blue curve).
6
Clay-bound water (VCBW) estimates were performed using the short time bins from NMR (Merkel and Gegg 2009) and compared with the clay-bound water computed from the multimineral model. Fig. 12 and Fig. 13 compare VCBW computed using multimineral model with NMR VCBW using T1 and T2 data respectively. These crossplots show that NMR data can be used as an independent verification method to validate the amount of VCBW computed using a probabilistic model.

SPWLA 51st Annual Logging Symposium, June 19-23, 2010
11100
11150
11050
Fig. 14 Well #1, comparison of clay-bound water (CBW) from probabilistic model, NMR, and XRD; Middle Bakken, Sanish, and Three Forks.
Fig. 15 Well #1, comparison of probabilistic mineral/saturation model with XRD; Middle Bakken, Sanish, and Three Forks.
7
SPWLA 51st Annual Logging Symposium, June 19-23, 2010
8
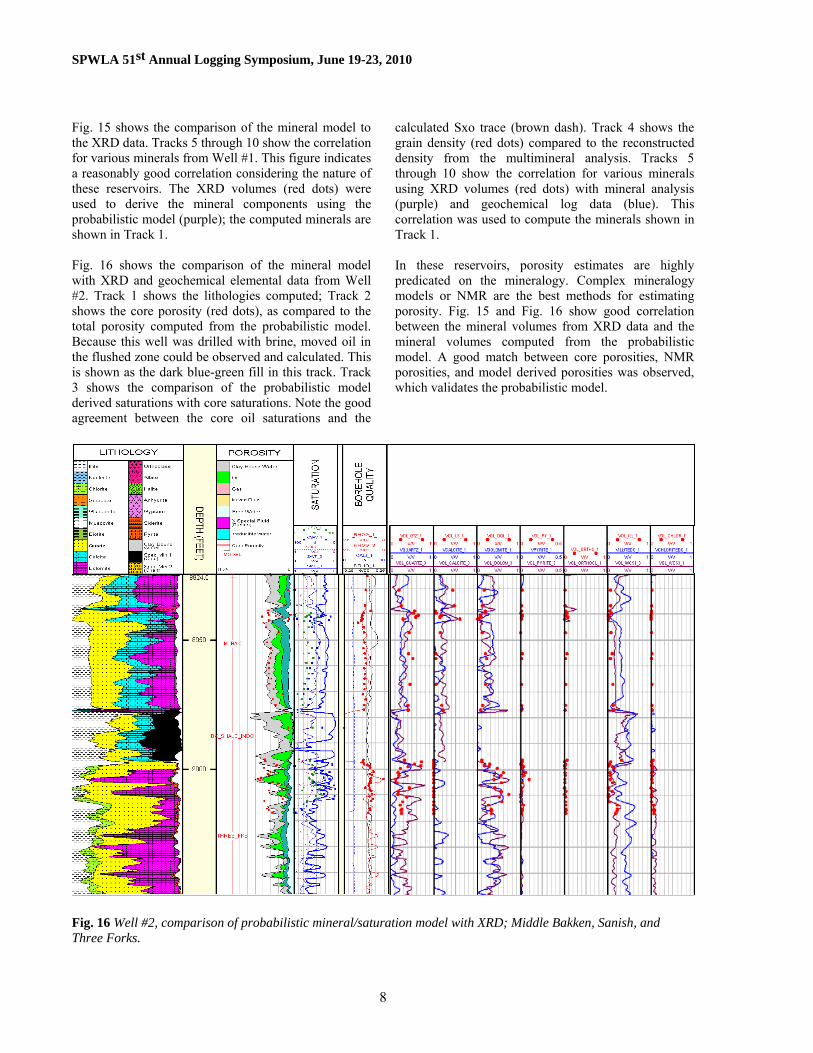
Fig. 15 shows the comparison of the mineral model to the XRD data. Tracks 5 through 10 show the correlation for various minerals from Well #1. This figure indicates a reasonably good correlation considering the nature of these reservoirs. The XRD volumes (red dots) were used to derive the mineral components using the probabilistic model (purple); the computed minerals are shown in Track 1. Fig. 16 shows the comparison of the mineral model with XRD and geochemical elemental data from Well #2. Track 1 shows the lithologies computed; Track 2 shows the core porosity (red dots), as compared to the total porosity computed from the probabilistic model. Because this well was drilled with brine, moved oil in the flushed zone could be observed and calculated. This is shown as the dark blue-green fill in this track. Track 3 shows the comparison of the probabilistic model derived saturations with core saturations. Note the good agreement between the core oil saturations and the
calculated Sxo trace (brown dash). Track 4 shows the grain density (red dots) compared to the reconstructed density from the multimineral analysis. Tracks 5 through 10 show the correlation for various minerals using XRD volumes (red dots) with mineral analysis (purple) and geochemical log data (blue). This correlation was used to compute the minerals shown in Track 1. In these reservoirs, porosity estimates are highly predicated on the mineralogy. Complex mineralogy models or NMR are the best methods for estimating porosity. Fig. 15 and Fig. 16 show good correlation between the mineral volumes from XRD data and the mineral volumes computed from the probabilistic model. A good match between core porosities, NMR porosities, and model derived porosities was observed, which validates the probabilistic model.
Fig. 16 Well #2, comparison of probabilistic mineral/saturation model with XRD; Middle Bakken, Sanish, and Three Forks.
SPWLA 51st Annual Logging Symposium, June 19-23, 2010
9
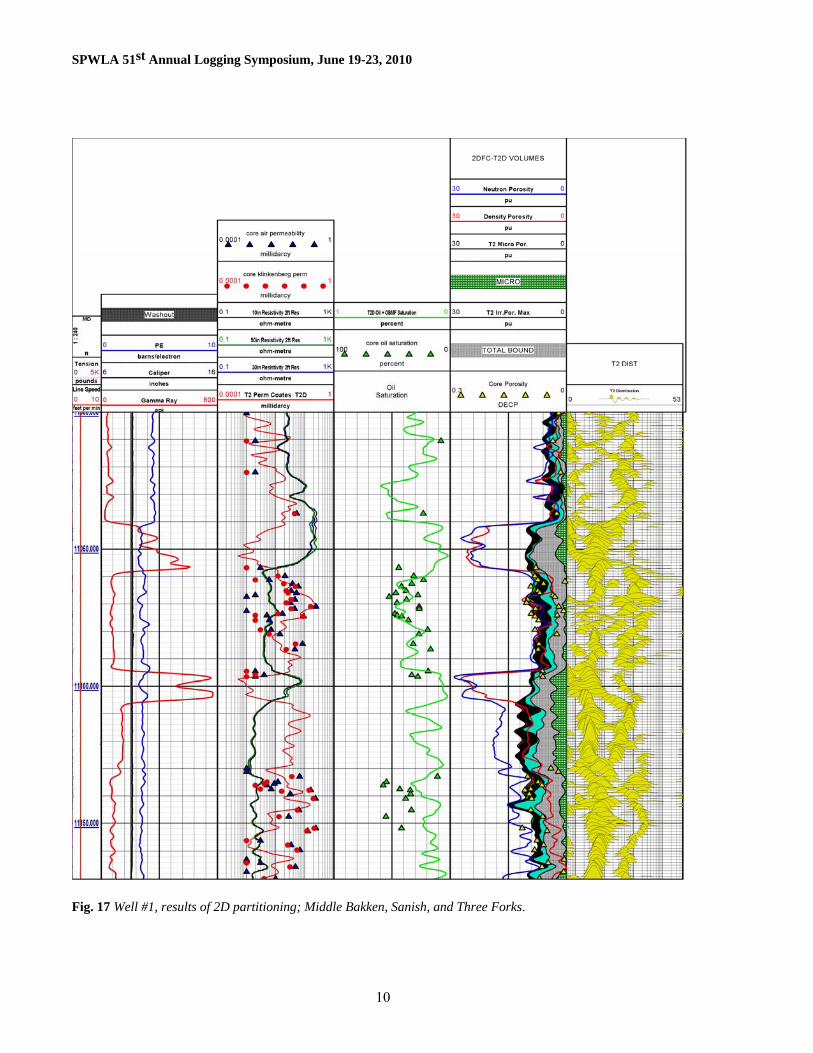
ANALYSIS METHODS WITH WIRELINE SENSORS Triple-Combo Processing - In Well #1, the evaluation of the Three Forks and Middle Bakken reservoirs using a resistivity-based water saturation model could pose several challenges, primarily because of the thin beds that affect induction response. Because this well was drilled with an OBM, a reliable Rxo measurement was not available to estimate the moveable oil saturation. The presence of complex mineralogies limits the use of density-neutron data for computing porosities and identifying lithologies. These factors contribute to a higher uncertainty in using a resistivity-based shaly-sand water-saturation model to analyze these reservoirs. In Well #2, a laterolog measurement and a Rxo measurement were available; consequently, we used a resistivity-based shaly sand model to compute the saturation values. Because the induction log response is affected by the horizontal conductivity of the thin beds, a laterolog measurement works well and is recommended for use in these reservoirs. NMR Processing and Results - NMR logging was performed in Well #1 to acquire fluid information in the Middle Bakken and Three Forks formations. The NMR data provided mineralogy independent porosity, bound and moveable fluid volumes, a permeability estimate, and 2D NMR fluid interpretation for oil, OBM filtrate, and gas and water volumes. Two NMR log passes were acquired on this well, one was a simultaneous T1T2 acquisition and the other was a T2D acquisition. Data from both these passes are discussed in this section. Fig. 17 shows the NMR log data with T2D fluid volume computations, porosity, permeability, and information from core laboratory work. The depth track includes tension (purple) and line speed (red). Track 1 includes correlation curves gamma ray (red), Photoelectric effect (blue), and caliper (black) with black shading to indicate washouts. Track 2 displays 30 inch resistivity (blue), 90 inch resistivity (green), 10 inch resistivity (black), Coates permeability (red), core air permeability (blue triangle) and core Klinkenberg permeability (red circle). Track 3 shows calculated T2D oil saturation (green) and core oil saturation (green triangle). Track 4 displays neutron porosity (blue), density porosity (red), and core porosity (yellow triangle). Track 4 also includes the T2D derived fluid volumes for microporosity (green and white pattern), bound fluid (gray), free water (light blue), OBM filtrate (black), oil (dark green), and gas (red). Track 5 contains a T2-apparent distribution.
The total NMR porosity exhibits a very close match to the core porosity, especially in the Middle Bakken (11,058 to 11,095 ft). Intervals where core porosities are much lower than total NMR porosity are believed to be from core measurements in low porosity laminations, which are below the resolution limits of the NMR sensor. In the Middle Bakken, the predominant T2D movable fluid is OBM filtrate with some free water. This is consistent with observations in the core samples of OBM invasion of a few tenths to approximately 1 in., as well as the knowledge that typical Middle Bakken wells in the area produce 1,000 to 1,500 bbl/day of oil with a 25% water cut. T2D NMR analysis may be used to compute individual volumes for OBM filtrate and native oil. For comparison to core oil saturation in Well #1, the T2D derived oil saturation considers both oil and OBM filtrate components as oil and provides a very good match in the Middle Bakken. Discrepancies between core and log derived T2D oil saturation can typically be attributed to T2D signal straddling the water-OBM filtrate and/or water-oil partition boundaries, which result in small errors in determining the volumes for water, oil, and/or OBM filtrate. Water saturations from core measurements were not considered because they were believed to be in error from OBM filtrate invasion. Computations from NMR 2D data show a significant amount of OBM filtrate invasion (Fig 17). OBM filtrate invasion was also evident during visual inspection of the core. Table 2 contains the computed fluid volumes from NMR T2D processing in a short stacked interval within the Middle Bakken. The water volume includes the bound and moveable water volumes. The hydrocarbon volumes are dominated by OBM filtrate with a small portion of the total attributed to light native oil. The native oil in Well #1 is much lighter than the OBM filtrate used to drill this well. The estimated viscosity of the native oil is approximately ≤ 3 cp, whereas the estimated viscosity of the OBM filtrate is 13 cp. In Fig. 18, native oil is displayed on the far right side of the 2D map, indicating a very light hydrocarbon with an appreciable gas/oil ratio. In the log plot, the OBM filtrate component appears between the T2intrinsic values of 40 to 250 ms along the dead oil line (green) and below. Numerical values along the dead oil line represent apparent dead oil viscosities.
SPWLA 51st Annual Logging Symposium, June 19-23, 2010
Fig. 17 Well #1, results of 2D partitioning; Middle Bakken, Sanish, and Three Forks.
10

SPWLA 51st Annual Logging Symposium, June 19-23, 2010
Fig. 18 Well # 1, T2D map for Middle Bakken interval OBM filtrate volume and minor native oil volume.
Fluid Volume (PU)
Saturation (V/V)
Water 4.865 0.560 Oil 0.955 0.110
OBM 2.868 0.330 Gas 0.003 0.000 Total 8.691
11
Table 2 Well #1, computed 2D T2D significant NMR volumes in a short stacked interval within the Middle Bakken.
Fig. 19 Well #1, 2D T1T2 image in the Three Forks.
Fluid Volume
(PU) Saturation
(V/V) Water 6.066 0.706
Oil 2.433 0.283 Gas 0.093 0.011 Total 8.592
Table 3 Well #1, computed 2D T1T2 NMR volumes in a short stacked interval within the Three Forks.
In the log plot (Fig. 17), the total NMR porosity in the Upper Bakken (11,041 to 11,058 ft) and Lower Bakken (11,095 to 11,105 ft) are consistent with the expected total porosity in this organic rich shale, as opposed to the porosity indicated by neutron and density. NMR porosity appears to indicate a small amount of movable fluid in the source rock intervals. The T2D Coates permeability also correlates with the core permeability and is typically within an order of magnitude. Laboratory NMR measurements for partial saturation and determination of bound-moveable fluid volume cutoffs have not yet been completed, so NMR log bound-moveable cutoffs were assigned based on log data and capillary pressure measurements from the core. The total NMR porosity in the Three Forks formation (11,133 to >11,520 ft) does not correlate with core porosity as well as in the Middle Bakken. Core oil saturations in the Three Forks formation tend to be greater than the log NMR estimates and may result from high OBM filtrate invasion. A small amount of gas is computed in the small reservoir interval of the Three Forks where the highest moveable fluid volume is located. A small volume of gas is produced daily from the Three Forks completion in this zone at 11,134 ft. Fig. 19 shows a 2D T1T2 image over a short stacked interval in the Three Forks formation. The diagonal lines represent lines of constant T1/T2 ratios. The main diagonal represents a T1/T2 ratio of 1, and the uppermost line represents a T1/T2 ratio of 100. Bound water lies along the ratio of 1 line at shorter T1T2 values. Free moveable water is present along the ratio of 1 line in the T2 apparent range of 80 to 100 ms. The OBM filtrate signal is present at a T1/T2 ratio of 2 to 5, and the lighter native oil occurs at higher T1/T2 ratios. A small portion of the native hydrocarbon signal is approaching the T1T2 computed for methane and is computed as gas, as shown in Table 3. Geochemical Elemental Log Processing and Results – Based on the petrophysical challenges in the Bakken complex, triple combo data are insufficient to analyze these reservoirs. In addition, it would not be economical to core each well and analyze the data in a laboratory. Adding geochemical elemental measurements as a part of the petrophysical evaluation would help to eliminate much of the subjectivity in the mineralogy evaluation. The geochemical elemental measurements consists of detecting the gamma ray emissions produced by the neutron reactions in the formations and identifying them according to the chemical elements involved in the reactions (Galford et al. 2009). Several elemental yields are derived to evaluate formation mineralogy. For example, sulphur yield is used to estimate the amount of anhydrite; magnesium is used to identify
SPWLA 51st Annual Logging Symposium, June 19-23, 2010
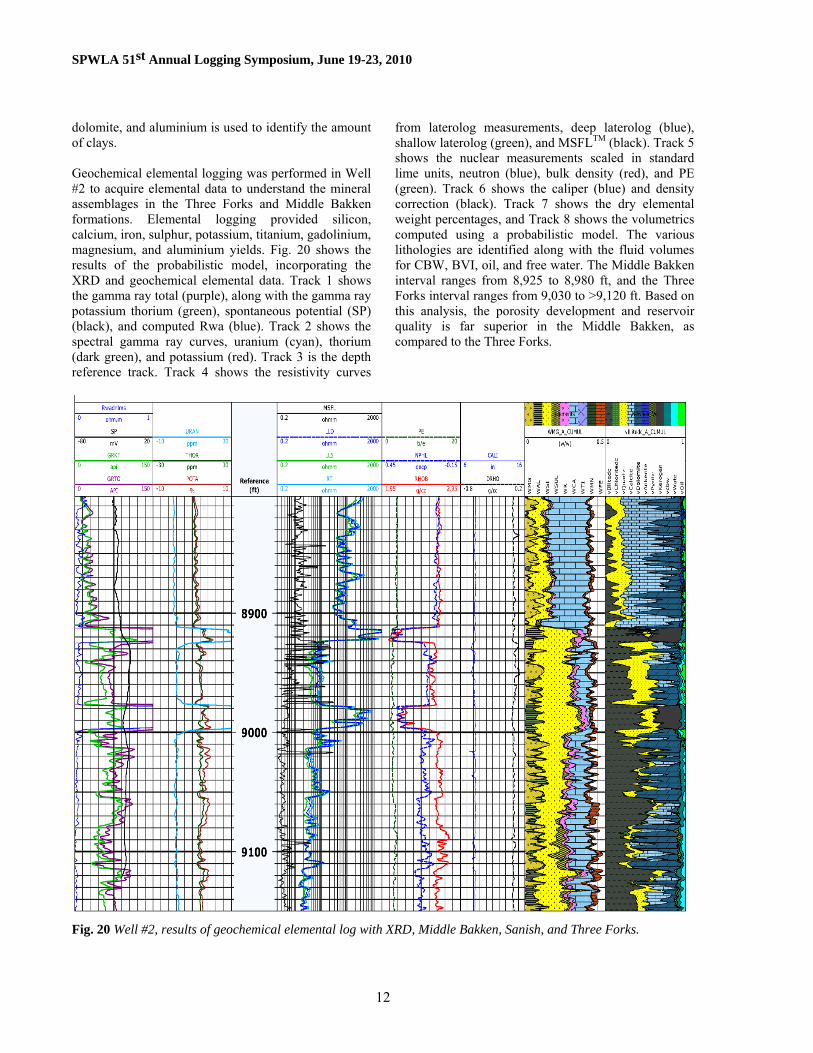
dolomite, and aluminium is used to identify the amount of clays. Geochemical elemental logging was performed in Well #2 to acquire elemental data to understand the mineral assemblages in the Three Forks and Middle Bakken formations. Elemental logging provided silicon, calcium, iron, sulphur, potassium, titanium, gadolinium, magnesium, and aluminium yields. Fig. 20 shows the results of the probabilistic model, incorporating the XRD and geochemical elemental data. Track 1 shows the gamma ray total (purple), along with the gamma ray potassium thorium (green), spontaneous potential (SP) (black), and computed Rwa (blue). Track 2 shows the spectral gamma ray curves, uranium (cyan), thorium (dark green), and potassium (red). Track 3 is the depth reference track. Track 4 shows the resistivity curves
from laterolog measurements, deep laterolog (blue), shallow laterolog (green), and MSFLTM (black). Track 5 shows the nuclear measurements scaled in standard lime units, neutron (blue), bulk density (red), and PE (green). Track 6 shows the caliper (blue) and density correction (black). Track 7 shows the dry elemental weight percentages, and Track 8 shows the volumetrics computed using a probabilistic model. The various lithologies are identified along with the fluid volumes for CBW, BVI, oil, and free water. The Middle Bakken interval ranges from 8,925 to 8,980 ft, and the Three Forks interval ranges from 9,030 to >9,120 ft. Based on this analysis, the porosity development and reservoir quality is far superior in the Middle Bakken, as compared to the Three Forks.
Fig. 20 Well #2, results of geochemical elemental log with XRD, Middle Bakken, Sanish, and Three Forks.
12
SPWLA 51st Annual Logging Symposium, June 19-23, 2010
13
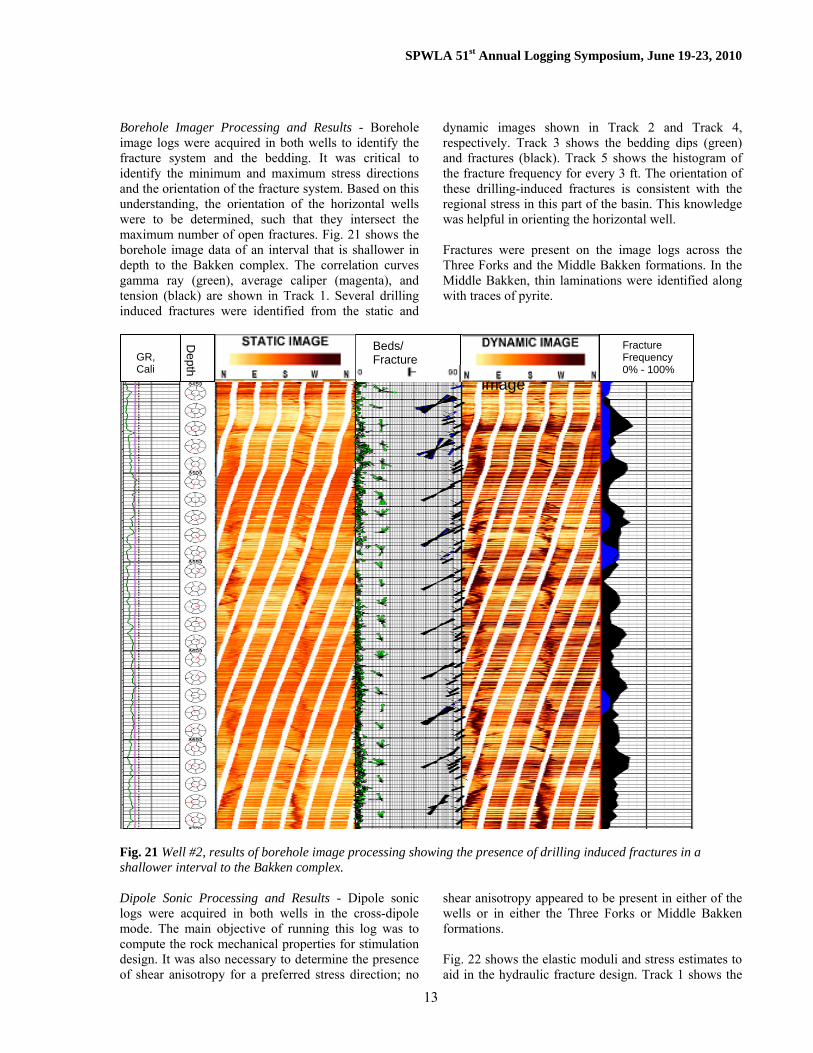
Borehole Imager Processing and Results - Borehole image logs were acquired in both wells to identify the fracture system and the bedding. It was critical to identify the minimum and maximum stress directions and the orientation of the fracture system. Based on this understanding, the orientation of the horizontal wells were to be determined, such that they intersect the maximum number of open fractures. Fig. 21 shows the borehole image data of an interval that is shallower in depth to the Bakken complex. The correlation curves gamma ray (green), average caliper (magenta), and tension (black) are shown in Track 1. Several drilling induced fractures were identified from the static and
dynamic images shown in Track 2 and Track 4, respectively. Track 3 shows the bedding dips (green) and fractures (black). Track 5 shows the histogram of the fracture frequency for every 3 ft. The orientation of these drilling-induced fractures is consistent with the regional stress in this part of the basin. This knowledge was helpful in orienting the horizontal well. Fractures were present on the image logs across the Three Forks and the Middle Bakken formations. In the Middle Bakken, thin laminations were identified along with traces of pyrite.
Fig. 21 Well #2, results of borehole image processing showing the presence of drilling induced fractures in a shallower interval to the Bakken complex. Dipole Sonic Processing and Results - Dipole sonic logs were acquired in both wells in the cross-dipole mode. The main objective of running this log was to compute the rock mechanical properties for stimulation design. It was also necessary to determine the presence of shear anisotropy for a preferred stress direction; no
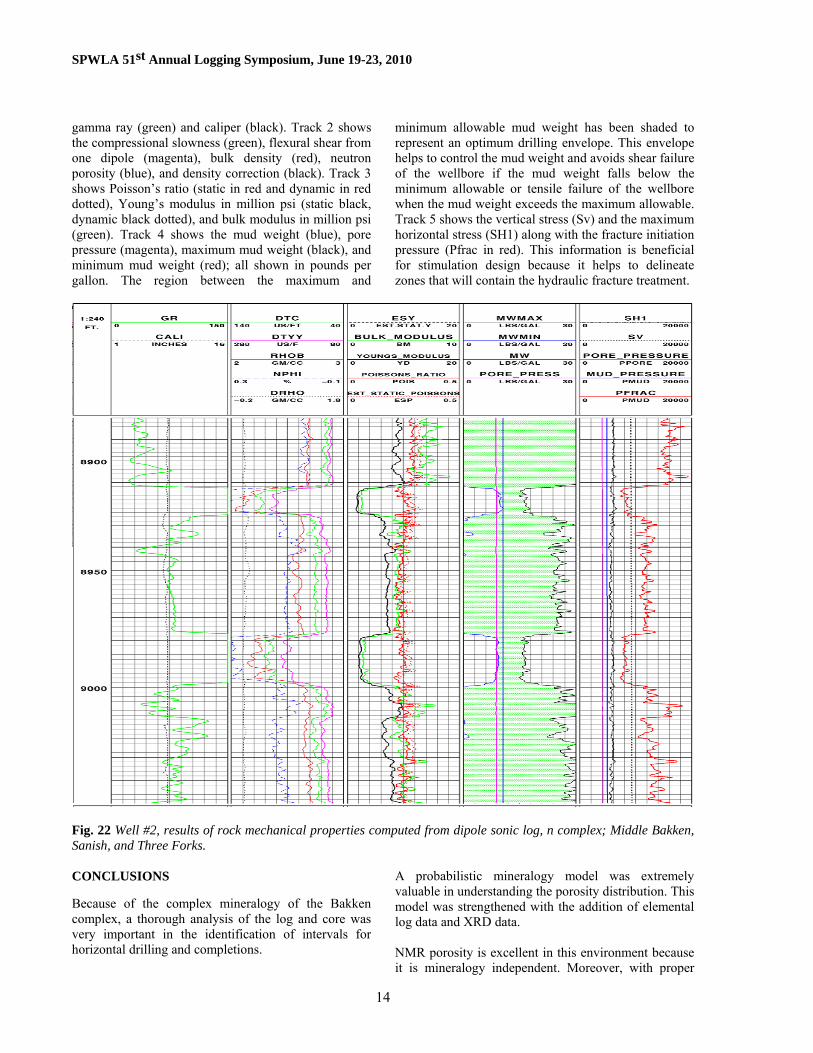
shear anisotropy appeared to be present in either of the wells or in either the Three Forks or Middle Bakken formations. Fig. 22 shows the elastic moduli and stress estimates to aid in the hydraulic fracture design. Track 1 shows the
GR, Cali
Depth
Static Image Beds/ Fracture 00 - 900 Dynamic
Image
Fracture Frequency0% - 100%
SPWLA 51st Annual Logging Symposium, June 19-23, 2010
14
gamma ray (green) and caliper (black). Track 2 shows the compressional slowness (green), flexural shear from one dipole (magenta), bulk density (red), neutron porosity (blue), and density correction (black). Track 3 shows Poisson’s ratio (static in red and dynamic in red dotted), Young’s modulus in million psi (static black, dynamic black dotted), and bulk modulus in million psi (green). Track 4 shows the mud weight (blue), pore pressure (magenta), maximum mud weight (black), and minimum mud weight (red); all shown in pounds per gallon. The region between the maximum and
minimum allowable mud weight has been shaded to represent an optimum drilling envelope. This envelope helps to control the mud weight and avoids shear failure of the wellbore if the mud weight falls below the minimum allowable or tensile failure of the wellbore when the mud weight exceeds the maximum allowable. Track 5 shows the vertical stress (Sv) and the maximum horizontal stress (SH1) along with the fracture initiation pressure (Pfrac in red). This information is beneficial for stimulation design because it helps to delineate zones that will contain the hydraulic fracture treatment.
Fig. 22 Well #2, results of rock mechanical properties computed from dipole sonic log, n complex; Middle Bakken, Sanish, and Three Forks. CONCLUSIONS Because of the complex mineralogy of the Bakken complex, a thorough analysis of the log and core was very important in the identification of intervals for horizontal drilling and completions.
A probabilistic mineralogy model was extremely valuable in understanding the porosity distribution. This model was strengthened with the addition of elemental log data and XRD data. NMR porosity is excellent in this environment because it is mineralogy independent. Moreover, with proper
SPWLA 51st Annual Logging Symposium, June 19-23, 2010
15
acquisition parameters, these data can be used for fluid typing. NMR based permeability models compare favorably with core and production data and can be used as an aid in the completion strategy for a well. Based on the two wells studied in this paper, petrophysical analysis of the Middle Bakken has shown it to have better reservoir quality than the Three Forks. ACKNOWLEDGEMENTS The authors would like to thank the management of Newfield Exploration Company for the release of this data. We wish to thanks our colleagues at Newfield and Halliburton for their input and valuable advice in using advanced logging technologies to understand unconventional reservoirs. RERERENCES Energy Information Administration Bulletin, November 2006, Offices of Oil and Gas, Reserves and Production Division. Galford, J., Truax, J., Hrametz, A., and Harambourne, C., 2009, A new neutron-induced gamma-ray spectroscopy tool for geochemical logging. Paper X, Presented at the 50th SPWLA Annual Logging Symposium, Houston, TX. Folk, R.L., 1980, Petrology of sedimentary rocks, Hemphill Publishing, Austin, TX, 184p. Katz, A.J., Thompson, A.H., 1986, Quantitative prediction of permeability in porous rock, American Physical Society, Physical Review B, 34, 8179-8181. Kolodzie, S. Jr., 1980, Analysis of pore throat size and use of Waxman-Smits equation to determine OOIP in Spindle Field, Colorado. Paper SPE 9382 presented at the SPE Annual Technical Conference and Exhibition, Dallas, Texas, USA, 21-24 September. LeFever, Julie A., 2005, Montana-North Dakota Middle Member Bakken Play, North Dakota Geological Survey. Merkel, R.H. and Gegg, J.K., 2009, NMR log/core data in tight gas sand petrophysical model development, Petrophysics Journal, vol 50, No 2, pp 130-139. Nordquist, J.W., 1953, Mississippian stratigraphy of northern Montana, Billings Geological Society, 4th Annual Field Conference Guidebook, pp 68-82.
USGS Fact Sheet, 2008-3-21, April 2008. ABOUT THE AUTHORS Sandeep Ramakrishna works for Halliburton as a petrophysicist in US Southern Region Wireline and Perforating product service line. Sandeep holds a MS degree in petroleum engineering from the University of Tulsa, Oklahoma. He has more than 12 years of experience in the industry and has been actively involved in developing techniques to analyze unconventional reservoirs. He is a member of the Society of Professional Well Log Analysts, Society of Petroleum Engineers, and American Association of Petroleum Geologists. Ron Balliet works for Halliburton as the global NMR product champion. Ron joined Numar in 1991 and worked with oilfield NMR in several locations worldwide. Since 1997, he has held various positions with Halliburton in West Africa and the USA. Ron holds BS degrees in geology and geophysics from the University of Minnesota (1984). He is a member of the Society of Professional Well Log Analysts and the Society of Petroleum Engineers. Danny Miller works for Halliburton as a senior petrophysicist on the NMR team within the Formation Evaluation Technology group. His primary duties involve NMR data processing and interpretation development. Danny completed his BS degree in mechanical engineering from Michigan State University in 1981 and began his oil field career as a field engineer for Schlumberger. In 1985, he joined Sun Oil Co./Oryx Energy initially as a production logging engineer and later as a log analyst. In 1992, Danny joined Numar as a petrophysicist and transitioned to Halliburton when Numar was acquired in 1997. Shriram Sarvotham completed a B.Tech. degree in electrical engineering at the Indian Institute of Technology (Madras, India), and MS and PhD degrees in electrical engineering at (Rice University, Houston, Texas, USA). His research interests lie in the broad areas of NMR data acquisition and processing, compressed sensing, non-asymptotic information theory, and data traffic analysis and modeling. Since 2009, he has worked as a principal research scientist at Halliburton Energy Services, Houston, TX, where he investigates data acquisition and processing of wireline NMR logs. Dick Merkel works for Newfield Exploration Company as a petrophysicist; he works with teams that develop reservoir models for unconventional oil and gas reservoirs in the Rocky Mountains. Previously,

SPWLA 51st Annual Logging Symposium, June 19-23, 2010
16
Dick worked with EnCana Oil & Gas in Denver where he worked on developing petrophysical models for tight gas sandstone reservoirs. Before its closing in 2000, he worked as a senior technical consultant at the Marathon Oil Petroleum Technology Center in Littleton, where he worked on evaluating new logging
tools and technology and developing techniques for their application in Marathon’s reservoirs. Dick holds PhD and MS degrees in geophysics from Penn State. He is a past president of SPWLA, the SPWLA Foundation, and DWLS.