Embed Size (px)
Citation preview

JPMorgan Global Growth & Income plc(formerly JPMorgan Overseas Investment Trust plc)
Half Year Report & Accounts for the six months ended 31st December 2016
Objective
Capital growth from world stockmarkets.
Investment Policy
To provide a diversified portfolio of approximately 50-90 stocks
in which the investment manager has a high degree of
conviction.
As of 1st July 2016, the Company has adopted a new
distribution policy whereby at the start of each financial year
the Company will announce the distribution it intends to pay to
shareholders in the forthcoming year in quarterly instalments.
On aggregate, the intention is to pay dividends totalling at least
4% of the net asset value of the Company as at the end of the
preceding financial year.
Investment Strategy
To provide superior capital growth and outperform the MSCI All
Countries World Index over the long-term by investing in
companies based around the world. The manager is focused on
building a high conviction portfolio of typically 50-90 stocks,
drawing on an investment process underpinned by fundamental
research. Portfolio construction is driven by bottom-up stock
selection rather than geographical or sector allocation.
Currency exposure is predominantly hedged back towards the
benchmark. The Company uses borrowing to gear the portfolio
within a range of 5% cash to 20% geared under normal market
conditions.
Gearing
A flexible, low cost £25 million borrowing facility is in place and
available for the investment manager to utilise at times of low
absolute valuation or for short term borrowing to finance
investment decisions.
Benchmark
The Company’s benchmark is the MSCI All Countries World
Index in sterling terms (total return with net dividends
reinvested).
Company Name
The Company changed its name from JPMorgan Overseas
Investment Trust plc to JPMorgan Global Growth & Income plc
on 8th July 2016.
Capital Structure
At 30th June 2016, the company’s issued share capital
comprised 154,905,500 Ordinary shares of 5p each including
31,244,215 shares held in Treasury.
Share Repurchase and Issuance Policy
In order for the Company’s shares to trade at a relatively
narrow discount, the Company has a long-term policy of
repurchasing its shares with the aim of maintaining an average
discount of around 5% calculated with debt at par value. Any
shares repurchased under this policy may be held in Treasury
or cancelled. Shares held in Treasury and new shares will only
be reissued/issued at a premium to net asset value.
Management Company and Company Secretary
The Company employs JPMorgan Funds Limited (‘JPMF’ or the
‘Manager’), as the Company’s Alternative Investment Fund
Manager (‘AIFM’) and the Company Secretary. JPMF delegates
the management of the Company’s portfolio to JPMorgan Asset
Management (UK) Limited (‘JPMAM’).
FCA regulation of ‘non-mainstream pooled
investments’
The Company currently conducts its affairs so that the shares
issued by JPMorgan Global Growth & Income plc can be
recommended by Independent Financial Advisers to ordinary
retail investors in accordance with the FCA’s rules in relation to
non-mainstream investment products and intends to continue
to do so for the foreseeable future.
The shares are excluded from the FCA’s restrictions which apply
to non-mainstream investment products because they are
shares in an investment trust.
AIC
The Company is a member of the Association of Investment
Companies.
Website
The Company’s website, which can be found at
www.jpmglobalgrowthandincome.co.uk, includes useful
information on the Company, such as daily prices, factsheets
and current and historic half year and annual reports.
Features

1
Contents
HALF YEAR PERFORMANCE
ABOUT THE COMPANY
3 Chairman’s Statement
4 Investment Manager’s Report
INVESTMENT REVIEW
6 List of Investments
8 Portfolio Analyses
FINANCIAL STATEMENTS
10 Statement of Comprehensive Income
11 Statement of Changes in Equity
12 Statement of Financial Position
13 Notes to the Financial Statements
15 INTERIM MANAGEMENT REPORT
SHAREHOLDER INFORMATION
16 Glossary of Terms and Definitions
17 Where to buy J.P. Morgan Investment Trusts
21 Information about the Company
2 JPMORGAN GLOBAL GROWTH & INCOME PLC. (FORMERLY JPMORGAN OVERSEAS INVESTMENT TRUST PLC) HALF YEAR REPORT & ACCOUNTS 2016
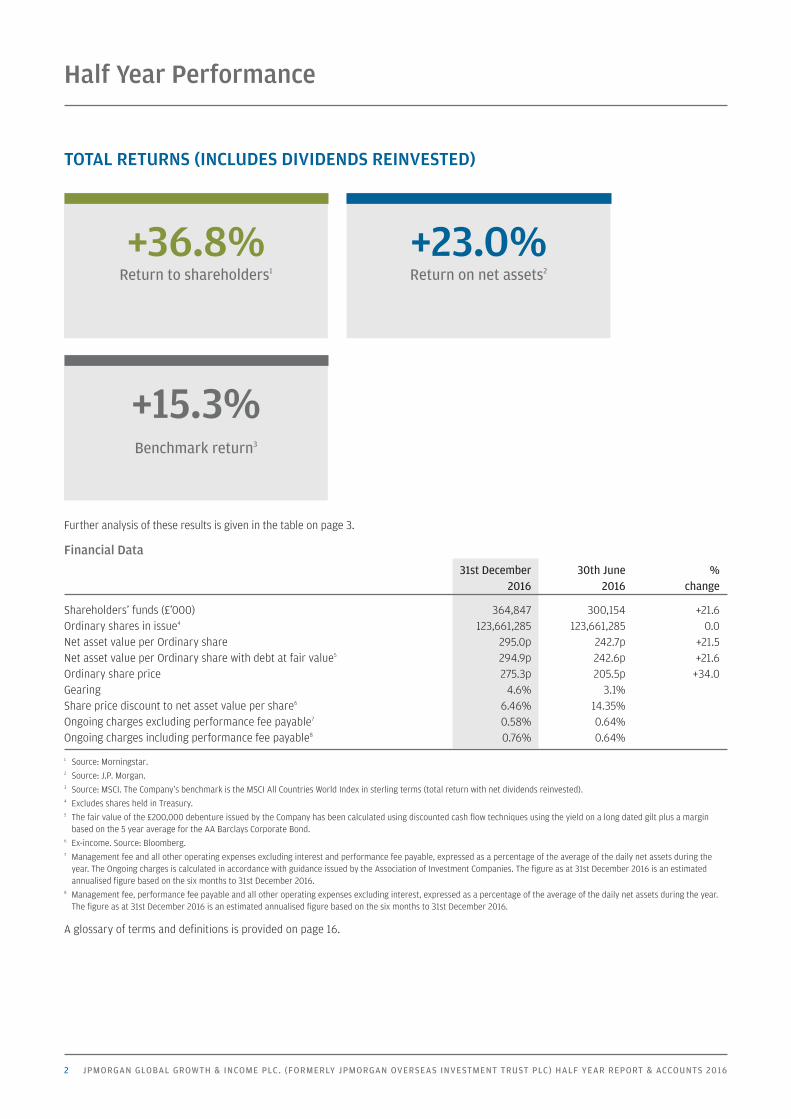
Half Year Performance
TOTAL RETURNS (INCLUDES DIVIDENDS REINVESTED)
+15.3%Benchmark return3
Further analysis of these results is given in the table on page 3.
Financial Data
31st December 30th June %
2016 2016 change
Shareholders’ funds (£’000) 364,847 300,154 +21.6
Ordinary shares in issue4 123,661,285 123,661,285 0.0
Net asset value per Ordinary share 295.0p 242.7p +21.5
Net asset value per Ordinary share with debt at fair value5 294.9p 242.6p +21.6
Ordinary share price 275.3p 205.5p +34.0
Gearing 4.6% 3.1%
Share price discount to net asset value per share6 6.46% 14.35%
Ongoing charges excluding performance fee payable7 0.58% 0.64%
Ongoing charges including performance fee payable8 0.76% 0.64%
1 Source: Morningstar.2 Source: J.P. Morgan.3 Source: MSCI. The Company’s benchmark is the MSCI All Countries World Index in sterling terms (total return with net dividends reinvested).4 Excludes shares held in Treasury.5 The fair value of the £200,000 debenture issued by the Company has been calculated using discounted cash flow techniques using the yield on a long dated gilt plus a margin
based on the 5 year average for the AA Barclays Corporate Bond.6 Ex-income. Source: Bloomberg.7 Management fee and all other operating expenses excluding interest and performance fee payable, expressed as a percentage of the average of the daily net assets during the
year. The Ongoing charges is calculated in accordance with guidance issued by the Association of Investment Companies. The figure as at 31st December 2016 is an estimated
annualised figure based on the six months to 31st December 2016.8 Management fee, performance fee payable and all other operating expenses excluding interest, expressed as a percentage of the average of the daily net assets during the year.
The figure as at 31st December 2016 is an estimated annualised figure based on the six months to 31st December 2016.
A glossary of terms and definitions is provided on page 16.
+36.8%Return to shareholders1
+23.0%Return on net assets2
3
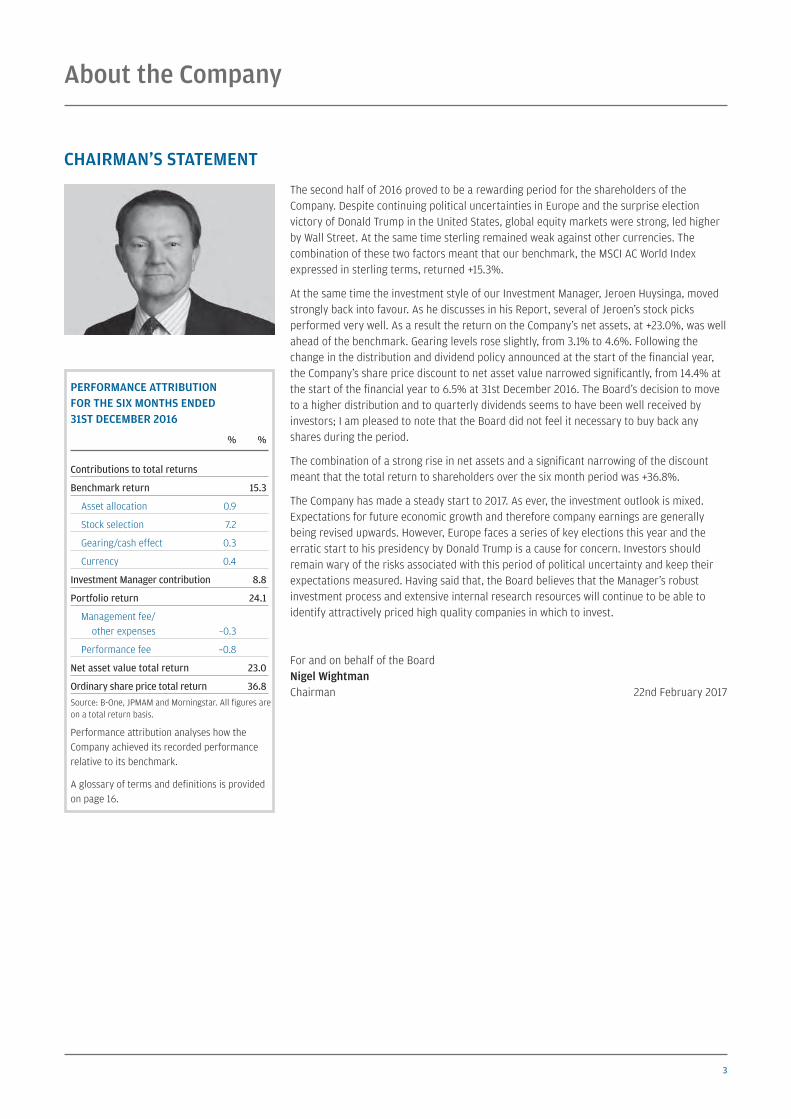
About the Company
CHAIRMAN’S STATEMENT
The second half of 2016 proved to be a rewarding period for the shareholders of the
Company. Despite continuing political uncertainties in Europe and the surprise election
victory of Donald Trump in the United States, global equity markets were strong, led higher
by Wall Street. At the same time sterling remained weak against other currencies. The
combination of these two factors meant that our benchmark, the MSCI AC World Index
expressed in sterling terms, returned +15.3%.
At the same time the investment style of our Investment Manager, Jeroen Huysinga, moved
strongly back into favour. As he discusses in his Report, several of Jeroen’s stock picks
performed very well. As a result the return on the Company’s net assets, at +23.0%, was well
ahead of the benchmark. Gearing levels rose slightly, from 3.1% to 4.6%. Following the
change in the distribution and dividend policy announced at the start of the financial year,
the Company’s share price discount to net asset value narrowed significantly, from 14.4% at
the start of the financial year to 6.5% at 31st December 2016. The Board’s decision to move
to a higher distribution and to quarterly dividends seems to have been well received by
investors; I am pleased to note that the Board did not feel it necessary to buy back any
shares during the period.
The combination of a strong rise in net assets and a significant narrowing of the discount
meant that the total return to shareholders over the six month period was +36.8%.
The Company has made a steady start to 2017. As ever, the investment outlook is mixed.
Expectations for future economic growth and therefore company earnings are generally
being revised upwards. However, Europe faces a series of key elections this year and the
erratic start to his presidency by Donald Trump is a cause for concern. Investors should
remain wary of the risks associated with this period of political uncertainty and keep their
expectations measured. Having said that, the Board believes that the Manager’s robust
investment process and extensive internal research resources will continue to be able to
identify attractively priced high quality companies in which to invest.
For and on behalf of the Board
Nigel Wightman
Chairman 22nd February 2017
PERFORMANCE ATTRIBUTION
FOR THE SIX MONTHS ENDED
31ST DECEMBER 2016
% %
Contributions to total returns
Benchmark return 15.3
Asset allocation 0.9
Stock selection 7.2
Gearing/cash effect 0.3
Currency 0.4
Investment Manager contribution 8.8
Portfolio return 24.1
Management fee/
other expenses –0.3
Performance fee –0.8
Net asset value total return 23.0
Ordinary share price total return 36.8
Source: B-One, JPMAM and Morningstar. All figures are
on a total return basis.
Performance attribution analyses how the
Company achieved its recorded performance
relative to its benchmark.
A glossary of terms and definitions is provided
on page 16.
4 JPMORGAN GLOBAL GROWTH & INCOME PLC. (FORMERLY JPMORGAN OVERSEAS INVESTMENT TRUST PLC) HALF YEAR REPORT & ACCOUNTS 2016
About the Company continued
INVESTMENT MANAGER’S REPORT
Market environment
The MSCI All Countries World index staged a strong recovery in the second half of 2016, up
15.3% in sterling terms. Equity markets rallied sharply from the lows reached at the end of
June after the surprise UK referendum result amid expectations that the Brexit vote would
not trigger a broader crisis. Positive economic data-points and a solid corporate earnings
season contributed to a noted improvement in investor sentiment. This was expressed in
a rotation away from the more defensive ‘bond proxy’ areas of the market into more
economically sensitive, cyclical areas, which had lagged considerably earlier in the year.
Investor sentiment and equity markets received a further boost following the election of
Republican candidate, Donald Trump, as US president and news that the Republicans had won
majorities in both the House of Representatives and the Senate. The rotation into
more cyclical areas of the equity market continued amid anticipation that Trump’s stated
pro-growth policies (less regulation, tax reform and higher fiscal spending) would significantly
boost economic growth and inflation prospects in the US. Banks, technology – semi
conductors and autos were some of the strongest performing sectors, while consumer non
durables, utilities and healthcare all lagged. Bond yields rallied, with the US 10 year Treasury
yield moving above 2%, as investors started to focus on the prospect of a world with stronger
economic growth and inflation. Towards the end of the period, the US Federal Reserve (Fed)
increased interest rates, which, while widely anticipated, ignited speculation around further
rate increases to come.
Portfolio Review
During the six months to December 2016 your Company significantly outperformed the
benchmark, following challenging performance over the previous year.
In my previous comments regarding the disappointing performance we delivered for the
financial year ended June 2016, I wrote: ‘Quantitative easing and other manifestations of
unconventional monetary policy have driven the relative valuation of bond equivalents to
stratospheric levels. Our core belief is that low and negative interest rates are unlikely to
be a permanent condition and our strategy continues to be positioned accordingly.’
During this unprecedented environment, we remained committed to our investment process
and added to positions in many of the companies which had reached extreme valuations,
while avoiding many of the (increasingly) expensive ‘bond proxy’ names. As investor
sentiment started to reverse and shift towards company fundamentals once again, the
second half of 2016 became a very constructive backdrop for our stock-picking process.
Examples of companies which contributed to performance include: Outokumpu, Morgan
Stanley and Suzuki Motor. Shares in Outokumpu, a global stainless steel producer listed in
Finland, rallied more than 100%. The company is finally seeing all of its divisions report
positive earnings, much of which is attributable to earlier restructuring and the actions of
an impressive new management team. Amid a backdrop of improving industry dynamics,
Outokumpu remains a key portfolio holding given the company’s dedication to cutting costs
and managing production and the potential for strong long-term earnings growth.
Shares in Morgan Stanley rallied to levels not seen since 2008, as the company reported
a surge in fixed income trading revenues and has continued to reduce costs. Though it still
has a way to go, the results show that the company is on track to creating higher sustainable
5
returns. The stock features a decent dividend (~2%) and net buyback yield (~4%) remains
strong.
Suzuki, the Japan-listed auto manufacturer, has benefited from continued strength in the
company’s Indian operations where demand for vehicles remains high. Through its 56%
stake in Maruti, Suzuki controls nearly half the auto market in India, which now rivals China
in terms of economic growth.
Portfolio positioning and outlook
The political surprises last year in the US and Europe have given governments a clear
mandate to reflate their economies. Investors are now expecting significant fiscal stimulus
and a continued move away from the reliance on monetary policy to reinvigorate economic
growth and inflation. Renewed fiscal stimulus should benefit equity markets globally, with
a direct effect on some cyclical sectors. The current backdrop has provided a powerful
catalyst for investors to refocus on the historically high levels of dispersion in company
valuations across sectors and regions globally. While we have started to see a rotation within
equity markets, there still remains a dislocation in valuations across a number of sectors, with
the difference between undervalued and overpriced stocks still wide by historical standards.
This positive backdrop is not without its risks, however. Political uncertainty is set to
continue in 2017, with a number of important elections in Europe, the start of Brexit
negotiations and uncertainty over the impact of Trump’s policies on US economic and
foreign policy. Investors will be following events closely and, we believe that, selectivity
will remain key. Our focus remains, as ever, on underlying company fundamentals and our
dedicated team of highly experienced research analysts continue to identify attractive
investment opportunities around the world.
Jeroen Huysinga
Investment Manager 22nd February 2017
6 JPMORGAN GLOBAL GROWTH & INCOME PLC. (FORMERLY JPMORGAN OVERSEAS INVESTMENT TRUST PLC) HALF YEAR REPORT & ACCOUNTS 2016
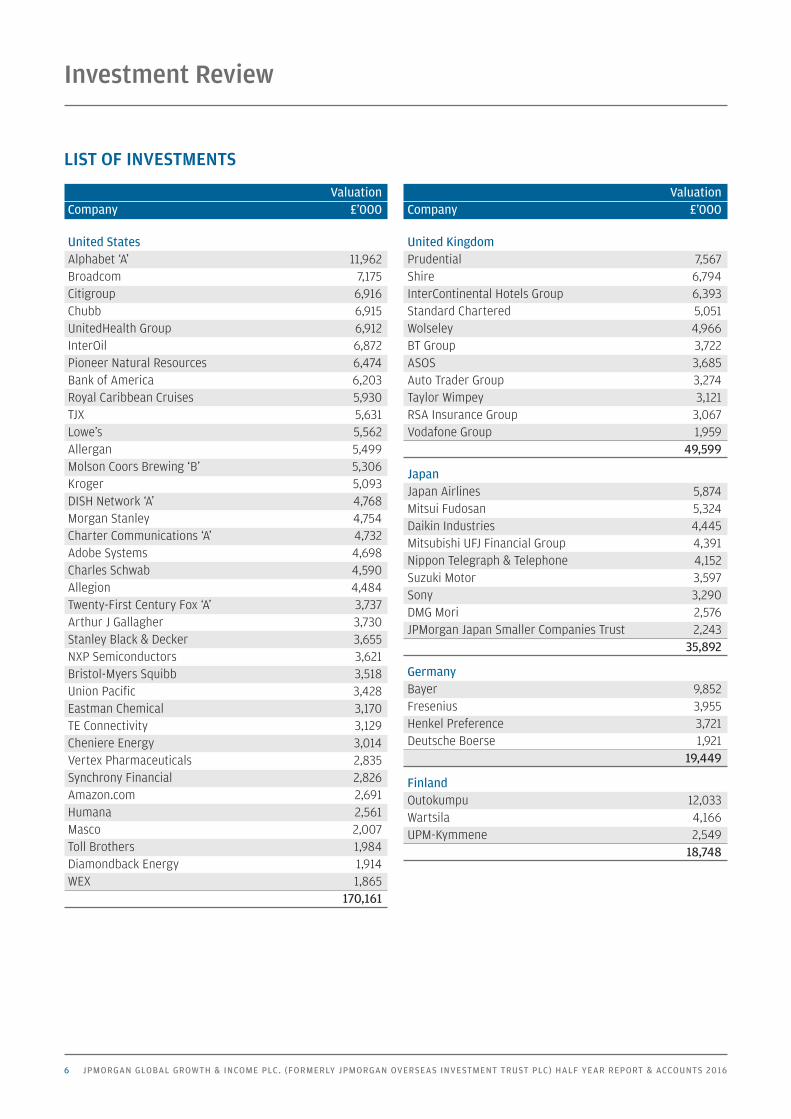
LIST OF INVESTMENTS
Valuation
Company £’000
United States
Alphabet ‘A’ 11,962
Broadcom 7,175
Citigroup 6,916
Chubb 6,915
UnitedHealth Group 6,912
InterOil 6,872
Pioneer Natural Resources 6,474
Bank of America 6,203
Royal Caribbean Cruises 5,930
TJX 5,631
Lowe’s 5,562
Allergan 5,499
Molson Coors Brewing ‘B’ 5,306
Kroger 5,093
DISH Network ‘A’ 4,768
Morgan Stanley 4,754
Charter Communications ‘A’ 4,732
Adobe Systems 4,698
Charles Schwab 4,590
Allegion 4,484
Twenty-First Century Fox ‘A’ 3,737
Arthur J Gallagher 3,730
Stanley Black & Decker 3,655
NXP Semiconductors 3,621
Bristol-Myers Squibb 3,518
Union Pacific 3,428
Eastman Chemical 3,170
TE Connectivity 3,129
Cheniere Energy 3,014
Vertex Pharmaceuticals 2,835
Synchrony Financial 2,826
Amazon.com 2,691
Humana 2,561
Masco 2,007
Toll Brothers 1,984
Diamondback Energy 1,914
WEX 1,865
170,161
Valuation
Company £’000
United Kingdom
Prudential 7,567
Shire 6,794
InterContinental Hotels Group 6,393
Standard Chartered 5,051
Wolseley 4,966
BT Group 3,722
ASOS 3,685
Auto Trader Group 3,274
Taylor Wimpey 3,121
RSA Insurance Group 3,067
Vodafone Group 1,959
49,599
Japan
Japan Airlines 5,874
Mitsui Fudosan 5,324
Daikin Industries 4,445
Mitsubishi UFJ Financial Group 4,391
Nippon Telegraph & Telephone 4,152
Suzuki Motor 3,597
Sony 3,290
DMG Mori 2,576
JPMorgan Japan Smaller Companies Trust 2,243
35,892
Germany
Bayer 9,852
Fresenius 3,955
Henkel Preference 3,721
Deutsche Boerse 1,921
19,449
Finland
Outokumpu 12,033
Wartsila 4,166
UPM-Kymmene 2,549
18,748
Investment Review
7
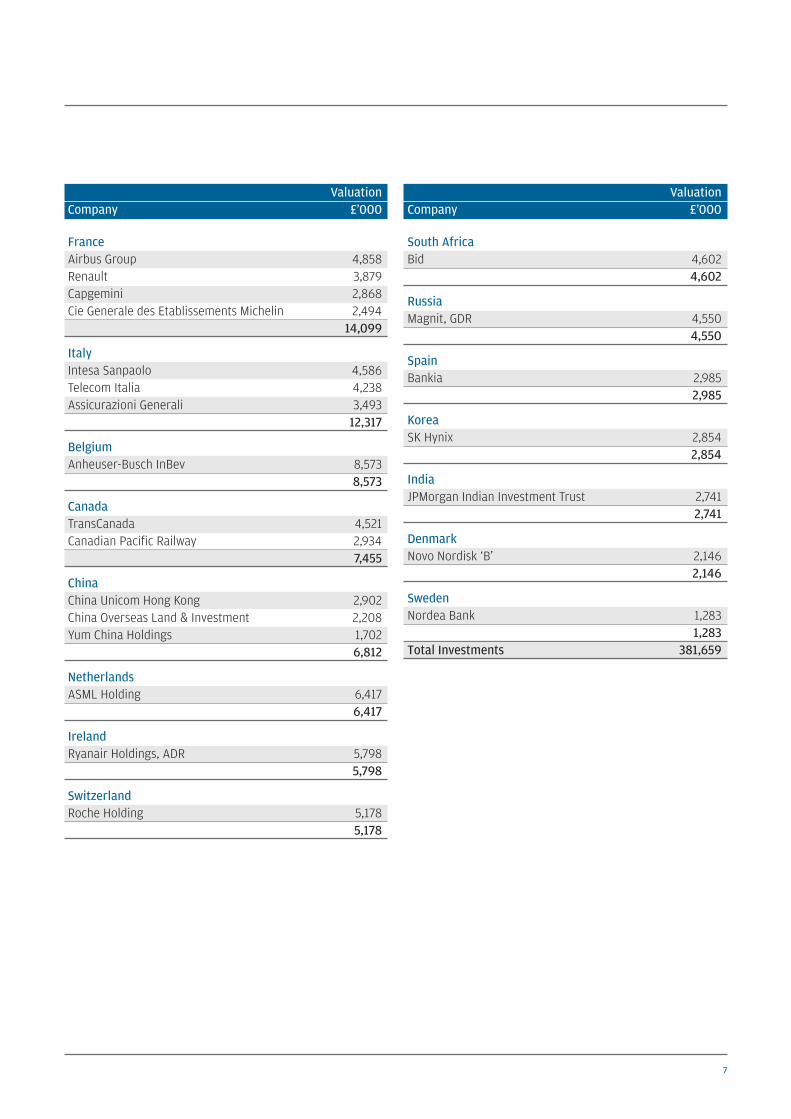
Valuation
Company £’000
France
Airbus Group 4,858
Renault 3,879
Capgemini 2,868
Cie Generale des Etablissements Michelin 2,494
14,099
Italy
Intesa Sanpaolo 4,586
Telecom Italia 4,238
Assicurazioni Generali 3,493
12,317
Belgium
Anheuser-Busch InBev 8,573
8,573
Canada
TransCanada 4,521
Canadian Pacific Railway 2,934
7,455
China
China Unicom Hong Kong 2,902
China Overseas Land & Investment 2,208
Yum China Holdings 1,702
6,812
Netherlands
ASML Holding 6,417
6,417
Ireland
Ryanair Holdings, ADR 5,798
5,798
Switzerland
Roche Holding 5,178
5,178
Valuation
Company £’000
South Africa
Bid 4,602
4,602
Russia
Magnit, GDR 4,550
4,550
Spain
Bankia 2,985
2,985
Korea
SK Hynix 2,854
2,854
India
JPMorgan Indian Investment Trust 2,741
2,741
Denmark
Novo Nordisk ‘B’ 2,146
2,146
Sweden
Nordea Bank 1,283
1,283
Total Investments 381,659
8 JPMORGAN GLOBAL GROWTH & INCOME PLC. (FORMERLY JPMORGAN OVERSEAS INVESTMENT TRUST PLC) HALF YEAR REPORT & ACCOUNTS 2016
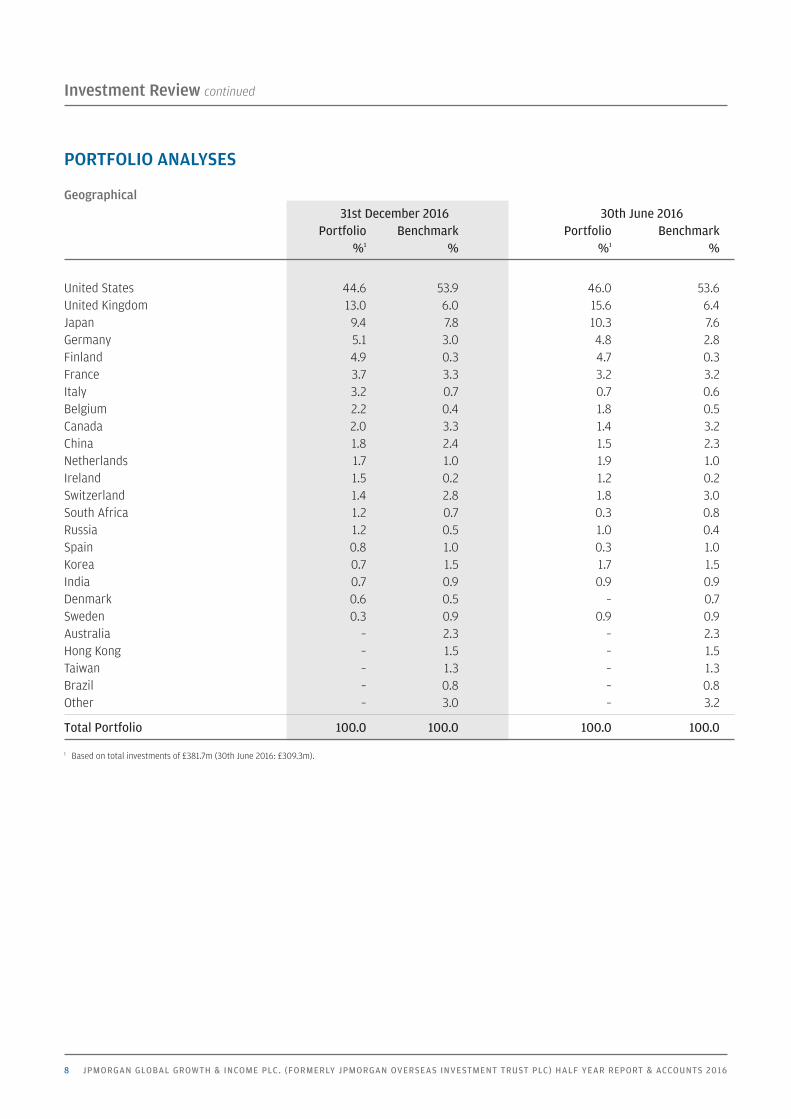
PORTFOLIO ANALYSES
Geographical
31st December 2016 30th June 2016
Portfolio Benchmark Portfolio Benchmark
%1 % %1 %
United States 44.6 53.9 46.0 53.6
United Kingdom 13.0 6.0 15.6 6.4
Japan 9.4 7.8 10.3 7.6
Germany 5.1 3.0 4.8 2.8
Finland 4.9 0.3 4.7 0.3
France 3.7 3.3 3.2 3.2
Italy 3.2 0.7 0.7 0.6
Belgium 2.2 0.4 1.8 0.5
Canada 2.0 3.3 1.4 3.2
China 1.8 2.4 1.5 2.3
Netherlands 1.7 1.0 1.9 1.0
Ireland 1.5 0.2 1.2 0.2
Switzerland 1.4 2.8 1.8 3.0
South Africa 1.2 0.7 0.3 0.8
Russia 1.2 0.5 1.0 0.4
Spain 0.8 1.0 0.3 1.0
Korea 0.7 1.5 1.7 1.5
India 0.7 0.9 0.9 0.9
Denmark 0.6 0.5 – 0.7
Sweden 0.3 0.9 0.9 0.9
Australia – 2.3 – 2.3
Hong Kong – 1.5 – 1.5
Taiwan – 1.3 – 1.3
Brazil – 0.8 – 0.8
Other – 3.0 – 3.2
Total Portfolio 100.0 100.0 100.0 100.0
1 Based on total investments of £381.7m (30th June 2016: £309.3m).
Investment Review continued
9
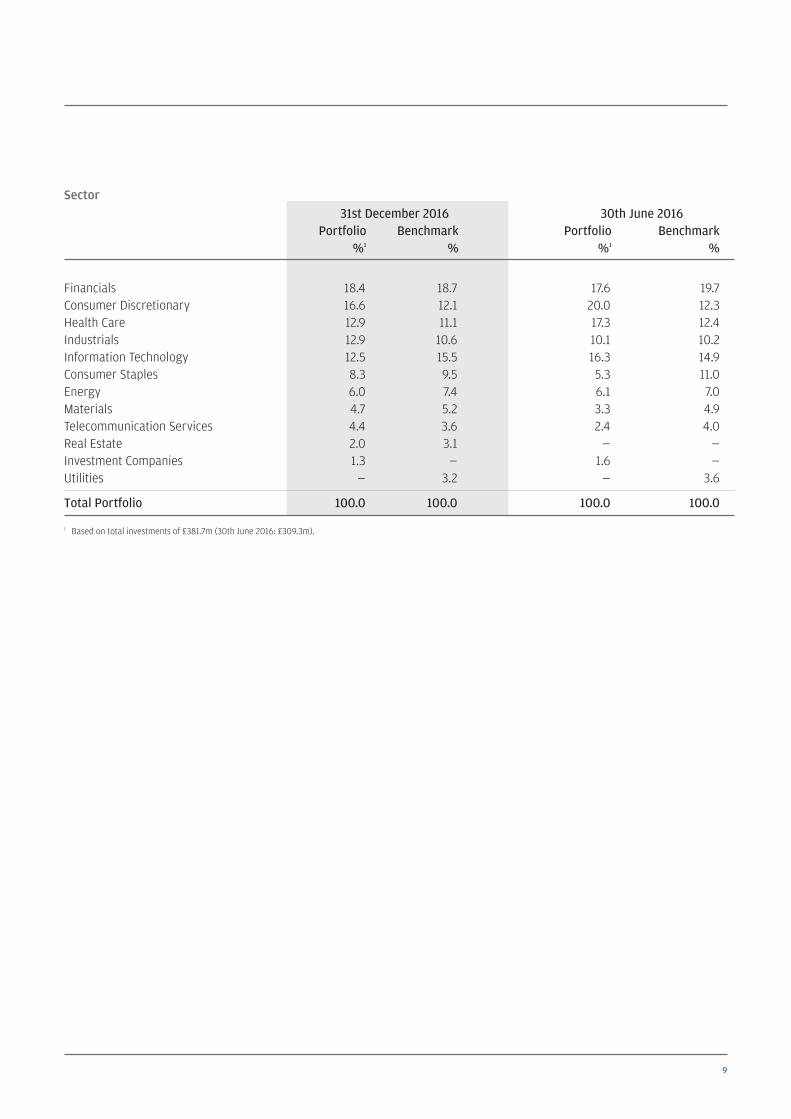
Sector
31st December 2016 30th June 2016
Portfolio Benchmark Portfolio Benchmark
%1 % %1 %
Financials 18.4 18.7 17.6 19.7
Consumer Discretionary 16.6 12.1 20.0 12.3
Health Care 12.9 11.1 17.3 12.4
Industrials 12.9 10.6 10.1 10.2
Information Technology 12.5 15.5 16.3 14.9
Consumer Staples 8.3 9.5 5.3 11.0
Energy 6.0 7.4 6.1 7.0
Materials 4.7 5.2 3.3 4.9
Telecommunication Services 4.4 3.6 2.4 4.0
Real Estate 2.0 3.1 — —
Investment Companies 1.3 — 1.6 —
Utilities — 3.2 — 3.6
Total Portfolio 100.0 100.0 100.0 100.0
1 Based on total investments of £381.7m (30th June 2016: £309.3m).
10 JPMORGAN GLOBAL GROWTH & INCOME PLC. (FORMERLY JPMORGAN OVERSEAS INVESTMENT TRUST PLC) HALF YEAR REPORT & ACCOUNTS 2016
Financial Statements
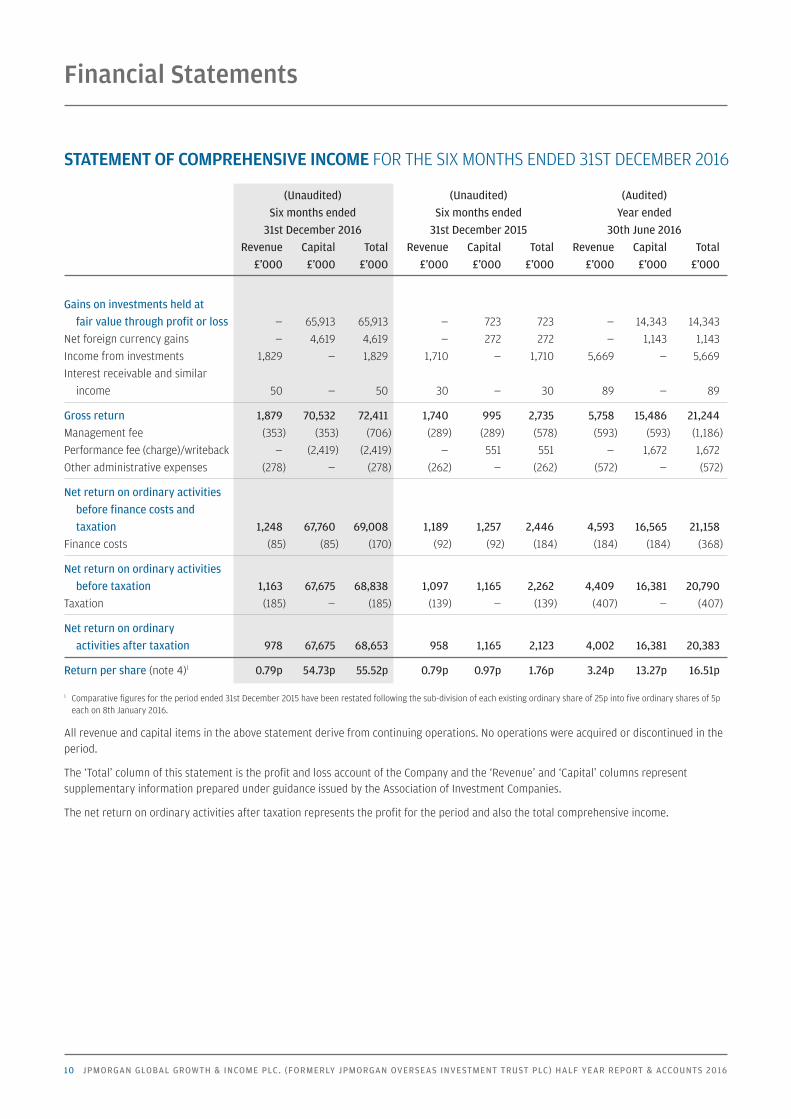
STATEMENT OF COMPREHENSIVE INCOME FOR THE SIX MONTHS ENDED 31ST DECEMBER 2016
(Unaudited) (Unaudited) (Audited)
Six months ended Six months ended Year ended
31st December 2016 31st December 2015 30th June 2016
Revenue Capital Total Revenue Capital Total Revenue Capital Total
£’000 £’000 £’000 £’000 £’000 £’000 £’000 £’000 £’000
Gains on investments held at
fair value through profit or loss — 65,913 65,913 — 723 723 — 14,343 14,343
Net foreign currency gains — 4,619 4,619 — 272 272 — 1,143 1,143
Income from investments 1,829 — 1,829 1,710 — 1,710 5,669 — 5,669
Interest receivable and similar
income 50 — 50 30 — 30 89 — 89
Gross return 1,879 70,532 72,411 1,740 995 2,735 5,758 15,486 21,244
Management fee (353) (353) (706) (289) (289) (578) (593) (593) (1,186)
Performance fee (charge)/writeback — (2,419) (2,419) — 551 551 — 1,672 1,672
Other administrative expenses (278) — (278) (262) — (262) (572) — (572)
Net return on ordinary activities
before finance costs and
taxation 1,248 67,760 69,008 1,189 1,257 2,446 4,593 16,565 21,158
Finance costs (85) (85) (170) (92) (92) (184) (184) (184) (368)
Net return on ordinary activities
before taxation 1,163 67,675 68,838 1,097 1,165 2,262 4,409 16,381 20,790
Taxation (185) — (185) (139) — (139) (407) — (407)
Net return on ordinary
activities after taxation 978 67,675 68,653 958 1,165 2,123 4,002 16,381 20,383
Return per share (note 4)1 0.79p 54.73p 55.52p 0.79p 0.97p 1.76p 3.24p 13.27p 16.51p
1 Comparative figures for the period ended 31st December 2015 have been restated following the sub-division of each existing ordinary share of 25p into five ordinary shares of 5p
each on 8th January 2016.
All revenue and capital items in the above statement derive from continuing operations. No operations were acquired or discontinued in the
period.
The ‘Total’ column of this statement is the profit and loss account of the Company and the ‘Revenue’ and ‘Capital’ columns represent
supplementary information prepared under guidance issued by the Association of Investment Companies.
The net return on ordinary activities after taxation represents the profit for the period and also the total comprehensive income.
11
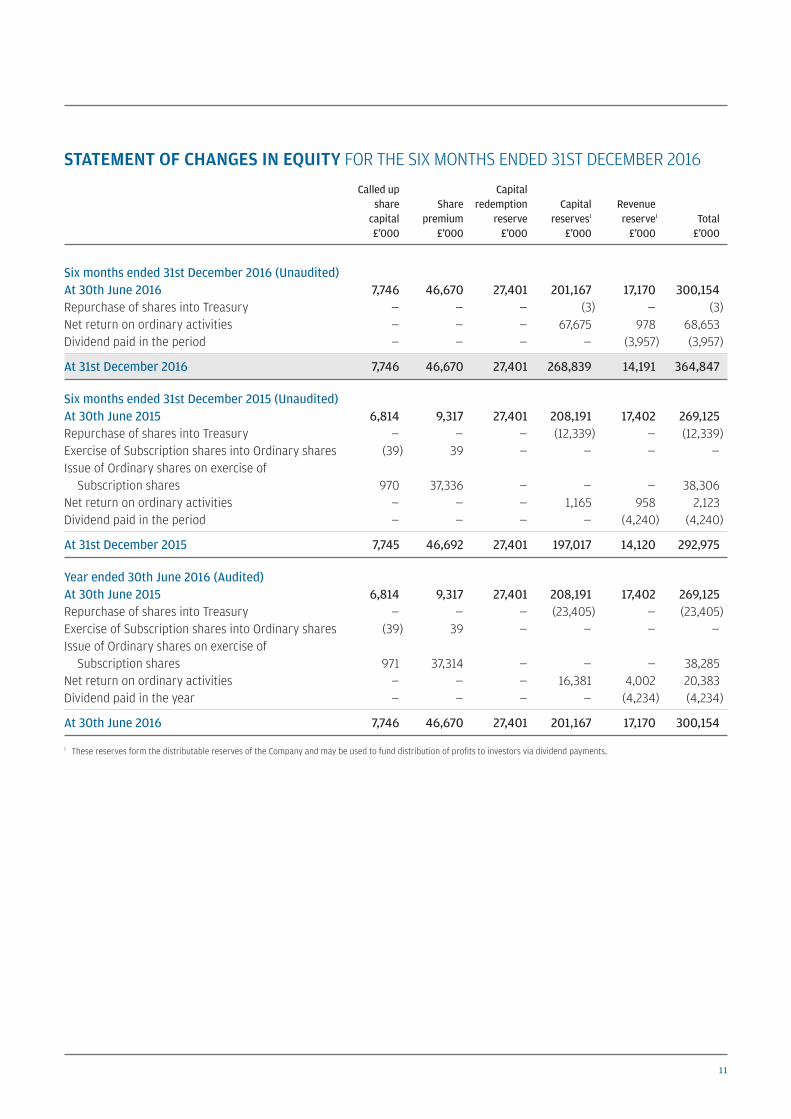
STATEMENT OF CHANGES IN EQUITY FOR THE SIX MONTHS ENDED 31ST DECEMBER 2016
Called up Capital
share Share redemption Capital Revenue
capital premium reserve reserves1 reserve1 Total
£’000 £’000 £’000 £’000 £’000 £’000
Six months ended 31st December 2016 (Unaudited)
At 30th June 2016 7,746 46,670 27,401 201,167 17,170 300,154
Repurchase of shares into Treasury — — — (3) — (3)
Net return on ordinary activities — — — 67,675 978 68,653
Dividend paid in the period — — — — (3,957) (3,957)
At 31st December 2016 7,746 46,670 27,401 268,839 14,191 364,847
Six months ended 31st December 2015 (Unaudited)
At 30th June 2015 6,814 9,317 27,401 208,191 17,402 269,125
Repurchase of shares into Treasury — — — (12,339) — (12,339)
Exercise of Subscription shares into Ordinary shares (39) 39 — — — —
Issue of Ordinary shares on exercise of
Subscription shares 970 37,336 — — — 38,306
Net return on ordinary activities — — — 1,165 958 2,123
Dividend paid in the period — — — — (4,240) (4,240)
At 31st December 2015 7,745 46,692 27,401 197,017 14,120 292,975
Year ended 30th June 2016 (Audited)
At 30th June 2015 6,814 9,317 27,401 208,191 17,402 269,125
Repurchase of shares into Treasury — — — (23,405) — (23,405)
Exercise of Subscription shares into Ordinary shares (39) 39 — — — —
Issue of Ordinary shares on exercise of
Subscription shares 971 37,314 — — — 38,285
Net return on ordinary activities — — — 16,381 4,002 20,383
Dividend paid in the year — — — — (4,234) (4,234)
At 30th June 2016 7,746 46,670 27,401 201,167 17,170 300,154
1 These reserves form the distributable reserves of the Company and may be used to fund distribution of profits to investors via dividend payments.
12 JPMORGAN GLOBAL GROWTH & INCOME PLC. (FORMERLY JPMORGAN OVERSEAS INVESTMENT TRUST PLC) HALF YEAR REPORT & ACCOUNTS 2016
Financial Statements continued
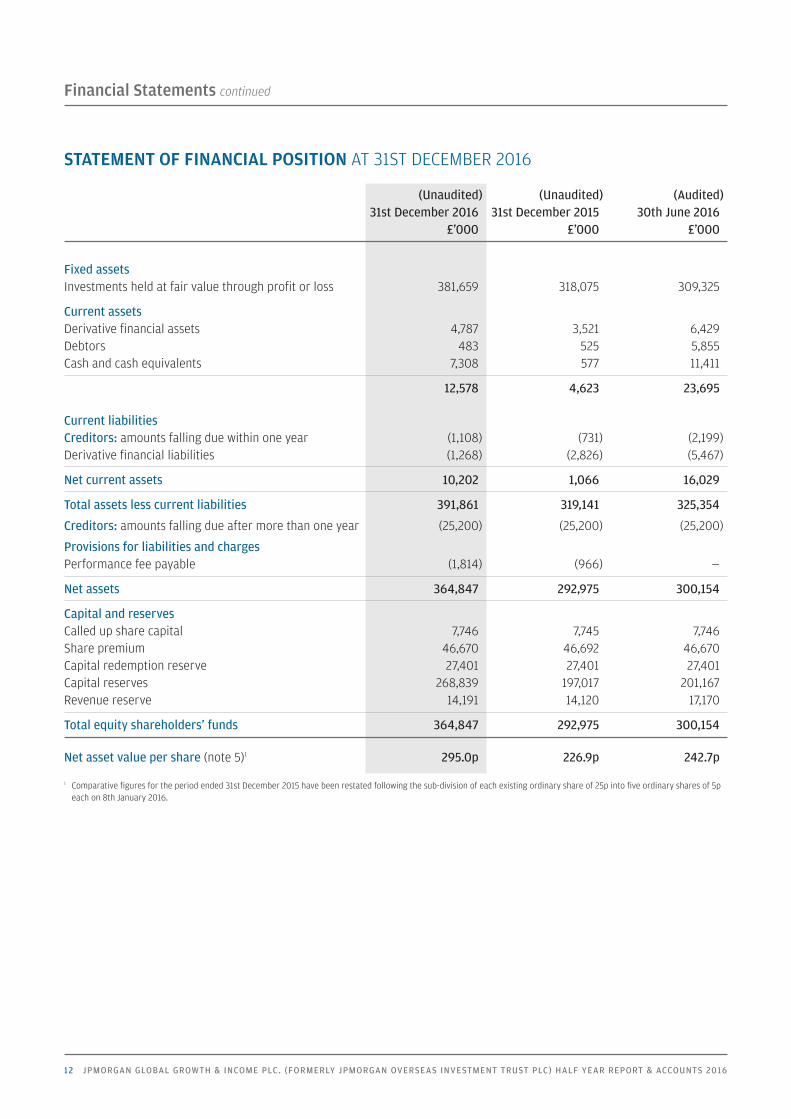
STATEMENT OF FINANCIAL POSITION AT 31ST DECEMBER 2016
(Unaudited) (Unaudited) (Audited)
31st December 2016 31st December 2015 30th June 2016
£’000 £’000 £’000
Fixed assets
Investments held at fair value through profit or loss 381,659 318,075 309,325
Current assets
Derivative financial assets 4,787 3,521 6,429
Debtors 483 525 5,855
Cash and cash equivalents 7,308 577 11,411
12,578 4,623 23,695
Current liabilities
Creditors: amounts falling due within one year (1,108) (731) (2,199)
Derivative financial liabilities (1,268) (2,826) (5,467)
Net current assets 10,202 1,066 16,029
Total assets less current liabilities 391,861 319,141 325,354
Creditors: amounts falling due after more than one year (25,200) (25,200) (25,200)
Provisions for liabilities and charges
Performance fee payable (1,814) (966) —
Net assets 364,847 292,975 300,154
Capital and reserves
Called up share capital 7,746 7,745 7,746
Share premium 46,670 46,692 46,670
Capital redemption reserve 27,401 27,401 27,401
Capital reserves 268,839 197,017 201,167
Revenue reserve 14,191 14,120 17,170
Total equity shareholders’ funds 364,847 292,975 300,154
Net asset value per share (note 5)1 295.0p 226.9p 242.7p
1 Comparative figures for the period ended 31st December 2015 have been restated following the sub-division of each existing ordinary share of 25p into five ordinary shares of 5p
each on 8th January 2016.
13
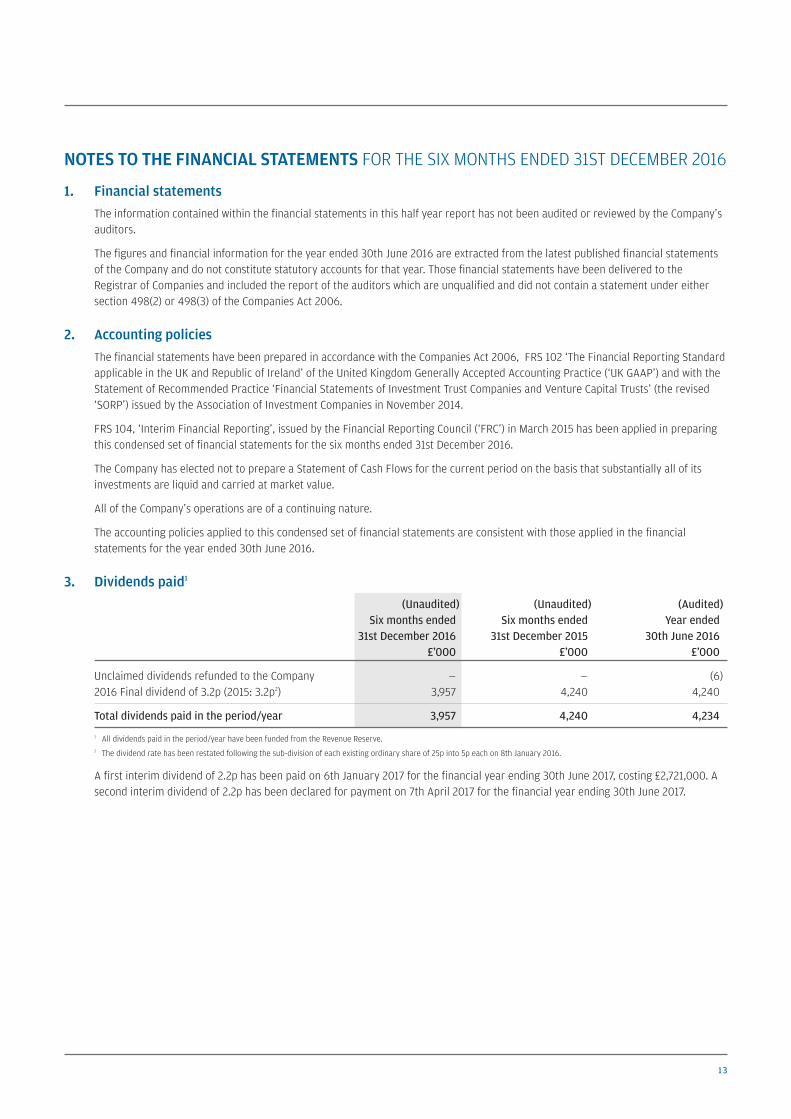
1. Financial statements
The information contained within the financial statements in this half year report has not been audited or reviewed by the Company’s
auditors.
The figures and financial information for the year ended 30th June 2016 are extracted from the latest published financial statements
of the Company and do not constitute statutory accounts for that year. Those financial statements have been delivered to the
Registrar of Companies and included the report of the auditors which are unqualified and did not contain a statement under either
section 498(2) or 498(3) of the Companies Act 2006.
2. Accounting policies
The financial statements have been prepared in accordance with the Companies Act 2006, FRS 102 ‘The Financial Reporting Standard
applicable in the UK and Republic of Ireland’ of the United Kingdom Generally Accepted Accounting Practice (‘UK GAAP’) and with the
Statement of Recommended Practice ‘Financial Statements of Investment Trust Companies and Venture Capital Trusts’ (the revised
‘SORP’) issued by the Association of Investment Companies in November 2014.
FRS 104, ‘Interim Financial Reporting’, issued by the Financial Reporting Council (‘FRC’) in March 2015 has been applied in preparing
this condensed set of financial statements for the six months ended 31st December 2016.
The Company has elected not to prepare a Statement of Cash Flows for the current period on the basis that substantially all of its
investments are liquid and carried at market value.
All of the Company’s operations are of a continuing nature.
The accounting policies applied to this condensed set of financial statements are consistent with those applied in the financial
statements for the year ended 30th June 2016.
3. Dividends paid1
(Unaudited) (Unaudited) (Audited)
Six months ended Six months ended Year ended
31st December 2016 31st December 2015 30th June 2016
£’000 £’000 £’000
Unclaimed dividends refunded to the Company — — (6)
2016 Final dividend of 3.2p (2015: 3.2p2) 3,957 4,240 4,240
Total dividends paid in the period/year 3,957 4,240 4,234
1 All dividends paid in the period/year have been funded from the Revenue Reserve.
2 The dividend rate has been restated following the sub-division of each existing ordinary share of 25p into 5p each on 8th January 2016.
A first interim dividend of 2.2p has been paid on 6th January 2017 for the financial year ending 30th June 2017, costing £2,721,000. A
second interim dividend of 2.2p has been declared for payment on 7th April 2017 for the financial year ending 30th June 2017.
NOTES TO THE FINANCIAL STATEMENTS FOR THE SIX MONTHS ENDED 31ST DECEMBER 2016
14 JPMORGAN GLOBAL GROWTH & INCOME PLC. (FORMERLY JPMORGAN OVERSEAS INVESTMENT TRUST PLC) HALF YEAR REPORT & ACCOUNTS 2016
Financial Statements continued
NOTES TO THE FINANCIAL STATEMENTS CONTINUED
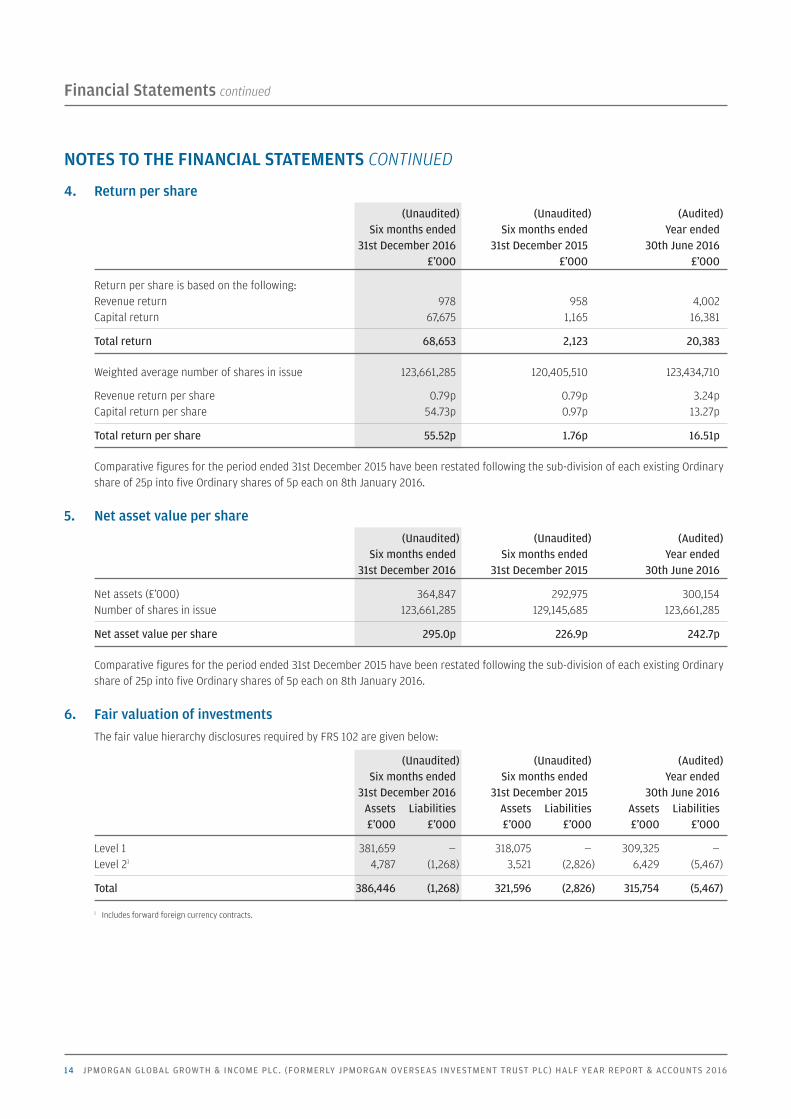
4. Return per share
(Unaudited) (Unaudited) (Audited)
Six months ended Six months ended Year ended
31st December 2016 31st December 2015 30th June 2016
£’000 £’000 £’000
Return per share is based on the following:
Revenue return 978 958 4,002
Capital return 67,675 1,165 16,381
Total return 68,653 2,123 20,383
Weighted average number of shares in issue 123,661,285 120,405,510 123,434,710
Revenue return per share 0.79p 0.79p 3.24p
Capital return per share 54.73p 0.97p 13.27p
Total return per share 55.52p 1.76p 16.51p
Comparative figures for the period ended 31st December 2015 have been restated following the sub-division of each existing Ordinary
share of 25p into five Ordinary shares of 5p each on 8th January 2016.
5. Net asset value per share
(Unaudited) (Unaudited) (Audited)
Six months ended Six months ended Year ended
31st December 2016 31st December 2015 30th June 2016
Net assets (£’000) 364,847 292,975 300,154
Number of shares in issue 123,661,285 129,145,685 123,661,285
Net asset value per share 295.0p 226.9p 242.7p
Comparative figures for the period ended 31st December 2015 have been restated following the sub-division of each existing Ordinary
share of 25p into five Ordinary shares of 5p each on 8th January 2016.
6. Fair valuation of investments
The fair value hierarchy disclosures required by FRS 102 are given below:
(Unaudited) (Unaudited) (Audited)
Six months ended Six months ended Year ended
31st December 2016 31st December 2015 30th June 2016
Assets Liabilities Assets Liabilities Assets Liabilities
£’000 £’000 £’000 £’000 £’000 £’000
Level 1 381,659 — 318,075 — 309,325 —
Level 21 4,787 (1,268) 3,521 (2,826) 6,429 (5,467)
Total 386,446 (1,268) 321,596 (2,826) 315,754 (5,467)
1 Includes forward foreign currency contracts.
15
Interim Management Report
The Company is required to make the following disclosures in its
half year report:
Principal Risks and Uncertainties
The principal risks and uncertainties faced by the Company have not
changed and fall into the following broad categories: investment
and strategy; market; accounting, legal and regulatory; corporate
governance and shareholder relations; operational; going concern;
and financial. Information on each of these areas is given in the
Business Review within the Annual Report and Accounts for the year
ended 30th June 2016.
Related Parties Transactions
During the first six months of the current financial year, no
transactions with related parties have taken place which have
materially affected the financial position or the performance of the
Company.
Going Concern
The Directors believe, having considered the Company’s investment
objectives, risk management policies, capital management policies
and procedures, nature of the portfolio and expenditure projections,
that the Company has adequate resources, an appropriate financial
structure and suitable management arrangements in place to
continue in operational existence for the foreseeable future and,
more specifically, that there are no material uncertainties
pertaining to the Company that would prevent its ability to continue
in such operation existence for at least twelve months from the date
of the approval of this half yearly financial report. For these
reasons, they consider there is reasonable evidence to continue to
adopt the going concern basis in preparing the accounts.
Directors’ Responsibilities
The Board of Directors confirms that, to the best of its knowledge:
(i) the condensed set of financial statements contained within the
half yearly financial report has been prepared in accordance
with FRS 104 ‘Interim Financial Reporting’ gives a true and fair
view of the state of affairs of the Company and of the assets,
liabilities, financial position and net return of the Company, as
at 31st December 2016, as required by the UK Listing Authority
Disclosure and Transparency Rules 4.2.4R; and
(ii) the interim management report includes a fair review of the
information required by 4.2.7R and 4.2.8R of the UK Listing
Authority Disclosure and Transparency Rules.
In order to provide these confirmations, and in preparing these
financial statements, the Directors are required to:
• select suitable accounting policies and then apply them
consistently;
• make judgements and accounting estimates that are
reasonable and prudent;
• state whether applicable UK Accounting Standards have been
followed, subject to any material departures disclosed and
explained in the financial statements; and
• prepare the financial statements on the going concern basis
unless it is inappropriate to presume that the Company will
continue in business;
and the Directors confirm that they have done so.
For and on behalf of the Board
Nigel Wightman
Chairman 22nd February 2017
16 JPMORGAN GLOBAL GROWTH & INCOME PLC. (FORMERLY JPMORGAN OVERSEAS INVESTMENT TRUST PLC) HALF YEAR REPORT & ACCOUNTS 2016
Shareholder Information
GLOSSARY OF TERMS AND DEFINITIONS
Return to shareholders
Total return to the Ordinary shareholders, on a last traded price to
last traded price basis, assuming that all dividends received were
reinvested, without transaction costs, in the Ordinary shares of the
Company at the time the shares were quoted ex-dividend.
Return on net assets
Total return on net asset value (‘NAV’) per share, on a bid value to
bid value basis, assuming that all dividends paid out by the
Company were reinvested in the shares of the Company at the NAV
per share at the time the shares were quoted ex-dividend.
In accordance with industry practice, dividends payable which have
been declared but which are unpaid at the balance sheet date are
deducted from the NAV per share when calculating the return on
net assets.
Benchmark return
Total return on the benchmark, on a closing-market value to
closing-market value basis, assuming that all dividends received
were reinvested in the shares of the underlying companies at the
time the shares were quoted ex-dividend.
The benchmark is a recognised index of stocks which should not be
taken as wholly representative of the Company’s investment
universe. The Company’s investment strategy does not follow or
‘track’ this index and consequently, there may be some divergence
between the Company’s performance and that of the benchmark.
Gearing/Net cash
Gearing represents the excess amount above shareholders’ funds of
total investments, expressed as a percentage of the shareholders’
funds. If the amount calculated is negative, this is shown as a ‘net
cash’ position.
Ongoing charges
The ongoing charges represent the Company’s management fee and
all other operating expenses, excluding finance costs, expressed as
a percentage of the average daily net assets during the year. The
figure at 31st December 2016 is an estimated annualised figure.
Share price discount/premium to net asset value
(‘NAV’)
If the share price of an investment trust is lower than the NAV per
share, the shares are is said to be trading at a discount. The
discount is shown as a percentage of the NAV. The opposite of a
discount is a premium. It is more common for an investment trust’s
shares to trade at a discount than at a premium.
Performance attribution
Analysis of how the Company achieved its recorded performance
relative to its benchmark.
Performance Attribution Definitions:
Asset allocation
Measures the impact of allocating assets differently from those in
the benchmark, via the portfolio’s weighting in different
countries, sectors or asset types.
Stock selection
Measures the effect of investing in securities to a greater or
lesser extent than their weighting in the benchmark, or of
investing in securities which are not included in the benchmark.
Gearing/Cash effect
Measures the impact on returns of borrowings or cash balances
on the Company’s relative performance.
Currency
Measures the impact of investing in different currencies on the
performance which is measured in sterling terms.
Management fee/Other expenses
The payment of fees and expenses reduces the level of total
assets, and therefore has a negative effect on relative
performance.
Performance fee
Measures the effect of a performance fee charge or writeback.
17
WHERE TO BUY J.P. MORGAN INVESTMENT TRUSTS
You can invest in a J.P. Morgan investment trust through the following;
1. Directly from J.P. Morgan
Investment Account
The Company’s shares are available in the J.P. Morgan Investment
Account, which facilitates both regular monthly investments and
occasional lump sum investments in the Company’s ordinary shares.
Shareholders who would like information on the Investment Account
should call J.P. Morgan Asset Management free on 0800 20 40 20 or
visit its website at am.jpmorgan.co.uk/investor
Stocks & Shares Individual Savings Accounts (ISA)
The Company’s shares are eligible investments within a J.P. Morgan
ISA. For the 2016/17 tax year, from 6th April 2016 and ending 5th April
2017, the total ISA allowance is £15,240. The shares are also available
in a J.P. Morgan Junior ISA. Details are available from J.P. Morgan Asset
Management free on 0800 20 40 20 or via its website at
am.jpmorgan.co.uk/investor
2. Via a third party provider
Third party providers include;
Please note this list is not exhaustive and the availability of individual
trusts may vary depending on the provider. These websites are third
party sites and J.P. Morgan Asset Management does not endorse or
recommend any. Please observe each site's privacy and cookie policies
as well as their platform charges structure.
3. Through a professional adviser
Professional advisers are usually able to access the products of all the
companies in the market and can help you find an investment that
suits your individual circumstances. An adviser will let you know the
fee for their service before you go ahead. You can find an adviser at
unbiased.co.uk
You may also buy investment trusts through stockbrokers, wealth
managers and banks.
To familiarise yourself with the Financial Conduct Authority (FCA)
adviser charging and commission rules, visit fca.org.uk
AJ Bell
Alliance Trust Savings
Barclays Stockbrokers
Bestinvest
Charles Stanley Direct
FundsNetwork
Hargreaves Lansdown
Interactive Investor
James Brearley
James Hay
Selftrade
TD Direct
The Share Centre

18 JPMORGAN GLOBAL GROWTH & INCOME PLC. (FORMERLY JPMORGAN OVERSEAS INVESTMENT TRUST PLC) HALF YEAR REPORT & ACCOUNTS 2016
Fraudsters use persuasive and high-pressure tactics to lure investors into scams. They may offer to sell shares that turn out to beworthless or non-existent, or to buy shares at an inflated price in return for an upfront payment. While high profits are promised, ifyou buy or sell shares in this way you will probably lose your money.
Keep in mind that firms authorised by the FCAare unlikely to contact you out of the blue withan offer to buy or sell shares.
Do not get into a conversation, note the nameof the person and firm contacting you and thenend the call.
Check the Financial Services Register fromwww.fca.org.uk to see if the person and firmcontacting you is authorised by the FCA.
Beware of fraudsters claiming to be from anauthorised firm, copying its website or givingyou false contact details.
Use the firm’s contact details listed on theRegister if you want to call it back.
Call the FCA on 0800 111 6768 if the firm doesnot have contact details on the Register or youare told they are out of date.
Search the list of unauthorised firms to avoid atwww.fca.org.uk/scams.
Consider that if you buy or sell shares from anunauthorised firm you will not have access to theFinancial Ombudsman Service or FinancialServices Compensation Scheme.
Think about getting independent financial andprofessional advice before you hand over anymoney.
Remember: if it sounds too good to be true, itprobably is!
If you are approached by fraudsters please tell theFCA using the share fraud reporting form atwww.fca.org.uk/scams, where you can find outmore about investment scams.
You can also call the FCA Consumer Helpline on0800 111 6768.
If you have already paid money to share fraudstersyou should contact Action Fraud on 0300 123 2040.
5,000 people contact the Financial ConductAuthority about share fraud each year,with victims losing an average of £20,000
1 6
7
8
9
10
2
3
4
5
Beware of share fraud
How to avoid share fraud Report a scam
In association with:
Financial Conduct Authority
Shareholder Information continued

19
Notes

20 JPMORGAN GLOBAL GROWTH & INCOME PLC. (FORMERLY JPMORGAN OVERSEAS INVESTMENT TRUST PLC) HALF YEAR REPORT & ACCOUNTS 2016
Notes
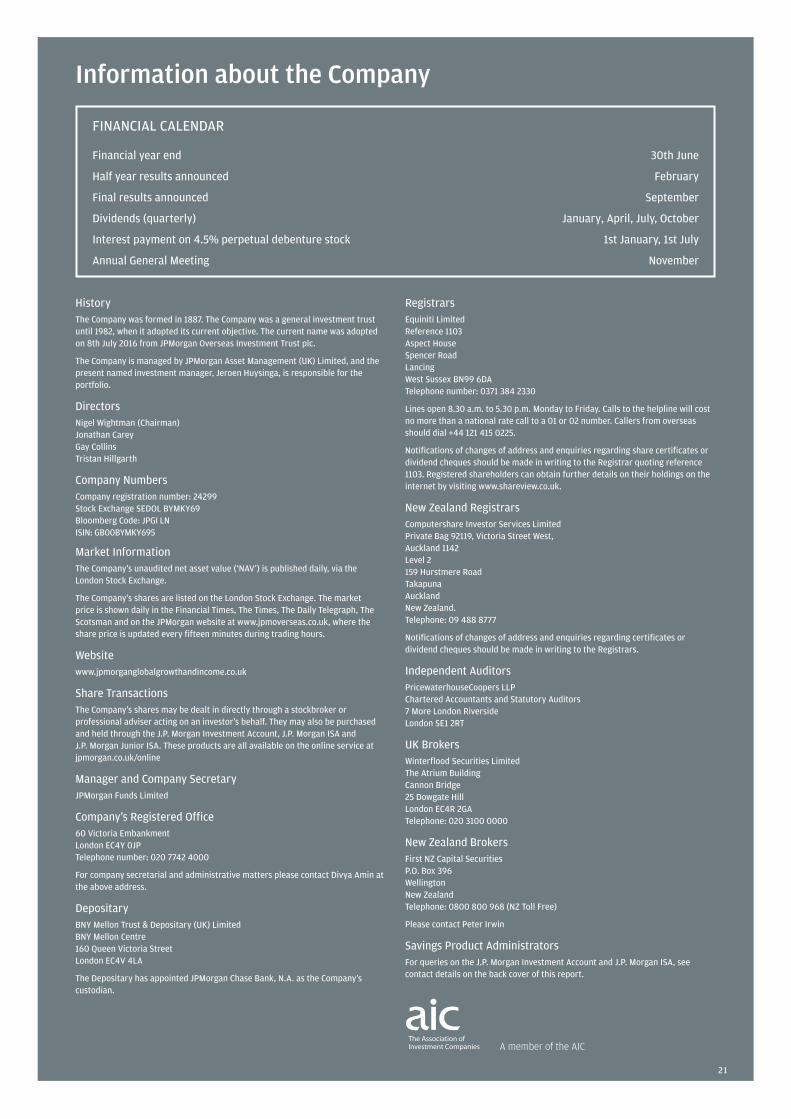
History
The Company was formed in 1887. The Company was a general investment trust
until 1982, when it adopted its current objective. The current name was adopted
on 8th July 2016 from JPMorgan Overseas Investment Trust plc.
The Company is managed by JPMorgan Asset Management (UK) Limited, and the
present named investment manager, Jeroen Huysinga, is responsible for the
portfolio.
Directors
Nigel Wightman (Chairman)
Jonathan Carey
Gay Collins
Tristan Hillgarth
Company Numbers
Company registration number: 24299
Stock Exchange SEDOL BYMKY69
Bloomberg Code: JPGI LN
ISIN: GB00BYMKY695
Market Information
The Company’s unaudited net asset value (‘NAV’) is published daily, via the
London Stock Exchange.
The Company’s shares are listed on the London Stock Exchange. The market
price is shown daily in the Financial Times, The Times, The Daily Telegraph, The
Scotsman and on the JPMorgan website at www.jpmoverseas.co.uk, where the
share price is updated every fifteen minutes during trading hours.
Website
www.jpmorganglobalgrowthandincome.co.uk
Share Transactions
The Company’s shares may be dealt in directly through a stockbroker or
professional adviser acting on an investor’s behalf. They may also be purchased
and held through the J.P. Morgan Investment Account, J.P. Morgan ISA and
J.P. Morgan Junior ISA. These products are all available on the online service at
jpmorgan.co.uk/online
Manager and Company Secretary
JPMorgan Funds Limited
Company’s Registered Office
60 Victoria Embankment
London EC4Y 0JP
Telephone number: 020 7742 4000
For company secretarial and administrative matters please contact Divya Amin at
the above address.
Depositary
BNY Mellon Trust & Depositary (UK) Limited
BNY Mellon Centre
160 Queen Victoria Street
London EC4V 4LA
The Depositary has appointed JPMorgan Chase Bank, N.A. as the Company’s
custodian.
Registrars
Equiniti Limited
Reference 1103
Aspect House
Spencer Road
Lancing
West Sussex BN99 6DA
Telephone number: 0371 384 2330
Lines open 8.30 a.m. to 5.30 p.m. Monday to Friday. Calls to the helpline will cost
no more than a national rate call to a 01 or 02 number. Callers from overseas
should dial +44 121 415 0225.
Notifications of changes of address and enquiries regarding share certificates or
dividend cheques should be made in writing to the Registrar quoting reference
1103. Registered shareholders can obtain further details on their holdings on the
internet by visiting www.shareview.co.uk.
New Zealand Registrars
Computershare Investor Services Limited
Private Bag 92119, Victoria Street West,
Auckland 1142
Level 2
159 Hurstmere Road
Takapuna
Auckland
New Zealand.
Telephone: 09 488 8777
Notifications of changes of address and enquiries regarding certificates or
dividend cheques should be made in writing to the Registrars.
Independent Auditors
PricewaterhouseCoopers LLP
Chartered Accountants and Statutory Auditors
7 More London Riverside
London SE1 2RT
UK Brokers
Winterflood Securities Limited
The Atrium Building
Cannon Bridge
25 Dowgate Hill
London EC4R 2GA
Telephone: 020 3100 0000
New Zealand Brokers
First NZ Capital Securities
P.O. Box 396
Wellington
New Zealand
Telephone: 0800 800 968 (NZ Toll Free)
Please contact Peter Irwin
Savings Product Administrators
For queries on the J.P. Morgan Investment Account and J.P. Morgan ISA, see
contact details on the back cover of this report.
Information about the Company
FINANCIAL CALENDAR
Financial year end 30th June
Half year results announced February
Final results announced September
Dividends (quarterly) January, April, July, October
Interest payment on 4.5% perpetual debenture stock 1st January, 1st July
Annual General Meeting November
A member of the AIC
21

www.jpmglobalgrowthandincome.co.uk
Telephone calls may be recorded and monitored for security and training purposes.
J.P. Morgan Helpline
Freephone 0800 20 40 20 or +44 (0) 1268 444470.
Telephone lines are open Monday to Friday, 9am to 5.30pm.
GB I122 02/17