Embed Size (px)
Citation preview

JPMorgan Emerging Markets Investment Trust plc
Annual General Meeting
24 November 2017
JPMorgan Emerging Markets Investment Trust plc
Annual General Meeting
24 November 2017
Austin Forey, Portfolio Manager

2
Agenda
The past year
Looking ahead
Staying relevant
And finally…
3
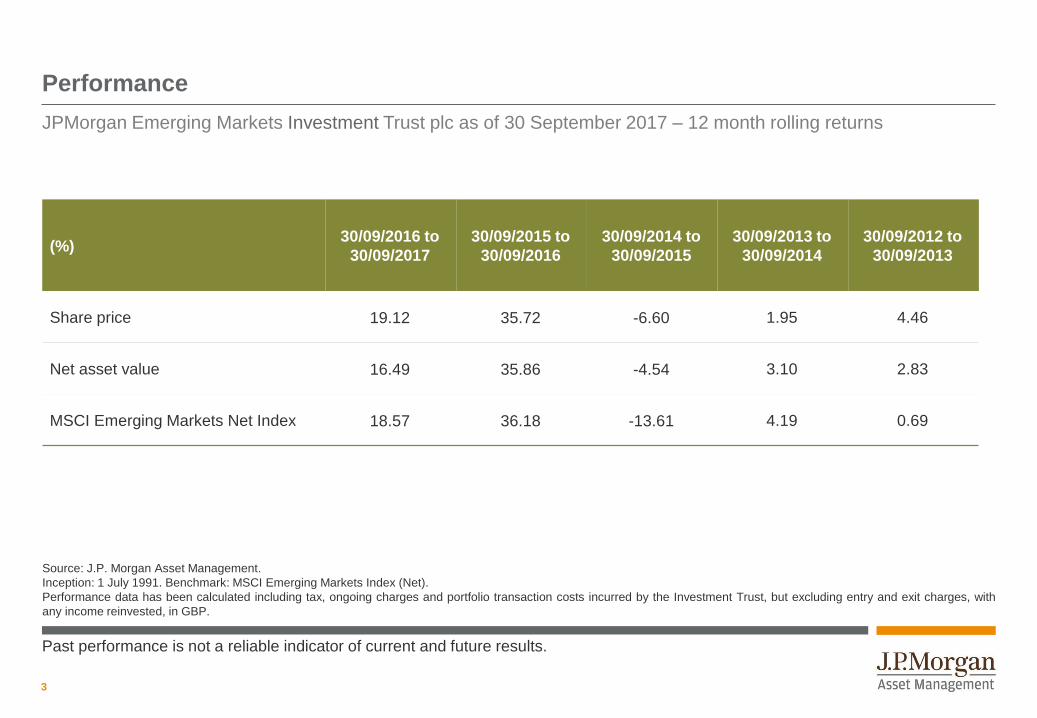
Performance
JPMorgan Emerging Markets Investment Trust plc as of 30 September 2017 – 12 month rolling returns
(%)30/09/2016 to
30/09/2017
30/09/2015 to
30/09/2016
30/09/2014 to
30/09/2015
30/09/2013 to
30/09/2014
30/09/2012 to
30/09/2013
Share price 19.12 35.72 -6.60 1.95 4.46
Net asset value 16.49 35.86 -4.54 3.10 2.83
MSCI Emerging Markets Net Index 18.57 36.18 -13.61 4.19 0.69
Source: J.P. Morgan Asset Management.
Inception: 1 July 1991. Benchmark: MSCI Emerging Markets Index (Net).
Performance data has been calculated including tax, ongoing charges and portfolio transaction costs incurred by the Investment Trust, but excluding entry and exit charges, with
any income reinvested, in GBP.
Past performance is not a reliable indicator of current and future results.
4
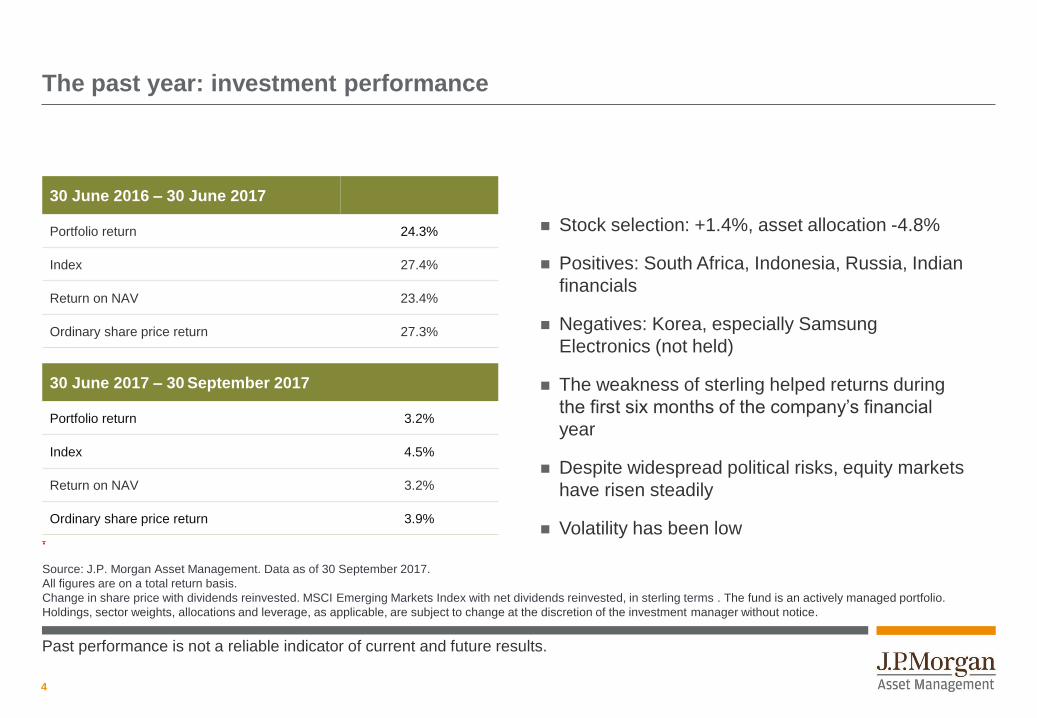
The past year: investment performance
Stock selection: +1.4%, asset allocation -4.8%
Positives: South Africa, Indonesia, Russia, Indian
financials
Negatives: Korea, especially Samsung
Electronics (not held)
The weakness of sterling helped returns during
the first six months of the company’s financial
year
Despite widespread political risks, equity markets
have risen steadily
Volatility has been low.
Source: J.P. Morgan Asset Management. Data as of 30 September 2017.
All figures are on a total return basis.
Change in share price with dividends reinvested. MSCI Emerging Markets Index with net dividends reinvested, in sterling terms . The fund is an actively managed portfolio.
Holdings, sector weights, allocations and leverage, as applicable, are subject to change at the discretion of the investment manager without notice.
30 June 2016 – 30 June 2017
Portfolio return 24.3%
Index 27.4%
Return on NAV 23.4%
Ordinary share price return 27.3%
30 June 2017 – 30 September 2017
Portfolio return 3.2%
Index 4.5%
Return on NAV 3.2%
Ordinary share price return 3.9%
Past performance is not a reliable indicator of current and future results.
5
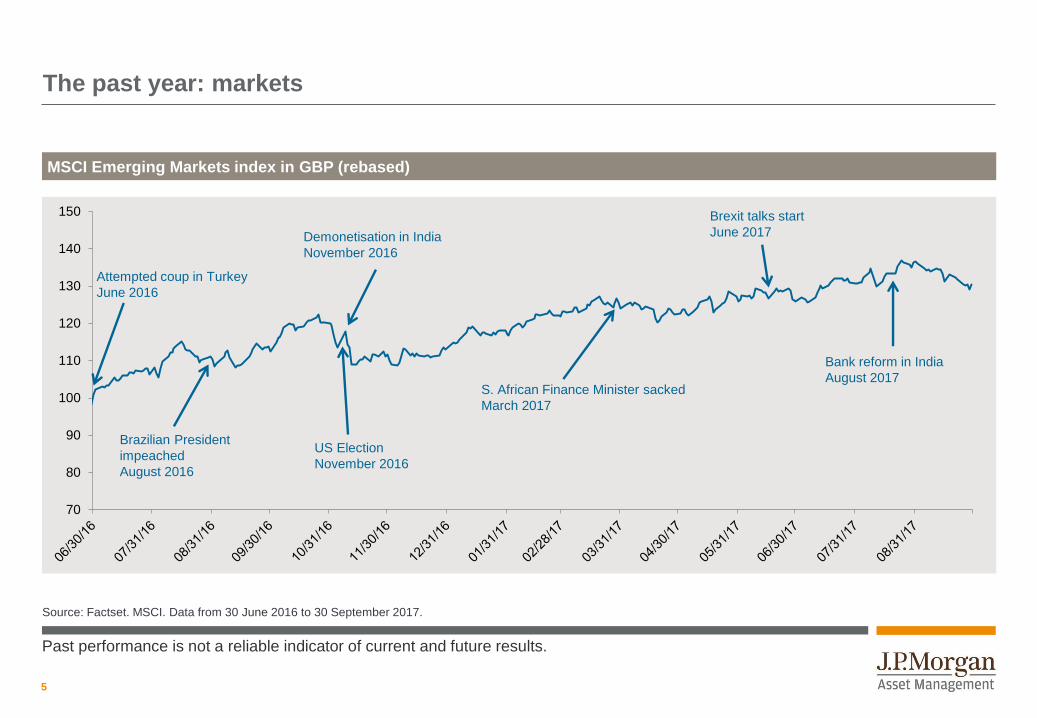
The past year: markets
Source: Factset. MSCI. Data from 30 June 2016 to 30 September 2017.
MSCI Emerging Markets index in GBP (rebased)
70
80
90
100
110
120
130
140
150
Demonetisation in India
November 2016
US Election
November 2016
Bank reform in India
August 2017
Attempted coup in Turkey
June 2016
Brazilian President
impeached
August 2016
S. African Finance Minister sacked
March 2017
Brexit talks start
June 2017
Past performance is not a reliable indicator of current and future results.
6
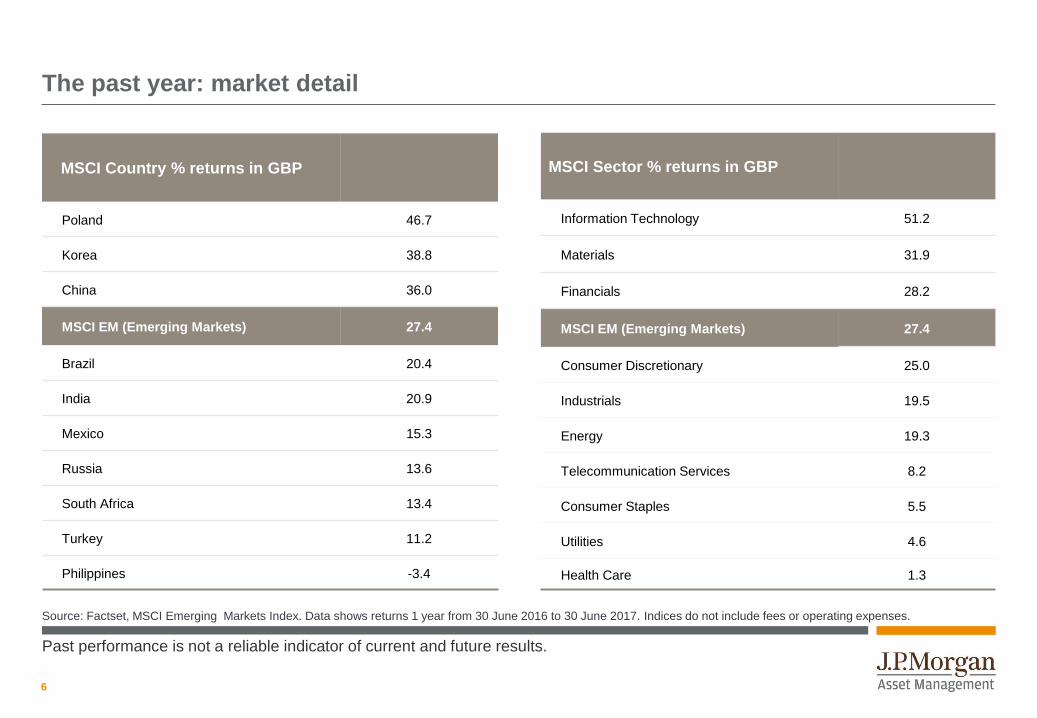
The past year: market detail
Source: Factset, MSCI Emerging Markets Index. Data shows returns 1 year from 30 June 2016 to 30 June 2017. Indices do not include fees or operating expenses.
MSCI Country % returns in GBP
Poland 46.7
Korea 38.8
China 36.0
MSCI EM (Emerging Markets) 27.4
Brazil 20.4
India 20.9
Mexico 15.3
Russia 13.6
South Africa 13.4
Turkey 11.2
Philippines -3.4
MSCI Sector % returns in GBP
Information Technology 51.2
Materials 31.9
Financials 28.2
MSCI EM (Emerging Markets) 27.4
Consumer Discretionary 25.0
Industrials 19.5
Energy 19.3
Telecommunication Services 8.2
Consumer Staples 5.5
Utilities 4.6
Health Care 1.3
Past performance is not a reliable indicator of current and future results.
7
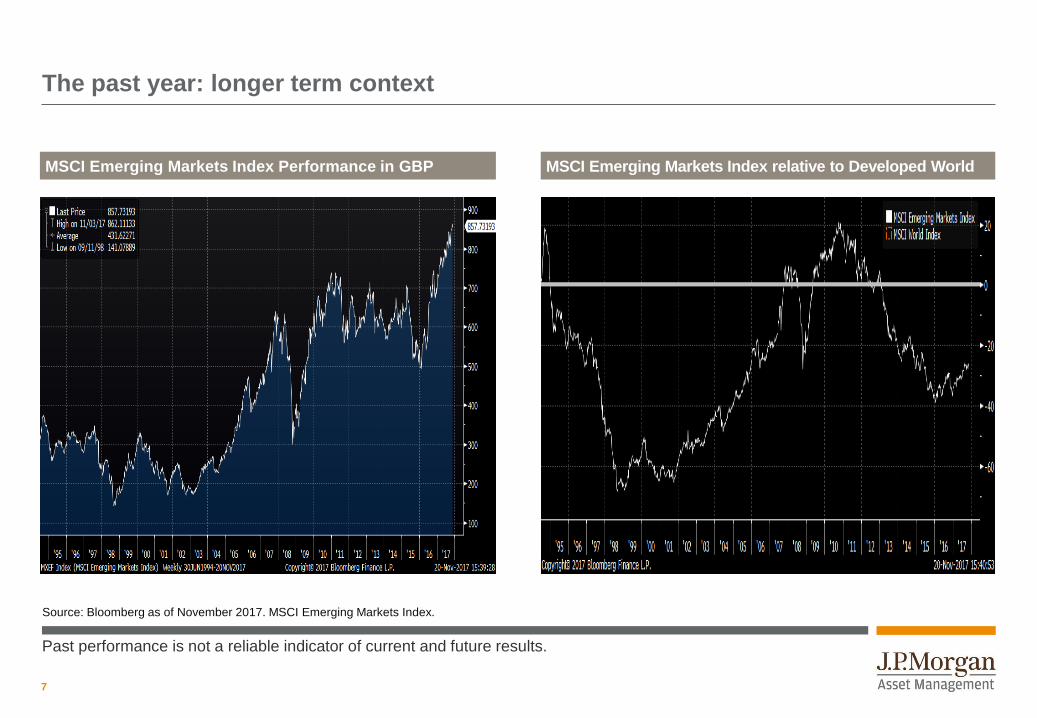
The past year: longer term context
MSCI Emerging Markets Index Performance in GBP MSCI Emerging Markets Index relative to Developed World
Source: Bloomberg as of November 2017. MSCI Emerging Markets Index.
Past performance is not a reliable indicator of current and future results.
8
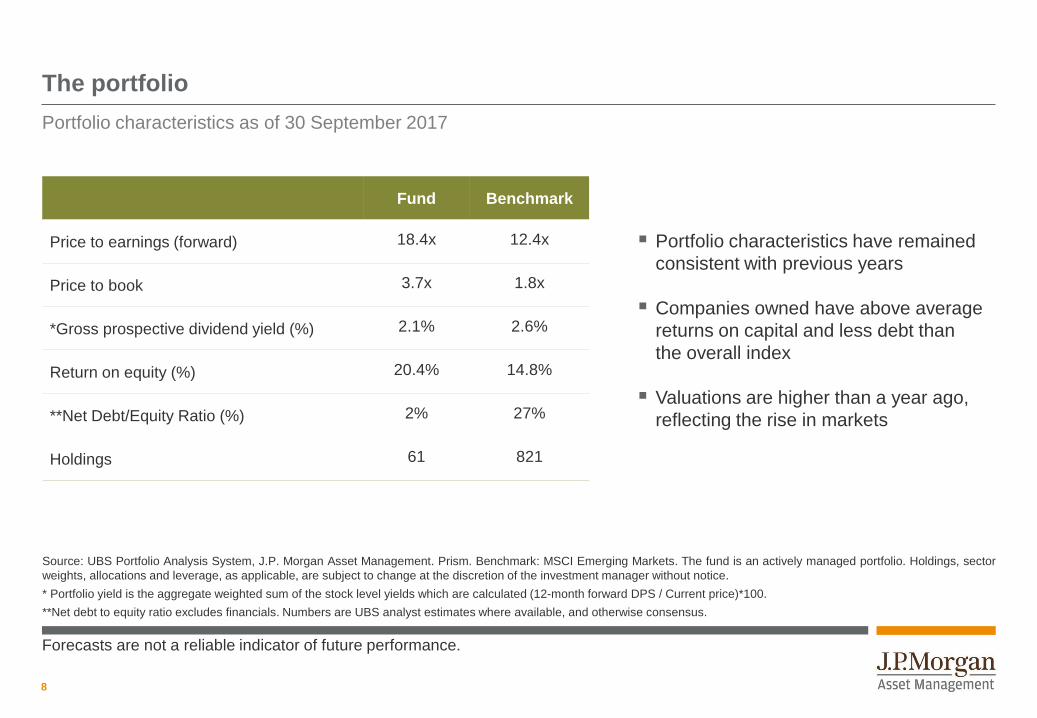
The portfolio
Source: UBS Portfolio Analysis System, J.P. Morgan Asset Management. Prism. Benchmark: MSCI Emerging Markets. The fund is an actively managed portfolio. Holdings, sector
weights, allocations and leverage, as applicable, are subject to change at the discretion of the investment manager without notice.
* Portfolio yield is the aggregate weighted sum of the stock level yields which are calculated (12-month forward DPS / Current price)*100.
**Net debt to equity ratio excludes financials. Numbers are UBS analyst estimates where available, and otherwise consensus.
Portfolio characteristics as of 30 September 2017
Fund Benchmark
Price to earnings (forward) 18.4x 12.4x
Price to book 3.7x 1.8x
*Gross prospective dividend yield (%) 2.1% 2.6%
Return on equity (%) 20.4% 14.8%
**Net Debt/Equity Ratio (%) 2% 27%
Holdings 61 821
Portfolio characteristics have remained
consistent with previous years
Companies owned have above average
returns on capital and less debt than
the overall index
Valuations are higher than a year ago,
reflecting the rise in markets
Forecasts are not a reliable indicator of future performance.
9
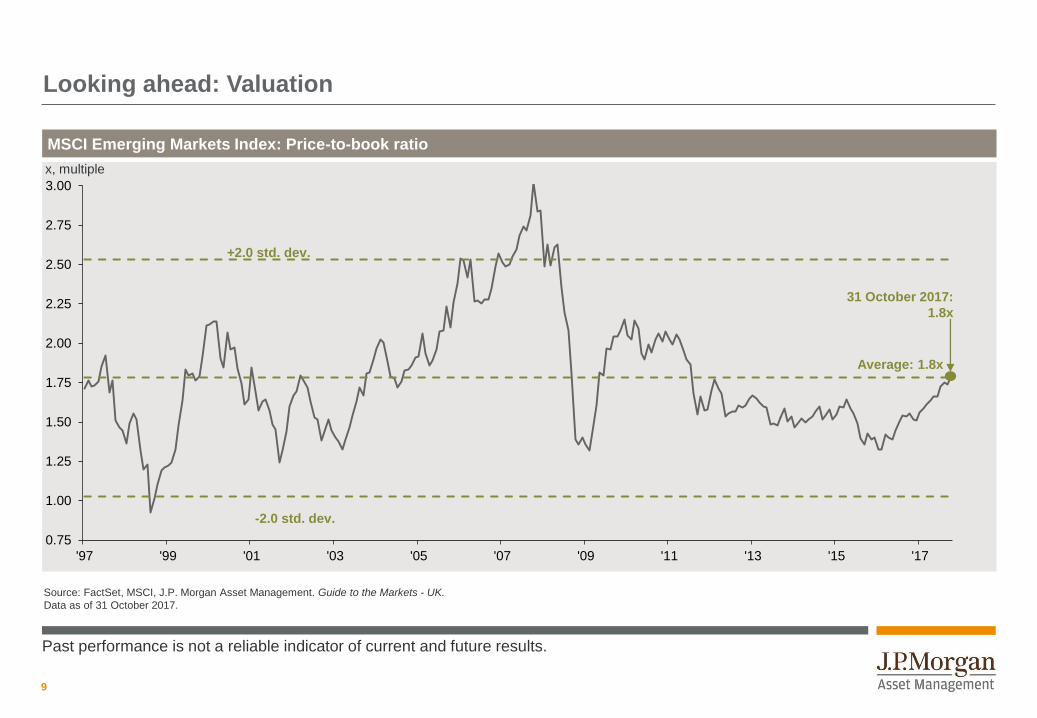
GTM – UK |Looking ahead: Valuation
MSCI Emerging Markets Index: Price-to-book ratio
Source: FactSet, MSCI, J.P. Morgan Asset Management. Guide to the Markets - UK.
Data as of 31 October 2017.
0.75
1.00
1.25
1.50
1.75
2.00
2.25
2.50
2.75
3.00
'97 '99 '01 '03 '05 '07 '09 '11 '13 '15 '17
x, multiple
-2.0 std. dev.
+2.0 std. dev.
Average: 1.8x
31 October 2017:
1.8x
Past performance is not a reliable indicator of current and future results.
10
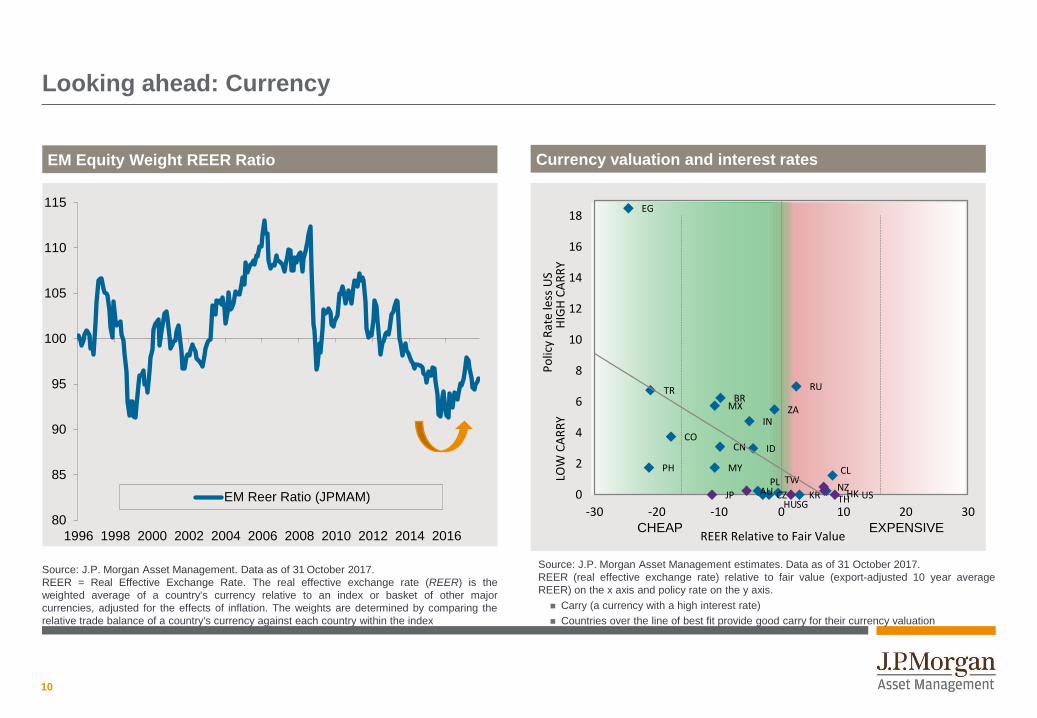
Looking ahead: Currency
EM Equity Weight REER Ratio
Source: J.P. Morgan Asset Management estimates. Data as of 31 October 2017.
REER (real effective exchange rate) relative to fair value (export-adjusted 10 year average
REER) on the x axis and policy rate on the y axis.
Carry (a currency with a high interest rate)
Countries over the line of best fit provide good carry for their currency valuation
Source: J.P. Morgan Asset Management. Data as of 31 October 2017.
REER = Real Effective Exchange Rate. The real effective exchange rate (REER) is the
weighted average of a country's currency relative to an index or basket of other major
currencies, adjusted for the effects of inflation. The weights are determined by comparing the
relative trade balance of a country's currency against each country within the index
Currency valuation and interest rates
80
85
90
95
100
105
110
115
1996 1998 2000 2002 2004 2006 2008 2010 2012 2014 2016
EM Reer Ratio (JPMAM)
MY
CN
TW
RU
ID
THKR
MXBR
CZ
IN
CO
TR
PL
HU
ZA
EG
CLPH
USAU NZHK
SGJP0
2
4
6
8
10
12
14
16
18
-30 -20 -10 0 10 20 30
Po
licy
Rat
e le
ss U
SREER Relative to Fair Value
CHEAP EXPENSIVE
LOW
CA
RR
YH
IGH
CA
RR
Y
11
0
2
4
6
8
10
12
14
16
18
20
0
20
40
60
80
100
120
140
19
99
20
00
20
01
20
02
20
03
20
04
20
05
20
06
20
07
20
08
20
09
20
10
20
11
20
12
20
13
20
14
20
15
20
16
20
17
e
20
18
e
20
19
N
20
20
e
20
21
e
20
22
eEPS ROE
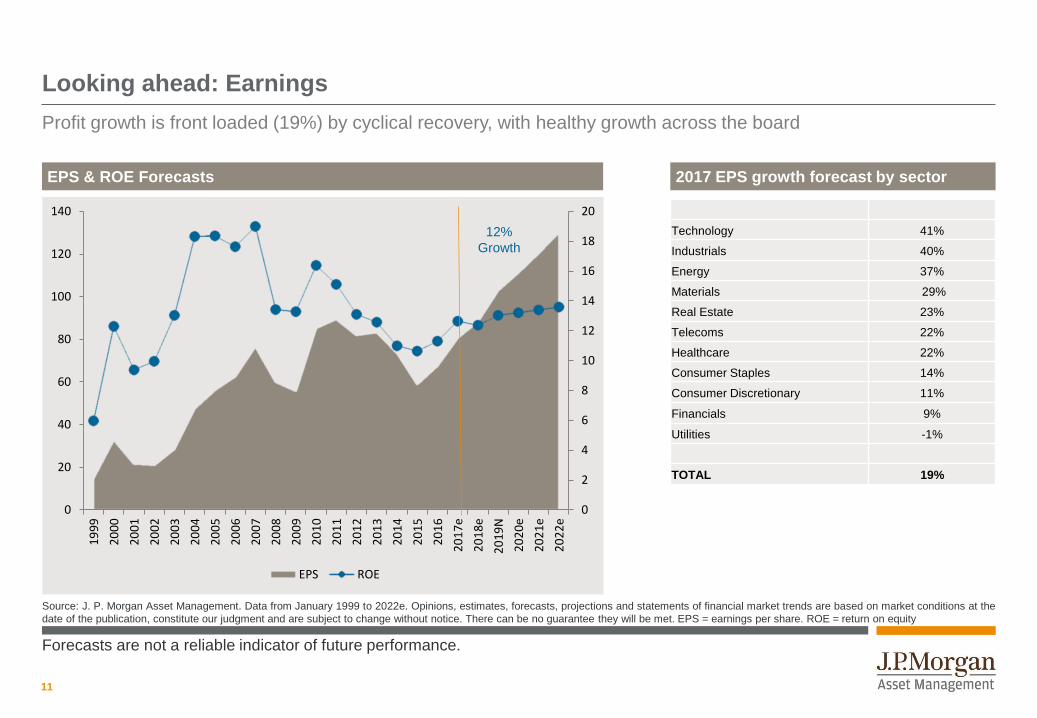
Looking ahead: Earnings
Profit growth is front loaded (19%) by cyclical recovery, with healthy growth across the board
Source: J. P. Morgan Asset Management. Data from January 1999 to 2022e. Opinions, estimates, forecasts, projections and statements of financial market trends are based on market conditions at the
date of the publication, constitute our judgment and are subject to change without notice. There can be no guarantee they will be met. EPS = earnings per share. ROE = return on equity
12%
Growth
EPS & ROE Forecasts 2017 EPS growth forecast by sector
Technology 41%
Industrials 40%
Energy 37%
Materials 29%
Real Estate 23%
Telecoms 22%
Healthcare 22%
Consumer Staples 14%
Consumer Discretionary 11%
Financials 9%
Utilities -1%
TOTAL 19%
Forecasts are not a reliable indicator of future performance.
12
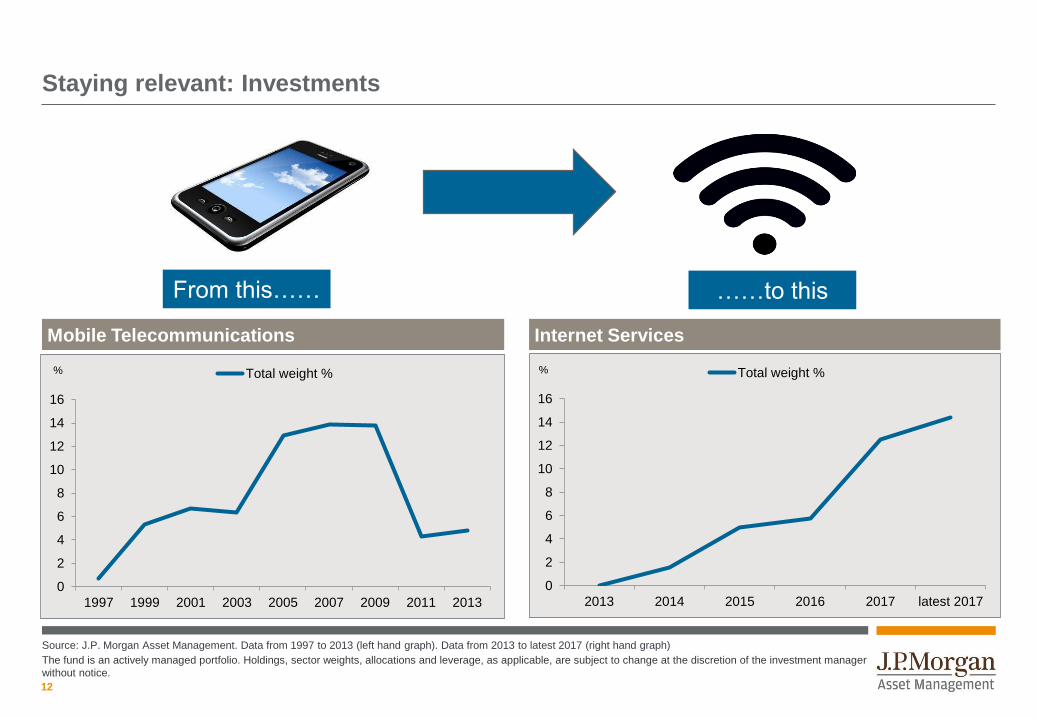
Staying relevant: Investments
Source: J.P. Morgan Asset Management. Data from 1997 to 2013 (left hand graph). Data from 2013 to latest 2017 (right hand graph)
The fund is an actively managed portfolio. Holdings, sector weights, allocations and leverage, as applicable, are subject to change at the discretion of the investment manager
without notice.
From this…… ……to this
Mobile Telecommunications Internet Services
0
2
4
6
8
10
12
14
16
2013 2014 2015 2016 2017 latest 2017
Total weight %%
0
2
4
6
8
10
12
14
16
1997 1999 2001 2003 2005 2007 2009 2011 2013
Total weight %%
13
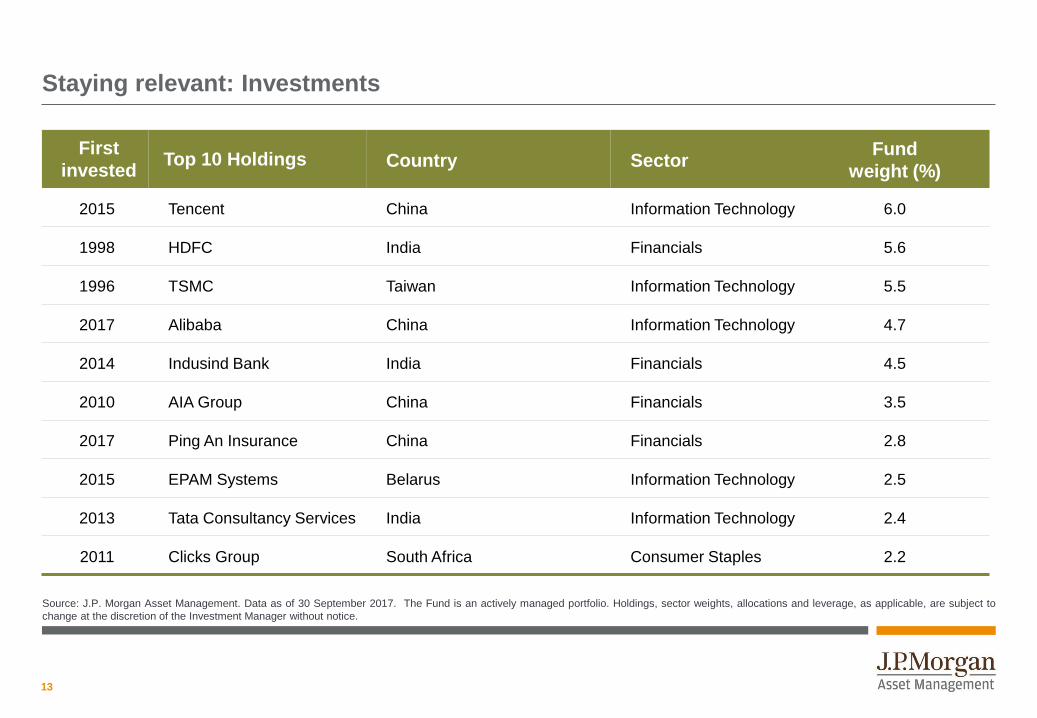
First
investedTop 10 Holdings Country Sector
Fund
weight (%)
2015 Tencent China Information Technology 6.0
1998 HDFC India Financials 5.6
1996 TSMC Taiwan Information Technology 5.5
2017 Alibaba China Information Technology 4.7
2014 Indusind Bank India Financials 4.5
2010 AIA Group China Financials 3.5
2017 Ping An Insurance China Financials 2.8
2015 EPAM Systems Belarus Information Technology 2.5
2013 Tata Consultancy Services India Information Technology 2.4
2011 Clicks Group South Africa Consumer Staples 2.2
Source: J.P. Morgan Asset Management. Data as of 30 September 2017. The Fund is an actively managed portfolio. Holdings, sector weights, allocations and leverage, as applicable, are subject to
change at the discretion of the Investment Manager without notice.
Staying relevant: Investments
14
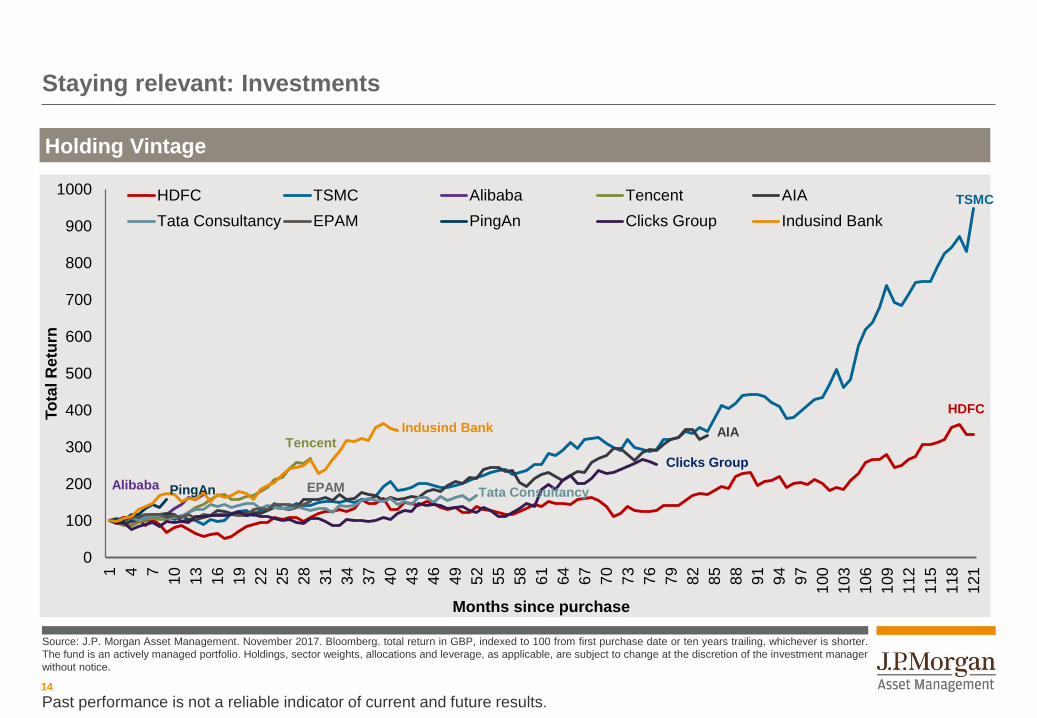
Staying relevant: Investments
0
100
200
300
400
500
600
700
800
900
1000
1 4 7
10
13
16
19
22
25
28
31
34
37
40
43
46
49
52
55
58
61
64
67
70
73
76
79
82
85
88
91
94
97
100
103
106
109
112
115
118
121
To
tal R
etu
rn
Months since purchase
HDFC TSMC Alibaba Tencent AIA
Tata Consultancy EPAM PingAn Clicks Group Indusind Bank
Holding Vintage
Source: J.P. Morgan Asset Management. November 2017. Bloomberg. total return in GBP, indexed to 100 from first purchase date or ten years trailing, whichever is shorter.
The fund is an actively managed portfolio. Holdings, sector weights, allocations and leverage, as applicable, are subject to change at the discretion of the investment manager
without notice.
TSMC
HDFC
Alibaba
TencentAIA
Tata ConsultancyPingAn
Clicks Group
Indusind Bank
EPAM
Past performance is not a reliable indicator of current and future results.
15
40
60
80
100
2001 2003 2005 2007 2009 2011 2013 2015
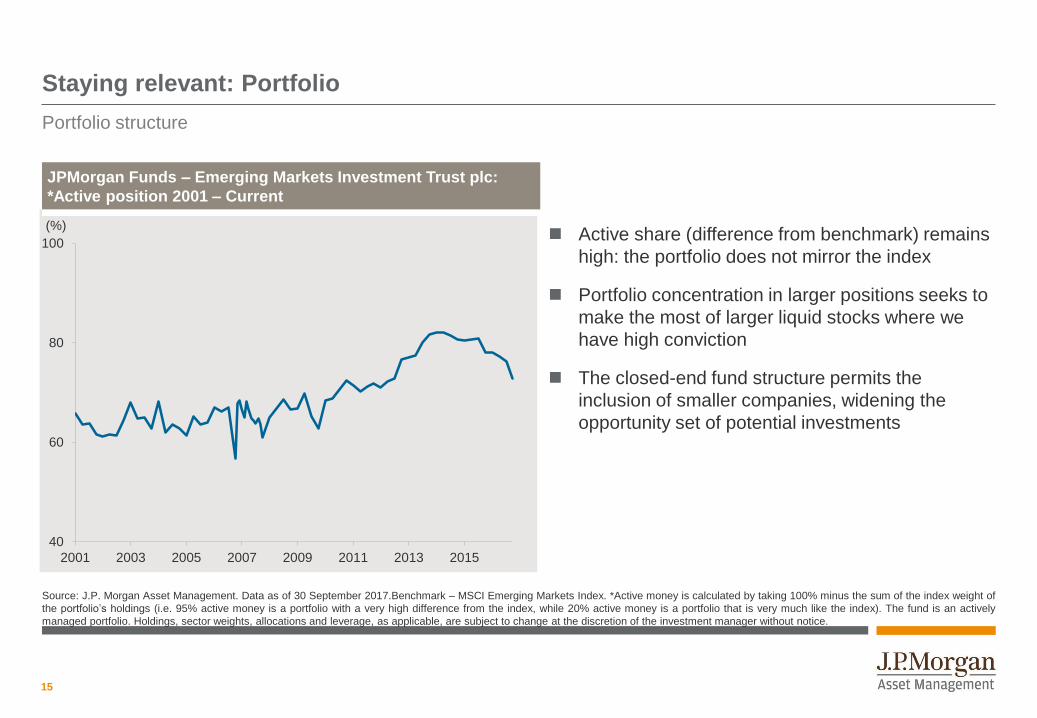
Staying relevant: Portfolio
Portfolio structure
Active share (difference from benchmark) remains
high: the portfolio does not mirror the index
Portfolio concentration in larger positions seeks to
make the most of larger liquid stocks where we
have high conviction
The closed-end fund structure permits the
inclusion of smaller companies, widening the
opportunity set of potential investments
Source: J.P. Morgan Asset Management. Data as of 30 September 2017.Benchmark – MSCI Emerging Markets Index. *Active money is calculated by taking 100% minus the sum of the index weight of
the portfolio’s holdings (i.e. 95% active money is a portfolio with a very high difference from the index, while 20% active money is a portfolio that is very much like the index). The fund is an actively
managed portfolio. Holdings, sector weights, allocations and leverage, as applicable, are subject to change at the discretion of the investment manager without notice.
JPMorgan Funds – Emerging Markets Investment Trust plc:
*Active position 2001 – Current
(%)
16
15
53
43
34
10
0
10
20
30
40
50
60
Average EMCompany
Infosys SamsungElectronics
HDFC Gazprom
1 03
0 1
0
10
20
30
40
50
60
Average EMCompany
Infosys SamsungElectronics
HDFC Gazprom
Staying relevant: Portfolio
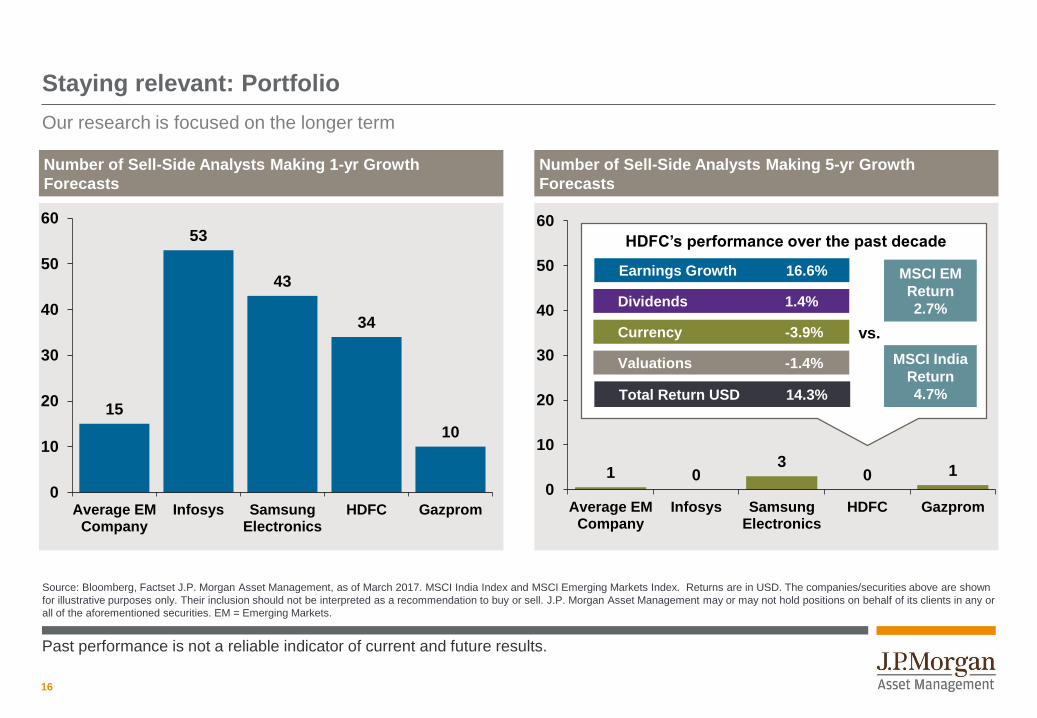
Source: Bloomberg, Factset J.P. Morgan Asset Management, as of March 2017. MSCI India Index and MSCI Emerging Markets Index. Returns are in USD. The companies/securities above are shown
for illustrative purposes only. Their inclusion should not be interpreted as a recommendation to buy or sell. J.P. Morgan Asset Management may or may not hold positions on behalf of its clients in any or
all of the aforementioned securities. EM = Emerging Markets.
Number of Sell-Side Analysts Making 1-yr Growth
Forecasts
Number of Sell-Side Analysts Making 5-yr Growth
Forecasts
Dividends 1.4%
Earnings Growth 16.6%
Currency -3.9%
Valuations -1.4%
Total Return USD 14.3%
vs.
MSCI EM
Return
2.7%
MSCI India
Return
4.7%
HDFC’s performance over the past decade
Our research is focused on the longer term
Past performance is not a reliable indicator of current and future results.
17
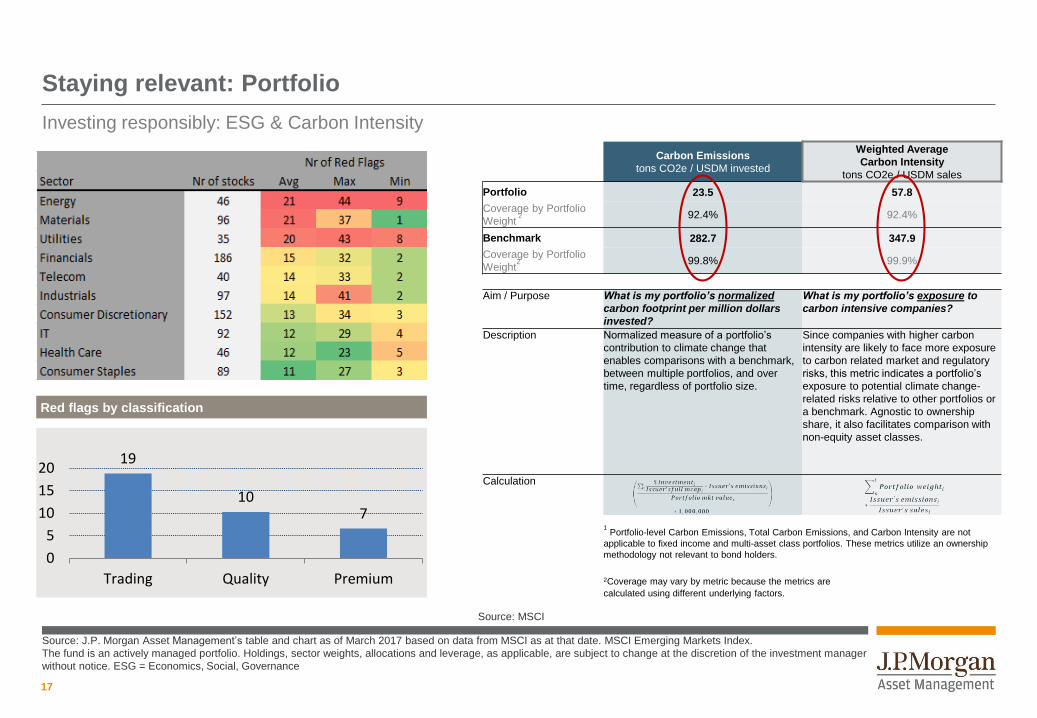
19
107
0
5
10
15
20
Trading Quality Premium
Red flags by classification
Source: J.P. Morgan Asset Management’s table and chart as of March 2017 based on data from MSCI as at that date. MSCI Emerging Markets Index.
The fund is an actively managed portfolio. Holdings, sector weights, allocations and leverage, as applicable, are subject to change at the discretion of the investment manager
without notice. ESG = Economics, Social, Governance
Staying relevant: Portfolio
Investing responsibly: ESG & Carbon Intensity
Carbon Emissions
tons CO2e / USDM invested
Weighted Average
Carbon Intensity
tons CO2e / USDM sales
Portfolio 23.5 57.8
Coverage by Portfolio
Weight2 92.4% 92.4%
Benchmark 282.7 347.9
Coverage by Portfolio
Weight2 99.8% 99.9%
Aim / Purpose What is my portfolio’s normalized
carbon footprint per million dollars
invested?
What is my portfolio’s exposure to
carbon intensive companies?
Description Normalized measure of a portfolio’s
contribution to climate change that
enables comparisons with a benchmark,
between multiple portfolios, and over
time, regardless of portfolio size.
Since companies with higher carbon
intensity are likely to face more exposure
to carbon related market and regulatory
risks, this metric indicates a portfolio’s
exposure to potential climate change-
related risks relative to other portfolios or
a benchmark. Agnostic to ownership
share, it also facilitates comparison with
non-equity asset classes.
Calculation
1Portfolio-level Carbon Emissions, Total Carbon Emissions, and Carbon Intensity are not
applicable to fixed income and multi-asset class portfolios. These metrics utilize an ownership
methodology not relevant to bond holders.
2Coverage may vary by metric because the metrics are
calculated using different underlying factors.
Source: MSCI
18
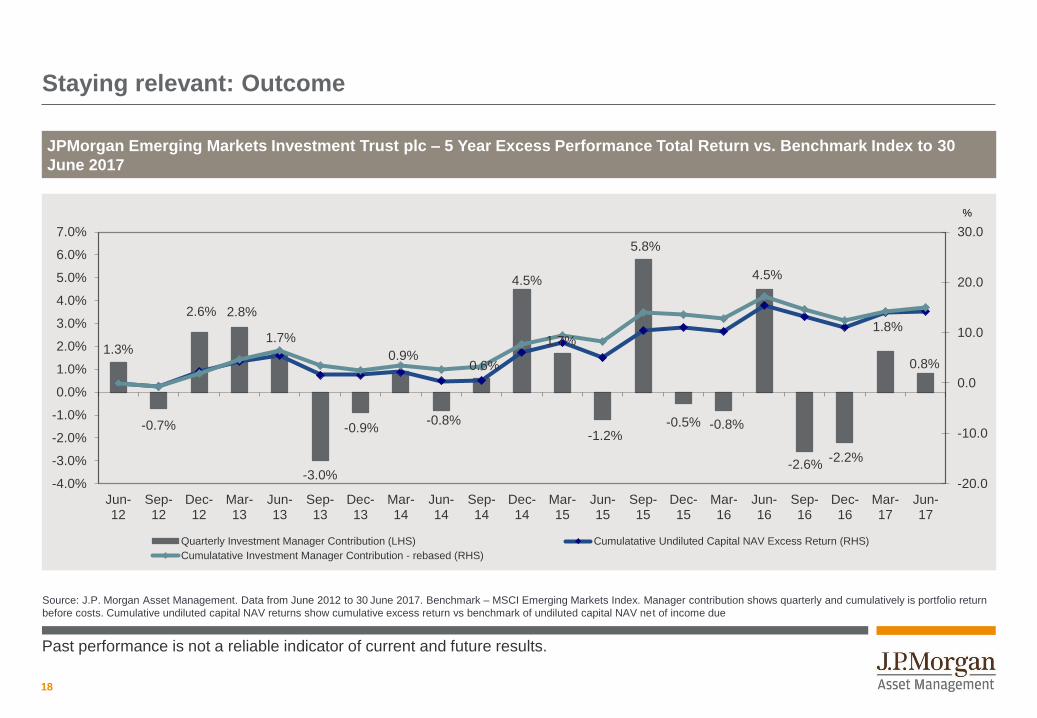
Staying relevant: Outcome
Source: J.P. Morgan Asset Management. Data from June 2012 to 30 June 2017. Benchmark – MSCI Emerging Markets Index. Manager contribution shows quarterly and cumulatively is portfolio return
before costs. Cumulative undiluted capital NAV returns show cumulative excess return vs benchmark of undiluted capital NAV net of income due
JPMorgan Emerging Markets Investment Trust plc – 5 Year Excess Performance Total Return vs. Benchmark Index to 30
June 2017
1.3%
-0.7%
2.6% 2.8%
1.7%
-3.0%
-0.9%
0.9%
-0.8%
0.6%
4.5%
1.7%
-1.2%
5.8%
-0.5% -0.8%
4.5%
-2.6%-2.2%
1.8%
0.8%
-20.0
-10.0
0.0
10.0
20.0
30.0
-4.0%
-3.0%
-2.0%
-1.0%
0.0%
1.0%
2.0%
3.0%
4.0%
5.0%
6.0%
7.0%
Jun-12
Sep-12
Dec-12
Mar-13
Jun-13
Sep-13
Dec-13
Mar-14
Jun-14
Sep-14
Dec-14
Mar-15
Jun-15
Sep-15
Dec-15
Mar-16
Jun-16
Sep-16
Dec-16
Mar-17
Jun-17
Quarterly Investment Manager Contribution (LHS) Cumulatative Undiluted Capital NAV Excess Return (RHS)
Cumulatative Investment Manager Contribution - rebased (RHS)
Past performance is not a reliable indicator of current and future results.
%
19
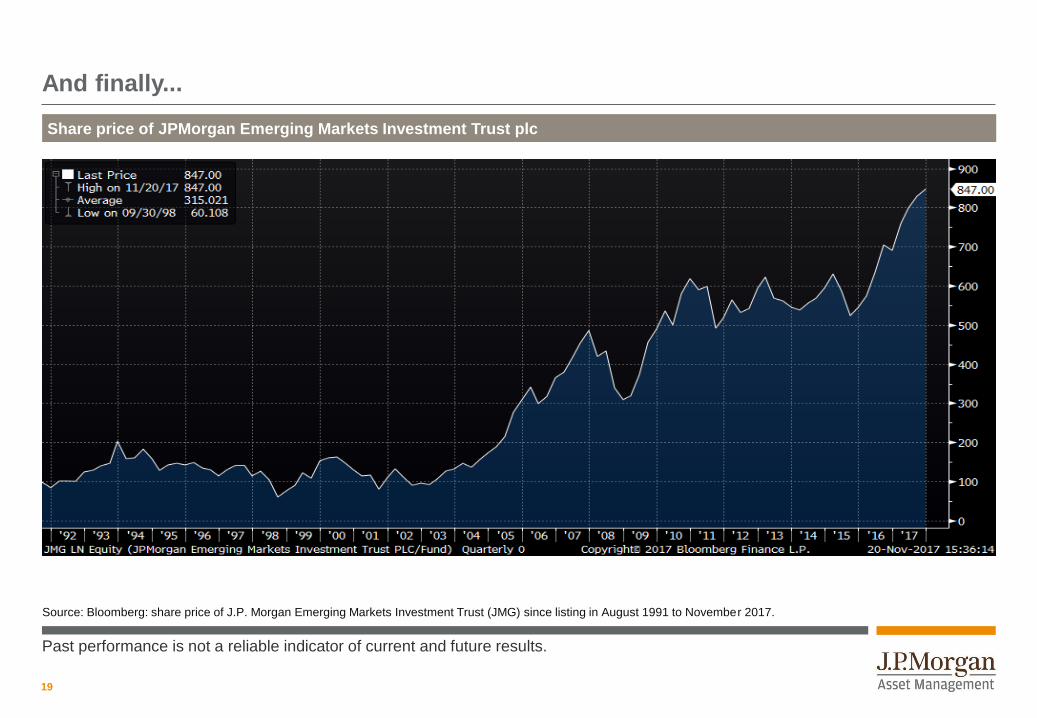
And finally...
Source: Bloomberg: share price of J.P. Morgan Emerging Markets Investment Trust (JMG) since listing in August 1991 to November 2017.
Share price of JPMorgan Emerging Markets Investment Trust plc
Past performance is not a reliable indicator of current and future results.

20
Thank you
21
Investment objectives and risk profile
Investment objectiveCapital growth from emerging markets worldwide. Invests in a diversified portfolio with no more than 50% of the Company’s assets
invested in any one region.
Risk Profile
Investing in emerging markets may involve a higher element of risk due to political and economic instability and underdeveloped markets and systems, and
may be illiquid.
Exchange rate changes may cause the value of underlying overseas investments to be volatile.
Some investment trusts may have warrants or subscription shares in issue, which if exercised may have an effect on the net asset value.
Investments in smaller companies may involve a higher degree of risk as these are usually more sensitive to price movements.
Please refer to the Investment Trust’s Investor Disclosure Document and the Company’s annual report, a copy of which is available from its website.
JPMorgan Emerging Markets Investment Trust plc (the Company) as of 30 September 2017
22
Important Information
This is a marketing communication and as such the views contained herein are not to be taken as an advice or recommendation to buy or sell any investment or
interest thereto. Reliance upon information in this material is at the sole discretion of the reader. Any research in this document has been obtained and may have
been acted upon by J.P. Morgan Asset Management for its own purpose. The results of such research are being made available as additional information and do
not necessarily reflect the views of J.P. Morgan Asset Management. Any forecasts, figures, opinions, statements of financial market trends or investment
techniques and strategies expressed are unless otherwise stated, J.P. Morgan Asset Management’s own at the date of this document. They are considered to be
reliable at the time of writing, may not necessarily be all inclusive and are not guaranteed as to accuracy. They may be subject to change without reference or
notification to you.
It should be noted that the value of investments and the income from them may fluctuate in accordance with market conditions and taxation agreements and
investors may not get back the full amount invested. Changes in exchange rates may have an adverse effect on the value, price or income of the products or
underlying overseas investments. Past performance and yield are not reliable indicators of current and future results. There is no guarantee that any forecast made
will come to pass. Furthermore, whilst it is the intention to achieve the investment objective of the investment products, there can be no assurance that those
objectives will be met.
J.P. Morgan Asset Management is the brand name for the asset management business of JPMorgan Chase & Co. and its affiliates worldwide. To the extent
permitted by applicable law, we may record telephone calls and monitor electronic communications to comply with our legal and regulatory obligations and internal
policies. Personal data will be collected, stored and processed by J.P. Morgan Asset Management in accordance with our EMEA Privacy Policy
www.jpmorgan.com/jpmpdf/1320694304816.pdf.
Investment is subject to documentation (Investment Disclosure Document, [Key Features and Terms and Conditions]), copies of which can be obtained free of
charge from JPMorgan Asset Management (UK) Limited. This communication is issued by JPMorgan Asset Management (UK), Limited which is authorised and
regulated in the UK by the Financial Conduct Authority. Registered in England No: 01161446. Registered address: 25 Bank Street, Canary Wharf, London E14
5JP.
0903c02a81fd8258
6cde0880-ce9c-11e7-b5e0-005056960c63
JPMorgan Emerging Markets Investment Trust plc
Annual General Meeting
24 November 2017