Embed Size (px)
Citation preview
Iranian Journal of Pharmaceutical Sciences Winter 2011: 7(1): 7-16ijps.sums.ac.ir
R
Original Article
Formulation and Characterization of Solid Dispersions ofGlimepiride through Factorial Design
Veerendra S. Rajpurohita, Pankaj Rakhaa, Surender Goyala, Harish Durejab,Gitika Arorac and Manju Nagpald,*
aRajendra Institute of Technology and Sciences, Hisar Road, Sirsa-125055, IndiabDepartment of Pharmaceutical Sciences, M. D. University, Rohtak- 124001, India
cNCRD’s Sterling Institute of Pharmacy, Navi Mumbai- 400706, IndiadSchool of Pharmaceutical sciences, Chitkara University, Solan-174103, India
AbstractIn order to enhance in vitro dissolution and content uniformity of poorly soluble
drug glimepiride by preparing solid dispersions using modified solvent fusionmethod, solid dispersions of drug were prepared by modified fusion solvent methodusing PEG 6000 and PVP K25 (as carrier). Eight batches (F1-F8) were prepared byFactorial design (23) by taking three factors i.e. the concentration of: drug (X1), PEG6000 (X2) and PVP K25 (X3). DSC, FTIR spectroscopy, powder X-ray diffraction(XRD) and SEM studies were used to characterize solid dispersions. In vitro releasewas carried out using USP II dissolution apparatus. Multilinear regression analysiswas applied to develop mathematical model to estimate cumulative drug release.The batch F3 was found to be best batch as it showed maximum in vitro dissolutionafter 30 min. Improvement in dissolution behavior of solid dispersion batches wasobserved due to conversion of crystalline form of drug to amorphous form asconfirmed by DSC, FTIR studies and X-RD studies. SEM photographs of batch F3showed porous nature of particle surface. Uniformity of content of different batcheswas found to be in range as specified by IP. Solid dispersion prepared via modifiedfusion solvent method was proved to be beneficial in enhancement of dissolution rateof poorly-water soluble drug using hydrophilic carriers. Retrospectively, this modelcan further be utilized to design solid dispersions for desired release characteristics.
Keywords: Factorial design; Glimepiride; PEG 6000; PVP K25; Solid dispersion.Received: August 25, 2010; Accetperd: October 27, 2010
1. IntroductionOral drug delivery is the simplest and
easiest way of administering drugs. Because
of the greater stability, smaller bulk, accuratedosage and easy production, solid oral dosagesforms have many advantages over other typesof oral dosage forms. Therefore, most of thenew chemical entities (NCE) underdevelopment are intended to be used as a soliddosage form that originate an effective and
*Corresponding author: Manju Nagpal. School of Pharmaceuticalsciences, Chitkara University, Solan-174103, INDIAEmail: [email protected]
V. S. Rajpurohit et al / IJPS Winter 2011; 7(1): 7-16
8
reproducible in vivo plasma concentrationafter oral administration [1, 2]. In fact, mostNCEs are poorly water-soluble drugs and arenot well absorbed after oral administrationwhich can detract from the drug’s inherentefficacy [3, 4]. Consequently, if these drugsare not completely released in the gastroin-testinal area, they will have a lowbioavailability [5]. Therefore, one of the majorcurrent challenges of the pharmaceuticalindustry is related to strategies that improvethe water solubility of drugs [6]. Thetechniques/approaches that have commonlybeen used to overcome drawbacks associatedwith poorly water-soluble drugs, in generalincludes micronization, salt formation, useof surfactants and use of prodrug [7].However, all these techniques have potentiallimitations. Solid dispersion is the mostsuccessful strategy to improve drug release ofpoorly soluble drugs. Solid dispersionimproves the solubility through decreasedparticle size, increase surface area, improvedwettability and increased amorphous state ofwater insoluble compound [8]. Sekiguchi andObi first introduced the concept of using soliddispersions to improve bioavailability ofpoorly water soluble drug in 1961. Chiouand Riegelman defined the term soliddispersion as “a dispersion of one or more
active ingredients in an inert carrier or matrix,prepared by the melting, solvent, or melting-solvent method [9]. Solid dispersion (SD)technique has been widely used to improve thesolubility, dissolution rate and oral absorptionof poorly water-soluble drugs [10, 11].
Glimepiride (a BCS class II drug) is athird generation of sulfonyl urea oral anti-diabetic drug having high permeability andlow solubility. Low water soluble drugs oftenexhibit low dissolution profile and oralbioavailability problems [12, 13]. Therefore,the objective of the present study was toimprove in vitro dissolution profile andcontent uniformity of glimepiride using soliddispersions by modified solvent fusionthrough factorial design.
2. Materials and methods2.1. Materials
Glimepiride was a gift sample from ComedPharmaceutical Ltd. (India). PEG 6000 waspurchased from Glaxo Smithkline Ltd. (India).PVP K25 was purchased from Titan BiotechLtd. (India). All chemicals used were ofanalytical grade.
2.2. Modified Fusion Solvent MethodSolid dispersions were prepared by using
the carriers viz. polyethylene glycol (PEG
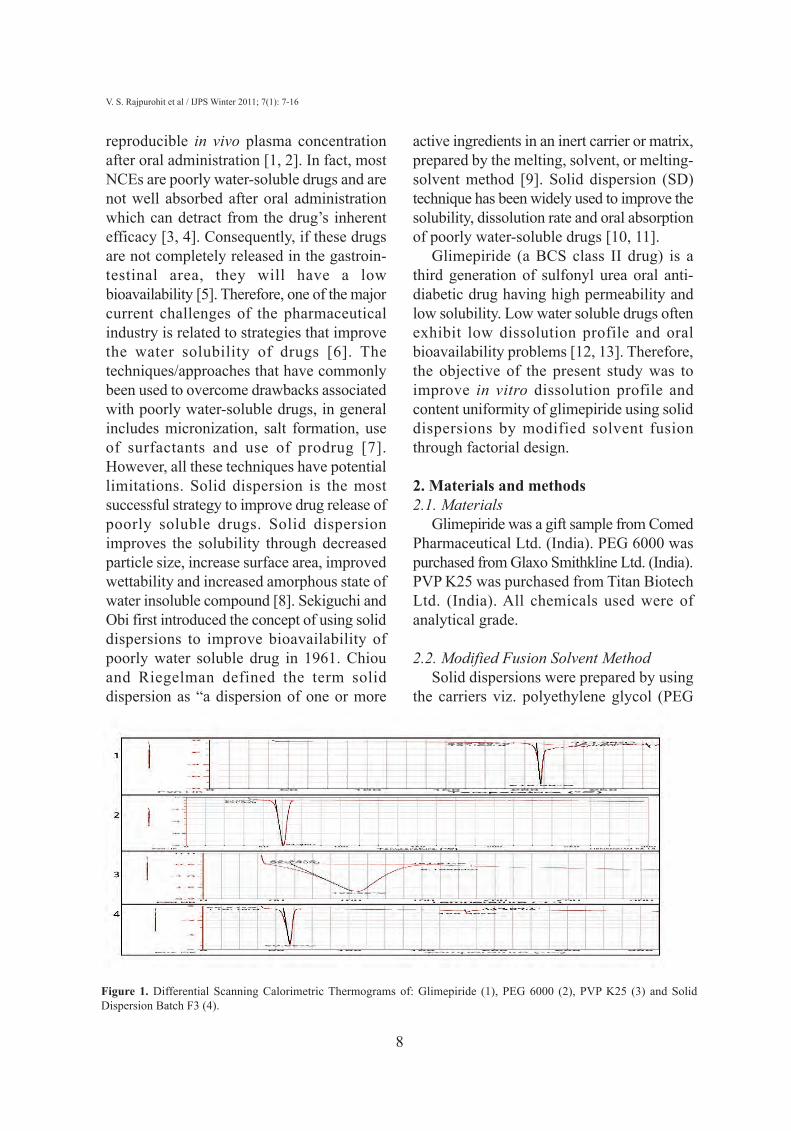
Figure 1. Differential Scanning Calorimetric Thermograms of: Glimepiride (1), PEG 6000 (2), PVP K25 (3) and SolidDispersion Batch F3 (4).
Formulation and characterization of glimepiride
6000) and polyvinyl pyrrolidone (PVP K25)by modified fusion solvent method. PEG6000 was melted over a thermostaticallycontrolled magnetic stirrer at its respectivemelting point and drug was incorporated intothe molten carrier mass. The polyvinylpyrrolidone K25 was dissolved in ethanoland mixed in the mixture of PEG 6000 anddrug. The whole mixture was kept at thecorresponding melting temperature for 10min, followed by flash cooling on an ice bath.The solidified mixture was pulverized in apestle mortar and passed through sieve # 44and stored in desiccator.
2.3. Experimental designSolid dispersion was formulated according
to the (23) factorial design to study the effectof three independent variables on in vitrodissolution profile of glimepiride. To evaluatethree factors at two levels, the factorial designconsisted of eight batches (F1-F8). The threefactors analyzed during the study were, theconcentration of drug (X1), the concentrationof PEG 6000 (X2) and the concentration ofPVP K25 (X3) (Table 1).
9
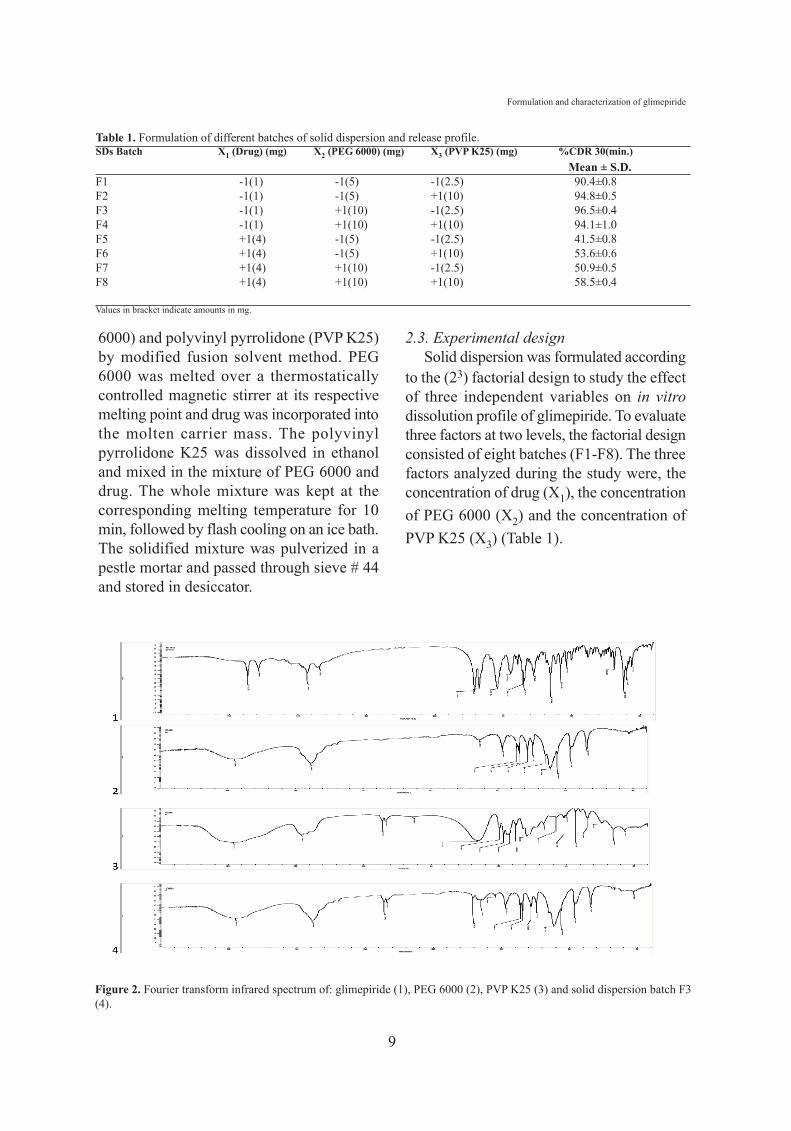
Figure 2. Fourier transform infrared spectrum of: glimepiride (1), PEG 6000 (2), PVP K25 (3) and solid dispersion batch F3(4).
Table 1. Formulation of different batches of solid dispersion and release profile.SDs Batch X1 (Drug) (mg) X2 (PEG 6000) (mg) X3 (PVP K25) (mg) %CDR 30(min.)
Mean ± S.D.F1 -1(1) -1(5) -1(2.5) 90.4±0.8F2 -1(1) -1(5) +1(10) 94.8±0.5F3 -1(1) +1(10) -1(2.5) 96.5±0.4F4 -1(1) +1(10) +1(10) 94.1±1.0F5 +1(4) -1(5) -1(2.5) 41.5±0.8F6 +1(4) -1(5) +1(10) 53.6±0.6F7 +1(4) +1(10) -1(2.5) 50.9±0.5F8 +1(4) +1(10) +1(10) 58.5±0.4
Values in bracket indicate amounts in mg.
V. S. Rajpurohit et al / IJPS Winter 2011; 7(1): 7-16
10
2.4. Differential scanning calorimetryThe melting behavior of the pure drug,
carrier and solid dispersions was evaluated byusing DSC instrument (DSC Q10 V 9.9 Build303). Samples were heated under nitrogenatmosphere on an aluminum pan at a rate of 10°C/min. over the temperature range of 30 to 300 °C.
2.5. Fourier transform infrared spectroscopyInfrared spectra of pure glimepiride, carriers
and solid dispersions was recorded using FTIRspectrometer (Thermo Nicolet 380, USA) toascertain the presence of different functionalgroups. A small amount of the powdered solid(1-2 mg) was added to pure potassium bromidepowder and grounded up as fine as possible.This was then placed in a small die and putunder pressure mechanically to form KBrpellet. Pellet was then scanned in the rangefrom 400 to 4000 cm-1.
2.6. In vitro dissolution studiesDrug release studies were performed in
triplicate using United State PharmacopoeiaType I dissolution test apparatus, employingphosphate buffer (pH 6.8) as dissolutionmedia, at a temperature of 37±0.5 °C and ata speed of 75 rpm. Dissolution studies wereperformed on pure drug (4 mg) and thedifferent solid dispersions containing anequivalent amount of drug. Aliquots of theperiodically withdrawn samples (10 ml) wereanalyzed spectrophotometrically at 226 nmand were replaced with an equal volume ofdissolution medium.
2.7. Powder X-ray diffraction studiesPowder X-ray diffraction pattern of solid
dispersions were traced employing X-raydiffractometer (X’pert-PRO, PAN Analytical),using Ni filtered CuK (α) radiation, a voltageof 45 kV, a current of 20 mA. The samplewas analyzed over 2θ range of 0-50° withscan step size of 0.0170° (2θ) and scan steptime of 20 s.
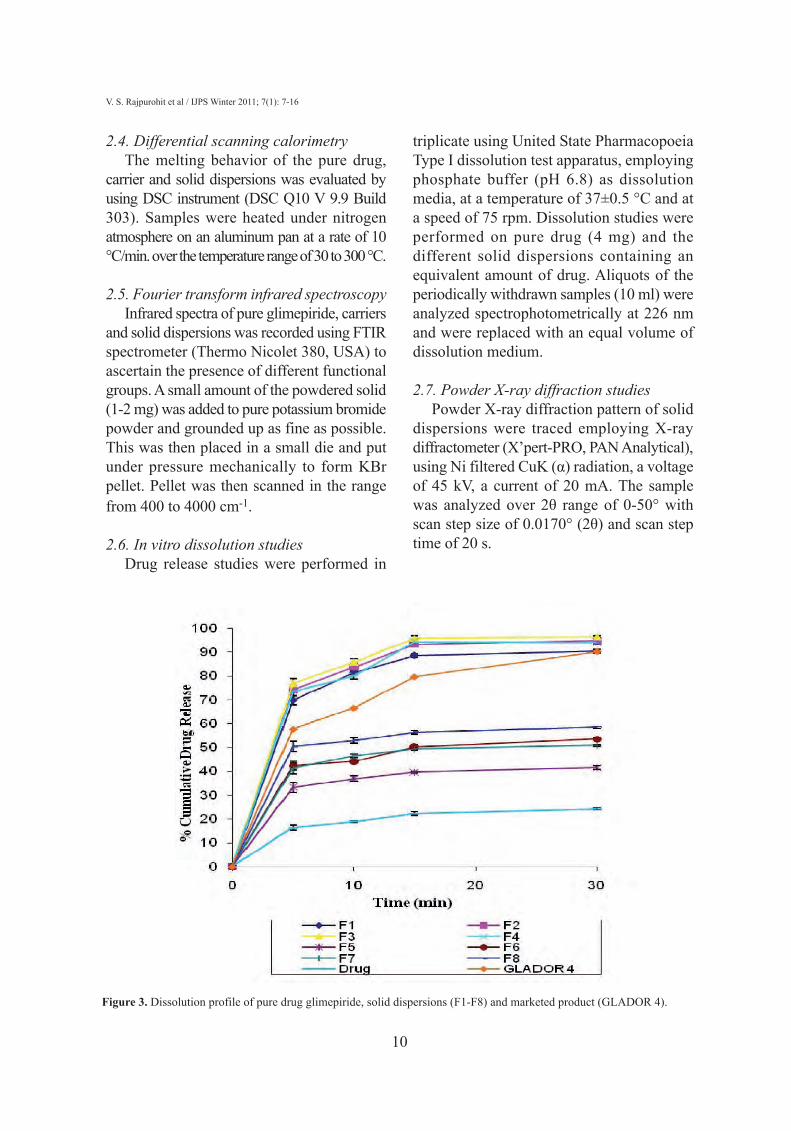
Figure 3. Dissolution profile of pure drug glimepiride, solid dispersions (F1-F8) and marketed product (GLADOR 4).
Formulation and characterization of glimepiride
2.8. Scanning electron microscopySample of pure drug and solid dispersions
were mounted onto the stubs using double-sided adhesive tape and then coated with goldpalladium alloy (150-200 A°) using fine coation sputter (Joel, JPC-1100). The sampleswere subsequently analyzed under thescanning electron microscope for externalmorphology.
2.9. Content uniformitySolid dispersions containing an equivalent
amount of 4 mg of glimepiride was added toa volumetric flask containing methanol. Theflask was shaken for 10 min. and final volumewas made up using buffer of pH 6.8. Thesample was diluted and analyzed spectropho-tometrically at 226 nm.
3. Results and discussion Preliminary studies were carried out to
select the factors affecting formulation ofsolid dispersion. Three factors i.e. amount ofdrug and carriers (PEG 6000 and PVP K25)were studied at two levels (+1 and –1) andeight batches (F1-F8) of solid dispersion wereformulated using (23) factorial design (Table1). All the batches were first subjected toDSC, FTIR and in vitro release studies.
3.1. Differential scanning calorimetryThe DSC curve of glimepiride shows a
sharp endothermic peak at 210.30 °C withenthalpy of fusion 194.2 J/g corresponding toits melting point, indicating its crystallinenature. Similarly, the endothermic peak ofPEG 6000 was found at 63.29 °C withenthalpy of fusion 251.3 J/g and DSC of PVPK25 showed endothermic peak at 106.58 °Cwith enthalpy of fusion 323.4 J/g (Figure 1).Absence of endothermic peak of drug(corresponding to its M. Pt. i.e. 210.30 °C) in
11
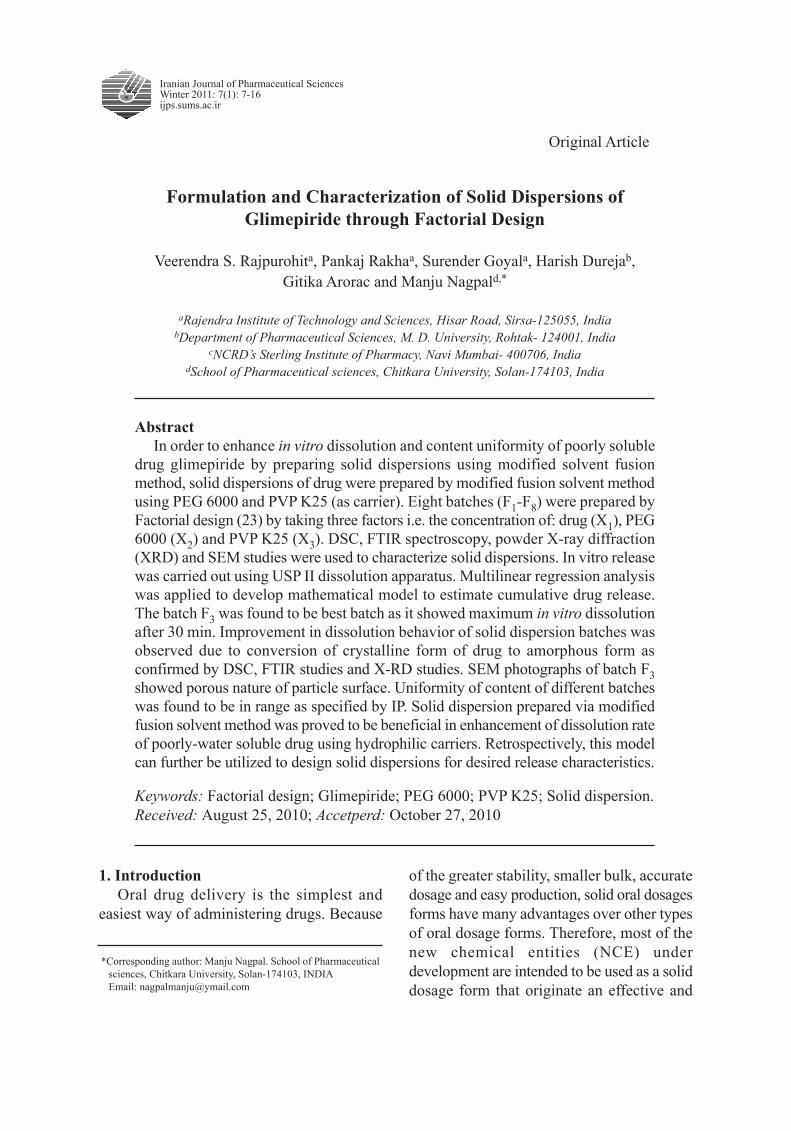
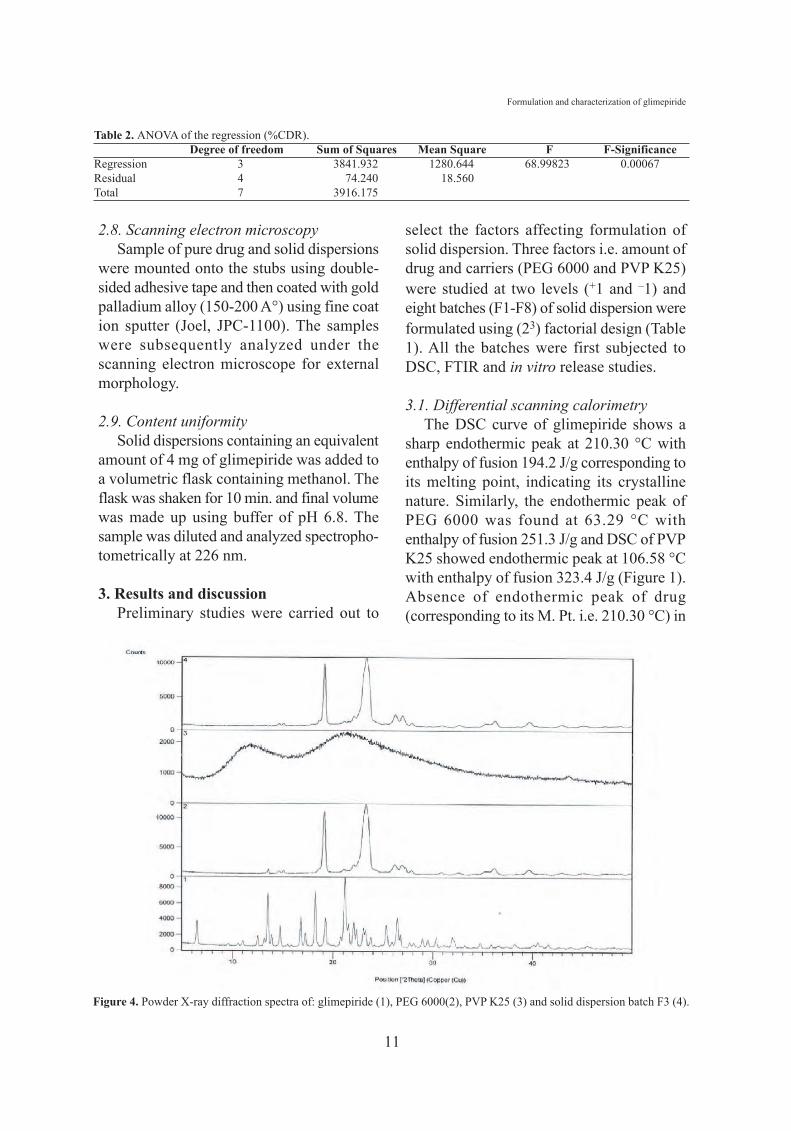
Figure 4. Powder X-ray diffraction spectra of: glimepiride (1), PEG 6000(2), PVP K25 (3) and solid dispersion batch F3 (4).
Table 2. ANOVA of the regression (%CDR).Degree of freedom Sum of Squares Mean Square F F-Significance
Regression 3 3841.932 1280.644 68.99823 0.00067Residual 4 74.240 18.560Total 7 3916.175
V. S. Rajpurohit et al / IJPS Winter 2011; 7(1): 7-16
12
thermograms of batches F1- F8 indicate thatentire drug has been converted to itsamorphous form.
3.2. Fourier transform infrared spectroscopyAn IR spectrum of sample was recorded as
to ascertain the presence of differentfunctional groups. FTIR of pure glimepirideshowed characteristic sharp peaks at 3369cm-1 and 3288 cm-1 due to N-H stretching,1707 cm-1 and 1674 cm-1 due to carbonylgroup, 1345cm-1 showing C-N stretchingvibration, 1153cm-1 showing S=O stretchingvibration [19]. PEG 6000 showed a C-Hstretching at 2886 cm-1 and C-O stretching at1112 cm-1. PVP K25 showed a C-H stretchingat 2955 cm-1 and broad peak due to C=O intertiary amide at 1654 cm-1 (Figure 2). The IRspectrum of different batches (F1-F8) of soliddispersion exhibited significant decrease in theintensity of N-H and S=O stretching vibrationof glimepiride. This is attributed to formationof hydrogen bonds between the primaryamino group of drug and the carbonyl groupof PVP or the backbone oxygen atoms and the
chain end hydroxyl groups of PEG. Theabsence of characteristic peaks of drug (3369cm-1 and 3288 cm-1) in solid dispersionbatches indicates H-bonding between drugand carrier thereby increasing the solubilityleading to enhanced dissolution.
3.3. In vitro dissolutionStudies of in vitro dissolution rates allow
a comparison to be made between pure drug,solid dispersion and marketed product(GLADOR 4). The dissolution profiles ofpure drug, solid dispersion batches (F1-F8)and marketed product (GLADOR 4) areshown in Figure 3. The in vitro dissolutionrates of all solid dispersions were found to bemuch faster than the pure drug. Soliddispersion batch F3 showed highest releaserate out of all and it was compared withmarketed product. The results obtained givean indication of potential immediate releasecharacteristics of solid dispersion. Soliddispersion batch F3 was selected for furtherSEM and X-RD studies owing to the existenceof drug at molecular level as evidenced by
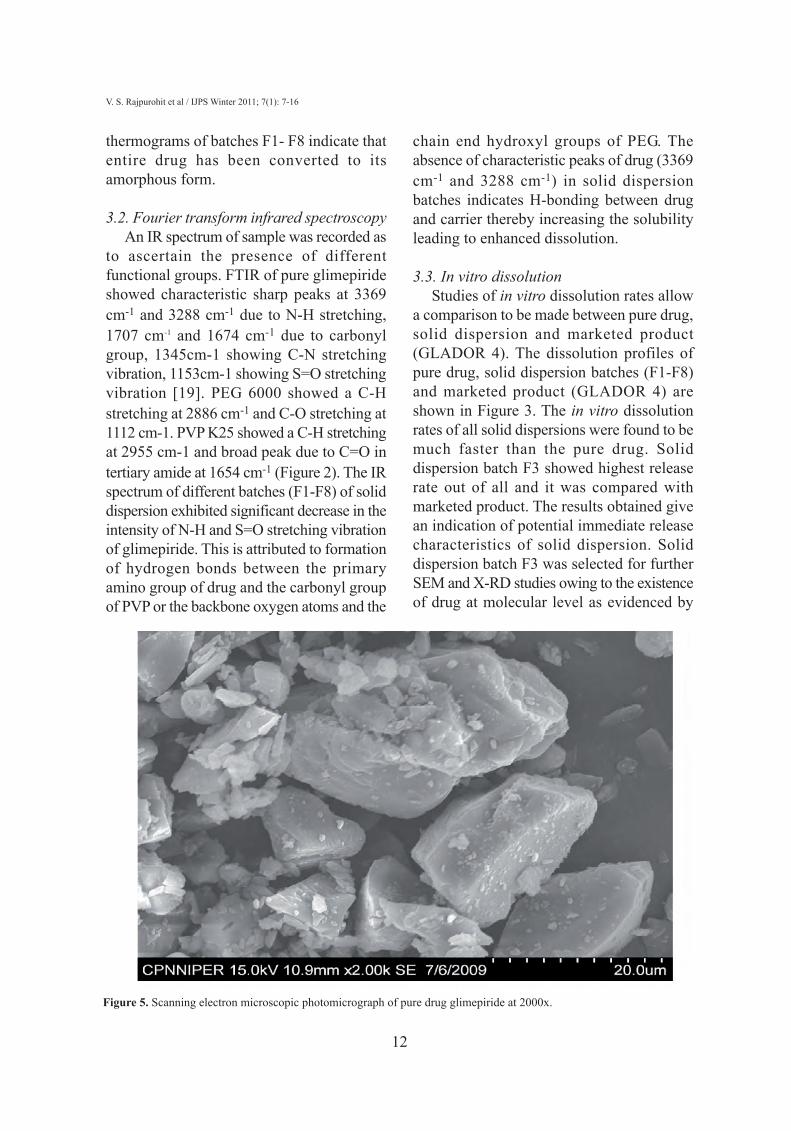
Figure 5. Scanning electron microscopic photomicrograph of pure drug glimepiride at 2000x.
Formulation and characterization of glimepiride
absence of endothermic peak of drug(corresponding to its M. Pt. i.e. 210.30 °C)during DSC studies, absence of characteristicpeak of drug in IR spectrum and maximumcumulative drug release during in vitrodissolution studies.
3.4. Powder X-ray diffraction studiesCrystallinity was further confirmed by
comparing some representative peak heightsin the diffraction of the solid dispersion withthose of the pure drug glimepiride.Glimepiride showed sharp peak of thediffraction angle of 2θ at 13.52, 18.23 and21.18° with peak intensities of 1216.66, 1293and 1667.11, respectively. PEG 6000 showeddistinct peak at 19.18 and 23.27° at 2θ withpeak intensities of 2920.35 and 2649.77,respectively, which is a characteristic of itscrystallinity. PVP K25 showed thecharacteristic peak at 11.18 and 21.38 withintensity of 135.55 and 104.53, respectively(Figure 4).
Diffractrograms of solid dispersion batchF3 showed fewer, broader and less intense
peaks. Lack of characteristic peaks ofglimepiride (13.52, 18.23 and 21.18°)confirms the presence of amorphous form ofdrug (Figure 4).
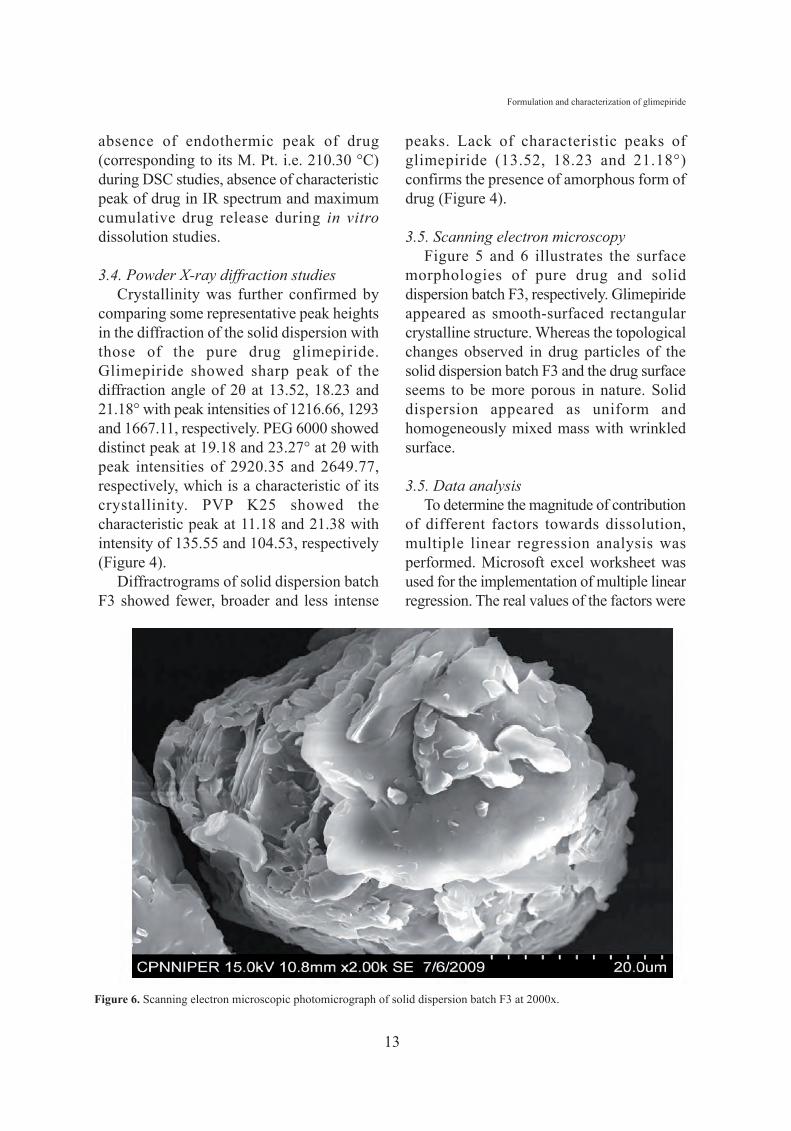
3.5. Scanning electron microscopyFigure 5 and 6 illustrates the surface
morphologies of pure drug and soliddispersion batch F3, respectively. Glimepirideappeared as smooth-surfaced rectangularcrystalline structure. Whereas the topologicalchanges observed in drug particles of thesolid dispersion batch F3 and the drug surfaceseems to be more porous in nature. Soliddispersion appeared as uniform andhomogeneously mixed mass with wrinkledsurface.
3.5. Data analysisTo determine the magnitude of contribution
of different factors towards dissolution,multiple linear regression analysis wasperformed. Microsoft excel worksheet wasused for the implementation of multiple linearregression. The real values of the factors were
13
Figure 6. Scanning electron microscopic photomicrograph of solid dispersion batch F3 at 2000x.
V. S. Rajpurohit et al / IJPS Winter 2011; 7(1): 7-16
14
transformed to facilitate orthogonality ofresults and easy calculations. The model,developed from multiple linear regression,to estimate cumulative drug release (Y) canbe represented mathematically as:
Y= 71–21.6625×X1+2.225×X2+2.455×X3
Where, Y=% Cumulative drug release, X1=Amount ofdrug, X2=Amount of PEG 6000, X3=Amount of PVPK25.
Analysis of variance (ANOVA) wasapplied (Table II) to study the fitting andsignificance of the mathematical model toestimate cumulative drug release. The ratioF=68.993 shows regression to be significant.The estimated model, therefore, may be usedas response surface for cumulative drugrelease.
3.6. Content uniformityAll the solid dispersion batches comply
with uniformity of drug content (97-99%) asspecified in I.P.
4. ConclusionSolid dispersions can be used to improve
the solubility of poorly-water soluble drugs.Modified fusion solvent method was provedto be beneficial in enhancement of dissolutionrate of poorly-water soluble drug glimepirideusing the carriers, PEG 6000 and PVPK25.The improvement in the drug release might bedue to improved wettability of the drugparticles, significant reduction in particle sizeduring the formulation of solid dispersions andto the presence of amorphous form ofglimepiride, as confirmed by DSC, FTIR andXRD studies. Retrospectively, this model canfurther be utilized to design solid dispersionsfor desired release characteristics.
AcknowledgementsThe authors are thankful to Comed
Pharmaceutical Pvt. Ltd., India for providing
the gift sample of glimepiride and PunjabUniversity, Chandigarh for providing X-RDand NIPER, Mohali for DSC and SEMfacilities.
References[1] Youn YS, Stera K. Improved intestinal delivery
of salmon calcitonin by Lys18amine specificPEGylation: stability, permeability, pharmaco-kinetic behavior and in vivo hypocalcemicefficacy. J Control Rel 2006; 114: 334-2.
[2] Sugawara M. The use of an in vitro dissolution andabsorption system to evaluate oral absorption oftwo weak bases in pH-independent controlled-release formulations. Eur J Pharm Sci 2005; 26:1-8.
[3] Drooge DJ. Characterization of the moleculardistribution of drugs in glassy solid dispersions atthe nano-meter scale, using differential scanningcalorimetry and gravimetric water vapour sorptiontechniques. Int J Pharm 2006; 310: 220-9.
[4] Vippagunta SR. Factors affecting the formationof eutectic solid dispersions and their dissolutionbehavior. J Pharm Sci 2006; 96: 294-304.
[5] Streubel A. Drug delivery to the upper smallintestine window using gastroretentivetechnologies. Curr Opin Pharmacol 2006; 6:501-8.
[6] Tanaka N. Development of novel sustained-release system, disintegration-controlled matrixtablet (DCMT) with solid dispersion granules ofnilvadipine (II): in vivo evaluation. J Control Rel2006; 112: 51-6.
[7] Patro S, Himasankar K, Choudhary AA, RaoME. Effect of some hydrophilic polymers ondissolution rate of roxitromycin. Indian J PharmSci 2005; 67: 334-41.
[8] Vasconcalos T, Sarmento B, Costa P. Soliddispersion as strategy to improve oral bioavailabil-ity of poof water soluble drugs. Drug DiscoveryToday 2007; 12: 1068-75.
[9] Chiou WL, Riegelman S. Pharmaceuticalapplications of solid dispersion systems. J PharmSci 1971; 60: 1281-302.
[10] Deepti, Dureja H, Madan AK. Solid dispersionadsorbates for enhancement of dissolution rate ofdrugs. PDA J Pharm Sci Technol 2007; 61: 1-5.
[11] Kiran T, Shastri N, Ramakrishna S, SadanandamM. Surface solid dispersion of glimepiride forenhancement of dissolution rate. Int J PharmTech Res 2009; 1: 822-31.
[12] Mehta A, Vasanti S, Tyagi R, Shukla A.Formulation and evaluation of solid dispersion ofan antidiabetic drug. Curr Trends Biotech Pharm
Formulation and characterization of glimepiride
2009; 3: 76-84.[13] Amidon GL, Lennernas H, Shah VP, Crisen JR.
A theoretical basis for a biopharmaceutics drugclassification: the correlation of in vitro drugproducts dissolution and in vivo bioavailability.Pharm Res 1995; 12: 413-24.
15

V. S. Rajpurohit et al / IJPS Winter 2011; 7(1): 7-16
16


![Challenges to improve the biopharmaceutical …...liquisolid systems [11, 12] and solid dispersions [13, 14]. Large investments in research and development of solid dispersions brought](https://img.pdfslide.net/doc/110x75/5f1087337e708231d4498db3/challenges-to-improve-the-biopharmaceutical-liquisolid-systems-11-12-and.jpg)