Embed Size (px)
Citation preview

FORMULATION OF CARBAMAZEPINE AND SODIUM VALPROATE FIXED
DOSE COMBINATION FOR MANAGEMENT OF EPILEPSY
MMAKGOMO EUNICE SEABI
Dissertation submitted in partial fulfilment of the requirements for the degree of
MASTERS IN PHARMACY
in
PHARMACEUTICS
in the
FACULTY OF HEALTH SCIENCE
(School of Health Care Sciences)
at the
UNIVERSITY OF LIMPOPO
Supervisor: MR MANYAMA TL
Co-supervisors: MR TSHITAKE RM
PROF DEMANA PH
2019

DECLARATION
I, Mmakgomo Seabi, hereby declare that the work on which this study is based is
original, except where acknowledgements indicate otherwise.
This thesis is submitted for the degree Master of Pharmacy (Pharmaceutics) at the
University of Limpopo. Neither the whole work nor any part of it has been submitted
before for any degree or examination at this or any other university.
18 February 2019

This dissertation is dedicated to God Almighty and to my family.
“You don’t choose your family. They are God’s gift to you, as you are to them” Desmond
Tutu
i
TABLE OF CONTENTS
CHAPTER 1: INTRODUCTION ........................................................................................... 1
1.1. INTRODUCTION AND BACKGROUND ................................................................ 1
1.2. PROBLEM STATEMENT ...................................................................................... 3
1.3. RESEARCH QUESTIONS ..................................................................................... 3
1.4. AIM OF THE STUDY ............................................................................................. 3
1.5. OBJECTIVES OF THE STUDY ............................................................................. 3
1.6. IMPORTANCE OR SIGNIFICANCE OF THE STUDY ........................................... 4
1.7. SUMMARY ............................................................................................................ 4
CHAPTER 2: LITERATURE REVIEW ................................................................................. 5
2.1. INTRODUCTION ................................................................................................... 5
2.2. OVERVIEW OF EPILEPSY ................................................................................... 5
2.2.1. Partial seizures ........................................................................................................ 6
2.2.2. Generalized seizures ............................................................................................... 7
2.2.3. Management of epilepsy .......................................................................................... 7 2.2.3.1. Monotherapy in epilepsy ................................................................................... 8 2.2.3.2. Polytherapy in epilepsy ..................................................................................... 9
2.3. FIXED DOSE COMBINATION .................................................................................. 10
2.3.1. Advantages of FDC ............................................................................................... 11
2.3.2. Disadvantages of FDC ........................................................................................... 12
2.3.3. Types of fixed dose combination tablets ................................................................ 12
2.3.4. Multi-layered tablets ............................................................................................... 12
2.3.5. Compression coated tablet .................................................................................... 13
2.3.6. Monolithic fixed dose tablet .................................................................................... 13
2.4. FACTORS TO BE CONSIDERED WHEN DEVELOPING A FDC ............................. 13
2.4.1. Biopharmaceutical classification system ................................................................ 15
2.4.2. Formulation design ................................................................................................ 16
2.5. PHARMACOLOGICAL OVERVIEW OF CARBAMAZEPINE .................................... 18
2.5.1. Physicochemical properties ................................................................................... 18
2.5.2. Clinical pharmacology ............................................................................................ 19
2.5.3. Clinical pharmacokinetics ...................................................................................... 20 2.5.3.1. Absorption ....................................................................................................... 20

ii
2.5.3.2. Distribution ..................................................................................................... 20 2.5.3.3. Metabolism ...................................................................................................... 20 2.5.3.4. Elimination ...................................................................................................... 20
2.6. PHARMACOLOGICAL OVERVIEW OF SODIUM VALPROATE .............................. 21
2.6.1. Physicochemical properties ................................................................................... 21
2.6.2. Clinical pharmacology ............................................................................................ 22
2.6.3. Clinical pharmacokinetics ...................................................................................... 23 2.6.3.1. Absorption ....................................................................................................... 23 2.6.3.2. Distribution ...................................................................................................... 23 2.6.3.3. Metabolism ...................................................................................................... 23 2.6.3.4. Elimination ...................................................................................................... 23
2.7. SUMMARY ............................................................................................................... 24
CHAPTER3: EXPERIMENTAL METHODS, MATERIALS AND APPARATUS .................. 25
3.1. INTRODUCTION ................................................................................................. 25
3.2. STUDY DESIGN .................................................................................................. 25
3.3. PREFORMULATION STUDIES ........................................................................... 26 3.3.1. Evaluation of starting materials and granules ............................................... 26 3.3.1.1. Particle size distribution ............................................................................... 26 3.3.1.2. Angle of repose ............................................................................................ 27 3.3.1.3. Bulk and tapped density ............................................................................... 27 3.3.1.4. Hausner ratio and Carr’s index..................................................................... 28 3.3.2. Simultaneous Thermal Analysis ................................................................... 29 3.3.2.1. Differential Scanning Calorimetry (DSC) ...................................................... 29 3.3.2.2. Fourier Transform Infrared Spectroscopy (FTIR).......................................... 30 3.3.2.3. X-ray Powder Diffraction (XRPD) method .................................................... 31 3.3.2.4. Thermal Activity Monitor (TAM) .................................................................... 31
3.4. FORMULATION STUDIES .................................................................................. 32 3.4.1. Direct compression ...................................................................................... 32 3.4.2. Preparation of wet granulated tablets ........................................................... 32 3.4.3. Mixture preparation of the fixed dose combination ....................................... 33 3.4.3.1. Selection of excipients ................................................................................. 33 3.4.3.2. Fillers ........................................................................................................... 33 3.4.3.3. Lubricants .................................................................................................... 34 3.4.3.4. Disintegrants ................................................................................................ 34 3.4.3.5. Binders ........................................................................................................ 34
3.5. POST FORMULATION STUDIES ........................................................................ 34 3.5.1. Tablet crushing strength, diameter and thickness ........................................ 35 3.5.2. Average weight of the dosage unit ............................................................... 35 3.5.3. Friability test ................................................................................................. 35 3.5.4. Disintegration studies ................................................................................... 35 3.5.5. Assay of tablets ........................................................................................... 36 3.5.5.1. HPLC method development and validation .................................................. 36 3.5.5.1.1. Specificity .................................................................................................... 37 3.5.5.1.2. Linearity ....................................................................................................... 37 3.5.5.1.3. Range .......................................................................................................... 37 3.5.5.1.4. Robustness .................................................................................................. 38

iii
3.5.5.1.5. Accuracy ...................................................................................................... 38 3.5.5.1.6. Precision ...................................................................................................... 38 3.5.6. Dissolution studies ....................................................................................... 39
3.6. DATA ENTRY AND ANALYSIS ........................................................................... 39
3.7. ETHICAL CONSIDERATIONS ............................................................................ 39
3.8. SUMMARY .......................................................................................................... 40
CHAPTER 4: PRE-FORMULATION STUDIES: RESULTS AND DISCUSSION ................ 41
4.1. INTRODUCTION ................................................................................................. 41
4.2. COMPATIBILITY STUDIES ................................................................................. 41 4.2.1. Differential Scanning Calorimetry (DSC) ...................................................... 41 4.2.2. Infrared Spectroscopy (IR) ........................................................................... 48 4.2.3. X-ray Powder Diffraction analysis (XRPD) ................................................... 50 4.2.4. Thermal Activity Monitor (TAM) .................................................................... 52
4.3. POWDER CHARACTERIZATION ....................................................................... 54 4.3.1. Particle size distribution ............................................................................... 54 4.3.2. Angle of repose ............................................................................................ 56 4.3.3. Bulk and tapped density ............................................................................... 56 4.3.4. Hausner ratio and Carr’s index..................................................................... 56
4.4. SUMMARY .......................................................................................................... 57
CHAPTER 5: FORMULATION STUDIES RESULTS AND DISCUSSION .......................... 59
5.1. INTRODUCTION ................................................................................................. 59
5.2.1. Physical strength: Friability and Crushing strength .............................................. 60
5.2.2. Weight variation of the tablets .............................................................................. 62
5.2.3. Disintegration ...................................................................................................... 63
5.3. SUMMARY .......................................................................................................... 65
CHAPTER 6: HPLC METHOD DEVELOPMENT, VALIDATION AND DISSOLUTION ..... 67
6.1. INTRODUCTION ................................................................................................. 67
6.2. HIGH PERFOMANCE LIQUID CHROMATOGRAPHY ........................................ 67
6.2.1. Validation of the HPLC method for carbamazepine and sodium valproate ........... 67 6.2.1.1. Linearity ....................................................................................................... 67 6.2.1.2. Selectivity .................................................................................................... 69 6.2.1.3. Accuracy ...................................................................................................... 70 6.2.1.4. Precision ...................................................................................................... 71 6.2.1.5. Ruggedness (sample stability) ..................................................................... 75 6.2.1.6. Repeatability ................................................................................................ 75
6.3. THE DISSOLUTION PROFILES OF CARBAMAZEPINE AND SODIUM VALPROATE ............................................................................................ 76
6.3.1. Results and discussion ........................................................................................ 76 6.3.1.1. Carbamazepine ........................................................................................... 76

iv
6.3.1.2. Sodium valproate ......................................................................................... 78
6.4. SUMMARY .......................................................................................................... 80
CHAPTER 7: CONCLUSIONS, LIMITATIONS AND RECOMMENDATIONS ................... 81
7.1. INTRODUCTION ................................................................................................. 81
7.2.1. Overview of the content of the dissertation .......................................................... 81
7.2.2. Conclusions ......................................................................................................... 82
7.2.2.1. Preformulation studies ......................................................................................... 82
7.2.2.2. Formulation studies ............................................................................................. 83
7.2.2.3. Post-formulation studies ...................................................................................... 84
7.2.2.4. HPLC method development and validation and dissolution ................................. 85
7.2.3. Limitations ........................................................................................................... 85
7.2.4. Recommendations ............................................................................................... 85
REFERENCES ................................................................................................................... 87
APPENDICES..................................................................................................................... 97
Appendix 1: Particle size distribution data for carbamazepine sample 1 ...................... 97 Appendix 2: Particle size distribution data for carbamazepine sample 2 ...................... 98 Appendix 3: Particle size distribution data for sodium valproate sample 1 .................... 99 Appendix 4: Particle size distribution data for sodium valproate sample 2 .................. 100 Appendix 5: Crushing strength results of formula 1 tablets ......................................... 101 Appendix 6: Crushing strength results of formula 2 tablets ......................................... 102 Appendix 7: Crushing strength results of formula 3 tablets ......................................... 103 Appendix 8: Mass variation results of formula 1 ......................................................... 104 Appendix 9: Mass variation results of formula 2 ......................................................... 105 Appendix 10: Mass variation results of formula 3 ....................................................... 106 Appendix 11: The dissolution data for carbamazepine from the FDC tablet ............... 107 Appendix 12: The dissolution data for sodium valproate from the FDC tablet ............. 108 Appendix 13: Standard deviations of the dissolution data .......................................... 108 Appendix 14: Standard calibration curve of carbamazepine ....................................... 109 Appendix 15: Standard calibration curve of sodium valproate .................................... 110 Appendix 16: PRESENTATION AT THE 3rd FACULTY OF HEALTH SCIENCES ANNUAL RESEARCH CONFERENCE 12th SEPTEMBER to 14 SEPTEMBER 2018 111 Appendix 17: Ethical clearance certificate .................................................................. 112

v
ACKNOWLEDGEMENTS
This study would not have been possible without the guidance, assistance and
encouragement of several people. I would like to extend my gratitude to the following
people.
Mr Tebogo Manyama for his guidance, hard work, patience and contributions
towards ensuring that this study was a success and endurable for me.
Mr Rendani Tshitake and Prof. Patrick Demana for their support, guidance and
contributions.
The North West University, Potchefstroom campus pharmacy department for
allowing me to carry out my studies at their vicinity and to use their facilities in
ensuring that the study is possible.
Prof Wilna Liebenberg for her contributions with DSC and TAM analysis
Prof Josias Hamman, Jan Steenekamp, Neil Barnard for their effortless guidance
in carrying out the experiments
Prof Jan du Preez for his effortless help, guidance and kind hearted contributions
in HPLC
Princess Nkuna for her constant encouragement and guidance in ensuring that I
realise my full potential of enrolling for a masters degree
Chieta bursary and HWseta bursary for funding this study.
Department of Pharmacy University of Limpopo for ensuring that everything
pertaining to the success of this study was possible.
University of Limpopo pharmacy interns for walking this journey with me, and
making it enjoyable, it wouldn’t have been easy.
My parents and siblings for their patience and guidance.
God Our Creator that made it all possible

vi
LIST OF FIGURES
Figure 2.1: Pathogenesis of epilepsy .................................................................................... 6
Figure 2.2: Compatibility check for FDC formulation ........................................................... 14
Figure 2.3: Representation of the biopharmaceutical classification system ......................... 15
Figure 2.3: Chemical structure of carbamazepine ............................................................... 18
Figure 2.4: Chemical structure of sodium valproate ............................................................ 21
Figure 4.1: DTG thermograms of carbamazepine (blue), sodium valproate (red) and
their physical 1:1 mixture (purple) ............................................................. 42
Figure 4.2: DSC thermogram of carbamazepine (red) Ac-Di-Sol® (black) and
carbamazepine-ac-di-sol® mixture (blue) .................................................. 43
Figure 4.3: DSC thermogram of sodium valproate (red) Ac-Di-Sol® (black) and sodium
valproate-ac-di-sol® mixture (blue) ........................................................... 44
Figure 4.4: DSC thermogram of carbamazepine (black) magnesium stearate (blue) and
carbamazepine-magnesium stearate mixture (red) ................................... 45
Figure 4.5: DSC thermogram of sodium valproate (red) magnesium stearate (black)
and sodium valproate-magnesium stearate mixture (blue) ........................ 46
Figure 4.6: DSC thermogram of carbamazepine (black) pharmacel® (blue) and
carbamazepine- pharmacel® mixture (red) ............................................... 47
Figure 4.7: DSC thermogram of sodium valproate (red) pharmacel® (black) and
sodium valproate- pharmacel® mixture (blue) ........................................... 48
Figure 4.8: FTIR spectrum of carbamazepine (blue), sodium valproate (red) and their
physical 1:1 mixture (purple) ..................................................................... 49
Figure 4.9: XRPD diffractogram of carbamazepine ............................................................. 50
Figure 4.10: XRPD diffractogram of sodium valproate ......................................................... 51
Figure 4.11: XRPD diffractogram of carbamazepine/sodium valproate ............................... 52
Figure 4.12: Heat flow graph of carbamazepine in combination with sodium valproate
in a 50:50 weight ratio ............................................................................... 53

vii
Figure 4.13: Heat flow graph of carbamazepine in combination with sodium valproate
in a 50:50 weight ratio ............................................................................... 53
Figure 4.14: Histograms generated from the particle size analysis of carbamazepine
sample (top) and sodium valproate powder (bottom) ................................ 55
Figure 5.1: The intragranular concentration percentage of Ac-Di-Sol® per tablet
against disintegration time ........................................................................ 64
Figure 6.1: The linear regression graph of carbamazepine to determine linearity and
range ........................................................................................................ 68
Figure 6.2: The linear regression graph of sodium valproate to determine linearity and
range ........................................................................................................ 69
Figure 6.3: The dissolution profile of carbamazepine from six FDC tablets ......................... 77
Figure 6.4: The mean percentage of amount of carbamazepine dissolved against time ...... 78
Figure 6.5: The dissolution profile of sodium valproate from six FDC tablets ....................... 79
Figure 6.6: The mean percentage of amount of sodium valproate dissolved against
time ........................................................................................................... 79

viii
LIST OF TABLES
Table 2.1: Summary of seizure types and treatment .................................................... 8
Table 2.2: Comparative efficacy of individual AED combinations .......................................... 9
Table 2.3: Examples representing the rationale for the development of FDC
products .................................................................................................... 11
Table 2.4: Solubility of carbamazepine in different mediums ...................................... 19
Table 2.5: Solubility of sodium valproate in different mediums ................................... 22
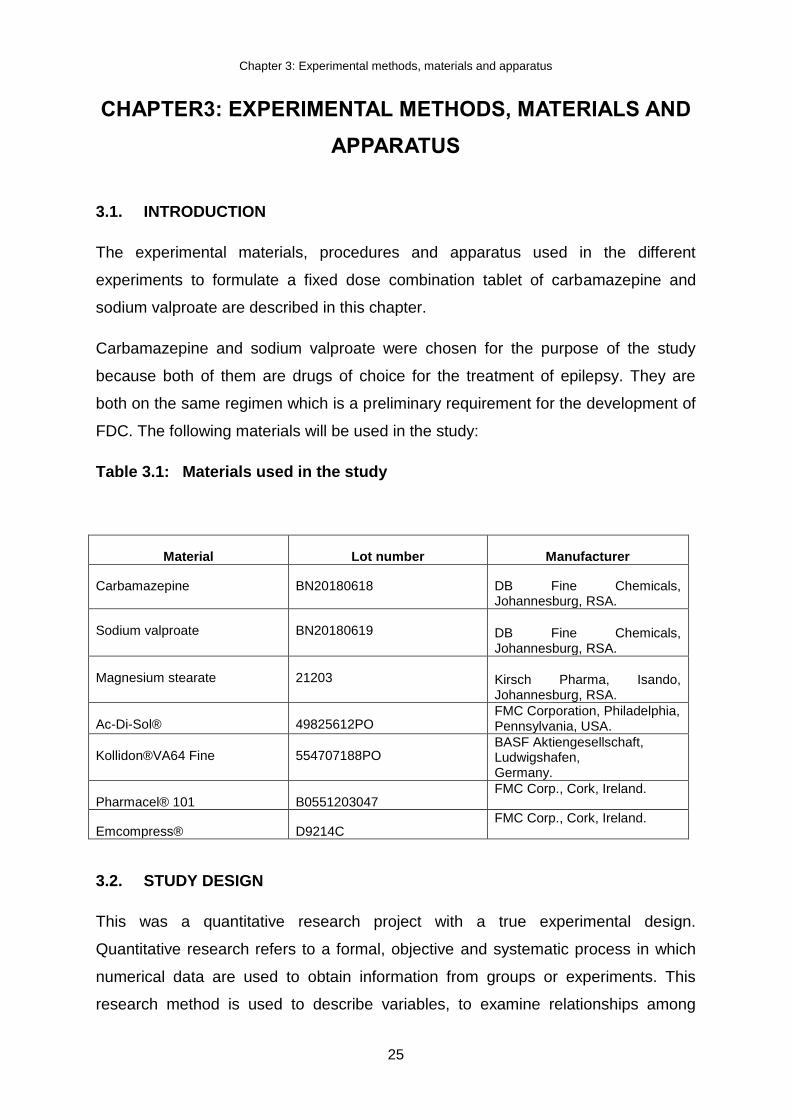
Table 3.1: Materials used in the study ....................................................................... 25
Table 3.2: Flow properties and corresponding angle of repose .................................. 27
Table 3.3: BP scale of flowability for Carr’s compressibility index and the
Hausner ratio ............................................................................................ 29
Table 3.3: Samples of DSC ....................................................................................... 30
Table 3.4: The instrument parameters ....................................................................... 36
Table 4.1: Classification of powder according to its measure of fineness ................... 54
Table 4.2: Particle size distribution parameters of carbamazepine ............................. 55
Table 4.4: Flow parameters of carbamazepine and sodium valproate powder ........... 57
Table 4.5: Summary of powder evaluation parameters .............................................. 57
Table 5.1: Tablet composition of formulation 1 ........................................................... 59
Table 5.2: Tablet composition of formula 2 ................................................................ 60
Table 5.3: Tablet composition of formula 3 ................................................................ 60
Table 5.5: Crushing strength of the tablets .......................................................................... 61
Table 5.6: Percentage friability of the three formulations ..................................................... 61
Table 5.7: Mass variation results of the tablets .......................................................... 62
Table 5.8: British Pharmacopoeia limits for weight variation ..................................... 62

ix
Table 5.9: The ratio of the internal granular disintegrant percentage against the
external percentage Ac-Di-Sol® per tablet mixture against
disintegration time. (Ac-Di-Sol® at 2.00% and 3.00% w/w of total
powder mixture). ....................................................................................... 63
Table 5.10: Summary of the physical properties of the fixed dose combination tablets ....... 65
Table 6.1: Results for carbamazepine to determine accuracy ............................................. 70
Table 6.2: Results for sodium valproate to determine accuracy .......................................... 71
Table 6.3: Results for carbamazepine to determine precision ............................................. 72
Table 6.4: Results for sodium valproate to determine precision .......................................... 73
Table 6.5: Results for carbamazepine to determine intra-day precision .............................. 74
Table 6.6: Results for sodium valproate to determine intraday precision ............................. 74
Table 6.7: 24-hour sample stability results for carbamazepine ............................................ 75
Table 6.8: 24-hour sample stability results for sodium valproate ......................................... 75
Table 6.9: Repeatability results for carbamazepine ............................................................. 76
Table 6.10: Repeatability results for sodium valproate ........................................................ 76
x
ABBREVIATIONS AND ACRONYMS
ADHD Attention Deficit Hyperactivity Disorder
AEDs Antiepileptic Drugs
API Active Pharmaceutical Ingredient
BA Bioavailability
BCS Biopharmaceutical classification system
BP British Pharmacopoeia
cGLP current Good Laboratory Practice
cGMP current Good Manufacturing Practice
CYP 450 Cytochrome P450
DSC Differential Screening Calorimetry
FDA Food and Drug Administration
FDC Fixed Dose Combination
FTIR Fourier transform infrared spectroscopy
GTCS General tonic-clonic seizures
HCV Hepatitis C Virus
ICH International Council for Harmonisation
LOD Limits of detection
LOQ Limits of quantification
PgP P-glycoprotein
QbD Quality by design
SSRI Selective serotonin reuptake inhibitors
TAM Thermal Activity Monitor

xi
TPP Target product profile
TREC Turfloop Research and Ethics Committee
UGT2B7 UDP-Glucuronosyltransferase-2B7
USP United States Pharmacopoeia
Vd Volume of distribution

xii
ABSTRACT
Epilepsy is the fourth most common neurological disorder after migraine, stroke and
Alzheimer’s disease and it affects about fifty million people worldwide. Careful
consideration should be taken when deciding to initiate treatment in epilepsy as it
should consider the balance between the possibility of further seizures and their
associated risks, including the possible risk of sudden expected death,
inconvenience and the risks of taking regular medication for each individual. In the
early 1980’s, the first-line treatment for epilepsy was polytherapy. This was due to
findings that smaller doses of two drugs rather than larger doses of one drug can
achieve synergistic effects or less drug toxicity. However, following more trials on the
treatment of epilepsy, this was later changed to monotherapy as first-line treatment.
Despite the change, patients remain uncontrolled on a single anti-epileptic drug, thus
they are initiated on polytherapy, one such combination being carbamazepine in
combination with sodium valproate. The use of these in combination has
pharmacological threats such as compliance, the control of side effects and the
achievement of synergistic effects. The development of a Fixed Dose Combination
(FDC) has often been used to resolve pharmacological threats, and this study aims
to develop a fixed dose combination tablet of carbamazepine and sodium valproate
to resolve the pharmacological threats in epilepsy.
Samples of carbamazepine and sodium valproate and a physical mixture (1:1 w/w)
of both drugs and excipients were prepared for compatibility with thermal analysis
and spectroscopy techniques. Data was analysed by comparing the DSC curves,
FTIR spectra, XRPD peaks and TAM analysis of carbamazepine and sodium
valproate alone and in their physical mixture (1:1 w/w) and with excipients. Both
carbamazepine and sodium valproate were evaluated for flowability using angle of
repose, tapped and bulk density, compressibility index and particle size distribution.
To formulate the proposed FDC tablet of carbamazepine and sodium valproate,
direct compression and wet granulation methods were employed. The tablets were
then evaluated for official and non-official post formulation parameters (weight
variation, crushing strength, friability, diameter and thickness, and disintegration)
according to BP and USP standards. A standardised HPLC method was developed
and validated for analytical procedures. Dissolution studies were conducted

xiii
according to USP methods to verify and quantify the release of the APIs from the
FDC tablet.
Carbamazepine and sodium valproate were tested for compatibility with excipients
using DSC, FTIR, XRPD and TAM analysis. The overall results confirmed that
carbamazepine and sodium valproate are compatible, with each other and the
excipients used in the study. Powder flow of carbamazepine and sodium valproate
was poor, hence they were subjected to granulation prior to compression to improve
flowability. The specifications of the fixed-dose combination were developed in
accordance with the FDA’s quality by design concept and WHO recommendations.
The tablets were subjected to non-official and official pharmacopoeial tests, and
passed all the tests. Dissolution studies according to a USP method were conducted
to verify and quantify the release of the APIs in the fixed-dose combination. The
initial dissolution rate (DRi) of carbamazepine and sodium valproate in the SLS
dissolution medium was rapid as required for an immediate release formulation.
The study aimed at developing a fixed dose combination of carbamazepine and
sodium valproate to try to reduce the burden of taking more than one tablet for
epilepsy. Based on the results obtained from preformulation studies to assay of the
final product, the study was successful.
Key words: Fixed dose combination, carbamazepine, sodium valproate, epilepsy,
compatibility

Chapter 1: Introduction
1
CHAPTER 1:
INTRODUCTION
1.1. INTRODUCTION AND BACKGROUND
According to Smith and Chadwick (2001), careful consideration should be taken
when deciding to initiate treatment in epilepsy. It should consider the balance
between the possibility of further seizures and their associated risks, including the
possible risk of sudden expected death, inconvenience and the risks of taking
regular medication for each individual.
In the early 1980’s, the first-line treatment for epilepsy was polytherapy. This was
due to findings that smaller doses of two drugs rather than larger doses of one drug
can achieve synergistic effects or less drug toxicity (Lee and Dworetzky, 2010).
However, following more trials on the treatment of epilepsy, this was later changed to
monotherapy as first-line treatment. Despite the change, patients remain
uncontrolled on a single anti-epileptic drug, thus they are initiated on polytherapy
(Lee and Dworetzky, 2010: Rossiter, 2016).
There are a number of available combinations in relation to the type of epilepsy they
treat, one such being carbamazepine and sodium valproate in the management of
focal seizures (Mani, 2013). In a study by Sirmagul, Atli, & Ilgin (2012), a comparitive
study on antiepileptic combination therapy between carbamazepine, sodium
valproate and phenytoin revealed that combinations of carbamazepine and sodium
valproate are better tolerated than carbamazepine/phenytoin and sodium
valproate/phenytoin combiantion therapy. Currently carbamazepine and sodium
valproate are available as single entities. The use of these in combination has
pharmacological threats such as compliance, the control of side effects and the
achievement of synergistic effects (Koo, 2010).
The development of a Fixed Dose Combination (FDC) has often been used to
resolve pharmacological threats (Desai, 2013). The use of fixed dose combination
(FDC) drug products is common in most therapeutic areas. FDC formulations that
are available commercially are oral, parenteral and even inhalations (Albsoul-

Chapter 1: Introduction
2
Younes, et al., 2016). The use of FDC drug therapies provides better safety and
clinical effectiveness, improved patient compliance and convenience, and reduced
treatment cost for patients compared to single drug treatment. Moreover, patients will
adhere more to FDC therapy and eventually achieve improved disease treatment
and management (Moon & Oh, 2016).
The use of FDCs has been widely demonstrated in the treatment of a number of
conditions such as human immunodeficiency virus/acquired immunodeficiency
syndrome (HIV/AIDS), malaria, tuberculosis and psychotic disorders such as
epilepsy. They have advantages when there is a distinguishable patient population
for whom treatment with a particular combination of actives in a fixed ratio of doses
has been shown to be safe and effective. Furthermore, all of the actives contribute to
the overall therapeutic effect as in the case of carbamazepine and sodium valproate
(World Health Organisation, 2005).
One of the major factors in drug formulation to be considered is the
Biopharmaceutics Classification System (BCS). The BCS focusses on aqueous
solubility and intestinal permeability of the Active Pharmaceutical Ingredient (API),
which is classified into four classes (Gouws, 2015; Chavda, et al., 2010):
Class I: High Solubility- High permeability,
Class II: Low Solubility- High permeability,
Class III: High Solubility- Low permeability and
Class IV: Low Solubility- Low permeability
Carbamazepine and sodium valproate are antiepileptic drugs which are often used
together/or as alternates for numerous diseases. Carbamazepine is a class I
antiepileptic and sodium valproate is a class II. They are both used in the treatment
of trigeminal neuralgia, epilepsy, bipolar disorder, neuropathic pain and have been
proved to have therapeutic value in breast, colorectal and prostate cancer (Martin, et
al., 2015; Abou-Khalil, 2017; Buoli, Serati, & Altamura, 2014; Prisco, et al., 2011).
This study explored pharmaceutical parameters which resulted in the formulation of
a FDC containing carbamazepine and sodium valproate. The formulation of this
combination was in line with the development of a FDC where the individual
Chapter 1: Introduction
3
components have been successfully used simultaneously in practice. However, due
to the fact that carbamazepine and sodium valproate affect each other’s metabolism,
blood levels must be monitored regularly (Rossiter, 2016). This will require the
individual doses to be adjusted, thus creating a need for different strengths of the
FDC which will not form part of the study
1.2. PROBLEM STATEMENT
For effective management of epilepsy, antiepileptic drugs are administered for a
lifetime. To date, monotherapy remains the mainstay for the initial treatment of
epilepsy. However, a large number of patients do not respond to the use of a single
antiepileptic drug (Perucca, 2005). This then results in the burden of taking multiple
medications, increased health-care costs and decreased patient compliance,
ultimately increasing the risk of treatment failure (Maher, Hanlom and Hajjar, 2013).
Carbamazepine and sodium valproate is one of the many combinations available in
the management of uncontrollable epilepsies (Perucca, 2005). However, currently
there is no fixed dose combination (FDC) with this combination on the market, which
is necessary to resolve problems associated with the use of multiple drugs in
epilepsy.
1.3. RESEARCH QUESTIONS
Are carbamazepine and sodium valproate compatible with each other?
Which method will be suitable for manufacturing a fixed dose combination tablet
containing carbamazepine and sodium valproate?
1.4. AIM OF THE STUDY
The aim of this study was to formulate a fixed dose combination containing
carbamazepine and sodium valproate.
1.5. OBJECTIVES OF THE STUDY
The objectives of the study were as follows:

Chapter 1: Introduction
4
To determine the compatibility of carbamazepine and sodium valproate.
To identify a suitable method of manufacturing a FDC tablet
To manufacture a fixed dose combination of carbamazepine and sodium
valproate.
1.6. IMPORTANCE OR SIGNIFICANCE OF THE STUDY
Successful development of a fixed dose combination (FDC) formulation of
carbamazepine and sodium valproate will encourage research and development to
pursue interest in this study and research further to establish if it is possible to have
it in the market. With the formulation in the market, patients will have a reduced
therapeutic burden.. This will help health practitioners manage epilepsy by improving
patient’s acceptance and adherence to the medication.
1.7. SUMMARY
This chapter provided a background and rational of the study in detail. It profusely
defined both the research questions and objectives as outlined in this chapter.. The
next chapter, which is the literature review, will provide an extensive review of
combination therapy of carbamazepine and sodium valproate in the management of
epilepsy. Physicochemical profiles of the two drugs are compared to determine
whether they can be formulated as a fixed dose combination.
Chapter 2: Literature review
5
CHAPTER 2:
LITERATURE REVIEW
2.1. INTRODUCTION
In this chapter, the literature provided recent studies related to the current study.
There is an increase in the development of fixed dose combinations in therapeutic
areas such as HIV/AIDS, diabetes and cardiovascular diseases where polytherapy is
a major factor in treatment failure (Koo, 2010). These have led to an interest in
studies of possible FDC in psychotic disorders where polytherapy is becoming a
common practice.
2.2. OVERVIEW OF EPILEPSY
Epileptic seizures normally involve excessive firing and synchronization of neurons.
This interferes with the normal functioning of the part of the brain that is involved,
thus causing symptoms and semiology of epilepsy (Jefferys, 2002).
Initiation and progression of epilepsy involves the glutamatergic molecular
mechanisms (figure 2.1). These include upregulation of glutamate receptors,
elevation of extracellular glutamate concentration, abnormalities in glutamatergic
transporters and autoimmune mechanism. These mechanisms may cause the
excessive glutamatergic activity, which is involved in the hyper-excitability of neurons
and epilepsy (Yin, Ahmad and Makmor-Bakry, 2013).

Chapter 2: Literature review
6
Figure 2.1: Pathogenesis of epilepsy
Source: Yin, Ahmad and Makmor-Bakry (2013).
The National institutes of Health, (2015) classify epilepsy according to the kind of
seizures a patient present with. There are two major categories of seizures, namely:
Partial (also focal) and generalized seizures.
2.2.1. Partial seizures
Generally, partial seizures (also focal seizures) are localized, and may originate from
one hemisphere (Scheffer, Berkovic, Capovilla, Connoly, Guilhoto, Hirsch, Moshe,
Nordli, Zhang and Zuberi, 2012). They may further be subdivided into simple and
complex partial seizures. In simple partial seizures, the affected part is the motor
context causing repeated convulsion of certain muscles. Voluntary control of the
affected parts is lost but the patient remains conscious (Mukhopadhyay, Kandar,
Das, Ghosh and Gupta, 2012). Complex partial seizures are characterized by
impairment of consciousness at onset. The affected part is the temporal lobe and the
seizure remains focused there. This may lead to involuntary muscle contractions,
effects mood and behavior as well as abnormal sensory experiences (Henry, 2012).

Chapter 2: Literature review
7
2.2.2. Generalized seizures
Generalized seizures are also subdivided into myoclonic seizures, absence seizures
(petitmal), clonic seizures, tonic seizures and tonic-clonic seizures (grandmal)
(Mukhopadhyay et alet al., 2012). Myoclonic seizures consist of sudden, short,
muscle contractions that may occur in one limb, more widespread or bilateral. They
are either single jerks or repeated jerks over long period (Dekker, 2002). Absence
seizures are more common in adolescence and childhood. They are characterized
by a brief (seconds) loss of consciousness, during this type of seizure, patients often
stare into space and stand still, hence it is often discovered later (Scotland, 2010).
Tonic clonic seizures involve the combination of tonic and clonic seizures. The tonic
phase includes the stiffening of the body and irregular breathing. The clonic phase
includes jerks and spasms. The patients often make grunting noises, bite their
tongues or cheeks, or suffer incontinence. The jerking may last a couple of minutes
before the patient recovers. After recovery, they may feel tired, sleepy and confused
for some time afterwards (Scotland, 2010).
2.2.3. Management of epilepsy
According Smith and Chadwick (2001) treatment of epilepsy is guided by three
principles, which are:
To minimize risk of acute allergic and dose related toxicity, initiate monotherapy
with caution;
Gradually increase the dose of the drug to maximum allowed dose, given that
seizures continue with the initial dose. If this fails, switch to an alternative drug;
Lastly, having tried both principles (1) and (2) without reducing the seizures,
combination therapy should be introduced.
The management of epilepsy is guided by the type of seizure the patient presents or
is diagnosed with. The four main antiepileptic drugs (AEDs) can effectively manage
the most common type of epilepsy, general tonic-clonic seizures (GTCS), namely:
phenobarbitone, phenytoin, carbamazepine and sodium valproate (Perucca, 2005).
The most commonly used medications being sodium valproate and carbamazepine

Chapter 2: Literature review
8
(Appleton and Cross, 2015). Pharmacological factors influence the choice of drug in
each seizure type according to the efficacy, toxicity and ease of use (Smith and
Chadwick, 2001), as shown in table 2.1 below.
Table 2.1: Summary of seizure types and treatment (Guerreiro, 2008)
Seizure type or epilepsy syndrome
Choice of drugs (according to preference)
Adults with partial-onset seizures
Carbamazepine, phenytoin
Sodium valproate
Gabapentin, lamotrigine, oxcarbazepine, phenobarbitone, topiramate and vigabatrin
Children with partial-onset seizures
Oxcarbazepine
Carbamazepine, phenobarbitone, phenytoin, topiramate and sodium valproate.
Elderly with partial-onset seizures
Gabapentin, lamotrigine
Carbamazepine
Adults with generalized tonic-clonic seizures
Carbamazepine, sodium valproate, phenytoin, phenobarbitone, oxcarbazepine, lamotrigine and topiramate
Children with generalized tonic-clonic epilepsy
Sodium valproate, ethosuxamide and lamotrigine
2.2.3.1. Monotherapy in epilepsy
Research shows that monotherapy has always been mainstay of therapy in epileptic
patients for over years. About 70% of epileptic patients are likely to become seizure
free and go into long-term remission shortly after initiation on a single antiepileptic
drug (Nolan, Sudell, Weston, Tudur Smith, & Marson, 2014). Although monotherapy
is preferable for majority of patients with epilepsy, it favours certain patient
populations (see table 2.1). Monotherapy may be ineffective when the AED choice is
suboptimal for a particular patient type thus raises a need for polytherapy to treat the
seizures effectively (Erik, William, & Thomas, 2009).
Chapter 2: Literature review
9
2.2.3.2. Polytherapy in epilepsy
Combination between antiepileptics in contrast to monotherapy has been found to be
successful in about 30% of patients (Jukka, Maria, Jani, Tapani, Elham, & Anss,
2008). Literature has shown that polytherapy is more effective in patients who failed
on monotherapy for the control of seizures. However, a combination of two or more
antiepileptic drugs can be disadvantageous (Sirmagul, Atli, & Ilgin, 2012). Maher et
al., (2013) mentioned increased health-care costs and decreased patient compliance
to be the most prominent disadvantages of polytherapy. In a study conducted by
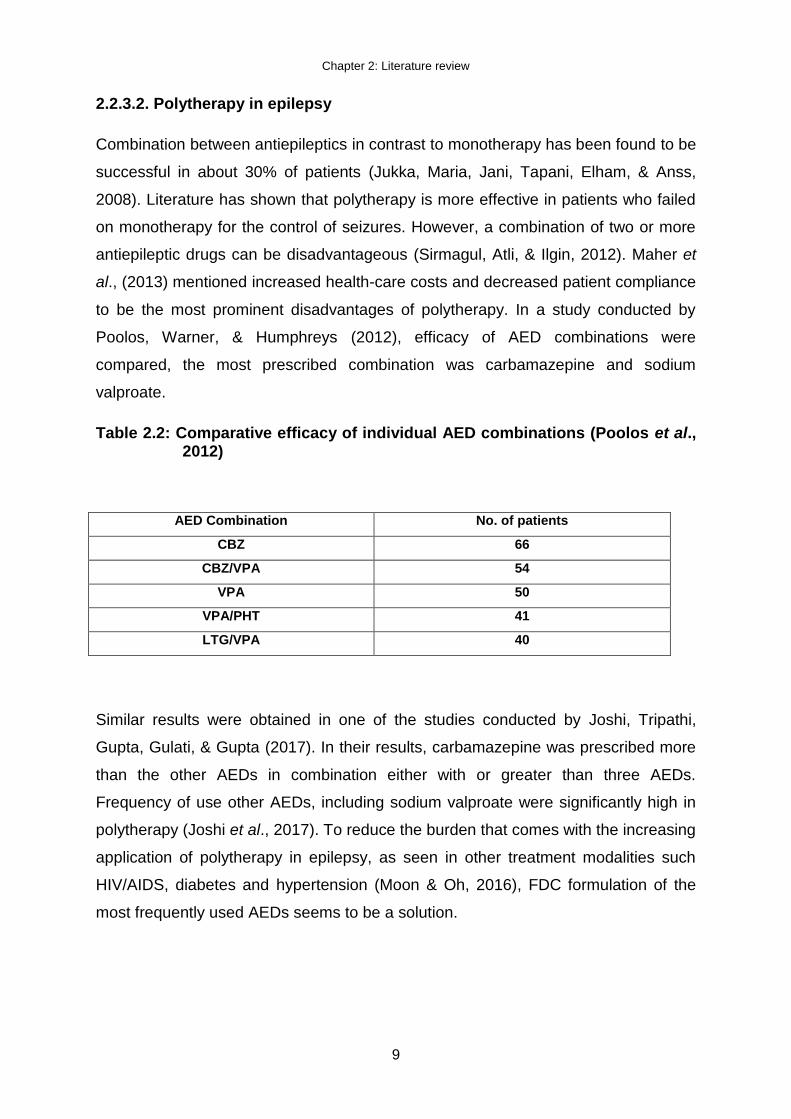
Poolos, Warner, & Humphreys (2012), efficacy of AED combinations were
compared, the most prescribed combination was carbamazepine and sodium
valproate.
Table 2.2: Comparative efficacy of individual AED combinations (Poolos et al., 2012)
AED Combination No. of patients
CBZ 66
CBZ/VPA 54
VPA 50
VPA/PHT 41
LTG/VPA 40
Similar results were obtained in one of the studies conducted by Joshi, Tripathi,
Gupta, Gulati, & Gupta (2017). In their results, carbamazepine was prescribed more
than the other AEDs in combination either with or greater than three AEDs.
Frequency of use other AEDs, including sodium valproate were significantly high in
polytherapy (Joshi et al., 2017). To reduce the burden that comes with the increasing
application of polytherapy in epilepsy, as seen in other treatment modalities such
HIV/AIDS, diabetes and hypertension (Moon & Oh, 2016), FDC formulation of the
most frequently used AEDs seems to be a solution.
Chapter 2: Literature review
10
2.3. FIXED DOSE COMBINATION
Fixed dose combination (FDC) formulation is a combination of two or more active
ingredients with different mechanisms of action into one entity (i.e. tablet). The
development of a FDC product has to take into consideration the safety and efficacy
of final product. The single components should remain effective even when in the
form of a FDC. Although it is not always possible to achieve synergistic effects, it is
important that the formulation not to interfere with the effectiveness of single
components (Modi and Patel, 2011).
Development of a FDC regimen can arise from a number of concepts, which can be
categorized, into 4 (four) (WHO, 2004). A FDC generic product bioequivalent to an
existing FDC, a new FDC developed by combining components that are already well
studied, and the simultaneous use of all the individual active components have been
well characterized safe and effective. The dosage regimen of the components given
individually and the dosage regimen of the FDC are the same. A new FDC product
developed from individual components that are well characterized for safety and
efficacy when used as monotherapy, but the efficacy and safety of their
simultaneous use is not well established or two or more well characterized individual
products are combined using a novel dosage regimen. Finally, a FDC that is
developed by incorporating one or more new molecular entities.
The development of FDC products bases its rationale on potential benefits that are
founded on effective therapeutic principles and validated by clinical evidences.
Therefore, the issue of how to rationalise combination products, either individually or
in combination, with respect to category of therapeutic benefits, class of
pharmacokinetic and pharmacodynamics interaction and type of combination effects
is first discussed (Moon & Oh, 2016). Table 2.3 illustrates examples of FDC products
and the rationale behind their development.

Chapter 2: Literature review
11
Table 2.3: Examples representing the rationale for the development of FDC products (Kota, Ayalavajjala & Sivasubramanian, 2015)
Rationale Example of FDC products
Treatment synergy
(complimentary mechanism of actions)
Short term Treatment (Acute therapy)
Artemether/Lumefantrine (Malaria)
Everolimus/Cyclosporine (Immune suppression)
Long term Treatment (Chronic therapy)
Ramipril/Felodipine (Hypertension)
Atenolol/Amlodipine (Hypertension)
Azidothymidine/Lamivudine/Abacavir/Nevirapine (HIV infection)
Pioglitazone/Metformin (Diabetes)
Metformin/Glipizide (Diabetes)
Bioavailability Enhancement Lopinavir/ritonavir (Lopinavir is a CYP and PgP substrate; Ritonavir inhibits gut CYP and Pgp
resulting in higher oral BA of lopinavir)
Amoxicillin/Clavulenate (Bacterial infection)
Levodopa/Carbidopa/Entacapone(Parkinson’s)
Multiple Indications (co-morbid disease states) Amlodipine/Atorvastatin (Hypertension and Hyperlipidemia)
Diclofenac/Chlorzoxazone (Inflammation and muscle sprain)
Adverse Event Management Ibuprofen/Famotidine (Co administration of proton pump inhibitor to overcome hyperacidity
related side effects of ibuprofen)
Morphine/Methylnaltrexone (To overcome morphine induced constipation by
methylnaltrexone)
2.3.1. Advantages of FDC
The main advantage of FDC is improved patient’s acceptance and adherence to the
medication. A FDC is also more economic and some products can enhance the
effect of the other in the combination as in FDC tablet containing tenofovir,
Chapter 2: Literature review
12
emtricitabine and efavirenz (in HIV) and an FDC tablet containing levodopa,
carbidopa and entacapone (in Parkinson’s disease) respectively (Davies, 2013:
Seeberger and Hauser, 2009). FDC lead to a reduced chance of drug abuse and
multi-dose therapy like in pain medication containing codeine (ibuprofen,
paracetamol and codeine (Seedat, 2008). It provides the ability to treat many
ailments with the same pill and it also reduces the risk of resistance as in cases of
co-trimoxazole (trimethoprim and sulphamethoxazole) and co-amoxiclav (amoxicillin
and clavulanic acid) (Snehal, 2008).
2.3.2. Disadvantages of FDC
Like any other drug, there are disadvantages associated with the use of an FDC
tablet. The main disadvantage is the inability to change the dosing once the
formulation is a particular dose. If side effects occur, it cannot be specifically
identified which drug causes them. In other cases, if the formulation is in a tablet
form, it may be too big for the patient to swallow (Desai, 2013).
2.3.3. Types of fixed dose combination tablets
Types of FDC tablets include multilayer tablets, compression coated tablet and
monolithic FDC tablet. Multi-layered tablets formulators insert an inert layer, which
acts as a barrier between two matrices to prevent interaction. This method is useful
when manufacturing an FDC tablets that contain incompatible matrices (Gupta et al.,
2012). Although high compression force degrades certain actives this method still
enables formulators to formulate two or more drugs with different release patterns,
thereby resolving the issue of instability and incompatibility (Snehal, 2008).
2.3.4. Multi-layered tablets
Incompatible substances can be separated by formulating them in separate layers as
a two-layer tablet or separating the two layers by a third layer of an inert substance
as a barrier between the two. Two-layer tablets may be designed for sustained
release; one layer for immediate release of the drug and the second layer for
extended release, thus maintaining a prolonged blood level. Layers may be coloured
differently to identify the product.

Chapter 2: Literature review
13
2.3.5. Compression coated tablet
Compression coated tablet (tab in tab) is prepared through a dry process in which
the tablet will contain two parts. The first part is the internal core, which is a small
porous tablet; it is then coated with a powder that will form the external tablet. The
more powder added on the internal core the bigger the tablet gets. This results in a
tablet within a tablet (Powar, Jaimini, Chauhan and Sharma, 2014).
2.3.6. Monolithic fixed dose tablet
Monolithic FDC tablet is a tablet composed of active ingredients that have the same
release rate and are compatible with each other. The powders are mixed together
into a single tablet without any layering. For the tablet to remain intact, the distance
between the adjacent molecules of the powder should be greatly reduced in order to
avoid brittleness of the tablet. They should also be mixed in the same base (Powar
et al., 2014). The benefits of monolithic FDC tablet are ease of manufacture and
smaller tablets can be obtained thus making the FDC convenient for the patients
(Koo, 2010).
2.4. FACTORS TO BE CONSIDERED WHEN DEVELOPING A FDC
The formulation of FDCs is dependent on the pharmacodynamics, pharmacokinetics
and chemical and physical compatibility factors to ensure its success.
Pharmacodynamic effects will lead to reduced efficacy or enhanced toxicity of the
FDC. Pharmacokinetic properties may lead to the FDC formulation having peak
efficacy at different time, whereas chemical and physical incompatibility may lead to
a decreased shelf-life of the formulation (Gupta & Ramachandran, 2016). To rule out
pharmacokinetic/pharmacodynamic interactions between the individual components,
it is important to understand the pharmacokinetic and pharmacodynamic properties
of the components of the proposed FDC (Kota, Ayalavajjala, & Sivasubramanian,
2015). In some cases, to enhance therapeutic efficacy, a FDC formulation is
developed based on the pharmacokinetic or pharmacodynamic interaction. An
example of such is either by maximizing the intestinal uptake of the drug or by
protecting the drug from presystemic degradation by combining with inhibitors of
enzyme or efflux transporter to enhance the bioavailability of the drug. This strategy
Chapter 2: Literature review
14
is especially prevalent in HIV and hepatitis C virus (HCV) treatment, where for
example, ritonavir is used as an enzyme inhibitor to enhance the bioavailability of
other anti-retroviral drug
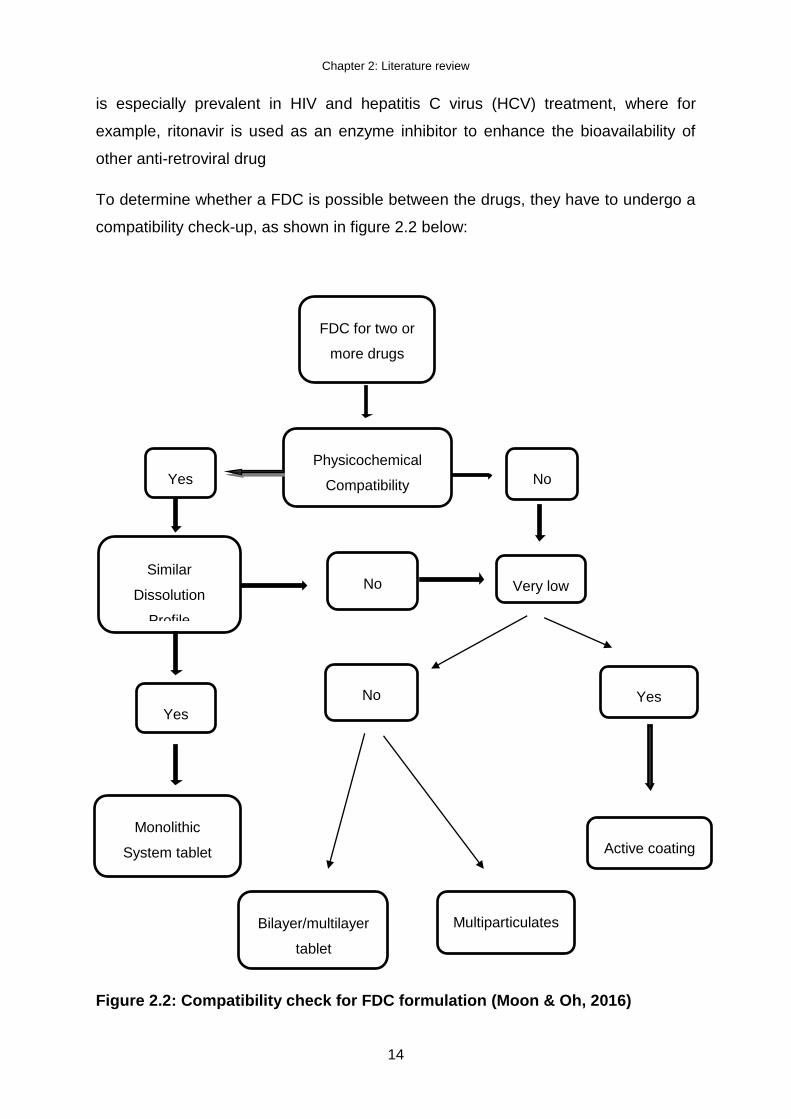
To determine whether a FDC is possible between the drugs, they have to undergo a
compatibility check-up, as shown in figure 2.2 below:
Figure 2.2: Compatibility check for FDC formulation (Moon & Oh, 2016)
FDC for two or
more drugs
Physicochemical
Compatibility
Yes
Similar
Dissolution
Profile
No
Monolithic
System tablet
No
Yes
Very low
No
Yes
Active coating
Bilayer/multilayer
tablet
Multiparticulates

Chapter 2: Literature review
15
2.4.1. Biopharmaceutical classification system
Biopharmaceutical classification system (BCS) correlates the in vitro solubility and
permeability to the in vivo bioavailability (Jouyban, 2010). Although it is simple in
developing formulation and manufacturing process, the suitability of the drugs in
monolithic systems should be thoroughly investigated in terms of this correlation. In
case of FDC drugs where the drugs combined have different absorption mechanisms
such as the combination of BCS Class I and BCS Class II drugs, the dissolution rate
of poor soluble drug, may be decreased in the FDC formulation (Moon & Oh, 2016).
Formulation design can improve absorption of a class II drug to be more like that of a
class I drug, provided that a class II drug can be maintained in a solubilized state in
the lumen of the gut (Pouton, 2006) see figure 2.3.
Figure 2.3: Representation of the biopharmaceutical classification system
Source (Pouton, 2006)
Formulation strategies can do little to improve the absorption of classes I and III
drugs which are limited by poor membrane permeability (Jouyban, 2010).
Carbamazepine and sodium valproate belong to different BCS classes and that
Chapter 2: Literature review
16
makes them both suitable for fixed dose combination formulation. Sodium valproate
belongs to class I, which represents drugs with high solubility and high permeability
and carbamazepine belongs to class II of low soluble but high permeable drugs
(Chan, et al., 2016).
2.4.2. Formulation design
Formulation design is defined as the processes in which different chemical
substances for instance, active chemical substances are combined together to
produce a medical compound (Hassan, 2012). Formulation design incorporates drug
design, which is the process of formulating a new medical product, completely based
on the knowledge of biological target (Hassan, 2012; (Bartlett, et al., 2017). When
developing an FDC dosage form, a quality by design approach is of dire importance
for a robust formulation and manufacturing process. Application of a quality by
design approach is often similar to the single application for a single API formulation,
but the presence of multiple APIs makes the formulation a bit more complicated (Yu,
et al., 2014). The first and most important step is to define the target product profile,
which describes the use, safety and efficacy of the product. Target product profile
(TPP) forms an integral part in the basis of design for the development of the
product. Considerations for inclusion in the TPP could include the following (Zhang &
Mao, 2017):
Intended use in a clinical setting, route of administration, dosage form, and
delivery system(s)
Dosage strength(s)
Container closure system
Therapeutic moiety release or delivery and attribute affecting pharmacokinetic
characteristics (e.g., dissolution and aerodynamic performance) appropriate to
the drug product dosage form being developed
An in depth understanding of the formulation, excipients and process (which
will reduce the amount of experimentation and analytical testing required and
consequently, the manufacturing and testing costs)

Chapter 2: Literature review
17
Drug product quality criteria (e.g., sterility, purity, stability, and drug release)
appropriate for the intended marketed product
Following TPP is to design the formulation and identify the critical quality attributes of
the final product that must be controlled to meet the TPP. It is important to identify
and control critical process parameters to achieve the final products critical quality
attributes (Krishna, et al., 2016). A control strategy is essential during the process of
formulation, from the development stage to commercialization. The control strategy
should include raw material and API controls (for particle size distribution, moisture,
polymorphs and impurities amongst others, process controls (such as hardness,
thickness, friability, tablet weight during compression and others) and design space
around individual or multiple unit operations (such as granulation, compression,
coating, encapsulation and packaging (Haleem, et al., 2015). (Rantanen & Khinast,
2015) Further reiterated that it is significant that the controls are monitored and the
processes are updated to ensure target product profile by quality by design
approach. To achieve successful target product profile quality by design approach, it
is important to use design of experiment and process analytical technology. A quality
by design approach provides the following advantages (Krishna et al., 2016; Zhang
& Mao, 2017):
Negligible chance of batch failure because the batches are manufactured in a
design space defined during product development.
Enhanced understanding of the formulation and manufacturing processes
The development of a robust process that leads to greater regulatory confidence
Continuous improvement in the manufacturing process during development,
validation and post commercialisation in a defined design space doesn’t require
submission to the FDA
Increased product quality improved yields, reduced investigations and testing,
and lower manufacturing costs
Guaranteed therapeutic equivalence of each batch of generics manufactured
A better less expensive, and safer drug product
By using a QbD approach, the researcher can develop safe and effective FDC
formulation of carbamazepine and sodium valproate to optimize the
pharmacokinetics, bioavailability and therapeutic effect of the drugs as single
Chapter 2: Literature review
18
entities. This as mentioned in Chapter 1 will benefit patients, particularly since
epilepsy requires long term management therapies. The drug profiles of
carbamazepine and sodium valproate are discussed below.
2.5. PHARMACOLOGICAL OVERVIEW OF CARBAMAZEPINE
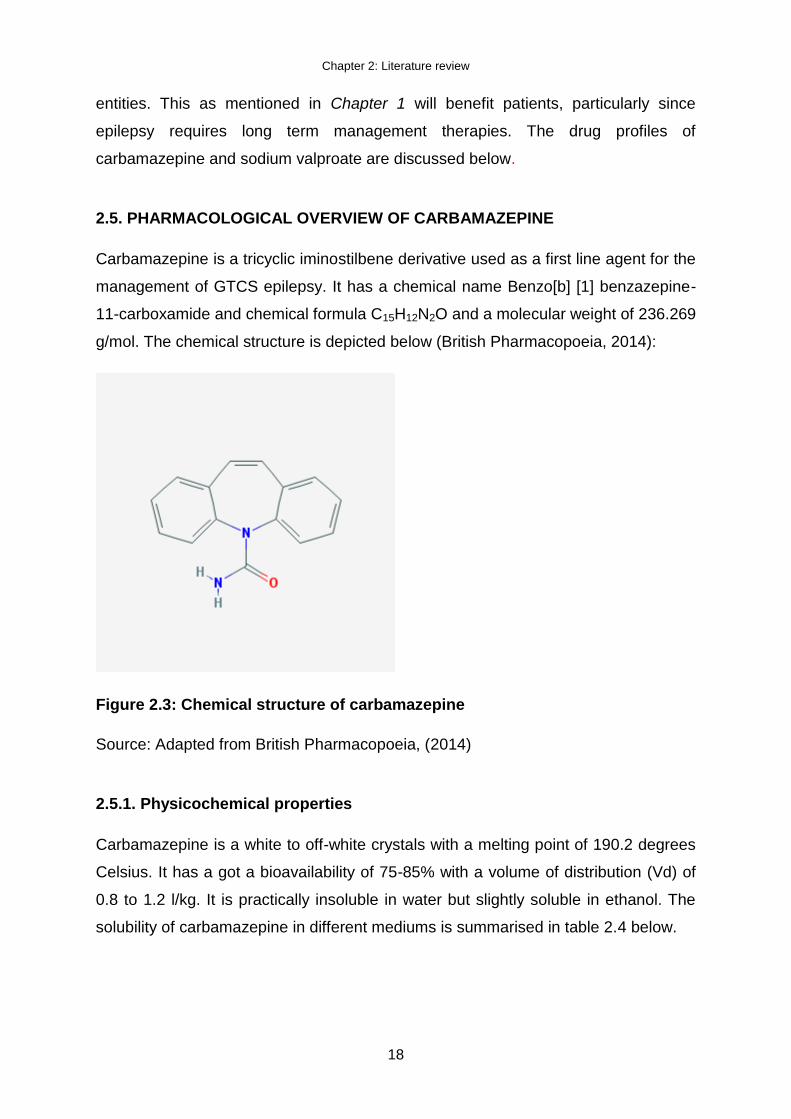
Carbamazepine is a tricyclic iminostilbene derivative used as a first line agent for the
management of GTCS epilepsy. It has a chemical name Benzo[b] [1] benzazepine-
11-carboxamide and chemical formula C15H12N2O and a molecular weight of 236.269
g/mol. The chemical structure is depicted below (British Pharmacopoeia, 2014):
Figure 2.3: Chemical structure of carbamazepine
Source: Adapted from British Pharmacopoeia, (2014)
2.5.1. Physicochemical properties
Carbamazepine is a white to off-white crystals with a melting point of 190.2 degrees
Celsius. It has a got a bioavailability of 75-85% with a volume of distribution (Vd) of
0.8 to 1.2 l/kg. It is practically insoluble in water but slightly soluble in ethanol. The
solubility of carbamazepine in different mediums is summarised in table 2.4 below.

Chapter 2: Literature review
19
Table 2.4: Solubility of carbamazepine in different mediums (Pubchem, 2005)
2.5.
2. Clinical pharmacology
According to Ambrósio, Soares-da-Silva, Carvalho and Carvalho, (2002)
carbamazepine may interact with different types of channels and receptors but the
main targets are voltage-dependent sodium channels. It reduces the occurrence of
sustained repetitive firing of action potentials in cultured mammalian central neurons.
It is now considered to be the drug of choice for the treatment of partial and tonic-
clonic seizures (Brunton et al., 2011). It can also be used in the management of
attention deficit hyperactivity disorder (ADHD), schizophrenia and post-traumatic
stress disorder as a mood-stabilizing agent, as well as phantom limb syndrome,
complex regional pain syndrome, paroxysmal extreme pain disorder and
neuromyotonia disorder (Tolou-Ghamari, Zare, Habibabadi and Najafi, 2013).
The common side effects of carbamazepine are sedation, dry mouth, dizziness,
ataxia, and gastrointestinal effects. Carbamazepine interacts with other
anticonvulsants, antiretroviral drugs, cimetidine, dextropropoxyphene, erythromycin
and other macrolides, SSRIs, verapamil, diltiazem, isoniazid, lithium, monoamine
oxidase inhibitors, oral contraceptives, corticosteroids, doxycycline, midazolam,
neuroleptics, theophylline, tricyclic antidepressants and warfarin. The use of
carbamazepine is contraindicated in patients suffering from Antrioventricular heart
block, history of bone marrow depression, and porphyria (Rossiter, 2016).
Solubility medium Solubility
Acetone Soluble
Propylene glycol Soluble
Water Practically insoluble
Chloroform Soluble
Dimethylformamide Soluble
Methanol Soluble
Ethanol Slightly soluble
Glacial acetic acid Slightly soluble

Chapter 2: Literature review
20
2.5.3. Clinical pharmacokinetics
2.5.3.1. Absorption
Although the rate of absorption of carbamazepine varies extensively among patients,
almost complete absorption occurs in all. Following administration, peak levels are
usually achieved after 6–8 hours. Giving the drug after meals slows absorption;
however, it helps the patient tolerate larger total daily doses (Katzung, Masters and
Trevor, 2010).
2.5.3.2. Distribution
Carbamazepine binds to serum proteins at an extent of 70-80%. The concentration
of unchanged substance in the saliva reflects the non-protein-bound portion present
in the serum (20-30%) (Product monograph: Tegretol®, 2014). Carbamazepine has a
large volume of distribution (Vd), projected to be 1 to 2 L/kg (Islam, Al Aidarous, Jan
and Dehlawi, 2013).
2.5.3.3. Metabolism
The main pathway of carbamazepine metabolism in humans involves conversion to
its active metabolite carbamazepine-10, 11 epoxide. This metabolite is as active as
the parent compound. It is further metabolized primarily into inactive compounds
such as carbamazepine 10, 11-transdiol, 9-hydroxymethyl-10-carbamoyl-acridan,
various monohydroxylated compounds and the N-glucuronide of carbamazepine
produced by UDP-Glucuronosyltransferase-2B7 (UGT2B7). CYP3A4 is primarily
responsible for the biotransformation of carbamazepine (Brunton et al., 2011).
2.5.3.4. Elimination
Whether administered as a single or in repeated doses, only 2-3% of carbamazepine
is excreted in the urine in an unchanged form. Approximately 30% of carbamazepine
is renally eliminated via the carbamazepine-10, 11-epoxide pathway with
carbamazepine 10, 11 -trans-diol as the main urinary metabolite (Islam et al., 2013).

Chapter 2: Literature review
21
2.6. PHARMACOLOGICAL OVERVIEW OF SODIUM VALPROATE
It is a synthetic derivative of 2-propylpentanoic acid with antiepileptic properties and
potential antineoplastic and antiangiogenesis activities. It has a molecular formula of
C8H15NaO2 and a molecular weight of 166.196 g/mol (Pubchem, 2005). Its chemical
structure is depicted in figure 2.4 below
Figure 2.4: Chemical structure of sodium valproate
Source: Adapted from British Pharmacopoeia (2014)
2.6.1. Physicochemical properties
Sodium valproate is a colourless crystal with a melting point of 219.5 degrees
Celsius. It has almost similar solubility properties as carbamazepine with slightly
better solubility properties. The solubility of sodium valproate in different mediums is
summarised in table 2.5 below.
Chapter 2: Literature review
22
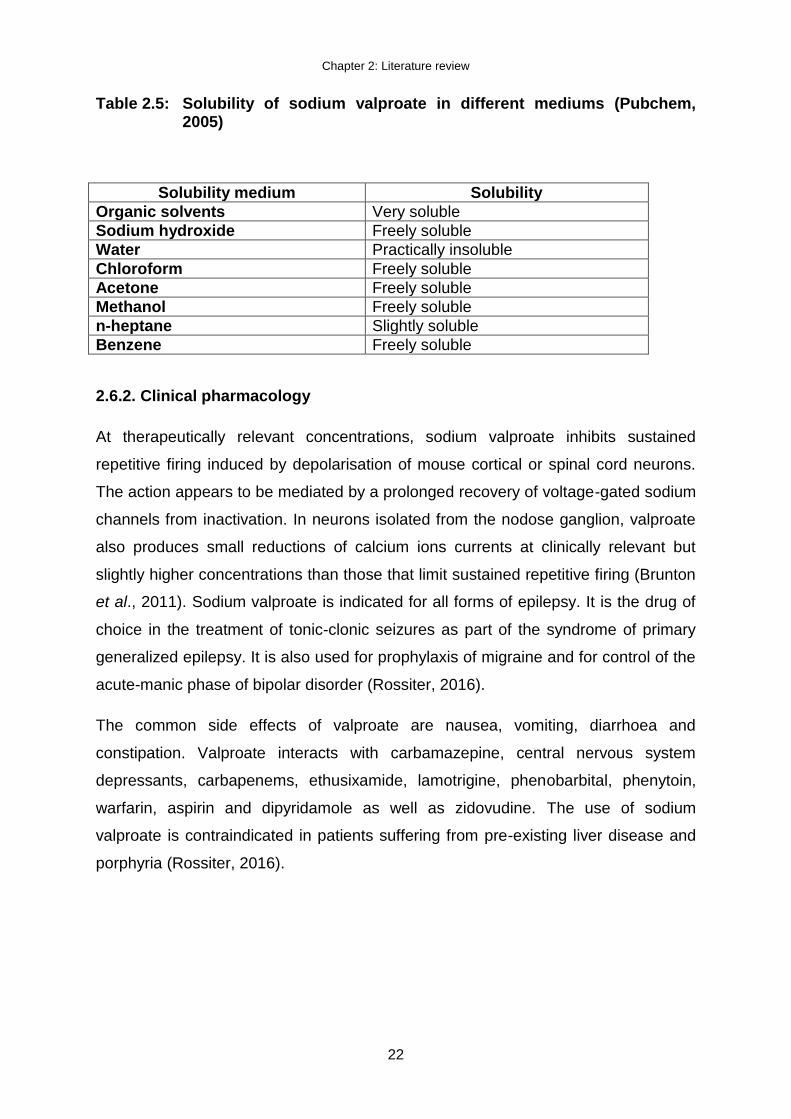
Table 2.5: Solubility of sodium valproate in different mediums (Pubchem, 2005)
Solubility medium Solubility
Organic solvents Very soluble
Sodium hydroxide Freely soluble
Water Practically insoluble
Chloroform Freely soluble
Acetone Freely soluble
Methanol Freely soluble
n-heptane Slightly soluble
Benzene Freely soluble
2.6.2. Clinical pharmacology
At therapeutically relevant concentrations, sodium valproate inhibits sustained
repetitive firing induced by depolarisation of mouse cortical or spinal cord neurons.
The action appears to be mediated by a prolonged recovery of voltage-gated sodium
channels from inactivation. In neurons isolated from the nodose ganglion, valproate
also produces small reductions of calcium ions currents at clinically relevant but
slightly higher concentrations than those that limit sustained repetitive firing (Brunton
et al., 2011). Sodium valproate is indicated for all forms of epilepsy. It is the drug of
choice in the treatment of tonic-clonic seizures as part of the syndrome of primary
generalized epilepsy. It is also used for prophylaxis of migraine and for control of the
acute-manic phase of bipolar disorder (Rossiter, 2016).
The common side effects of valproate are nausea, vomiting, diarrhoea and
constipation. Valproate interacts with carbamazepine, central nervous system
depressants, carbapenems, ethusixamide, lamotrigine, phenobarbital, phenytoin,
warfarin, aspirin and dipyridamole as well as zidovudine. The use of sodium
valproate is contraindicated in patients suffering from pre-existing liver disease and
porphyria (Rossiter, 2016).
Chapter 2: Literature review
23
2.6.3. Clinical pharmacokinetics
2.6.3.1. Absorption
Following oral use, sodium valproate is well-absorbed and 80% bioavailable. Peak
blood levels occur within 2 hours. Absorption may be delayed by food and if the drug
is given after meals, toxicity may be decreased. However, this does not affect the
extent of absorption (Katzung et al., 2010).
2.6.3.2. Distribution
The apparent volume of distribution of sodium valproate is relatively slow
(approximately 0.15- 0.21/kg). Extravascular distribution is limited by its high binding
affinity for plasma albumin. Sodium valproate has a half-life ranging between 8-20
hours. It is usually shorter in children. It is approximately 90% bound to plasma
proteins but only 60% to albumin. Distribution of sodium valproate is rapid and most
possibly limited to the circulation and rapidly exchangeable extracellular water.
Cerebrospinal fluid and breast milk levels were found to be 5 to 15% and about 1 to
10% of plasma levels, respectively (Loscher, 1999).
2.6.3.3. Metabolism
Sodium valproate’s metabolism is complex; the major elimination pathway is by
glucuronidation (40-60%). The remainder is largely metabolised via oxidation
pathways, β-oxidation accounting for 30-40% and the remaining fraction being w-
oxidation (cytochrome P450 dependent). Only 1 to 3% of the ingested dose is found
to be excreted unchanged in the urine (Brunton et al., 2011).
2.6.3.4. Elimination
Sodium valproate is almost completely metabolised prior to excretion. Plasma half-
life is variable but generally appears to be 8 to 12 hours (range 3.84 to 15.77 hours).
It may be shorter in patients receiving other anticonvulsants or in children and
patients receiving the medicine for long periods. In cases of overdose, plasma half-
life up to 30 hours has been reported (Loscher, 1999).

Chapter 2: Literature review
24
2.7. SUMMARY
This chapter provided the overview and management of epilepsy. The literature on
the use of carbamazepine and sodium valproate individually and in combination
provided significance for the formulation of the two drugs into a fixed dose
combination tablet. This was reiterated by checking the pharmacological aspects and
pharmacokinetic data which was found in existing data. The next chapter, which is
experimental methods, will provide the methods, materials and apparatus used to
formulate the fixed dose combination tablet of carbamazepine and sodium valproate
Chapter 3: Experimental methods, materials and apparatus
25
CHAPTER3: EXPERIMENTAL METHODS, MATERIALS AND
APPARATUS
3.1. INTRODUCTION
The experimental materials, procedures and apparatus used in the different
experiments to formulate a fixed dose combination tablet of carbamazepine and
sodium valproate are described in this chapter.
Carbamazepine and sodium valproate were chosen for the purpose of the study
because both of them are drugs of choice for the treatment of epilepsy. They are
both on the same regimen which is a preliminary requirement for the development of
FDC. The following materials will be used in the study:
Table 3.1: Materials used in the study
Material Lot number Manufacturer
Carbamazepine BN20180618 DB Fine Chemicals, Johannesburg, RSA.
Sodium valproate BN20180619 DB Fine Chemicals, Johannesburg, RSA.
Magnesium stearate 21203 Kirsch Pharma, Isando, Johannesburg, RSA.
Ac-Di-Sol® 49825612PO FMC Corporation, Philadelphia, Pennsylvania, USA.
Kollidon®VA64 Fine 554707188PO BASF Aktiengesellschaft, Ludwigshafen, Germany.
Pharmacel® 101 B0551203047 FMC Corp., Cork, Ireland.
Emcompress® D9214C FMC Corp., Cork, Ireland.
3.2. STUDY DESIGN
This was a quantitative research project with a true experimental design.
Quantitative research refers to a formal, objective and systematic process in which
numerical data are used to obtain information from groups or experiments. This
research method is used to describe variables, to examine relationships among

Chapter 3: Experimental methods, materials and apparatus
26
variables and to determine cause-and-effect interactions between variables (Brink,
van Rensburg and van der Walt, 2012). When using a true experimental design, the
researcher will have to a control group and an experimental group. The controls that
were used in this study were pure carbamazepine and sodium valproate, which were
positive controls as they are the active pharmaceutical ingredients in this study.
3.3. PREFORMULATION STUDIES
The most important thing when handling a drug is powder flow and compatibility
between the drugs and the excipients. There are number of methods existing that
can be used to evaluate powder flow and compatibility and some of them were
chosen and used for this study. They are extensively explained and the methods
used are outlined below.
3.3.1. Evaluation of starting materials and granules
The starting materials and granules were evaluated for pre-compression parameters
such as angle of repose, bulk density, tapped density and Carr’s index
3.3.1.1. Particle size distribution
Particle size analysis of the powders and granules were conducted by means of
laser diffraction, using a Malvern® Mastersizer 2000 (Malvern Instruments Ltd.,
Worcestershire, UK), fitted with a sample suspension unit. The dispersion unit
contained water and cyclohexane during the particle size distribution measurements
of carbamazepine and sodium valproate respectively.
The calculation of the span of a powder sample is made to determine its particle size
distribution. The span gives an indication of the width of the distribution based on the
10th, 50th and 90th percentile. The span can be calculated by using the following
equation (Malvern Instruments Ltd, 2012):
Equation 3.1

Chapter 3: Experimental methods, materials and apparatus
27
3.3.1.2. Angle of repose
Angle of repose is a characteristic related to inter particulate cohesion between the
particles, which was used as an indirect method to quantify the flow properties of
powders (Aulton, 2007). Static angle of repose was determined according to the
fixed funnel and freestanding cone method whereby the powder was accurately
weighed and carefully poured though the funnel with its tip 2 cm high, until the apex
of the conical heap formed reach the tip of the funnel. The angle of repose (θ) was
calculated using equation 3.2:
Equation 3.2
where H is the height of the tip of the funnel and R is the radius of the base of the
powder cone.
Table 3.2: Flow properties and corresponding angle of repose (British Pharmacopoeia, 2014)
Flow properties Angle of repose
Excellent 25-30
Good 31-35
Fair 36-40
Passable 41-45
Poor 46-55
Very poor 56-65
Poorest >66
3.3.1.3. Bulk and tapped density
A known quantity of each sample (25 g) was weighed on a Precisa® analytical
balance (model 240A, OERLIKON AG, Zurich) and poured through a funnel into a
100 ml graduated cylinder. The cylinder was then lightly tapped twice to collect all
the powder sticking on the wall of the cylinder. The volume was then read directly
from the cylinder and used to calculate the bulk density. For tapped density, the

Chapter 3: Experimental methods, materials and apparatus
28
cylinder was tapped from a height of 15 cm, 50 times on a wooden bench top to
attain a constant volume reading from the cylinder. The bulk density was calculated
using equation 3.3
Equation 3.3
Equation 3.4 was used to calculate the tapped density
Equation 3.4
3.3.1.4. Hausner ratio and Carr’s index
Carr’s index and the Hausner ratio previewed the degree of densification, which
could occur during tableting. The Carr's index was calculated using 3.5:
Equation 3.5
The Hausner ratio was calculated using equation 3.6
Equation 3.6

Chapter 3: Experimental methods, materials and apparatus
29
Table 3.3: BP scale of flowability for Carr’s compressibility index and the Hausner ratio (British Pharmacopoeia, 2014)
Flow character Carr’s compressibility index (%)
Hausner ratio
Excellent ≤10 1.00 – 1.11
Good 11 – 15 1.12 – 1.18
Fair 16 – 20 1.19 – 1.25
Passable 21 – 25 1.26 – 1.34
Poor 26 – 31 1.35 – 1.45
Very poor 32 – 37 1.46 – 1.59
Very, very poor ≥38 ≥1.60
3.3.2. Simultaneous Thermal Analysis
The starting materials were evaluated for physico-chemical compatibility using
Differential Scanning Calorimetry (DSC) in combination with Thermogravimetric
Analysis (TGA), Fourier Transform Infrared Spectroscopy (FTIR), X-ray Powder
Diffraction (XRPD) and Thermal Activity Monitor (TAM) method.
3.3.2.1. Differential Scanning Calorimetry (DSC)
A DTG simultaneously measures the mass loss (TGA) and heat flow (DSC) of a
sample during the heating process. With this combined technique, information about
the mass loss, melting point, glass transition, solid-state transformation(s), loss of
solvents and degradation of a sample can be obtained (Brown, 2001).
A Mettler DTG 3+ (Mettler Toledo, Greifensee, Switzerland) was used to record the
DSC and TGA thermograms. DTG was used to investigate the physicochemical
compatibilities and solid interaction of carbamazepine and sodium valproate and the
excipients. Powder samples weighing approximately 5-8 mg were placed in open
aluminium crimp cells (100 µl) and heated to an end temperature dependant on the
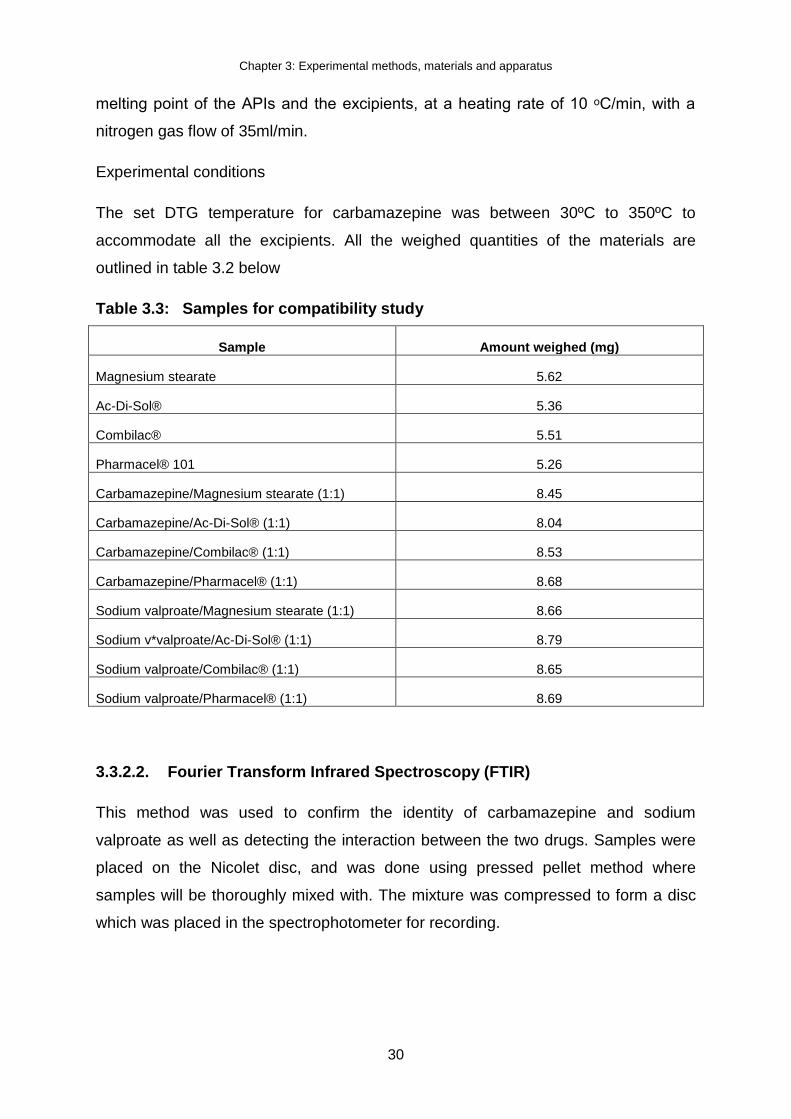
Chapter 3: Experimental methods, materials and apparatus
30
melting point of the APIs and the excipients, at a heating rate of 10 ᵒC/min, with a
nitrogen gas flow of 35ml/min.
Experimental conditions
The set DTG temperature for carbamazepine was between 30ºC to 350ºC to
accommodate all the excipients. All the weighed quantities of the materials are
outlined in table 3.2 below
Table 3.3: Samples for compatibility study
Sample Amount weighed (mg)
Magnesium stearate 5.62
Ac-Di-Sol® 5.36
Combilac® 5.51
Pharmacel® 101 5.26
Carbamazepine/Magnesium stearate (1:1) 8.45
Carbamazepine/Ac-Di-Sol® (1:1) 8.04
Carbamazepine/Combilac® (1:1) 8.53
Carbamazepine/Pharmacel® (1:1) 8.68
Sodium valproate/Magnesium stearate (1:1) 8.66
Sodium v*valproate/Ac-Di-Sol® (1:1) 8.79
Sodium valproate/Combilac® (1:1) 8.65
Sodium valproate/Pharmacel® (1:1) 8.69
3.3.2.2. Fourier Transform Infrared Spectroscopy (FTIR)
This method was used to confirm the identity of carbamazepine and sodium
valproate as well as detecting the interaction between the two drugs. Samples were
placed on the Nicolet disc, and was done using pressed pellet method where
samples will be thoroughly mixed with. The mixture was compressed to form a disc
which was placed in the spectrophotometer for recording.

Chapter 3: Experimental methods, materials and apparatus
31
Experimental conditions
The IR-spectra was recorded on a Nicolet nexus 4709- Fourier transform infrared
spectroscopy (FTIR) spectrometer (Nicolet instrumentation corporation, Madison
USA) over a range of 0-400cm-1.
3.3.2.3. X-ray Powder Diffraction (XRPD) method
X-ray powder diffraction was used as an effective method to distinguish between
different solid phases in different or the same powdered samples. The X-ray powder
diffractogram produces information about the diffraction characteristics of the sample
(Watts, Maruyoshi, Hughes, Brown, & Harris, 2016). These diffraction characteristics
include the intensities of the maximum diffraction peaks and the angles at which they
occur (Bunaciu, Udristioiu, & Aboul-Enein, 2015). The XRPD traces of the powders
were compared with regard to peak position and relative intensity, peak shifting and
the presence or lack of peaks in certain regions of º2θ values.
Experimental conditions
Approximately 1g of carbamazepine and sodium valproate were placed into the
aluminium sample holder using a glass side to assure a flat upper surface. XRPD
patterns of the materials were determined on a Philips PW 1380 X-Ray
diffractometer with high intensity Cu-Kα radiation (λ = 1.54 Å, 40 kV and 40 mA) and
a graphite monochrometer at a scanning rate of 0.025 s-1 ranging from 4 to 64
degrees 2-theta, where theta is the diffraction angle. The raw count data was
captured using Philips Automatic Powder diffraction software which was then
converted into ACSII format and imported into a Microsoft® Excel spreadsheet.
3.3.2.4. Thermal Activity Monitor (TAM)
Compatibility between the different APIs was established with a 2277 Thermal
Activity Monitor (TAM III; TA Instruments, United States of America), equipped with
an oil bath with a stability of ± 100 μK over 24 h. The calorimeter’s temperature was
maintained at 40°C. During the compatibility studies the heat flow was measured for
the single components, as well as for the mixtures. The TAM is a sensitive and
accurate instrument for detecting incompatibilities and instabilities between APIs.

Chapter 3: Experimental methods, materials and apparatus
32
Masses of samples:
Carbamazepine 1: 100.43 mg; carbamazepine 2: 100.53 mg
Sodium valproate 1: 100.05 mg; sodium valproate 2: 100.19 mg
Combination 1: 100.68 mg; Combination 2: 94.59 mg
3.4. FORMULATION STUDIES
The FDC tablets were manufactured using direct compression method and wet
granulation method.
3.4.1. Direct compression
Formulations of carbamazepine/sodium valproate monolithic FDC tablet was
prepared by direct compression. All the raw materials for carbamazepine and sodium
valproate were weighed inside a 250 cm3 glass container to obtain a mass of 100 g.
The glass containers were fitted with a screw cap prior to mixing. All mixing
procedures employed a Turbula®-mixer (model T2C W.A. Bachofen, Basel,
Switzerland) at 130 rpm for 5 minutes as the standard method to ensure a proper
distribution of powder particles.
Compression settings employed upper punch settings of between 8.25 and 8.5 and
the filling volume of the die was altered by the adjustment of the lower punch setting
to 5.25 and 5.5. Round shaped die set was utilised to manufacture tablets that
presented a round surface. A Korsch® XP 1 Research tablet press (Berlin,
Germany) was employed during all tableting procedures. After manufacturing was
completed, tablets were stored in sealed glass containers away from light at room
temperature for 24 hours preceding further analysis.
3.4.2. Preparation of wet granulated tablets
Carbamazepine and sodium valproate, Ac-Di-Sol®, Kollidon® VA64 fine and
Emcompress® were weighed together inside a 250 cm3 glass container. The glass
container was fitted with a screw cap prior to mixing. All mixing procedures employed
a Turbula®-mixer (model T2C W.A. Bachofen, Basel, Switzerland) at 130 rpm for 5
Chapter 3: Experimental methods, materials and apparatus
33
minutes as the standard method to ensure a proper distribution of powder particles.
The mixture was wetted with ethanol and granulated. The granules were forced
through a 841 μm mesh stainless steel sieve, dried, and kept in a desiccator for 24
hours at room temperature. After 24 hours, the primary granules were forced through
250 μm mesh stainless steel sieve. Magnesium stearate was added to the granules
and mixed for 2 minutes using a Turbula®-mixer (model T2C W.A. Bachofen, Basel,
Switzerland) prior compression.
Compression settings employed upper punch settings of between 8 and 8.5 and the
filling volume of the die was altered by the adjustment of the lower punch setting to 5
and 5.25. Round shaped die set was utilised to manufacture tablets that presented a
round surface. A Korsch® XP 1 Research tablet press (Berlin, Germany) was
employed during all tableting procedures. After manufacturing was completed,
tablets were stored in sealed glass containers away from light at room temperature
for 24 hours preceding further analysis.
3.4.3. Mixture preparation of the fixed dose combination
3.4.3.1. Selection of excipients
Excipients were carefully selected in advance based on theoretical compatibility,
theoretical stability and to eliminate disturbances during the analytical process of
HPLC. Both APIs and excipients were studied prior formulation for compatibility by
employing differential scanning calorimetry, infrared absorption spectroscopy and x-
ray powder diffraction to identify excipient incompatibilities.
3.4.3.2. Fillers
Fillers are used in tablet formulations to help in free flowing of granules from hopper
to die cavity and to minimize friction between particles (Karthik, 2016).
Emcompress® was selected as the preferred filler to Pharmacel® and Combilac® for
direct compression method. Emcompress® was the only filler between the three that
could produce tablets that could withstand crushing upon handling, and increased
flowability whilst Pharmacel® and Combilac® produced tablets that broke upon
handling. Pharmacel® was the preferred filler for wet granulation as the

Chapter 3: Experimental methods, materials and apparatus
34
3.4.3.3. Lubricants
Lubricants are used in tablet formulation to help decrease friction at the interface
between a tablet’s surface and the die wall during ejection so that the wear on
punches and dies are reduced. They also prevent sticking of tablets to punch faces
(Li & Wu, 2014). Magnesium stearate was selected as the preferred lubricant mainly
because it is commonly used in the pharmaceutical manufacturing of tablets.
3.4.3.4. Disintegrants
Disintegrating agents are included in tablet formulations to help the tablet break
down in to small particles and promote moisture penetration of the matrix of the
dosage form in dissolution fluids (Karthik, 2016). Ac-Di-Sol® was the preferred
disintegrant as it is highly active in relatively low concentrations compared to other
disintegrants, thus the amount used in all the formulations was not going to affect
dissolution of the tablets.
3.4.3.5. Binders
Binders are employed to impart cohesiveness to the granules, thus to ensure the
tablet remain intact after compression (Patil, et al., 2014).
3.5. POST FORMULATION STUDIES
Tablet dimensions were evaluated to establish the applicability of the manufacturing
processes for the oral fixed-dose combination in terms of tablet weight variation,
friability and physical proportions. British Pharmacopoeia (2014) methods were used
to evaluate the dosage form. The crushing strength, friability, diameter and thickness
of the tablets are non-official pharmacopoeial tests and were conducted for data
gathering purposes.

Chapter 3: Experimental methods, materials and apparatus
35
3.5.1. Tablet crushing strength, diameter and thickness
Twenty tablets were randomly selected and measured for crushing strength,
diameter and thickness by using Pharma Test® (model PTB-311) tablet test unit
(Pharma Test, Switzerland).
3.5.2. Average weight of the dosage unit
The weight variation test of tablets is an official British Pharmacopoeia (2014) test.
Twenty tablets from each batch were dusted and weighed using a Precisa®
analytical balance (model 240A, OERLIKON AG, Zurich) which was used to
determine weight variation. Weight values were reported in milligrams and were
measured against the BP limits for tablet weight variation.
3.5.3. Friability test
Twenty tablets were weighed individually from each batch. The tablets were placed
in a Roche friabilator and exposed to 25 rotations in 4 minutes. The tablets were
dedusted and reweighed. Equation 3.5 was used to calculate the percentage
friability.
Equation 3.6
Where:
Wa - weight of tablets before rotation
Wb - weight of tablets after rotation
3.5.4. Disintegration studies
The disintegration equipment and method used are described in the British
Pharmacopoeia (2014). The disintegration times of six tablets from each formulation
were determined using an Erweka® GmbH tablet disintegration test unit (Type
ZT503, Heusenstamm, Germany). A set limit of 15 minutes was employed. The
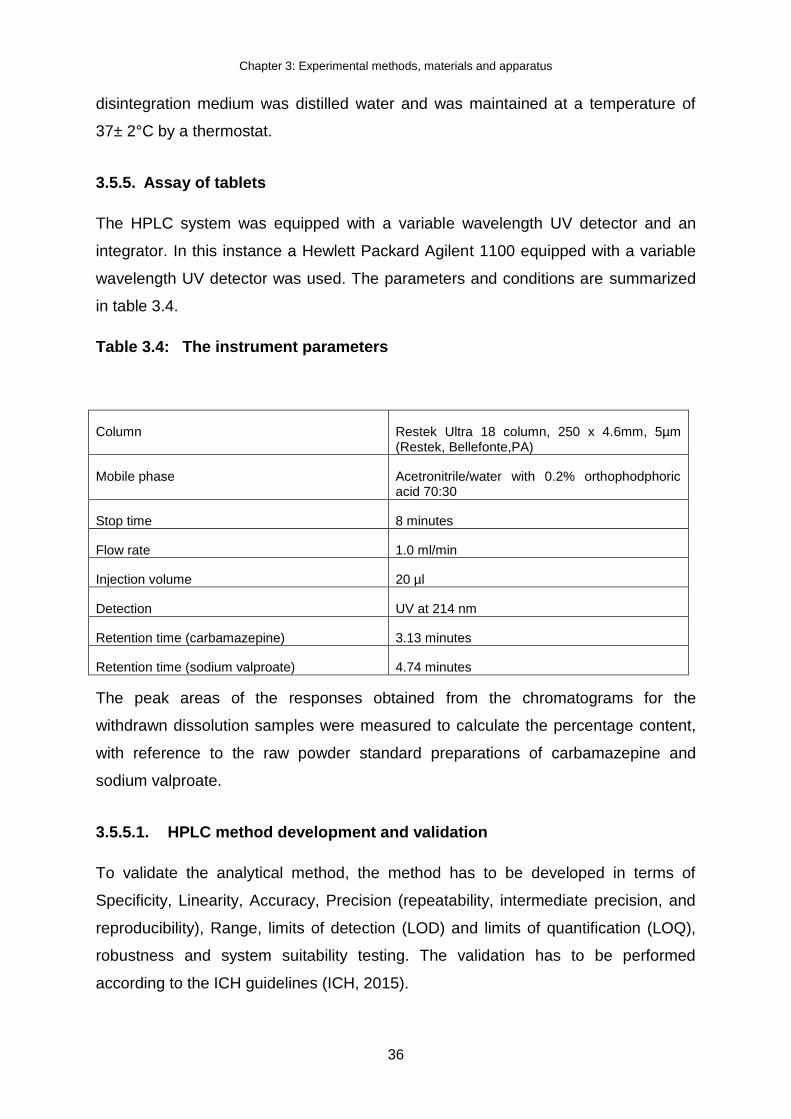
Chapter 3: Experimental methods, materials and apparatus
36
disintegration medium was distilled water and was maintained at a temperature of
37± 2°C by a thermostat.
3.5.5. Assay of tablets
The HPLC system was equipped with a variable wavelength UV detector and an
integrator. In this instance a Hewlett Packard Agilent 1100 equipped with a variable
wavelength UV detector was used. The parameters and conditions are summarized
in table 3.4.
Table 3.4: The instrument parameters
Column Restek Ultra 18 column, 250 x 4.6mm, 5µm (Restek, Bellefonte,PA)
Mobile phase Acetronitrile/water with 0.2% orthophodphoric acid 70:30
Stop time 8 minutes
Flow rate 1.0 ml/min
Injection volume 20 µl
Detection UV at 214 nm
Retention time (carbamazepine) 3.13 minutes
Retention time (sodium valproate) 4.74 minutes
The peak areas of the responses obtained from the chromatograms for the
withdrawn dissolution samples were measured to calculate the percentage content,
with reference to the raw powder standard preparations of carbamazepine and
sodium valproate.
3.5.5.1. HPLC method development and validation
To validate the analytical method, the method has to be developed in terms of
Specificity, Linearity, Accuracy, Precision (repeatability, intermediate precision, and
reproducibility), Range, limits of detection (LOD) and limits of quantification (LOQ),
robustness and system suitability testing. The validation has to be performed
according to the ICH guidelines (ICH, 2015).

Chapter 3: Experimental methods, materials and apparatus
37
3.5.5.1.1. Specificity
Specificity is the ability to evidently assess the analyte in the formulation, which may
be expected to be present in that formulation or sample. Normally these might
include impurities, degradants, matrix, etc. To ensure that all the analytical
procedures performed allow an accurate statement of the content of impurities of an
analyte, an assay is used for determining an accurate result in order to provide
specific and precise information on the content and potency of the analyte in a
sample (ICH, 1996).
3.5.5.1.2. Linearity
The linearity of an analytical procedure is defined as the ability to obtain results that
are directly proportional to the concentration of drug used in a sample. E.g. the
difference between a 10mg concentration must be proportional to that of 5mg looking
at the absorbance obtained during test (ICH, 1996). Linearity in this study was
confirmed by dilutions that were prepared from the standard solution which had the
concentration of 0.01µg, 0.10 µg, 0.51 µg, 1.52 µg, 5.06 µg,15.18 µg, 25.30 µg,
50.60 µg and 101.20 µg for carbamazepine and 0.01 µg, 0.10 µg, 0.51 µg, 1.54 µg,
5.12 µg,15.36 µg, 25.60 µg, 51.20 µg and 102.40 µg for sodium valproate in 100ml
volumetric flask. These solutions were then transferred into an HPLC-vial through
the 0.45µ filter and analyzed. The average peak areas from three injections on the
chromatograms were used to plot the standard curves using Microsoft Excel TM
3.5.5.1.3. Range
The range of an analysis for the assay of an active substance is usually between 80
to 120 percent of the test concentration (ICH, 1996). The range of concentrations
used to determine standard linearity of carbamazepine and sodium valproate was
between 0.0001mg/100ml up to 04 mg/100ml and covered the entire anticipated
range of concentrations expected to elicit a pharmaceutical response. This is
established by confirming that the analytical procedure provides an acceptable
degree of linearity.

Chapter 3: Experimental methods, materials and apparatus
38
3.5.5.1.4. Robustness
Robustness is a measure to determine the ability of the analytical procedure to
remain unchanged by slight or deliberate variations in method parameters used. It
provides an indication of its reliability during a test procedures or analytical run (ICH,
2015). When working with HPLC, typical variations that can occur include the
following: Flow rate of the mobile phase, columns (different suppliers, brand and
dimensions), Temperature of the column, pH of a mobile phase and composition of
mobile phase (Yanamandra, Chaudhary, Bandaru, Sastry, Patro, Murthy & Ramaiah,
2011).
3.5.5.1.5. Accuracy
The accuracy of an analytical method states the similarity between the value which is
accepted either as a conventional true value or an accepted reference value and the
found value. To determine the accuracy of a method, the reference material must be
subjected to the analytical procedure. (FDA, 2001; ICH, 2015). Three injections of
varying concentrations were analyzed in triplicate in this study to determine if they all
result in similar area under the chromatogram or closest to the first injection.
3.5.5.1.6. Precision
Validation of assay tests methodology includes an investigation of precision. The
precision of an analytical procedure expresses as the closeness of agreement
between a series of measurements acquired from multiple sampling of the same
homogeneous sample under the prescribed conditions. Precision may be considered
in three levels, these include repeatability, intermediate precision and reproducibility.
Precision should be investigated using homogeneous, authentic samples. However,
if it is not possible to obtain a homogeneous sample it may be explored using
artificially prepared samples or a sample solution. The precision of an analytical
procedure is usually stated as the variance, standard deviation or coefficient of
variation of a series of measurements (ICH, 2015)
Twenty tablets were weighed individually, then placed in the mortar and powdered
with a pestle. An amount equivalent to 200mg of both carbamazepine and sodium
valproate was extracted with 100ml of 0.1 M hydrochloric acid, sonication for 15
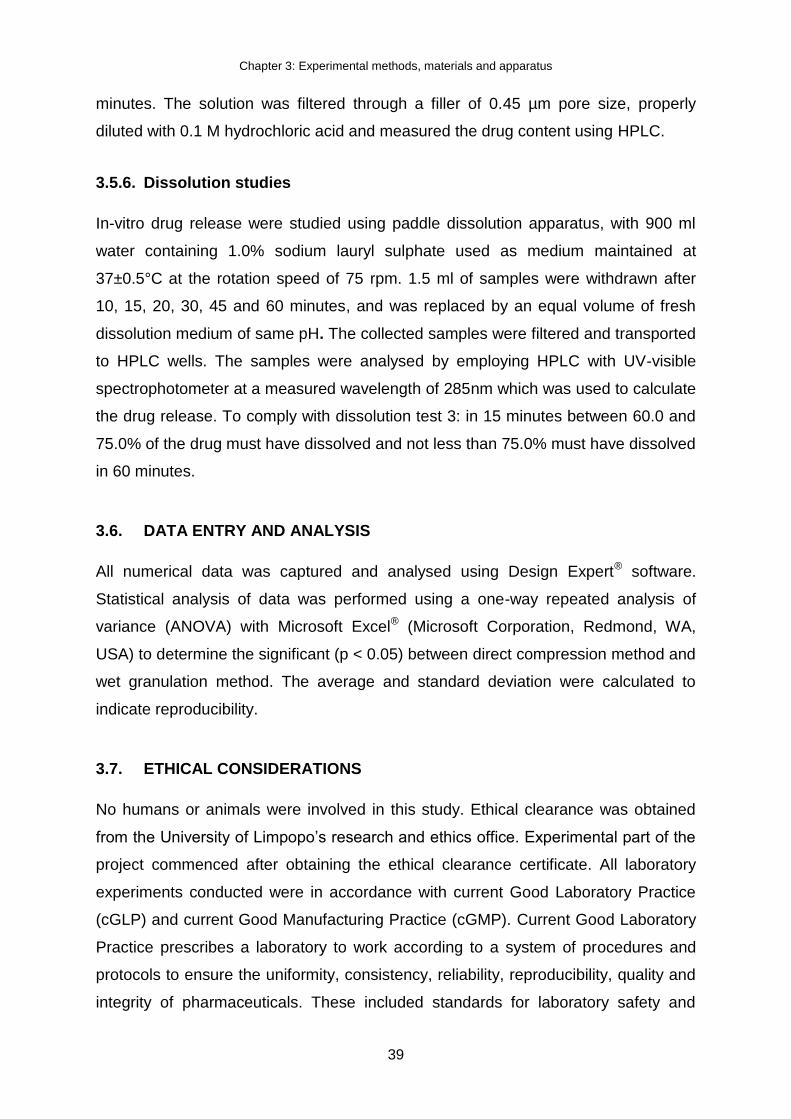
Chapter 3: Experimental methods, materials and apparatus
39
minutes. The solution was filtered through a filler of 0.45 µm pore size, properly
diluted with 0.1 M hydrochloric acid and measured the drug content using HPLC.
3.5.6. Dissolution studies
In-vitro drug release were studied using paddle dissolution apparatus, with 900 ml
water containing 1.0% sodium lauryl sulphate used as medium maintained at
37±0.5°C at the rotation speed of 75 rpm. 1.5 ml of samples were withdrawn after
10, 15, 20, 30, 45 and 60 minutes, and was replaced by an equal volume of fresh
dissolution medium of same pH. The collected samples were filtered and transported
to HPLC wells. The samples were analysed by employing HPLC with UV-visible
spectrophotometer at a measured wavelength of 285nm which was used to calculate
the drug release. To comply with dissolution test 3: in 15 minutes between 60.0 and
75.0% of the drug must have dissolved and not less than 75.0% must have dissolved
in 60 minutes.
3.6. DATA ENTRY AND ANALYSIS
All numerical data was captured and analysed using Design Expert® software.
Statistical analysis of data was performed using a one-way repeated analysis of
variance (ANOVA) with Microsoft Excel® (Microsoft Corporation, Redmond, WA,
USA) to determine the significant (p < 0.05) between direct compression method and
wet granulation method. The average and standard deviation were calculated to
indicate reproducibility.
3.7. ETHICAL CONSIDERATIONS
No humans or animals were involved in this study. Ethical clearance was obtained
from the University of Limpopo’s research and ethics office. Experimental part of the
project commenced after obtaining the ethical clearance certificate. All laboratory
experiments conducted were in accordance with current Good Laboratory Practice
(cGLP) and current Good Manufacturing Practice (cGMP). Current Good Laboratory
Practice prescribes a laboratory to work according to a system of procedures and
protocols to ensure the uniformity, consistency, reliability, reproducibility, quality and
integrity of pharmaceuticals. These included standards for laboratory safety and

Chapter 3: Experimental methods, materials and apparatus
40
suitable means of disposing wastes. Good manufacturing practice provide guidance
for manufacturing, testing and quality assurance in order to ensure that drug product
meet the minimum standards a prescribed by BP and/or USP.
3.8. SUMMARY
This chapter provided the experimental methods, materials and apparatus used to
formulate the fixed dose combination tablet of carbamazepine and sodium valproate.
The methods used are official methods from the British Pharmacopoeia and ICH
guidelines. The methods were categorised into three phases, starting with
preformulation studies that were used to ensure that the raw materials used in the
study were suitable and appropriate for the formulation of a FDC tablet. The second
phase was formulation studies which encapsulated different methods of formulating
the conventional FDC tablet. The last phase, which was post formulation studies,
consisted of numerous tests (official and non-official) that were used to determine if
the tablets complied. The next chapter will provide the results and discussion of the
first phase, which is preformulation studies.

Chapter 4: Pre-formulation studies: Results and discussion
41
CHAPTER 4: PRE-FORMULATION STUDIES: RESULTS AND
DISCUSSION
4.1. INTRODUCTION
The results obtained in chapter 3 are presented in this chapter and discussed in
detail. The results described below comprise several imperative factors to ultimately
deliver a product with suitable flow and compressibility properties. Particle flowability
and compressibility are two critical process parameters tested when a material is
designed for direct compression. The interpretations of the results obtained
compatibility studies and the evaluation of power are discussed in this chapter.
4.2. COMPATIBILITY STUDIES
The starting materials were evaluated for physico-chemical compatibility using
Differential Scanning Calorimetry (DSC), Fourier Transform Infrared Spectroscopy
(FTIR) and X-ray Powder Diffraction (XRPD) method.
4.2.1. Differential Scanning Calorimetry (DSC)
The appearance, shift or disappearance of endothermic or exothermic peaks on the
DSC thermograms were monitored as a crucial aspect of drug-drug compatibility or
interaction. In this study, the thermograms of the carbamazepine and sodium
valproate mixture was compared to the different drugs alone and the excipients.
Figure 4.1 shows the DSC thermogram of carbamazepine (blue) with a single
endothermic peak at 190.74 º C, corresponding to its melting point of 191.5º C
(Yadav & Lariya, 2017). DSC thermogram of sodium valproate (red) showed a single
endothermic peak of 110.02º C.
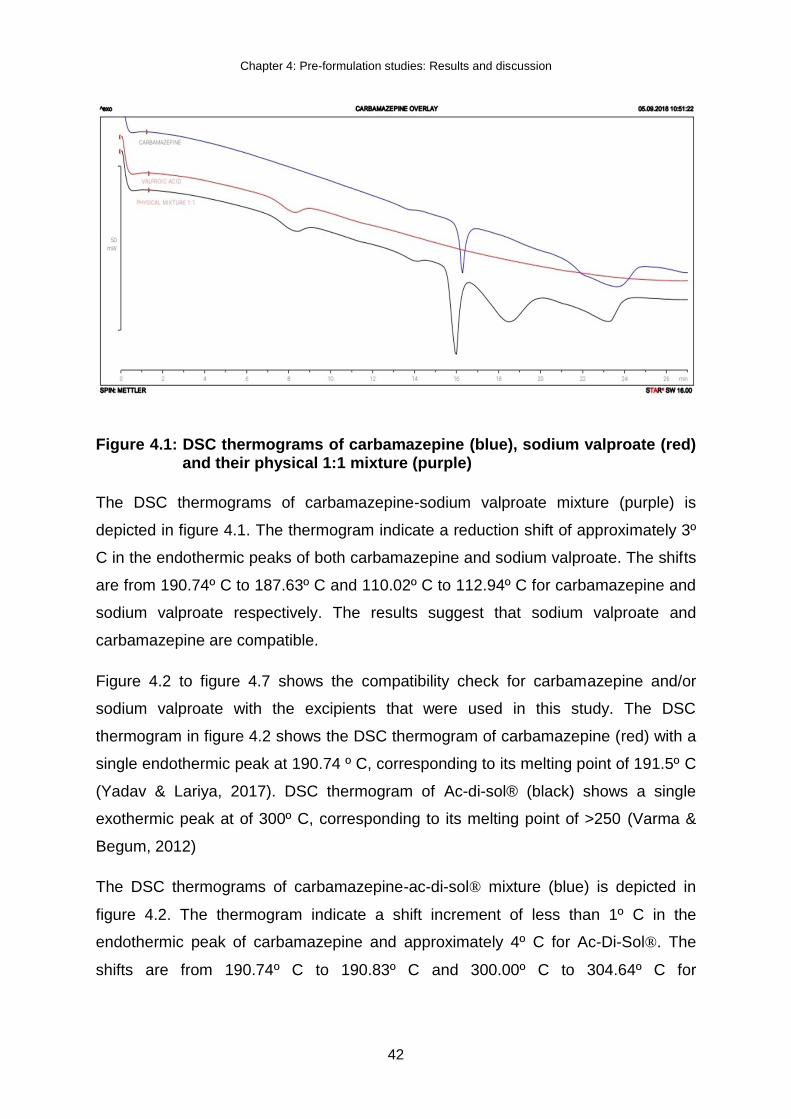
Chapter 4: Pre-formulation studies: Results and discussion
42
Figure 4.1: DSC thermograms of carbamazepine (blue), sodium valproate (red) and their physical 1:1 mixture (purple)
The DSC thermograms of carbamazepine-sodium valproate mixture (purple) is
depicted in figure 4.1. The thermogram indicate a reduction shift of approximately 3º
C in the endothermic peaks of both carbamazepine and sodium valproate. The shifts
are from 190.74º C to 187.63º C and 110.02º C to 112.94º C for carbamazepine and
sodium valproate respectively. The results suggest that sodium valproate and
carbamazepine are compatible.
Figure 4.2 to figure 4.7 shows the compatibility check for carbamazepine and/or
sodium valproate with the excipients that were used in this study. The DSC
thermogram in figure 4.2 shows the DSC thermogram of carbamazepine (red) with a
single endothermic peak at 190.74 º C, corresponding to its melting point of 191.5º C
(Yadav & Lariya, 2017). DSC thermogram of Ac-di-sol® (black) shows a single
exothermic peak at of 300º C, corresponding to its melting point of >250 (Varma &
Begum, 2012)
The DSC thermograms of carbamazepine-ac-di-sol® mixture (blue) is depicted in
figure 4.2. The thermogram indicate a shift increment of less than 1º C in the
endothermic peak of carbamazepine and approximately 4º C for Ac-Di-Sol®. The
shifts are from 190.74º C to 190.83º C and 300.00º C to 304.64º C for
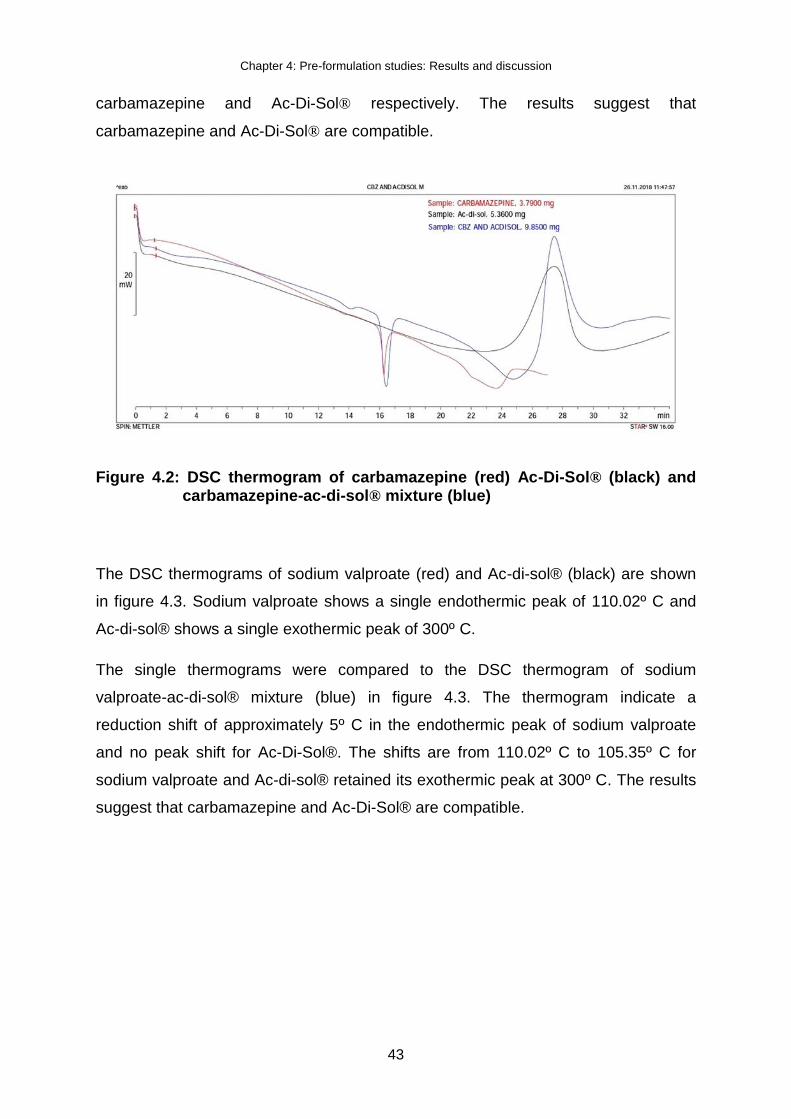
Chapter 4: Pre-formulation studies: Results and discussion
43
carbamazepine and Ac-Di-Sol® respectively. The results suggest that
carbamazepine and Ac-Di-Sol® are compatible.
Figure 4.2: DSC thermogram of carbamazepine (red) Ac-Di-Sol® (black) and carbamazepine-ac-di-sol® mixture (blue)
The DSC thermograms of sodium valproate (red) and Ac-di-sol® (black) are shown
in figure 4.3. Sodium valproate shows a single endothermic peak of 110.02º C and
Ac-di-sol® shows a single exothermic peak of 300º C.
The single thermograms were compared to the DSC thermogram of sodium
valproate-ac-di-sol® mixture (blue) in figure 4.3. The thermogram indicate a
reduction shift of approximately 5º C in the endothermic peak of sodium valproate
and no peak shift for Ac-Di-Sol®. The shifts are from 110.02º C to 105.35º C for
sodium valproate and Ac-di-sol® retained its exothermic peak at 300º C. The results
suggest that carbamazepine and Ac-Di-Sol® are compatible.

Chapter 4: Pre-formulation studies: Results and discussion
44
Figure 4.3: DSC thermogram of sodium valproate (red) Ac-Di-Sol® (black) and sodium valproate-ac-di-sol® mixture (blue)
In the DSC thermogram for magnesium stearate (blue) shown in figure 4.4, two
peaks were observed. The first occurring at a temperature of 110.40º C and the
second occurring at 125.08º C. The DSC thermogram of carbamazepine (black)
shows a single endothermic peak of 190.74º C.
The DSC thermogram for carbamazepine and magnesium stearate were compared
to the DSC thermogram of carbamazepine-magnesium stearate mixture (red) in
figure 4.4. Four peaks were observed in carbamazepine-magnesium stearate
mixture, the first one occurring at 87.86º C, characteristic of magnesium stearate
melting point (Li & Wu, 2014). There was a reduction peak shift of approximately 2º
C in the second and a shift increment of less than 1º C for carbamazepine. The shifts
are from 110.40º C to 109.03º C and 125.08º C to 123.32º C for magnesium stearate
and from 190.74º C to 190. 81º C for carbamazepine. Given the results,
carbamazepine is compatible with magnesium stearate.

Chapter 4: Pre-formulation studies: Results and discussion
45
Figure 4.4: DSC thermogram of carbamazepine (black) magnesium stearate
(blue) and carbamazepine-magnesium stearate mixture (red)
In the DSC thermogram for magnesium stearate (black) shown in figure 4.5, two
endothermic peaks were observed. The first occurring at a temperature of 87.80º C
and the second occurring at 125.08º C. The DSC thermogram of sodium valproate
(red) shows a single endothermic peak of 110.02º C.
The DSC thermogram for sodium valproate and magnesium stearate were compared
to the DSC thermogram of sodium valproate-magnesium stearate mixture (blue) in
figure 4.5. Three peaks were observed in carbamazepine-magnesium stearate
mixture. There was a shift increment between 1º C to 5º C for magnesium stearate
and a shift increment of approximately 1º C for sodium valproate. The shifts are from
87.86º C to 88.94º C and 125.08º C to 129.66º C for magnesium stearate and from
110.02º C to 110.17º C for sodium valproate. Given the results, sodium valproate is
compatible with magnesium stearate.
Chapter 4: Pre-formulation studies: Results and discussion
46
Figure 4.5: DSC thermogram of sodium valproate (red) magnesium stearate
(black) and sodium valproate-magnesium stearate mixture (blue)
The DSC thermogram for pharmacel® (blue) in figure 4.6 shows a single
endothermic peak of 338.44 º C, which deviated from its melting point of 260-270º C
(Kharismi & Suryadi, 2018). The DSC thermogram of carbamazepine (black) shows
a single endothermic peak of 190.74º C.
The DSC thermogram for carbamazepine and pharmacel® were compared to the
DSC thermogram of carbamazepine-pharmacel® mixture (red) in figure 4.6. Three
peaks were observed in carbamazepine-pharmacel® mixture. There was a shift
increment of approximately 1º C for carbamazepine and approximately 4 º C for
pharmacel®. The shifts are from 190.74º C to 191.5º C and 338.44 º C to 342.76º C
for carbamazepine and pharmacel® respectively. Given the results, carbamazepine
is compatible with pharmacel®.
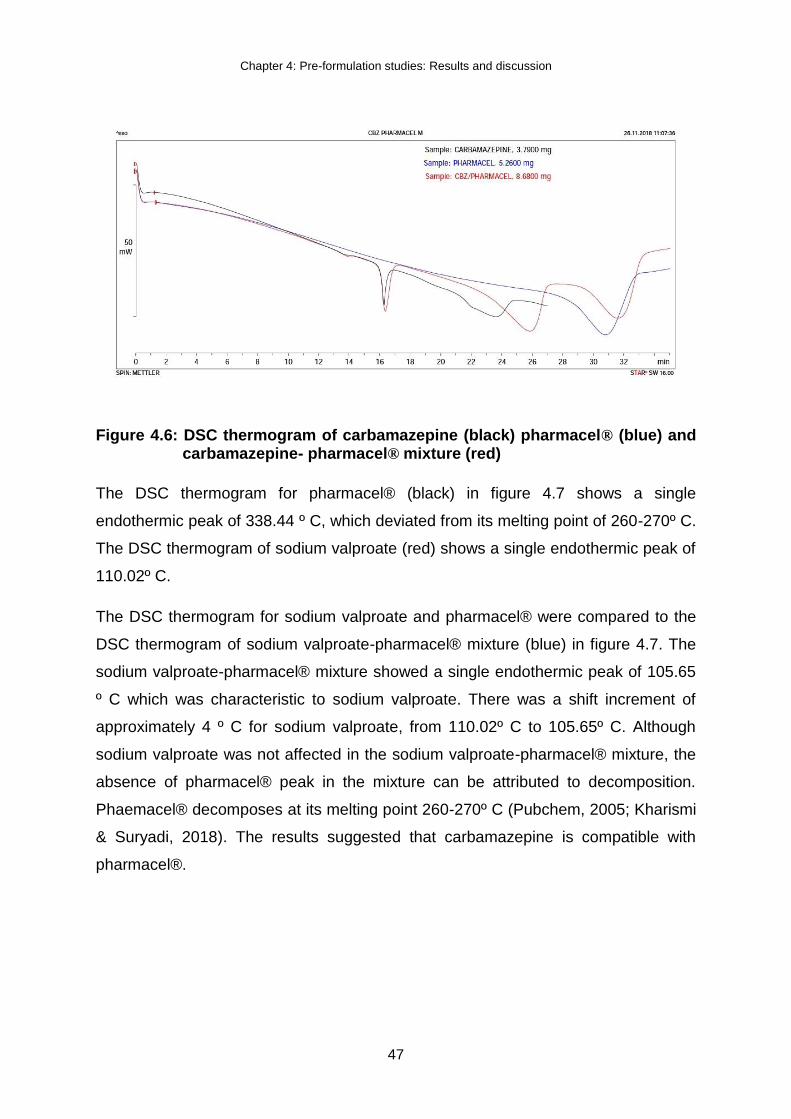
Chapter 4: Pre-formulation studies: Results and discussion
47
Figure 4.6: DSC thermogram of carbamazepine (black) pharmacel® (blue) and carbamazepine- pharmacel® mixture (red)
The DSC thermogram for pharmacel® (black) in figure 4.7 shows a single
endothermic peak of 338.44 º C, which deviated from its melting point of 260-270º C.
The DSC thermogram of sodium valproate (red) shows a single endothermic peak of
110.02º C.
The DSC thermogram for sodium valproate and pharmacel® were compared to the
DSC thermogram of sodium valproate-pharmacel® mixture (blue) in figure 4.7. The
sodium valproate-pharmacel® mixture showed a single endothermic peak of 105.65
º C which was characteristic to sodium valproate. There was a shift increment of
approximately 4 º C for sodium valproate, from 110.02º C to 105.65º C. Although
sodium valproate was not affected in the sodium valproate-pharmacel® mixture, the
absence of pharmacel® peak in the mixture can be attributed to decomposition.
Phaemacel® decomposes at its melting point 260-270º C (Pubchem, 2005; Kharismi
& Suryadi, 2018). The results suggested that carbamazepine is compatible with
pharmacel®.

Chapter 4: Pre-formulation studies: Results and discussion
48
Figure 4.7: DSC thermogram of sodium valproate (red) pharmacel® (black) and sodium valproate- pharmacel® mixture (blue)
4.2.2. Infrared Spectroscopy (IR)
Figure 4.12 shows the FTIR spectrum of carbamazepine (blue), which shows
absorption bands at 3463.72 cm-1 and 3157.25 cm-1 attributed to the amine group
(N-H), 1676.23 cm-1 and 1594.25 cm-1 attributed to the alkene group (C=C). The
carbonyl group (C=O) was represented between 1488.15 cm-1, 1461.74 cm-1,
1382.30 cm-1, 1306.66 cm-1 and 1244.64 cm-1. At 1115.05 cm-1, the ether group (C-
O) together with an alcohol group (C-OH) were observed whilst the aromatic ring
was represented between 870 cm-1, 800 cm-1, 724 cm-1, 646 cm-1 and 623 cm-1. All
these functions groups are represented in the chemical formula of carbamazepine,
C15H12N2O, and the spectrum conformed to the spectrum in literature (British
Pharmacopoeia, 2014).
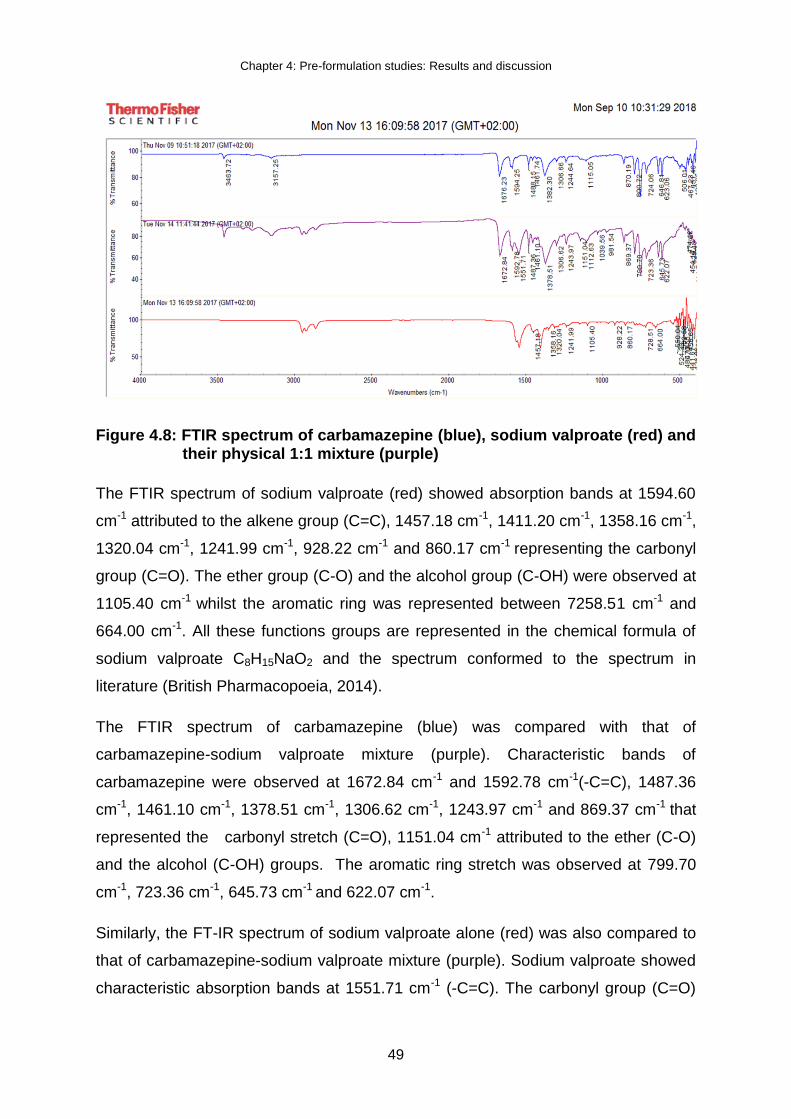
Chapter 4: Pre-formulation studies: Results and discussion
49
Figure 4.8: FTIR spectrum of carbamazepine (blue), sodium valproate (red) and their physical 1:1 mixture (purple)
The FTIR spectrum of sodium valproate (red) showed absorption bands at 1594.60
cm-1 attributed to the alkene group (C=C), 1457.18 cm-1, 1411.20 cm-1, 1358.16 cm-1,
1320.04 cm-1, 1241.99 cm-1, 928.22 cm-1 and 860.17 cm-1 representing the carbonyl
group (C=O). The ether group (C-O) and the alcohol group (C-OH) were observed at
1105.40 cm-1 whilst the aromatic ring was represented between 7258.51 cm-1 and
664.00 cm-1. All these functions groups are represented in the chemical formula of
sodium valproate C8H15NaO2 and the spectrum conformed to the spectrum in
literature (British Pharmacopoeia, 2014).
The FTIR spectrum of carbamazepine (blue) was compared with that of
carbamazepine-sodium valproate mixture (purple). Characteristic bands of
carbamazepine were observed at 1672.84 cm-1 and 1592.78 cm-1(-C=C), 1487.36
cm-1, 1461.10 cm-1, 1378.51 cm-1, 1306.62 cm-1, 1243.97 cm-1 and 869.37 cm-1 that
represented the carbonyl stretch (C=O), 1151.04 cm-1 attributed to the ether (C-O)
and the alcohol (C-OH) groups. The aromatic ring stretch was observed at 799.70
cm-1, 723.36 cm-1, 645.73 cm-1 and 622.07 cm-1.
Similarly, the FT-IR spectrum of sodium valproate alone (red) was also compared to
that of carbamazepine-sodium valproate mixture (purple). Sodium valproate showed
characteristic absorption bands at 1551.71 cm-1 (-C=C). The carbonyl group (C=O)

Chapter 4: Pre-formulation studies: Results and discussion
50
was represented at 112.63 cm-1, 1039.56 cm-1, 987.54 cm-1. The aromatic ring
stretch was observed between 723.36 cm-1 and 645.73 cm-1. Since both spectra
were observed in the 1:1 physical mixture, this suggests that carbamazepine and
sodium valproate are compatible.
4.2.3. X-ray Powder Diffraction analysis (XRPD)
The XRPD diffractogram of carbamazepine in figure 4.18 demonstrated sharp peaks
at 2θ=15.1º, 15.7º, 16.4º, 17.7º, 19.8º, 21.7º, 22.6º, 23.70º, 27.8º, 28.9º, 31.0º, 31.6º
and 37.3º. These results were consistent with those described in the literature (Pinto,
Ambrozini, Ferreira, & Cavalheiro, 2014)
Figure 4.9: XRPD diffractogram of carbamazepine
Sodium valproate in figure 4.19 showed sharp peaks at 2θ=7.2º, 8.6º and 16.9º.
Shallow peaks were observed at 2θ=23.7º, 25.7º, 26.3º and 70.0º. These results
also conformed to those described in the literature (Dicaire, Perras, & Bryce, 2014)
0
50
100
150
200
250
300
350
400
450
500
5,0 10,0 15,0 20,0 25,0 30,0 35,0 40,0 45,0 50,0 55,0 60,0 65,0 70,0 75,0
Co
un
ts /
Se
c
degrees 2 theta Co Ka
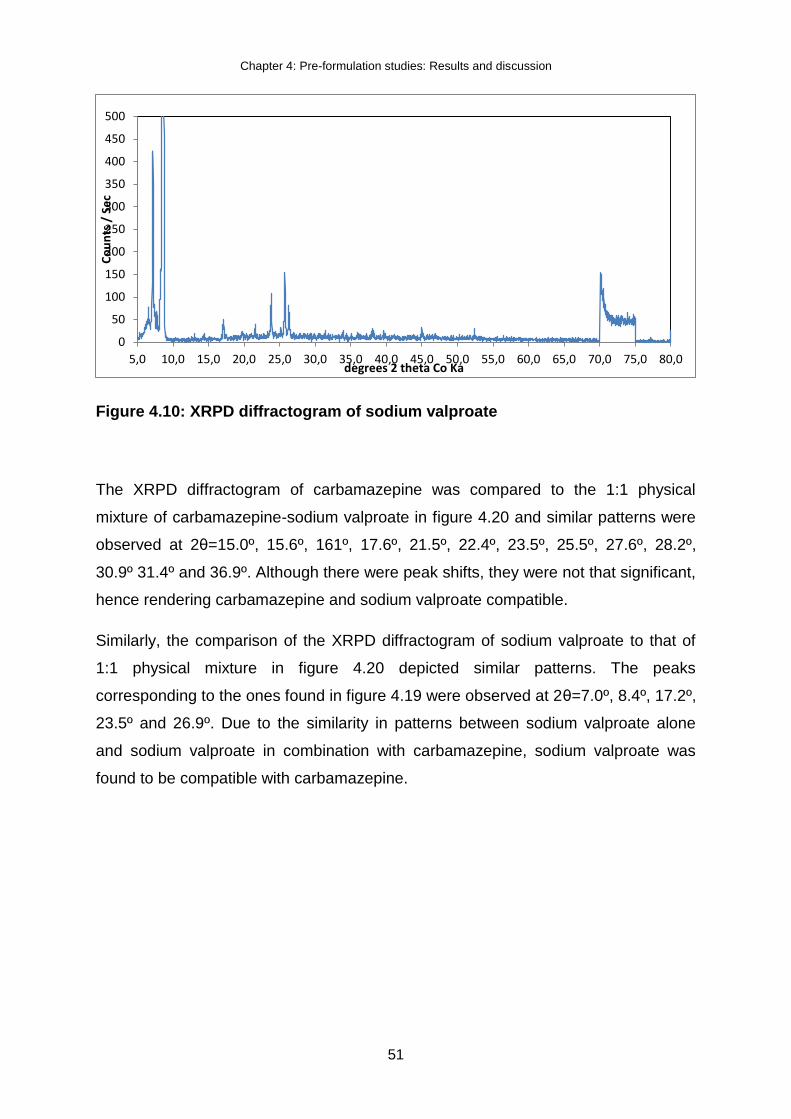
Chapter 4: Pre-formulation studies: Results and discussion
51
Figure 4.10: XRPD diffractogram of sodium valproate
The XRPD diffractogram of carbamazepine was compared to the 1:1 physical
mixture of carbamazepine-sodium valproate in figure 4.20 and similar patterns were
observed at 2θ=15.0º, 15.6º, 161º, 17.6º, 21.5º, 22.4º, 23.5º, 25.5º, 27.6º, 28.2º,
30.9º 31.4º and 36.9º. Although there were peak shifts, they were not that significant,
hence rendering carbamazepine and sodium valproate compatible.
Similarly, the comparison of the XRPD diffractogram of sodium valproate to that of
1:1 physical mixture in figure 4.20 depicted similar patterns. The peaks
corresponding to the ones found in figure 4.19 were observed at 2θ=7.0º, 8.4º, 17.2º,
23.5º and 26.9º. Due to the similarity in patterns between sodium valproate alone
and sodium valproate in combination with carbamazepine, sodium valproate was
found to be compatible with carbamazepine.
0
50
100
150
200
250
300
350
400
450
500
5,0 10,0 15,0 20,0 25,0 30,0 35,0 40,0 45,0 50,0 55,0 60,0 65,0 70,0 75,0 80,0
Co
un
ts /
Se
c
degrees 2 theta Co Ka

Chapter 4: Pre-formulation studies: Results and discussion
52
Figure 4.11: XRPD diffractogram of carbamazepine/sodium valproate
4.2.4. Thermal Activity Monitor (TAM)
Both samples of carbamazepine and sodium valproate in combination with one
another showed to be compatible. Figure 4.16 depicts the heat flow curve obtained
with the first combination. The fact that the measured heat flow and the theoretically
calculated heat flow correlate very well allows the conclusion that the two
compounds are compatible with one another. The average interaction heat flow was
measured to be 430.7 nW/g.
0
50
100
150
200
250
300
350
400
450
500
5,0 10,0 15,0 20,0 25,0 30,0 35,0 40,0 45,0 50,0 55,0 60,0 65,0 70,0 75,0
Co
un
ts /
Se
c
degrees 2 theta Co Ka
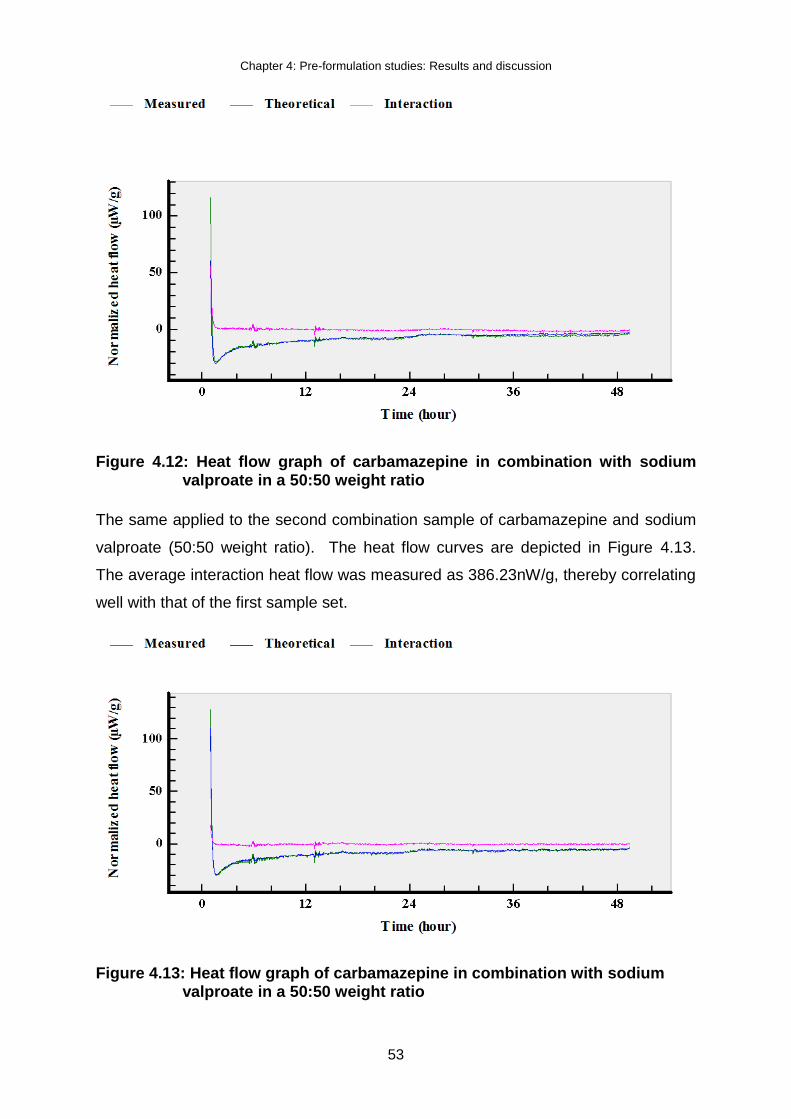
Chapter 4: Pre-formulation studies: Results and discussion
53
Figure 4.12: Heat flow graph of carbamazepine in combination with sodium valproate in a 50:50 weight ratio
The same applied to the second combination sample of carbamazepine and sodium
valproate (50:50 weight ratio). The heat flow curves are depicted in Figure 4.13.
The average interaction heat flow was measured as 386.23nW/g, thereby correlating
well with that of the first sample set.
Figure 4.13: Heat flow graph of carbamazepine in combination with sodium valproate in a 50:50 weight ratio

Chapter 4: Pre-formulation studies: Results and discussion
54
4.3. POWDER CHARACTERIZATION
Powder was characterised in terms of particle size distribution, flowability and
density. This information is essential in determining the need for milling or size
enlargement of the starting material, appropriate excipients to be used in the
formulation and appropriate method of formulation.
4.3.1. Particle size distribution
The particle size distribution was determined using the Malvern® Mastersizer 2000
and the results are summarised in table 4.2. Carbamazepine had a mean median
particle size (D50) of 70.840 µm approximately double of that of sodium valproate
(D50 of 31.702). To ensure that the FDC tablet to be formulated will have uniform
particle size with the difference observed between carbamazepine and sodium
valproate powders, granulation would be required prior compression.
Carbamazepine powder exhibited a narrow particle size distribution (figure 4.14) and
sodium valproate showed a wide particle size distribution. According to the BP
classification of powder by fineness (table 4.1), both carbamazepine and sodium
valproate were considered very fine powders.
Table 4.1: Classification of powder according to its measure of fineness (British Pharmacopoeia, 2014)
Classification of powders by fineness
Descriptive terms X50 (µm)
Coarse > 355
Moderately fine 180 – 349
Fine 125 – 179
Very fine < 125

Chapter 4: Pre-formulation studies: Results and discussion
55
Table 4.2: Particle size distribution parameters of carbamazepine
Sample D(0.1)
(µm)
D(0.5)
(µm)
D(0.9)
(µm)
Carbamazepine 16.929±2.155 70.840±1.550 199.320±2.362
Sodium valproate
7.286±2.252 31.702±4.800 350.384±23.334
Figure 4.14: Histograms generated from the particle size analysis of carbamazepine sample (top) and sodium valproate powder (bottom)
Carbamazepine powder revealed that it had small particles that promotes powder
homogeneity and dissolution rate. However, small particles may have a negative

Chapter 4: Pre-formulation studies: Results and discussion
56
impact on flowability of the material (Etzler & Uddin, 2013). For powders with small
particles, size enlargement techniques have to be applied to improve the flow
properties of the material. This information was also helpful in the selection of
appropriate excipients, which were used to aid flowability of the material. Sodium
valproate exhibited a wide particle size distribution, which may be subjected to
segregation during handling due to different particle size thus hindering homogeneity
of the product. The information was essential in the selection of the appropriate
method that will ensure that particle size is uniform and enlarged, and the required
method would be granulation prior compression.
4.3.2. Angle of repose
The angle of repose was determined according to the fixed funnel and freestanding
cone method. Angle of repose was calculated to be 38.55° for carbamazepine.
According to BP, carbamazepine denoted fair flowability. Flowability of the powder
ensure that the tablet weight remains uniform across. The angle of repose for
sodium valproate could not be determined due to its poor flow properties. Sodium
valproate is cohesive and hygroscopic and the angle of repose test is suitable for
‘free flowing’ powders (Manyama, 2011). The appropriate formulation method for
powders with poor flow properties is granulation. This study employed wet
granulation method to increase particle size and improve flowabilty.
4.3.3. Bulk and tapped density
The bulk density was calculated to be 0.48 g/ml for carbamazepine and 0.36 g/ml for
sodium valproate. Tapped density was calculated to be 0.62 g/ml carbamazepine
and 3 and 0.47 g/ml for sodium valproate. These values were used to calculate
hausner ratio and carr’s index.
4.3.4. Hausner ratio and Carr’s index
The hausner ratio for carbamazepine was calculated to be 1.31 and for sodium
valproate it was calculated to be 1.29. Both hausner ratio showed that both drugs
flow properties fall within the criteria of passable. Compressibility index was found at
23.40% and 22.58% for carbamazepine and sodium valproate respectively. As the

Chapter 4: Pre-formulation studies: Results and discussion
57
hausner ratio, the carr’s index also showed that the flow for both drugs are passable.
Given the results, there was surely a need for a flow aid to the FDC formulation of
carbamazepine and sodium valproate. This also showed that direct compression
alone won’t be adequate for the formulation but granulation will be a required method
for the formulation.
Table 4.4: Flow parameters of carbamazepine and sodium valproate powder
Material Densities (g/ml) Compressibility index
Bulk Tapped
Carbamazepine powder 0.48 ± 0.06 0.62 ± 0.09 23.40 ± 1.42
Sodium valproate powder 0.36 ± 0.03 0.47 ± 0.05 22.58 ± 1.38
Table 4.5: Summary of powder evaluation parameters
Property Carbamazepine Sodium valproate
Mean particle size (µm) 94.692 ± 5.070 114.675 ± 5.374
Tapped density (g/ml) 0.62 ± 0.09 0.47 ± 0.05
Bulk density (g/ml) 0.48 ± 0.06 0.36 ± 0.03
Hausner ratio 1.31 ± 0.05 1.29 ± 0.04
Carr index 23.40 ± 1.42 22.58 ± 1.38
Angle of repose 38.55
4.4. SUMMARY
To formulate a fixed dose combination, APIs and excipients need to be tested for
compatibility in order to determine a suitable formulation. The four methods
corroborated the results and revealed that there was no drug-drug nor drug-excipient
incompatibility. Many pharmaceutical processes depend on the flowability of the
Chapter 4: Pre-formulation studies: Results and discussion
58
powder formulation and as such, powders with better flow are always preferred. Both
carbamazepine and sodium valproate exhibited poor flow properties. To improve the
flow properties, a flow aid would be required when manufacturing the tablet and the
suitable method to manufacture the tablet would be granulation methods.

Chapter 5: Formulation studies results and discussion
59
CHAPTER 5: FORMULATION STUDIES RESULTS AND
DISCUSSION
5.1. INTRODUCTION
In this chapter the results of the evaluation of the physical properties of the tablets of
the oral fixed-dose combination of carbamazepine and sodium valproate will be
presented. The tablets were evaluated in terms of physical dimensions, weight
variation, friability, and disintegration to establish the applicability of the
manufacturing process. The quality of the compressed tablets was evaluated
according to standards set by the British Pharmacopoeia.
5.2. EVALUATION OF THE TABLETS
Tablets were evaluated in terms of tablet weight variation, friability and crushing
strength as described in Chapter 3. Three batches were successfully formulated and
their composition are presented from table 5.1 to table 5.3. The diameter of the
tablets was approximately 14 mm and the thickness was approximately 4 mm.
Table 5.1: Tablet composition of formulation 1
Ingredient Purpose Amount per tablet (%w/w)
Quantity per tablet (mg)
Carbamazepine Active ingredient 25 200
Sodium valproate Active ingredient 25 200
Ac-Di-Sol® Disintegrant 3 24
Magnesium stearate Lubricant 0.5 4
Kollidon® VA 64 Binder 3 24
Emcompress® Filler 43.5 348
Total 100 800
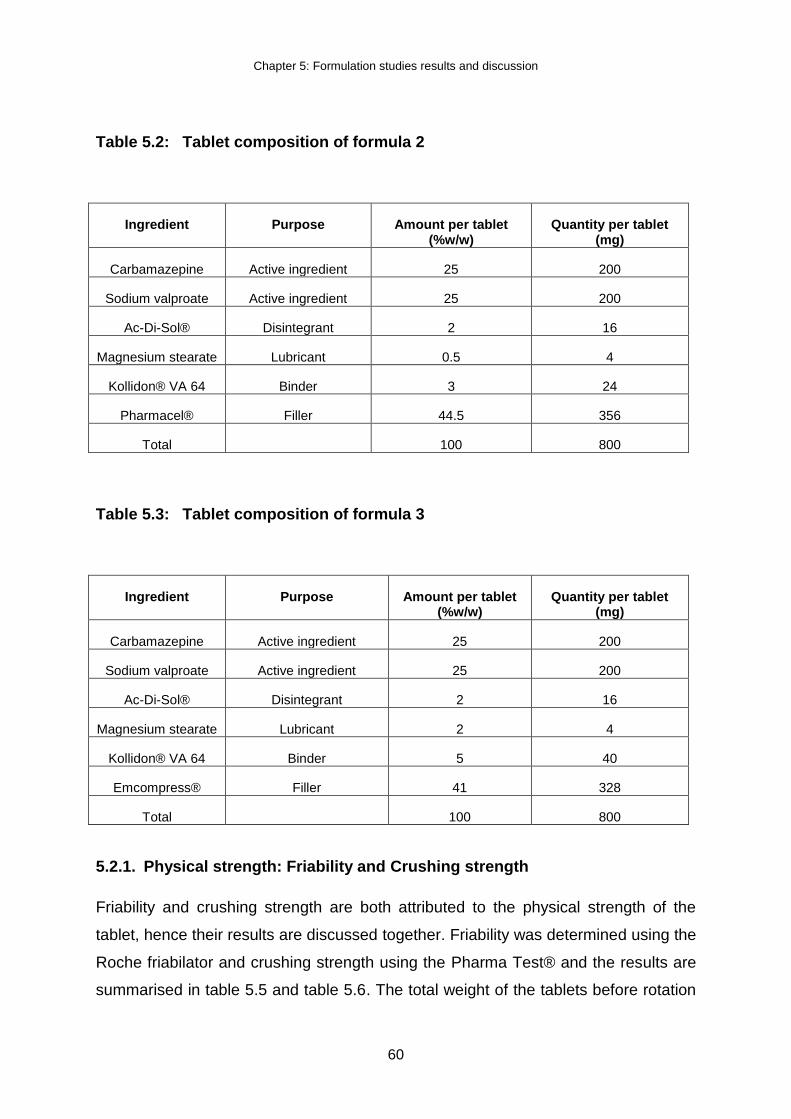
Chapter 5: Formulation studies results and discussion
60
Table 5.2: Tablet composition of formula 2
Ingredient Purpose Amount per tablet (%w/w)
Quantity per tablet (mg)
Carbamazepine Active ingredient 25 200
Sodium valproate Active ingredient 25 200
Ac-Di-Sol® Disintegrant 2 16
Magnesium stearate Lubricant 0.5 4
Kollidon® VA 64 Binder 3 24
Pharmacel® Filler 44.5 356
Total 100 800
Table 5.3: Tablet composition of formula 3
Ingredient Purpose Amount per tablet (%w/w)
Quantity per tablet (mg)
Carbamazepine Active ingredient 25 200
Sodium valproate Active ingredient 25 200
Ac-Di-Sol® Disintegrant 2 16
Magnesium stearate Lubricant 2 4
Kollidon® VA 64 Binder 5 40
Emcompress® Filler 41 328
Total 100 800
5.2.1. Physical strength: Friability and Crushing strength
Friability and crushing strength are both attributed to the physical strength of the
tablet, hence their results are discussed together. Friability was determined using the
Roche friabilator and crushing strength using the Pharma Test® and the results are
summarised in table 5.5 and table 5.6. The total weight of the tablets before rotation

Chapter 5: Formulation studies results and discussion
61
was 154.5 g, 153.9 g and 151.1 g for formulation 1, 2 and 3 respectively. After
rotation the average mass of the tablets was 154.3 g, 153.6 g and 151.0 g and the
percentage friability was 0.129% for formulation 1, 0.195% for formulation 2 and
0.066% for formulation 3. The results showed that all the formulations were in
accordance to BP specifications. The BP specifications states that the tablets should
not lose more than 1% of their total weight (British Pharmacopoeia, 2014).
The results for crushing strength complimented the friability results. The tablets
showed a crushing strength of 121.4 N, 113.6 N and 118.6 N for formulation 1, 2 and
3 respectively. According to Ayorinde & Itiola (2012), the recommended crushing
strength for tablets is 40 N to 150 N, which deem the results for all the formulations
successful. Accordingly, it can be concluded that the tablets were strong enough to
withstand abrasion.
Table 5.5: Crushing strength of the tablets
Formulation Crushing force (N)
Formula 1 121.4 ± 11.34
Formula 2 113.6 ± 15.84
Formula 3 118.6 ± 10.74
Table 5.6: Percentage friability of the three formulations
Formulation Total weight before
rotation (g)
Total weight after
rotation (g)
% Friability
Formulation1 154.5 154.3 0.129
Formulation 2 153.9 153.6 0.195
Formulation 3 151.1 151.0 0.066
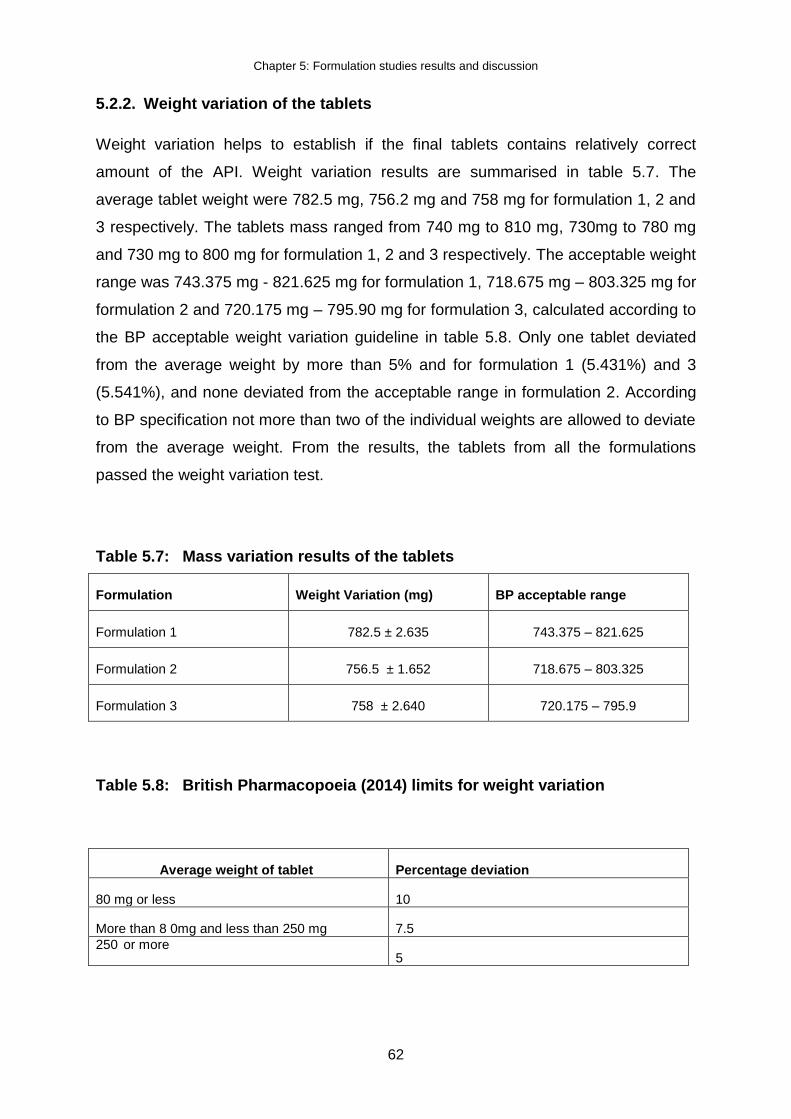
Chapter 5: Formulation studies results and discussion
62
5.2.2. Weight variation of the tablets
Weight variation helps to establish if the final tablets contains relatively correct
amount of the API. Weight variation results are summarised in table 5.7. The
average tablet weight were 782.5 mg, 756.2 mg and 758 mg for formulation 1, 2 and
3 respectively. The tablets mass ranged from 740 mg to 810 mg, 730mg to 780 mg
and 730 mg to 800 mg for formulation 1, 2 and 3 respectively. The acceptable weight
range was 743.375 mg - 821.625 mg for formulation 1, 718.675 mg – 803.325 mg for
formulation 2 and 720.175 mg – 795.90 mg for formulation 3, calculated according to
the BP acceptable weight variation guideline in table 5.8. Only one tablet deviated
from the average weight by more than 5% and for formulation 1 (5.431%) and 3
(5.541%), and none deviated from the acceptable range in formulation 2. According
to BP specification not more than two of the individual weights are allowed to deviate
from the average weight. From the results, the tablets from all the formulations
passed the weight variation test.
Table 5.7: Mass variation results of the tablets
Formulation Weight Variation (mg) BP acceptable range
Formulation 1 782.5 ± 2.635 743.375 – 821.625
Formulation 2 756.5 ± 1.652 718.675 – 803.325
Formulation 3 758 ± 2.640 720.175 – 795.9
Table 5.8: British Pharmacopoeia (2014) limits for weight variation
Average weight of tablet Percentage deviation
80 mg or less 10
More than 8 0mg and less than 250 mg 7.5
250 or more 5

Chapter 5: Formulation studies results and discussion
63
5.2.3. Disintegration
To establish whether the tablets, made from the three batches of carbamazepine
and sodium valproate powders, would undergo disintegration after administration,
disintegration tests were performed, as described in Chapter 3. The results are
summarised in Table 5.9 and graphically presented in Figure 5.1. Formulation 1
contained 3.00% Ac-Di-Sol® (50:50 intragranula:extragranula ratio), formulation 2
(70:30) and formulation 3(100:0) contained 2.00% Ac-Di-Sol® concentration. For
formulation 1, the tablets disintegrated at approximately 10 minutes, which was
approximately double the time it took for the 100:0 ratio (6.17 minutes) to
disintegrate. This was expected as the ratio difference between the two formulations
was double. For formulation 2, the tablets disintegrated at approximately 3 minutes,
approximately one third of formulation 1 and half of formulation 3. All of the tablets
from the three batches disintegrated within the prescribed 15 minutes, as per the BP
specification. However, the tablets needed to contain at least a 70:30 weight
distribution for a total of Ac-Di-Sol® concentration of 2.00% w/w to render rapid
tablet disintegration. Based on the results from the crushing strength, it was
expected that tablets of formulation 2 would render a rapid disintegration times
compared to formulations 1 and 3. The disintegration time of tablets increases with
an increase in physical strength (Juban, Briancon, Puel, Hoc & Lehon, 2017).
Table 5.9: The ratio of the internal granular disintegrant percentage against the external percentage Ac-Di-Sol® per tablet mixture against disintegration time. (Ac-Di-Sol® at 2.00% and 3.00% w/w of total powder mixture).
Intragranular disintegrant percentage: Extragranular disintegrant (%)
Disintegration time (minutes)
Formulation 1 50:50 10.22 ± 3.33
Formulation 2 70:30 3.71 ± 1.38
Formulation 3 100:0 6.17 ± 1.36
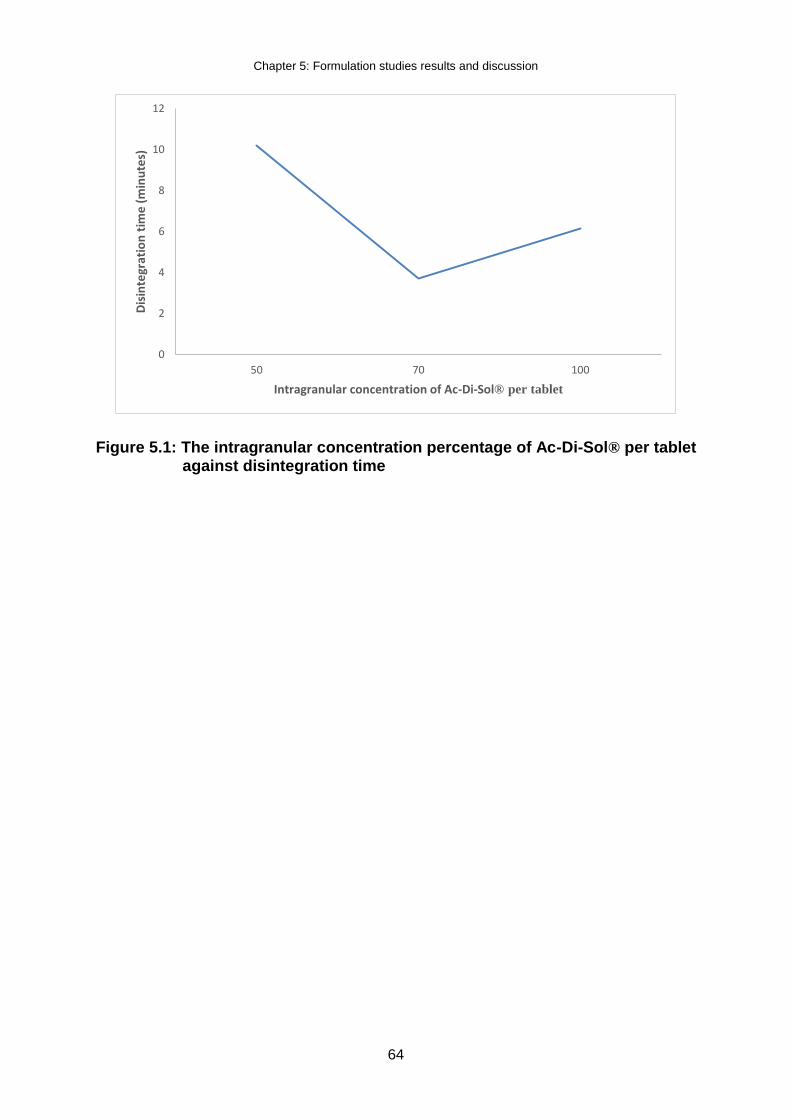
Chapter 5: Formulation studies results and discussion
64
Figure 5.1: The intragranular concentration percentage of Ac-Di-Sol® per tablet against disintegration time
0
2
4
6
8
10
12
50 70 100
Dis
inte
grat
ion
tim
e (
min
ute
s)
Intragranular concentration of Ac-Di-Sol® per tablet
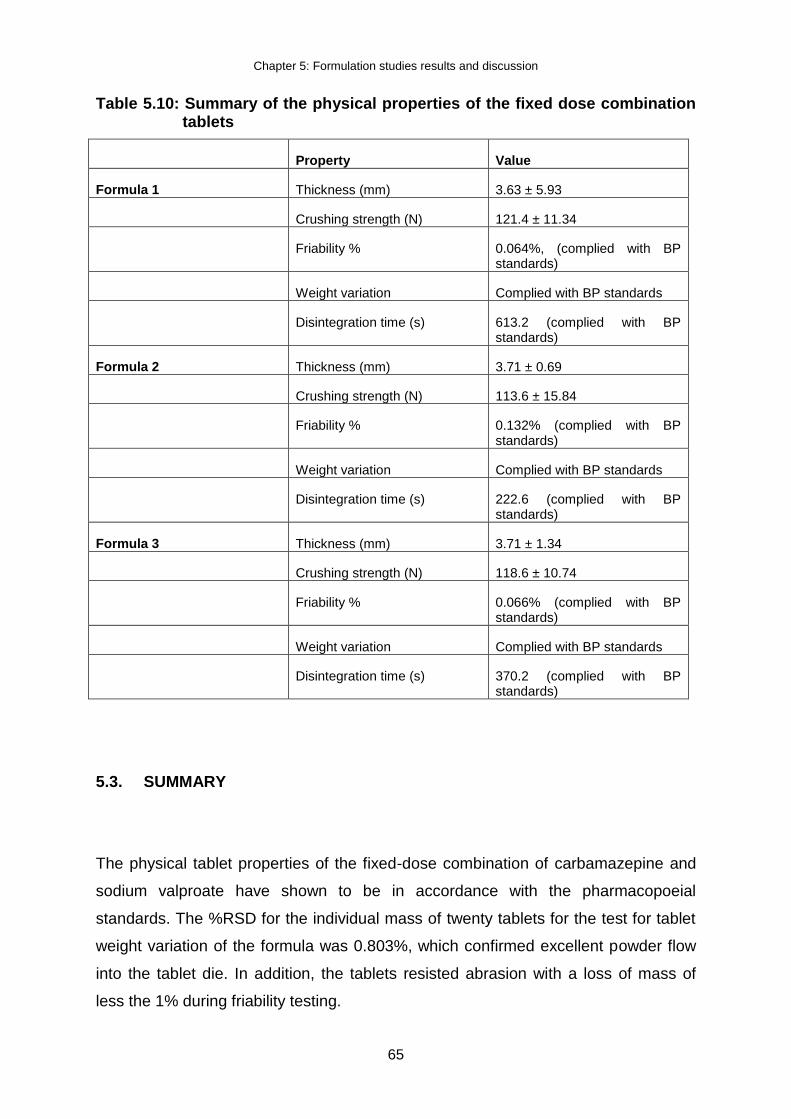
Chapter 5: Formulation studies results and discussion
65
Table 5.10: Summary of the physical properties of the fixed dose combination tablets
Property Value
Formula 1 Thickness (mm) 3.63 ± 5.93
Crushing strength (N) 121.4 ± 11.34
Friability % 0.064%, (complied with BP standards)
Weight variation Complied with BP standards
Disintegration time (s) 613.2 (complied with BP standards)
Formula 2 Thickness (mm) 3.71 ± 0.69
Crushing strength (N) 113.6 ± 15.84
Friability % 0.132% (complied with BP standards)
Weight variation Complied with BP standards
Disintegration time (s) 222.6 (complied with BP standards)
Formula 3 Thickness (mm) 3.71 ± 1.34
Crushing strength (N) 118.6 ± 10.74
Friability % 0.066% (complied with BP standards)
Weight variation Complied with BP standards
Disintegration time (s) 370.2 (complied with BP standards)
5.3. SUMMARY
The physical tablet properties of the fixed-dose combination of carbamazepine and
sodium valproate have shown to be in accordance with the pharmacopoeial
standards. The %RSD for the individual mass of twenty tablets for the test for tablet
weight variation of the formula was 0.803%, which confirmed excellent powder flow
into the tablet die. In addition, the tablets resisted abrasion with a loss of mass of
less the 1% during friability testing.

Chapter 5: Formulation studies results and discussion
66
The physical properties of the fixed-dose combination of carbamazepine and sodium
valproate tablets showed to be viable for manufacturing purposes. All the
formulations passed the disintegration test. However, the establishment of feasible
physical properties have no significance unless the integrated drug(s) can carry out
is therapeutic function. In the majority of cases, this can only occur when the drug
substance has dissolved in the fluids of the gastrointestinal tract. Following in
Chapter 6 is the evaluation of the dissolution profiles of the fixed-dose combination.

Chapter 6: HPLC method development and validation and dissolution
67
CHAPTER 6:
HPLC METHOD DEVELOPMENT, VALIDATION AND
DISSOLUTION
6.1. INTRODUCTION
To determine if the fixed dose combination possess the antiepileptic function, the
drug substance has to dissolve in the gastrointestinal tract fluids and achieve
systemic absorption. It is imperative to determine the pharmaceutical availability of
the two APIs in the fixed-dose combination. Assay procedures are intended to
measure the analyte present in a given sample. In this chapter, the dissolution
profiles of carbamazepine and sodium valproate will be presented and discussed as
well as the HPLC method that was employed to quantify the concentrations of the
two APIs in the dissolution samples.
6.2. HIGH PERFOMANCE LIQUID CHROMATOGRAPHY
A validated HPLC method for the analysis of carbamazepine and sodium valproate
was used to quantify the concentration of carbamazepine and sodium valproate in
the dissolution samples.
6.2.1. Validation of the HPLC method for carbamazepine and sodium valproate
This method was developed and validated at the Analytical Technology Laboratory,
North-West University, Potchefstroom, South Africa.
6.2.1.1. Linearity
The linearity for carbamazepine was determined by performing linear regression
analysis on the plot. Standard solutions were prepared in methanol to obtain
concentrations ranging from 0.01 μg/ml to 253.00 μg/ml for carbamazepine. The
regression value was at 0.9977 and the Y-intercept was 5.6871 for carbamazepine
as displayed in Figure 6.1.

Chapter 6: HPLC method development and validation and dissolution
68
Figure 6.1: The linear regression graph of carbamazepine to determine linearity and range
The linearity for sodium valproate was determined by performing linear regression
analysis on the plot. Standard solutions were prepared in methanol to obtain
concentrations ranging from 0.01 μg/ml to 256.00 μg/ml for sodium valproate. The
regression value (R2) was greater than 0.9946 and the Y-intercept was 1.7053 for
sodium valproate as displayed in Figure 6.2.

Chapter 6: HPLC method development and validation and dissolution
69
Figure 6.2: The linear regression graph of sodium valproate to determine linearity and range
The regression coefficient of >0.998 is generally considered as evidence of
acceptable fit of the data to the regression line (Shabir, 2004). The demonstration
coefficient (r2) obtained for the regression line demonstrates an excellent relationship
between peak area and concentration of carbamazepine (figure 6.1). The r2
obtained for the regression line in figure 6.2 demonstrates a good relationship
between peak area and concentration of sodium valproate in the FDC formulation.
The linearity of the method demonstrated a proportional relationship of response
versus analyte concentration over the working range of the FDC formulation.
6.2.1.2. Selectivity
For specificity a solution from the placebo powder similar to the sample solution was
prepared in methanol. The placebo did not generate any peaks that interfered with
the determination of the active ingredients.

Chapter 6: HPLC method development and validation and dissolution
70
6.2.1.3. Accuracy
Accuracy was determined by, amounts of the placebo equivalent to the amount of
sample powder that would contain 80%, 100% and 120% of 100 mg of
carbamazepine and sodium valproate were weighed. Quantities of the active
ingredients at concentrations of approximately 80%, 100% and 120% respectively of
the expected sample concentration, known as spiking, were made up to volume and
filtered. The samples were analysed in triplicate by means of HPLC. The results for
accuracy are displayed in Table 6.1 and Table 6.2 for carbamazepine and sodium
valproate respectively.
Table 6.1: Results for carbamazepine to determine accuracy
Conc. spiked Area Mean Recovery
µg/ml µg/ml %
150.60 4751.5
4774.6 4762.9 4763 166.2 110.3
148.80 4414.2
4406.7 4409.8 4410 153.7 103.3
149.40 4630.6
4631.6 4630.8 4631 152.3 101.9
200.8 6189.3
6195.6 6191.1 6192 203.9 101.6
198.4 5994.8
5977.3 5715.9 5986 197.1 99.3
199.2 6050.3
6061.5 6056.2 6056 199.4 100.1
251 7288.8
7295.6 7291.6 7292 240.3 95.7
248 7150.4
7098.5 7123.1 7124 234.8 94.7
249 7263.5
7279.9 7272.6 7272 239.6 96.2
Statistical analysis
Mean 97.9
SD 2.5
%RSD 2.6

Chapter 6: HPLC method development and validation and dissolution
71
Table 6.2: Results for sodium valproate to determine accuracy
Conc. spiked Area Mean Recovery
µg/ml µg/ml %
153.00 104.3
104.7 106 105 180.5 118.0
151.20 101.6
101.7 102.7 102 175.6 116.1
150.00 104.2
104.2 103.3 104 180.3 120.0
204.0 141.4
141.8 142.8 142 244.9 120.0
201.6 130.4
128.3 128.3 129 223.6 110.9
200.0 133.6
134 134.4 134 231.3 115.7
255 156.6
157.1 157.3 157 271.3 106.4
252 149.6
149.8 150.6 150 258.9 102.7
250 152.8
150.4 152.8 152 262.2 104.9
Statistical analysis
Mean 110.1
SD 6.1
%RSD 5.6
The ICH recommends collecting data from a minimum of nine determinations over a
minimum of three concentration levels covering the specified range (e.g., three
concentrations, three replicates each). In the present study, a number of different
solutions were prepared with known added amounts of carbamazepine and sodium
valproate and injected in triplicate. Percent recoveries of response factor
(area/concentration) were calculated. The results of accuracy studies are shown in
table 6.1 and table 6.2, and it is evident that the method is accurate within the
desired recovery range.
6.2.1.4. Precision
Precision was determined by performing HPLC analysis of a low, medium and high
concentration sample for both carbamazepine and sodium valproate. To determine
precision, amounts of the placebo equivalent to the amount of sample powder that
would contain 80%, 100% and 120% of 100 mg of carbamazepine and sodium
valproate were weighed. Quantities of the active ingredients at concentrations of

Chapter 6: HPLC method development and validation and dissolution
72
approximately 80%, 100% and 120% respectively of the expected sample
concentration, known as spiking, were made up to volume and filtered. The samples
were analysed in triplicate by means of HPLC. The results for precision are
displayed in Table 6.3 and Table 6.4 for carbamazepine and sodium valproate
respectively. further subdivided into within-run, intra-batch precision or repeatability,
which assesses precision during a single analytical run, and between-run, interbatch
precision or repeatability, which measures precision with time, and may involve
different analysts, equipment, reagents, and laboratories.
Table 6.3: Results for carbamazepine to determine precision
Standard
µg/ml Area
Area Area Mean
200.9 21074.8
20918.7 20996.8 20996.750
Spiked conc
µg/ml Area
Area Area Mean Conc. µg/ml %
605.30 13849.5
14260.8 14055.3 14055.2 168.3 84.1
602.60 13845.4
13676.9 13761.3 13761.2 165.5 82.8
602.90 14545.2
14441.2 14493.2 14493.2 174.2 87.1
754.60 17404.5
17473.9
17439.2
17439.2
167.8 83.9
756.20 17153.9
17421.3
17287.6 17287.6 165.7 82.8
756.70 17471.0
17666.9 17570.2 17569.0 168.3 84.1
908.20 20793.6
20976.6 20885.1 20885.1 166.7 83.3
908.40 21728.0
22085.5 21906.9 21906.8 174.8 87.4
908.00 21805.6
22174.1 21990.0 21989.9 175.5 87.8
Statistical analysis
Mean 84.82
SD 1.90
RSD% 2.25

Chapter 6: HPLC method development and validation and dissolution
73
Table 6.4: Results for sodium valproate to determine precision
Standard
µg/ml Area
Area Area Mean
200 385.35
381.96 383.66 383.655
Spiked conc
µg/ml Area
Area Area Mean Conc. µg/ml %
605.30 271.0 289.3 280.3 280.2 182.8 91.4
602.60 283.2 288.1 285.5 285.6 187.2 93.6
602.90 282.9 285.6 284.1 284.2 186.2 93.1
754.60 337.5 343.2 340.5
340.4 178.1 89.1
756.20 340.2 350.3 335.1 345.2 180.3 90.1
756.70 347.3 354.7 351.0 351.0 183.2 91.6
908.20 415.7 423.0 419.2 419.3 182.3 91.2
908.40 433.5 437.3 435.7 435.4 189.3 94.6
908.00 429.5 469.6 449.1 449.6 195.5 97.8
Statistical analysis
Mean 92.48
SD 2.47
RSD% 2.67

Chapter 6: HPLC method development and validation and dissolution
74
Table 6.5: Results for carbamazepine to determine intra-day precision
Carbamazepine concentrations (µg/ml)
Mean % recovered
Standard deviation %RSD
155.1
98.00
0.69
0.71
157.9
156.0
221.8
103.27
0.46
0.44
218.7
218.3
272.4
104.06
1.17
1.12
278.6
278.7
The acceptance criterion for %RSD was set at 2.0% or less. The intra-day precision
for carbamazepine was acceptable with an RSD of 1.12% or less.
Table 6.6: Results for sodium valproate to determine intraday precision
Sodium valproate concentrations (µg/ml)
Mean % recovered
Standard deviation %RSD
136.8
86.4
0.69
0.80
137.0
136.0
110.3
87.34
0.81
0.93
107.8
107.3
131.6
86.06
1.05
1.22
135..1
134.8
The acceptance criteria for %RSD was set at 2.0% or less. The intra-day precision
for sodium valproate was acceptable with an RSD of 1.22% or less.
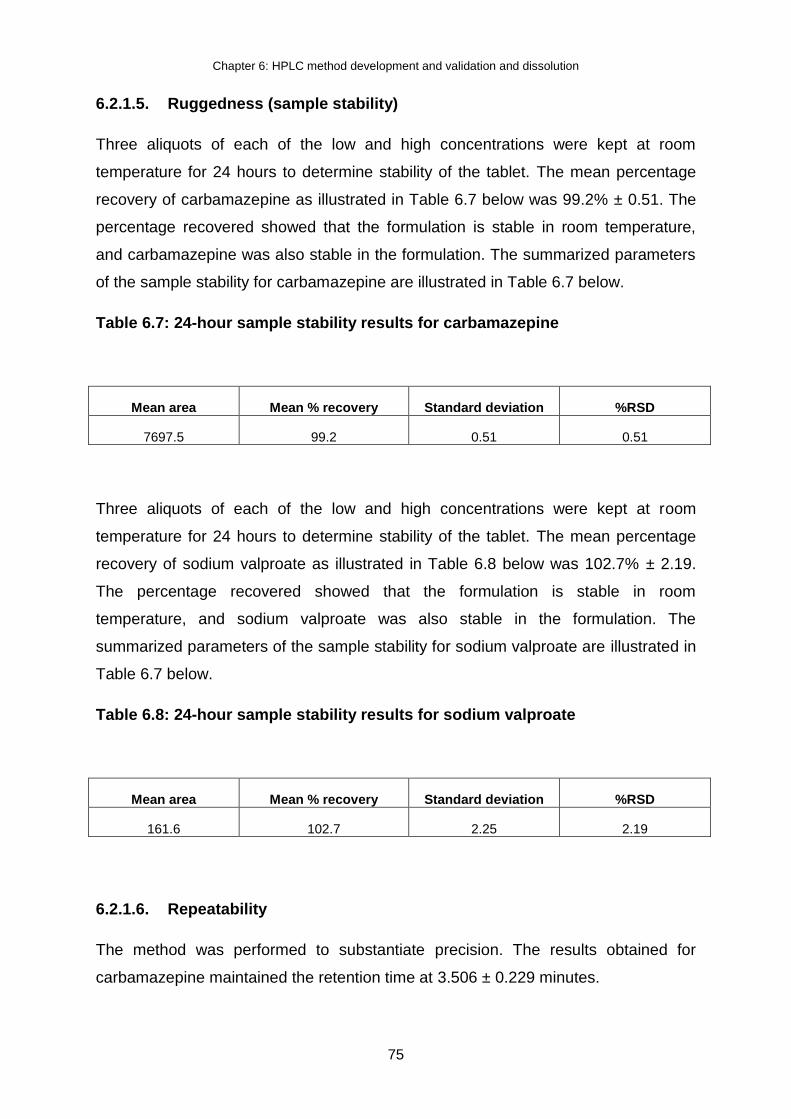
Chapter 6: HPLC method development and validation and dissolution
75
6.2.1.5. Ruggedness (sample stability)
Three aliquots of each of the low and high concentrations were kept at room
temperature for 24 hours to determine stability of the tablet. The mean percentage
recovery of carbamazepine as illustrated in Table 6.7 below was 99.2% ± 0.51. The
percentage recovered showed that the formulation is stable in room temperature,
and carbamazepine was also stable in the formulation. The summarized parameters
of the sample stability for carbamazepine are illustrated in Table 6.7 below.
Table 6.7: 24-hour sample stability results for carbamazepine
Mean area Mean % recovery Standard deviation %RSD
7697.5 99.2 0.51 0.51
Three aliquots of each of the low and high concentrations were kept at room
temperature for 24 hours to determine stability of the tablet. The mean percentage
recovery of sodium valproate as illustrated in Table 6.8 below was 102.7% ± 2.19.
The percentage recovered showed that the formulation is stable in room
temperature, and sodium valproate was also stable in the formulation. The
summarized parameters of the sample stability for sodium valproate are illustrated in
Table 6.7 below.
Table 6.8: 24-hour sample stability results for sodium valproate
Mean area Mean % recovery Standard deviation %RSD
161.6 102.7 2.25 2.19
6.2.1.6. Repeatability
The method was performed to substantiate precision. The results obtained for
carbamazepine maintained the retention time at 3.506 ± 0.229 minutes.
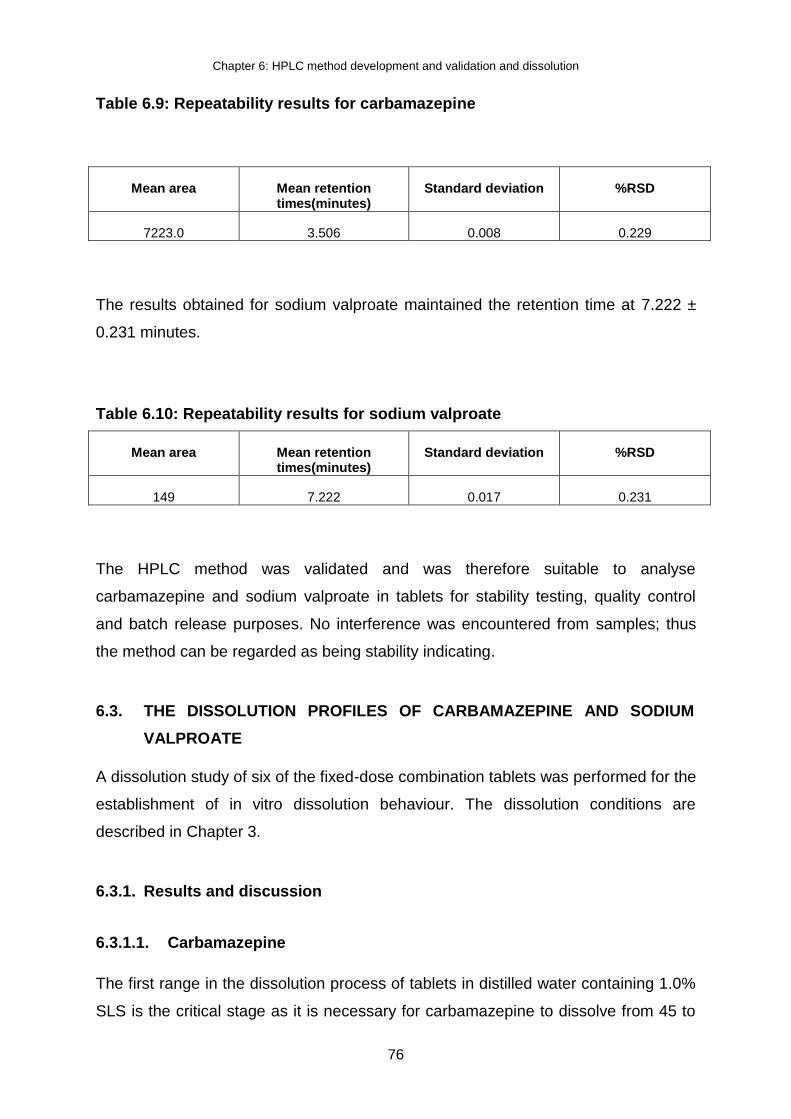
Chapter 6: HPLC method development and validation and dissolution
76
Table 6.9: Repeatability results for carbamazepine
Mean area Mean retention times(minutes)
Standard deviation %RSD
7223.0 3.506 0.008 0.229
The results obtained for sodium valproate maintained the retention time at 7.222 ±
0.231 minutes.
Table 6.10: Repeatability results for sodium valproate
Mean area Mean retention times(minutes)
Standard deviation %RSD
149 7.222 0.017 0.231
The HPLC method was validated and was therefore suitable to analyse
carbamazepine and sodium valproate in tablets for stability testing, quality control
and batch release purposes. No interference was encountered from samples; thus
the method can be regarded as being stability indicating.
6.3. THE DISSOLUTION PROFILES OF CARBAMAZEPINE AND SODIUM
VALPROATE
A dissolution study of six of the fixed-dose combination tablets was performed for the
establishment of in vitro dissolution behaviour. The dissolution conditions are
described in Chapter 3.
6.3.1. Results and discussion
6.3.1.1. Carbamazepine
The first range in the dissolution process of tablets in distilled water containing 1.0%
SLS is the critical stage as it is necessary for carbamazepine to dissolve from 45 to

Chapter 6: HPLC method development and validation and dissolution
77
75% in the first 15 minutes (USP, 2012). In this fixed dose combination, 20.02% was
released within the first 10 minutes. The number gradually increased to 41.28% at 20
minutes and by 30 minutes about 59.98% was already released. This was not
entirely undesirable, as an immediate release of the carbamazepine dose was
desirable.
According to the USP (2012), the second stage in the dissolution process is that the
total amount of carbamazepine dissolved is not less than 75% after 60 minutes. It
was found that the dissolution values of the prepared fixed dose combination tablets
were more than 95% after 60 minutes. The remainder of carbamazepine dissolved
rapidly as expected from 45 minutes onwards as shown in Figure 6.4. This showed
that the formulation was conforming to the set standards of the second stage of
dissolution process listed in the United States Pharmacopoeia.
Between 60 and 75 minutes, the rotations per minute (rpm) was changed from 75
rpm to 250 rpm to ensure complete dissolution. After 75 minutes, about 100.0% was
dissolved, which meant that carbamazepine reached complete dissolution from the
prepared tablets.
Figure 6.3: The dissolution profile of carbamazepine from six FDC tablets
0,0
20,0
40,0
60,0
80,0
100,0
120,0
0 10 20 30 40 50 60 70 80
% d
rug
rele
ase
Time (minutes)

Chapter 6: HPLC method development and validation and dissolution
78
Figure 6.4: The mean percentage of amount of carbamazepine dissolved against time
6.3.1.2. Sodium valproate
In this fixed dose combination, 29.33% was released within the first 10 minutes. The
number gradually increased to 39.75% at 20 minutes and by 30 minutes about
47.42% was already released. This was not entirely undesirable, as an immediate
release of the sodium valproate dose was desirable.
According to the USP (2012), the second stage in the dissolution process is that the
total amount of sodium valproate dissolved is not less than 75% after 60 minutes. It
was found that the dissolution values of the prepared fixed dose combination tablets
were less than 75% after 60 minutes, with sodium valproate having released only
59.25% at 60 minutes. The rate at which sodium valproate was released from the
fixed dose combination was not entirely satisfactory. The desired complete
percentage release was expected within 60 minutes at the set dissolution
parameters.
Between 60 and 75 minutes, the rotations per minute (rpm) was changed from 75
rpm to 250 rpm to ensure complete dissolution. After 75 minutes, about 100.0% was
0
20
40
60
80
100
120
0 10 20 30 40 50 60 70 80
% d
rug
rele
ase
Time (minutess)

Chapter 6: HPLC method development and validation and dissolution
79
dissolved, which meant that sodium valproate reached complete dissolution from the
prepared tablets.
Figure 6.5: The dissolution profile of sodium valproate from six FDC tablets
Figure 6.6: The mean percentage of amount of sodium valproate dissolved against time
0,0
20,0
40,0
60,0
80,0
100,0
120,0
0 10 20 30 40 50 60 70 80
%d
rug
rele
ase
Time (minutes)
0
20
40
60
80
100
120
0 10 20 30 40 50 60 70 80
%d
rug
rele
ase
Time (minutes)
Chapter 6: HPLC method development and validation and dissolution
80
6.4. SUMMARY
The dissolution profiles of carbamazepine and sodium valproate from the tablets
displayed a rapid initial release of both the APIs, followed bya very slow release for
sodium valproate, and a secondary release stage for sodium valproate again. The
dissolution profile of carbamazepine in 1% SLS revealed complete dissolution within
45 minutes.
An analytical procedure was developed and validated to measure the concentrations
of carbamazepine and sodium valproate from the fixed-dose combination released
during dissolution. The analytical results presented evidence that the pharmaceutical
quality by design concept maximise satisfactory ingredient compatibility, stability and
expected dissolution performance.
The method performed well and should be suitable to analyse carbamazepine and
sodium valproate in products for stability testing, quality control and batch release
purposes. To develop a fixed-dose combination with improved potential absorption
rates and oral bioavailability necessitated the study of the dissolution model of the
APIs. Following in Chapter 7 is conclusions derived from the overall study, and
recommendations for future studies.

Chapter 7: Conclusions, limitations and recommendations
81
CHAPTER 7:
CONCLUSIONS, LIMITATIONS AND RECOMMENDATIONS
7.1. INTRODUCTION
The focus in this chapter is to draw conclusions from the study with regard to the
specific objectives outlined in Chapter 1. A brief overview of the content of the
dissertation and the summary of the findings will be provided. The limitations of the
study will be listed with a conclusion and recommendations for future studies.
7.2.1. Overview of the content of the dissertation
This dissertation consists of seven chapters that was divided into:
Chapter 1 provided the background and overview of the study, the problem
statement, the aim of the study, research questions and objectives of the study.
Chapter 2 focused on literature review, checking what other studies say about the
study and the recent treatment modalities of epilepsy that encouraged the need
for the development of a FDC tablet consisting of carbamazepine and sodium
valproate.
Chapter 3 gave an overview of the apparatus and methods that were used in the
study
Chapter 4 provided the results and discussions of the preformulation studies.
Chapter 5 represented the results and discussions of formulation and post-
formulation studies
Chapter 6 represented the results and discussions of HPLC method development
and validation and dissolution studies of the FDC tablet of carbamazepine and
sodium valproate that was formulated.
Chapter 7, which is this one revolves around drawing conclusions from the
results obtained and list the limitations of the study with recommendations for
future studies.

Chapter 7: Conclusions, limitations and recommendations
82
7.2.2. Conclusions
Epilepsy is one of the common neurological disorders that have social impact on
people living with epilepsy. In the 17th and 18th centuries, epilepsy was classified as
a mental disorder in Europe and a debate of whether it was a mental or a
neurological disorder broke out during those years. The treatment modalities around
epilepsy have always been focused on monotherapy. As time went by, monotherapy
could not successfully treat epilepsy as was, hence polytherapy was introduced.
According to NICE guidelines, polytherapy ensured that the medications that were
used were of different classes of antiepileptics and carbamazepine and sodium
valproate were the most common drugs prescribed.
The study aimed at reducing the burden of taking more than one tablet for epilepsy
and developed a fixed dose combination tablet of carbamazepine and sodium
valproate, at the lowest dose of 200mg/200mg per tablet. Following are the
conclusions derived on the preformulation studies, formulation and post-formulation
studies as well as HPLC method development and dissolution studies
7.2.2.1. Preformulation studies
The preformulation studies that were done considered powder flow, drug-drug
compatibility, drug-excipients compatibility, powder compressibility and particle size
distribution. From the results that were obtained, the study drew the following
conclusions:
Carbamazepine had fair flowability and sodium valproate had excellent
flowability. As the two drugs were mixed together to make the FDC tablet, the
flow of the mixture, which included a flow aid was excellent.
With the four methods that measured drug-drug compatibility, all of them
revealed that the drugs were compatible with one another and could be used
together with little or no chemical interactions.
The drug-excipient compatibility was measured using only one method, that
being DSC. The results revealed that the two drugs were compatible with the
excipients that were used. One method however, was not enough to critic the
compatibility between the drugs and the excipients used hence, commercially

Chapter 7: Conclusions, limitations and recommendations
83
available tablets of carbamazepine (sold under the trade name Tegretol®) and
sodium valproate (sold under the trade name Epilim®) were checked for the
excipients that were used in their development. It was found that the two tablets
as the single entities, used the same excipients, and most of the excipients were
used in the formulation of the FDC tablet of carbamazepine and sodium valproate
in this study.
The particle size distribution of both powders were good and showed good
distribution, which denoted good flowability.
The overall conclusion on the preformulation studies, is that the results provided an
insight into what of a formulation would be made for the fixed dose combination
between carbamazepine and sodium valproate, which the study opted for a tablet.
From the compatibility studies, it was easy to choose the correct and suitable
excipients of the FDC tablet, hence the preformulation studies were a success.
7.2.2.2. Formulation studies
The tablets that were formulated used to methods, direct compression method and
wet granulation method. The following conclusions were drawn from the results
obtained:
The tablets that were manufactured on first attempt using direct compression
method were not smooth, the tablet weight was too little and the batch failed. The
flow aid that was added to the mixture was too little, hence the batch failed.
On the second attempt, using direct compression still, the batch was successful
but the tablets were not smooth still, which led to the development of the third
batch of the FDC tablets that were manufactured using the wet granulation
method.
The first attempt with the wet granulation method produced very soft tablets that
would easily break upon handling, and the observation was that the binder was
too little and the lubricant was too much.
After numerous attempt, tablets that were complying with standards set by the BP
and the USP were formulated, using a different filler and adequate proportions of
the lubricant and binder.

Chapter 7: Conclusions, limitations and recommendations
84
The overall conclusion on the formulation of the FDC tablets of carbamazepine and
sodium valproate is that the formulation was successful.
7.2.2.3. Post-formulation studies
Post formulation studies that were done included non-official and official
pharmacopoeial tests. The following are the conclusions that were drawn from the
results:
All the tests that were done complied with the set standards.
Weight variation test confirmed that the weight of the FDC tablets did not deviate
much from the specified tablet weight, which was calculated to be 800 mg, with
the average weight of the first batch being at 782.5 mg, the second at 756.5 mg
and the third one at 758 mg.
Although the weight was a bit lower that the specified weight, not more than two
of the individual weights of each of the tablet deviated from the average weight by
more than the 5% deviation and none deviated by more than twice that
percentage. This showed that the batches were successful
The friability test on all three batches was less than 1% and that meant the
tablets passed the test and were good for handling during transportation and
were less prone to abrasion.
The disintegration test was also successful on all three batches, which indicated
that the superdisintegrant that was used was adequate and the tablets would
render rapid disintegration.
The tablet dimensions indicated that the tablet will be convenient for patients’
acceptability.
The overall conclusion on the post-formulation test revealed that the development of
the FDC tablet of carbamazepine and sodium valproate was successful and it met
the set BP and USP standards, and further studies can be done to put the product
on the market.

Chapter 7: Conclusions, limitations and recommendations
85
7.2.2.4. HPLC method development and validation and dissolution
The method was developed and validated to enable the researcher to check for drug
content and perform in vitro dissolution studies. The drug content of carbamazepine
and sodium valproate in the FDC tablet was checked using the method and the
results were satisfactory. A short 24-hour stability was also done using the method
and it showed that formulation was stable under set conditions and the method was
suitable for the study.
The dissolution study checked for the release profiles of carbamazepine and sodium
valproate from the formulation. Carbamazepine is released faster compared to
sodium valproate, reaching optimum release within 45 minutes whereas sodium
valproate only reached optimum release after an hour at increase rotations per
minute (rpm). The USP and the BP don’t specify the medium that must be used for
running dissolution for sodium valproate, but sodium lauryl sulphate (SLS) is
accepted as dissolution medium. Given that the SLS was the most suitable medium
for carbamazepine according to USP (2014), the conditions favored the release of
carbamazepine more than sodium valproate, hence the marked difference. Despite
the different release profiles, both carbamazepine and sodium valproate followed an
immediate release profile behavior, which was require of the formulation. The
method was therefore suitable for the FDC tablet was successful.
7.2.3. Limitations
There are a few limitations regarding the database employed in the study. The drug-
excipients compatibility studies were analyzed using one method. It lacks validation
and supporting data that the excipients used in the study are compatible with
carbamazepine and sodium valproate. The reason for using one method for drug-
excipients compatibility analysis was lack of material to carry out the experiments.
7.2.4. Recommendations
Based on the current FDC development, new technologies for formulation and
successful assessments of individual drug components for drug-drug interactions

Chapter 7: Conclusions, limitations and recommendations
86
and drug-excipients interactions, the study recommends the following for future
studies:
The utilisation of more than one method to analyse drug-excipients interactions to
validate the results and findings. Use FTIR, XRPD and TAM analysis to
complement the DSC data obtained for drug-excipients interactions.
Include scanning electron microscope (SEM) analysis to determine particle size
and shape of carbamazepine and sodium valproate in order to complement
particle size analysis and the flow property parameters.
An investigation in order to determine the in vivo efficacy of carbamazepine and
sodium valproate FDC tablet.
A further study that can design different doses of carbamazepine-sodium
valproate FDC tablet for better management of epilepsy.
An investigation to design other oral fixed-dose combinations of antiepileptics.
An investigation of stability studies to establish the storage conditions, shelf lives
and retest intervals.
References
87
REFERENCES
About-Khalil, B., 2017. Selecting Rational Drug Combinations in Epilepsy. Therapy in
practice: 1-10.
Albsoul-Younes, A. Gharaibeh, L. Murtaja, A. A. Masri, A. Alabbadi, A & Al-Qudah,
A. A. 2016. Patterns of antiepileptic drugs use in epileptic pediatric patients in
Jordan. Neurosciences Journal, 21(3): 264-267.
Al-Hashemi, H. M. B. & Al-Amousi, O. S. B., 2018. A review on the angle of repose
of granular material. Powder Technology, 330(1): 397-417.
Ambrosio, A. F. Soares-da-Silva, P. Carvalho, C. M & Carvalho, AP. 2002.
Mechanisms of action of carbamazepine and its derivatives, oxcarbazepine, BIA 2-
093, and BIA 2-024. Neurological Research 27(1):121-130.
Appleton, R. E & Cross, J. H. 2015. Drug treatment of paediatric epilepsy. Lingfield:
Liverpool.
Aulton, M. E. 2007. Aulton, M.E. (Ed). The design and manufacture of medicines. 3rd
edition. Elsevier: Hungary.
Aulton, M. E. 2017. Aulton, M.E. (Ed). The design and manufacture of medicines. 5th
edition. Elsevier: Hungary
Ayorinde, J.O. Odeniyi, M.A. Itiola, A.O. 2012. Evaluation of Pharmaceutical and
Chemical Equivalence of Selected Brands of Diclofenac Sodium tablets. East and
Central African Journal of Pharmaceutical Sciences 15(1): 3 - 9
References
88
Bartlett, L. E., Pratt, N. & Roughead, E. E., 2017. Does tablet formulation alone
improve adherence and persistence: a comparison of ezetimibe fixed dose
combination versus ezetimibe separate pill combination?. British Journal of Clinical
Pharmacology, 83(1): 202-210.
Brink, H. I. van Rensburg, G. van der Walt, C. 2012. (Ed). Fundamentals of
Research Methodology for Health Care Professionals. 3rd edition. Juta: Cape Town.
British Pharmacopoeia. 2014. London: British Pharmacopoeia Commision.
Brunton, L. Chabner, B. Knollman, B. 2011. (Ed). The pharmacological basis of
therapeutics. 12th edition. McGraw Hill: New York.
Bunaciu, A. A., Udristioiu, E. g. & Aboul-Enein, H. Y., 2015. X-Ray Diffraction:
Instrumentation and Applications. Critical Reviews in Analytical Chemistry, 45(4):
289-299.
Buoli, M., Serati, M. A. & Altamura, C., 2014. Is the combination of a mood stabilizer
plus an antipsychotic more effective than mono-therapies in long-term treatment of
bipolar disorder?A systematic review. Journal of Affective Disorders: 12-18.
Chan, R., Wei, C.-y., Chen, Y.-t. & Benet, L. Z., 2016. Use of Biopharmaceutics Drug
Disposition Classification System (BDDCS) to Help Predict the Occurrence of
Idiosyncratic Cutaneous Adverse Drug Reactions Associated with Antiepileptic Drug
Usage. The AAPs Journal, 18(3): 757-766.
Chavda, H., Patel, C. & Anand, I., 2010. Biopharmaceutics Classification System.
Systematic Reviews in Pharmacy, 1(1): 62-69.
References
89
Daharwal, S. J. Jangade, R. K. Thakur, V. D. Sahu, B. P. 2013. Compatibility study
of Ambroxol HCl Drug-Excipients by using IR Spectroscopy. Asian Journal
pharmaceuticals 3(3):98.
Davies, N. E. C. G. 2013. Fixed-dose combination for adults accessing antiretroviral
therapy. South African Journal of HIV Medicine. 14(1): 1.
Dekker, P. A. 2002. Epilepsy: A manual for medical and clinical officers in Africa.
World Health Organization; Geneva. 17-25.
Desai, D. Wang, J. Wen, H. Li, X. and Timmins, P. 2013. Formulation design,
challenges, and development considerations for fixed dose combination (FDC) of
oral solid dosage forms. Journal of Pharmaceutical Development and Technology
18(6): 1265–1276.
Dicaire, N. M., Perras, F. A. & Bryce, D. L., 2014. 23Na magic-angle spinning and
double-rotation NMR study of solid forms of sodium valproate. Canadian Journal of
Chemistry, 92(1): 9-15.
Dichter, M. A., 2009. Emerging Concepts in the Pathogenesis of Epilepsy and
Epileptogenesis. Arch Neurology Journal, 66(4): 443-447.
Erik, K. S. L., William, E. R. & and Thomas, B., 2009. Antiepileptic Drug
Monotherapy: The Initial Approach in Epilepsy Management. Current
Neuropharmacology, 7(2): 77-82.
Goel, D & Mittal, M. 2015. Mono-Therapy versus Poly-Therapy: Ten Years Indian
Experience on Various Seizure Disorders. World Journal Neuroscience. Vol. 5: 350.
Gouws, J., 2015. Medicine Control Council Biostudies. MCC, 6(1): 26-28.
References
90
Guerreiro, C. A. M. 2008. Guidelines for drug treatment of epilepsy. Arq
Neuropsiquiatr 66(3-A): 591-599.
Haleem, R. M., Salem, M. Y. & Fatahallah, L. E. A., 2015. Quality in the
pharmaceutical industry- A literature review. Saudi Pharmaceutical Journal, 23(1):
463-469.
Hassan, B. A. R., 2012. Overview on Pharmaceutical Formulation and Drug Design.
Pharmaceutica Analytica Acta, 3(10): 2153-2435.
Henry, T. R. 2012. Seizures and Epilepsy: Pathophysiology and Principles of
Diagnosis. Epilepsy Board Review Manual. 1(1): 5-15.
International Council for Harmonisation. 2016. Guidance for industry, stability testing
of new drug substance and product. From:
http://www.fda.gov/RegulatoryInformation/Guidances/ucm122049.htm. (accessed 7
October 2016)
Islam, S. I, Al Aidarous, R. S, Jan, M. S., Dehlawi, F. A. 2013. Population
pharmacokinetics of carbamazepine and optimising its use in Saudi epileptic
children. International Journal of Medicine and Medical Sciences 1(4): 85-93.
Jayalekshmi, K. Palanisamy, K. Ramanathan, S. Akela, S. 2016. A Study on the
Adverse Drug Reactions Induced by Anti Epileptic Drugs in the Epileptic Patients.
Journal of Applied Pharmaceutical Science 6(5): 119-123.
Jefferys, J. G. R. 2002. Basic mechanisms of epilepsy. Oxford: USA.

References
91
Joshi, R. Tripathi, M. Gupta, P. Gulati, S. & Gupta, Y. K. 2017. Adverse effects &
drug load of antiepileptic drugs in patients with epilepsy: Monotherapy versus
polytherapy. The Indian Journal of Medical, 145(3): 317-326.
Jouyban, A., 2010. HANDBOOK OF SOLUBILITY DATA for PHARMACEUTICALS.
Boca Raton: CRC Press.
Juban, A. Briancon, S. Puel, F. Hoc, T. Lehon, C. N. 2017. Experimental study
oftensile strength of pharmaceutical tablets: effect of the diluent nature and
compression pressure. European Physical Journal,1(1): 1 – 4.
Karthik, V. V., 2016. Excipients used in the Formulation of Tablets. Research and
Reviews: Journal of Chemistry, 5(2):143-154.
Katzung, B.G. Masters, S.B. Trevor, A.J. (Ed). 2010. Basic & Clinical Pharmacology.
12th edition. McGraw-Hill Co. Inc.: United States.
Kharismi, R. R. A. Y. & Suryadi, S. H., 2018. Preparation and characterization of
Microcrystaline Cellulose Produced from Betung Bamboo (Dendrocalamus asper)
through Acid Hydrolysis. Journal of Young Pharmacists, 10(2): s79-s83.
Koo, O. 2010. Manufacturing Process Considerations For Fixed Dose Combination
Drug Products. From: http://www.americanpharmaceuticalreview.com/ (accessed 22
February 2017).
Kota, J., Ayalavajjala, P. S. & Sivasubramanian, R., 2015. DEVELOPMENT OF
ORALLY ADMINISTERED FIXED DOSE COMBINATION (FDC) PRODUCTS:
PHARMACOKINETIC AND BIOPHARMACEUTICAL CONSIDERATIONS.
International Journal of Pharmaceutical Sciences and Research, 6(8).

References
92
Krishna, M. V. & Madhavi, G. 2016. Quality by Design (QbD) approach to develop
HPLC method for eberconazole nitrate: Application to hydrolytic, thermal, oxidative
and photolytic degradation kinetics. Journal of Saudi Chemical Society, 20(1): 313-
322.
Lee, JW. Dworetzky, B. 2010. Rational Polytherapy with Antiepileptic Drugs. Journal
of Pharmaceuticals. Vol. 3: 2362.
Li, J. & Wu, Y., 2014. Lubricants in Pharmaceutical Solid Dosage Forms. Molecular
Diversity Preservation International journal, 2(1): 21-43.
Loscher, W. 1999. Milestones in Drug Therapy Valproate. Birkhuser Verlag: Berlin.
Maher, RL. Hanlon, JT. Hajjar, ET. 2013. Clinical consequences of polypharmacy in
elderly. Elsevier: Canada.
Mani, J. 2013. Combination Therapy in Epilepsy: What, When, How and What Not!.
Journal of the association of physicians of India, 61(1): 40-43.
Manyama, TL. Stieger, N. Steenekamp, J. Liebenberg, W. 2011. Powder
characteristics and tabletting of nevirapine prepared by a novel process
Martin, F. Ufodiama, C. Watt, I. Bland, M & Brackenbury W. J. 2015. Therapeutic
value of voltage gated sodium channel inhibitors in breast, colorectal and prostate
cancer: A systematic review. Journal frontiers in pharmacology, 8(1): 1-11.
Modi, FP & Patel, PR. 2011.formulation optimization& evaluation of Fixed Dose
Combination moisture barrier film coted bilayer tablet of artenuasate & amodiaquine
hydrochloride. International journal of PharmTech research 3(4):2124-2134.

References
93
Moon, C. & Oh, E., 2016. Rationale and strategies for formulation development of
oral fixed dose combination drug products. Journal of Pharmaceutical Investigation,
46(1): 615-631.
Mukhopadhyay, HK. Kandar, CC. Das, SK. Ghosh, L. Gupta, BK. 2012. Epilepsy and
its Management: A Review. Journal of PharmaSciTech 1(2): 20-26.
National Institute of Neurological Disorders and stroke: National Institutes of Health.
2015. The epilepsies and seizures. Bethesda; Maryland. 4-10.
Nolan, S. J. Sudell, M. Weston, J. Smith, C. T & Marson, A. G. 2014. Antiepileptic
drug monotherapy for epilepsy: a network meta-analysis (Protocol). Cochrane
Database of Systematic Reviews, 1(12): 1-5.
Patil, S. V., Ghatage, S. L., Navele, S. S. & Mujawar, N. K., 2014. Natural Binders in
Tablet Formulation. International Jornal of PharmTech Research, 6(3): 1070-1073.
Patsalos, P. N., Feroscher, W., Pisani, F. & van Rijn, C. M., 2002. The Importance of
Drug Interactions in Epilepsy Therapy. Epilepsia, 43(4): 372.
Peltola, J. Auvinen, A 2008. Seizure-freedom with combination therapy in
localization-related epilepsy. Seizure European Journal of Epilepsy, 17(3): 276-280.
Perucca, E. 2005. Clinically relevant drug interactions with antiepileptic drugs. British
Journal of Clinical Pharmacology. 61(3): 246-255.
Pinto, M. A., Ambrozini, B., Ferreira, A. P. & Cavalheiro, E. T., 2014.
Thermoanalytical studies of carbamazepine: hydration/ dehydration, thermal
decomposition, and solid phase transitions. Brazilian Journal of Pharmaceutical
Sciences, 50(4): 877-883.

References
94
Poolos, N. P., Warner, L. N. & Humphreys, S. Z., 2012. Comparative efficacy of
combination drug therapy in refractory epilepsy. American Academy of Neurology:
62-68.
Pouton, C. W., 2006. Formulation of poorly water-soluble drugs for oral
administration: Physicochemical and physiological issues and the lipid formulation
classification system. European journal of Pharmaceutical Sciences, 29(1): 276-287.
Powar, R. Jaimini, M. Chauhan, BS. Sharma, SK. 2014. International journal of
pharmaceutics research and development. 6(1).
Prisco, L., Ganau, M., Bigotto, F. & Zornada, F., 2011. Trigeminal neuralgia:
successful antiepileptic drug combination therapy in three refractory cases. Drug,
Healthcare and Patient Safety: 43-45.
Pubchem. 2005. Carbamazepine/ C15H12N2O. From:
https://pubchem.ncbi.nlm.nih.gov/compound /carbamazepine#section=2D-Structure
(accessed 19 December 2017).
Rantanen, J. & Khinast, J., 2015. The future of Pharmaceutical Manufacturing
Sciences. Journal of Pharmaceutical Sciences, 104(1): 3612-3638.
Rossiter, D. 2016. South African medicines formulary. 11th edition. Cape Town:
Health and medical publishing group.
Scheffer, IE, Berkovic, SF, Capovilla, G, Connoly, MB, Guilhoto, L, Hirsch, E, Moshe,
SL, Nordli, D, Zhang Y, Zuberi, SM. 2012. The Organization of the Epilepsies:
Report of the ILAE Commission on Classification and Terminology. Glasgow: United
Kingdom.

References
95
Scotland, S. 2010. Seizures explained. Glasgow: Scotland.
Seeberger, LC & Hauser, RA. 2009. Levodopa/carbidopa/entacapone in Parkinson’s
disease. International Journal of Neuroscience. 9(7): 929.
Seedat, YK. 2008. Fixed drug combination in hypertension and hyperlipidaemia in
the developing world. Cardiovascular Journal of Africa. 19(3): 124.
Shorvon, SD. 2011. The etiologic classification of epilepsy. Epilepsia 52(6): 1052-
1054.
Sirmagul, B., Atli, O. & Ilgin, S., 2012. The effect of combination therapy on the
plasma concentrations of traditional antiepileptics: A retrospective study. Human and
Experimental Toxicology, 31(10): 971-990.
Smith, D & Chadwick, D. 2001. The management of epilepsy. From:
http://jnnp.bmj.com/ (accessed 1 December 2017).
Snehal, K. 2008. Pharmaceutical developments with focus on paediatric
formulations. Practical problems in developing FDCs & Bilayer Tablets: 13-17.
Sousa e Silva, JP. 2013. Pharmaceutical Formulation. Pharmaceutical Anal Acta. 4
(1):1.
Tolou-Ghamari, Z. Zare, M. Habibabadi J.M. Najafi, M.R. 2013. A quick review of
carbamazepine pharmacokinetics in epilepsy from 1953 to 2012. Journal of
Research in Medical Science 18(5): 81-85.
Uzunovic, A. Vranic, E. Hadzidedic, S. 2010. Impairment of the in-vitro release of
carbamazepine from tablets: Bosnian journal of basic medical sciences. 10(3): 235
References
96
Varma, M. M. & Begum, S. K. R. 2012. Formulation, physicochemical evaluation,
and dissolution studies of carbamazepine solid dispersions. International Journal of
Pharmaceutical Sciences and Nanotechnology. 5(3): 1790-1807
Watts, A. E. Maruyoshi, K. Hughes, C.E., Brown, S. P. & Harris, K. D. M. 2016.
Combining the Advantages of Powder X-ray Diffraction and NMR Crystallography in
structure Determination of the Pharmaceutical Material Cimetidine Hydrochloride.
Crystal Growth & Design, 16(4): 1798-1804.
WHO. 2004. Scientific and Technical Princilles for Fixed Dose Combination Drug
Products. World Health Organisation: Geneva.
Yadav, C. S. & Lariya, N. 2017. Preformulation studies of carbamazepine for tablet
dosage form. Journal of scientific research in Pharmacy.
Yin, YH. Ahmad, N. Makmor-Bakry, MM. 2013. Pathogenesis of Epilepsy:
Challenges in Animal Models. International Journal of Basic Medical Sciences
16(10):1119-1132.
Yu, L. X. et al., 2014. Understanding Pharmaceutical Quality by Design. American
Association of Pharmaceutical Sciences, 16(4): 771-783.
Zhang, L. & Mao, S., 2017. Application of quality by design in the current drug
development. Asian Journal of Pharmaceutical Sciences, 12(1): 1142-1158

Appendices
97
APPENDICES
Appendix 1: Particle size distribution data for carbamazepine sample 1
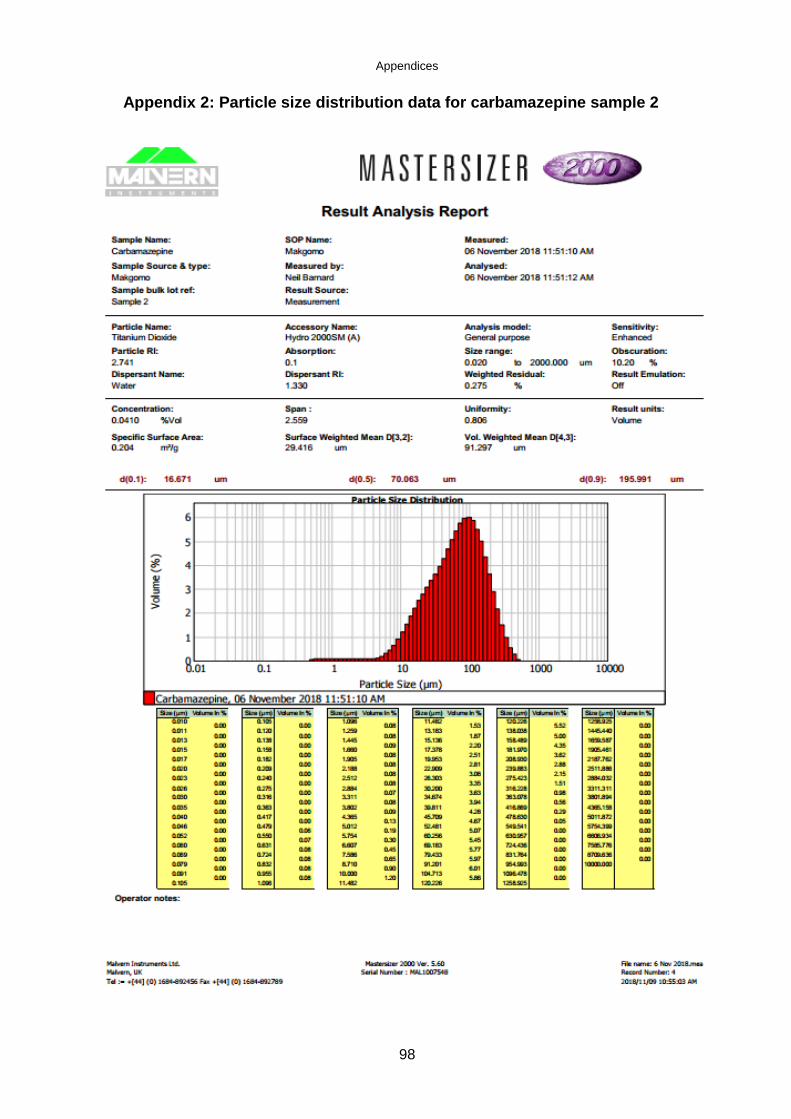
Appendices
98
Appendix 2: Particle size distribution data for carbamazepine sample 2
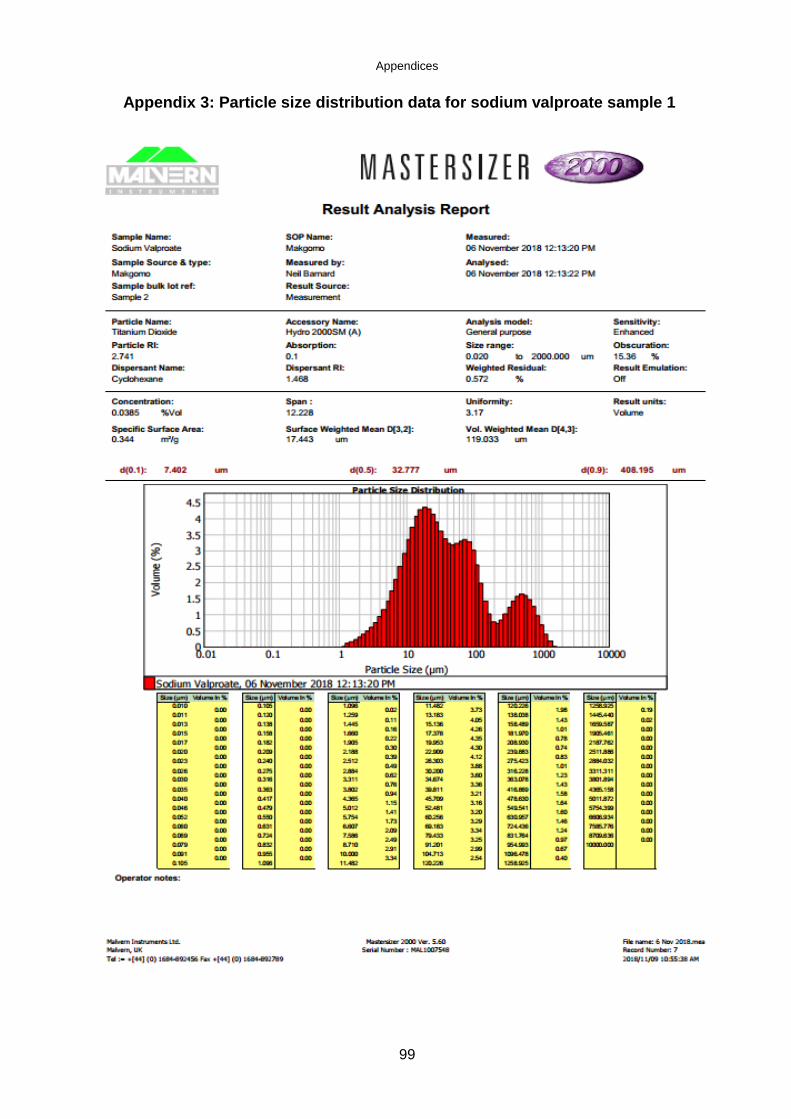
Appendices
99
Appendix 3: Particle size distribution data for sodium valproate sample 1

Appendices
100
Appendix 4: Particle size distribution data for sodium valproate sample 2

Appendices
101
Appendix 5: Crushing strength results of formula 1 tablets
Tablet Mass (mg) Crushing force (N)
1 780 107
2 750 134
3 750 131
4 760 114
5 760 133
6 730 123
7 720 121
8 790 124
9 750 92
10 780 135
Total 7570 1214
Average 757 121.4
SD 22.14 13.77
%RSD 2.92 11.34

Appendices
102
Appendix 6: Crushing strength results of formula 2 tablets
Tablet Mass (mg) Crushing force (N)
1 760 107
2 780 134
3 750 131
4 780 114
5 760 133
6 770 123
7 780 121
8 770 124
9 760 92
10 770 135
Total 7690 1136
Average 769 113.6
SD 11.00 18.00
%RSD 1.43 15.84
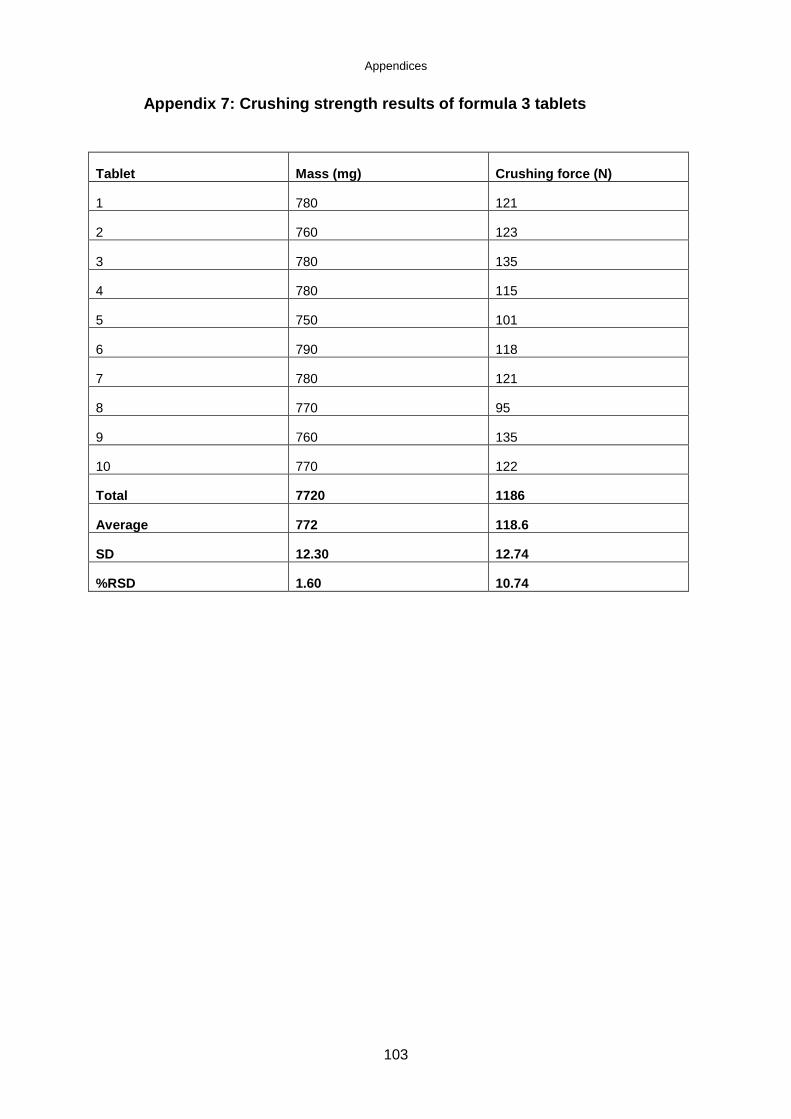
Appendices
103
Appendix 7: Crushing strength results of formula 3 tablets
Tablet Mass (mg) Crushing force (N)
1 780 121
2 760 123
3 780 135
4 780 115
5 750 101
6 790 118
7 780 121
8 770 95
9 760 135
10 770 122
Total 7720 1186
Average 772 118.6
SD 12.30 12.74
%RSD 1.60 10.74

Appendices
104
Appendix 8: Mass variation results of formula 1
Tablet Mass (mg) %variation Results
1 800 2,498 Complied
2 800 2,498 Complied
3 770 -1,597 Complied
4 780 -0,319 Complied
5 780 -0,319 Complied
6 800 2,236 Complied
7 770 -1,597 Complied
8 780 -0,319 Complied
9 780 -0,319 Complied
10 750 -4,153 Complied
11 780 -0,319 Complied
12 760 -2,875 Complied
13 780 -0,319 Complied
14 790 0,958 Complied
15 800 2,236 Complied
16 820 4,792 Complied
17 760 -2,875 Complied
18 740 -5,431 Complied
19 800 2,236 Complied
20 810 3,514 Complied
Total 15650
Average 782,5
STDEV 20,61907367
%RSD 2,635025389

Appendices
105
Appendix 9: Mass variation results of formula 2
Tablet Mass (mg) %variation Results
1 750 -0,859 Complied
2 770 1,852 Complied
3 760 0,463 Complied
4 750 -0,859 Complied
5 730 -3,503 Complied
6 770 1,852 Complied
7 780 3,106 Complied
8 750 -0,859 Complied
9 750 -0,859 Complied
10 750 -0,859 Complied
11 760 0,463 Complied
12 750 -0,859 Complied
13 750 -0,859 Complied
14 780 3,106 Complied
15 760 0,463 Complied
16 760 0,463 Complied
17 740 -2,181 Complied
18 750 -0,859 Complied
19 760 0,463 Complied
20 760 0,463 Complied
Total 15130
Average 756,5
STDEV 12,49561327
%RSD 1,651766459

Appendices
106
Appendix 10: Mass variation results of formula 3
Tablet Mass (mg) %variation Results
1 780 2,902 Complied
2 750 -1,055 Complied
3 750 -1,055 Complied
4 760 0,264 Complied
5 760 0,264 Complied
6 730 -3,694 Complied
7 730 -3,694 Complied
8 790 4,222 Complied
9 750 -1,055 Complied
10 780 2,902 Complied
11 740 -2,375 Complied
12 730 -3,694 Complied
13 760 0,264 Complied
14 800 5,541 Complied
15 740 -2,375 Complied
16 760 0,264 Complied
17 750 -1,055 Complied
18 770 -0,859 Complied
19 780 2,902 Complied
20 750 -1,055 Complied
Total 15160
Average 758
STDEV 20,01461454
%RSD 2,640450467

Appendices
107
Appendix 11: The dissolution data for carbamazepine from the FDC
tablet
Time Carbamazepine % Dissolved
(min) TABLET
1
TABLET
2
TABLET 3 TABLET 4 TABLET 5
TABLET 6
0 0 0 0 0 0 0
10 23.2 20.8 25.5 19.0 22.8 20.8
15 31.2 31.2 34.2 30.0 31.7 30.0
20 39.9 40.3 40.6 39.9 46.7 40.3
30 55.6 61.5 63.2 63.4 57.4 58.8
45 99.5 96.7 99.6 99.9 93.6 96.4
60 99.8 99.8 100.0 100.0 99.9 98.8
75 101.0 101.0 100.0 100.0 99.9 98.8
AVE DRi* 0.507
AVE AUC* 10244.45
DRi = Initial dissolution rate (%.min-1)
AUC = Area under the curve (%.min)

Appendices
108
Appendix 12: The dissolution data for sodium valproate from the FDC
tablet
Time Sodium valproate % Dissolved
(min) TABLET
1
TABLET
2
TABLET 3 TABLET 4 TABLET 5
TABLET 6
0 0 0 0 0 0 0
10 24.8 22.6 29.9 37.4 35.4 25.9
15 44.6 39.2 45.0 33.3 41.3 29.6
20 39.4 40.8 36.8 36.3 50.8 34.4
30 49.8 53.0 40.7 42.1 59.1 39.8
45 55.6 47.5 48.4 47.2 68.8 48.0
60 54.1 63.2 54.7 54.7 77.1 51.7
75 103.0 103.6 107.6 108.5 108.6 106.9
AVE DRi 0.702
AVE AUC 6851.25
Appendix 13: Standard deviations of the dissolution data
Carbamazepine Sodium valproate
Carbamazepine Sodium valproate
Time (min) STDEV STDEV %RSD %RSD
0 0 0 0 0
10 2.29 6.23 10.40 21.24
15 1.54 6.19 4.92 15.95
20 2.67 6.66 6.46 16.52
30 3.21 8.63 5.36 18.20
45 2.50 9.41 2.56 17.90
60 0.46 10.34 0.46 17.44
75 0.82 2.05 0.82 2.08
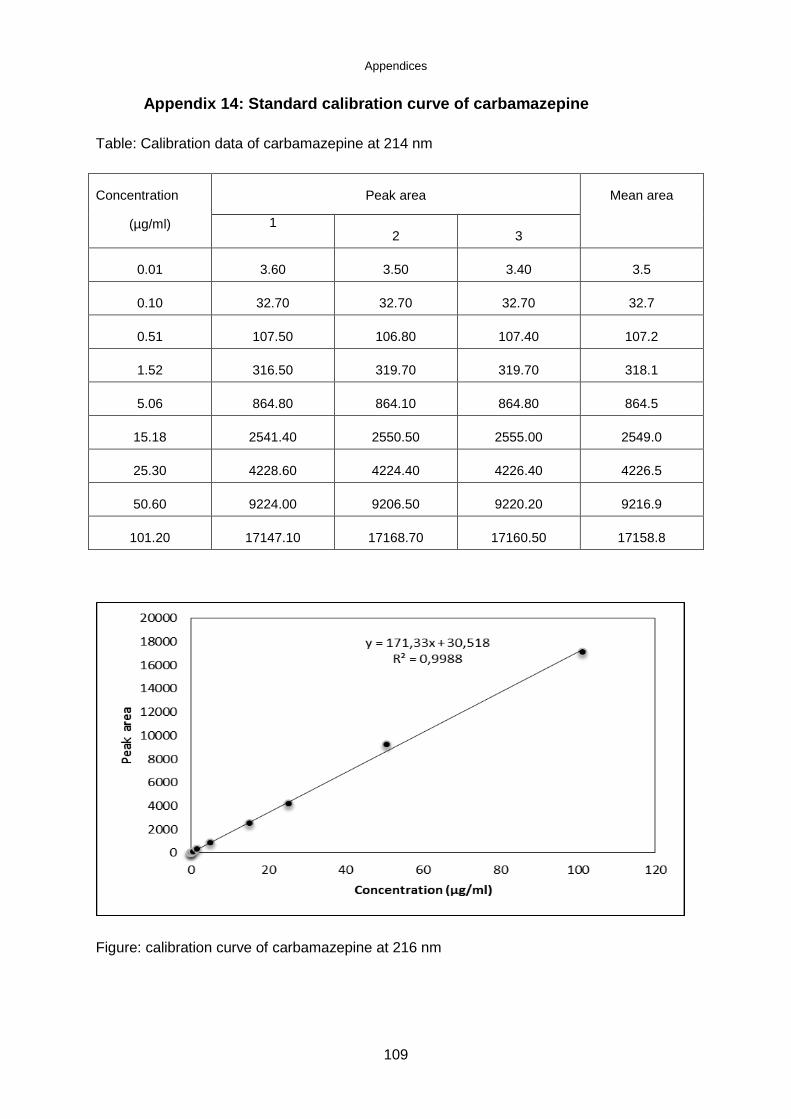
Appendices
109
Appendix 14: Standard calibration curve of carbamazepine
Table: Calibration data of carbamazepine at 214 nm
Concentration
(µg/ml)
Peak area Mean area
1 2 3
0.01 3.60 3.50 3.40 3.5
0.10 32.70 32.70 32.70 32.7
0.51 107.50 106.80 107.40 107.2
1.52 316.50 319.70 319.70 318.1
5.06 864.80 864.10 864.80 864.5
15.18 2541.40 2550.50 2555.00 2549.0
25.30 4228.60 4224.40 4226.40 4226.5
50.60 9224.00 9206.50 9220.20 9216.9
101.20 17147.10 17168.70 17160.50 17158.8
Figure: calibration curve of carbamazepine at 216 nm

Appendices
110
Appendix 15: Standard calibration curve of sodium valproate
Table: Calibration data of sodium valproate at 214 nm
Concentration
(µg/ml)
Peak area Mean area
1 2 3
0.01 1.60 1.20 1.30 1.4
0.10 2.50 2.30 2.30 2.4
0.51 1.30 1.20 1.30 1.3
1.54 2.10 2.10 2.10 2.1
5.12 4.20 3.90 4.00 4.0
15.36 11.40 11.40 11.20 11.3
25.60 18.80 18.60 18.80 18.7
51.20 33.20 32.90 33.30 33.1
102.40 65.90 66.00 66.00 66.0
Figure: Calibration curve of sodium valproate at 214 nm
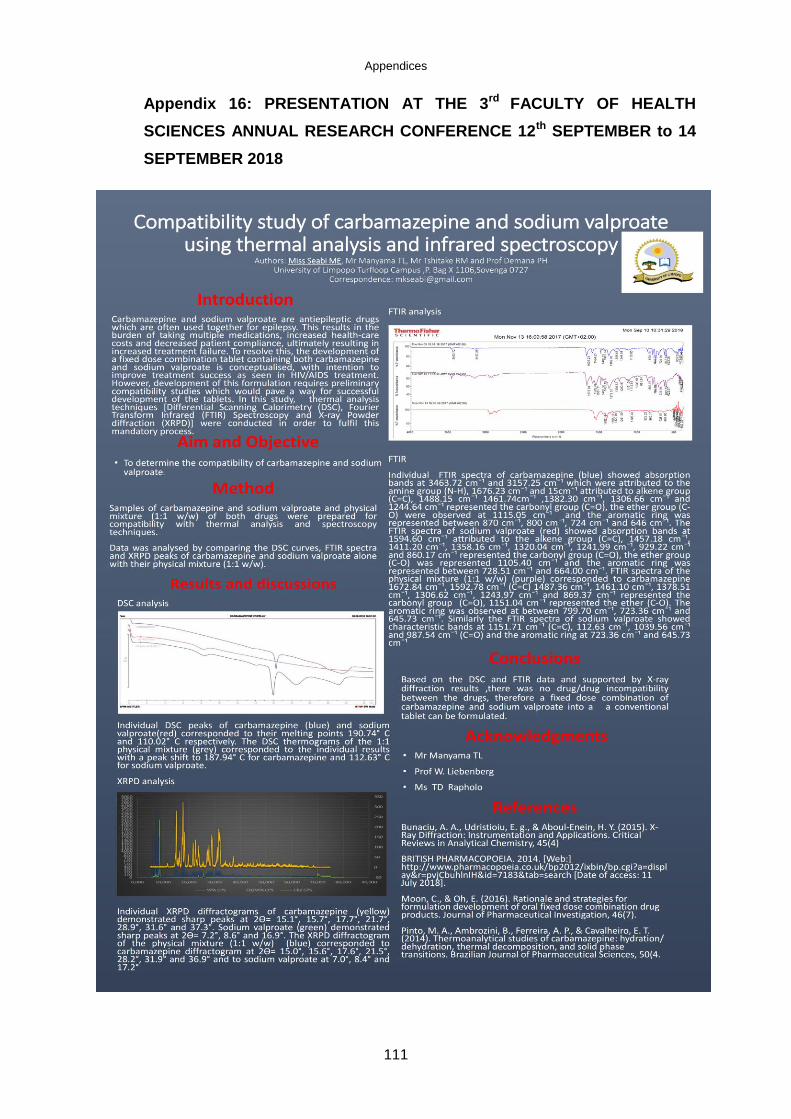
Appendices
111
Appendix 16: PRESENTATION AT THE 3rd FACULTY OF HEALTH
SCIENCES ANNUAL RESEARCH CONFERENCE 12th SEPTEMBER to 14
SEPTEMBER 2018

Appendices
112
Appendix 17: Ethical clearance certificate


![INDEX [jpet.aspetjournals.org] · 2005. 12. 30. · 1146 Index Vol.238 and sodium valproate, epilepsy (ba-boons),32 modulation ofbehavioral effects, external discriminative stimulus](https://img.pdfslide.net/doc/110x75/60f7a56c525417429900bc79/index-jpet-2005-12-30-1146-index-vol238-and-sodium-valproate-epilepsy.jpg)