Embed Size (px)
Citation preview
Juan Manuel Gers, PhD
FORO MEJORES PRÁCTICAS EN INTERNACIONALIZACIÓN
Medellin, Noviembre 27, 2013
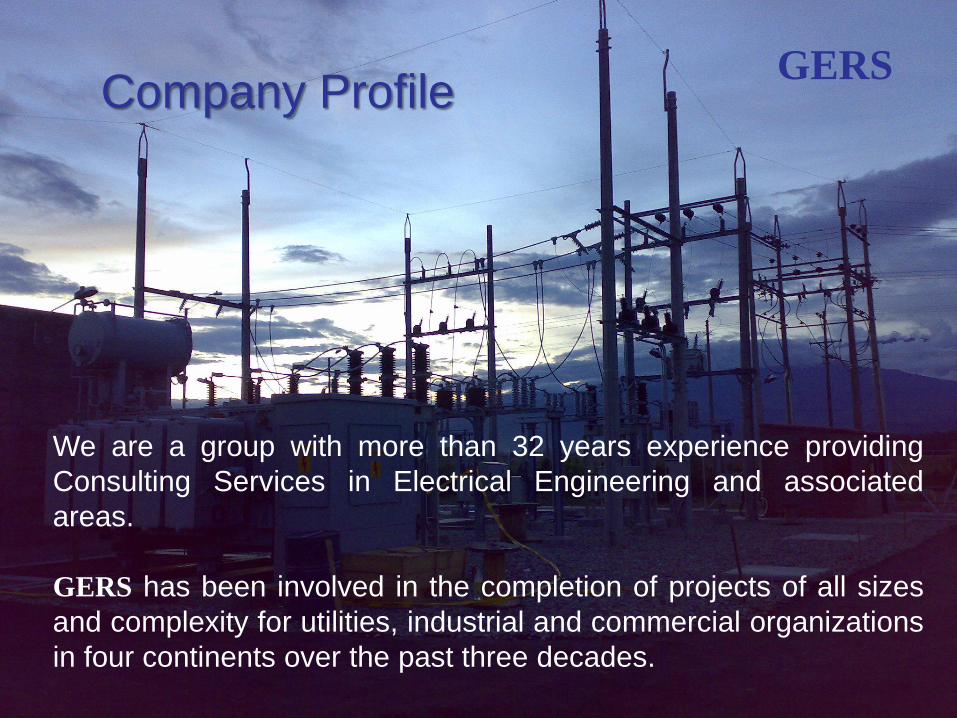
Company Profile
We are a group with more than 32 years experience providing
Consulting Services in Electrical Engineering and associated
areas.
GERS has been involved in the completion of projects of all sizes
and complexity for utilities, industrial and commercial organizations
in four continents over the past three decades.
GERS
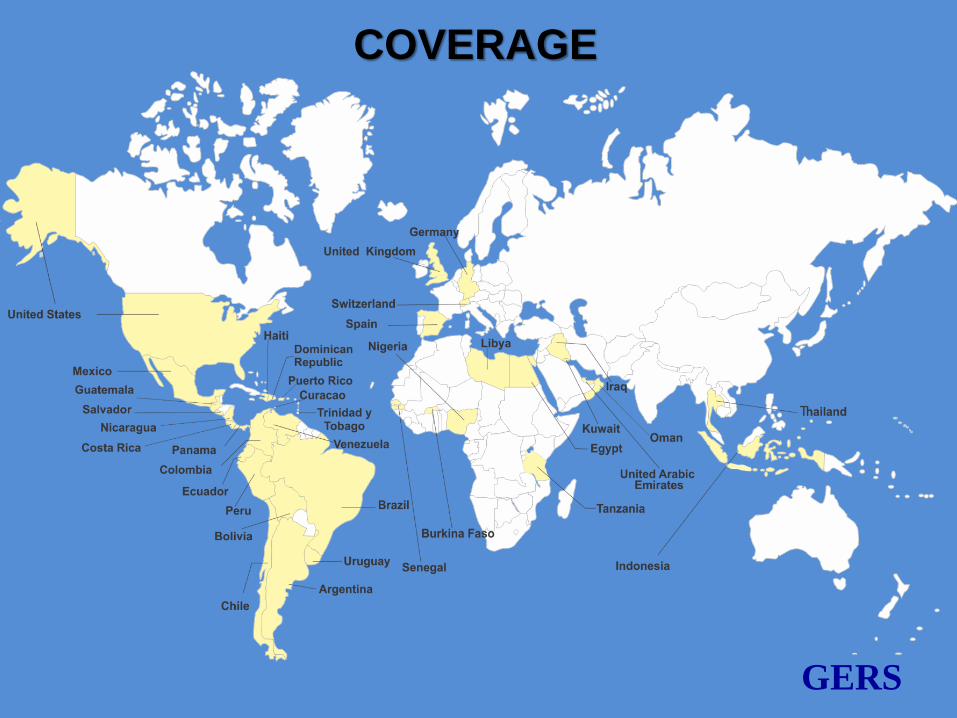
COVERAGE
GERS
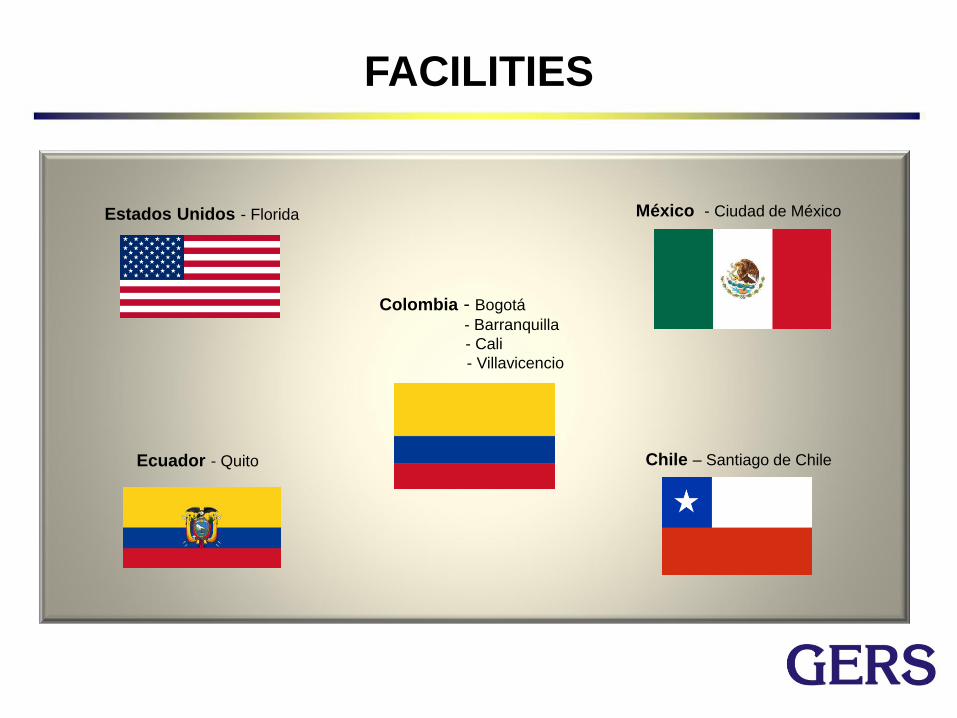
Estados Unidos - Florida
Colombia - Bogotá
- Barranquilla
- Cali
- Villavicencio
Ecuador - Quito Chile – Santiago de Chile
México - Ciudad de México
FACILITIES

A
ECUADOR
PROJECT MANAGEMENT
MÉXICO
STUDIES
USA
STUDIES
DESIGNS
COLOMBIA
STUDIES
DESIGNS
TESTS &COMMISSIONING
SMART GRIIDS
GENERAL
MANAGEMENT
PRESIDENCY
CHILE
PROJECT MANAGEMENT
ORGANIZATIONAL CHART
Multilateral Banks
creo que deberías resaltar las actividades con organismos multilaterales y el crecimiento de nuevas alianzas internacionales con empresas internacionales, como India, Bangaldesh, Brazil y otras Organismos como World Bank, IDB (InterAmerican Development Bank), USTDA (US Trade and Development Agency) otras entidades privadas US DOIE DOE IFC
Regional Development Banks
UNION EUROPEA
FINANCE INSTITUTIONS
International Alliances
Government Institutions
WORKING OPPORTUNITIES

State license
County occupational license
City occupational license
City certificate of use
Professional Engineer
Minority Certification
Small Business
Company Licensing
GERS
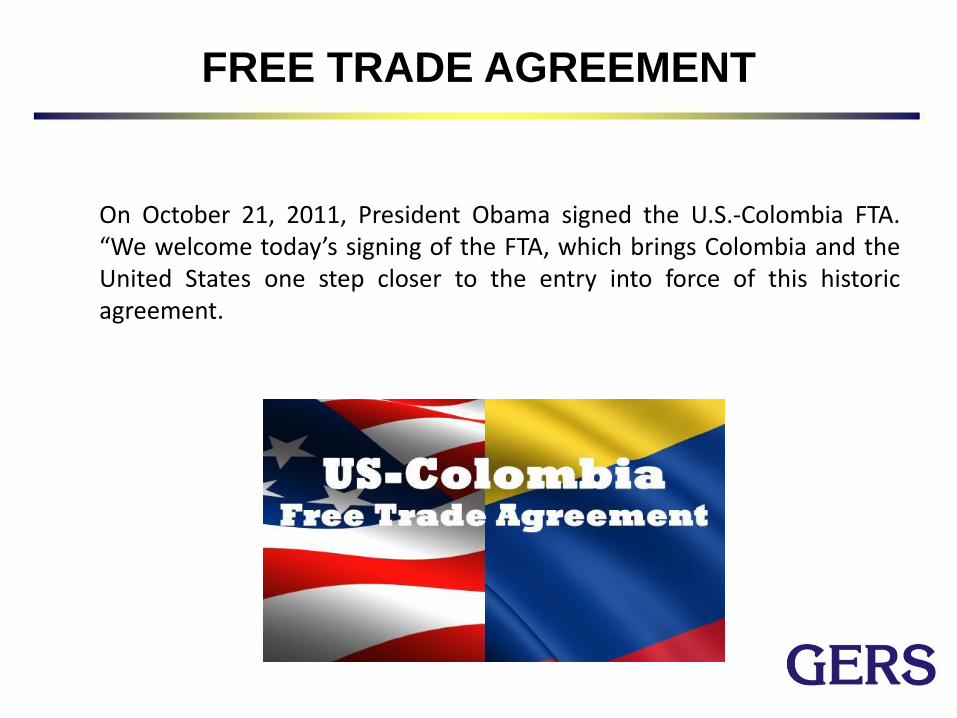
FREE TRADE AGREEMENT
On October 21, 2011, President Obama signed the U.S.-Colombia FTA. “We welcome today’s signing of the FTA, which brings Colombia and the United States one step closer to the entry into force of this historic agreement.
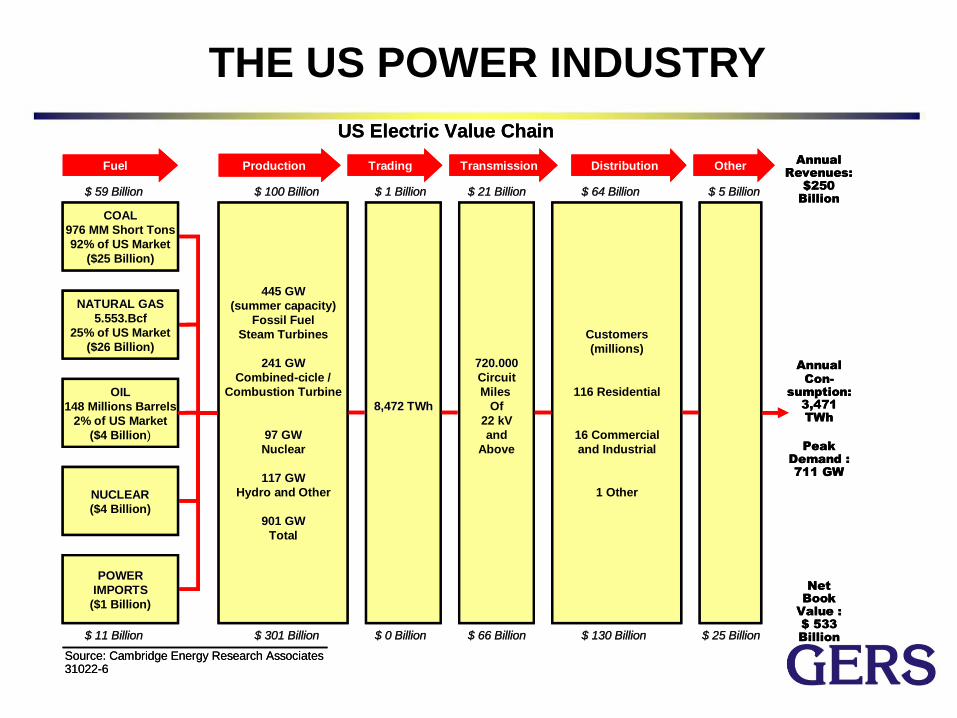
THE US POWER INDUSTRY
COALCOAL
976 MM Short Tons
92% of US Market
($25 Billion)
NATURAL GASNATURAL GAS
5.553.Bcf
25% of US Market
($26 Billion)
OILOIL
148 Millions Barrels
2% of US Market
($4 Billion)
NUCLEARNUCLEAR
($4 Billion)
POWERPOWER
IMPORTSIMPORTS
($1 Billion)
445 GW445 GW
(summer capacity)
Fossil Fuel
Steam Turbines
241 GW241 GW
Combined-cicle /
Combustion Turbine
97 GW97 GW
Nuclear
117 GW117 GW
Hydro and Other
901 GW901 GW
Total
8,472 8,472 TWhTWh
720.000720.000
Circuit
Miles
Of
22 kV
and
Above
CustomersCustomers
(millions)
116 Residential
16 Commercial
and Industrial
1 Other
$ 11 $ 11 BillionBillion $ 301 $ 301 BillionBillion $ 0 $ 0 BillionBillion $ 66 $ 66 BillionBillion $ 130 $ 130 BillionBillion $ 25 $ 25 BillionBillion
$ 59 $ 59 BillionBillion $ 100 $ 100 BillionBillion $ 1 $ 1 BillionBillion $ 21 $ 21 BillionBillion $ 64 $ 64 BillionBillion $ 5 $ 5 BillionBillion
TradingProductionFuel Transmission Distribution OtherAnnual
Revenues:
$250
Billion
Annual
Con-
sumption:
3,471
TWh
Peak
Demand :
711 GW
Net
Book
Value :
$ 533
Billion
Source: Cambridge Energy Research Associates31022-6
US Electric Value Chain
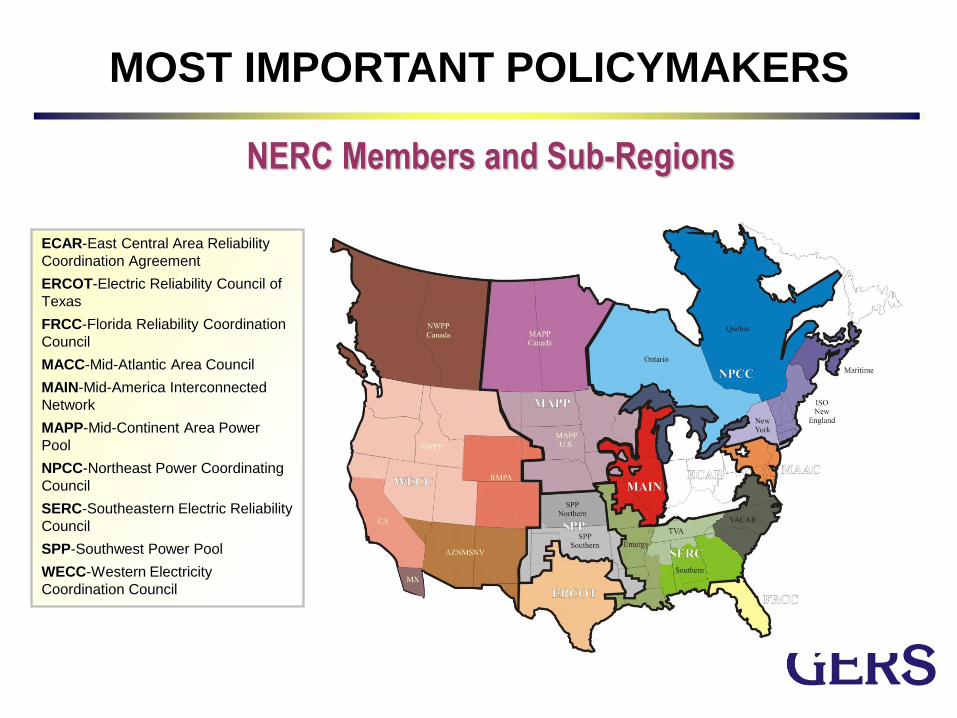
NERC Members and Sub-Regions
ECAR-East Central Area Reliability
Coordination Agreement
ERCOT-Electric Reliability Council of
Texas
FRCC-Florida Reliability Coordination
Council
MACC-Mid-Atlantic Area Council
MAIN-Mid-America Interconnected
Network
MAPP-Mid-Continent Area Power
Pool
NPCC-Northeast Power Coordinating
Council
SERC-Southeastern Electric Reliability
Council
SPP-Southwest Power Pool
WECC-Western Electricity
Coordination Council
MOST IMPORTANT POLICYMAKERS

OVERVIEW OF THE ELECTRIC
INDUSTRY IN THE UNITED STATES
The U.S. electric system
Over 200 million customers participating in an deregulated market
Over 3200 utilities
Over 16,802 generators in commercial operation
Over 155,000 miles of transmission lines (230 kV and above)
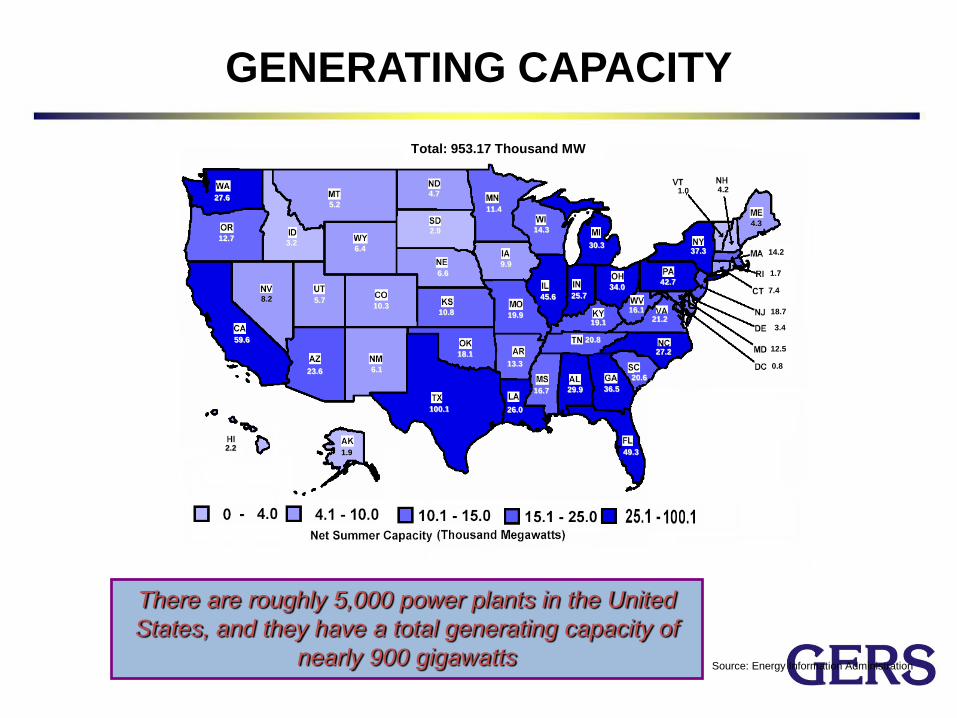
GENERATING CAPACITY
There are roughly 5,000 power plants in the United
States, and they have a total generating capacity of
nearly 900 gigawatts Source: Energy Information Administration
29.9
1.9
23.6 13.3
59.6
10.3
7.4
3.4
0.8
49.3
36.5
2.2
3.2
45.6 25.7
9.9
10.8
19.1
26.0
4.3
12.5
14.2 30.3
11.4
16.7
19.9
5.2
6.6
8.2
4.2
18.7
6.1
37.3
27.2
4.7
34.0
18.1
12.7
42.7 1.7
20.6
2.9
20.8
100.1
5.7
1.0
21.2
27.6
16.1
14.3
6.4
Total: 953.17 Thousand MW
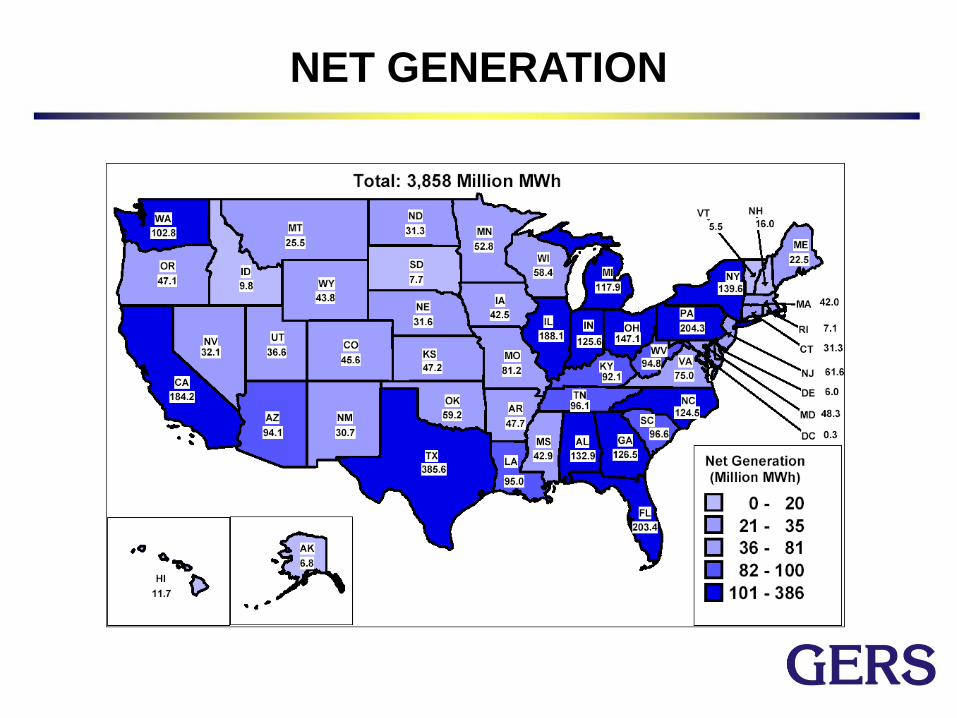
NET GENERATION
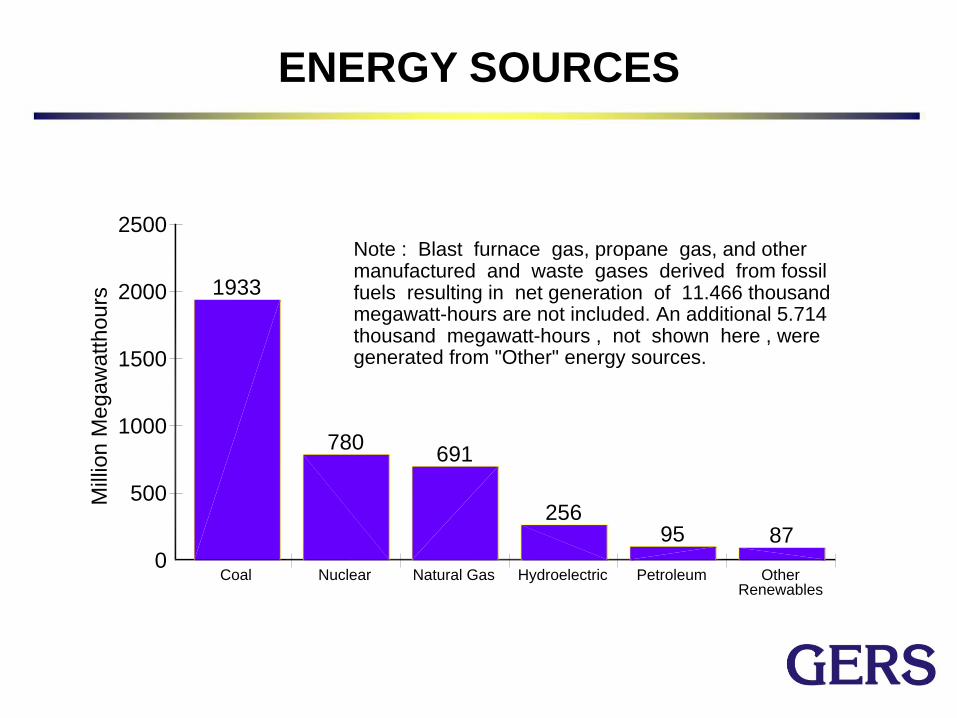
ENERGY SOURCES
1933
780691
25695 87
Coal Nuclear Natural Gas Hydroelectric Petroleum OtherRenewables
2000
2500
1000
500
0
1500
Note : Blast furnace gas, propane gas, and othermanufactured and waste gases derived from fossilfuels resulting in net generation of 11.466 thousand
thousand megawatt-hours , not shown here , were megawatt-hours are not included. An additional 5.714
generated from "Other" energy sources.
Mill
ion
Me
ga
wa
tth
ou
rs
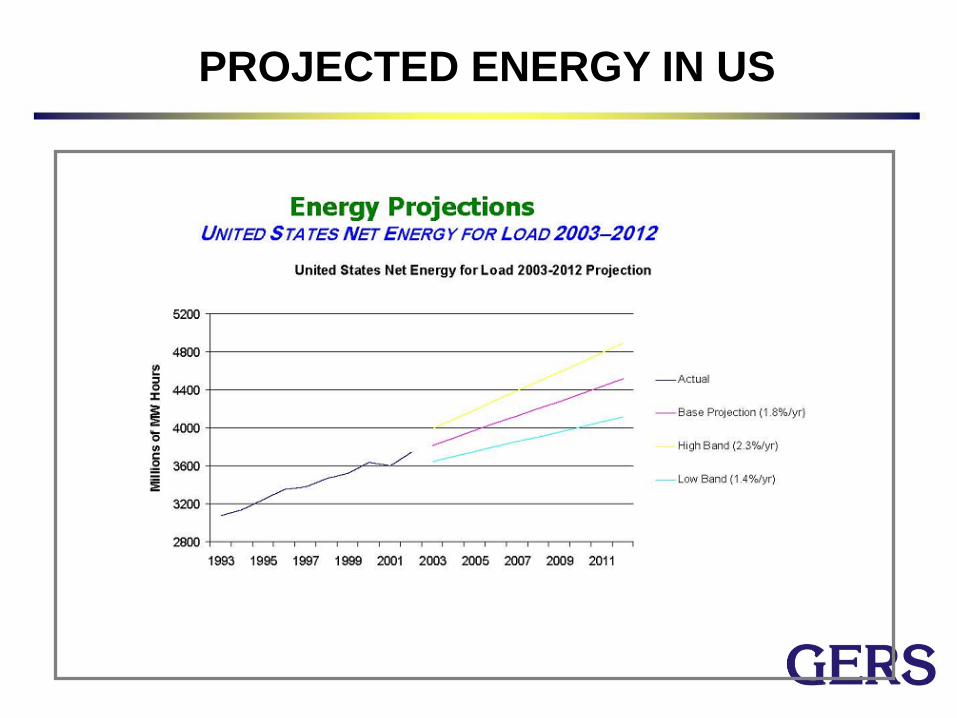
PROJECTED ENERGY IN US

TRANSMISSION SYSTEM INFRASTRUCTURE
U.S. High Voltage Transmission System
Source: NERC
VVoollttaaggee MMiilleess ooff TTrraannssmmiissssiioonn LLiinnee
AACC
230 kV 76,762
345 kV 49,250
500 kV 26,038
765 kV 2,453
Total AC 154,503
DDCC
250-300 kV 930
400 kV 852
450 kV 192
500 kV 1,333
Total DC 3,307
TToottaall AACC ++ DDCC 115577,,881100
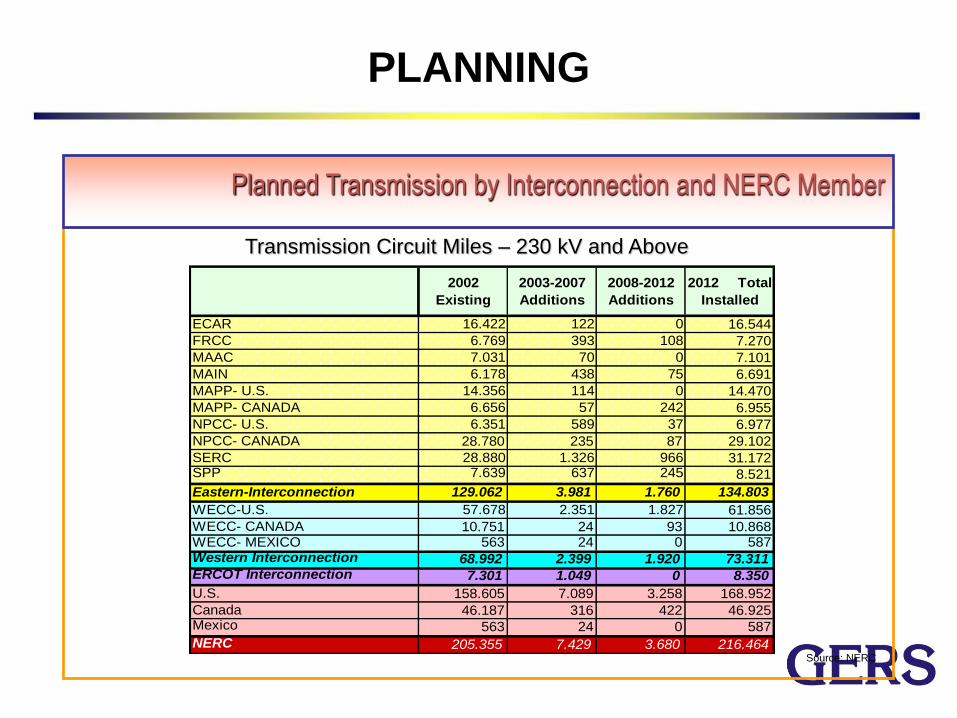
2002
Existing
2003-2007
Additions
2008-2012
Additions
2012 Total
Installed
ECAR 16.422 122 0 16.544
FRCC 6.769 393 108 7.270
MAAC 7.031 70 0 7.101
MAIN 6.178 438 75 6.691
MAPP- U.S. 14.356 114 0 14.470
MAPP- CANADA 6.656 57 242 6.955
NPCC- U.S. 6.351 589 37 6.977
NPCC- CANADA 28.780 235 87 29.102
SERC 28.880 1.326 966 31.172SPP 7.639 637 245 8.521
Eastern-Interconnection 129.062 3.981 1.760 134.803
WECC-U.S. 57.678 2.351 1.827 61.856
WECC- CANADA 10.751 24 93 10.868WECC- MEXICO 563 24 0 587Western Interconnection 68.992 2.399 1.920 73.311ERCOT Interconnection 7.301 1.049 0 8.350
U.S. 158.605 7.089 3.258 168.952
Canada 46.187 316 422 46.925Mexico 563 24 0 587
NERC 205.355 7.429 3.680 216.464
PLANNING
Planned Transmission by Interconnection and NERC Member
Source: NERC
Transmission Circuit Miles – 230 kV and Above
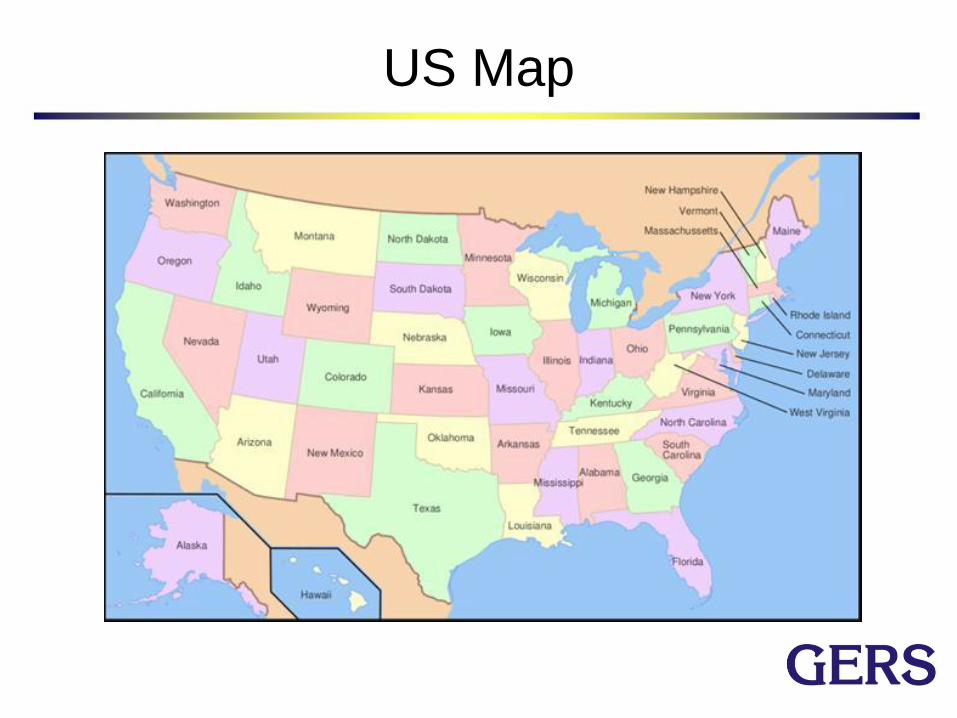
US Map
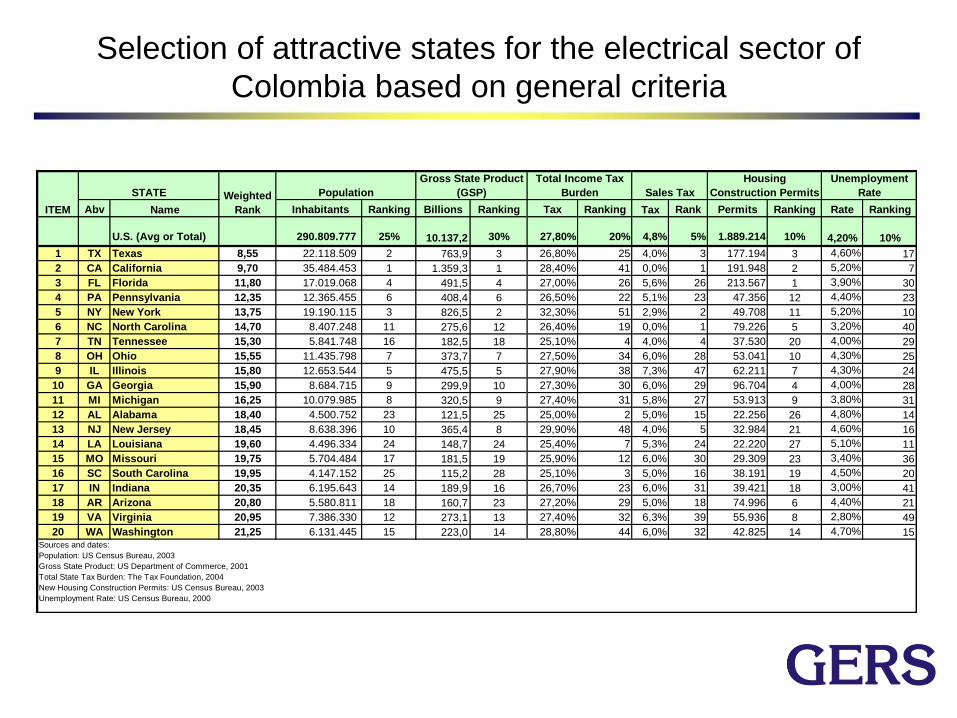
Selection of attractive states for the electrical sector of
Colombia based on general criteria
Abv Name Inhabitants Ranking Billions Ranking Tax Ranking Tax Rank Permits Ranking Rate Ranking
U.S. (Avg or Total) 290.809.777 25% 10.137,2 30% 27,80% 20% 4,8% 5% 1.889.214 10% 4,20% 10%
1 TX Texas 8,55 22.118.509 2 763,9 3 26,80% 25 4,0% 3 177.194 3 4,60% 17
2 CA California 9,70 35.484.453 1 1.359,3 1 28,40% 41 0,0% 1 191.948 2 5,20% 7
3 FL Florida 11,80 17.019.068 4 491,5 4 27,00% 26 5,6% 26 213.567 1 3,90% 30
4 PA Pennsylvania 12,35 12.365.455 6 408,4 6 26,50% 22 5,1% 23 47.356 12 4,40% 23
5 NY New York 13,75 19.190.115 3 826,5 2 32,30% 51 2,9% 2 49.708 11 5,20% 10
6 NC North Carolina 14,70 8.407.248 11 275,6 12 26,40% 19 0,0% 1 79.226 5 3,20% 40
7 TN Tennessee 15,30 5.841.748 16 182,5 18 25,10% 4 4,0% 4 37.530 20 4,00% 29
8 OH Ohio 15,55 11.435.798 7 373,7 7 27,50% 34 6,0% 28 53.041 10 4,30% 25
9 IL Illinois 15,80 12.653.544 5 475,5 5 27,90% 38 7,3% 47 62.211 7 4,30% 24
10 GA Georgia 15,90 8.684.715 9 299,9 10 27,30% 30 6,0% 29 96.704 4 4,00% 28
11 MI Michigan 16,25 10.079.985 8 320,5 9 27,40% 31 5,8% 27 53.913 9 3,80% 31
12 AL Alabama 18,40 4.500.752 23 121,5 25 25,00% 2 5,0% 15 22.256 26 4,80% 14
13 NJ New Jersey 18,45 8.638.396 10 365,4 8 29,90% 48 4,0% 5 32.984 21 4,60% 16
14 LA Louisiana 19,60 4.496.334 24 148,7 24 25,40% 7 5,3% 24 22.220 27 5,10% 11
15 MO Missouri 19,75 5.704.484 17 181,5 19 25,90% 12 6,0% 30 29.309 23 3,40% 36
16 SC South Carolina 19,95 4.147.152 25 115,2 28 25,10% 3 5,0% 16 38.191 19 4,50% 20
17 IN Indiana 20,35 6.195.643 14 189,9 16 26,70% 23 6,0% 31 39.421 18 3,00% 41
18 AR Arizona 20,80 5.580.811 18 160,7 23 27,20% 29 5,0% 18 74.996 6 4,40% 21
19 VA Virginia 20,95 7.386.330 12 273,1 13 27,40% 32 6,3% 39 55.936 8 2,80% 49
20 WA Washington 21,25 6.131.445 15 223,0 14 28,80% 44 6,0% 32 42.825 14 4,70% 15
Housing
Construction PermitsSales Tax
Unemployment
Rate
Sources and dates:
Population: US Census Bureau, 2003
Gross State Product: US Department of Commerce, 2001
Total State Tax Burden: The Tax Foundation, 2004
New Housing Construction Permits: US Census Bureau, 2003
Unemployment Rate: US Census Bureau, 2000
ITEM
Weighted
Rank
STATE
Total Income Tax
BurdenPopulation
Gross State Product
(GSP)
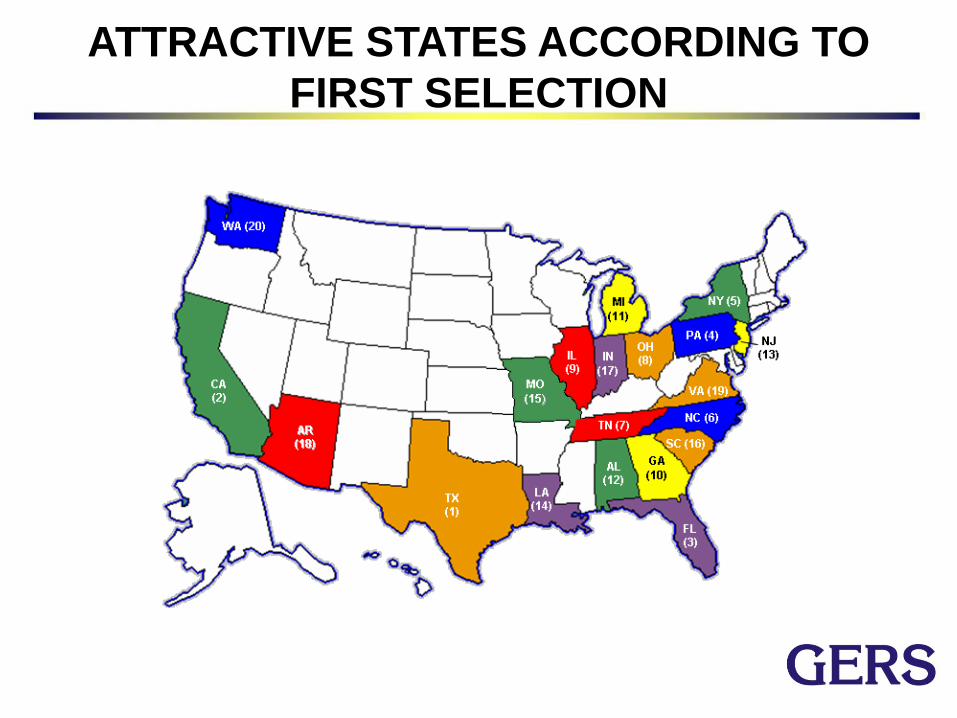
ATTRACTIVE STATES ACCORDING TO
FIRST SELECTION
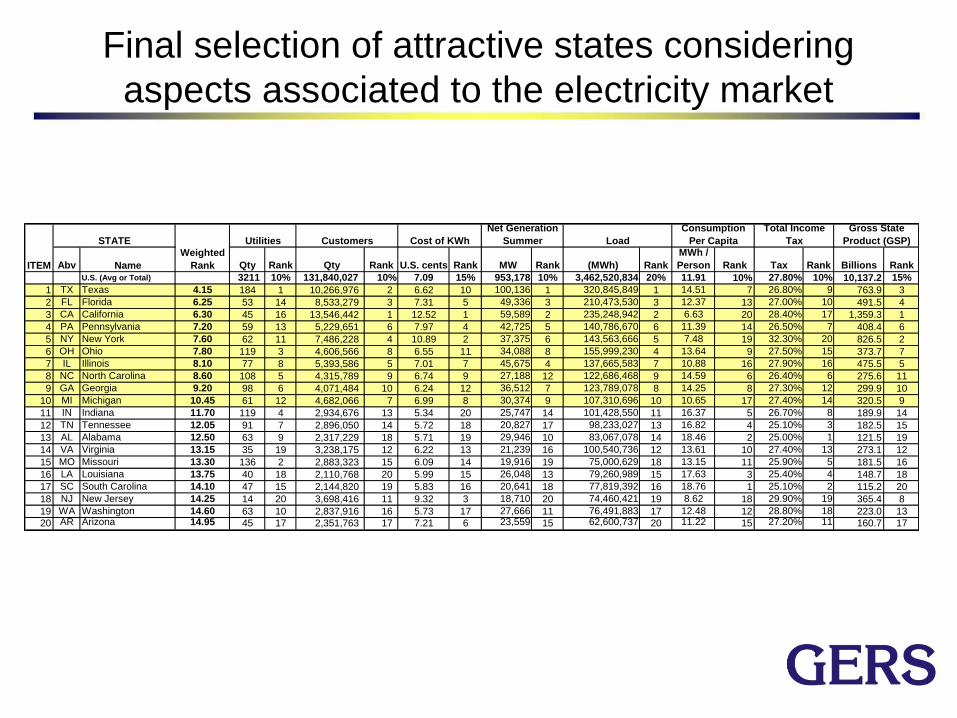
Final selection of attractive states considering
aspects associated to the electricity market
Abv Name Qty Rank Qty Rank U.S. cents Rank MW Rank (MWh) Rank
MWh /
Person Rank Tax Rank Billions Rank
U.S. (Avg or Total) 3211 10% 131,840,027 10% 7.09 15% 953,178 10% 3,462,520,834 20% 11.91 10% 27.80% 10% 10,137.2 15%
1 TX Texas 4.15 184 1 10,266,976 2 6.62 10 100,136 1 320,845,849 1 14.51 7 26.80% 9 763.9 3
2 FL Florida 6.25 53 14 8,533,279 3 7.31 5 49,336 3 210,473,530 3 12.37 13 27.00% 10 491.5 4
3 CA California 6.30 45 16 13,546,442 1 12.52 1 59,589 2 235,248,942 2 6.63 20 28.40% 17 1,359.3 1
4 PA Pennsylvania 7.20 59 13 5,229,651 6 7.97 4 42,725 5 140,786,670 6 11.39 14 26.50% 7 408.4 6
5 NY New York 7.60 62 11 7,486,228 4 10.89 2 37,375 6 143,563,666 5 7.48 19 32.30% 20 826.5 2
6 OH Ohio 7.80 119 3 4,606,566 8 6.55 11 34,088 8 155,999,230 4 13.64 9 27.50% 15 373.7 7
7 IL Illinois 8.10 77 8 5,393,586 5 7.01 7 45,675 4 137,665,583 7 10.88 16 27.90% 16 475.5 5
8 NC North Carolina 8.60 108 5 4,315,789 9 6.74 9 27,188 12 122,686,468 9 14.59 6 26.40% 6 275.6 11
9 GA Georgia 9.20 98 6 4,071,484 10 6.24 12 36,512 7 123,789,078 8 14.25 8 27.30% 12 299.9 10
10 MI Michigan 10.45 61 12 4,682,066 7 6.99 8 30,374 9 107,310,696 10 10.65 17 27.40% 14 320.5 9
11 IN Indiana 11.70 119 4 2,934,676 13 5.34 20 25,747 14 101,428,550 11 16.37 5 26.70% 8 189.9 14
12 TN Tennessee 12.05 91 7 2,896,050 14 5.72 18 20,827 17 98,233,027 13 16.82 4 25.10% 3 182.5 15
13 AL Alabama 12.50 63 9 2,317,229 18 5.71 19 29,946 10 83,067,078 14 18.46 2 25.00% 1 121.5 19
14 VA Virginia 13.15 35 19 3,238,175 12 6.22 13 21,239 16 100,540,736 12 13.61 10 27.40% 13 273.1 12
15 MO Missouri 13.30 136 2 2,883,323 15 6.09 14 19,916 19 75,000,629 18 13.15 11 25.90% 5 181.5 16
16 LA Louisiana 13.75 40 18 2,110,768 20 5.99 15 26,048 13 79,260,989 15 17.63 3 25.40% 4 148.7 18
17 SC South Carolina 14.10 47 15 2,144,820 19 5.83 16 20,641 18 77,819,392 16 18.76 1 25.10% 2 115.2 20
18 NJ New Jersey 14.25 14 20 3,698,416 11 9.32 3 18,710 20 74,460,421 19 8.62 18 29.90% 19 365.4 8
19 WA Washington 14.60 63 10 2,837,916 16 5.73 17 27,666 11 76,491,883 17 12.48 12 28.80% 18 223.0 13
20 AR Arizona 14.95 45 17 2,351,763 17 7.21 6 23,559 15 62,600,737 20 11.22 15 27.20% 11 160.7 17
ITEM
STATE
Total Income
Tax
Gross State
Product (GSP)Utilities Customers Cost of KWh
Weighted
Rank
Load
Net Generation
Summer
Consumption
Per Capita
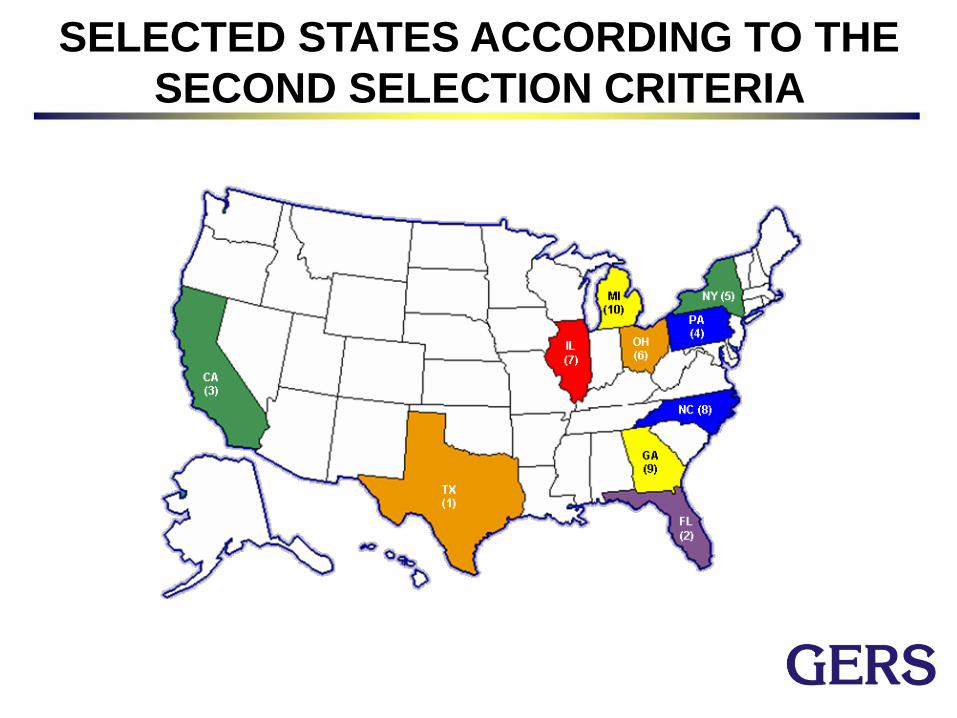
SELECTED STATES ACCORDING TO THE
SECOND SELECTION CRITERIA

WORKING SCHEMES
Joint ventures considering foreign
partnership or cross-border
contracts
Work as a foreign
contractor
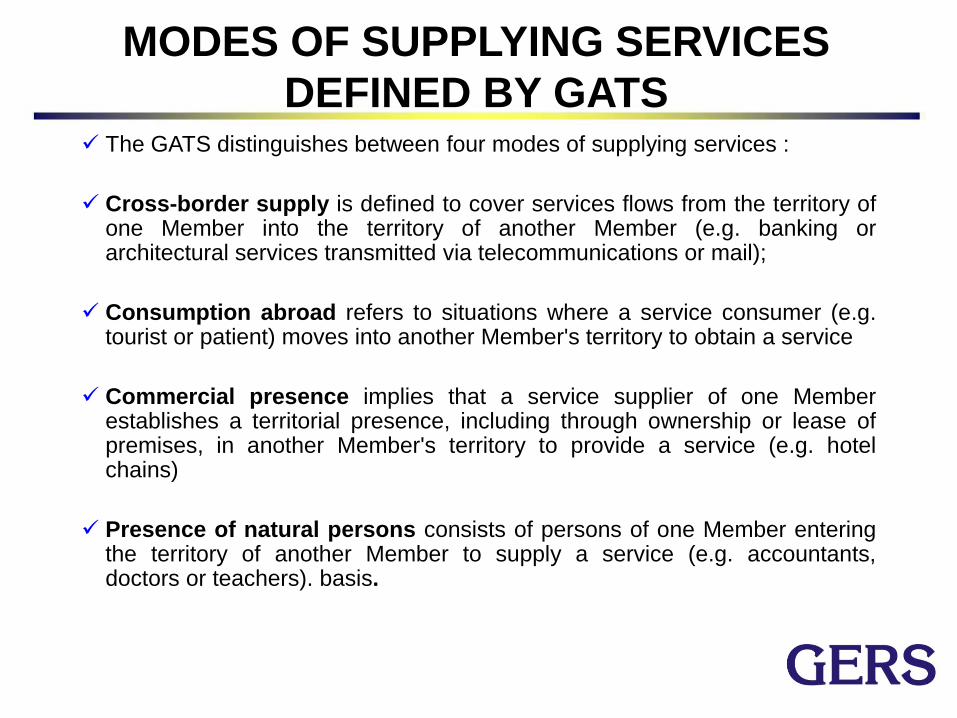
MODES OF SUPPLYING SERVICES
DEFINED BY GATS The GATS distinguishes between four modes of supplying services :
Cross-border supply is defined to cover services flows from the territory of one Member into the territory of another Member (e.g. banking or architectural services transmitted via telecommunications or mail);
Consumption abroad refers to situations where a service consumer (e.g. tourist or patient) moves into another Member's territory to obtain a service
Commercial presence implies that a service supplier of one Member establishes a territorial presence, including through ownership or lease of premises, in another Member's territory to provide a service (e.g. hotel chains)
Presence of natural persons consists of persons of one Member entering the territory of another Member to supply a service (e.g. accountants, doctors or teachers). basis.
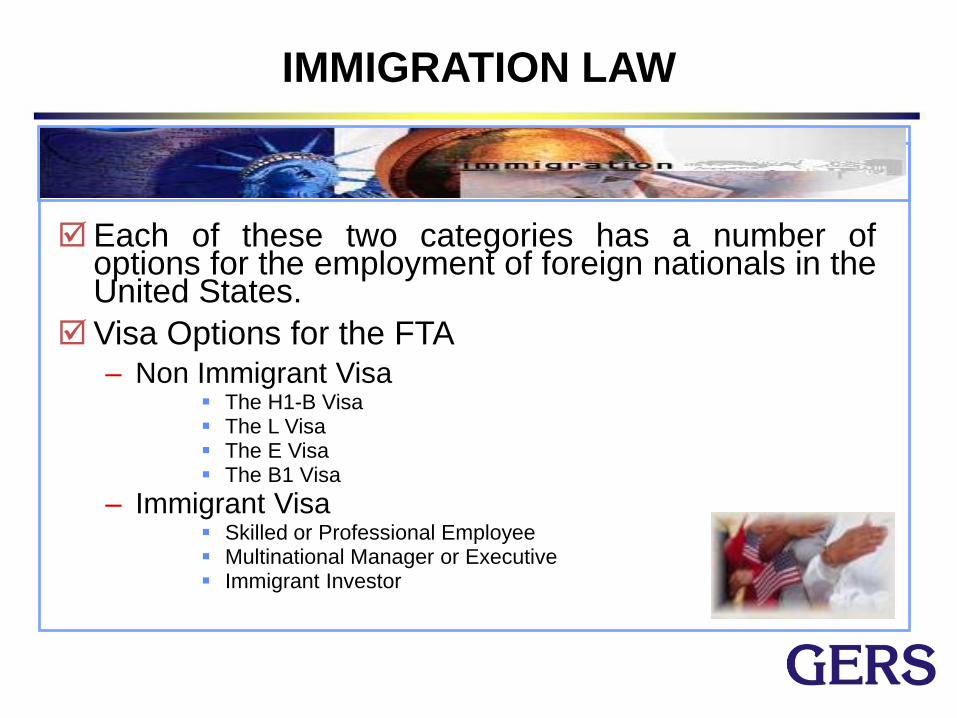
IMMIGRATION LAW
Each of these two categories has a number of options for the employment of foreign nationals in the United States.
Visa Options for the FTA – Non Immigrant Visa
The H1-B Visa The L Visa The E Visa The B1 Visa
– Immigrant Visa Skilled or Professional Employee Multinational Manager or Executive Immigrant Investor
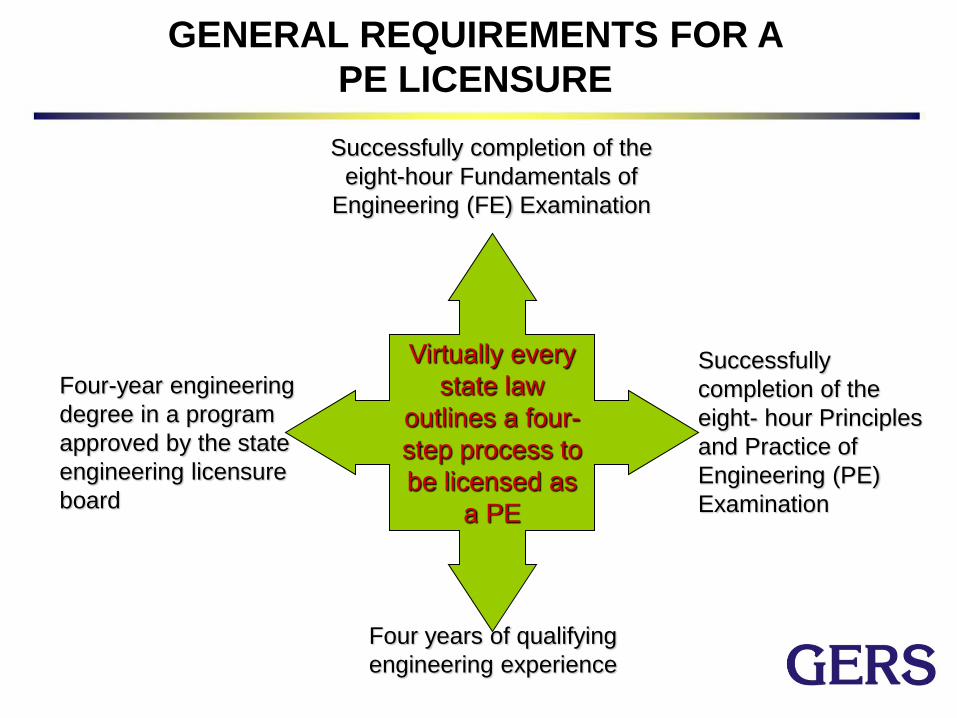
GENERAL REQUIREMENTS FOR A
PE LICENSURE
Virtually every
state law
outlines a four-
step process to
be licensed as
a PE
Four-year engineering
degree in a program
approved by the state
engineering licensure
board
Four years of qualifying
engineering experience
Successfully completion of the
eight-hour Fundamentals of
Engineering (FE) Examination
Successfully
completion of the
eight- hour Principles
and Practice of
Engineering (PE)
Examination
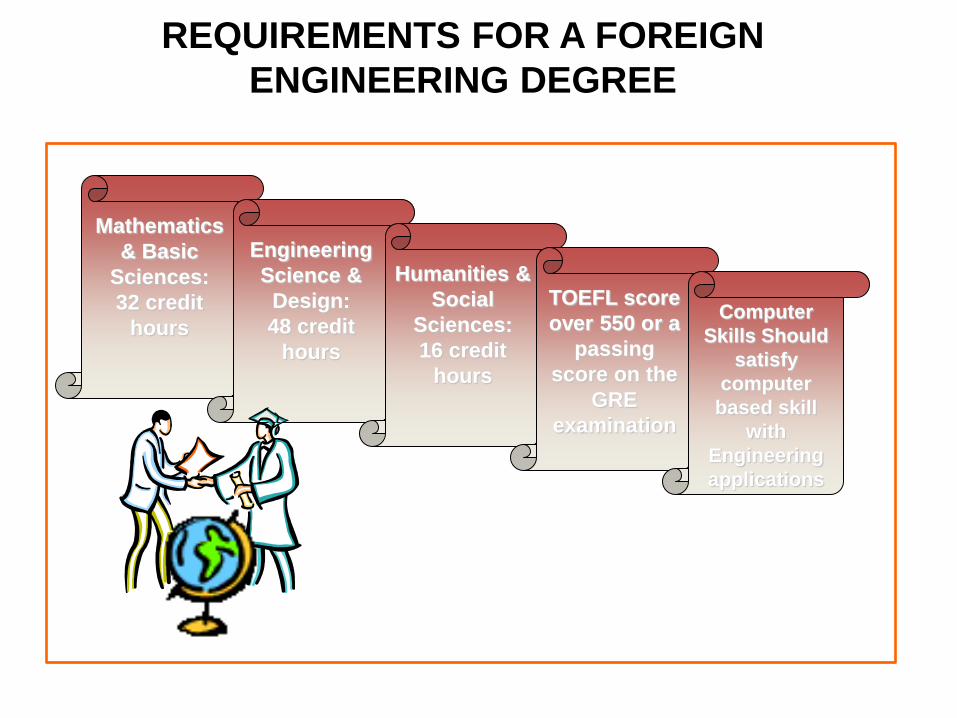
REQUIREMENTS FOR A FOREIGN
ENGINEERING DEGREE
Mathematics
& Basic
Sciences:
32 credit
hours
Engineering
Science &
Design:
48 credit
hours
Humanities &
Social
Sciences:
16 credit
hours
TOEFL score
over 550 or a
passing
score on the
GRE
examination
Computer
Skills Should
satisfy
computer
based skill
with
Engineering
applications

THE CORPORATE FORM MENU
CORPORATE
STRUCTURE
OWNERSHIP RULES TAX TREATMENT LIABILITY PROS AND CONS
Sole
Proprietorship
One owner Pass-through federal tax
entity
Unlimited
personal
liability for
business
debts.
Is easy to set up but
leaves your personal
finances at risk. Plus,
you miss out on all
kinds of business
deductions.
S Corporation Up to 75
shareholders, only
one basic class of
stock; slight flexibility
on voting rights.
Pass-through federal tax
entity
Limited Is easy to set up but
may limit your financing
options later on.
C Corporation Unlimited number of
shareholders; no
limits on stock classes
or voting
arrangements.
Dividend income gets
taxed at the corporate
and shareholder levels;
losses and deductions
stay at the corporate
level.
Limited Can be costly from a
tax perspective but
investor friendly.
TYPES OF BUSINESS ORGANIZATIONS
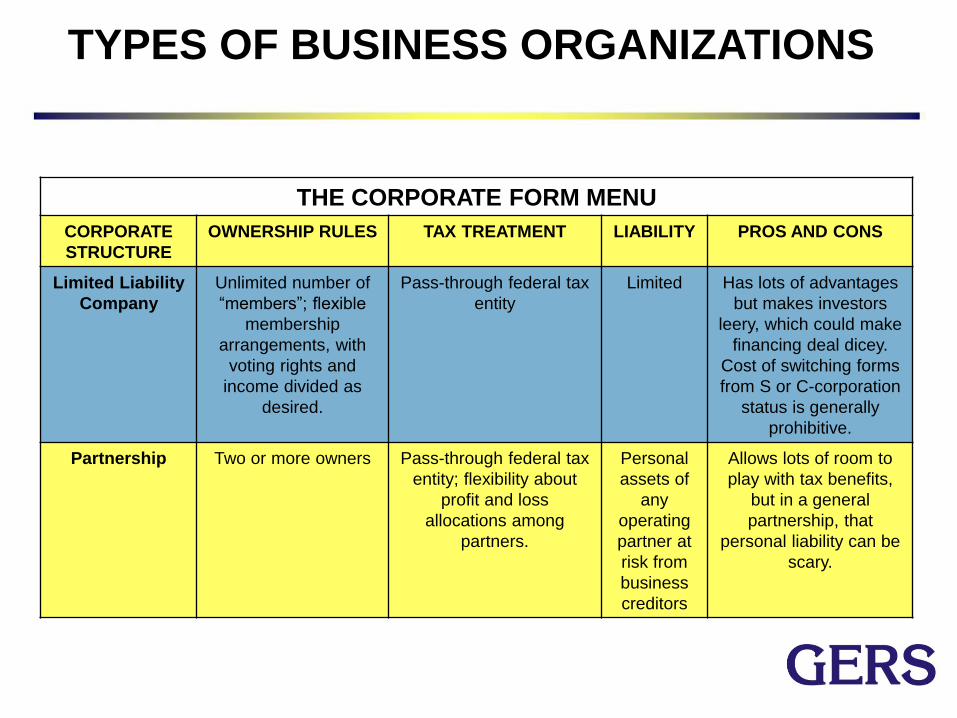
THE CORPORATE FORM MENU
CORPORATE
STRUCTURE
OWNERSHIP RULES TAX TREATMENT LIABILITY PROS AND CONS
Limited Liability
Company
Unlimited number of
“members”; flexible
membership
arrangements, with
voting rights and
income divided as
desired.
Pass-through federal tax
entity
Limited Has lots of advantages
but makes investors
leery, which could make
financing deal dicey.
Cost of switching forms
from S or C-corporation
status is generally
prohibitive.
Partnership Two or more owners Pass-through federal tax
entity; flexibility about
profit and loss
allocations among
partners.
Personal
assets of
any
operating
partner at
risk from
business
creditors
Allows lots of room to
play with tax benefits,
but in a general
partnership, that
personal liability can be
scary.
TYPES OF BUSINESS ORGANIZATIONS
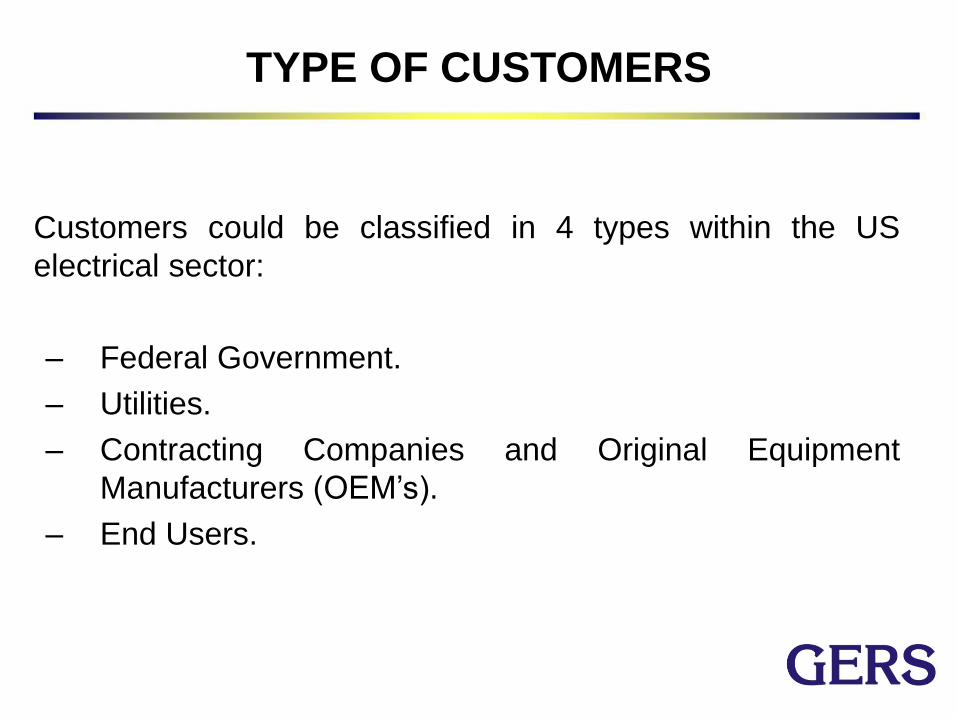
TYPE OF CUSTOMERS
Customers could be classified in 4 types within the US
electrical sector:
– Federal Government.
– Utilities.
– Contracting Companies and Original Equipment
Manufacturers (OEM’s).
– End Users.
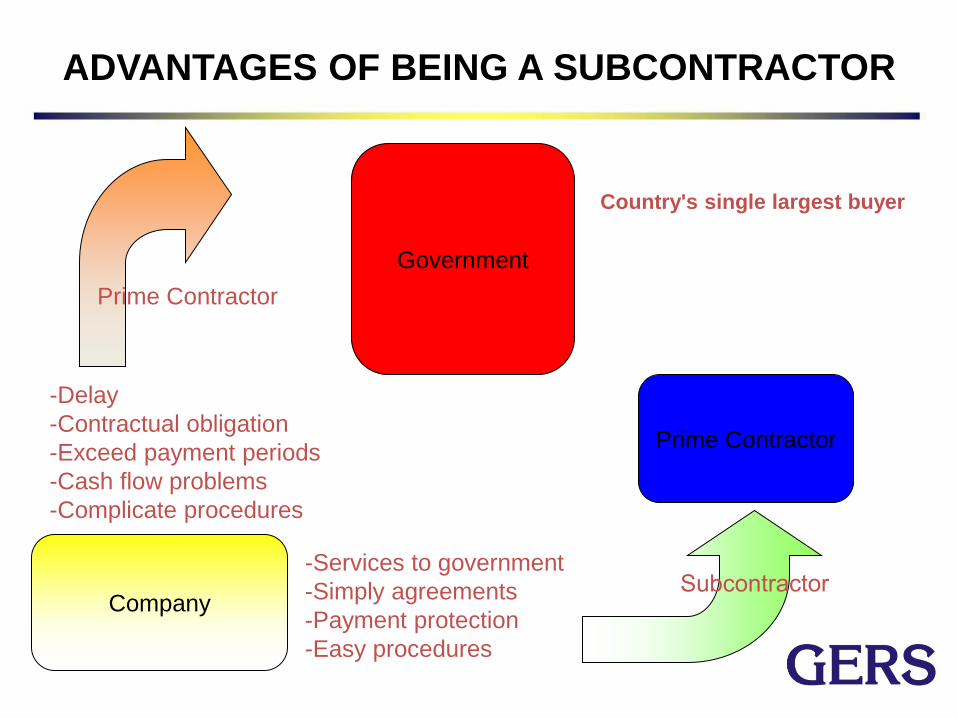
ADVANTAGES OF BEING A SUBCONTRACTOR
Company
Government
Prime Contractor
Prime Contractor
-Delay
-Contractual obligation
-Exceed payment periods
-Cash flow problems
-Complicate procedures
-Services to government
-Simply agreements
-Payment protection
-Easy procedures
Country's single largest buyer

FEDERAL PROCUREMENT
The federal government purchases billions of dollars in goods and
services each year from paperclips to complex space vehicles.
To ensure that small businesses get their fair share, statutory goals
have been established for Federal executive agencies. They are:
23 percent of prime contracts for small businesses
5 percent of prime and subcontracts for small disadvantaged businesses
5 percent of prime and subcontracts for women-owned small businesses
3 percent of prime contracts for Historically Underutilized Business Zone (HUBZone) small businesses
3 percent of prime and subcontracts for service-disabled veteran-owned small businesses.
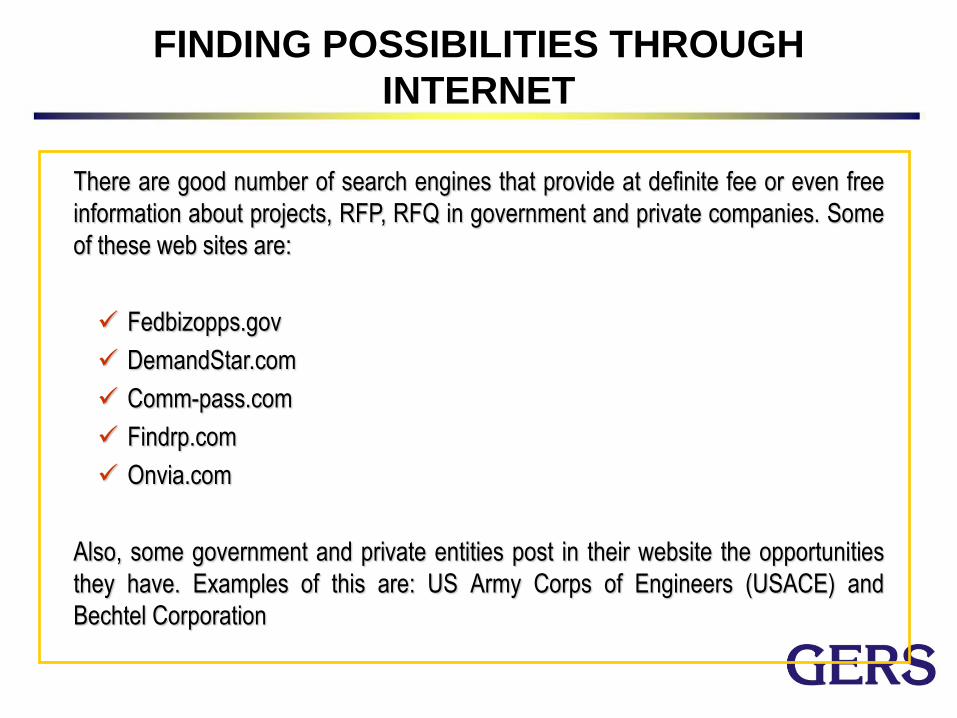
FINDING POSSIBILITIES THROUGH
INTERNET
There are good number of search engines that provide at definite fee or even free
information about projects, RFP, RFQ in government and private companies. Some
of these web sites are:
Fedbizopps.gov
DemandStar.com
Comm-pass.com
Findrp.com
Onvia.com
Also, some government and private entities post in their website the opportunities
they have. Examples of this are: US Army Corps of Engineers (USACE) and
Bechtel Corporation
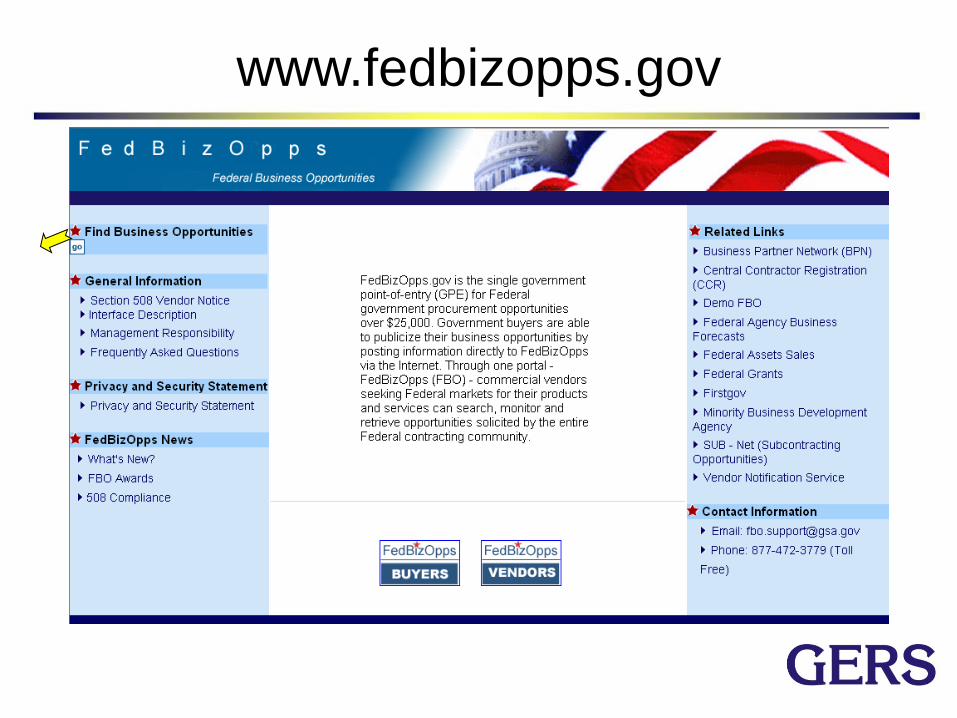
www.fedbizopps.gov
Possibilities of Solar Generating Plants in
New Mexico

SOLAR GENERATION CLASSIFICATION
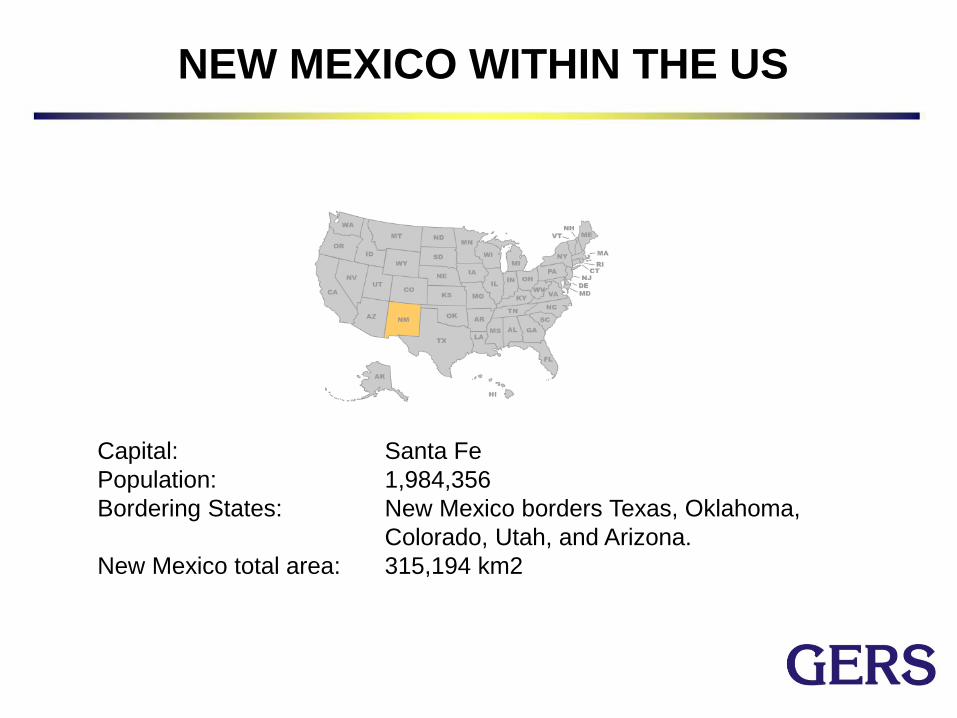
NEW MEXICO WITHIN THE US
Capital: Santa Fe
Population: 1,984,356
Bordering States: New Mexico borders Texas, Oklahoma,
Colorado, Utah, and Arizona.
New Mexico total area: 315,194 km2

CURRENT PROJECTS

Possibilities in Energy
Efficiency Projects
Energy service company or energy savings company (ESCO or ESCo) is a commercial or non-profit business providing a broad range of comprehensive energy solutions including:
• Designs and implementation of energy savings projects,
• Energy infrastructure outsourcing,
• Generation and energy supply,
• Risk management.
According to the industry group NAESCO, revenues of ESCOs in the US grew by 22% in 2006, reaching $3.6 billion. Currently, the largest independent energy services company is AMERESCO.
Energy Efficiency
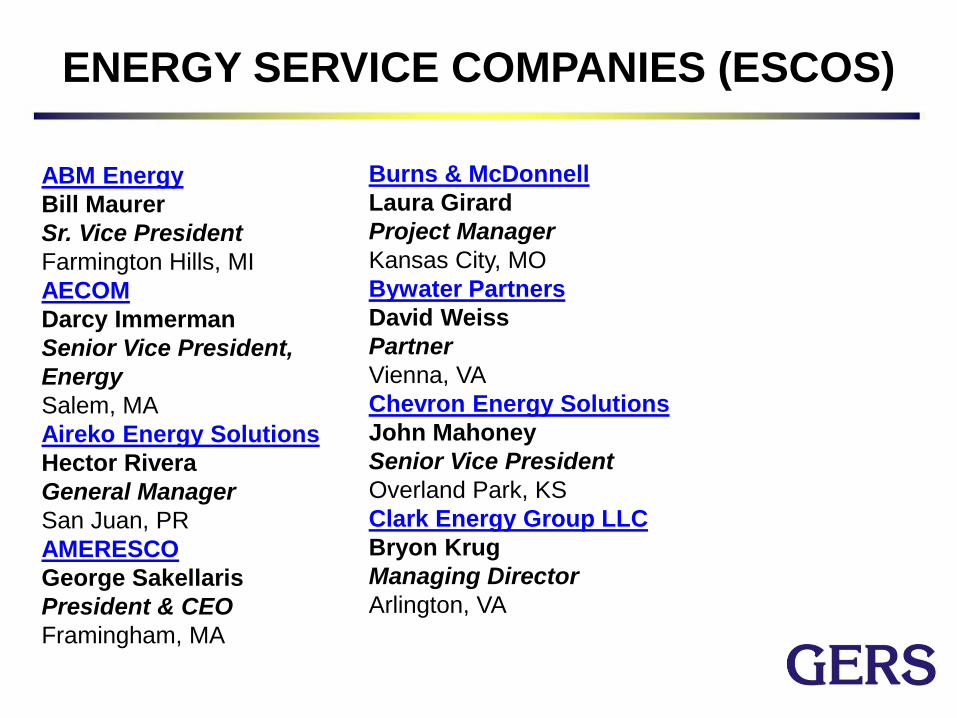
ENERGY SERVICE COMPANIES (ESCOS)
ABM Energy
Bill Maurer
Sr. Vice President
Farmington Hills, MI
AECOM
Darcy Immerman
Senior Vice President,
Energy
Salem, MA
Aireko Energy Solutions
Hector Rivera
General Manager
San Juan, PR
AMERESCO
George Sakellaris
President & CEO
Framingham, MA
Burns & McDonnell
Laura Girard
Project Manager
Kansas City, MO
Bywater Partners
David Weiss
Partner
Vienna, VA
Chevron Energy Solutions
John Mahoney
Senior Vice President
Overland Park, KS
Clark Energy Group LLC
Bryon Krug
Managing Director
Arlington, VA

CONCLUSIONS
The electrical system of the USA presents a giant and well developed infrastructure but presents severe weaknesses and needs important projects. Therefore it offers huge market possibilities for transnational and established companies.
Doing business in the USA is both easy and difficult. It is easy in the sense that there are thousands of opportunities well paid generally. It is difficult though in the sense that penetrating the American market is complicated, high investment is normally required and getting acquainted with the bid process is lengthy.
It is very important to stress that the US offers possibilities in each of the 50 states. From a selection based on economical figures and parameters of the electricity market a total of 10 states were taken: Texas, Florida, California, Pennsylvania, New York, Ohio, Illinois, North Carolina, Georgia and Michigan.