Embed Size (px)
Citation preview

FIRE RESEARCH
Summary Report
Fire Safe implementation of visible mass timber in tall buildings – compartment fire testing
Daniel Brandon, Johan Sjöström, Emil Hallberg, Alastair Temple and Fredrik Kahl
RISE Report 2020:94

1
Fire Safe implementation of visible mass timber in tall buildings – compartment fire testing
Daniel Brandon, Johan Sjöström, Emil Hallberg, Alastair Temple and Fredrik Kahl

2
Corrigendum This report includes corrections made on 12/03/2021, which includes a corrected list of
authors, clarification of the objectives, and a correction of the figure for Test 3 of Table
1.
Abstract
Summary Report
Five real scale compartment fire tests, constructed of CLT slabs and glulam beam and
column in accordance with current US product standards, were performed. The
compartments had surface areas of exposed mass timber equal to up to two times the
area of the floor plan. The 4 hours long tests showed that compartments with such
quantities of exposed wood can exhibit continuous decay to hot-spots and embers after
flashover. The tests indicate that the presence of two exposed wall surfaces in one corner
should be avoided to ensure this.
Key words: Mass Timber, CLT, Fire, Compartment fire, Glued laminated timber
RISE Research Institutes of Sweden AB
RISE Report 2020:94
ISBN:978-91-89167-79-7
2021

3
Content Corrigendum .............................................................................................. 2
Abstract ...................................................................................................... 2
Content ...................................................................................................... 3
Preface ....................................................................................................... 4
1 Introduction......................................................................................... 5
1.1 Background .........................................................................................................5
1.2 Aim and objectives of this study ........................................................................ 6
2 Experimental setup .............................................................................. 7
2.1 Intersections ..................................................................................................... 14
2.2 Measurements .................................................................................................. 17
3 Pass/fail criteria – ICC TWB................................................................ 18
4 Summary of test results ...................................................................... 19
4.1 Events ............................................................................................................... 19
4.2 Interior plate thermometers ............................................................................. 21
4.3 Gypsum board protection ................................................................................ 25
4.4 Heat release rates .............................................................................................. 27
4.5 Char depths ...................................................................................................... 28
4.6 Intersections .................................................................................................... 34
4.7 Discussion ........................................................................................................ 40
5 Main conclusions ............................................................................... 42
References ............................................................................................... 44
Annex A - Façade drawings ....................................................................... 46
Annex B - Probabilistic study of compartments and fire scenarios ........... 48
Annex C - Fuel load ................................................................................... 53
Annex D - Mass loss measurements and heat release rate calculations .... 56
Annex E - Photos ....................................................................................... 61
Annex F – Facade pictures and details ..................................................... 68
4
Preface This report provides the test results of a research project of fire safe implementation of
visible wood in tall timber buildings. The main funder of the project is the US Forest
Service (USFS), US Department of Agriculture (USFS Grant Number 2019-DG-
11083150-022), the project owner is the American Wood Council (AWC), and
Research Institutes of Sweden (RISE) is the contractor for this research project.
Other project partners and funders of this project are: Katerra providing ANSI/APA
PRG 320 (2018) compliant CLT, KLH providing ANSI/APA PRG 320 (2018) compliant
CLT; Henkel providing the required ANSI/APA PRG 320 (2018) compliant timber
adhesive and additional funding, Boise Cascade providing ANSI A 190.1-2017
compliant glued laminated timber; USG, providing Type X gypsum boards;
Rothoblaas, providing mass timber screws, sealants, tapes, resilient profiles and
equipment for lifting anchors mass timber members; the Softwood Export Council
providing shipment costs of US products to the test site in Sweden; Brandforsk
providing additional funding for the inclusion of façade extension measurements. The
façade measurements are out of the scope of this report. Technical in-kind contributions
were provided by NIST for recording of videos in severe fire conditions.
A Steering Group was assembled for this project, comprising of:
Kevin Naranjo (USDA)
Kuma Sumathipala, Jason Smart, Kenneth Bland (AWC)
Sean DeCrane (Building & Life Safety Technologies, UL)
Gordian Stapf, Christian Lehringer, Daniel Current, Chris Whelan (Henkel)
Hans-Erik Blomgren (Katerra)
Sebastian Popp, Johannes Habenbacher (KLH)
Kyle Flondor, Ajith Rao, Young-Geun You (USG)
Susan Jones (Atelier Jones)
Rodney McPhee (Canadian Wood Council)
Dan Cheney (Boise Cascade)
Hannes Blaas, Andres Reyes, Paola Brugnara (Rothoblaas)
All steering group members provided in-kind technical contributions in this project.

5
1 Introduction This summary report discusses a compartment fire test series and includes a discussion
of the setup and a summary of basic results and observation. The selected results aim to
allow an assessment of the occurrence of a decaying fire. The final project report, to be
issued at a later date, will have a full overview of all results, including a case study to
repair a portion of a fire damaged structure.
1.1 Background
New US building regulations for the International Building Code (IBC) 2021 have
recently been approved, which allow the construction of tall buildings with mass timber
structures. The IBC 2021 includes three new building types dedicated for mass timber
structures, namely IV-A, IV-B and IV-C. Buildings of type IV-A can be up to 18 stories
and have the most strict fire safety requirements, including required protection of all
mass timber surfaces, using non-combustible fire protection contributing to no less than
2/3 of the required fire resistance rating of the mass timber itself (2 hrs. for IV-A).
Buildings of type IV-B can be built up to 12 stories and can have limited portions of the
ceiling (20%) or limited portions of walls (40% of the floor area) exposed. Buildings of
type IV-C can have all mass timber surfaces exposed, but have stricter limitations of
building height, depending on the type of occupancy. It should be noted that other fire
safety requirements hold for all building types, such as the presence of NFPA 13
compliant sprinklers, as summarized by Breneman et al. (2019).
The limitations for buildings of type IV-B were based on two compartment fire tests
performed by Zelinka et al. (2018), in which relatively small surface areas of timber were
exposed. Both fires continuously decayed after a period of flashover for at least three
hours, and were continuously decaying at 4 hours after ignition, which has been a
primary acceptance criterion for the ICC TWB Ad hoc committee.
There has, however, been a change of requirements in the CLT product standard
(ANSI/APA PRG320, 2018), requiring the face bond adhesive of CLT to withstand a 3-
hour long full-scale compartment fire test without the occurrence of delamination and to
pass a bench scale test. As previous research (McGregor 2014, Medina Hevia, 2015, Su
et al. 2018, Brandon et al. 2018, Hadden et al. 2017, Emberley, 2017) demonstrated the
significant effect that CLT delamination can have on compartment fire dynamics, this
change in the ANSI/APA PRG320 can significantly change the outcome of fires in
compartments made of CLT.
The tests by Zelinka et al. (2018) were initiated before the 2018 version of ANSI/APA
PRG 320 was published and the tested CLT was not compliant with the new product
standard, compromising the potential fire performance of the structure. In addition, the
tests by Zelinka et al. involved the highest heat release rates of any indoor CLT
compartment fire test and possibilities of increasing the surface areas of timber in any
indoor fire test at this scale would be limited because of the laboratory’s exhaust and
calorimeter limitations.
A first study of fires in compartment made of ANSI/APA PRG320 (2018) compliant CLT,
was performed at NRC-CNRC in Canada (Su et al. 2018b). This study showed an

6
improved potential for compartment fires of CLT structures to decay. However, due to
charring behind two layers of ½ inch gypsum plaster boards and some details in the
design, some of these fires did not fully decay.
1.2 Aim and objectives of this study
This study aims to assess possibilities for safe increases to US code-prescribed limits of
visible mass timber surface areas, for mass timber products that comply with current US
product standards.
The specific objectives are, therefore, to:
• Perform a series of compartment fire tests in structures constructed of PRG 320-2018 compliant CLT with varying amounts of exposed mass timber areas.
• Provide background for possible1 justification of increases to code-prescribed limits of exposed mass timber surfaces consistent with the fire performance
criterion2 used for changes to the International Building Code.
• Identify additional measures necessary (if any) to ensure the International Code
Council (ICC) established fire performance criterion and additional criteria
discussed in Section 3 are met.
In addition, secondary objectives are defined:
• Design and test intersections between exposed mass timber members that are
practical, affordable and sufficient for the entire fire duration of compartment
fires.
• Develop and test a method of restoring exposed CLT members after a fire. Note: this objective is not further discussed in this summary report.
• Allow for comparisons of the fire exposure measured on the front façade above ventilation openings of compartments that are fire tested. The exposure of three
of these tests is expected to be statistically severe (with respect to quantity of
external combustion and duration). Note: this objective is part of the project
add-on funded by Brandforsk (as noted in the Preface) and is not further
discussed in this summary report.
• Map the influence of increasing the surface area of exposed mass timber on the
façade exposure. Note: this objective is part of the project add-on funded by
Brandforsk (as noted in the Preface) and is not further discussed in this
summary report.
1 This clarification is added on 12/03/2021 2 ICC TWB Ad Hoc committee used a fire performance criterion where a compartment fire should continue to decay at 4 hours following fire initiation.

7
2 Experimental setup Five compartment fire experiments were performed for this study. The compartments
had internal dimensions of 23.0 ft x 22.5 ft x 9.0 ft (7.0 m x 6.85 m x 2.73 m). Four of
these compartments had two ventilation openings (Figure 1) of 7.4 ft x 5.8 ft (2.25 m x
1.78 m, width x height) resulting in an opening factor3 of 0.112 ft1/2 (o.o62 m1/2). The
compartment dimensions and the opening factor were based on a probabilistic analysis
and surveys of data of tall residential buildings, as discussed in Annex B. The remaining
compartment test had six larger openings, resulting in an opening factor of 0.25 m1/2
(0.453 ft1/2), which is approximately equal to the midrange of opening factors for office
compartments found in the survey of Annex B.
Figure 1: Fully developed fire of Test 1
The compartments were constructed of ANSI/APA PRG 320, 2018 compliant 6.9 inch
(175 mm) thick 5-ply CLT (each ply 1.38 inches, 35-35-35-35-35 mm) and ANSI A 190.1-
2017 compliant glued laminated timber. The average moisture content of the mass
timber members was 13%. It is important to note that in contrast with most previous
studies, the tested CLT lay-up with the specific enhanced poly-urethane adhesive fulfills
the requirements specified in Annex B of the 2018 version of ANSI/APA PRG 320. In
this study, varying mass timber surfaces were protected with Type X gypsum boards. All
CLT, glued laminated timber and gypsum boards used during the tests complied with
current US regulations and standards.
3 Definition of opening factor: 𝑂 = 𝐴0√𝐻0 𝐴𝑡⁄ , where 𝐴0 = ∑𝐴𝑖 is the sum of all opening areas, 𝐴𝑡
is the total enclosing area (incl. openings), 𝐻0 = ∑(𝐴𝑖ℎ𝑖) 𝐴0⁄ , and ℎ𝑖 is the height of each opening

8
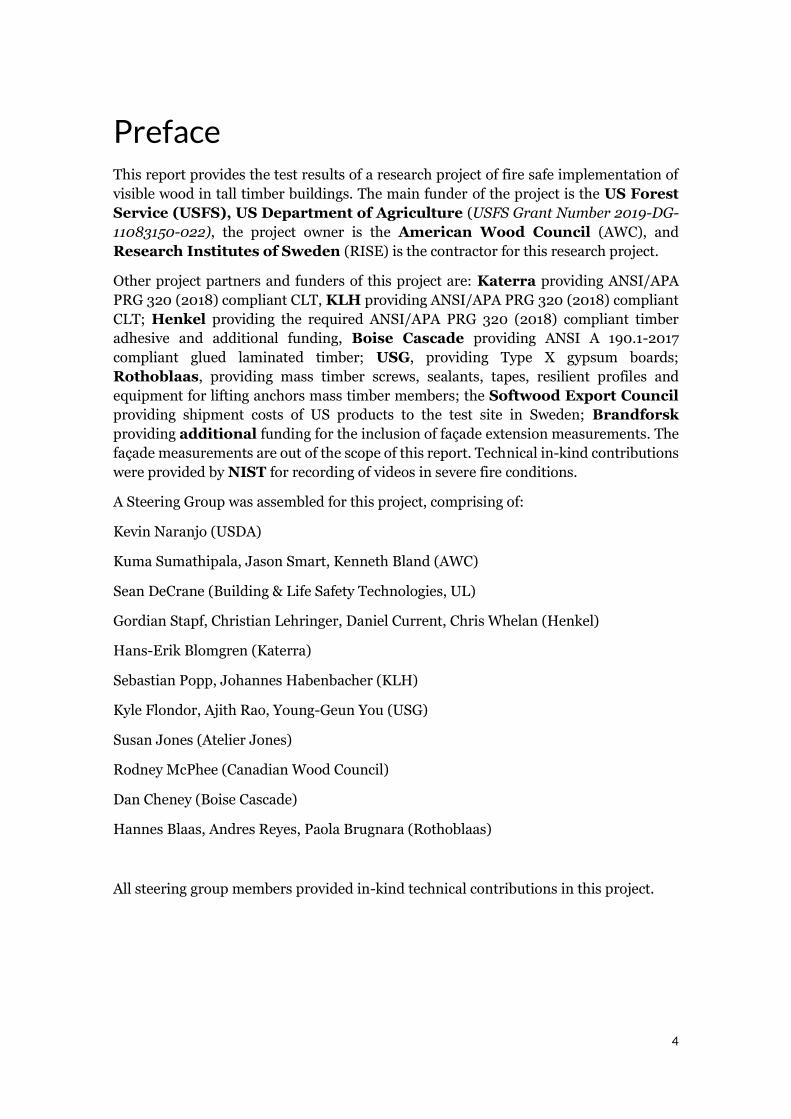
The floor plan of Test 1, 2, 3 and 5 is shown in Figure 2. The Floor plan of Test 4 is shown
in Figure 3. Drawings of all facades with openings are shown in Annex A.
The dimensions of the compartment, size of the openings and fuel load density were
determined from a probabilistic analysis aiming to test a severe fire scenario that is based
on the designs of real buildings, which is summarized in Annex B. The combination of
the compartment dimensions, fuel load density and opening factor results in the 85th
percentile of expected total char damage for fire scenarios in residential buildings where
sprinklers are not activated, flashover takes place and fire service interference is absent.
Details of this analysis are indicated in Annex B. The target fuel load density resulting
from the probabilistic study is 560 MJ/m2 (52 MJ/ft2).
The fuel used was a combination of typical apartment furniture, particle board sheets on
the floor to represent a wooden floor, and additional wood cribs representing fuel in
storage spaces. The calculation of the moveable fuel load is provided in Annex C, in which
the fuel items denoted with the letters A to J in Figure 2 and Figure 3 are specified. The
total mass of the moveable fuel on the floor was measured using load cells under the floor
for every test and was 2881 ± 22 lb (1307 ± 10 kg) in total.
9
Figure 2: Floor plan of Test 1, 2, 3 and 5

10
Figure 3: Floor plan of Test 4
The locations of gypsum board protection and the number of layers of gypsum board
protection along with the percentages of exposed surface areas are provided in Table 1.
The CLT ceiling and the glued laminated timber beam were exposed in all tests. The table
includes the number of 5/8 inch thick (15.9 mm) Type X gypsum board layers (GB) that
were implemented on interior surfaces. Schematic floor plans (not to scale) indicate the
locations of the protected surfaces. In addition, the drawings also indicate the fire
protection that was implemented on the sides and top of the opening and on the fire
exposed façades. All gypsum board layers were attached with gypsum screws at a

11
maximum relative distance of 10.8 inch (274 mm) in both horizontal and vertical
direction. Edge distances of 2.5 inch (64 mm) were implemented for screws at the edge
of the gypsum boards. The lengths of the gypsum screws were 1.6 inch (41 mm) long for
the base layer, 2.2 inch (55 mm) long for the second layer and 2.8 inch (72 mm) long for
the third layer. Specialized equipment was used to prevent the screw heads from
punching through the paper surface of the gypsum boards and prevent premature
damage of the boards. On the exposed surface all screw heads and joints between gypsum
boards were finished with regular joint compound.
Of the small opening tests (tests 1, 2, 3 and 5 - representative of dwellings), Test 1 had
the least surface area of exposed wood followed by Test 2. Test 3 and 5 had the same
exposed wood surface area, but in Test 5 no corners with two exposed walls were present.
For Test 4 (large opening – representative of mercantile occupancy) all internal, walls
except for the back wall were exposed.

12
Table 1: Test matrix (GB indicates gypsum boards; SW indicates stone wool)
Test
name
Window
Opening
size
Gypsum Board
(GB) Protected
interior
surfaces*
Exposed wood
surfaces Floor plan (schematic)***
Test 1
Two
window
openings
86 ft2 (8.0
m2) of
exterior
wall open
- All walls and
- Column
protected by 2
layers of GB
100% of ceiling
exposed and 100%
of beam exposed
No exposed wood
surfaces in walls
Test 2
Two
window
openings
86 ft2 (8.0
m2) of
exterior
wall open
-Back wall and
-Front wall
protected by 3
layers of GB
100% of ceiling,
100% of beam, and
100% of left and
100% of right-side
walls exposed
No exposed wood
wall surfaces
meeting in a corner
Test 3*
Two
window
openings
86 ft2 (8.0
m2) of
exterior
wall open
-Back wall and
-Back 5 ft (1.5
m) length of
right wall
protected by 3
layers of GB
Note: figure on
right side is
corrected on
12/o3/2021
100% ceiling, 100%
beam, and 100% of
left side and 78% of
right-side walls,
and 100% of front
wall and 100% of
column exposed.
Two exposed wood
wall surfaces
meeting in a corner
(front left and front
right)
Openings 2GB
Walls 2GB
Column 2GB
Facade 1GB
Column 3GB
Back wall 3GB
Openings 2 GB sides; 3GB topFacade 1GB + 50mm SW
Back wall3GB
Openings 3GB**
Facade 1GB + 45mm SW
Back 1.5m ofright wall
3GB

13
Test
name
Window
Opening
size
Gypsum Board
(GB) Protected
interior
surfaces*
Exposed wood
surfaces Floor plan (schematic)***
Test 4*
Six
Window
openings
336 ft2
(31.2 m2)
of exterior
wall open
Back wall
protected by 2
layers of GB
100% ceiling, 100%
of beam, and 100%
of left and 100% of
right-side walls,
and 100% of front
wall and column
exposed.
Two exposed wood
wall surfaces
meeting in a corner
(front left and front
right)
Test 5*
Two
window
openings
86 ft2 (8.0
m2) of
exterior
wall open
-Back wall and
-2.3 ft (0.7 m)
on left and
right-side edges
of the front wall
protected by 3
layers of GB
100% ceiling, 100%
beam, and 100% of
left-side and 100%
of right-side walls,
and 60% of front
wall and 100% of
column exposed.
No exposed wood
wall surfaces
meeting in a corner
*To be able to weigh the floor separately from the structure, the floor was not directly attached to the walls of the fire test compartment. The small gap, between the floors and the walls was filled with stone wool insulation for all tests. In Test 2, some of the stone wool fell out of place and resulted in fire spread downward from the compartment floor in this (artificially created) gap. Therefore, for subsequent tests, a 10 cm (4”) strip of gypsum board was applied to the bottom of all exposed walls to cover the wall/floor gap in Test 3, 4 and 5.
** In Test 3 and 5, three layers of gypsum boards were applied on the side of the ventilation openings instead of two layers. The extra layer made the openings slightly narrower than the openings of Test 1 and 2. To compensate for this, the height of the ventilation opening was increased so that the opening factor for Tests 1, 2, 3 and 5 was the same.
***Protection on the façade and façade details at the opening have been changed iteratively. Annex F gives an overview of details and pictures after the tests. A full discussion will be included in the final project report.
Back wall2GB
Openings 2GBFacade 1GB + 50mm SW
Back wall 3GB
Openings 3GB**Facade 1GB + 50mm SW

14
2.1 Intersections
One of the secondary objectives of this study was to “Design and test intersections
between exposed mass timber members that are practical, affordable and sufficient for
the entire fire duration of compartment fires” (Section 1.2).
For intersections of mass timber building elements with other building elements, where
both are required to be fire resistance rated, the IBC 2021 requires the use of sealants in
accordance with ASTM C920 and ASTM D3498. Instead of complying with IBC 2021, it
was aimed to study the performance of alternative solutions that potentially increase
practicability and possibly lower costs. To this end several types of commercially
available sealants were applied between mass timber elements during this study. This
report contains a limited discussion of the performance of such sealants. The final project
report, to be issued at a later date, would contain a thorough discussion of all details.
Sealants were applied between mass timber elements to reduce the risk of fire spread
through mass timber intersections, in particular, CLT-CLT intersections, by eliminating
the flow of hot gasses between mass timber elements at intersections. It is expected that
sealing materials do not need a high temperature resistance if the sealant is used in
locations not directly exposed to a compartment fire. The tested sealants were primarily
those generally used to improve air tightness, water proofing or acoustic performance.
Test results should indicate if these are suitable to prevent fire spread through
intersections. Table 2 gives an overview of the materials used to seal the intersections,
including information of their temperature resistance, if available.
Table 2: Materials used at intersections of CLT members.
Product Common functions Detailed description
Construction
tape
Water proofing
Improving air tightness
Tape comprising of a polyethylene film, with
reinforcing Polyethylene grid and acrylate
adhesive. Width: 60 mm (2.36 inch);
Thickness: 0.25 mm (0.01 inch);
Temperature resistance: -40/80˚C.
Expanding
tape
Improving sound
insulation
Improving air tightness
Elastic expanding tape developed to fill
irregular gaps, sound proofing up to 58 dB.
Width: 20 mm (0.8 inch);
Max expansion (thickness): 20 mm (0.8
inch). Temperature resistance: -30/90 ˚C.
Resilient
profile
Sound proofing
Improving water
tightness
Resilient profile of polyurethane. Width: 140
mm (0.46 ft); Thickness: 0.24 inch (6 mm);
Thermal conductivity: 0.2 W/mK. Maximum
processing temperature: >200 ˚C.
Construction
sealing
Improving air tightness
Improving sound
insulation
Expanded EPDM (synthetic rubber). Width:
46 mm (0.15 ft); Thickness: 3 mm (0.12
inch); Temperature resistance: -35/100 ˚C.
Fire Sealing
adhesive
Fire sealing
Acoustic insulation
1-component silicon elastomer adhesive. Up
to 90 minutes fire rated. Sound proofing up
to 60 dB.

15
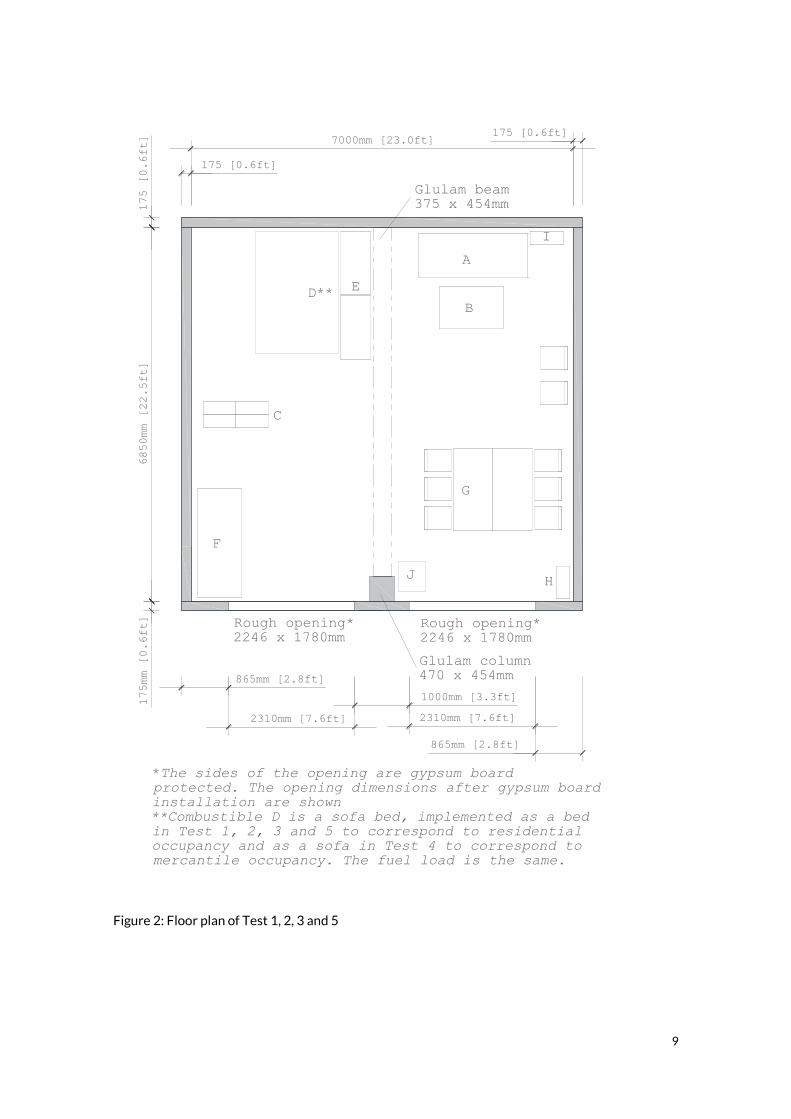
Figure 4 shows details of the CLT intersection and indicates which sealing material was
used in each test.
Spline board joints with Ø0.24 x 3.1 inch (Ø6 x 80 mm) washer-head screws with 10 inch
(250 mm) spacing were used to connect CLT panels in the ceiling. Four different variants
were used to seal the spline board joint, using either construction tape or expanding tape.
It was expected that a slight offset of height between two CLT members may cause a
channel of air along the spline board in the details of Test 1 and 3. For that reason, tape
that sealed the end of the channel (at the ends of the spline board) was implemented in
those tests. This was not done for the other tests, because the implemented tape was
expected not to allow hot gasses in any potential channel under the spline board.
Lap joints were used to connect wall elements that were in the same plane. The members
were connected using Ø0.32 x 4.7 inch (Ø8 x 120 mm) countersunk head screws with 10
inch (250 mm) spacing. In Tests 3, 4 and 5 no sealing materials were implemented for
lap joints in gypsum protected walls. For exposed walls two variants have been
implemented using either construction tape or expanding tape as shown in Figure 4 C.
Butt-joints between CLT walls and ceiling panels were implemented using Ø0.32 x 11.8
inch (Ø8 x 300 mm) washer-head screws. Three variants to seal the joints were
implemented using resilient profile and/or construction tape. The resilient profile was
positioned centrically on top of the walls. Since the CLT wall is 35 mm wider than the
resilient profile a small void was formed between the construction tape and the resilient
profile on the external side in Tests 2, 4 and 5. Although it was not expected that high
temperatures would be reached in this void, a small amount of fire sealing adhesive was
used every two meters, to limit flow of gasses in the longitudinal direction of the void in
case it would manage to pass the resilient profile. For locations at which the walls were
gypsum board protected, a small amount of fire sealing adhesive was used to avoid gasses
flowing into the void between the resilient profile and the gypsum boards. Fire sealing
adhesive was used to fill up some visible voids between the resilient profile and the CLT
in a few locations of the left and right walls of the Test 2 and 3 compartments.
CLT wall corner joints were connected also using Ø0.32 x 11.8 inch (Ø8 x 300 mm)
washer-head screws. Three variants to seal the joints were implemented, using
construction sealing, construction tape, or expanding tape (Figure 4 D). The construction
sealing was stapled to the end of the walls before assembly.
16
Figure 4: Variants of sealed CLT intersections and their sealing details (different colours represent different sealing types and/or locations)
* Construction tape was used to close potential voids between the spline board and the CLT at the end of the spline board, for Tests 1 and 3.
** Construction tape was not used for lap joints between gypsum protected walls in Test 3, 4 and 5.
All configurations of CLT joints of Figure 4 were at least in one test implemented without
any gypsum board protection, with the exception of the wall-ceiling joint of Test 1 and
the wall-wall butt joint of Test 2. Those two configurations were subjected to less severe
exposure because of the gypsum board protection. Therefore, the detail of these specific
tests including gypsum boards is shown in Figure 5. In Test 1, no fire sealant was
implemented between gypsum and abutting CLT members in corners. Before all
subsequent tests, a small amount of fire sealing adhesive was used only in locations
where a gap between gypsum and abutting CLT was visible.
A B
C D

17
Figure 5: Variants of CLT intersections that only were implemented together with gypsum board protection.
2.2 Measurements
The test measurements were made before, during and for a period after the test. This
summary report focusses only on basic measurements made during the tests that allow
for identifying a decaying nature of a fire. In addition, charring depths measured after
the tests have been included.
As such, the results presented in this report are limited to:
- Temperature measurements by plate thermometers at wall and ceiling surfaces that
are directed into the compartment (Figure 6);
- Observations and measurements related to gypsum board protection;
- Heat release rates;
- Important observations during the tests;
- Observations regarding flame spread through intersections of mass timber members.
The final project report will include all measurements in either the main text or the
Annex together with a more in-depth discussion of details. It will also include a
description of locations where smoldering continued after the fires and a case study of
repairing a part of the CLT after the fire.

18
Figure 6: Locations of plate thermometers (includes only plates at surfaces that are directed away from the surface).
* indicates plates that are implemented in Test 5 only
3 Pass/fail criteria – ICC TWB The test matrix given in Table 1 was decided upon during the execution of the test series.
Instead of planning the configurations of exposed surfaces, gypsum board protection and
the number of protective layers before the execution of all tests, it was chosen to only
plan the configuration of Test 1 and let the project steering group decide on the
configuration of each subsequent test based on the test results. This approach was chosen
aiming to find limits of surface areas of exposed mass timber and corresponding
requirements for gypsum board protection (amount and location) iteratively. To support
this procedure, the project steering group defined pass criteria to reach a common
agreement of the desired outcome of the fire tests needed to justify fire safe changes of
current code prescribed limits. These criteria are a quantifiable adaption of the criterion
(where a compartment fire should continue to decay at 4 hours following fire initiation)
used by the International Code Council Ad Hoc Committee on Tall Wood Building (ICC-
TWB) to develop code change proposals for the International Building Code 2021 (IBC

19
2021), which were accepted in 2019. The criterion was used for the assessment of the
results by Zelinka et al. (2018) and a comparable criterion is being used in the required
CLT compartment fire test of Annex B in the ANSI/APA PRG 320 (2018), where
temperatures should be equal to or below 510˚C after 4 hours of compartment fire
testing.
The following quantifiable adaptation of the ICC pass criterion was developed by the
project Steering Group at the outset and was included in the test plan:
- At 4 hours after ignition the plate thermometer temperatures should
be below 300 °C. The corresponding incident radiant heat flux is roughly4
6 kW/m2, which has previously been identified as one of the extinction criteria
of smoldering in timber (Crielaard, 2019). Achieving a complete stop of all
smoldering is, however, not an aim of this study. Instead, this study aims at
assessing techniques for fire fighters of locating and extinguishing smoldering
that is left after the fire through case studies, which will be included in the final
project report.
- No secondary flashover (identified by absence of flashover criteria as
specified in UL 1715, ASTM E2257, and ISO 9705) should occur between 3
hours and 4 hours after ignition. Flashover shall be considered to have
occurred when any two of the following conditions have been attained:
a. Heat release rate exceeds 0.12 MW/m2 of floor area, which is determined
from the mass loss rate)
b. Average upper layer temperature exceeds 600°C.
c. Flames exit one of the openings.
Exception:
In case the criteria above are locally not fulfilled caused by a detailing issue, that could
be solved with a change of details, the results will be considered satisfactory (i.e. pass).
In that case recommendations for further study of the fire performance of this detail will
be made.
4 Summary of test results This chapter gives an overview of the results of plate thermometer temperatures, char
depth and heat release data. In addition, important observations regarding details are
summarized. A full overview of all results will be provided in the final project report.
4.1 Events
Significant events that occurred during the tests are listed in Table 3 together with the
corresponding time after ignition. The highly variable time to flashover is expected to be
to some extent caused by the relatively high variability of the time it took for the ignited
bin, to ignite the sofa cushions.
4 The incident heat flux of roughly 6 kW/m2 is based on the assumption that the gas temperature is equal or lower than the plate thermometer temperature, which is generally the case in a decaying fire.
20
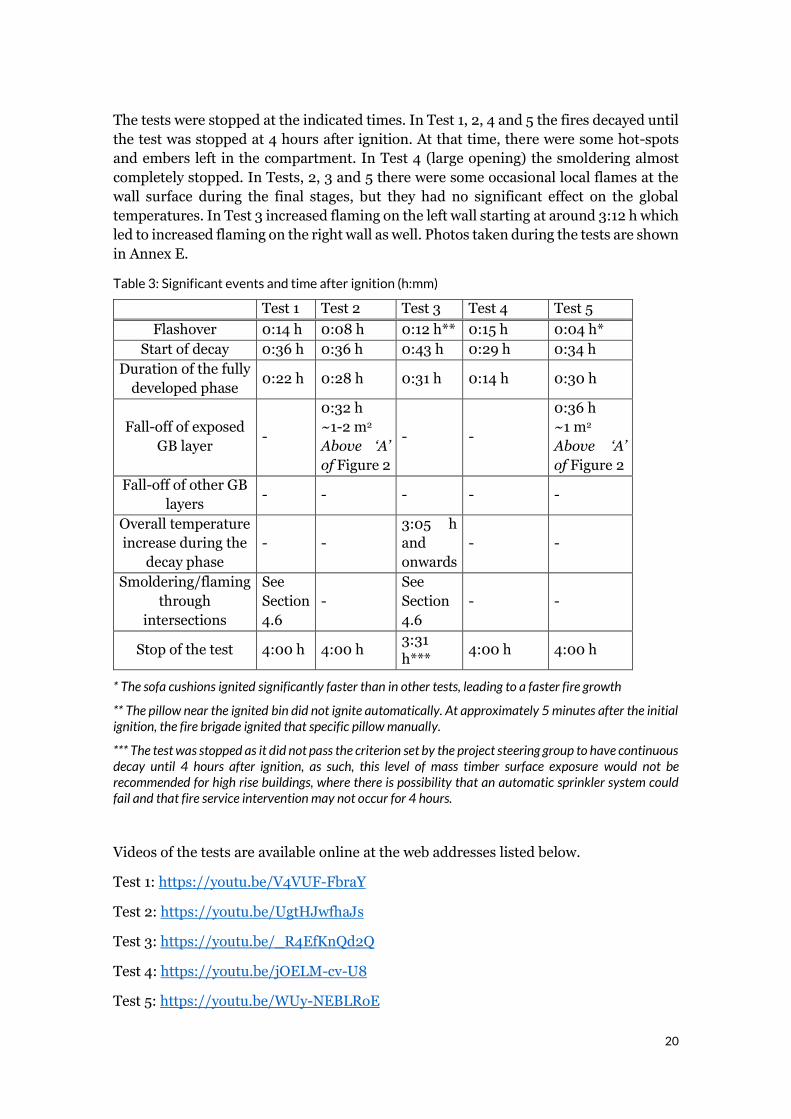
The tests were stopped at the indicated times. In Test 1, 2, 4 and 5 the fires decayed until
the test was stopped at 4 hours after ignition. At that time, there were some hot-spots
and embers left in the compartment. In Test 4 (large opening) the smoldering almost
completely stopped. In Tests, 2, 3 and 5 there were some occasional local flames at the
wall surface during the final stages, but they had no significant effect on the global
temperatures. In Test 3 increased flaming on the left wall starting at around 3:12 h which
led to increased flaming on the right wall as well. Photos taken during the tests are shown
in Annex E.
Table 3: Significant events and time after ignition (h:mm)
Test 1 Test 2 Test 3 Test 4 Test 5
Flashover 0:14 h 0:08 h 0:12 h** 0:15 h 0:04 h*
Start of decay 0:36 h 0:36 h 0:43 h 0:29 h 0:34 h
Duration of the fully
developed phase 0:22 h 0:28 h 0:31 h 0:14 h 0:30 h
Fall-off of exposed
GB layer -
0:32 h
~1-2 m2
Above ‘A’
of Figure 2
- -
0:36 h
~1 m2
Above ‘A’
of Figure 2
Fall-off of other GB
layers - - - - -
Overall temperature
increase during the
decay phase
- -
3:05 h
and
onwards
- -
Smoldering/flaming
through
intersections
See
Section
4.6
-
See
Section
4.6
- -
Stop of the test 4:00 h 4:00 h 3:31
h*** 4:00 h 4:00 h
* The sofa cushions ignited significantly faster than in other tests, leading to a faster fire growth
** The pillow near the ignited bin did not ignite automatically. At approximately 5 minutes after the initial ignition, the fire brigade ignited that specific pillow manually.
*** The test was stopped as it did not pass the criterion set by the project steering group to have continuous decay until 4 hours after ignition, as such, this level of mass timber surface exposure would not be recommended for high rise buildings, where there is possibility that an automatic sprinkler system could fail and that fire service intervention may not occur for 4 hours.
Videos of the tests are available online at the web addresses listed below.
Test 1: https://youtu.be/V4VUF-FbraY
Test 2: https://youtu.be/UgtHJwfhaJs
Test 3: https://youtu.be/_R4EfKnQd2Q
Test 4: https://youtu.be/jOELM-cv-U8
Test 5: https://youtu.be/WUy-NEBLRoE

21
More videos will be made available through the RISE Fire Research YouTube account
within weeks after publication of this report, at:
https://www.youtube.com/channel/UCi7ee3Rvuc1mZw-GsFjROgQ/videos
4.2 Interior plate thermometers
Measurements using plate thermometers inside the compartment, installed at a distance
of 2.8 inch (10 cm) from wall or ceiling surfaces, facing away from the surface, are shown
in this chapter together with the temperature criterion discussed in Chapter 3. Figure 7
to Figure 11 show the plate temperatures for Test 1 to 5, respectively. The plate
thermometers were located as indicated in Figure 6. The front plate thermometer in the
ceiling malfunctioned repeatedly and is, therefore, not visible in most of these figures.
Figure 7: Internal plate thermometer measurements of Test 1
0
200
400
600
800
1000
1200
0 60 120 180 240
Tem
pera
ture
(°C
)
Time (min)
Internal plate thermometers Test 1
Back wall, Low -0.7m from floor
Back wall, High -2.0m from floor
Left wall, High -2.0m from floor
Ceiling, Front
Left wall, Low -0.7m from floor
Ceiling, Back
Right wall,Center - 1.35mfrom floor
Tem
per
ature
crit
erio
n @
4h

22
Figure 8: Internal plate thermometer measurements of Test 2
Figure 9: Internal plate thermometer measurements of Test 3
0
200
400
600
800
1000
1200
0 60 120 180 240
Tem
pera
ture
(°C
)
Time (min)
Internal plate thermometers Test 2
Right wall,Center - 1.35mfrom floor
Back wall, High -2.0m from floor
Left wall, Low -0.7m from floor
Ceiling, Back
Left wall, High -2.0m from floor
Back wall, Low -0.7m from floor
Tem
per
ature
crit
erio
n @
4h
0
200
400
600
800
1000
1200
0 60 120 180 240
Tem
pera
ture
(°C
)
Time (min)
Internal plate thermometers Test 3
Back wall, Low -0.7m from floor
Back wall, High -2.0m from floor
Left wall, High -2.0m from floor
Left wall, Low -0.7m from floor
Ceiling, Back
Right wall,Center - 1.35mfrom floor
Tem
per
ature
crit
erio
n @
4h
Stop of test
X

23
Figure 10: Internal plate thermometer measurements of Test 4
Figure 11: Internal plate thermometer measurements of Test 5
0
200
400
600
800
1000
1200
0 60 120 180 240
Tem
pera
ture
(°C
)
Time (min)
Internal plate thermometers Test 4
Back wall,Low - 0.7mfrom floor
Back wall,High - 2.0mfrom floor
Left wall,High- 2.0mfrom floor
Left wall, Low- 0.7m fromfloor
Ceiling, Back
Tem
per
ature
crit
erio
n @
4h
0
200
400
600
800
1000
1200
0 60 120 180 240
Tem
pera
ture
(°C
)
Time (min)
Internal plate thermometers Test 5
Right wall,High
Right wall,High-front
Left wall, Low-front
Left wall, High
Back wall, High
Right wall,Low-front
Right wall,Low-back
Tem
per
ature
crit
erio
n @
4h

24
Figure 12 shows temperatures of the plate thermometers on the left wall 6.6ft (2.0m)
from the floor of every test for comparative purposes. To improve the clarity of the figure
for comparisons, the curves were time adjusted so that the moment of flashover is at 10
minutes on the x-axis.
Figure 12: Left wall plate thermometer measurements at 2.0 meters (6.6ft) from the floor of all tests. The red dashed line indicates the 300 °C criterion at 4 hours.
0
200
400
600
800
1000
1200
0 60 120 180 240
Tem
pera
ture
(°C
)
Time from 10-min-to-flashover (min)
Left wall plate thermometer - All tests
Test 1 -Left wall,High
Test 2 -Left wall,High
Test 3 -Left wall,High
Test 4 -Left wall,High
Test 5 -Left wall,High

25
4.3 Gypsum board protection
Temperatures were measured behind every layer of gypsum boards at different locations.
The temperatures will be given in the final project report. In this report only an
assessment of the involvement of protected CLT in the compartment fires is made. That
assessment is made by temperatures measured at the interface between the CLT surface
and the base layer of gypsum board protection. In Tests 2, 3, 4 and 5, all measured
temperatures at the protected CLT or glulam surfaces were lower than 200˚C for the
whole test duration, indicating no material decomposition and, therefore, no
contribution to the heat release in the locations where temperatures were measured. In
Test 1 the protected CLT or glulam surface temperatures were measured in seven
locations of which one location had temperatures above 300˚C (but below 350˚C),
indicating local charring at this location (Buchanan and Abu, 2017). In three other
locations the temperatures exceeded 200˚C (but not 250˚C), indicating some local and
minor material decomposition and contribution to the fuel load at the CLT surface.
Figure 13 and Figure 14 show photos of CLT surfaces after removal of the gypsum after
Test 1 (2 gypsum board layers). Local charring was seen, especially in locations near the
intersection of walls and the exposed ceiling and in some lap joints between two wall
panels. Figure 15 shows the top of the back wall after removal of the ceiling. The right
picture shows the location of the most significant charring that took place in a lap joint.
As indicated before in Figure 5, there was no fire sealant applied at the interface between
the gypsum boards and the ceiling of Test 1. In all other tests a fire sealant adhesive was
used in this location only at locations were a gap was visible between the outer boards
and the ceiling. The location of the local maximum char depths on gypsum protected
surface after Test 1 was determined and indicated in the char diagram of Section 4.5.
Figure 16 and Figure 17 show the CLT surface after removal of the gypsum boards for
Test 2 to 5. It should be noted that the gypsum boards in Test 2 and 3 were removed by
the local fire brigade with water mist, which left stains and some damage of wood grains.
Water mist was used to identify alternative techniques to extinguish potential
smoldering behind the gypsum boards using less water than conventional methods.
Figure 13: Test 1, Back wall (left) and right wall (right) after removal of the 2 gypsum board layers.

26
Figure 14: Test 1, Front wall (left) and left wall (right) after removal of the 2 gypsum board layers.
Figure 15: Test 1, Top of back wall after removal of ceiling.

27
Figure 16: Protected walls of Test 2 (left) and Test 3 (right) of left wall after removal of the 3 gypsum board layers.
Figure 17: Protected walls of Test 4 (left, 2 GB layers) and Test 5 (right, 3 GB layers) after removal of gypsum boards.
4.4 Heat release rates
Heat release rates were determined from load cell measurements of the floor and the
structure separately. The method used is summarized in Annex D and includes
corrections for the mass loss of the lightweight concrete floor structure (by drying out),
the façade extension, and the gypsum boards. The movement of firefighters in the
compartment at the beginning of the fire and in some instances at other times during the
fire was identified using video recordings and the mass change caused by that was
disregarded for the calculation of the heat release rates.
Heat release rates of all tests are shown in Figure 17. It should be noted that the first 9
minutes of Test 5 were lost due to a technical issue with the load cells. To increase the
clarity of the figure, the heat release rate curves were time adjusted so that the moment
of flashover is at 10 minutes on the x-axis. Additionally, after the peak heat release rate
is reached, a moving average (of 5 datapoints) is plotted, which increased the visibility of
the curves that are drawn behind other curves.

28
Figure 18: Heat release rates of all tests and the heat release rate flashover criterion of Chapter 3
4.5 Char depths
CLT char depths were measured after the test using a resistograph which is able to drill
through the specimen while plotting the drill depth versus the torque resistance. The
uncharred depth is identified as the depth at which the resistance drops significantly, as
done previously by Brandon and Dagenais (2018) and Su et al. (2018b).
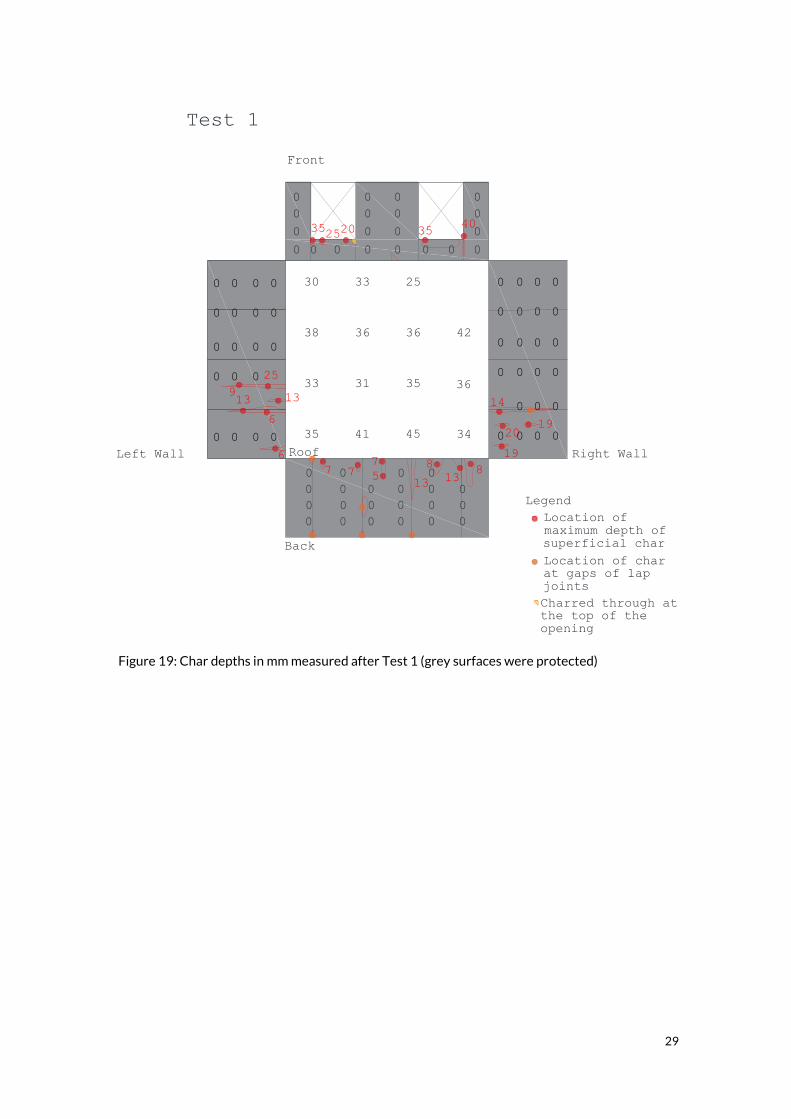
Figure 19 to Figure 23 show the depth of the char at the interior CLT surfaces of Test 1 to
5, respectively. The gypsum board protected surfaces are grey colored. After Test 1, the
majority of the protected timber surface area was uncharred, but there were some
locations with localized charring along CLT lap joints and gypsum board joints. There
was no indication of any flaming as a result of this localized charring. Efforts were made
to determine the deepest char depths at those locations as indicated in Figure 19. The
protected surfaces of Tests 2 to 5 were mostly undamaged. Pictures of protected surfaces
after removal of the gypsum boards, are shown in Section 4.3.
0
10
20
30
40
50
60
0 60 120 180 240
Heat
rele
ase
rate
(M
W)
Time from 10 min to flashover (min)
Heat release rates - All tests
Test 1 Test 2 Test 3 Test 4 Test 5
Flashover criterion @ 3 to 4h
29
Figure 19: Char depths in mm measured after Test 1 (grey surfaces were protected)

30
* Indicates locations with an increased uncertainty of the char depth measurement
Figure 20: Char depths in mm measured after Test 2 (grey surfaces were protected)
Figure 21: Char depths in mm measured after Test 3 (grey surfaces were protected)

31
Figure 22: Char depths in mm measured after Test 4 (grey surfaces were protected)
Figure 23: Char depths in mm measured after Test 5 (grey surfaces were protected)
The char depth during fire resistance tests (ASTM E119 and ISO 834) is generally used
to calculate structural fire resistance of a load bearing assembly. Design standards, such

32
as NDS (2018), use calculations of char depths to determine the load bearing capacity of
mass timber elements to meet the fire resistance requirements.
These compartment tests are conducted to evaluate the safe limits of exposed mass
timber surface areas, subject to a real fire. The time duration of 4 hours was chosen to
assure that there is no reignition of mass timber elements after the real fire has decayed.
The comparisons of char depths corresponding to a 4-hour real fire exposure to that of a
2-hour fire resistance test is not directly related to any U.S. code requirements.
Nevertheless, this report provides a comparison for academic use. Please use caution in
using the comparison for any regulatory requirements.
It should be noted that the NDS (2018) not only requires subtracting a char layer from
the cross-section to calculate the load bearing capacity during fires, but also an additional
20% of the char layer thickness to account for damaged but uncharred wood. An
appropriate size of this damaged layer to determine the structural capacity of a member
exposed to fire, is dependent on the fire exposure which, in most cases, differs between
standard fire tests and real fires. However, for a wide range of non-standard fire
exposures, Lange et al. (2015) found that this layer was up to 16mm thick, which
corresponds with the calculations of NDS (2018) for 2-hour fire resistance ratings.
Therefore, the comparison of calculated char depth according to NDS and measured char
depths is considered informative.
The CLT ceiling was exposed in all tests. Figure 24 shows box plots of the char depths
measured after each test. It should be noted that Test 3 was stopped about 30 minutes
earlier than all other tests5, which means that the values would have been higher if the
test lasted 4 hours instead. Test 4, which has a larger opening factor, had the lowest char
depth. The char depths in the other compartments seem to show some correlation with
the surface area of exposed timber. This agrees with predictions that were sent out to the
project steering group and stake holders before the tests were performed. The
predictions and the corresponding calculation model will be discussed in a separate
report. It can be noted that all char depths measured in the ceiling after the fire were
lower than the char depth for a 2 hour fire resistance rating, according to NDS (2018).
From the measurements it can be concluded that the char depths were lowest in the
ceiling and at the top of walls and gradually increased towards the bottom of walls.
Figure 25 shows the average char depth at different heights within the compartment. For
comparison, the char depth according to NDS (2018) is indicated. It can be seen that the
char depths are lower than the char depth for 2 hour fire resistance by NDS (2018), with
the exception of the bottom of walls in Test 34.
5 Test 3 was stopped at 3:30h as it did not pass the criterion set by the project steering group to have continuous decay until 4 hours after ignition, as such, this level of mass timber surface exposure would not be recommended for high rise buildings, where there is possibility that an automatic sprinkler system could fail and that fire service intervention may not occur for 4 hours.

33
Figure 24: Box plots of char depths in the CLT surface of the ceiling
Figure 25: Average char depths in the walls and ceiling at different heights measured from the floor
0
10
20
30
40
50
60
70
80
90
100
110
Test 1 Test 2 Test 3 Test 4 Test 5
Ch
ar d
epth
(m
m)
Char depths ceiling - All tests
1
2
3
4
5
6
7
8
9
0 25 50 75 100 125 150 175
He
igh
t fr
om
flo
or
(ft)
Average char depth after test (mm)
Test 1 Test 2Test 4 Test 5Test 3 NDS char depth (2h)
Ceiling
Full panel thickness

34
In corners between two exposed timber members (CLT or glulam), the char depths were
highest. Figure 26, shows box plots of the maximum measured char depth in corners of
two exposed mass timber members and corners of one protected and one exposed
member. As Test 4 had a different compartment design, its data is not included in the
figure. The figure indicates a significantly higher char depth at the bottom of corners of
two exposed members, indicating a significant influence of exchange of radiative heat
between both combusting walls in the corner. At these locations the char depth exceeds
the char depth of NDS (2018) for a fire rating of 2 hours. As Test 3 had a number of such
corners, this significantly influenced the overall char depth. In corners where only one
member was exposed, the measured char depth was significantly lower and only outliers
(indicated by the whisker of the box plot) exceeded the char depth of NDS (2018).
In Test 4 a more significant difference was observed, as the maximum char depth at
corners between two exposed walls was nearly twice as high as the maximum char depth
in other wall corners.
Figure 26: Box plots of measured char depths at the bottom of corners between walls (generally the most damaged location)
4.6 Intersections
With 2 exceptions no flaming occurred on the exterior side of the compartment. At (1) an
intersection between the glued laminated timber beam and the back wall of Test 1, and
(2) an intersection between the left wall and the ceiling at the front of the wall of Test 3,
there was some flaming on the exterior side. Table 4 shows an overview of
smoldering/flame spread through intersections of mass timber members.
0
10
20
30
40
50
60
70
80
90
100
110
corner with 1 protected wall corner with 2 exposed mass timbersurfaces
Ch
ar d
epth
(m
m)
Char depths in the bottom of corners between walls Test 2, 3, 5

35
Table 4: observed flames through joints or details
Location Description Images
Test
1
Beam-wall
joint at
back wall
Minor flaming at one of the top
corners of the beam at the location
where the beam penetrated the back
wall.
Note: the rectangular hole in the
CLT was made on site using a hand-
held reciprocating (tiger) saw. The
geometrical imperfections are not
representative for factory made
cuts.
Some fire sealing adhesive, but no
construction tape or expanding tape
was used at this detail.
Test
2
None - -
Test
3
Wall-
ceiling
joint at the
front side
of the left
wall
Smoke exited the intersection at the
top of the left wall on the front side
directly after flashover, indicating
the intersection was not sealed at
this location. The smoke
development took place at the
location where several thermocouple
wires were running (Note: these
were moved before the photo was
taken). To avoid loss of data, the
stone wool was placed over the
intersection (under the wires) to
protect the wires. In extreme cases,
small amounts of water on the
external surface were used to
minimize the exposure to the
thermocouple wires.
(Detail shown in Figure 4)
Test
4
None - -
Test
5
None - -
As mentioned in 2.1, the sealing materials used in the different tests varied. Table 5 gives
an overview of these sealant materials (as also indicated before in Figure 4 of Section
2.2). Hereby, green shaded cells of the table indicate that connection details withstood
the specific test without any occurrence of spread of smoldering or spread of flaming
through the intersection. The orange shaded cell indicates local spread in one location,
which was likely a result of compromised air tightness because of slight level differences
between the top of connected wall members. Some of these locations were identified

36
before the start of Test 3 (Figure 27) and fire sealing adhesive was applied to close the
void under and above the resilient profile in those locations only. During the test,
however, smoke left the intersection at the top of the left wall at an early stage in the fire,
indicating lack of air tightness at that location.
Figure 28 and Figure 29 show the top of the wall in Test 3. The photo of Figure 28 is
taken at a lap joint where the top faces of the wall panels were on the same level and
showed no damage near the exterior side of the joint. Figure 30 and Figure 31 show
typical photos of walls with the alternative wall-ceiling joints that were tested in other
tests. No damage was observed near the exterior side of the joint.
Table 5: Sealing materials at intersections between CLT members (green indicates fire spread to the external surface; orange indicates spread of flames to the external surface in one location)
Ceiling-ceiling
spline board joint
(see Figure 4 A)
Wall-ceiling joint
(see Figure 4 B)
Wall-wall lap joint
(see Figure 4 C)
Wall-wall corner
butt-joint
(see Figure 4 D)
Test 1 2x Construction
tape
Construction tape Construction tape Construction tape*
Test 2 2x Expanding tape
close together
Construction tape
& Resilient profile
2x Expanding tape 2x Expanding
tape*
Test 3 2x Expanding tape
apart
Resilient profile Construction tape Construction
sealant
Test 4 Construction tape
under spline board
Construction tape
& Resilient profile
Construction tape Construction tape
Test 5 Construction tape
under spline board
Construction tape
& Resilient profile
Construction tape Construction tape*
* All wall-wall corner joints in Test 1, 2 and 5 had at least one gypsum protected surface which reduced the challenge of sealing the connection
Figure 27: Location of imperfect detail at wall-ceiling joint with a resilient profile identified before the test

37
Figure 28: Top of the wall lap joint after removal of the ceiling. Typical location without flame spread. Sealing method: resilient profile only (Test 3).
Figure 29: Top of the wall after removal of the ceiling and the resilient profile. Location of flame spread through intersection (front side of left wall) - Sealing method: resilient profile only (Test 3).
Figure 30: Top of the wall after removal of the ceiling. Typical location. Sealing method: construction tape only (Test 1).
Figure 31: Top of the wall after removal of the ceiling. Typical location. Sealing method: construction tape and resilient profile (Test 2).
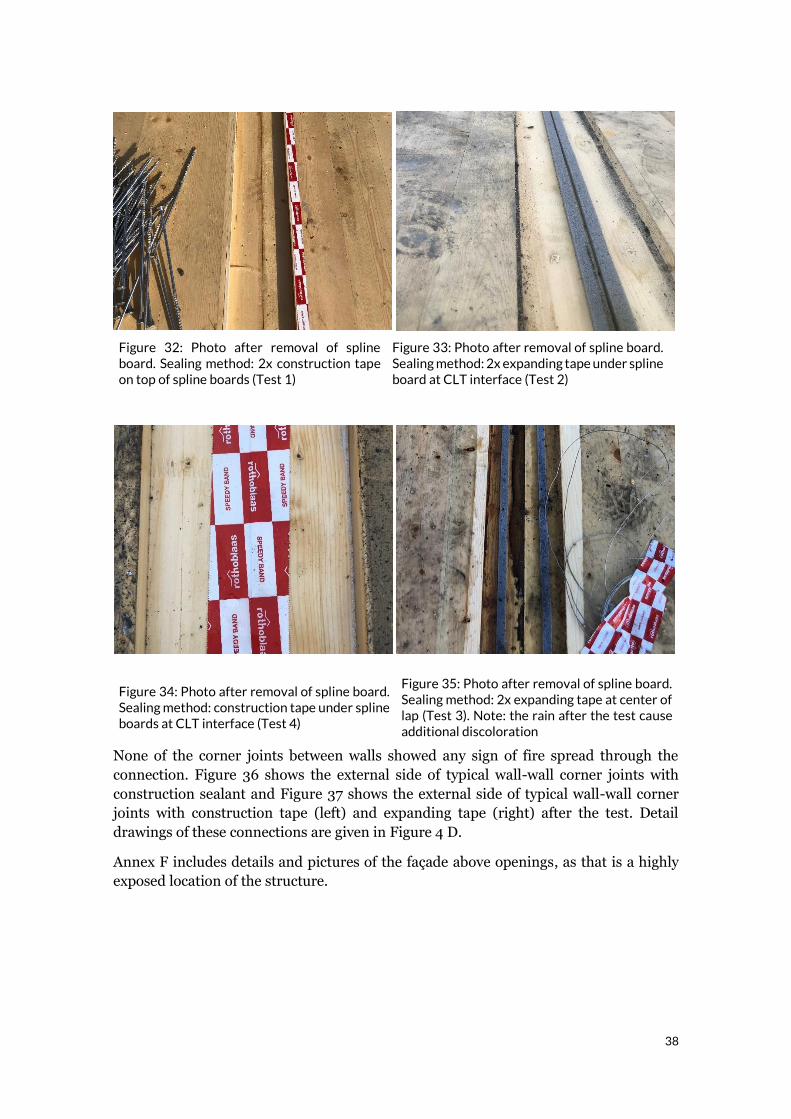
Figure 32 to Figure 35 show the ceiling-ceiling spline board connection alternatives after
the test. At most some discoloration of the CLT surface under the spline board was seen
at some locations after Test 1 and Test 3. In the other tests, there was no sign of damage
on the surface under the spline board.
38
Figure 32: Photo after removal of spline board. Sealing method: 2x construction tape on top of spline boards (Test 1)
Figure 33: Photo after removal of spline board. Sealing method: 2x expanding tape under spline board at CLT interface (Test 2)
Figure 34: Photo after removal of spline board. Sealing method: construction tape under spline boards at CLT interface (Test 4)
Figure 35: Photo after removal of spline board. Sealing method: 2x expanding tape at center of lap (Test 3). Note: the rain after the test cause additional discoloration
None of the corner joints between walls showed any sign of fire spread through the
connection. Figure 36 shows the external side of typical wall-wall corner joints with
construction sealant and Figure 37 shows the external side of typical wall-wall corner
joints with construction tape (left) and expanding tape (right) after the test. Detail
drawings of these connections are given in Figure 4 D.
Annex F includes details and pictures of the façade above openings, as that is a highly
exposed location of the structure.

39
Figure 36: Typical wall-wall butt joint with construction sealing after the test.
Figure 37: Typical wall-wall butt joint with construction tape (left) and expanding tape (right) after the test.

40
4.7 Discussion
The data and analysis in Section 4.5 showed that the char depths at the end of the tests
were higher in the bottom of corners with two exposed walls intercepting. It is expected
that this is caused by a radiative feedback loop in the lower part of the corner located in
a relatively oxygen rich environment (further analysis using oxygen measurements will
be included in the final project report). The photo of Figure 38 shows such a corner at a
late stage of decay of Test 4. At the time of this photo, smoldering combustion in most
other surfaces started to extinguish as concluded using an infrared camera. However, the
bottom corner was visibly smoldering more severely than other surfaces.
Figure 38: Photo at the final stage of Test 4
Tests 3, and 5 had approximately the same surface area of exposed wood and Test 2 had
roughly 5 % less surface area of exposed wood, as is summarized in Table 6. Between the
tests only one test parameter has changed, which is the location of the gypsum board
protection. As indicated in Table 6 the gypsum boards of Test 2 and Test 5 were
positioned in a way that one wall surface at each corner intersection between walls was

41
protected, which was not the case for Test 3. The plate thermometer temperatures
compiled in Figure 12 indicate that, despite the similar surface areas of exposed wood,
the thermal radiation on the left wall in Test 3 was significantly higher for most of the
decay phase compared to that of Test 2 and 5. An indication that radiative feedback
played a role is the increased char depth in the bottom of those corners by roughly 40 %
or 0.8 inch (30 mm) in Test 3, despite the fact that Test 3 was 30 minutes shorter than
Test 5.
As indicated in Table 6, Test 3 did not pass the criteria defined in Chapter 3, while Test
5 (and all other tests) did fulfil these criteria. As there was only one test variable between
Test 3 and Test 5 and because there are indications that radiative feedback between two
exposed walls at the bottom of a corner is significant, the data indicates that the contrast
between the outcome of (a) Test 3 and (b) Test 2 or 5 is a result of the presence of wall
corners with two exposed CLT surfaces.
Table 6: Overview of tests with an opening factor of 0.062 m1/2
Test
Opening
factor
m1/2
Protection
(interior).
Number of 5/8
inch thick (15.9
mm) type X
gypsum boards
Surface area of
timber exposed
Presence of
corner
intersection
between
exposed
walls
Pass
criteria
at 4 h
m2 ft2 %*
Test 1 0.062 2GB 53.8 579 44.2 No Fulfilled
Test 2 0.062 3GB 91.2 981 75.0 No Fulfilled
Test 3 0.062 3GB 96.2 1035 79.2 Yes Not
fulfilled
Test 5 0.062 3GB 97.2 1046 80.0 No Fulfilled
* Percentage of all surface areas except the floor
Test 4 fulfilled the criteria defined in Chapter 3, despite the presence of corners between
two exposed walls. It can, however, be stated that the char damage to the mass timber
structure becomes less with increasing opening factor (Su et al 2018a, Su et al 2018b,
Brandon and Anderson, 2018). Thus, the large openings of Test 4, representing a
building with mercantile occupancy (Annex B), lost significantly more heat through
openings (by radiation and convection) and that despite the significantly larger HRR
during flashover, the fire rapidly decayed to just a small number of very local hot-spots.
Table 7: Information of Test 4 with an opening factor of 0.25 m1/2
Test
Opening
factor
m1/2
Protection
(interior)
Surface area of
timber
exposed
Presence of corner
intersection
between exposed
walls
Pass
criteria
at 4h
m2 ft2 %*
Test 4 0.25 2GB type X
15.9 mm
77.9 838 80.2 Yes Fulfilled
* Percentage of all surface areas except the floor

42
5 Main conclusions Five compartment fire tests were performed, that were designed to represent statistically
severe and realistic fire scenarios. The tests were performed outside and, therefore, there
were no laboratory restrictions regarding the heat release rates of the fires and the
surface area of mass timber that could be exposed.
The conclusions of this study are only applicable for mass timber materials that have
been demonstrated to withstand long duration compartment fires without the
occurrence of delamination, such as required by ANSI/APA PRG 320 (2018).
The fire scenarios tested in this study correspond to the improbable event that (NFPA 13
compliant) sprinklers are not functioning, and fire service interference is not successful
for the first 4 hours. Under those conditions a statistically severe fire scenario (with a
statistically high fuel load density and low opening factor) is tested, aiming to make the
conclusions more generally applicable, while limits of exposing mass timber have been
investigated. More information of the statistical analysis can be found in Annex B.
From the compartments tested against the selected severe fire scenario, it can be
concluded that:
(A) A flashover fire in a compartment with
(1) 100 % exposed (PRG 320, 2018 compliant) CLT ceiling
(2) 100 % exposed glulam beam under the ceiling
(3) two layers of 5/8 inch thick Type X gypsum board protection on all other mass
timber surfaces,
decayed continuously until 4 hours after ignition and reached radiation temperatures
that were significantly below 300˚C.
(B) Flashover fires in compartments with
(1) 100 % exposed (PRG 320, 2018 compliant) CLT ceiling
(2) 100 % exposed beam under the ceiling
(3) additional exposed surface areas of column and walls equal to 78 % or 90 % of
the floor area
(4) 3 layers of 5/8 inch thick Type X gypsum board protection on all other mass
timber surfaces,
decayed continuously until 4 hours after ignition and reached radiation temperatures
that were significantly below 300˚C. A third test with similar surface areas of exposed
mass timber walls indicate that the exposed CLT wall surfaces should not intersect in a
corner in order to achieve a continuous decay phase for more than 3 hours after ignition.
(C) A post flashover fire in a similar compartment with a larger opening factor, which
corresponds to the range of opening factors of office buildings, decayed relatively quickly
and reached ambient temperature within 4 hours.
(D) In all tested compartments with walls and the ceiling surfaces exposed, the char
depth in the ceiling and the top part of the wall was lower than the char depth at the
bottom part of walls.

43
The work upon which this publication is based was funded in whole or in part through
a Wood Innovation grant by the Southern Region, State & Private Forestry, Forest
Service, U.S. Department of Agriculture.
In accordance with Federal law and U.S. Department of Agriculture policy, this
institution is prohibited from discriminating on the basis of race, color, national origin,
sex, age, or disability. To file a complaint of discrimination, write USDA Director, Office
of Civil Rights, Room 326-W, Whitten Building, 1400 Independence Avenue, SW,
Washington, DC 20250-9410 or call (202) 720-5964 (voice and TDD). USDA is an equal
opportunity employer.

44
References APA—The Engineered Wood Association. (2017). ANSI A190.1-2017: Standard for Wood
Products-Structural Glued Laminated Timber.
APA—The Engineered Wood Association. (2018). ANSI/APA PRG 320: 2018: Standard
for performance-rated cross-laminated timber. American National Standard. Tacoma,
WA: APA-The Engineered Wood Association, 246.
ANSI (2018) National Design Specification (NDS) for Wood Construction.
Brandon D, Just A, Andersson P, Östman B (2018) Mitigation of fire spread in multi-
storey timber buildings – statistical analysis and guidelines for design. RISE Report
2018:43.
Brandon, D. (2018). Fire Safety Challenges of Tall Wood Buildings–Phase 2: Task 4-
Engineering methods. National Fire Protection Association. NFPA report: FPRF-2018-
04.
Brandon, D., & Anderson, J. (2018). Wind effect on internal and external compartment
fire exposure. RISE Report 2018:72. Research Institutes of Sweden.
Brandon, D., & Dagenais, C. (2018). Fire Safety Challenges of Tall Wood Buildings–
Phase 2: Task 5–Experimental Study of Delamination of Cross Laminated Timber (CLT)
in Fire. National Fire Protection Association. NFPA report: FPRF-2018-05.
Breneman, S., Timmers, M., & Richardson, D. (2019). Tall Wood Buildings in the 2021
IBC. Up to 18 Stories of Mass Timber. Wood Products Council.
Buchanan, A. H., & Abu, A. K. (2017). Structural design for fire safety. John Wiley & Sons.
Bwayla A.C., Lougheed G.D., Kashef A., Saber H.H. (2010) Survey results of combustible
contents and floor areas in Canadian multi-family dwellings. Fire Technology, 46-1, pp.
1-20.
Crielaard, R., van de Kuilen, J. W., Terwel, K., Ravenshorst, G., & Steenbakkers, P.
(2019). Self-extinguishment of cross-laminated timber. Fire Safety Journal, 105, 244-
260.
Emberley R., Gorska Putynska C., Bolanos A., Lucherini A., Solarte A. , Soriguer D.,
Gutierrez Gonzalez M., Humphreys K., Hidalgo JP., Maluk C., Law A., and Torero JL.
(2017) Description of Small and Large-Scale CLT Fire Tests, Fire Safety Journal,
doi:10.1016/j.firesaf.2017.03.024
Frangi, A., & Fontana, M. (2005). Fire Performance of Timber Structures under Natural
Fire Conditions. Fire Safety Science Symposium 8: 279-290. IAFSS, Beijing, China.
Hadden RM., Bartlett AI., Hidalgo JP., Santamaria S., Wiesner F., Bisby LA., Deeny S.,
Lane B. (2017) Effects of exposed cross laminated timber on compartment fire dynamics.
Fire Safety Journal (91): 480-489.
Hox K. (2015) Branntest av massivtre. SPFR-rapport SPFR A15101. SP Fire Research,
Trondheim, Norway (unpublished). (in Norwegian)

45
Janssens, M. (2017). Development of a Fire Performance Test Method for Evaluating
CLT Adhesives. Southwest Research Institute.
Lange, D., Boström, L., Schmid, J., & Albrektsson, J. (2015). The reduced cross section
method applied to glulam timber exposed to non-standard fire curves. Fire technology,
51(6), 1311-1340.
McGregor, C.J. (2013) Contribution of cross-laminated timber panels to room fires.
Master thesis. Department of Civil and Environmental Engineering Carleton University.
Ottawa-Carleton Institute of Civil and Environmental Engineering, Ottawa, Ontario,
Canada.
Medina Hevia A.R. (2014). Fire resistance of partially protected cross-laminated timber
rooms. Master thesis. Department of Civil and Environmental Engineering Carleton
University. Ottawa-Carleton Institute of Civil and Environmental Engineering, Ottawa,
Ontario, Canada.
Su J.Z. and Lougheed G.D. (2014) Report to research consortium for wood and wood
hybrid mid-rise buildings – Fire safety summary – Fire research conducted for the
project on mid-rise wood construction. National Research Council Canada, Client report:
A1-004377.1, Ottawa, Ontario, Canada
Su, J., Lafrance, P. S., Hoehler, M. S., & Bundy, M. F. (2018a). Fire Safety Challenges of
Tall Wood Buildings–Phase 2: Task 3-Cross Laminated Timber Compartment Fire Tests
(No. Fire Protection Research Foundation).
Su, J., Leroux, P., Lafrance, P. S., Berzins, R., Gratton, K., Gibbs, E., & Weinfurter, M.
(2018b). Fire testing of rooms with exposed wood surfaces in encapsulated mass timber
construction. National Research Council of Canada, Ottawa.
Zelinka, S. L., Hasburgh, L. E., Bourne, K. J., Tucholski, D. R., Ouellette, J. P., Kochkin,
V., & Lebow, S. T. (2018). Compartment fire testing of a two-story mass timber building.
United States Department of Agriculture, Forest Service, Forest Products Laboratory.

46
Annex A - Façade drawings This Annex includes drawings of the facades with openings. All tests, including Test 4
had a symmetrical structure. Therefore, only one of the side facades of Test 4 is included.
Figure A. 1: Front view of the compartments of Test 1, 2, 3 and 5
500mm [1.6ft]
3025mm [9.9ft]
175mm [0.6ft]
Rough
opening
Rough
opening
Facade panel
Floor level 2200mm [7.2ft]
2310mm [7.6ft]
7350mm [24.1ft]
2850mm [9.4ft]
150mm [0.5ft]
2700mm [8.9ft]
2310mm [7.6ft]

47
Figure A. 2: Front view of the compartment of Test 4
Figure A. 3: Side view of the compartment of Test 4
500mm [1.6ft]
Rough
opening
Rough
opening
2500mm [8.2ft]
Floor level
2850mm [9.4ft]
150mm [0.5ft]
2700mm [8.9ft]
2500mm [8.2ft]
7350mm [24.1ft]
3025mm [9.9ft]
175mm [0.6ft]
1000mm [3.3ft]
2200mm [7.2ft]
Rough
opening
Rough
opening
Floor level
2850mm [9.4ft]
150mm [0.5ft]
2700mm [8.9ft]
2550mm [8.4ft]
7350mm [24.1ft]
3025mm [9.9ft]
175mm [0.6ft]
2550mm [8.4ft]
900mm [3.0ft]
500mm [1.6ft]

48
Annex B - Probabilistic study of
compartments and fire scenarios To ensure relevance of the compartment to real scenarios, a statistical approach has been
utilized in the design of the test compartments. A review of the, publicly available,
general arrangement, section, elevation and façade drawings, of 513 compartments in
residential buildings constructed within the past decade in the UK, has been conducted
to provide a statistical overview of modern apartment design, and specifically:
• The distribution of floor areas, and
• The distribution of opening factors (O)6.
It has been indicated previously, for example by Zelinka et al. (2018) or Su and Lougheed
(2014), that typical non-fire rated walls within enclosures provide limited impediment
to the spread of fire. Therefore, when considering the floor area and perimeter of the
apartments, the internal walls have been ignored, as shown in Figure B. 1 below.
Figure B. 1: Apartment showing measured floor area (blue) and assumed perimeter (red)
In order to confirm that buildings utilizing mass timber are not being designed in any
significantly different manner, a review of 185 compartments in large residential mass
timber buildings7, has also been conducted. The distributions established for the
compartment area and opening factors can be found in Figure B. 2 and Figure B. 3,
respectively. Based on multiple studies (e.g. Hox, 2015 and Frangi and Fontana, 2005),
it is presumed that windows will break before the post-flashover phase of the fire, if the
6 Definition of opening factor: 𝑂 = 𝐴0√𝐻0 𝐴𝑡⁄ , where 𝐴0 = ∑𝐴𝑖 is the sum of all opening areas, 𝐴𝑡
is the total enclosing area (incl openings), 𝐻0 = ∑(𝐴𝑖ℎ𝑖) 𝐴0⁄ , and ℎ𝑖 is the height of each opening 7 The Cube, Dalston Lane and Stadthaus buildings, all of which are in London

49
fire has enough oxygen supply to develop to flashover. Therefore, windows and glass
doors are counted as openings during flashover fires.
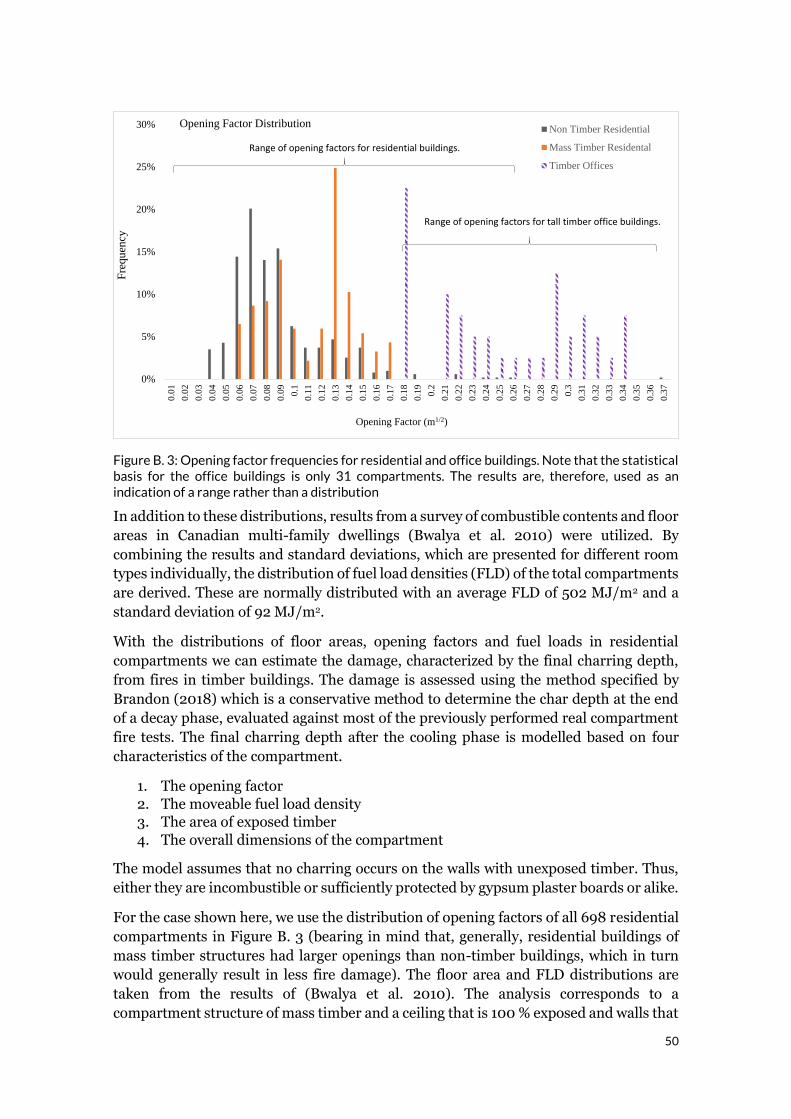
Lastly, drawings from 31 compartments in mass timber office buildings were collected
and the distribution of corresponding opening factors are displayed alongside the ones
for residential compartments in Figure B. 3. The opening factors of compartments in
office buildings are in a range that is clearly higher than that of residential
compartments.
Figure B. 2: Compartment area frequencies from residential buildings (n=513 for non-timber buildings and n=185 for mass timber buildings)
0%
5%
10%
15%
20%
25%
15 -
20
20 -
25
25 -
30
30 -
35
35 -
40
40 -
45
45 -
50
50 -
55
55 -
60
60 -
65
65 -
70
70 -
75
75 -
80
80 -
85
85 -
90
90 -
95
95 -
100
100
- 1
05
105
- 1
10
110
- 1
15
115
- 1
20
120
- 1
25
Fre
qu
ency
Area (m2)
Compartment Area Distribution
Non Timber Buildings Mass Timber Buildings
50
Figure B. 3: Opening factor frequencies for residential and office buildings. Note that the statistical basis for the office buildings is only 31 compartments. The results are, therefore, used as an indication of a range rather than a distribution
In addition to these distributions, results from a survey of combustible contents and floor
areas in Canadian multi-family dwellings (Bwalya et al. 2010) were utilized. By
combining the results and standard deviations, which are presented for different room
types individually, the distribution of fuel load densities (FLD) of the total compartments
are derived. These are normally distributed with an average FLD of 502 MJ/m2 and a
standard deviation of 92 MJ/m2.
With the distributions of floor areas, opening factors and fuel loads in residential
compartments we can estimate the damage, characterized by the final charring depth,
from fires in timber buildings. The damage is assessed using the method specified by
Brandon (2018) which is a conservative method to determine the char depth at the end
of a decay phase, evaluated against most of the previously performed real compartment
fire tests. The final charring depth after the cooling phase is modelled based on four
characteristics of the compartment.
1. The opening factor
2. The moveable fuel load density
3. The area of exposed timber
4. The overall dimensions of the compartment
The model assumes that no charring occurs on the walls with unexposed timber. Thus,
either they are incombustible or sufficiently protected by gypsum plaster boards or alike.
For the case shown here, we use the distribution of opening factors of all 698 residential
compartments in Figure B. 3 (bearing in mind that, generally, residential buildings of
mass timber structures had larger openings than non-timber buildings, which in turn
would generally result in less fire damage). The floor area and FLD distributions are
taken from the results of (Bwalya et al. 2010). The analysis corresponds to a
compartment structure of mass timber and a ceiling that is 100 % exposed and walls that
0%
5%
10%
15%
20%
25%
30%
0.0
1
0.0
2
0.0
3
0.0
4
0.0
5
0.0
6
0.0
7
0.0
8
0.0
9
0.1
0.1
1
0.1
2
0.1
3
0.1
4
0.1
5
0.1
6
0.1
7
0.1
8
0.1
9
0.2
0.2
1
0.2
2
0.2
3
0.2
4
0.2
5
0.2
6
0.2
7
0.2
8
0.2
9
0.3
0.3
1
0.3
2
0.3
3
0.3
4
0.3
5
0.3
6
0.3
7
Fre
qu
ency
Opening Factor (m1/2)
Opening Factor DistributionNon Timber Residential
Mass Timber Residental
Timber Offices
Range of opening factors for tall timber office buildings.
Range of opening factors for residential buildings.
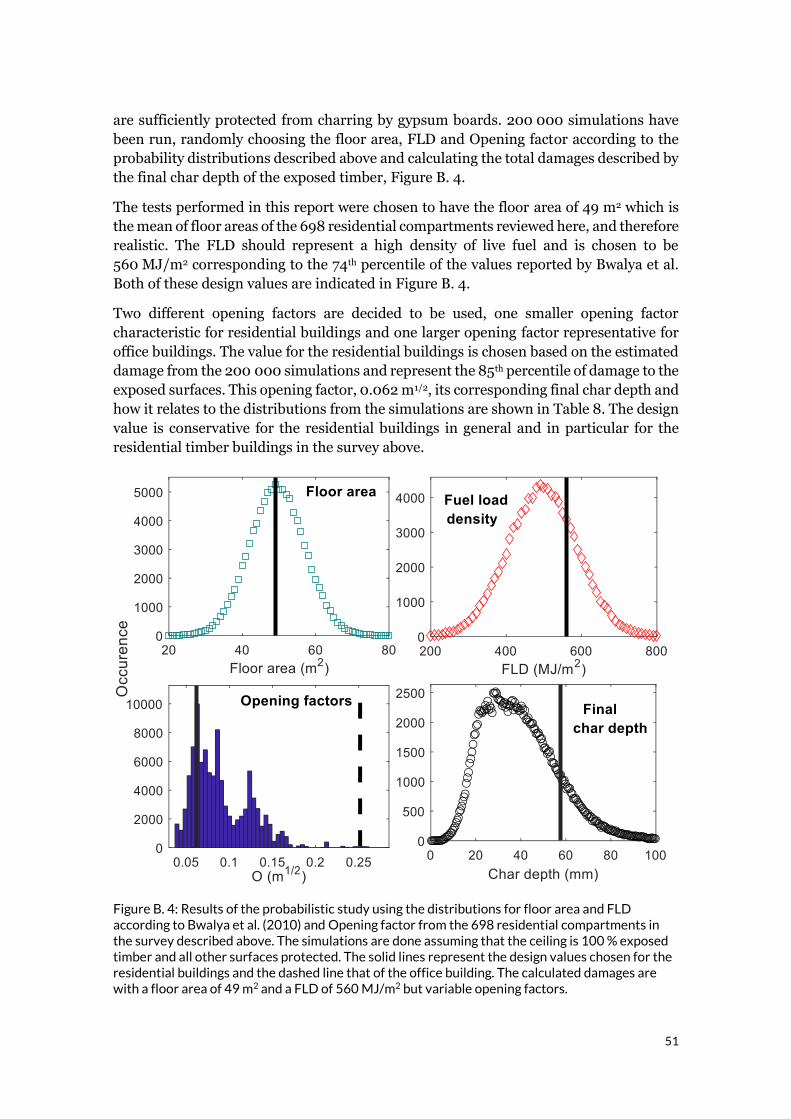
51
are sufficiently protected from charring by gypsum boards. 200 000 simulations have
been run, randomly choosing the floor area, FLD and Opening factor according to the
probability distributions described above and calculating the total damages described by
the final char depth of the exposed timber, Figure B. 4.
The tests performed in this report were chosen to have the floor area of 49 m2 which is
the mean of floor areas of the 698 residential compartments reviewed here, and therefore
realistic. The FLD should represent a high density of live fuel and is chosen to be
560 MJ/m2 corresponding to the 74th percentile of the values reported by Bwalya et al.
Both of these design values are indicated in Figure B. 4.
Two different opening factors are decided to be used, one smaller opening factor
characteristic for residential buildings and one larger opening factor representative for
office buildings. The value for the residential buildings is chosen based on the estimated
damage from the 200 000 simulations and represent the 85th percentile of damage to the
exposed surfaces. This opening factor, 0.062 m1/2, its corresponding final char depth and
how it relates to the distributions from the simulations are shown in Table 8. The design
value is conservative for the residential buildings in general and in particular for the
residential timber buildings in the survey above.
Figure B. 4: Results of the probabilistic study using the distributions for floor area and FLD according to Bwalya et al. (2010) and Opening factor from the 698 residential compartments in the survey described above. The simulations are done assuming that the ceiling is 100 % exposed timber and all other surfaces protected. The solid lines represent the design values chosen for the residential buildings and the dashed line that of the office building. The calculated damages are with a floor area of 49 m2 and a FLD of 560 MJ/m2 but variable opening factors.

52
Table 8. The opening factor highlighted in Figure B. 4, corresponding final char depth predicted percentile of the damage (char depth) after the fire.
Opening
factor
(m1/2)
Percentile of
all residential
buildings
Percentile of
timber residential
buildings
Final char
depth (mm)*
Percentile of
damages for all
residential buildings
0.062 25 7 57.4 85
* Assuming 49 m2, full ceiling exposed and 560 MJ/m2.
All previous experience show that larger openings will result in less damage. The design
for the tests with a lager opening includes 𝑂 = 0.250 m1/2, which is right in the range of
mass timber offices shown in Figure B. 4 and where the damage is expected to be less
than for the small opening tests.

53
Annex C - Fuel load Annex B discusses a probabilistic approach, concluding that a fuel load density of 560
MJ/m2 would result in statistically severe scenarios, which was based on a statistical
survey by NRC Canada (Bwayla et al 2010). To limit uncertainties introduced by using
the NRC Canada survey based on one set of calorific values and using another set of
calorific values to determine the fuel load density, this study also uses calorific values
published by the same Unit at NRC Canada, involving partly the same researchers. Table
C. 1 shows the calorific values of the NRC Canada study that are also used for this
research.
Table C. 1: Calorific values from Su et al. (2018a)
Material Calorific Value
Hardboard 19.9 MJ/kg
White pine 19.2 MJ/kg
Douglas Fir 21.0 MJ/kg
Polyurethane foam 29.0 MJ/kg
Cotton 20.3 MJ/kg
Paper 17.0 MJ/kg
In the compartments of this study several objects contained wood cribs of Norway Spruce
for which a calorific value of 17.8 MJ/kg is calculated. The floor and several objects
consist of particle board for which for which a calorific value of 21.2 MJ/kg is calculated
based on data from Phyllis 2, a database of material properties performed according to
relevant international test standards for the physico-chemical composition of
lignocellulosic biomass, micro- and macroalgae, various feedstocks for biogas
production and biochar, made available by TNO (the Netherlands). Some small amount
of polypropylene (polyester) was used in the compartment, for which 47.3 MJ/kg is
calculated based on the Phyllis 2 database. The weights of the object were individually
determined and the total weight of the fuel on the floor was checked using load cell
measurements before and after installation of the fuel. Table C. 2 shows the calculated
calorific value per object. This excludes the energy of the exposed gypsum board paper,
which is estimated to be between 2 and 5 MJ/m2 depending on the area of gypsum board
protection in each test.

54
Table C. 2: Calculated moveable fuel load density per test
Brand QTY Material 1 (kg) Material 2 (kg) Material 3 (kg) Total cal. value
Hemnes sofa bed
Ikea 2 Particle board
85 Spruce 9.8 Hardboard 8.2 4281
Friheten sofa bed
Ikea 1 Particle board
63 PU foam 40 Cotton 3 2557
Kleppstad wardrobe
Ikea 2 Particle board
74.1 Hardboard 4.8 none
3333
Göran table
Ikea 2 Particle board
8 Hardboard 2.5 none
439
Lack coffee table
Ikea 1 Particle board
18 none
none
382
Stefan chair
Ikea 8 White pine
4 none
none
614
Gersby book shelves
Ikea 6 Particle board
8 Hardboard 2.5 none
1316
Sköldblad cushions
Ikea 12 PU foam 0.37 none
none
129
Pärkla storage bags
Ikea 2 Polypropylene
0.14 none
none
13
Hemnes mattress
Ikea 4 PU foam 6.7 none
none
777
Fullkomlig Table cloth
Ikea 2 Polypropylene
0.57 none
none
54
Particle board floor
1 Particle
board 289 none
none
6127
Wood cribs in total
Södra 1 Spruce 380 none
none
6802
Paper in bin
1 Paper 1 none
none
17
Total fuel load (MJ) 26840
Fuel load density (MJ/m2) 560
The wood cribs were positioned in storage spaces to correspond to a realistic distribution
of fuel throughout the compartment. In addition, a wood crib was installed under the
dinner table to more closely resemble a heavier table and set of chairs. Table C. 3
indicates mass of the wood cribs at the locations indicated with the letters A to J in Figure
2 and Figure 3 of the main text.

55
Table C. 3: Mass of spruce wood crib at locations indicated in Figure 2 and Figure 3
Location Type Mass of wood crib (kg)
A Hemnes sofa bed 19.4
B Lack coffee table 23.3
C Gersby bookshelves (4x) 103.6
E1 Kleppstad wardrobe at back wall 36.3
E2 Kleppstad wardrobe towards center 41.5
F Hemnes sofa bed 20.7
G Göran dinner tables 66.1
H Gersby bookshelf 25.9
I Gersby bookshelf 25.9
J Pärkla storage bags 17.3
Total mass of wood cribs 380.0

56
Annex D - Mass loss measurements and
heat release rate calculations Mass loss rates of the floor and the mass loss of the structure were determined using load
cells that were positioned under a steel frame that bared the floor or a steel frame that
bared the remaining structure (walls, ceiling and external façade). The initial mass of the
bare floor was determined before every test using load cell measurements. The mass of
the movable fuel load was determined from load cell measurements before and after
installation of the fuel. After each fire test, the material left on the floor was limited to
some metallic parts of the furniture and some equipment, weighing 36 kg (79 lb) in total.
The combustible material left on the floor is considered negligible and the mass of the
floor after the test was determined from load cell measurements at the end of the test.
As the bare mass of the floor was determined before and after the test, the total mass
loss, due to drying of the floor (175 mm (20.7 inch) CLT, 20 mm (2.4 inch) Stone Wool
and 100 mm (11.8 inch) light weight concrete on top) could be determined. For the
calculations of the mass loss rate, it is considered reasonable to assume that the ratio
between mass loss rate of water in the floor and mass loss rate of the movable fuel was
constant. This assumption will be further assessed using material temperature
measurements of the floor and will be discussed in the final project report. By subtracting
the mass loss rate of the floor structure from the total mass loss rate, the mass loss rate
of the fuel load on the floor was determined.
The structure (walls, ceiling and glulam members) was weighed during the tests using
load cells under a separate frame. The mass loss of the CLT and glulam of the structure
is determined by subtracting an estimated mass loss of gypsum and the mass loss of the
facade extension from the measured mass loss. The total mass loss of the lightweight
concrete façade extension was determined by weighing the total structure before the
façade extension was installed on top of the compartment before the test and after
removing it. The mass loss of the façade extension was relatively small in comparison
with the total mass loss (approximately 3%). Given the small overall influence on the
total mass loss, for calculations of the mass loss rates of the combustible structure, it was
considered reasonable to assume that the ratio between mass loss rate of the total
structure and mass loss rate of the façade extension was constant. The mass loss rate of
gypsum board protection was determined using temperature measurements and a heat
transfer model described previously by Brandon and Andersson (2018, Annex A & B).
The heat transfer model was used to estimate the temperatures in a large amount of
locations in the gypsum board cross section. The calculation included the following steps:
1. Finite element calculation of the temperatures throughout the gypsum boards, using
the average plate thermometer temperature curve measured during the test as
boundary conditions for both radiation temperature and gas temperature. The gypsum
thermal properties used are given by Brandon and Andersson (2018).
2. Comparison with measured temperature to assess the accuracy of the calculation.
3. Use Thermo Gravimetric Analysis (Figure D. 2) of the tested gypsum board to
determine the mass loss throughout the gypsum board.
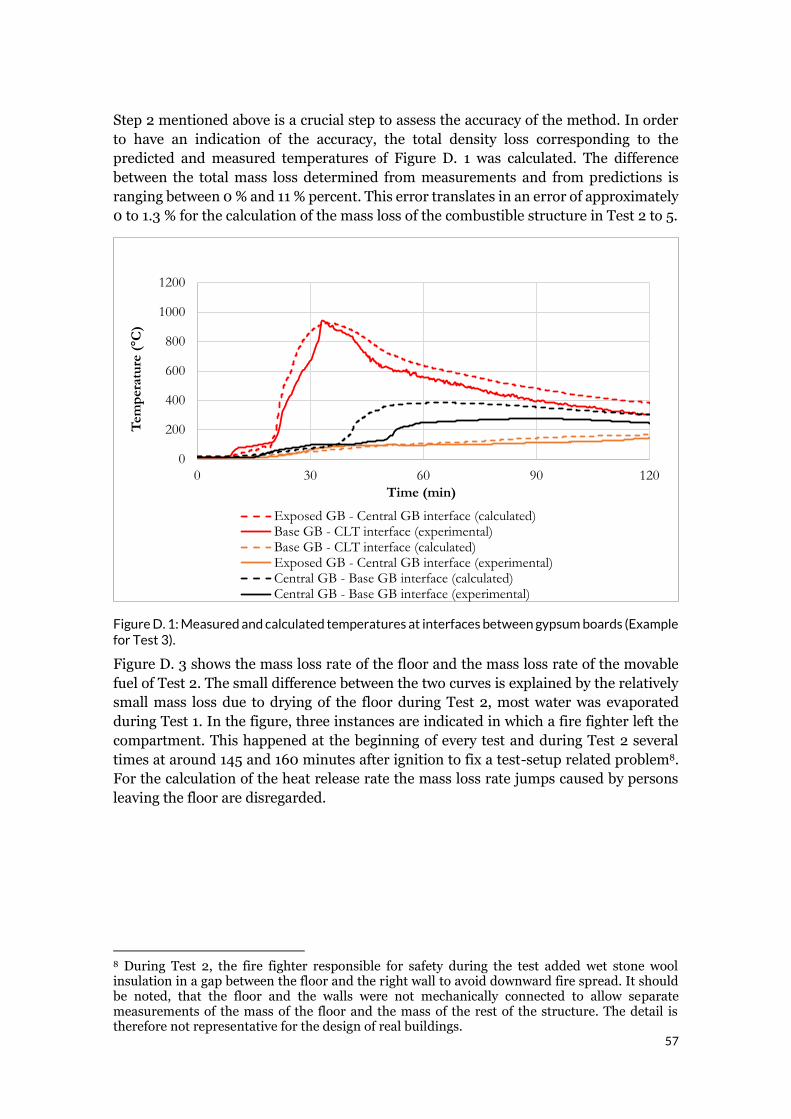
57
Step 2 mentioned above is a crucial step to assess the accuracy of the method. In order
to have an indication of the accuracy, the total density loss corresponding to the
predicted and measured temperatures of Figure D. 1 was calculated. The difference
between the total mass loss determined from measurements and from predictions is
ranging between 0 % and 11 % percent. This error translates in an error of approximately
0 to 1.3 % for the calculation of the mass loss of the combustible structure in Test 2 to 5.
Figure D. 1: Measured and calculated temperatures at interfaces between gypsum boards (Example for Test 3).
Figure D. 3 shows the mass loss rate of the floor and the mass loss rate of the movable
fuel of Test 2. The small difference between the two curves is explained by the relatively
small mass loss due to drying of the floor during Test 2, most water was evaporated
during Test 1. In the figure, three instances are indicated in which a fire fighter left the
compartment. This happened at the beginning of every test and during Test 2 several
times at around 145 and 160 minutes after ignition to fix a test-setup related problem8.
For the calculation of the heat release rate the mass loss rate jumps caused by persons
leaving the floor are disregarded.
8 During Test 2, the fire fighter responsible for safety during the test added wet stone wool insulation in a gap between the floor and the right wall to avoid downward fire spread. It should be noted, that the floor and the walls were not mechanically connected to allow separate measurements of the mass of the floor and the mass of the rest of the structure. The detail is therefore not representative for the design of real buildings.
0
200
400
600
800
1000
1200
0 30 60 90 120
Tem
pera
ture
(°C
)
Time (min)
Exposed GB - Central GB interface (calculated)Base GB - CLT interface (experimental)Base GB - CLT interface (calculated)Exposed GB - Central GB interface (experimental)Central GB - Base GB interface (calculated)Central GB - Base GB interface (experimental)
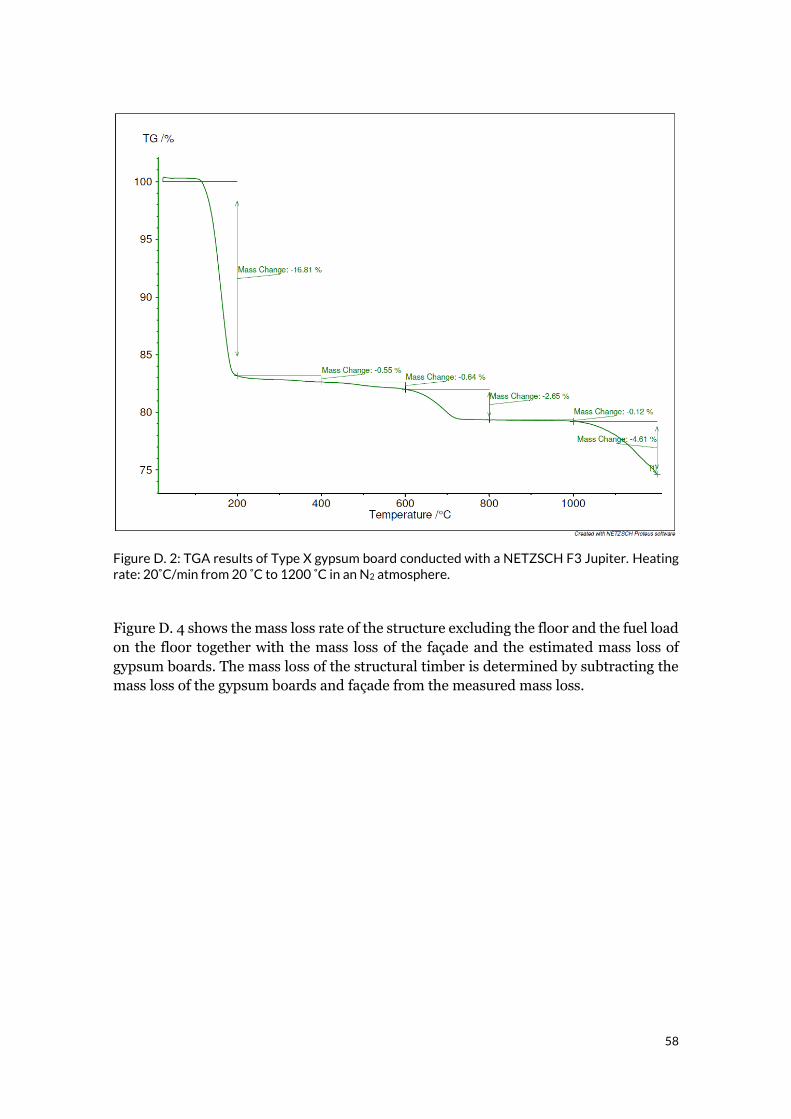
58
Figure D. 2: TGA results of Type X gypsum board conducted with a NETZSCH F3 Jupiter. Heating rate: 20˚C/min from 20 ˚C to 1200 ˚C in an N2 atmosphere.
Figure D. 4 shows the mass loss rate of the structure excluding the floor and the fuel load
on the floor together with the mass loss of the façade and the estimated mass loss of
gypsum boards. The mass loss of the structural timber is determined by subtracting the
mass loss of the gypsum boards and façade from the measured mass loss.

59
Figure D. 3: Mass loss rate of floor and mass loss rate of fuel of Test 2
Figure D. 4: Mass loss rate of the structure (excluding floor), façade, gypsum boards and timber surfaces for Test 2.
From the mass loss rates the heat release rates are estimated using the calorific values
summarized in Annex C - Fuel load (17.8 MJ/kg for the structural timber and 20.5 MJ/kg
for the moveable fuel load). The heat release calculation assumes that all combustible
volatiles that are released in the fire will combust. Figure D. 5 shows the heat release
rates of Test 2. It was found that the floor and the structure clearly interacted in multiple
0
0,2
0,4
0,6
0,8
1
1,2
0 60 120 180 240
Mass
lo
ss r
ate
(k
g/
s)
Time (min)
Mass Loss Rate Floor
Mass Loss Rate Floor (total) Mass Loss Rate of Fuel
Firefighter leaving the compartment
0
0,2
0,4
0,6
0,8
1
1,2
1,4
1,6
1,8
2
0 60 120 180 240
Mass
lo
ss r
ate
(k
g/
s)
Time (min)
Mass Loss Rate Structure
Mass Loss Rate Structure Mass loss GB
Mass loss facade Mass loss rate timber
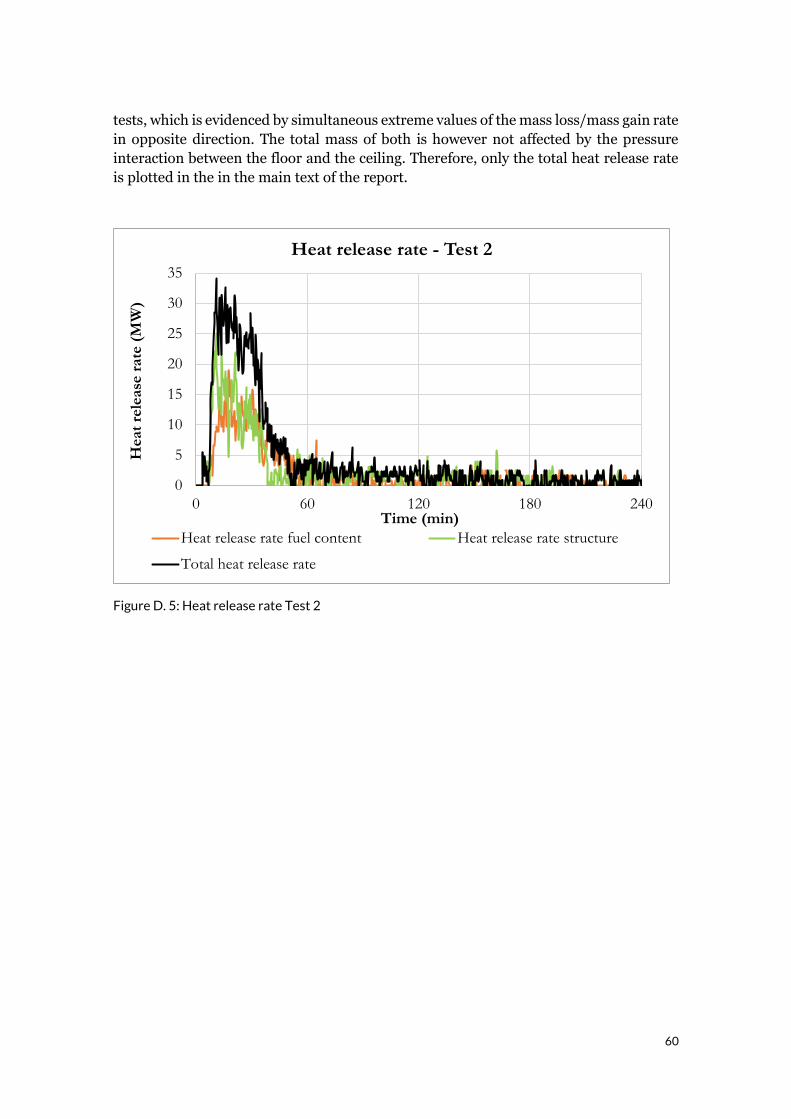
60
tests, which is evidenced by simultaneous extreme values of the mass loss/mass gain rate
in opposite direction. The total mass of both is however not affected by the pressure
interaction between the floor and the ceiling. Therefore, only the total heat release rate
is plotted in the in the main text of the report.
Figure D. 5: Heat release rate Test 2
0
5
10
15
20
25
30
35
0 60 120 180 240
Heat
rele
ase
rate
(M
W)
Time (min)
Heat release rate - Test 2
Heat release rate fuel content Heat release rate structure
Total heat release rate

61
Annex E - Photos Photos of the fuel setup
Figure E. 1. Photos of the furniture in Test 1 (replicated for all three tests)

62
Photos of tests
Snapshots of videos taken at the opening of the tests are shown in this Annex. Snap shots
are taken of the moment of flashover, 30 minutes after flashover and each whole hour
after ignition. The videos can be accessed using the URLs below:
Test 1:
https://youtu.be/V4VUF-FbraY
Test 2:
https://youtu.be/UgtHJwfhaJs
Test 3:
https://youtu.be/_R4EfKnQd2Q
Test 4:
https://youtu.be/jOELM-cv-U8
Test 5:
https://youtu.be/WUy-NEBLRoE

63
Figure H. 1. Test 1 - Video snapshots at flashover (left) and 30 minutes after flashover (right)
Figure H. 2. Test 1 - Video snapshots at 1 hour (left) and 2 hours (right) after ignition
Figure H. 3. Test 1 - Video snapshots at 3 hours (left) and 4 hours (right) after ignition

64
Figure H. 4. Test 2 - Video snapshots at flashover (left) and 30 minutes after flashover
(right)
Figure H. 5. Test 2 - Video snapshots at 1 hour (left) and 2 hours (right) after ignition
Figure H. 6. Test 2 - Video snapshots at 3 hours (left) and 4 hours (right) after ignition

65
Figure F. 1. Test 3 - Video snapshots at flashover (left) and 30 minutes after flashover
(right)
Figure F. 2. Test 3 - Video snapshots at 1 hour (left) and 2 hours (right) after ignition
Figure F. 3. Test 3 - Video snapshots at 3 hours (left) and 4 hours (right) after ignition

66
Figure F. 4. Test 4 - Video snapshots at flashover (left) and 30 minutes after flashover
(right)
Figure F. 5. Test 4 - Video snapshots at 1 hour (left) and 2 hours (right) after ignition
Figure F. 6. Test 4 - Video snapshots at 3 hours (left) and 4 hours (right) after ignition

67
Figure F. 7. Test 5 - Video snapshots at flashover (left) and 30 minutes after flashover
(right)
Figure F. 8. Test 5 - Video snapshots at 1 hour (left) and 2 hours (right) after ignition
Figure F. 9. Test 5 - Video snapshots at 3 hours (left) and 4 hours (right) after ignition
Snapshots of videos taken at the opening of the tests are shown in this Annex. Snap shots
are taken of the moment of flashover, 30 minutes after flashover and each whole hour

68
Annex F – Facade pictures and details The detail above openings at the façade is a sensitive detail, which is subject to high gas
velocities and thermal exposures. This study included different details for each test.
Iteratively looking for an effective solution that leads to minor damage. It should be
noted that Test 5 included cavities in the front façade as it was originally planned to have
larger openings. The damage in the façade of Test 5 is therefore, considered not
representative for real buildings.
Figure F. 10. Test 1 - Detail above opening (left) and front façade after removal of gypsum boards (right)
Figure F. 11. Test 2 - Detail above opening (left) and front façade after removal of gypsum
boards. NOTE: the sides of the opening had 2 layers of gypsum boards.

69
Figure F. 12. Test 3 - Detail above opening (left) and front façade after removal of gypsum
boards. NOTE: Stone wool B (1200 x 555 x 45) was thinner and had smaller batt
dimensions than stone wool A, which was used in other tests (1200 x 2700 x 50mm). The
stone wool batt above the right opening fell at an early stage.
Figure F. 13. Test 4 - Detail above opening (left) and front façade after removal of gypsum
boards.

70
Figure F. 14. Test 4 – Left façade after removal of gypsum boards.
Figure F. 15. Test 4 – Right façade after removal of gypsum boards.
Figure F. 16. Test 5 - Detail above opening (left) and front façade after removal of gypsum
boards. NOTE: Test 5 was originally planned to have larger openings. During the test
series is was decided to perform a test with the same openings as Test 1, 2 and 3 and
modify the opening width in the front façade. As a result an cavity existed between the

71
external and internal gypsum boards at the outer side of both openings. It is expected
that a smouldering fire entered the cavity on the right side of the right opening, which
stayed behind the outer gypsum boards.

72
The work upon which this publication is based was funded in part through a Wood Innovation
grant by the Southern Region, State & Private Forestry, Forest Service, U.S. Department of
Agriculture.
In accordance with Federal law and U.S. Department of Agriculture policy, this institution is
prohibited from discriminating on the basis of race, color, national origin, sex, age, or disability. To
file a complaint of discrimination, write USDA Director, Office of Civil Rights, Room 326-W,
Whitten
Building, 1400 Independence Avenue, SW, Washington, DC 20250-9410 or call (202) 720-5964
(voice and TDD). USDA is an equal opportunity employer.
Through our international collaboration programs with academia, industry, and the public sector,
we ensure the competitiveness of the Swedish business community on an international level and
contribute to a sustainable society. Our 2,800 employees support and promote all manner of
innovative processes, and our roughly 100 testbeds and demonstration facilities are instrumental
in developing the future-proofing of products, technologies, and services. RISE Research Institutes
of Sweden is fully owned by the Swedish state.
RISE Research Institutes of Sweden AB
Box 857, 501 15 BORÅS, SWEDEN
Telephone: +46 10-516 50 00
E-mail: [email protected], Internet: www.ri.se
Fire Research
RISE Report 2020:94
ISBN: 978-91-89167-79-7