Embed Size (px)
Citation preview
Electronic copy available at: http://ssrn.com/abstract=1304775
THE EXTROVERTED FIRM:
HOW EXTERNAL INFORMATION PRACTICES AFFECT INNOVATION AND PRODUCTIVITY
Forthcoming, Management Science
Prasanna Tambe
Stern School of Business, New York University New York, NY 10012 [email protected]
Lorin M. Hitt
The Wharton School, University of Pennsylvania Philadelphia, PA 19104 [email protected]
Erik Brynjolfsson
MIT Sloan School of Management Cambridge, MA 02139
Last revised, June 2011
Abstract
We gather detailed data on organizational practices and IT use at 253 firms to examine the hypothesis that external focus – the ability of a firm to detect and therefore respond to changes in its external operating environment – increases returns to information technology, especially when combined with decentralized decision-making. First, using survey-based measures, we find that external focus is correlated with both organizational decentralization and IT investment. Second, we find that a cluster of practices including external focus, decentralization and IT is associated with improved product innovation capabilities. Third, we develop and test a 3-way complementarities model that indicates that the combination of external focus, decentralization and IT is associated with significantly higher productivity in our sample. We also introduce a new set of instrumental variables representing barriers to IT-related organizational change and find that our results are robust when we account for the potential endogeneity of organizational investments. Our results may help explain why firms that operate in information-rich environments such as high-technology clusters or areas with high worker mobility have experienced especially high returns to IT investment and suggest a set of practices that some managers may be able to use to increase their returns from IT investments. Keywords: Information Technology, Productivity, Organizational Practices, External Focus, Complementarities, High Performance Work Practices, Product Development, High-Tech Clusters
Acknowledgements: We thank Anindya Ghose, Natalia Levina, Gary Loveman, Hal Varian, and Jeff Wilke as well as seminar participants at New York University, MIT, Harvard Business School, Northwestern University and the International Conference on Information Systems for helpful comments on this research. This material is based upon work supported by the MIT Center for Digital Business and the National Science Foundation under Grant No. IRI-9733877.
Electronic copy available at: http://ssrn.com/abstract=1304775
The Extroverted Firm
2
1. Introduction
Falling internal communication costs and new internal information practices enable information-
age firms to quickly respond to changes in consumer preferences, technology and competition. However,
improvements in the accuracy and timeliness of information are valuable only when combined with
appropriate changes in decision rights and organizational practices (Brynjolfsson and Mendelson, 1993;
Mendelson and Pillai, 1999). This suggests that the adoption of practices used to detect and respond to
changes in the external operating environment should become increasingly common. Internet companies
are an extreme example: firms like Amazon and Google record each customer’s keystrokes and analyze
the data to continuously optimize their products, processes and marketing. Off-line companies are also
using customer data extensively. For example, Harrah’s invested heavily in capturing data on consumer
gaming patterns, which they used to design compelling packages to attract high-value customers and
outperform competitors (Loveman, 2003). Similarly, firms like Cisco, Capital One, UPS, and Wal-Mart
have been described as gaining competitive advantage by adopting an aggressive approach to learning
about their customers and competitors (Davenport and Harris, 2007).
A growing research literature on the behavior of modern organizations has linked firm
performance to the ability to identify and respond to changes in a firm’s competitive environment
(Saxenian, 1996; Dyer and Singh, 1998; Dyer and Nobeoka, 2000; Powell, Koput, and Smith-Doerr,
1996; Bradley and Nolan, 1998; Von Hippel, 1998). Researchers have also emphasized the role of IT in
the development of information gathering and processing capabilities that facilitate external orientation
(Mendelson and Pillai, 1999; Malhotra et al., 2005; Pavlou and El Sawy, 2006; Rai et al., 2006;
Bharadwaj et al., 2007). However, the growing emphasis on external orientation has not been integrated
into the IT productivity literature, which has primarily emphasized the importance of adopting
organizational changes like decentralization in conjunction with IT investments (Bresnahan, Brynjolfsson,
and Hitt, 2002; Brynjolfsson, Hitt, and Yang, 2002).
In this study, we argue that information technologies are most productive when they allow firms
to quickly respond to external information. The central argument of this paper is that the combination of
external focus, changes in decision-rights and IT investments forms a 3-way system of complements
resulting in higher productivity levels (Figure 1). For example, Harrah’s, in addition to adopting new
information technologies to monitor consumer gaming patterns, simultaneously made extensive changes
to internal practices, such as implementing the appropriate incentives for customer service personnel to
keep high-value customers happy. These changes were required to successfully handle the massive
amounts of customer intelligence being generated.
The implication is that organizations that do not have the appropriate receptors in place through
which to sense environmental change will not experience the same returns to IT investments, even if they
The Extroverted Firm
3
have re-organized decision-making. In keeping with earlier research (Mendelson and Pillai, 1999), we
define “external focus” to be a set of practices firms use to detect changes in their external operating
environment. In information-rich environments, firms should engage in practices that make up-to-date,
accurate information available to decision-makers. The literature has emphasized several mechanisms
through which firms can capture external information, such as customer interaction, benchmarking, and
using inter-organizational project teams. We argue that returns to IT and decentralization are higher in
firms that have adopted these practices.
Conceptually, complementarities between external information awareness and internal
information practices are grounded in the literature on information processing organizations (Radner,
1992; Cyert and March, 1973). Because ‘boundedly rational’ organizations are limited in the amount of
information they can effectively process, improvements in internal information processing capabilities,
such as those offered by information technologies, increase the firm’s capacity to process information for
decision-making and to therefore respond to external information. Thus, the largest productivity benefits
from improving a firm’s internal information-processing infrastructure should be observed in dynamic
environments where firms continuously capture and respond to external signals. Beyond broad
performance benefits, this literature places special emphasis on product development as an important
mechanism through which IT-led improvements in information processing lead to higher productivity
(Mendelson, 2000; Pavlou and El Sawy, 2006; Bartel, Ichniowski, and Shaw, 2007). Firms that
effectively sense and process external information should have market-based advantages when
introducing new products (Kohli and Jaworski, 1990; Mendelson and Pillai, 1999).
Our study is based on a 2001 survey of organizational practices in 253 moderate and large sized
firms, matched to data on IT investment and firm performance from private and public sources. In
addition to including measures of internal organization used in prior work, we included constructs to
capture external focus and product innovation, motivated specifically by the work done by Mendelson
and Pillai (1999) on external practices in the computer manufacturing industry, but adapted to a more
heterogeneous set of firms, and broadened to include other sources of external information such as tacit
knowledge obtained from the strategic recruitment of new employees.
We find that external focus, decentralized organization, and IT investment are correlated.
Second, we find that these practices lead to higher product innovation rates. Third, we estimate a three-
way complementarities model (IT, external focus, decentralization) and demonstrate that firms that
combine all three practices derive substantially greater benefits from their IT investments. Our
econometric identification strategy includes the assumption that organizational practices are quasi-fixed
in the short run. However, we also introduce an innovative set of instrumental variables based on
inhibitors of organizational change to demonstrate that our results are not sensitive to this assumption. In
The Extroverted Firm
4
our preferred specifications, the output elasticity of IT investment is about 7 percentage points higher in
firms that are one standard deviation above the mean on both our external focus and organizational
decentralization measures compared to the average firm in our sample.
These findings suggest that firms can more successfully leverage IT investments if they
effectively capture external information through networks of customers, suppliers, partners, and new
employees. Mounting a more effective response to external information requires firms to have the
mechanisms in place through which to absorb this information, as well as the mechanisms to allow
effective local information processing. Internal workplace organization, external information practices,
and information technologies appear to be part of a mutually reinforcing cluster associated with faster
product cycles and higher productivity.
Our paper contributes to a literature on IT value, supporting the argument that organizational
complements lead to higher IT returns (Brynjolfsson and Hitt, 1995; Brynjolfsson and Hitt, 2000;
Dedrick, Kraemer, and Gurbaxani, 2003; Melville, Kraemer and Gurbaxani, 2004). We build upon prior
work that addresses complementarities between IT and internal practices such as decentralized decision
making (Bresnahan, Brynjolfsson, and Hitt, 2002; Caroli and Van Reenen, 2002) but add the external
orientation dimension which has been shown to be important in technology-intensive firms (Mendelson
and Pillai, 1999; Pavlou and El Sawy, 2006). Identifying organizational complements is useful for
managers who are restructuring their organizations to take advantage of improvements in computing. In
addition, our results improve our understanding of why firms in information-rich environments such as
Silicon Valley (Saxenian, 1996) appear to receive greater benefits from technology investments and why
IT returns may be influenced by geographic position (Dewan and Kraemer, 2000; Bloom, Sadun, and Van
Reenen, 2008).
2. Data and Measures
Our organizational practice measures are generated from a survey that was administered to 253 senior
human resource managers in 2001. The survey was conducted by telephone on a sample of 1,309 large
and upper middle-market firms1 that appear in a database of IT spending compiled by Harte Hanks (see
further detail below) and also have the requisite financial data in Compustat. The survey yielded a
response rate of 19.3%, which was typical for large-scale corporate surveys at the time. The sample of
responding firms has a slightly higher proportion of manufacturing firms relative to the sample population
(62% vs. 54%) and the firms tend to be slightly smaller when measured in sales, assets, employees and
market value. However, after conditioning on industry, the size differences between responding and non-
1 The target sample contains 806 Fortune 1000 firms as well as 503 firms that are present in Compustat but not Fortune 1000 that are routinely sampled by Harte-Hanks over our time period.
The Extroverted Firm
5
responding firms are not statistically significant. Furthermore, there is no significant difference between
responding and non-responding firms on performance measures such as return on assets or sales per
employee.
The questions for this survey were drawn from a previous wave of surveys on IT usage and
workplace organization administered in 1995-1996, and by incorporating additional questions on external
and internal information practices motivated by research on IT and organizational design (Mendelson and
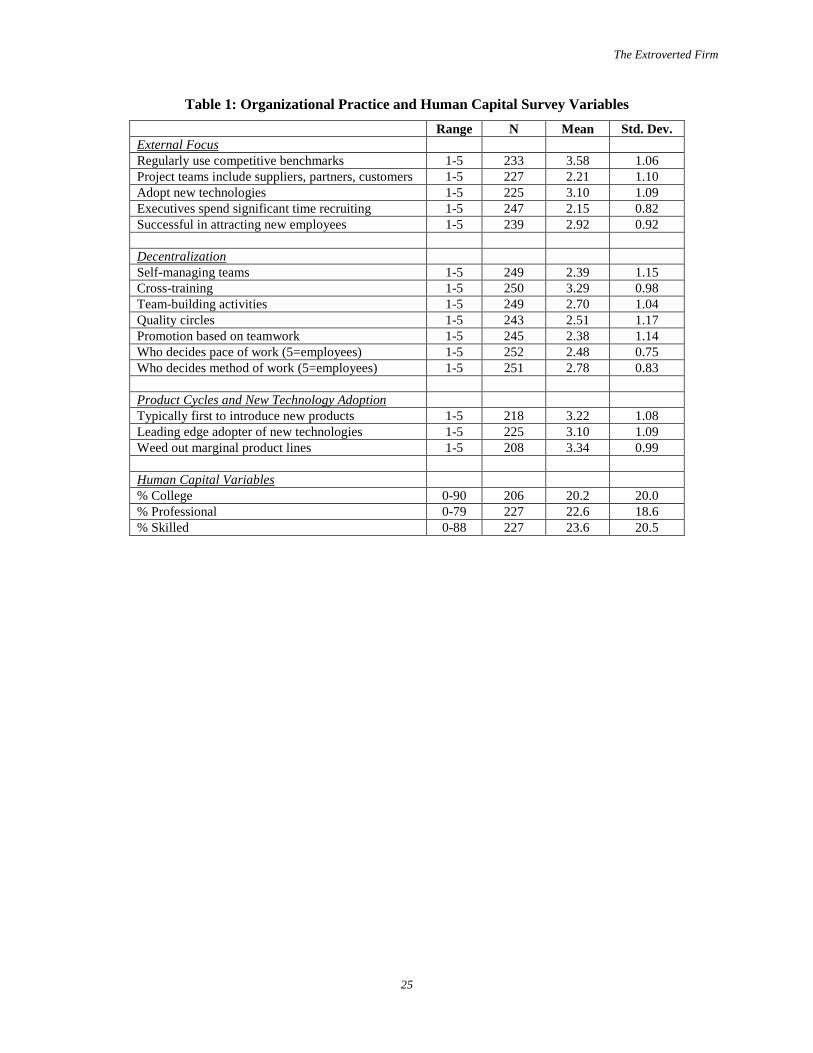
Pillai, 1998). Our survey also includes questions related to firms’ human capital mix, including
occupational and educational distributions (see Table 1 for a summary of variables and their descriptive
statistics).
2.1 External Focus
Our measure of external focus is based on an industry-specific “external information” construct
utilized by Mendelson and Pillai (1999) (designated as MP hereafter) which is in turn closely related to
the customer-specific concept of “market orientation” defined by Narver and Slater (1990) and Jaworski
and Kohli (1993) and operationalized by Kohli, Jaworski and Kumar (1993) (designated as KJK
hereafter). We broaden our measure to be applicable beyond customer-information (like MP) and to
multiple industries. In Table 2, we present the components of our external focus measure along side the
components used in related work. Both KJK and MP include constructs for direct customer interaction
(see Table 2, KJK scale items 1-3, MP scale items 1-2), which we capture in a question related to
customer participation on project teams, but we also include partners and suppliers (variable
PROJTEAM). Our second question focuses on the use of competitive benchmarking (BNCHMRK) which
relates to a firm’s awareness of the industry and broader business environment in KJK (scale items 5, 6)
and the industry-specific measure of order throughput benchmarking used in MP (scale item 3).
To these measures, we add additional constructs for incorporating new technology (scale item 3,
variable NEWTECH) as well as measures that examine how the firm might capture external information
through employee mobility – the involvement of executives in recruiting (EXECRCT) and the use of
higher pay as an inducement to attract new employees (NEWEMP). The inclusion of employee mobility
was motivated by work in strategic management that emphasizes this particular pathway as a means of
gathering tacit knowledge related to the competitive or technological environment (Argote and Ingram,
2000; Song, Almeida, and Wu, 2003). Executive involvement in recruiting and pay for performance were
specifically identified as key components of digital strategy in a case study of Cisco Systems (Woerner,
2001). Pay for performance has also been central to numerous other studies, including recent work by
Aral, Brynjolfsson and Wu (2009). In summary, we cover many of the same constructs as prior work,
but adapt them to apply to a broader set of industries than the industry-specific measures in MP, and we
The Extroverted Firm
6
place greater emphasis on non-customer information (in contrast to KJK) to reflect an operations rather
than marketing focus that may better fit a heterogeneous cross-section of firms.
Correlations between the individual constructs are shown in Table 3. The measures are positively
correlated, but not very highly correlated, and Cronbach’s alpha for a five-item scale constructed from the
individual variables is 0.521. The relatively lower alpha value is because these external measures are
multi-dimensional in the sense that just because firms do one of these activities, they do not necessarily
also have do the others. This implies that firms in different industries may access environmental
information in many ways, all of which may have similar economic impact. Indeed, in our main analysis,
we could not reject the hypothesis that the standardized values of the five components of external focus
have the same coefficients when entered into the regression individually. Consequently, we combined
these measures in a similar manner to our workplace organization variables, where each factor is first
standardized (STD) by removing the mean and then scaled by its standard deviation, yielding an external
focus measure with a mean of zero and a standard deviation of one. The full form of our aggregate
external focus variable is shown below.
))()()()()(( NEWEMPSTDEXECRCRTSTDPROJTEAMSTDNEWTECHSTDBNCHMRKSTDSTDEXT ++++=
While higher values on this scale represent more channels of external information acquisition,
firms that use none of these practices can still be externally focused (Type II error), although it is likely
that firms that have implemented unmeasured external information practices will also rate high on our
external focus scale. It is somewhat less likely that a firm that rates high on our external focus scale will
know little about the external environment (Type I error). Regardless, to the extent that our construct
mis-measures the true underlying external focus of some firms, measurement error is likely to bias
downwards the estimates on our external focus variables (Griliches and Hausman, 1986). Results from
productivity regressions using a variety of alternative external focus measure constructions, including one
that omits the two variables associated with the employee mobility (and thus are more directly
comparable to MP and KJK) show similar results (available from authors upon request).
2.2 Workplace Organization
To capture internal organizational processes that are complementary to external focus, we rely on a scale
focused on decentralized and team-oriented work practices used in prior work (Bresnahan, Brynjolfsson,
and Hitt, 2003; Brynjolfsson, Hitt and Yang, 2002), which was originally motivated by the extensive
literature on “high performance work systems” (Ichniowski, Kochan, Levine, Olson, and Strauss, 1996).
The measure contains six constructs of group-based decentralized decision-making [the use of self-
managed teams in production (SMTEAM), the use of team-building activities (TEAMBLD), the use of
teamwork as a promotion criterion (PROMTEAM), the use of quality circles or employee involvement
groups (QUALCIR)] and two measures capturing individual decision rights [the extent to which
The Extroverted Firm
7
individual workers decide the pace of work (PACE) and the extent to which individual workers decide
methods of work (METHOD)]. The Cronbach’s alpha for the four team-based measures is .732, and the
alpha for all six measures is .671. Similar to external focus, we construct a scale (WO) from these
measures using the standardized sum of the standardized values of each component. We utilized this
scale because it shows significant variation across firms, it has been previously shown to be a useful
summary metric IT-related work practices (Brynjolfsson and Hitt, 1997), and it has a clear economic
interpretation as decentralized, team-based decision making which is relatively narrow and specific,
making our model and econometrics more precise and interpretable.
2.3 Organizational Inhibitors
Some of our analyses are based on the assumption that the organizational measures described above are
quasi-fixed over short time periods, which is theoretically justified by a large literature on organizational
adjustment costs (Applegate, Cash, and Mills, 1988; Attewell and Rule, 1984; David, 1990; Milgrom and
Roberts, 1990; Murnane, Levy, and Autor, 1999; Zuboff, 1988; Bresnahan and Greenstein, 1996).
However, in addition to organizational practice variables, our survey data includes questions on
individual inhibitors of organizational change. These were designed to allow us to create direct measures
of organizational adjustment costs, which we can use as instrumental variables for our organizational
asset measures. These survey questions ask respondents to describe the degree to which the following
factors facilitate or inhibit the ability to make organizational changes: Skill Mix of Existing Staff,
Employment Contracts, Work Rules, Organizational Culture, Customer Relationships, Technological
Infrastructure, and Senior Management Support. These responses are used as instruments in our product
development and productivity regressions, as well as to create an aggregate adjustment cost measure
which was computed as the standardized sum of the standardized values of the individual inhibitors.
Cronbach’s Alpha for the seven individual inhibitors is 0.725.
These organizational inhibitors are suitable as instrumental variables because they reflect the
costs faced by firms in adopting new organizational practices. Firms that face constraints in terms of
culture, work rules, or staff mix may find it more difficult or costly to reengineer existing practices, or to
adopt practices complementary to new IT investments. Therefore, these organizational inhibitors are a
source of exogenous variation in the degree to which we are likely to observe the adoption of
organizational practices when firms adopt IT. These inhibitors, however, are less likely to be correlated
with firm performance directly.
2.4 Innovation, Product Cycles and Technological Change
Three of the variables from our survey data reflect a firm’s innovation and product development
capabilities with respect to its competitors. Our goal in choosing these measures is not to fully
The Extroverted Firm
8
characterize a firm’s product development processes – the literature on product development is very large
and includes a variety of perspectives on effective product development (Ulrich and Krishnan, 2001).
Instead, our variables were chosen to reflect different aspects of the innovation and product development
process for which access to information might prove beneficial. We measure 1) whether a firm is
normally the first to introduce a new product in its industry (FIRST), 2) the speed of internal product
development once a new product has been approved (SPEED) and 3) whether a firm regularly weeds out
marginal products (PLMGMT), which is a measure of the effectiveness of a firm’s product line
management. Access to different product development variables is useful because introduction of new
products is related to innovation and the firm’s ability to collect and process external information, but
product development speed should be more closely associated with the ability to process information
within the organization. Our innovation and product development measures are standardized to have a
zero mean and standard deviation of one.
2.5 Information Technology
We use two types of measures of computerization, one from our survey and one constructed from a
separate data set on IT employment. Managers responding to our survey were asked both the percentage
of workers in the organization that used personal computers (%PC), as well as the percentage of workers
in the organization that used email (%EMAIL). However, these internal measures are only available in
the survey base year. To construct our data set for the longitudinal productivity analysis, we use panel IT
measures based on an external data set describing firm-level IT employment from 1987 to 2006 (Tambe
and Hitt 2011), which we use as a proxy for firms’ aggregate IT expenditures.
IT employment in this data set is estimated using the employment history data from a very large
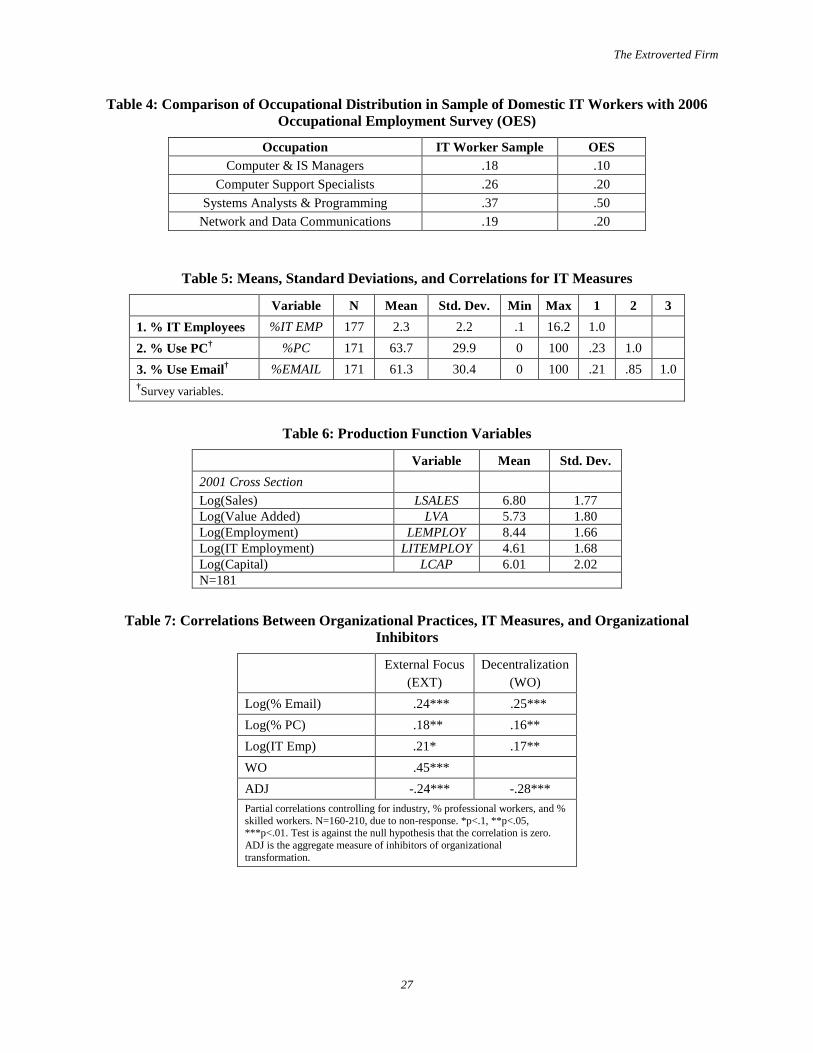
sample of US-based information technology workers. Table 4 shows the occupational composition of
these IT workers. These data include fewer programmers and higher numbers of support personnel. For
our purposes, this employment-based data set compares favorably to alternative archival data sets, such as
the Harte-Hanks CITDB capital stock data, in several ways. Although much recent research on IT
productivity has relied on the Computer Intelligence Technology Database (CITDB), complete panel data
is generally only available for Fortune 1000 firms, the definitions of variables changed significantly after
1994 and most importantly, the CITDB no longer includes direct measures of IT capital stock.
Consequently, even using methods to infer capital stock from available data only yield self-consistent
capital stock measures through about 2000.2 Our employment-based data, by contrast, are available on a
2 Chwelos, Ramirez, Kraemer and Melville (2007) provide a method for extending CITDB 1994 valuation data through 1998 by imputing the values of equipment in the earlier part of the dataset and adjusting for aggregate price changes. However, this differs from the method employed by Computer Intelligence, which determined equipment market values by looking at actual prices in the new, rental and resale computer markets.

The Extroverted Firm
9
consistent basis through 2006 and include matches for nearly all the firms we surveyed. We have
benchmarked these data against a number of other sources of IT data from ComputerWorld, Computer
Intelligence, and InformationWeek and generally find high correlations between these different sources in
both cross-section and time series.
Descriptive statistics and correlations for the IT employment measures and the survey-based IT
measures are shown in Table 5. The mean usage of both PCs and email for firms in our sample is about
60%. By comparison, similar measures from a survey conducted in 1995 indicated that in the average
firm, about 50% of workers used computers, and only about 30% of workers used email, implying
significant growth in IT intensity in the six-year interim period. The average firm in our sample had
about 470 IT workers in 2001, comprising about 2.3% of total employment, compared to 2.2% of total
employment accounted for by workers in “Computer and Mathematical Occupations” in the Bureau of
Labor Statistics 2001 Occupational Employment Survey.3 The large variation across firms for our
measures of the fraction of IT workers, email use, and computer use suggests that some firms, such as
those in IT-producing industries, have much greater IT usage than others. Therefore, we log transform
our IT measures to facilitate direct comparisons with our organizational factor data. Where we require
normalized measures for size, we compute IT workers as a proportion of total workers.
2.6 Value Added and Non-IT Production Inputs
We obtained longitudinal data on capital, labor, research & development expense, and value-added for the
firms in our sample by using the Compustat database. We used standard methods from the micro-
productivity literature to create our variables of interest from the underlying data. Price deflators for
inputs and outputs are taken from the Bureau of Labor Statistics (BLS) and Bureau of Economic Analysis
(BEA) web sites. Eight industry dummies were created using 1-digit NAICS headers. Table 6 shows
statistics for the 2001 cross section of the Compustat variables included in our analysis. In 2001, the
average firm in our sample had about $3.8 billion in sales and 15,200 employees.
3. Methods
Providing direct evidence of complementarities is challenging due to the endogeneity of
organizational practices in observational data (Athey and Stern, 1998; Brynjolfsson and Milgrom, 2009;
Cassiman and Veugelers, 2006; Novak and Stern, 2009). Moreover, lack of information about the costs
and value of specific organizational practices limits the ability to implement structural models of
organizational investment. The existing empirical literature on organizational complements has therefore
3 Available at http://www.bls.gov/oes/

The Extroverted Firm
10
focused instead on providing evidence of the economic implications of complementarities between
organizational practices (Arora and Gambardella, 1990; Bresnahan, Brynjolfsson and Hitt, 2002). The
empirical strategy followed in these studies is to marshal a number of different types of evidence
consistent with the complementarities hypothesis, which when considered in whole, strongly suggest
complementarities between organizational practices.
In particular, complementarities imply that we should observe 1) the clustering of practices across
firms and 2) that the simultaneous presence of these complements impacts performance more than the
sum of the individual effects. To the extent managers understand and embrace complementarities, they
would be expected to adopt them jointly, which should lead to significant correlations, but lower power
for the performance tests. In contrast, to the extent that the practices vary due to random shocks, the
performance tests can be expected to have more power (Brynjolfsson and Milgrom, 2009). We measure
clustering as correlation within a survey base year as well as changes in correlations over time, and
performance by regression models with interactions as well as newer tests proposed by Brynjolfsson and
Milgrom (2009) that contrast performance for different combinations of complementary practices. We
also include two useful measurement innovations. First, unobserved human capital among firms is likely
to be a significant omitted variable in prior work on organizational practices. Using our survey data we
are able to include human capital controls at the firm level. Second, we are able to consider the potential
endogeneity of work practices by instrumenting these measures with our data on inhibitors to
organizational innovation, which indirectly capture the cost variation of organizational investments across
firms. Thus, we substantially increase the number of factors that we are able to directly measure,
reducing the role that unobserved heterogeneity and endogeneity play in the analysis relative to earlier
studies on organizational complementarities.
3.1 Correlation Tests
The first test we conduct is based on correlations among these organizational practices. First, using our
cross-sectional data, we examine how the use of IT and the proposed complementary practices co-vary in
the survey base year. If these practices are complements, price declines in IT should be accompanied by
greater use of both complementary organizational practices. Second, we can examine time trends in
correlations. If IT is complementary to the proposed organizational practices, we should see rising
correlations over time as managers adjust IT levels to match levels of other complementary inputs.
3.2 Innovation and Product Development Regressions
The Extroverted Firm
11
We can also use our data to develop some insight into how these inputs affect the productivity of firms.
We test how our organizational and IT variables are associated with various stages of the product
development process by estimating the following model.
PRODi = βEXT EXTi + βWOWOi + βIT IT i+ βRDRDi + controls
PROD represents one of our three possible product development outcomes (FIRST, SPEED, and
PLMGMT), EXT is our external focus variable (EXT), WO measures workplace decentralization, IT is a
measure of IT usage within the firm, RD measures R&D intensity computed as the R&D expense per
employee, and i indexes firms. For our IT usage variable, we use the percentage of workers who use
email. As control variables, we include dummy variables for industry and the percentage of a firm’s
workers that are college educated.
One concern with these regression estimates is that organizational practice variables and product
development measures may be simultaneously determined. Therefore, we use instrumental variables to
conduct regressions in which the organizational measures (WO and EXT) are treated as endogenous. As
instruments, we use our individual inhibitors of organizational transformation, which reflect the ease or
difficulty through which firms can develop these organizational assets, as well as the state in which a
firm’s corporate headquarters are located, which may affect a firm’s cost for external information
gathering.
3.3 Productivity Tests
We test complementarities in production by embedding our measures within a production
function. The productivity framework has been widely used in IT productivity research (Brynjolfsson
and Yang, 1995 and Stiroh, 2004 review much of this literature). IT productivity scholars embed
measures of information technology, along with levels of other production inputs, into an econometric
model of how firms convert these inputs to outputs. Economic theory places some constraints on the
functional form used to relate these inputs to outputs, but a number of different functional forms are
widely used depending on the firm’s economic circumstances.
We use the Cobb-Douglas specification, which aside from being among the simplest functional
forms, has the advantage that it has been the most commonly used model in research relating inputs such
as information technology to output growth (e.g., Brynjolfsson and Hitt, 1993, 1995, 1996; Dewan and
Min, 1997), and has been used extensively in research testing for complementarities between IT and
organization (Bresnahan, Brynjolfsson, and Hitt, 2002; Brynjolfsson, Hitt, and Yang, 2002). Our primary
regression model can be written
uitEXTWO
itEXTitWOEXTWOEXTWOitnitekva
itEXTWO
itEXTitWOEXTWOEXTWOitnitek
+++++++++=
)**(
)*()*()*(
**
***
βββββββββ
The Extroverted Firm
12
where va is the log of value added, k is the log of capital, it is the log of IT employees, nite is the log of
non-IT employees, and WO and EXT are our organizational variables. Dummy variables are included for
industry and year. In some specifications, we also control for the firm’s human capital to rule out some
alternative explanations for our principal results.
In the productivity regression, the organizational variables are entered in levels as well as in
interactions with each other and with the technology variables. A positive coefficient on the three-way
term in this model is not sufficient to indicate complementarities because a high value of this variable
when using standardized organizational measures can correspond to a number of different combinations
of practices (e.g. high-high-high or any of the three high-low-low combinations). Therefore, interpreting
what the estimated coefficients indicate for how different combinations of practices affect productivity
requires evaluating the terms and cross-terms over the sample range for each factor. A derivation of what
the estimates from our full-sample productivity regression model imply for how different combinations of
practices affect the elasticity of other factors is provided in Appendix A. In general, we find that
complementarities are present for the movements of factors considered individually or with two factors
moving simultaneously when other factors are above the mean.
Although our data on IT and other production inputs are longitudinal, our organizational factors
data are based on a single survey conducted in 2001. We construct a seven-year panel (1999-2006) by
making the assumption that organizational factors are quasi-fixed in the short run. Our survey was
administered in 2001, towards the middle of our panel. Similar assumptions regarding the quasi-fixed
nature of organizational assets have been used in prior research on organizational factors (Bresnahan,
Brynjolfsson, and Hitt, 2002), and the assumption that organizational factors are associated with
substantial adjustment costs and take considerable time to change is supported by substantial case and
econometric evidence cited earlier. Furthermore, in our analysis, we use adjustment cost data as
instrumental variables to directly test this assumption.
An additional potentially important source of endogeneity is our IT measures. Unobserved
productivity shocks will tend to exert an upward bias on the IT estimates as firms adjust IT to
accommodate higher production levels. However, the endogeneity of IT investment may not exert too
large an influence on our key estimates for two reasons. First, in other work we show that using GMM-
based estimators that account for the endogeneity of IT investment (such as the Levinsohn-Petrin
estimator) lowers our IT estimates by no more than 10% when using these data (Tambe and Hitt 2011).
Second, our key estimates, based on the 3-way complementarity between IT, external focus, and
decentralization are less subject to bias relative to our main effect estimates because any biases that affect
the complementarity term must be present only at the confluence of all three of these factors, but not
The Extroverted Firm
13
when factors are present individually or in pairs.4 For example, unobservable factors like “good
management” might explain why some firms are simultaneously productive and extroverted. However,
such an unobservable would not explain why EXT is productive in the presence of IT and WO but not in
its absence. That would require a much more unusual sort of unobservable factor which increased
productivity only when the other inputs were present as a group, but not individually. Thus, although we
cannot completely eliminate all sources of bias, the effects of unobservables on our key estimates should
be limited.
4. Results
4.1 Correlation Tests
Table 7 shows partial correlations between our IT measures and our organizational practice
variables. All correlations include controls for firm size. We also control for 1-digit NAICS industry, as
well as the percent of skilled blue-collar workers and the percent of professional workers to control for
the nature of the firm’s production process. Although these correlations by themselves are neither
necessary nor sufficient evidence of complementarities (Athey and Stern, 1998; Brynjolfsson and
Milgrom, 2009), they provide preliminary evidence as to whether managers perceive these practices as
mutually beneficial.
Our external focus measure is correlated with our IT measure, and is highly correlated with the
decentralization measure. Workplace organization is also positively associated with our IT measures. The
correlation between workplace organization and external focus is 0.45 (p<.01), indicating that external
information practices are significantly more likely to be found in firms with decentralized decision
architectures. These correlations between external focus, workplace organization, and IT support the
argument that external focus, workplace organization, and information technology usage are complements
in the production process. Furthermore, our aggregated adjustment cost variable, which we use as an
instrument in both our product development and productivity regressions, is negatively and significantly
associated with both organizational measures, indicating that firms that have higher adjustment costs are
less likely to have implemented either of these systems of work practices, as theory would predict.
We can also examine how managers adjust IT levels over time to match organizational practices.
Figure 2 compares changes in aggregate IT employment levels over time where firms are separated
according to whether they are above or below the median in terms of adoption of EXT and WO. The
trend lines suggest that IT demand in firms with high levels of both EXT and WO has been increasing
faster than in firms that have not adopted these practices or firms that are mismatched on these practices.
4 We thank an anonymous editor for making this observation.
The Extroverted Firm
14
4.2 Innovation and Product Cycle Regressions
Table 8 shows associations between our innovation and product development measures and our
technology and organizational variables. In Columns (1)-(3), we report OLS regressions of how the
different organizational practice and IT measures are related to product development. In (1), the
dependent variable is how likely a firm is to be the first in its industry to introduce a new product. The
point estimate on external focus is positive and significant (t=3.44), suggesting that extroverted firms also
tend to exhibit product leadership. The dependent variable in (2) is related to internal product
development speed, which captures how quickly a firm can introduce a new product or service after it has
been approved. Thus, this measure captures speed of execution, rather than innovation per se. The
estimates in (2) indicate that in addition to R&D intensity, technology usage, rather than organizational
variables, is more closely associated with faster internal product development (t=2.12). The dependent
variable in (3) is effective management of the product line, and the coefficient estimates indicate that
external focus (t=3.16) and to a lesser degree, decentralization (t=1.69), are closely related to how well a
firm manages its product line.
In Columns (4)-(6), we report estimates from 2SLS regressions where our organizational
measures are treated as endogenous, and individual inhibitors of organizational transformation and
location variables are used as instruments. As in our OLS regressions, the estimates from this set of
regressions indicate that external focus is positively and significantly associated with new product
introduction (t=3.26), and that IT investment is most closely associated with product development speed
(t=2.19). However, in our IV estimates, decentralization rather than external focus appears to be most
closely associated with effective management of the product line (t=2.18). Hausman test statistics from all
three IV regressions, displayed at the bottom of Table 8, indicate that we cannot reject the null hypothesis
that decentralization and external focus are exogenous to our regression models, consistent with our
assumption that organizational factors are difficult to change in the short-run.
In aggregate, these results indicate that the ability to exercise product leadership is more closely
connected to a firm’s ability to capture information from its environment, but its ability to internally
process and manage products in a timely manner is governed by its internal information processing
capacity. Competing in quickly changing product environments, therefore, appears to require external
receptors in addition to decentralization and technology.
4.3 Full-Sample Regression-Based Productivity Tests
The central hypothesis of this paper is that external focus is an important organizational asset
affecting the returns to IT investment, especially when combined with decentralization. Table 9 shows
the results from our regressions directly testing this hypothesis in a complementarities framework. All

The Extroverted Firm
15
estimates are from pooled OLS regressions, and errors are clustered by firm to provide consistent
estimates of the standard errors under repeated sampling of the same firms over time. First, we establish a
baseline estimate of the contribution of IT to productivity during our panel, which extends from 1999 to
2006. The coefficient estimate on our IT employment variable is about .084 (t=2.3), consistent with
many pooled OLS regressions of this type that appear in the literature using other sources of data on IT
expenditures (e.g., Brynjolfsson and Hitt, 1996).
In Column (2), we include only decentralization measures, for comparison with earlier studies.
Although the coefficient estimate on decentralization is significant (t=3.3), the interaction term between
decentralization and IT is insignificant, in contrast with earlier work. This may be because decentralized
work practices have more broadly diffused to most IT-intensive firms that can benefit from them, leading
to minimal marginal effects on productivity in recent data.5 The coefficient estimate on IT is slightly
smaller but is close to the estimate without any organizational factors explicitly modeled. In Column (3),
we include only our external focus measure plus an interaction term with information technology. The
results are similar—the estimate on the external focus measure is significant (t=2.08), but the two-way
interaction term between external focus and IT is not significant.
In our main results, reported in Column (4), we include the full set of organizational factors and
interaction terms. The coefficient estimates on the three-way interaction term as well as on the
decentralization term are positive and significant. For IT returns within our sample range, the estimates
imply that IT returns are increasing when EXT and WO are matched in either direction. This is consistent
with the interpretation that unless high IT firms have adopted these organizational complements together,
adopting only one or the other in isolation may make them worse off than adopting neither. Therefore, IT
is complementary with the EXT*WO combination rather than just WO in isolation. In the cube-based
productivity analysis presented later in the paper, we show that of the possibilities for matching EXT and
WO for high IT firms—either high-high or low-low-- the highest productivity group corresponds to firms
that have adopted both practices along with IT, not those that have invested in IT but adopted neither of
the two organizational practices. Based on supplemental analysis (see Tambe, Hitt and Brynjolfsson,
2011) these point estimates suggest that complementarities are present among any two factors when the
third factor is close to or above the sample mean, and a single factor is complementary to the combination
of two other factors when the two factors are above the sample mean. After including the organizational
factors and all interaction terms, the IT main effect estimate in Column (4) is no longer significantly
different from zero. Although our benchmark estimates in Column (1) indicate an output elasticity of
5Estimates from supplementary regressions (not shown) indicate that this complementarity reappears when restricting our estimates to earlier time periods.
The Extroverted Firm
16
about 0.08, our Column (4) estimates suggest that these benefits are only captured by firms that have also
chosen the right combination of decentralization and external focus to match their IT investments.6
To gauge the robustness of these results, we re-estimate our model (Columns 5 and 6) including a
control for workforce composition (percentage of skilled workers and professionals out of total
employment) to account for the fact that human capital is closely related to organizational innovation and
technology adoption (Bartel and Lichtenberg, 1987). Our coefficient estimates do not change
substantively after including these human capital measures or after including more detailed industry
dummies. Second, we conduct instrumental variables regressions using our organizational inhibitors
measures as instruments for external focus, decentralization and the interaction terms. The pattern of IV
estimates (Column 7) is similar to that in earlier regressions and indicates that our core findings are
unlikely to be heavily influenced by the endogeneity of organizational investments. At the bottom of
Column (7), we report values of the Hansen J-statistic, which tests the instrument exclusion restriction,
and the Anderson Canonical Correlation, which tests for weak instruments. The reported values indicate
that instrument validity is not likely to be a problem in our IV regression model. A Hausman test is just
short of rejecting the null hypothesis that our organizational measures are exogenous with respect to
productivity, and that our OLS regressions in Columns (1)-(5) produce consistent estimates.
4.4 Sample Difference Tests
We can use a number of contrasts among subsamples of our data to further investigate potential
endogeneity or other specification problems. For instance, we construct a measure of adjustment costs by
creating a composite scale (comparable to what we did with EXT and WO) for our organizational
inhibitor variables, which allows us to segment the sample into firms that have high and low
organizational adjustment costs. Firms facing higher adjustment costs are likely to have been endowed
with whatever organizational practices we observe so our quasi-fixed assumption is most likely to be
valid, while firms with lower adjustment costs are more likely in the midst of change to more modern
work practices. If unusually high performing firms are also likely to be investing in decentralized work
practices, we would expect the endogeneity problem to be concentrated in the low adjustment cost firms.
In Columns (1) and (2) of Table 10, we report regression estimates for the subsamples of firms that have
lower than average and higher than average adjustment costs, respectively, and find results that suggest
our analyses are not biased upwards by endogeneity. The coefficient estimate on the 3-way interaction
term for firms with lower organizational adjustment costs is .058 (t=1.93), only slightly lower than our
6 We also estimated similar regressions where each of the individual external focus variables are tested individually, and where the external focus variable is constructed from different combinations of the individual external focus constructs. The results from these regressions indicate that our external focus measure is not overly sensitive to any of the individual underlying constructs. These results are available in Appendix B.
The Extroverted Firm
17
baseline estimate, and we cannot reject the hypothesis that the coefficient on the 3-way interaction term is
the same across the two regressions. The comparable coefficient estimate for firms with high adjustment
costs, for whom our assumption of quasi-fixed organizational factors is more likely to be accurate, is .106
(t=2.72). Therefore, consistent with our IV estimates, it appears that to the extent that our organizational
factors are changing during the sample period, it would introduce a downward bias to our productivity
estimates.
We can also test for other specification problems by varying the length and sample frame of our
panel. In particular, our organizational practice measures are likely to accurately reflect actual practices
in the interval around 2001, and be less accurate in the early and late years. Moreover, if firms adopt
these practices over time as IT prices decline, as our theory would predict, we will likely overstate the use
of these practices in early periods, and understate them in later periods. In Column (3), when we restrict
the sample to a five-year panel close to 2001, we obtain estimates similar to our full estimates in Table 9,
and we cannot reject the hypothesis that the coefficients on the 3-way interaction term are the same across
the two regressions. In Columns (4) and (5), we run separate regressions from 1999-2001 and from 2002-
2006. The higher coefficient estimates on the organizational measures in the 1999-2001 period are
consistent with the interpretation that our survey measures understate organizational differences before
2001 and overstate them after 2001. Overall, our estimates in (1) through (5) suggest that even if firms
were becoming more externally focused during these years, measurement error in organizational factors is
unlikely to have had a significant effect on our productivity estimates.
In Table 11, we implement a series of tests for complementarities proposed by Brynjolfsson and
Milgrom (2009) that contrast the productivity of firms that have adopted different combinations of IT,
EXT and WO. We first dichotomize each of the three variables where a 1 represents high levels of the
organizational practice, and a 0 represents low levels. This yields eight cells (2x2x2), one for each
possible combination of practices. Each cell in the table is instantiated with average productivity
differences of firms in that cell relative to the (0, 0, 0) cell. Unlike the productivity tests shown above,
this test distinguishes productivity differences between high IT firms that have invested in EXT and WO
and high IT firms that have invested in neither.
We find that the highest productivity cell is that in which firms invest in all three factors (1, 1, 1).
F-tests indicate that the productivity differences between the (1, 1, 1) cell and cells with any combination
of two factors are all significant at the 5% level. This pattern of results is what would be predicted by the
complementarities story, and provides additional evidence that our results are not being driven by
endogenous organizational investment. Although reverse causality between performance and
organizational investment might explain the (1,1,1) quadrant, it does not explain why firms that have
neither factor in place would be more productive than those with one but not the other in place.
The Extroverted Firm
18
Furthermore, Chi-squared tests (shown with Table 11) indicate that the majority of firms appear to cluster
into one of the two main diagonal corners within this group, as would be expected given the observed
productivity differences and the expected clustering of complementary practices. Interestingly, these
results also suggest that even for low IT firms, the combination of decentralization and external focus
appears to provide benefits that are independent of IT investment levels.
Complementarities arguments also predict that the marginal benefit of adopting a practice should
be increasing in the presence of complementary practices. As noted by Aral, Brynjolfsson and Wu (2009)
and Brynjolfsson and Milgrom (2009) this can be viewed as comparisons along the edges of a cube where
each axis represents one of the (dichotomized) practice measures (see Figure 3). This increasing returns
argument implies three specific tests of along a pair of edges, plus a fourth test that simultaneously
considers all three pairs of edges. For instance, one test is whether the adoption of EXT adds greater
benefit in the presence of IT and WO [the comparison of (1,1,0) vs. (1,1,1)] than adoption EXT alone [the
comparision of (0,0,0) vs. (0,0,1)]. The results of these tests suggest that the benefits of adopting external
focus in the presence of IT and decentralization are greater than the benefits of adopting external focus
alone (p<.01), and a test of whether the benefits of adopting decentralization are increasing in the
presence of IT and external focus falls slightly short of being significant at the 10% level. IT adoption
provides greater productivity benefits in the presence of decentralization and external focus, but this is not
significant, perhaps due to the substantial complementarity between external focus and decentralization
alone.7 Finally, we reject the null hypothesis of no increasing returns when we consider the most
comprehensive test, which examines all three comparisons simultaneously (p<.05).
The findings from Table 11 and Figure 3 are visually captured in Figure 4, in which we show a
plot of fitted values from a regression of organizational and IT inputs on the productivity residuals when
other variables have been netted out. Lighter areas in Figure 3 correspond to higher productivity values.
The surface contours corresponding to changing EXT*WO while holding IT fixed indicate that high IT
firms perform better when EXT and WO are matched. Furthermore, the contours that correspond to
changing IT levels with EXT*WO held fixed indicate that returns to IT increase much more rapidly in
firms in which EXT and WO are matched.
5. Conclusion
Our results suggest that a 3-way system of complements that includes external focus,
decentralization, and IT intensity is associated with productivity in modern firms. IT has the strongest
effect on productivity in firms that simultaneously have the right organizational structures in place,
7 Alternatively, this could reflect lower adjustment costs of IT, and a resulting faster adoption rate.
The Extroverted Firm
19
whether through wise management or luck. While prior work has demonstrated the importance of
decentralization in explaining differences in returns to IT investment, the central contribution of this
paper is the integration of a third variable, external focus, into the IT productivity framework.
Our hypothesis that decentralized decision-making and external focus are complementary to IT
investment is supported by a number of different analyses. First, these three factors are highly correlated,
indicating that firms are likely to invest in them together. This pattern of joint investment is predicted if
managers are at least somewhat aware of these complementarities or if competition selects for companies
with more productive combinations of practices. We also found evidence that one of the principal
mechanisms through which external focus affects productivity is via improved product development.
Some of the strongest evidence of complementarities comes from our production function estimates —
the combination of IT, decentralization, and external focus is positively associated with firm productivity.
Moreover, when these complements are included in a production model, main effect estimates of IT and
other organizational factors essentially disappear, indicating that firms derive the most benefit from
implementing the system of technological and organizational resources, and not IT alone.
From a research perspective, our study contributes to a literature on determinants of IT value, and
in particular, on IT-related organizational complements. Our findings highlight the benefits of information
technologies in an environment in which innovation largely takes place through external linkages with
other firms, rather than within insular firms. Information technologies appear to provide greater benefits
for firms that must process information effectively to respond to frequent environmental signals. This
observation is also consistent with recent research suggesting cross-regional variation in returns to IT
adoption, since these complementarities are likely to be most valuable when firms are located in
information-rich environments. Finally, from a research methods standpoint, we have identified an
effective set of instruments for work organization and external focus, providing greater confidence that
these and prior results on the benefits of IT-related organizational practices are not driven by endogeneity.
A key managerial implication of our research is that “extroverted” firms are more productive and
derive disproportionate benefits from advances in IT and workplace organization. Companies that exploit
this opportunity by using more information from customers, suppliers and competitive benchmarks
appear to outperform their rivals. Moreover, theoretical arguments suggest that managers should
implement all of the elements in a system of complements to realize the maximum benefits (Milgrom and
Roberts, 1990). Therefore, managers in firms with decentralized structures may not realize productive
returns to IT-related investments unless they also find a way to also promote cross-boundary information
flows through external practices such as competitive benchmarking and inter-organizational product
teams. Thus, while the two types of organizational practices are complementary, external focus is distinct
from organizational decentralization both theoretically and empirically. However, it is likely that our
The Extroverted Firm
20
measures are only a subset of an even wider set of practices that firms use to bring information into the
organization.
Our findings may also have implications for policy makers. There has been recent discussion of
why IT appears to have led to greater productivity growth in some regions within the US than in others,
and in some parts of the world than others (Dewan and Kraemer, 2000; Bloom, Sadun, and Van Reenen,
2008). Our findings suggest that the degree to which firms are networked with customers, suppliers, and
partners is a potentially important factor explaining differences in IT-led productivity growth. Even
within the same industry in the US, scholars have shown that considerable variation can exist among the
degree to which firms share information across regions (Saxenian, 1996).
There are some important limitations to our study. Because of the research design, we were not
able to conduct fixed effect productivity regressions to determine if changes in organizational assets drive
productivity changes. Thus it is possible that the organizational assets that we have focused on here are
reflecting some unobserved heterogeneity among the firms in our sample. However, we controlled for the
most likely candidate, human capital endowments, and supplementary data allowed us to test whether our
results were sensitive to this assumption. Furthermore, while heterogeneity could explain correlations
between any given practice and our performance measures, it is more difficult to construct a story of
heterogeneity that drives correlations with 3-way combinations, but not one or two way combinations of
these practices.
An increasing body of evidence suggests that organizational practices, such as the ones that we
identify in this paper, are critical to the success of technological innovation. We expect that future
research using more fine-grained measures of organization will continue to identify other organizational
and management practices that interact with technology to affect productivity and innovation.
References
Applegate, L., J. Cash, and D. Mills. 1988. Information Technology and Tomorrow’s Manager. Harvard Business Review. 66(6): 128-136.
Aral, S., E. Brynjolfsson, and L. Wu. 2009. Testing Three-Way Complementarities: Incentives,
Monitoring and Information Technology, Working Paper, MIT Center for Digital Business. Arora, A. and A. Gambardella. 1990. Complementarity and External Linkages: The Strategies of the
Large Firms in Biotechnology. Journal of Industrial Economics. 38(4): 361-379. Argote, L. and P. Ingram. 2000. Knowledge Transfer: A Basis for Competitive Advantage in Firms.
Organizational Behavior and Human Decision Processes. 82(1): 150-169. Athey, S. and S. Stern. 1998. An Empirical Framework for Testing Theories about Complementarity in
Organizational Design. NBER Working Paper No. W6600.
The Extroverted Firm
21
Attewell, P. and J. Rule. 1984. Computing and Organizations: What We Know and What We Don’t Know. Communications of the ACM. 27(12): 1184-1192.
Bartel, A. and P. R. Lichtenberg. 1987. The Comparative Advantage of Educated Workers in
Implementing New Technology. Review of Economics and Statistics, 64: 1-11. Bartel, A., Ichniowski, C., and Shaw, K. 2007. How Does Information Technology Affect Productivity?
Plant-Level Comparisons of Product Innovation, Process Improvement, and Worker Skills, Quarterly Journal of Economics 122(4): 1721-1758.
Bharadwaj, S., A. Bharadwaj, and E. Bendoly. 2007. The Performance Effects of Complementarities
Between Information Systems, Marketing, Manufacturing, and Supply Chain Processes, Information Systems Research 18(4) 437-453.
Bloom, N., R. Sadun, and J. Van Reenen. 2008. Americans Do I.T. Better: US Multinationals and the
Productivity Miracle. Working Paper. Bradley, S.P. and R. Nolan. 1998. Sense and Respond: Capturing Value in the Network Era, Harvard
Business School Press, Cambridge. Bresnahan, T., E. Brynjolfsson, and L. M. Hitt. 2002. Information Technology, Workplace Organization
and the Demand for Skilled Labor: Firm-level Evidence. Quarterly Journal of Economics. 117(1):339-376.
Bresnahan, T. and S. Greenstein. 1996. Technological Progress and Co-Invention in Computing and in the Uses of Computers. Brookings Papers on Economic Activity. 1-78.
Brynjolfsson, E. 1993. The Productivity Paradox of Information Technology. Communications of the
ACM. 36(12): 67-77. Brynjolfsson, E. and L.M. Hitt. 1995. Information Technology as a Factor of Production: The Role of
Differences Among Firms, Economics of Innovation and New Technology, 3(4):183-200. Brynjolfsson, E. and L. M. Hitt. 1996. Paradox Lost? Firm-level Evidence on the Returns to Information
Systems Spending. Management Science 42(4): 541-558.
Brynjolfsson, E. and L.M. Hitt. 2000. Beyond Computation: Information Technology, Organizational Transformation and Business Performance, Journal of Economic Perspectives, 14(4):23-48.
Brynjolfsson, E., L.M. Hitt, and S. Yang. 2002. Intangible Assets: Computers and Organizational Capital. Brookings Papers on Economic Activity. 1: 137-199.
Brynjolfsson, E. and H. Mendelson. 1993. Information Systems and the Organization of Modern
Enterprise. Journal of Organizational Computing. 3(4): 245-255. Brynjolfsson, E. and P. Milgrom. 2009. Complementarities in Organizations. Working Paper. Brynjolfsson, E. and S. Yang. 1996. Information Technology and Productivity: A Review of the
Literature. In Zelkowitz, M., ed., Advances in Computers. 43: 179-214. Caroli, E. and J. Van Reenen. 2002. Skill-Biased Organizational Change: Evidence from a Panel of
British and French Establishments. Quarterly Journal of Economics. 116(4): 1449-1492.
The Extroverted Firm
22
Cassiman, B. and R. Veugelers. 2006. In Search of Complementarity in Innovation Strategy: Internal
R&D and External Knowledge Acquisition. Management Science. 52(1): 68-82. Chesbrough, H. 2003. Open Innovation: The New Imperative for Creating and Profiting from
Technology. Harvard Business School Press, Cambridge. Chwelos, P., R. Ramirez, K. Kraemer, and N. Melville. 2007. Does Technological Progress Alter the
Nature of Information Technology as a Production Input? New Evidence and New Results. Information Systems Research, Forthcoming.
Cyert, R. and J. March. 1963. A Behavioral Theory of the Firm, Prentice-Hall, Englewood Cliffs, NJ. Davenport, T. and J. Harris. 2007. Competing on Analytics: The New Science of Winning. Harvard
Business School Press, Cambridge. David, P. 1990. The Dynamo and the Computer: An Historical Perspective on the Modern Productivity
Paradox. American Economic Review. 80(2): 355-361. Dewan, S. and K. Kraemer. 2000. Information Technology and Productivity: Evidence from Country-
Level Data. Management Science. 46(4): 548-562. Dewan, S., Min, C. 1997. The Substitution of Information Technology for Other Factors of Production: A
Firm-Level Analysis. Management Science, 43(12): 1660-1675. Dedrick, J., K. Kraemer, and V. Gurbaxani. 2003. Information Technology and Economic Performance:
A Critical Review of the Evidence. ACM Computing Surveys. 35(1): 1-28. Dyer, J.D. and K. Nobeoka. 2000. Creating and Managing a High-Performance Knowledge-Sharing
Network: The Toyota Case, Strategic Management Journal, Special Issue: Strategic Networks. 21(3): 345-367
Dyer, J.D. and H. Singh. 1998. The Relational View: Cooperative Strategy and Sources of
Interorganizational Competitive Advantage, The Academy of Management Review, 23(4): 660-679.
Griliches, Z. & J. A. Hausman. 1986. Errors in variables in panel data, Journal of Econometrics, , 31(1): 93-
118.
Hitt, L. M. and E. Brynjolfsson, E. 1997. Information Technology and Internal Firm Organization: An Exploratory Analysis. Journal of Management Information Systems. 14(2): 81-101.
Ichniowski, C., T. Kochan, D. Levine, C. Olson, and G. Strauss. 1996. What Works at Work: Overview and Assessment. Industrial Relations. 35(3): 299-333.
Kohli, A. and B. Jaworksi. 1990. Market Orientation: The Construct, Research Propositions, and
Managerial Implications. Journal of Marketing. 54(2):1-18. Kohli, A., B. Jaworski, and A. Kumar. 1993. MARKOR: A Measure of Market Orientation. Journal of
Marketing Research. 30(4): 467-477. Loveman, G. 2003. Diamonds in the Data Mine. Harvard Business Review 81(5): 109-113.
The Extroverted Firm
23
Malhotra, A., S. Gosain, and O. El Sawy. 2005. Absorptive Capacity Configurations in Supply Chains: Gearing for Partner-Enabled Market Knowledge Creation, MIS Quarterly 29(1): 145-187.
Melville, N., K. Kraemer, and V. Gurbaxani. 2004. Review: Information Technology and Organizational
Performance: An Integrative Model of IT Business Value. MIS Quarterly. 28(2): 283-322. Mendelson, H. 2000. Organizational Architecture and Success in the Information Technology Industry.
Management Science. 46(4): 513-529. Mendelson, H. and R. Pillai. 1999. Information Age organizations, dynamics and performance. Journal of
Economic Behavior & Organization. 38: 253-281. Milgrom, P. and J. Roberts. 1990. The Economics of Modern Manufacturing: Technology, Strategy, and
Organization. American Economic Review. 80(3) : 511-528. Murnane, R., F. Levy, and D. Autor. 1999. Upstairs, Downstairs: Computers and Skills on Two Floors of
a Large Bank. Industrial Relations and Labor Review. 55(3): 432-447. Narver, J. and S. Slater. 1990. The Effect of Market Orientation on Business Profitability. Journal of
Marketing. 54: 20-35. Novak, S. and S. Stern. 2009. Complementarity Among Vertical Integration Decisions: Evidence from
Automobile Product Development, Management Science. Pavlou, P. and O. El Sawy. 2006. From IT Leveraging Competence to Competitive Advantage in
Turbulent Environments: The Case of New Product Development. Information Systems Research. 17(3): 198-227.
Powell, W., K. Koput, and L. Smith-Doerr. 1996. Interorganizational Collaboration and the Locus of
Innovation: Networks of Learning in Biotechnology. Administrative Science Quarterly. 41: 116-145.
Radner, R. 1992. Hierarchy: The Economics of Managing. Journal of Economic Literature. 30: 1382-
1415. Rai, A., R. Patnayakuni, and N. Patnayakuni. 2006. Firm Performance Impacts of Digitally Enabled
Supply Chain Integration Capabilities, MIS Quarterly, 30(2): 225-246. Saxenian, A. 1996. Regional Advantage: Culture and Competition in Silicon Valley and Route 128,
Harvard University Press, Cambridge, USA. Song, J., P. Almeida, and G. Wu. 2003. Learning-by-Hiring: When is Mobility More Likely to Facilitate
Knowledge Transfer? Management Science. 49(4): 351-365. Stiroh, K. J. 2004. Reassessing the Impact of IT in the Production Function: A Meta- analysis and
Sensitivity Tests. Mimeo, New York Federal Reserve. Tambe, P. and L.M. Hitt. 2011. The Productivity of Information Technology Investments: New Evidence
from IT Labor Data. Working Paper.
The Extroverted Firm
24
Tambe, P., L.M. Hitt, E. Brynjolfsson. 2011. The Extroverted Firm: How External Information Practices Affect Innovation and Productivity. Available at http://ssrn.com/abstract=1304775.
Ulrich, K. and V. Krishnan. 2001. Product Development Decisions: A Review of the Literature.
Management Science, 47(1): 1-21. Von Hippel, E. 1988. The Sources of Innovation. Oxford University Press, New York. Woerner, S. 2001. Networked at Cisco, MIT Center for Digital Business Case Study. Zuboff, S. 1988. In the Age of the Smart Machine: The Future of Work and Power. Basic Books, New
York.
The Extroverted Firm
25
Table 1: Organizational Practice and Human Capital Survey Variables
Range N Mean Std. Dev. External Focus Regularly use competitive benchmarks 1-5 233 3.58 1.06 Project teams include suppliers, partners, customers 1-5 227 2.21 1.10 Adopt new technologies 1-5 225 3.10 1.09 Executives spend significant time recruiting 1-5 247 2.15 0.82 Successful in attracting new employees 1-5 239 2.92 0.92 Decentralization Self-managing teams 1-5 249 2.39 1.15 Cross-training 1-5 250 3.29 0.98 Team-building activities 1-5 249 2.70 1.04 Quality circles 1-5 243 2.51 1.17 Promotion based on teamwork 1-5 245 2.38 1.14 Who decides pace of work (5=employees) 1-5 252 2.48 0.75 Who decides method of work (5=employees) 1-5 251 2.78 0.83 Product Cycles and New Technology Adoption Typically first to introduce new products 1-5 218 3.22 1.08 Leading edge adopter of new technologies 1-5 225 3.10 1.09 Weed out marginal product lines 1-5 208 3.34 0.99 Human Capital Variables % College 0-90 206 20.2 20.0 % Professional 0-79 227 22.6 18.6 % Skilled 0-88 227 23.6 20.5

The Extroverted Firm
26
Table 2: External Focus Measure
Kohli, Jaworski, & Kumar (1993)
Mendelson & Pillai (1999)
Tambe, Hitt, & Brynjolfsson (2011)
Measure Intelligence Generationa
External Informationb
External Focus
Definition
The collection and assessment of both customer needs/ preferences and the forces (i.e., task and macro environments) that influence the development and refinement of those needs.
Whether the organization has receptors to sense changes in the external environment and provide it with quick and accurate feedback.
External information practices used to detect environmental changes
Information Scope Customer Preferences
Technology, Product
Markets, Customers, and
Competitors
Technology, Product
Markets, Customers, and
Competitors
Industry Scope All sectors IT Hardware Manufacturing All Sectors
Scale Items Used
1. In this business unit, we
meet with customers at least
once a year to find out what
products and services they
will need in the future.
2. In this business unit, we do a
lot of in-house market
research.
3. We are slow to detect
changes in customer’s
product preferences.
4. We poll end users at least
once a year to assess the
quality of our products and
services.
5. We are slow to detect
fundamental shifts in our
industry (e.g., competition,
technology, regulation)
6. We periodically review the
likely effect of changes in our
business environment (e.g.,
regulation) on customers.
1. How important are direct
discussions with customers
and input from marketing
personnel, as sources of
ideas for product
development?
2. How important are
customer preferences in
defining your cost reduction
targets?
3. On what basis do you set
order throughput time
targets?
1. Project teams often
include employees from
customers, suppliers, or
business partners
2. Competitive benchmarks
are regularly used in
corporate strategic
planning.
3. We are usually the leading
edge adopter of new
technologies in our
industry.
4. Executives devote a
significant part of their
time to recruiting.
5. We are successful in
attracting new employees
because we pay better
than industry average.
a Intelligence generation is one element of “Market Orientation” along with intelligence dissemination and responsiveness.
bAwareness of external Information is one element of the ‘Information Age Organization’, along with decentralization, incentives, internal
knowledge dissemination, learning by doing, internal focus, and inter-organizational networks.
Table 3: Correlations for Variables Used in External Focus Measure
BENCHMARK PROJTEAM EXECRCRT NEWEMP NEWTECH
BENCHMARK 1.0 PROJTEAM .22 1.0 EXECRCRT .13 .13 1.0 NEWEMP .17 .23 .25 1.0 NEWTECH .27 .07 .10 .28 1.0 N=201
The Extroverted Firm
27
Table 4: Comparison of Occupational Distribution in Sample of Domestic IT Workers with 2006 Occupational Employment Survey (OES)
Occupation IT Worker Sample OES Computer & IS Managers .18 .10
Computer Support Specialists .26 .20
Systems Analysts & Programming .37 .50
Network and Data Communications .19 .20
Table 5: Means, Standard Deviations, and Correlations for IT Measures
Variable N Mean Std. Dev. Min Max 1 2 3
1. % IT Employees %IT EMP 177 2.3 2.2 .1 16.2 1.0
2. % Use PC† %PC 171 63.7 29.9 0 100 .23 1.0
3. % Use Email† %EMAIL 171 61.3 30.4 0 100 .21 .85 1.0 †Survey variables.
Table 6: Production Function Variables
Variable Mean Std. Dev.
2001 Cross Section
Log(Sales) LSALES 6.80 1.77 Log(Value Added) LVA 5.73 1.80 Log(Employment) LEMPLOY 8.44 1.66 Log(IT Employment) LITEMPLOY 4.61 1.68 Log(Capital) LCAP 6.01 2.02 N=181
Table 7: Correlations Between Organizational Practices, IT Measures, and Organizational Inhibitors
External Focus (EXT)
Decentralization (WO)
Log(% Email) .24*** .25***
Log(% PC) .18** .16**
Log(IT Emp) .21* .17**
WO .45***
ADJ -.24*** -.28***
Partial correlations controlling for industry, % professional workers, and % skilled workers. N=160-210, due to non-response. *p<.1, **p<.05, ***p<.01. Test is against the null hypothesis that the correlation is zero. ADJ is the aggregate measure of inhibitors of organizational transformation.
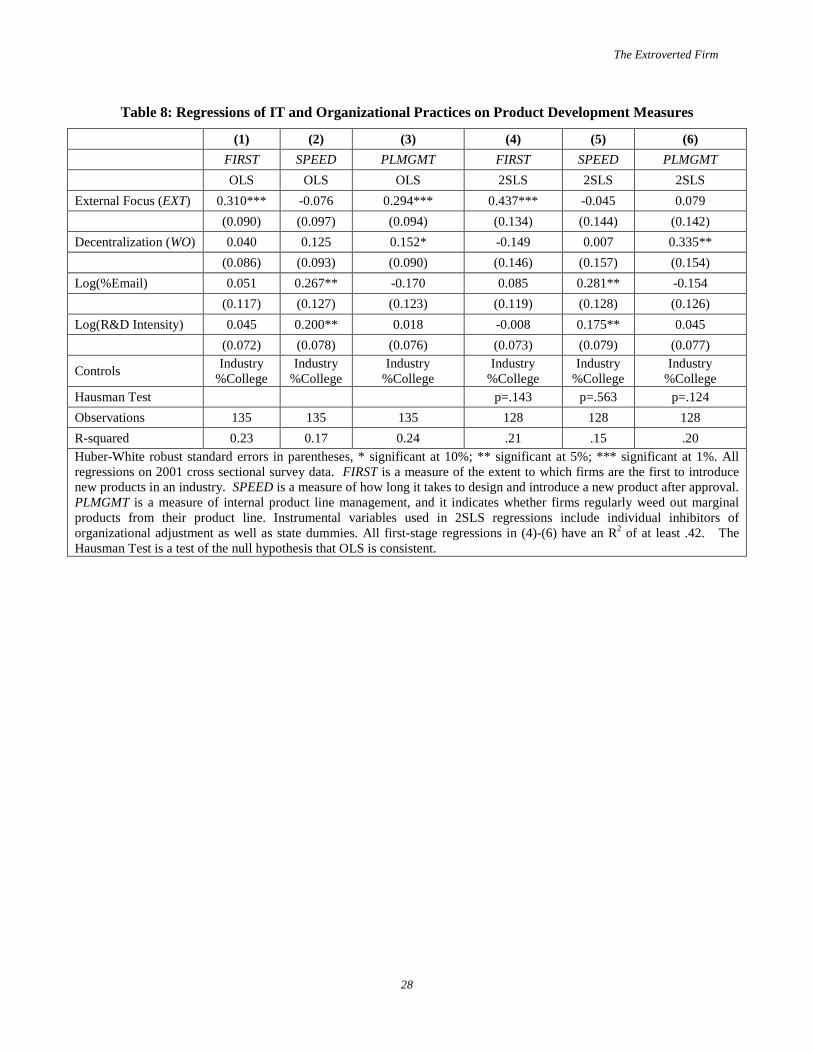
The Extroverted Firm
28
Table 8: Regressions of IT and Organizational Practices on Product Development Measures
(1) (2) (3) (4) (5) (6)
FIRST SPEED PLMGMT FIRST SPEED PLMGMT
OLS OLS OLS 2SLS 2SLS 2SLS
External Focus (EXT) 0.310*** -0.076 0.294*** 0.437*** -0.045 0.079
(0.090) (0.097) (0.094) (0.134) (0.144) (0.142)
Decentralization (WO) 0.040 0.125 0.152* -0.149 0.007 0.335**
(0.086) (0.093) (0.090) (0.146) (0.157) (0.154)
Log(%Email) 0.051 0.267** -0.170 0.085 0.281** -0.154
(0.117) (0.127) (0.123) (0.119) (0.128) (0.126)
Log(R&D Intensity) 0.045 0.200** 0.018 -0.008 0.175** 0.045
(0.072) (0.078) (0.076) (0.073) (0.079) (0.077)
Controls Industry
%College Industry
%College Industry
%College Industry
%College Industry
%College Industry
%College Hausman Test p=.143 p=.563 p=.124
Observations 135 135 135 128 128 128
R-squared 0.23 0.17 0.24 .21 .15 .20 Huber-White robust standard errors in parentheses, * significant at 10%; ** significant at 5%; *** significant at 1%. All regressions on 2001 cross sectional survey data. FIRST is a measure of the extent to which firms are the first to introduce new products in an industry. SPEED is a measure of how long it takes to design and introduce a new product after approval. PLMGMT is a measure of internal product line management, and it indicates whether firms regularly weed out marginal products from their product line. Instrumental variables used in 2SLS regressions include individual inhibitors of organizational adjustment as well as state dummies. All first-stage regressions in (4)-(6) have an R2 of at least .42. The Hausman Test is a test of the null hypothesis that OLS is consistent.
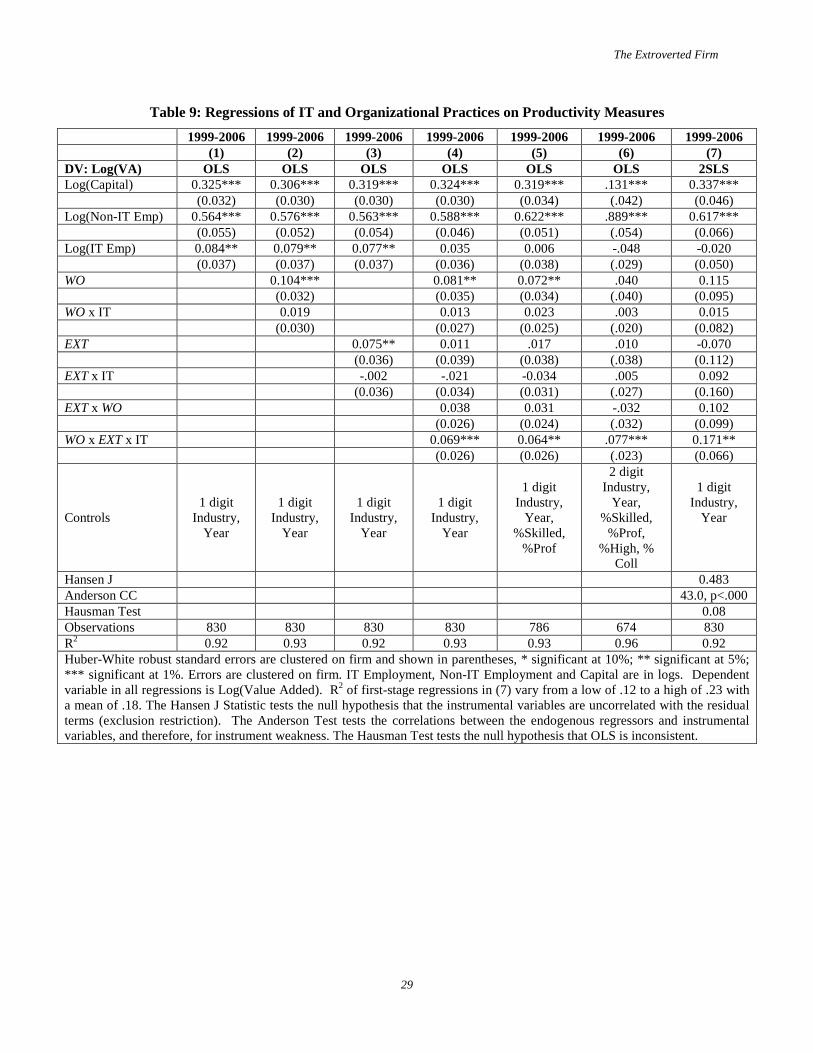
The Extroverted Firm
29
Table 9: Regressions of IT and Organizational Practices on Productivity Measures
1999-2006 1999-2006 1999-2006 1999-2006 1999-2006 1999-2006 1999-2006 (1) (2) (3) (4) (5) (6) (7) DV: Log(VA) OLS OLS OLS OLS OLS OLS 2SLS Log(Capital) 0.325*** 0.306*** 0.319*** 0.324*** 0.319*** .131*** 0.337*** (0.032) (0.030) (0.030) (0.030) (0.034) (.042) (0.046) Log(Non-IT Emp) 0.564*** 0.576*** 0.563*** 0.588*** 0.622*** .889*** 0.617*** (0.055) (0.052) (0.054) (0.046) (0.051) (.054) (0.066) Log(IT Emp) 0.084** 0.079** 0.077** 0.035 0.006 -.048 -0.020 (0.037) (0.037) (0.037) (0.036) (0.038) (.029) (0.050) WO 0.104*** 0.081** 0.072** .040 0.115 (0.032) (0.035) (0.034) (.040) (0.095) WO x IT 0.019 0.013 0.023 .003 0.015 (0.030) (0.027) (0.025) (.020) (0.082) EXT 0.075** 0.011 .017 .010 -0.070 (0.036) (0.039) (0.038) (.038) (0.112) EXT x IT -.002 -.021 -0.034 .005 0.092 (0.036) (0.034) (0.031) (.027) (0.160) EXT x WO 0.038 0.031 -.032 0.102 (0.026) (0.024) (.032) (0.099) WO x EXT x IT 0.069*** 0.064** .077*** 0.171** (0.026) (0.026) (.023) (0.066)
Controls 1 digit
Industry, Year
1 digit Industry,
Year
1 digit Industry,
Year
1 digit Industry,
Year
1 digit Industry,
Year, %Skilled,
%Prof
2 digit Industry,
Year, %Skilled, %Prof,
%High, % Coll
1 digit
Industry, Year
Hansen J 0.483 Anderson CC 43.0, p<.000 Hausman Test 0.08 Observations 830 830 830 830 786 674 830 R2 0.92 0.93 0.92 0.93 0.93 0.96 0.92 Huber-White robust standard errors are clustered on firm and shown in parentheses, * significant at 10%; ** significant at 5%; *** significant at 1%. Errors are clustered on firm. IT Employment, Non-IT Employment and Capital are in logs. Dependent variable in all regressions is Log(Value Added). R2 of first-stage regressions in (7) vary from a low of .12 to a high of .23 with a mean of .18. The Hansen J Statistic tests the null hypothesis that the instrumental variables are uncorrelated with the residual terms (exclusion restriction). The Anderson Test tests the correlations between the endogenous regressors and instrumental variables, and therefore, for instrument weakness. The Hausman Test tests the null hypothesis that OLS is inconsistent.

The Extroverted Firm
30
Table 10: Sensitivity Tests to Quasi-Fixed Organizational Assumptions
DV: Log(Value Added)
1999-2006 1999-2006 1999-2003 1999-2001 2002-2006
(1) (2) (3) (4) (5) Low Adj Cost High Adj Cost All All All Log(Capital) 0.294*** 0.341*** 0.305*** 0.322*** 0.322*** (0.063) (0.033) (0.036) (0.040) (0.032) Log(Non-IT Emp) 0.598*** 0.547*** 0.593*** 0.608*** 0.575*** (0.073) (0.056) (0.052) (0.073) (0.044) Log(IT Emp) 0.041 0.082 0.039 0.002 0.056 (0.056) (0.050) (0.040) (0.055) (0.037) EXT 0.003 -0.008 0.013 -0.001 0.019 (0.061) (0.050) (0.040) (0.048) (0.043) WO 0.041 0.117* 0.085** 0.088** 0.072* (0.060) (0.060) (0.037) (0.042) (0.037) EXT x WO 0.031 0.030 0.047 0.056* 0.025 (0.037) (0.054) (0.030) (0.029) (0.028) EXT x IT -0.031 -0.003 -0.046 -0.094* 0.011 (0.040) (0.045) (0.035) (0.055) (0.033) WO x IT 0.043 -0.070 0.019 0.031 .003 (0.041) (0.046) (0.031) (0.043) (0.026) WO x EXT x IT 0.058* 0.106*** 0.058** 0.094** 0.064** (0.030) (0.039) (0.029) (0.046) (0.026)
Controls 1 digit Industry,
Year 1 digit Industry,
Year 1 digit Industry,
Year 1 digit Industry,
Year 1 digit Industry
Year Observations 444 386 539 323 507 R-squared 0.92 0.95 0.92 0.91 0.95 Huber-White robust standard errors are clustered on firm and shown in parentheses, * significant at 10%; ** significant at 5%; *** significant at 1%.
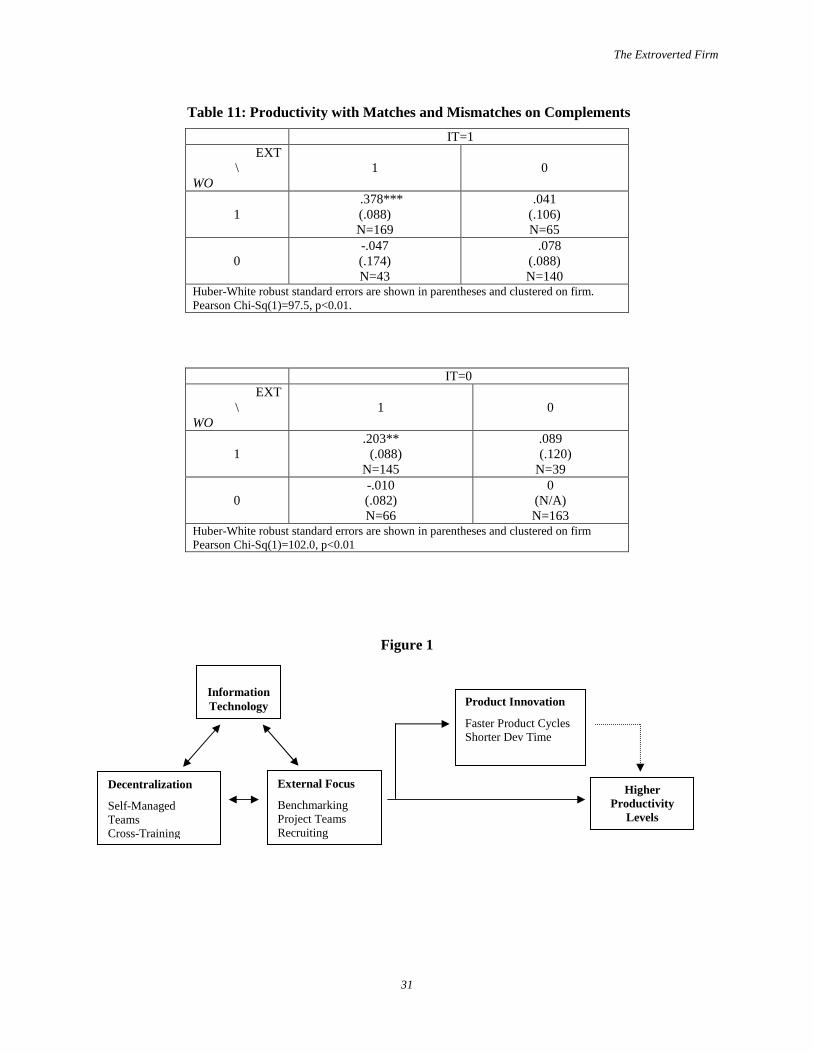
The Extroverted Firm
31
Table 11: Productivity with Matches and Mismatches on Complements
IT=1 EXT
\ WO
1
0
1
.378*** (.088) N=169
.041 (.106) N=65
0
-.047 (.174) N=43
.078 (.088) N=140
Huber-White robust standard errors are shown in parentheses and clustered on firm. Pearson Chi-Sq(1)=97.5, p<0.01.
IT=0 EXT
\ WO
1
0
1
.203** (.088) N=145
.089 (.120) N=39
0
-.010 (.082) N=66
0 (N/A) N=163
Huber-White robust standard errors are shown in parentheses and clustered on firm Pearson Chi-Sq(1)=102.0, p<0.01
Figure 1
Product Innovation
Faster Product Cycles Shorter Dev Time
External Focus
Benchmarking Project Teams Recruiting
Decentralization
Self-Managed Teams Cross-Training
Higher Productivity
Levels
InformationTechnology
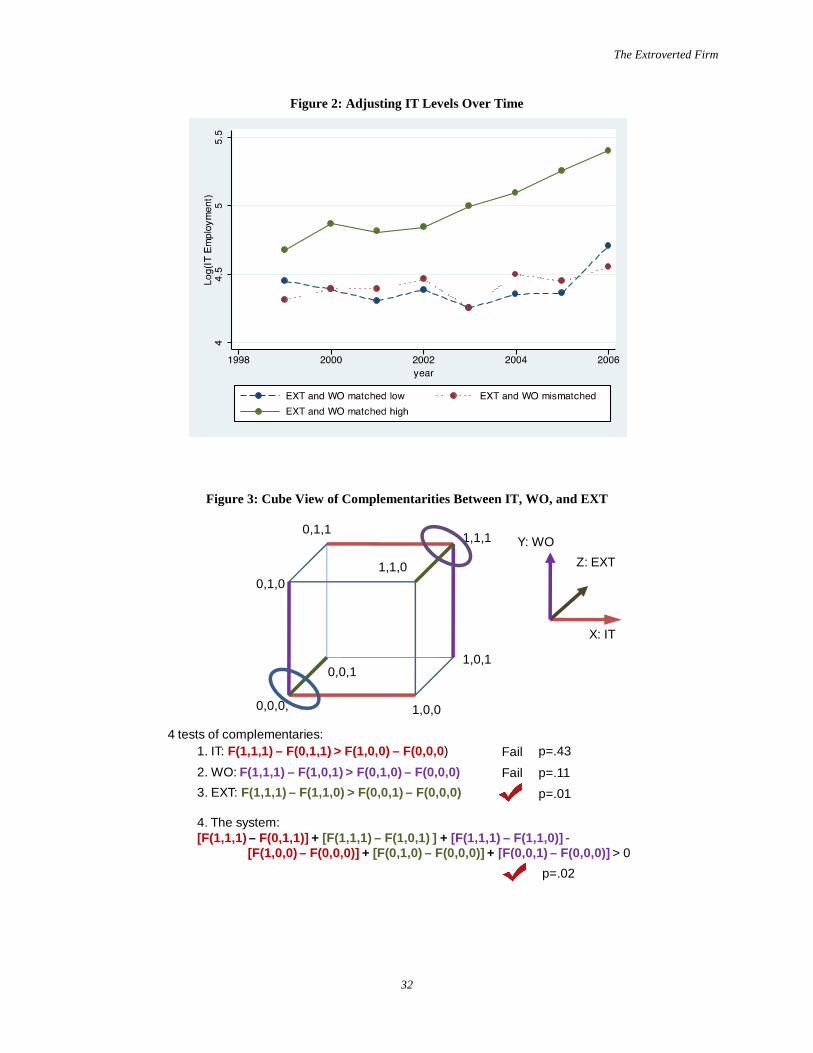
The Extroverted Firm
32
Figure 2: Adjusting IT Levels Over Time
Figure 3: Cube View of Complementarities Between IT, WO, and EXT
1,1,1
1,0,1
1,1,0
0,1,1
1,0,0
0,0,1
0,1,0
0,0,0,
1. IT: F(1,1,1) – F(0,1,1) > F(1,0,0) – F(0,0,0)
X: IT
Y: WO
Z: EXT
4 tests of complementaries:p=.43
2. WO: F(1,1,1) – F(1,0,1) > F(0,1,0) – F(0,0,0)
4. The system: [F(1,1,1) – F(0,1,1)] + [F(1,1,1) – F(1,0,1) ] + [F(1,1,1) – F(1,1,0)] -
[F(1,0,0) – F(0,0,0)] + [F(0,1,0) – F(0,0,0)] + [F(0,0,1) – F(0,0,0)] > 0
p=.02
p=.013. EXT: F(1,1,1) – F(1,1,0) > F(0,0,1) – F(0,0,0)
p=.11
Fail
Fail
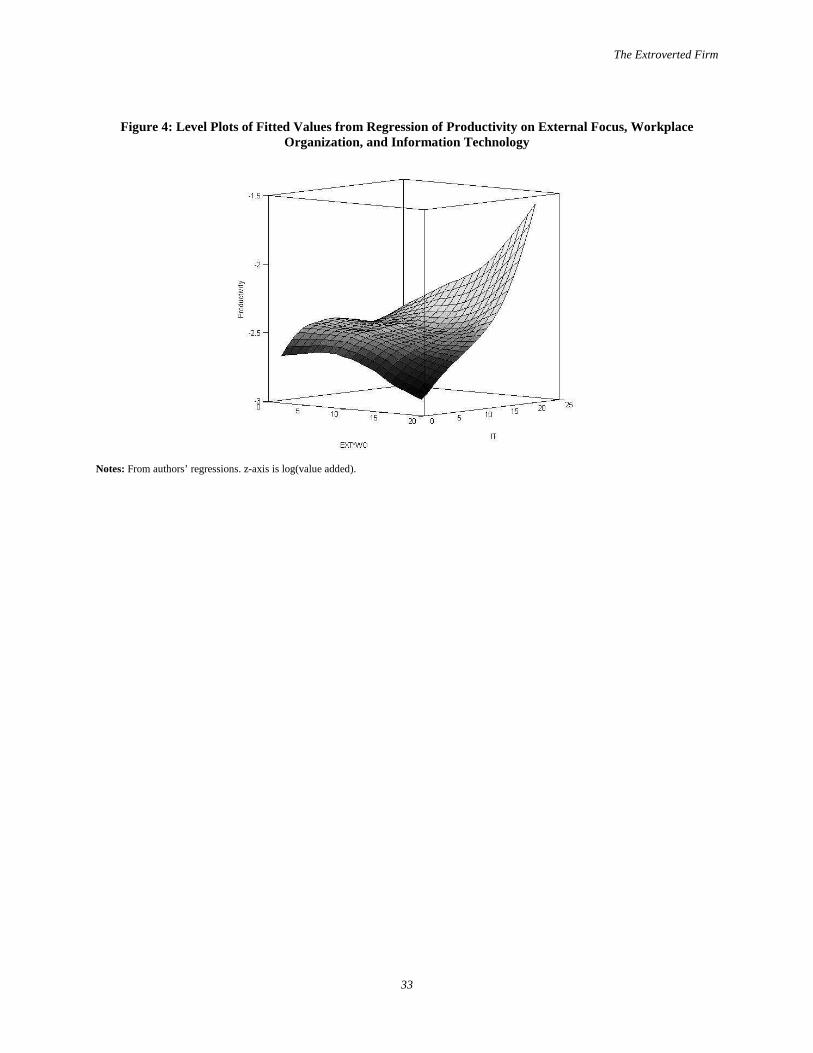
The Extroverted Firm
33
Figure 4: Level Plots of Fitted Values from Regression of Productivity on External Focus, Workplace Organization, and Information Technology
Notes: From authors’ regressions. z-axis is log(value added).
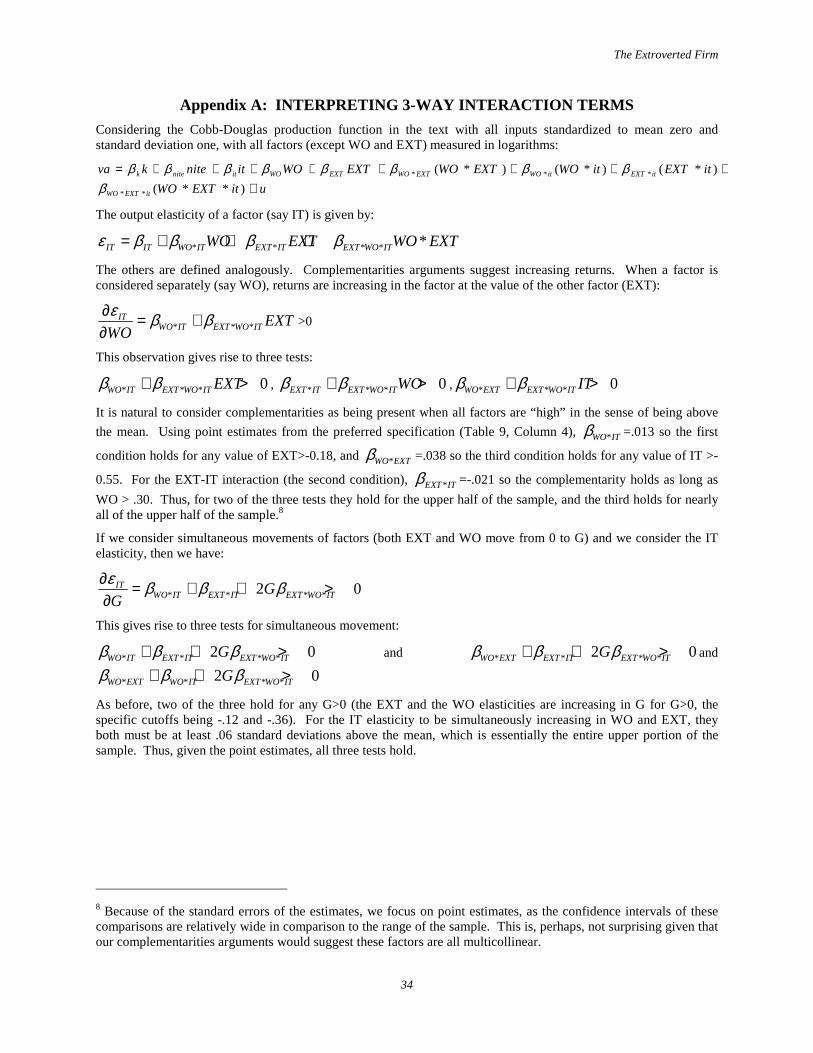
The Extroverted Firm
34
Appendix A: INTERPRETING 3-WAY INTERACTION TERMS
Considering the Cobb-Douglas production function in the text with all inputs standardized to mean zero and standard deviation one, with all factors (except WO and EXT) measured in logarithms:
The output elasticity of a factor (say IT) is given by:
* * * * *IT IT WO IT EXT IT EXT WO ITWO EXT WO EXTε β β β β= + + +
The others are defined analogously. Complementarities arguments suggest increasing returns. When a factor is considered separately (say WO), returns are increasing in the factor at the value of the other factor (EXT):
* * *IT
WO IT EXT WO IT EXTWO
ε β β∂ = +∂
>0
This observation gives rise to three tests:
* * * 0WO IT EXT WO IT EXTβ β+ > , * * * 0EXT IT EXT WO ITWOβ β+ > , * * * 0WO EXT EXT WO IT ITβ β+ >
It is natural to consider complementarities as being present when all factors are “high” in the sense of being above
the mean. Using point estimates from the preferred specification (Table 9, Column 4), *WO ITβ =.013 so the first
condition holds for any value of EXT>-0.18, and *WO EXTβ =.038 so the third condition holds for any value of IT >-
0.55. For the EXT-IT interaction (the second condition), *EXT ITβ =-.021 so the complementarity holds as long as
WO > .30. Thus, for two of the three tests they hold for the upper half of the sample, and the third holds for nearly all of the upper half of the sample.8
If we consider simultaneous movements of factors (both EXT and WO move from 0 to G) and we consider the IT elasticity, then we have:
* * * *2 0ITWO IT EXT IT EXT WO ITG
G
ε β β β∂ = + + >∂
This gives rise to three tests for simultaneous movement:
* * * *2 0WO IT EXT IT EXT WO ITGβ β β+ + > and * * * *2 0WO EXT EXT IT EXT WO ITGβ β β+ + > and
* * * *2 0WO EXT WO IT EXT WO ITGβ β β+ + >
As before, two of the three hold for any G>0 (the EXT and the WO elasticities are increasing in G for G>0, the specific cutoffs being -.12 and -.36). For the IT elasticity to be simultaneously increasing in WO and EXT, they both must be at least .06 standard deviations above the mean, which is essentially the entire upper portion of the sample. Thus, given the point estimates, all three tests hold.
8 Because of the standard errors of the estimates, we focus on point estimates, as the confidence intervals of these comparisons are relatively wide in comparison to the range of the sample. This is, perhaps, not surprising given that our complementarities arguments would suggest these factors are all multicollinear.
uitEXTWO
itEXTitWOEXTWOEXTWOitnitekva
itEXTWO
itEXTitWOEXTWOEXTWOitnitek
+++++++++=
)**(
)*()*()*(
**
***
βββββββββ
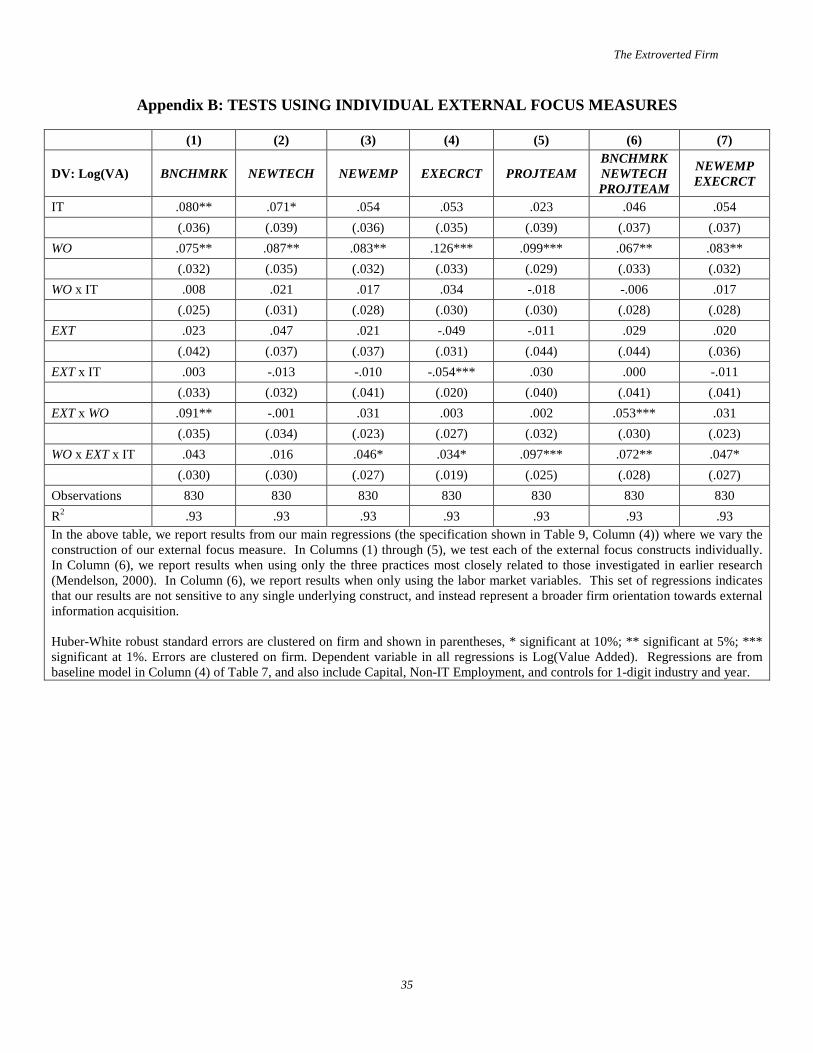
The Extroverted Firm
35
Appendix B: TESTS USING INDIVIDUAL EXTERNAL FOCUS M EASURES
(1) (2) (3) (4) (5) (6) (7)
DV: Log(VA) BNCHMRK NEWTECH NEWEMP EXECRCT PROJTEAM BNCHMRK NEWTECH PROJTEAM
NEWEMP EXECRCT
IT .080** .071* .054 .053 .023 .046 .054
(.036) (.039) (.036) (.035) (.039) (.037) (.037)
WO .075** .087** .083** .126*** .099*** .067** .083**
(.032) (.035) (.032) (.033) (.029) (.033) (.032)
WO x IT .008 .021 .017 .034 -.018 -.006 .017
(.025) (.031) (.028) (.030) (.030) (.028) (.028)
EXT .023 .047 .021 -.049 -.011 .029 .020
(.042) (.037) (.037) (.031) (.044) (.044) (.036)
EXT x IT .003 -.013 -.010 -.054*** .030 .000 -.011
(.033) (.032) (.041) (.020) (.040) (.041) (.041)
EXT x WO .091** -.001 .031 .003 .002 .053*** .031
(.035) (.034) (.023) (.027) (.032) (.030) (.023)
WO x EXT x IT .043 .016 .046* .034* .097*** .072** .047*
(.030) (.030) (.027) (.019) (.025) (.028) (.027)
Observations 830 830 830 830 830 830 830
R2 .93 .93 .93 .93 .93 .93 .93 In the above table, we report results from our main regressions (the specification shown in Table 9, Column (4)) where we vary the construction of our external focus measure. In Columns (1) through (5), we test each of the external focus constructs individually. In Column (6), we report results when using only the three practices most closely related to those investigated in earlier research (Mendelson, 2000). In Column (6), we report results when only using the labor market variables. This set of regressions indicates that our results are not sensitive to any single underlying construct, and instead represent a broader firm orientation towards external information acquisition. Huber-White robust standard errors are clustered on firm and shown in parentheses, * significant at 10%; ** significant at 5%; *** significant at 1%. Errors are clustered on firm. Dependent variable in all regressions is Log(Value Added). Regressions are from baseline model in Column (4) of Table 7, and also include Capital, Non-IT Employment, and controls for 1-digit industry and year.


![SARF-IRF 2014 EXPOSE Chief TAMBE OK2 [Mode de compatibilité]](https://img.pdfslide.net/doc/110x75/587fcbf91a28ab3b158b7341/sarf-irf-2014-expose-chief-tambe-ok2-mode-de-compatibilite.jpg)