Embed Size (px)
Citation preview
Fossil Hominin Ulnae and the Forelimb of Paranthropus
Henry M. McHenry,1* Cassandra C. Brown,1 and Lindsay J. McHenry2
1Department of Anthropology, University of California, Davis, CA 956162Department of Geosciences, University of Wisconsin, Milwaukee, WI 53201
KEY WORDS early Homo; ulnae; Paranthropus; Australopithecus; Olduvai
ABSTRACT The discovery of Pan in the Middle Pleis-tocene deposits of the Kapthurin Formation of the TugenHills (McBrearty and Jablonski: Nature 437 (2005) 105–108) inspires new interest in the search for other chim-panzee fossils in the East African Rift Valley. Cranio-dental evidence of an eastward excursion of chimpanzeepopulations in the Plio-Pleistocene goes undetected inother hominin sites, but one enigmatic postcranial fossil,the Olduvai Hominid 36 ulna, has many chimp-like fea-tures. Analyses by Aiello et al. (Aiello et al.: Am J PhysAnthropol 109 (1999) 89–110) reveal that it is similar toextant Pan in some respects, but it also has unique traitsnot seen in other hominoid species. They refer it to Para-nthropus boisei. In this study, we reassess the affinitiesof OH 36 using a different data set that includes morerecently discovered hominin fossils including those
attributed to Paranthropus. Despite its superficial resem-blance to modern Pan, our results agree with those ofAiello et al. (Aiello et al.: Am J Phys Anthropol 109(1999) 89–110) that OH 36 is distinctly different frommodern chimpanzees. By default, it is reasonable toassign this specimen to P. boisei, but it is not at all simi-lar to other ulnae referred to this genus. Ulnae attributedto Paranthropus from South Africa, Kenya, and Ethiopiaare morphologically more heterogeneous than thosewithin species of large-bodied Hominoidea. Although thereare many apparent shared derived traits justifying amonophyletic Paranthropus clade, most if not all of thesetraits are related to a single functional complex (hyper-mastication) that may have evolved in parallel andthereby constituting a paraphyletic group of species. AmJ Phys Anthropol 134:209–218, 2007. VVC 2007 Wiley-Liss, Inc.
In 1970 M. Mutala discovered Olduvai Hominid 36ulna in situ from site SC in Upper Bed II, Olduvai Gorge,Tanzania. Its superficial morphology reminds one of achimpanzee, but there was no craniodental evidence ofthat ape at that site. In 2005 McBrearty and Jablonskiannounced the discovery of Pan in the Middle Pleistocenedeposits of the Kapthurin Formation of the Tugen Hills(McBrearty and Jablonski, 2005). That discovery inspiresnew interest in the search for other chimpanzee fossils inthe East African Rift Valley. Superficially, OH 36 doeslook chimp-like, but detailed analysis by Aiello et al.(1999) show that it is outside the range of modern chim-panzee variation. They point out a few features that dis-tinguish it from modern chimpanzees. They also showthat its morphology (as described by 21 variables) clus-ters with extant chimps on discriminant Functions 1, 2,and 3, that account for 97% of the variance. However, ondiscriminant Function 4, OH 36 projects in a unique way.That unique projection on discriminant Function 4,
however, may be because they entered the fossils in theirstudy (OH 36, Omo L40-19, and KNM-BK 66) as a fifthgroup in the calculation of discriminant analysis (theother groups being human, chimpanzees, gorillas, andorangutans). The effect of entering the fossils as a groupinto the calculation of the discriminant functions is tocreate a function that maximally separates that groupfrom others. With 21 variables and only three membersof the fossil group, the discriminant analysis will likelyfind a unique individual profile within the group thatmaximally separates it from other groups. With fossilulnae, there is a distinct lack of homogeneity which isan additional problem with lumping them into a group.Possible problems with previous analyses and the
recent discovery of chimps in the Pleistocene of the EastAfrican Rift Valley inspire a fresh look. The purpose ofthis study is to test the hypothesis that OH 36 repre-
sents further evidence of eastward excursion of chimpsinto habitats occupied by hominids. The study by Aielloet al. (1999) found that OH 36 had a unique morphologyamong hominoids that they attributed to the enigmaticbody of Paranthropus. This study also addresses theuniqueness of Paranthropus in the ulnae of both easternand southern African variants of that genus in the con-text of other Plio-Pleistocene specimens including thoseattributed to Australopithecus afarensis, A. africanus,and Homo erectus.
MATERIALS AND METHODS
The Olduvai Hominid 36 ulna comes from site SC inUpper Bed II above Tuff IID where M. Mutala recoveredit in situ in 1970. Despite its paleoanthropological signif-icance, Olduvai Bed II remains poorly dated, but ongoinggeochronological work at Olduvai (McHenry, 2004, 2005)informs understanding of Upper Bed II. Tuff IF (at itsbase, 1.74 6 0.016, (Walter et al., 1992) and Tuff IIA(the boundary between Lower and Middle Bed II, belowthe disconformity, 1.71 Ma, (Curtis and Hay, 1972)) havebeen dated successfully using the 40Ar/39Ar and K-Ar
Grant sponsor: Committee of Research, University of California,Davis.
*Correspondence to: Henry M. McHenry, Department of Anthro-pology, One Shields Ave, University of California, Davis, CA 95616,USA. E-mail: [email protected]
Received 7 February 2007; accepted 23 April 2007
DOI 10.1002/ajpa.20656Published online 27 June 2007 in Wiley InterScience
(www.interscience.wiley.com).
VVC 2007 WILEY-LISS, INC.
AMERICAN JOURNAL OF PHYSICAL ANTHROPOLOGY 134:209–218 (2007)
systems. However, no high-quality radiometric datesare available for materials above this level. Manega’s(1993, unpublished) date of 1.48 6 0.05 Ma for Tuff IIDwas a weighted average of SCLF dates for 5 feldspargrains ranging in age from 1.18 6 0.17 to 1.82 6 0.09Ma in a contaminated sample, and thus may not beaccurate.Other attempts to constrain the age of Upper Bed II
relied on magnetostratigraphy and sedimentation rates.Hay’s (1976) estimated age for the top of Bed II (*1.1Ma) was based on stratal thickness between the end ofthe Olduvai event at the base of the Lower Bed IILemuta Member and the Brunhes/Matuyama polaritytransition within Bed IV above Tuff IVB. Cerling andHay (1986) recalculated the age (using a newer decayconstant for potassium) as *1.2 Ma. Several studies(Aiello et al., 1999; Kimura, 1999, 2002), have appliedthese dates to the Olduvai paleoanthropological record.Applying Berggren et al.’s (1995) dates for the end of theOlduvai event (1.67 Ma then, 1.77 Ma now) and theBrunhes/Matuyama transition (0.73 Ma then, 0.78 Manow) would yield older ages: 1.28 Ma for the Bed II/IIItransition and 1.35 Ma for Tuff IID. Using Tamratet al.’s (1995) proposed magnetostratigraphy (where thereversal event in Bed IV is interpreted as the Jaramillo)in the same calculation yields ages of 1.34 Ma for theBed II/III transition and 1.4 Ma for Tuff IID. Sedimenta-tion rates are likely unreliable for Olduvai, as it isuncertain how much time is missing at the disconform-ities. Both Tuffs IF and IIA lie below the disconformityand \faunal break" between Lower and Middle Bed II(Hay, 1976). The disconformity between Beds II and IIImay also represent an extended time of nondeposition.Sedimentation rates may have varied over time, chang-ing with changes in depositional environment and cli-mate. A combination of these factors could lead to unreli-able age estimates based on stratal thickness alone.Another attempt to date the transition between Beds
II and III relies on tectonic history. A major episode ofregional faulting is dated elsewhere in the Tanzanianrift region between 1.25 and 1.2 Ma (Macintyre et al.,1974). This could correspond to the disconformity andchange in drainage observed at Olduvai at the contactbetween Beds II and III (Hay, 1976). This correlation isstill uncertain, and should be tested using other geochro-nological techniques.The Bed II/Bed III transition is most likely older than
1.15 Ma, but could be considerably older. The OH 36ulna, therefore, is at least half a million years older thanthe fossils attributed to Pan in the Kapthurin Formationof Kenya (McBrearty and Jablonski, 2005).With the kind permission of the Tanzanian govern-
ment, M.D. Leakey and R.E.F. Leakey, one of us (HMM)examined the Olduvai Hominid 36 ulna in 1974 as partof a larger study of 289 primate ulnae with a particularemphasis on Omo L40-19 (McHenry et al., 1976). Sincethere was no published description, the 1976 publicationdid not report on OH 36. What follows are fresh analysesof the data from that study plus new data from fossilsdiscovered since 1974. These include the well preservedA.L. 438-1a, which is thoroughly described by Drapeauet al. (2005), the Stw 431 specimen that is part of theassociated A. africanus skeleton of Stw 431 (McHenryand Berger, 1998; Toussaint et al., 2003), the isolatedSterkfontein ulnae Stw 113, 398, and 380 (Senut andTobias, 1989; Menter, 2002), the H. erectus ulna KNM-BK 66 (Senut, 1981; Solan and Day, 1992), the ulna
attributed to Paranthropus, SKX 8761 (Susman, 1988,1989) and the ulnae associated with the partial skeletonof A. afarensis, A.L. 288-1 n, o, t, & u (Johanson et al.,1982).The comparative sample, described in McHenry et al.
(1976), includes 73 Homo sapiens, 61 Pan troglodytes, 71Gorilla gorilla (both G. g. gorilla and G. g. beringei) and32 Pongo pygmaeus. We exclude the P. paniscus samplebecause of its small sample size. This study does notinclude the distal width (measurement 3 in McHenry etal., 1976) because the distal end is missing in most ofthe fossils. These measurements are similar to thosereported in Aiello et al. (1999) except that study addsolecranon breadth (both articular and maximum), troch-lear notch subtense, coronoid breadth and length to thepronator quadratus. The means of the comparative sam-ple appear in Table 1 and the measurements of the fos-sils in Table 2.The analyses include both raw measurements and
size-standardized variables. Size-standardization followsthe usual procedures as described in Aiello et al. (1999)that involve the formation of shape variables by dividingeach measurement of each specimen by that specimen’sgeometric mean. We follow Aiello et al.’s (1999) lead inremoving ulnar length as a variable in our discriminantanalysis; the extreme magnitude of the variable as com-pared with the much smaller proximal ulna measure-ments may have a large effect on the outcome of theanalysis. For the multiple discriminant analyses we usethe software available in SPSS 14.0.This study proceeds through four steps. First, it tests
the effects of entering fossils as a group in discriminantanalysis. One of the assumptions of discriminant analy-sis is group homogeneity, which is clearly violated by theheterogeneous nature of the fossil sample. It also hasthe effect of maximally separating the groups that areidentified. With only three members of the fossil groupand with more than four times that many variables,experience shows that an individual profile of each mem-ber of the group artificially defines an axis that sepa-rates that group from the others. The first analysis ofthis study does a common-sense test of grouping of threespecimens (like three dissimilar fossil ulnae), equivalentto the number of fossils used in our 12 variable discrimi-nant analysis, by randomly selecting three specimensfrom the comparative sample, entering them as a groupinto the discriminant analysis, and seeing how \unique"they appear in four dimensions calculated by the dis-criminant analysis.
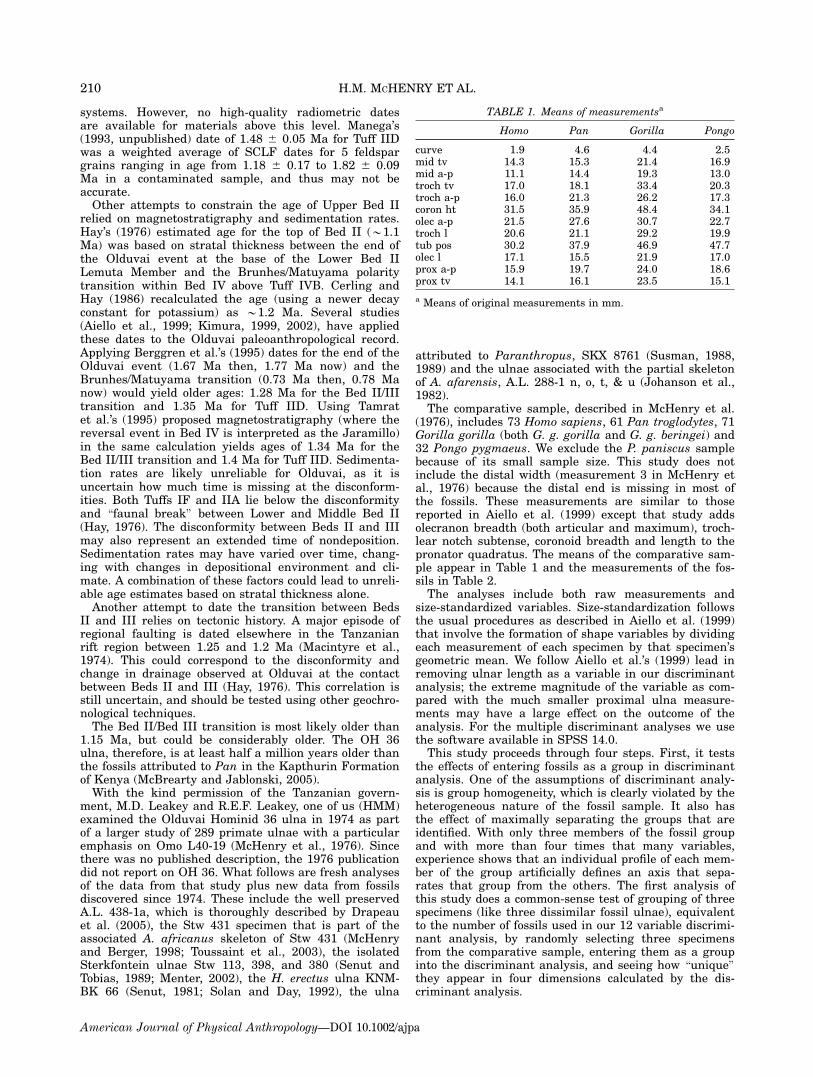
TABLE 1. Means of measurementsa
Homo Pan Gorilla Pongo
curve 1.9 4.6 4.4 2.5mid tv 14.3 15.3 21.4 16.9mid a-p 11.1 14.4 19.3 13.0troch tv 17.0 18.1 33.4 20.3troch a-p 16.0 21.3 26.2 17.3coron ht 31.5 35.9 48.4 34.1olec a-p 21.5 27.6 30.7 22.7troch l 20.6 21.1 29.2 19.9tub pos 30.2 37.9 46.9 47.7olec l 17.1 15.5 21.9 17.0prox a-p 15.9 19.7 24.0 18.6prox tv 14.1 16.1 23.5 15.1
a Means of original measurements in mm.
210 H.M. MCHENRY ET AL.
American Journal of Physical Anthropology—DOI 10.1002/ajpa
The second step calculates the three dimensional spacethat maximally separates the four species of the compar-ative sample using raw and shape variables with the fos-sils entered as a second sample and not as a group thatdefines the multidimensional discriminant space. Thefossils are projected into the space defined by the threeaxes that maximally separate the comparative samples.This is a conservative approach to rejecting the hypothe-sis that OH 36 is indistinguishable from the projectionsof known chimps because the fossil plays no role in thecalculation of that space.The third step in this analysis uses the discriminant
scores from the second set of analyses to calculate dis-tances between the average projections of the chimpan-zee sample in multiple discriminant space (the chimp\centroid") and individuals. This further addresses thequestion of chimp affinities of OH 36 and reveals aninteresting pattern among the fossils.Finally, the study examines the morphometrical affin-
ities of OH 36 among species of the comparative sampleand an expanded sample of fossil hominids. To includeless complete fossil hominids, it is necessary to reducethe number of measurements to those describing onlythe proximal end of the ulna. These include measure-ments numbers 6–14 of McHenry et al. (1976). We usethese measurements in a discriminant analysis similarto that in step two as well as calculating the distancesbetween 1,000 randomly selected pairs within compara-tive species to elucidate the fossils’ affinities.
RESULTS AND DISCUSSION
Part I—Grouping methods in discriminantanalysis
At first glance, an observer might notice the strong re-semblance between OH 36 and the ulnae of chimpan-zees. Its shaft curvature, the form of its trochlear notch,its projecting coracoid process, and the shape of its olec-ranon process recall familiar features of Pan. Its discov-ery in 1970 from Upper Bed II of Olduvai Gorge causeda great deal of informal discussion about its chimp-likequalities. Perhaps its lack of human-like features despiteits presumed age (greater than 1.15 Ma) delayed its for-mal description until 1999 (Aiello et al., 1999). Its formaldescription began with a superb paper presented byAiello (1995) at the 64th Annual Meeting of the Ameri-can Association of Physical Anthropologists in Oakland,
California. There its chimpanzee qualities received spe-cial attention, but the subsequent publication carefullypointed out how uniquely different the fossil appeared tobe. Part of its uniqueness was its projection in discrimi-nant space defined by four groups of extant hominoidsplus a fifth group defined by three fossils (OH 36, OmoL40-19 and KNM-BK 66).The unique projection of the fossil group in Aiello et
al. (1999)’s study does not dispel all doubt about OH 36’schimpanzee affinities, however, because of the nature ofmultiple discriminant analysis. That study entered afifth group into the calculation of the discriminant analy-sis comprised of the three most complete fossil homininulnae (OH 36, Omo L40-19, and KNM-BK 66). The effectof entering this fifth group is to force the analysis to finda fourth function that can separate it from the others.Uniqueness may thereby be established artificiallybecause of the nature of the multivariate method.The first step in our analysis tests the effects of enter-
ing a small group of specimens by randomly selectingthree specimens from the comparative sample and enter-ing them as a fifth group in the calculation of discrimi-nant space. Figure 1 displays a representative result. Inthis case the three randomly selected specimens hap-pened to be one chimp and two gorillas; all resulting dis-criminant functions were statistically significant. Dis-criminant Functions 1–3 classified them correctly, butFunction 4 (the vertical axis in Fig. 1) removed them toa unique position. There are unmistakable resemblanceswith this figure and figures 3C and 4C of Aiello et al.(1999) that report their fourth discriminant functionthat shows the uniqueness of the fossils. Similar resultsoccurred either with raw or shape variables and withdifferent random samples. The power of discriminantanalysis to distinguish a small group entered into thecalculation of discriminant space distorts reality. With 13measurements and only three members of the group, themethod will find a discriminant function that will maxi-mally separate the group, but it is most likely an indi-vidual profile of each specimen rather than a character-istic of the group. The analyses have no difficulty findinga discriminant function that uniquely characterizes asmall group, but this does not imply anything that ismeaningful biologically. Experience shows that withenough variables, one can distinguish any groups thatare entered into the calculations of the discriminantspace. There are disadvantages of not entering the fos-sils into the calculation of discriminant space, of course.
TABLE 2. Plio-Pleistocene hominin fossil ulnae and measurementsa
Fossil Omo L40-19 OH 36 A.L. 438-1 A.L. 288-1 STW 431 STW 380 STW 398 SKX 8761 STW 113 BK 66
length 313.0 274.0 268.0curve 4.8 5.0 2.0mid tv 17.9 16.1 14.5mid a-p 14.2 16.1 17.4troch tv 21.1 16.7 16.4 12.9 17.9 15.6 13.3 17.2a 16.0 19.5troch a-p 21.2 23.2 16.8 12.7 18.0 15.8 15.5 14.4a 17.6 16.1coron ht 37.8 35.6 31.5 22.3 34.0a 29.2 27.9 25.5 31.5 27.2olec a-p 30.5 33.2 25.0a 18.7 26.7 22.5a 22.0 22.3 24.5 24.0troch l 23.4 18.5 24.2a 15.6 20.3b 18.7 16.9 13.2 20.2 18.5tub pos 40.2 34.7 38.0 24.6 39.6 31.9 33.6 25.5a 39.3 31.0olec l 16.4 23.1 20.0 14.0 18.0 16.3 15.1 17.5 17.3 14.6prox a-p 17.8 21.0 19.2 13.7 15.8 13.8 17.9a 15.1 15.8 17.0prox tv 21.5 18.4 16.9 12.5 15.1 15.5 14.1a 13.7 14.9 15.5
a Measurements of fossil hominin ulnae used. Refer to McHenry (1976) for measurement definitions.b Measurement based on reconstruction
211HOMININ ULNAE
American Journal of Physical Anthropology—DOI 10.1002/ajpa
Most obviously is that their morphological uniquenessgoes unrepresented. Aiello et al. (1999) found that thediscriminant function responsible for separating the fos-sils was correlated with absolutely large maximumwidths of the pronator crest and relatively small mini-mum diameters of the ulnar crest.
Part II—Discriminant analysis of fossilhominin ulnae
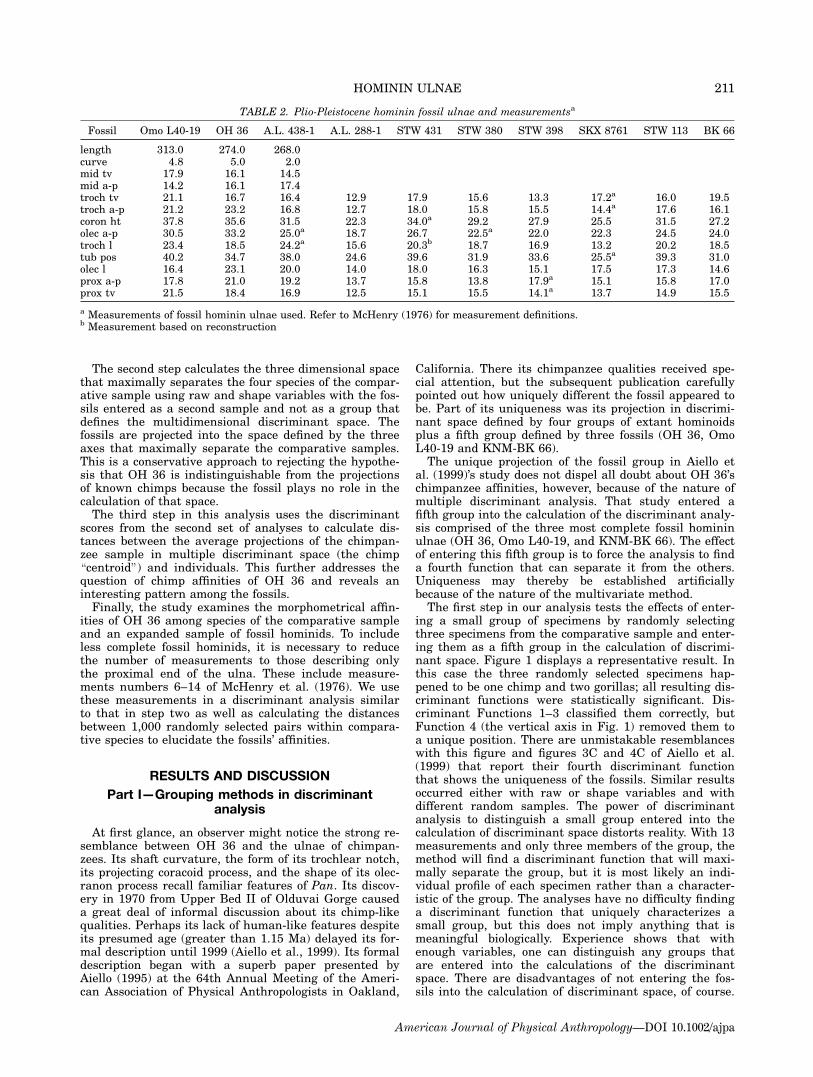
Figure 2A plots the first two discriminant functionsusing 12 raw variables and entering the fossils as a sec-ond sample that did not enter into the calculation of thefunctions. Function 1 (accounting for 48.2% of the totalvariance) separates Gorilla from other species in thecomparative sample and from the fossils. The outstand-ing feature of the Gorilla ulna is its massively widetrochlea in the mediolateral direction (measurement no.6 of McHenry et al., 1976), but the measurements highly,and positively, correlated with Function 1 also includemost of the proximal dimensions of the ulna (refer to Ta-ble 3). OH 36 projects more negatively on this functionthan any chimps and most humans because of its verysmall transverse diameter of the trochlea. Omo L40-19falls within in the Pan distribution and AL 438 falls atthe upper edge of the Homo distribution. Function 2, re-sponsible for 31.6% of the variance, acts to maximallyseparate Pan from the rest of the comparative sample.The most highly correlated measurement with this func-tion is the depth of curvature of the ulnar shaft (mea-surement no. 2 of McHenry et al., 1976). Both Omo L40-19 and OH 36 project near Pan and outside the Homorange. A.L. 438-1 is within the upper limits of the Homorange. Other variables positively correlated with thisfunction include the anterior-posterior diameter of thetrochlea and olecranon.
Figure 2B is the plot of Functions 1 & 3 (accountingfor 20.2% of the total variance) that acts to maximallyseparate Pongo and shows the fossils projecting outsidethe range of most Pongo and Gorilla specimens, butwithin the Pan and Homo space. By far the most highlycorrelated measurement with the third discriminantfunction is the length from the center of the tuberosityto the center of the trochlea (measurement no. 11 inMcHenry et al., 1976) which is large in Pongo. In thediscriminant space defined by these three discriminantfunctions, OH 36 is closer to the chimp centroid than itis to any other species, but its Mahalanobis D2 valuefrom the chimp centroid (7.79) is higher than any chimpulna in the comparative sample. Omo L40-19 projectsvery close to the chimp centroid (Mahalanobis D2 ¼3.09), a distance that is nearer than 10 of the chimpspecimens in the comparative sample. The visualimpression that A.L. 438-1 is rather human-like agreeswith its projection closer to the human centroid (Mahala-nobis D2 ¼ 6.56) than it is to any other species centroid;
Fig. 1. Discriminant Scores from Functions 1 & 4 based on13 raw variables. Three cases were randomly selected andgrouped as Fossil. They have been additionally labeled withtheir original species classification for clarification. [Color figurecan be viewed in the online issue, which is available at www.interscience.wiley.com.]
Fig. 2. (A) Discriminant Scores from Functions 1 & 2 basedon 12 raw variables. (B) Discriminant Scores from Function 1 &3 based on 12 raw variables. [Color figure can be viewed in theonline issue, which is available at www.interscience.wiley.com.]
212 H.M. MCHENRY ET AL.
American Journal of Physical Anthropology—DOI 10.1002/ajpa
the Pan centroid is the next closest (MD2 ¼ 7.03). InAiello et al.’s (1999) study, OH 36 projects with chimpsin that it has an absolutely small transverse diameter ofthe trochlea, although it is heavily buttressed, and thatOH 36 has a large a-p diameter of the olecranon. Ouranalysis agrees with Aiello et al.’s in that it indicatesthat OH 36 projects with chimps due to its large ante-rior-posterior dimensions as well as by the small trans-verse diameter of OH 36’s trochlea. Both studies showthat OH 36 and Omo L40-19 project with chimps on thefunction correlated with depth of the shaft curvature.Figure 3A shows the distribution of discriminant
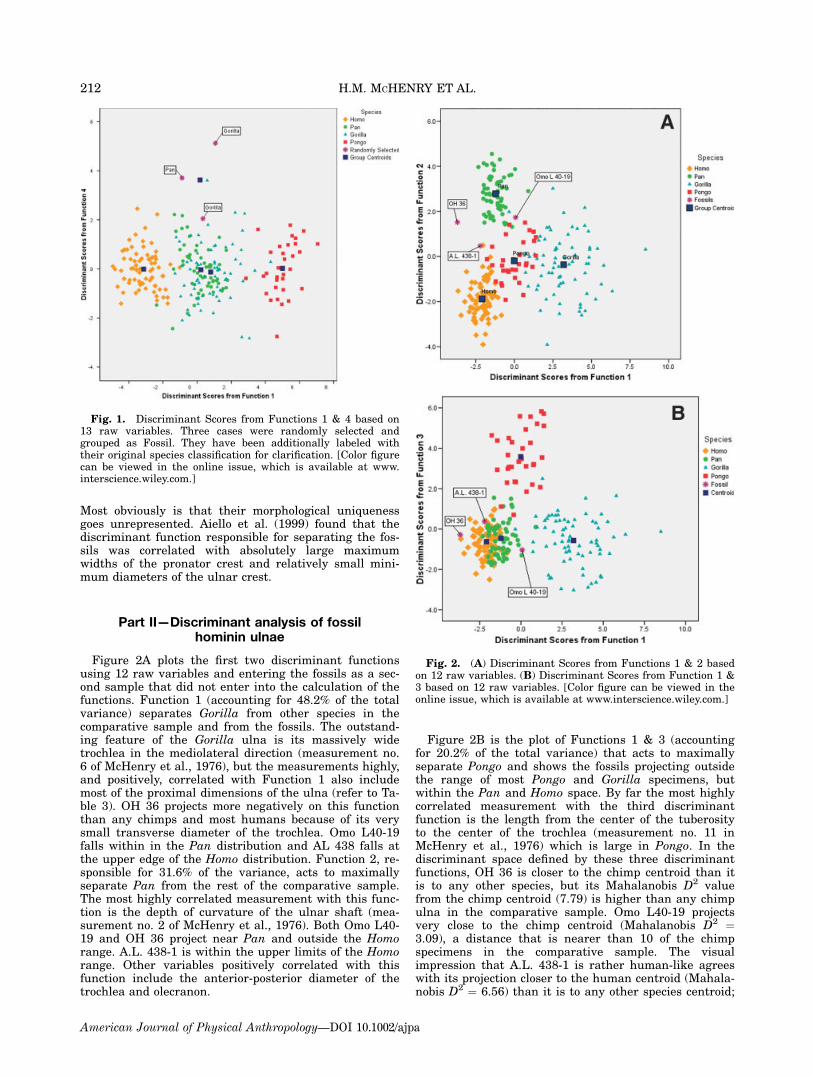
scores using the size corrected data. The first function(accounting for 45.3% of the variance) separates Homofrom Pan. Like the results from the raw measurementanalysis, a highly correlated measurement with thisfunction is the depth of curvature of the shaft, which islarge in chimps and small in Homo particularly in rela-tion to Pan’s relatively abbreviated olecranon lengths(measurement no. 12 in McHenry et al., 1976). Othermeasurements that are correlated with this function, allnegatively, are trochlear length, transverse width of theshaft and height of the coronoid (refer to Table 3). Allthese features are larger relatively in Homo than inPan. Omo L40-19 falls within the Pan distribution onthis function and OH 36 right outside. AL 438-1 is at theedge of the Homo distribution but still within it. Func-tion 2 separates the human and chimp samples fromthose of Gorilla and Pongo and accounts for 29.1% of thetotal variance. As with Function 1 of the analysis usingraw measurements, it is the exceptional width of thetrochlea (measurement no. 6 in McHenry et al., 1976)that is highly (in this case, negatively) correlated with
this function. The most positively correlated variable onthis function is the anteroposterior diameter of the olec-ranon (measurement no. 9 in McHenry et al., 1976). Thea-p diameter of the trochlea is also correlated. The threefossils project with the humans and chimps and not withgorillas and orangs. Although there are differences,these results are generally in agreement with previouslypublished analyses. Figure 3B shows Function 3 (respon-sible for 25.5% of the variance) which separates Pongofrom Gorilla primarily on the basis of Pongo’s largelength from the tuberosity to trochlea, a characteristicthat was also highly correlated in the raw measurementanalysis. Shaft dimensions are also correlated with thisfunction reflecting the fact that Pongo has relativelylarge anterior-posterior dimensions of the shaft at thetuberosity as compared with relatively small dimensionsat the tuberosity and antero-posterior dimensions at themidshaft.
TABLE 3. Correlations of predictor variables withdiscriminant functionsa
12 Variable Analysis Function
1 2 3
Based on Raw Datatroch tv 0.875 �0.097 �0.189prox tv 0.659 0.05 �0.252coron ht 0.618 0.081 �0.217tub pos 0.564 0.205 0.465troch a-p 0.546 0.266 �0.279mid a-p 0.545 0.17 �0.167mid tv 0.531 �0.018 �0.012troch 1 0.519 �0.055 �0.292prox a-p 0.457 0.185 �0.087olec l 0.407 �0.196 �0.129olec a-p 0.344 0.256 �0.205Curve 0.275 0.429 �0.193Based on Shape Dataolec l �0.54 0.146 0.154Curve 0.4 0.116 �0.077troch 1 �0.337 0.173 �0.045mid tv �0.264 �0.082 0.176coron ht �0.209 0.076 0.012troch tv �0.206 �0.494 �0.37olec a-p 0.001 0.293 0.146troch a-p 0.08 0.169 �0.047tub pos �0.045 �0.233 0.503prox a-p �0.053 0.104 0.206prox tv �0.119 �0.049 �0.147mid a-p 0.03 �0.032 �0.059
a Pooled within-groups correlations between discriminating vari-ables and standardized canonical discriminant functions. Varia-bles ordered by absolute size of correlation within function.
Fig. 3. (A) Discriminant Scores from Functions 1 & 2 basedon 12 size-corrected variables. (B) Discriminant Scores fromFunctions 1 & 3 based on 12 size-corrected variables. [Color fig-ure can be viewed in the online issue, which is available atwww.interscience.wiley.com.]
213HOMININ ULNAE
American Journal of Physical Anthropology—DOI 10.1002/ajpa
These results agree with those of Aiello et al.’s (1999)in that OH 36 also projects with chimps on the functioncorrelated with depth of shaft curvature when size iscontrolled. Omo L40-19 is somewhere in between theHomo and Pan distribution in the 1999 study whereas inours it is securely within the Pan distribution. Bothstudies show OH 36 projecting with chimps again (or inour study Homo & chimp) due to small transverse troch-lea width and a large anterior-posterior olecranonheight. Our results are also in agreement with Drapeauet al. (2005) and Aiello et al.’s (1999) findings that withinmultiple discriminant space defined by a comparativesample of Homo, Pan, Gorilla, Pongo, and fossil homi-nids, OH 36 and Omo L40-19 do not project with Gorillanor Pongo. Drapeau et al. (2005) find the projection ofA.L. 438-1 more Homo-like than ape-like as do our anal-yses. Many of the proximal ulna characteristics separat-ing apes from humans have functional interpretationsand the position of the fossils in the discriminant analy-sis may reflect on locomotion or use of the forearm.These are well summarized and discussed in Aiello et al.(1999) and Aiello and Dean (1990). Our results are inagreement with Aiello et al.’s (1999) in that OH 36’s rel-atively large a-p diameter of the trochlea and olecranon,as well as curvature indicate a more powerful forearmthan seen in modern humans and many other fossilhominids.In Aiello et al. (1999) and Drapeau et al. (2005) all dis-
criminant axes save one (that defined by fossil homi-nids), show OH 36 to be rather chimp-like. Omo L40-19is not clearly linked to any modern comparator, but it ischaracterized as Homo-like by Drapeau et al. (2005) andis intermediate between chimps and Homo in Aiello et al.(1999). But in the current analysis the discriminantspace is defined by the variability within the compara-tive sample with no contribution to the calculations ofthat space by the fossils. This inspires a third step totest the hypothesis that OH 36 represents a chimpanzeein the Pleistocene of the East African Rift Valley.
Part III—Fossil distance and intraspecificcomparative distances
In the multidimensional space defined by the compara-tive sample, OH 36 and Omo L40-19 are quite close toappearing chimp-like in their projections on discriminantFunctions 1–3 using either raw measurements or size-standardized measurements. But are they really chimp-like within this space defined by 12 variables adjustedappropriately for intercorrelations as Mahalanobis(1936) and Fisher (1936) rightfully advocated?We test this in a conservative way. We calculate the
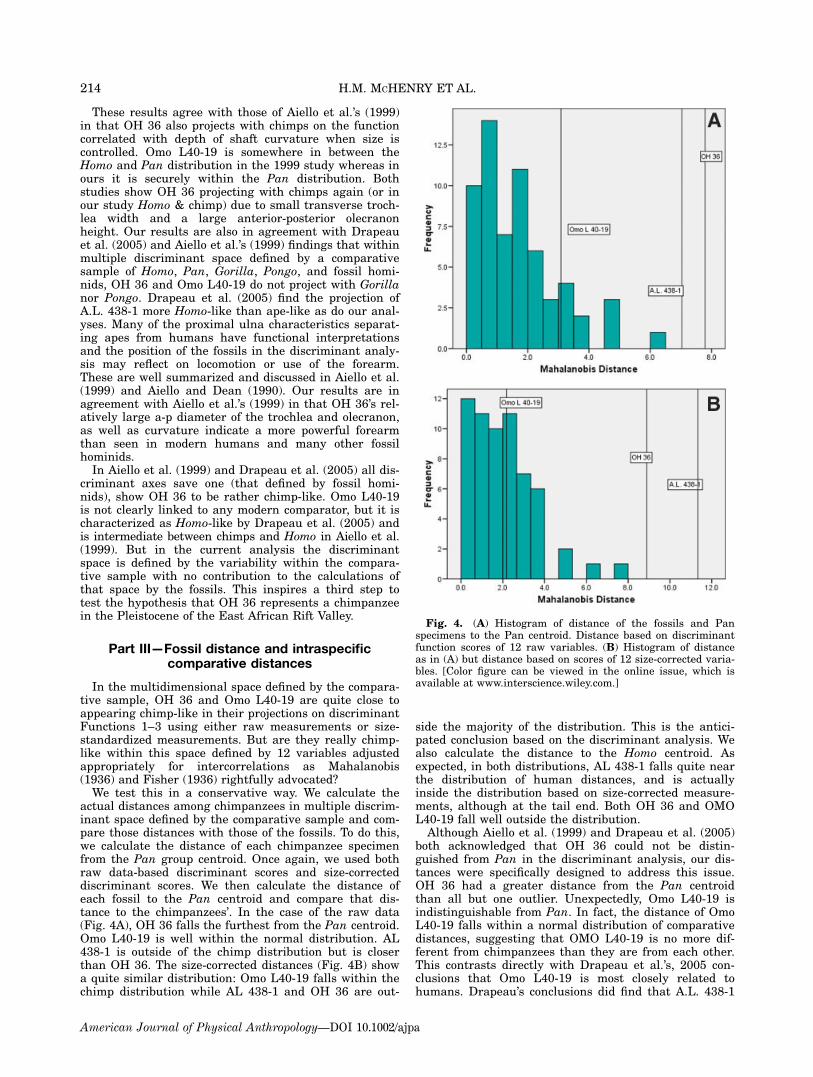
actual distances among chimpanzees in multiple discrim-inant space defined by the comparative sample and com-pare those distances with those of the fossils. To do this,we calculate the distance of each chimpanzee specimenfrom the Pan group centroid. Once again, we used bothraw data-based discriminant scores and size-correcteddiscriminant scores. We then calculate the distance ofeach fossil to the Pan centroid and compare that dis-tance to the chimpanzees’. In the case of the raw data(Fig. 4A), OH 36 falls the furthest from the Pan centroid.Omo L40-19 is well within the normal distribution. AL438-1 is outside of the chimp distribution but is closerthan OH 36. The size-corrected distances (Fig. 4B) showa quite similar distribution: Omo L40-19 falls within thechimp distribution while AL 438-1 and OH 36 are out-
side the majority of the distribution. This is the antici-pated conclusion based on the discriminant analysis. Wealso calculate the distance to the Homo centroid. Asexpected, in both distributions, AL 438-1 falls quite nearthe distribution of human distances, and is actuallyinside the distribution based on size-corrected measure-ments, although at the tail end. Both OH 36 and OMOL40-19 fall well outside the distribution.Although Aiello et al. (1999) and Drapeau et al. (2005)
both acknowledged that OH 36 could not be distin-guished from Pan in the discriminant analysis, our dis-tances were specifically designed to address this issue.OH 36 had a greater distance from the Pan centroidthan all but one outlier. Unexpectedly, Omo L40-19 isindistinguishable from Pan. In fact, the distance of OmoL40-19 falls within a normal distribution of comparativedistances, suggesting that OMO L40-19 is no more dif-ferent from chimpanzees than they are from each other.This contrasts directly with Drapeau et al.’s, 2005 con-clusions that Omo L40-19 is most closely related tohumans. Drapeau’s conclusions did find that A.L. 438-1
Fig. 4. (A) Histogram of distance of the fossils and Panspecimens to the Pan centroid. Distance based on discriminantfunction scores of 12 raw variables. (B) Histogram of distanceas in (A) but distance based on scores of 12 size-corrected varia-bles. [Color figure can be viewed in the online issue, which isavailable at www.interscience.wiley.com.]
214 H.M. MCHENRY ET AL.
American Journal of Physical Anthropology—DOI 10.1002/ajpa
is most similar to Homo; our results agree: AL 438-1 issimilar enough to humans to fall within the normal dis-tribution, but neither Omo L40-19 nor OH 36 is withinthe human range. Omo L40-19 projects among the chim-panzees and OH 36 is unique.
Part IV—Discriminant analysis and bootstrappingof OH 36’s taxonomic affinities
The apparent uniqueness of OH 36 among extant hom-inoids provokes the question of taxonomic attributionamong extinct hominids. Aiello et al. (1999) point outthat the site from which it derives, SC in Upper Bed II,Olduvai Gorge, Tanzania, also contained a homininmolar and two incisors (OH 38) that have been attrib-uted to cf. P. boisei (Leakey, 1978). The only other homi-nin species from Upper Bed II is H. erectus as repre-sented by OH 9 (Leakey, 1961). Since OH 36 is decidedlyunlike other early Homo ulnae (e.g. KNM-WT 15000,KNM-BK 66), it is reasonable to assign it to P. boisei.A less complete fossil ulna from Swartkrans Member
1, South Africa, SKX 8761, is also attributed to Para-nthropus (Susman, 1988, 1989), although to the speciesrobustus, and not boisei. Does this specimen share theunusual characteristics of its con-generic cousin to thenorth?To answer this we conduct a final set of analyses using
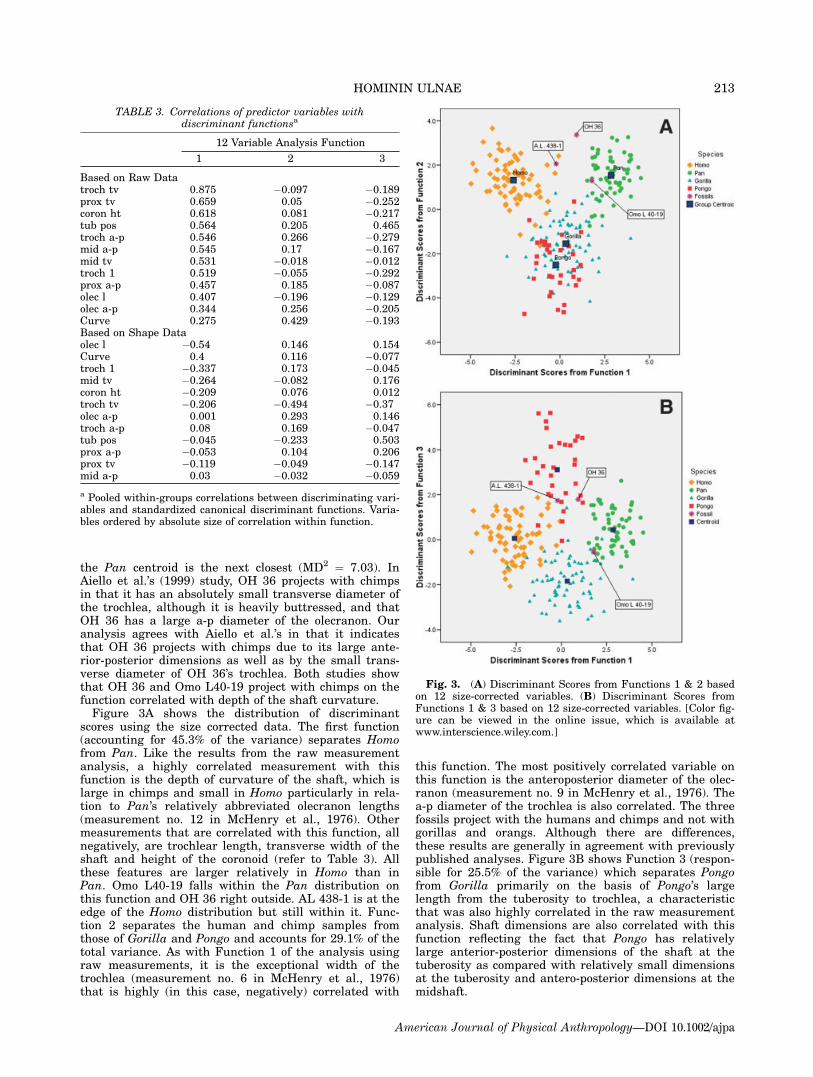
SKX 8761 and other less complete fossil ulnae for whichonly 9 of the original 12 measurements are possible (nos.6–13 in McHenry et al., 1976). The additional fossilsinclude the Stw 431 specimen that is part of the associ-ated A. africanus skeleton of Stw 431 (McHenry andBerger, 1998; Menter, 2002; Toussaint et al., 2003), theisolated Sterkfontein Australopithecus africanus ulnaeStw 113, 398, and 380 (Senut and Tobias, 1989; Menter,2002), the H. erectus ulna KNM-BK 66 (Senut, 1981;Solan and Day, 1992), the ulna attributed to Paranthro-pus robustus, SKX 8761 (Susman, 1988, 1989) and theassociated partial skeleton of A. afarensis, A.L. 288-1 n,o, t, & u (Johanson et al., 1982).Figure 5A plots discriminant Function 1 (accounting
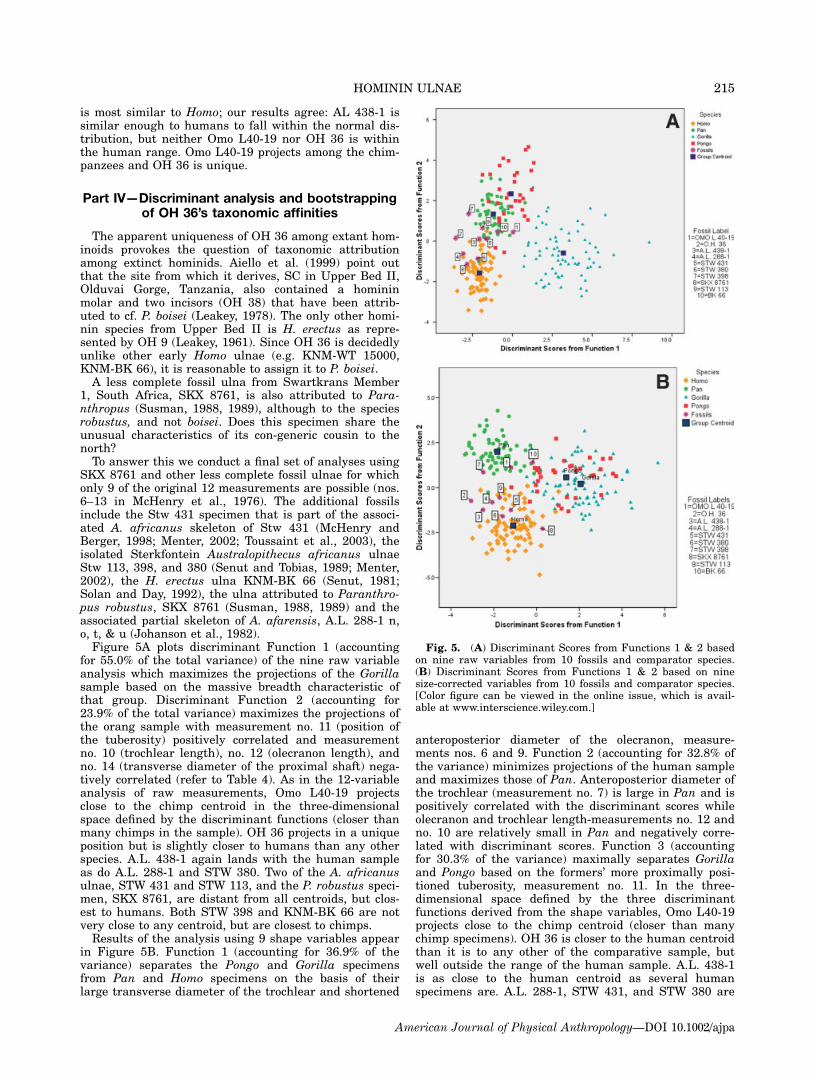
for 55.0% of the total variance) of the nine raw variableanalysis which maximizes the projections of the Gorillasample based on the massive breadth characteristic ofthat group. Discriminant Function 2 (accounting for23.9% of the total variance) maximizes the projections ofthe orang sample with measurement no. 11 (position ofthe tuberosity) positively correlated and measurementno. 10 (trochlear length), no. 12 (olecranon length), andno. 14 (transverse diameter of the proximal shaft) nega-tively correlated (refer to Table 4). As in the 12-variableanalysis of raw measurements, Omo L40-19 projectsclose to the chimp centroid in the three-dimensionalspace defined by the discriminant functions (closer thanmany chimps in the sample). OH 36 projects in a uniqueposition but is slightly closer to humans than any otherspecies. A.L. 438-1 again lands with the human sampleas do A.L. 288-1 and STW 380. Two of the A. africanusulnae, STW 431 and STW 113, and the P. robustus speci-men, SKX 8761, are distant from all centroids, but clos-est to humans. Both STW 398 and KNM-BK 66 are notvery close to any centroid, but are closest to chimps.Results of the analysis using 9 shape variables appear
in Figure 5B. Function 1 (accounting for 36.9% of thevariance) separates the Pongo and Gorilla specimensfrom Pan and Homo specimens on the basis of theirlarge transverse diameter of the trochlear and shortened
anteroposterior diameter of the olecranon, measure-ments nos. 6 and 9. Function 2 (accounting for 32.8% ofthe variance) minimizes projections of the human sampleand maximizes those of Pan. Anteroposterior diameter ofthe trochlear (measurement no. 7) is large in Pan and ispositively correlated with the discriminant scores whileolecranon and trochlear length-measurements no. 12 andno. 10 are relatively small in Pan and negatively corre-lated with discriminant scores. Function 3 (accountingfor 30.3% of the variance) maximally separates Gorillaand Pongo based on the formers’ more proximally posi-tioned tuberosity, measurement no. 11. In the three-dimensional space defined by the three discriminantfunctions derived from the shape variables, Omo L40-19projects close to the chimp centroid (closer than manychimp specimens). OH 36 is closer to the human centroidthan it is to any other of the comparative sample, butwell outside the range of the human sample. A.L. 438-1is as close to the human centroid as several humanspecimens are. A.L. 288-1, STW 431, and STW 380 are
Fig. 5. (A) Discriminant Scores from Functions 1 & 2 basedon nine raw variables from 10 fossils and comparator species.(B) Discriminant Scores from Functions 1 & 2 based on ninesize-corrected variables from 10 fossils and comparator species.[Color figure can be viewed in the online issue, which is avail-able at www.interscience.wiley.com.]
215HOMININ ULNAE
American Journal of Physical Anthropology—DOI 10.1002/ajpa
nearer the human centroid than any other. STW 398 iswidely separated from any centroid but is closest tochimps. KNM-BK 66 and SKX 8761 project in uniqueways, but the former is closer to the chimp centroid thanit is to any other and the latter is closer to the humancentroid than it is to any other.We address the question of how distant each fossil is
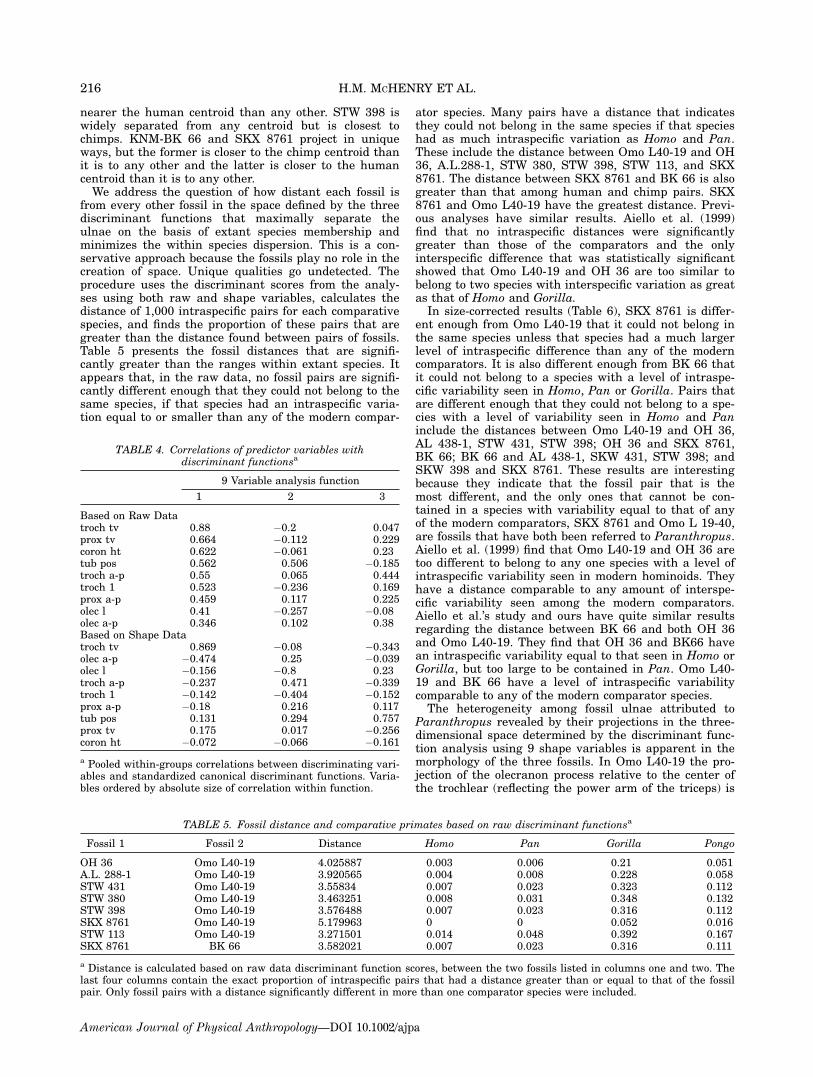
from every other fossil in the space defined by the threediscriminant functions that maximally separate theulnae on the basis of extant species membership andminimizes the within species dispersion. This is a con-servative approach because the fossils play no role in thecreation of space. Unique qualities go undetected. Theprocedure uses the discriminant scores from the analy-ses using both raw and shape variables, calculates thedistance of 1,000 intraspecific pairs for each comparativespecies, and finds the proportion of these pairs that aregreater than the distance found between pairs of fossils.Table 5 presents the fossil distances that are signifi-cantly greater than the ranges within extant species. Itappears that, in the raw data, no fossil pairs are signifi-cantly different enough that they could not belong to thesame species, if that species had an intraspecific varia-tion equal to or smaller than any of the modern compar-
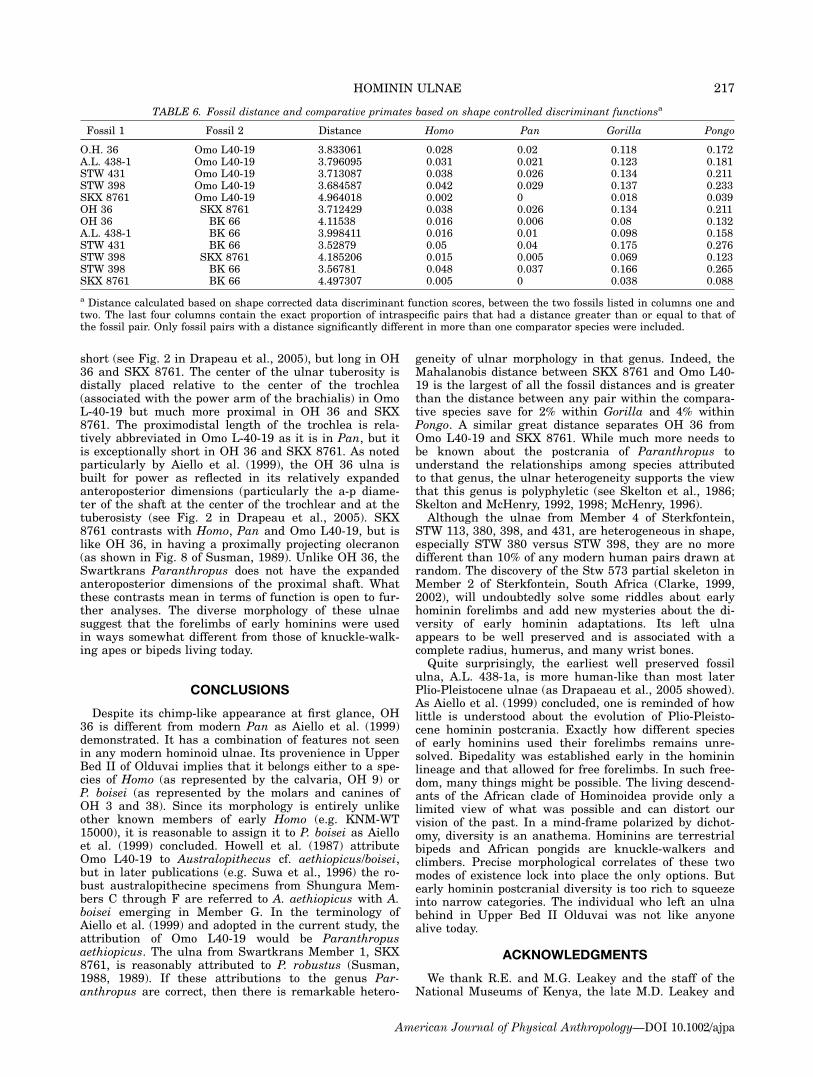
ator species. Many pairs have a distance that indicatesthey could not belong in the same species if that specieshad as much intraspecific variation as Homo and Pan.These include the distance between Omo L40-19 and OH36, A.L.288-1, STW 380, STW 398, STW 113, and SKX8761. The distance between SKX 8761 and BK 66 is alsogreater than that among human and chimp pairs. SKX8761 and Omo L40-19 have the greatest distance. Previ-ous analyses have similar results. Aiello et al. (1999)find that no intraspecific distances were significantlygreater than those of the comparators and the onlyinterspecific difference that was statistically significantshowed that Omo L40-19 and OH 36 are too similar tobelong to two species with interspecific variation as greatas that of Homo and Gorilla.In size-corrected results (Table 6), SKX 8761 is differ-
ent enough from Omo L40-19 that it could not belong inthe same species unless that species had a much largerlevel of intraspecific difference than any of the moderncomparators. It is also different enough from BK 66 thatit could not belong to a species with a level of intraspe-cific variability seen in Homo, Pan or Gorilla. Pairs thatare different enough that they could not belong to a spe-cies with a level of variability seen in Homo and Paninclude the distances between Omo L40-19 and OH 36,AL 438-1, STW 431, STW 398; OH 36 and SKX 8761,BK 66; BK 66 and AL 438-1, SKW 431, STW 398; andSKW 398 and SKX 8761. These results are interestingbecause they indicate that the fossil pair that is themost different, and the only ones that cannot be con-tained in a species with variability equal to that of anyof the modern comparators, SKX 8761 and Omo L 19-40,are fossils that have both been referred to Paranthropus.Aiello et al. (1999) find that Omo L40-19 and OH 36 aretoo different to belong to any one species with a level ofintraspecific variability seen in modern hominoids. Theyhave a distance comparable to any amount of interspe-cific variability seen among the modern comparators.Aiello et al.’s study and ours have quite similar resultsregarding the distance between BK 66 and both OH 36and Omo L40-19. They find that OH 36 and BK66 havean intraspecific variability equal to that seen in Homo orGorilla, but too large to be contained in Pan. Omo L40-19 and BK 66 have a level of intraspecific variabilitycomparable to any of the modern comparator species.The heterogeneity among fossil ulnae attributed to
Paranthropus revealed by their projections in the three-dimensional space determined by the discriminant func-tion analysis using 9 shape variables is apparent in themorphology of the three fossils. In Omo L40-19 the pro-jection of the olecranon process relative to the center ofthe trochlear (reflecting the power arm of the triceps) is
TABLE 4. Correlations of predictor variables withdiscriminant functionsa
9 Variable analysis function
1 2 3
Based on Raw Datatroch tv 0.88 �0.2 0.047prox tv 0.664 �0.112 0.229coron ht 0.622 �0.061 0.23tub pos 0.562 0.506 �0.185troch a-p 0.55 0.065 0.444troch 1 0.523 �0.236 0.169prox a-p 0.459 0.117 0.225olec l 0.41 �0.257 �0.08olec a-p 0.346 0.102 0.38Based on Shape Datatroch tv 0.869 �0.08 �0.343olec a-p �0.474 0.25 �0.039olec l �0.156 �0.8 0.23troch a-p �0.237 0.471 �0.339troch 1 �0.142 �0.404 �0.152prox a-p �0.18 0.216 0.117tub pos 0.131 0.294 0.757prox tv 0.175 0.017 �0.256coron ht �0.072 �0.066 �0.161
a Pooled within-groups correlations between discriminating vari-ables and standardized canonical discriminant functions. Varia-bles ordered by absolute size of correlation within function.
TABLE 5. Fossil distance and comparative primates based on raw discriminant functionsa
Fossil 1 Fossil 2 Distance Homo Pan Gorilla Pongo
OH 36 Omo L40-19 4.025887 0.003 0.006 0.21 0.051A.L. 288-1 Omo L40-19 3.920565 0.004 0.008 0.228 0.058STW 431 Omo L40-19 3.55834 0.007 0.023 0.323 0.112STW 380 Omo L40-19 3.463251 0.008 0.031 0.348 0.132STW 398 Omo L40-19 3.576488 0.007 0.023 0.316 0.112SKX 8761 Omo L40-19 5.179963 0 0 0.052 0.016STW 113 Omo L40-19 3.271501 0.014 0.048 0.392 0.167SKX 8761 BK 66 3.582021 0.007 0.023 0.316 0.111
a Distance is calculated based on raw data discriminant function scores, between the two fossils listed in columns one and two. Thelast four columns contain the exact proportion of intraspecific pairs that had a distance greater than or equal to that of the fossilpair. Only fossil pairs with a distance significantly different in more than one comparator species were included.
216 H.M. MCHENRY ET AL.
American Journal of Physical Anthropology—DOI 10.1002/ajpa
short (see Fig. 2 in Drapeau et al., 2005), but long in OH36 and SKX 8761. The center of the ulnar tuberosity isdistally placed relative to the center of the trochlea(associated with the power arm of the brachialis) in OmoL-40-19 but much more proximal in OH 36 and SKX8761. The proximodistal length of the trochlea is rela-tively abbreviated in Omo L-40-19 as it is in Pan, but itis exceptionally short in OH 36 and SKX 8761. As notedparticularly by Aiello et al. (1999), the OH 36 ulna isbuilt for power as reflected in its relatively expandedanteroposterior dimensions (particularly the a-p diame-ter of the shaft at the center of the trochlear and at thetuberosisty (see Fig. 2 in Drapeau et al., 2005). SKX8761 contrasts with Homo, Pan and Omo L40-19, but islike OH 36, in having a proximally projecting olecranon(as shown in Fig. 8 of Susman, 1989). Unlike OH 36, theSwartkrans Paranthropus does not have the expandedanteroposterior dimensions of the proximal shaft. Whatthese contrasts mean in terms of function is open to fur-ther analyses. The diverse morphology of these ulnaesuggest that the forelimbs of early hominins were usedin ways somewhat different from those of knuckle-walk-ing apes or bipeds living today.
CONCLUSIONS
Despite its chimp-like appearance at first glance, OH36 is different from modern Pan as Aiello et al. (1999)demonstrated. It has a combination of features not seenin any modern hominoid ulnae. Its provenience in UpperBed II of Olduvai implies that it belongs either to a spe-cies of Homo (as represented by the calvaria, OH 9) orP. boisei (as represented by the molars and canines ofOH 3 and 38). Since its morphology is entirely unlikeother known members of early Homo (e.g. KNM-WT15000), it is reasonable to assign it to P. boisei as Aielloet al. (1999) concluded. Howell et al. (1987) attributeOmo L40-19 to Australopithecus cf. aethiopicus/boisei,but in later publications (e.g. Suwa et al., 1996) the ro-bust australopithecine specimens from Shungura Mem-bers C through F are referred to A. aethiopicus with A.boisei emerging in Member G. In the terminology ofAiello et al. (1999) and adopted in the current study, theattribution of Omo L40-19 would be Paranthropusaethiopicus. The ulna from Swartkrans Member 1, SKX8761, is reasonably attributed to P. robustus (Susman,1988, 1989). If these attributions to the genus Par-anthropus are correct, then there is remarkable hetero-
geneity of ulnar morphology in that genus. Indeed, theMahalanobis distance between SKX 8761 and Omo L40-19 is the largest of all the fossil distances and is greaterthan the distance between any pair within the compara-tive species save for 2% within Gorilla and 4% withinPongo. A similar great distance separates OH 36 fromOmo L40-19 and SKX 8761. While much more needs tobe known about the postcrania of Paranthropus tounderstand the relationships among species attributedto that genus, the ulnar heterogeneity supports the viewthat this genus is polyphyletic (see Skelton et al., 1986;Skelton and McHenry, 1992, 1998; McHenry, 1996).Although the ulnae from Member 4 of Sterkfontein,
STW 113, 380, 398, and 431, are heterogeneous in shape,especially STW 380 versus STW 398, they are no moredifferent than 10% of any modern human pairs drawn atrandom. The discovery of the Stw 573 partial skeleton inMember 2 of Sterkfontein, South Africa (Clarke, 1999,2002), will undoubtedly solve some riddles about earlyhominin forelimbs and add new mysteries about the di-versity of early hominin adaptations. Its left ulnaappears to be well preserved and is associated with acomplete radius, humerus, and many wrist bones.Quite surprisingly, the earliest well preserved fossil
ulna, A.L. 438-1a, is more human-like than most laterPlio-Pleistocene ulnae (as Drapaeau et al., 2005 showed).As Aiello et al. (1999) concluded, one is reminded of howlittle is understood about the evolution of Plio-Pleisto-cene hominin postcrania. Exactly how different speciesof early hominins used their forelimbs remains unre-solved. Bipedality was established early in the homininlineage and that allowed for free forelimbs. In such free-dom, many things might be possible. The living descend-ants of the African clade of Hominoidea provide only alimited view of what was possible and can distort ourvision of the past. In a mind-frame polarized by dichot-omy, diversity is an anathema. Hominins are terrestrialbipeds and African pongids are knuckle-walkers andclimbers. Precise morphological correlates of these twomodes of existence lock into place the only options. Butearly hominin postcranial diversity is too rich to squeezeinto narrow categories. The individual who left an ulnabehind in Upper Bed II Olduvai was not like anyonealive today.
ACKNOWLEDGMENTS
We thank R.E. and M.G. Leakey and the staff of theNational Museums of Kenya, the late M.D. Leakey and
TABLE 6. Fossil distance and comparative primates based on shape controlled discriminant functionsa
Fossil 1 Fossil 2 Distance Homo Pan Gorilla Pongo
O.H. 36 Omo L40-19 3.833061 0.028 0.02 0.118 0.172A.L. 438-1 Omo L40-19 3.796095 0.031 0.021 0.123 0.181STW 431 Omo L40-19 3.713087 0.038 0.026 0.134 0.211STW 398 Omo L40-19 3.684587 0.042 0.029 0.137 0.233SKX 8761 Omo L40-19 4.964018 0.002 0 0.018 0.039OH 36 SKX 8761 3.712429 0.038 0.026 0.134 0.211OH 36 BK 66 4.11538 0.016 0.006 0.08 0.132A.L. 438-1 BK 66 3.998411 0.016 0.01 0.098 0.158STW 431 BK 66 3.52879 0.05 0.04 0.175 0.276STW 398 SKX 8761 4.185206 0.015 0.005 0.069 0.123STW 398 BK 66 3.56781 0.048 0.037 0.166 0.265SKX 8761 BK 66 4.497307 0.005 0 0.038 0.088
a Distance calculated based on shape corrected data discriminant function scores, between the two fossils listed in columns one andtwo. The last four columns contain the exact proportion of intraspecific pairs that had a distance greater than or equal to that ofthe fossil pair. Only fossil pairs with a distance significantly different in more than one comparator species were included.
217HOMININ ULNAE
American Journal of Physical Anthropology—DOI 10.1002/ajpa
F.C. Howell, and D.C. Johanson and the staff of theCleveland Museum of Natural History and the Instituteof Human Origins, the staff of the National Museum ofEthiopia, C.K. Brain, F. Thackeray and the staff of theTransvaal Museum, P.V. Tobias and the staff of theDepartment of Anatomy and Human Biology, Universityof Witwatersrand, for permission to study the originalfossil material in their charge and for numerous kind-nesses. We also thank the staff of the Powell-CottonMuseum; M. Rutzmoser and staff of the Museum ofComparative Zoology, Harvard University; R. Thoringtonand the staff of the Division of Mammology, SmithsonianInstitution; D.J. Ortner and the staff of the Departmentof Anthropology, Smithsonian Institution; the staff of theMusee d’Afrique Centrale, Tervuren; R.D. Martin andthe staff of the Anthropologische Institut, Zurich; thelate W.W. Howells and the staff of the Peabody Museum,Harvard University; the staff of the Natur HistoriskaRismuseet, Stockholm; for many kindnesses and for per-mission to study the comparative material in theircharge. We thank J. Daniels and M. Grote for statisticalhelp; Leslie Aiello, Clark Larsen, an anonymousreviewer, Linda McHenry and Tim Weaver for valuablecomments.
LITERATURE CITED
Aiello L. 1995. An early hominid ulna (OH 36) from Bed II, Ol-duvai Gorge. Am J Phys Anthropol Suppl 20:55–56.
Aiello L, Dean C. 1990. An introduction to human evolutionaryanatomy. London: Academic Press.
Aiello LC, Wood B, Key C, Lewis M. 1999. Morphological andtaxonomic affinities of the Olduvai Ulna (OH 36). Am J PhysAnthropol 109:89–110.
Berggren WA, Hilgen FJ, Langereis CG, Kent DV, ObradovichJD, Raffi I, Raymo ME, Shackleton NJ. 1995. Late Neogenechronology: new perspectives in high-resolution stratigraphy.Geol Soc Am Bull 107:1272–1287.
Cerling TE, Hay RL. 1986. An isotopic study of paleosol carbo-nates from Olduvai Gorge. Quaternary Res 25:63–78.
Clarke RJ. 1999. Discovery of complete arm and hand of the 3.3million-year-old Australopithecus skeleton from Sterkfontein.S Afr J Science 96:477–480.
Clarke RJ. 2002. Newly revealed information on the Sterkfon-tein Member 2 Australopithecus skeleton. S Afr J Science98:523–526.
Curtis G, Hay R. 1972. Further geologic studies and K-Ar dat-ing at Olduvai Gorge and Ngorongoro Crater. In: Bishop WW,Miller JA, editors. Calibration of hominoid evolution. Edin-burgh: Scottish Academic Press. p 289–301.
Drapeau MSM, Ward CV, Kimbel WH, Johanson DC, Rak Y.2005. Associated cranial and forelimb remains attributed toAustralopithecus afarensis from Hadar, Ethiopia. J Hum Evol48:593–642.
Fisher RA. 1936. The use of multiple measurements in taxo-nomic problems. Ann Eugen 7:179–188.
Hay RL. 1976. Geology of the Olduvai Gorge. Berkeley: Univer-sity of California Press. p 289–301.
Howell FC, Haesaerts P, de Heinzelin J. 1987. Depositionalenvironments, archaeological occurences and hominids frommembers E and F of the Shungura Formation (Omo Basin,Ethiopia). J Hum Evol 16:665–700.
Johanson DC, Lovejoy CO, Kimbel WH, White TD, Ward SC,Bush ME, Latimer BM, Coppens Y. 1982. Morphology ofthe Pliocene partial hominid skeleton (A.L. 288-1) from theHadar Formation, Ethiopia. Am J Phys Anthropol 57:403–452.
Kimura Y. 1999. Tool-using strategies by early hominids at BedII, Olduvai Gorge, Tanzania. J Hum Evol 37:807–832.
Kimura Y. 2002. Examining time trends in the Oldowantechnology at Beds I and II, Olduvai Gorge. J Hum Evol 43:291–322.
Leakey LSB. 1961. New finds at Olduvai Gorge. Nature189:649–650.
Leakey MD. 1978. Olduvai Gorge 1911–1975: a history of theinvestigations. In: Bishop WW, editor. Geological background tofossil man. Edinburgh: Scottish Academic Press. p 151–155.
Macintyre RM, Mitchell JG, Dawson JB. 1974. Age of faultmovement in Tanzanian sector of East African Rift system.Nature 247:354–356.
Mahalanobis PC. 1936. On the generalized distance in statistics.Proc Natl Inst Sci India 2:49–55.
McBrearty S, Jablonski NG. 2005. First fossil chimpanzee.Nature 437:105–108.
McHenry HM. 1996. Homoplasy, clades and hominid phylogeny.In: Meikle WE, Howell FC, Jablonski NG, editors. Contempo-rary issues in human evolution. San Francisco: CaliforniaAcademy of Sciences. p 77–92.
McHenry HM, Berger LR. 1998. Body proportions in Australopi-thecus afarensis and A. africanus and the origin of the genusHomo. J Hum Evol 35:1–22.
McHenry HM, Corruccini RS, Howell FC. 1976. Analysis of anearly hominid ulna from the Omo Basin, Ethiopia. Am J PhysAnthropol 44:295–304.
McHenry LJ. 2004. Characterization and correlation of alteredPlio-Pleistocene tephra using a \multiple technique" approach:case study at Olduvai Gorge, Tanzania [Ph.D. thesis]. RutgersUniversity, Piscataway, NJ.
McHenry LJ. 2005. Phenocryst composition as a tool for corre-lating fresh and altered tephra, Bed I, Olduvai Gorge, Tanza-nia. Stratigraphy 2:101–115.
Menter CG. 2002. Hominid distal humeri, proximal radii andproximal ulnae from Sterkfontein, in comparison with theelbow bones of other Plio-Pleistocene fossil hominids [Ph.D.thesis]. University of Witwatersrand, Johannesburg.
Senut B. 1981. L’Humerus et Ses Articulations Chez les Homi-nides Plio-Pleistocenes. Paris: Cahiers De Paleontologie.
Senut B, Tobias PV. 1989. A preliminary examination of somenew hominid upper limb remains from Sterkfontein (1974–1984). Paleontology 308:565–571.
Skelton RR, McHenry HM. 1992. Evolutionary relationshipsamong early hominids. J Hum Evol 23:309–349.
Skelton RR, McHenry HM. 1998. Trait list bias and a reap-praisal of early hominid phylogeny. J Hum Evol 34:109–113.
Skelton RR, McHenry HM, Drawhorn GM. 1986. Phylogeneticanalysis of early hominids. Curr Anthropol 27:21–43.
Solan M, Day MH. 1992. The Baringo (Kapthurin) ulna. J HumEvol 22:307–313.
Susman RL. 1988. New postcranial remains from Swartkransand their bearing on the functional morphology and behaviorof Paranthropus robustus. In: Grine FE, editor. Evolutionaryhistory of the \robust" Australopithecines. New York: Aldinede Gruyter. p149–174.
Susman RL. 1989. New hominid fossils from the Swartkransformation (1979–1986 excavations): postcranial specimens.Am J Phys Anthropol 79:451–474.
Suwa G, White TD, Howell FC. 1996. Mandibular postcaninedentition from the Shungura Formation, Ethiopia: crown mor-phology, taxonomic allocations, and Plio-Pleistocene hominidevolution. Am J Phys Anthropol 101:247–282.
Tamrat E, Thouveny N, Taieb M, Opdyke ND. 1995. Revisedmagnetostratigraphy of the Plio-Pleistocene sedimentarysequence of the Olduvai Formation (Tanzania). PalaeogeogrPalaeoclimatol Palaeoecol 114:273–283.
Toussaint M, Macho GA, Tobias PV, Partridge TC, Hughes AR.2003. The third partial skeleton of late Pliocene hominin (Stw431) from Sterkfontein, South Africa. S Afr J Science 99:215–223.
Walter RC, Manega PC, Hay RL. 1992. Tephrochronology of BedI, Olduvai Gorge: an application of laser-fusion 40Ar/39Ardating to calibrating biological and climatic change. Quater-nary Int 13–14:37–46.
218 H.M. MCHENRY ET AL.
American Journal of Physical Anthropology—DOI 10.1002/ajpa