Embed Size (px)
Citation preview
Abu Dhabi Competitiveness Report 2016Fostering economic growth & social well-being for the Emirate of Abu Dhabi
Abu Dhabi Competitiveness Report 20162 Abu Dhabi Competitiveness Report 2016 3
FOREWORD 5
ACKNOWLEDGMENTS 8
COAD AND THE MISSION TO IMPROVE COMPETITIVENESS 10
EXECUTIVE SUMMARY 12
GLOBAL TRENDS AND REGIONAL CONTEXT 16
ABU DHABI REGIONAL COMPETITIVENESS MODEL PILLARS 20
OUTCOMES—KEY OBJECTIVES OF COMPETITIVENESS POLICIES 22
INPUTS—UNDERLYING DRIVERS OF FUTURE COMPETITIVENESS 26
OUTPUTS—EARLY INDICATORS OF FUTURE COMPETITIVENESS 36
THE NEAR TERM COMPETITIVENESS AGENDA 48
TECHNICAL NOTES 50
CONTENTS
Competitiveness in Abu Dhabi is about creating the sustainable environment that enables the Emirate’s enterprises and its people to realize their full productive potential

Abu Dhabi Competitiveness Report 20164 Abu Dhabi Competitiveness Report 2016 5
Abu Dhabi has always sought to adopt best practices and enablers to enhance Abu Dhabi’s competitiveness regionally and internationally; under the leadership of H.H.Sheikh Khalifa bin Zayed Al Nahyan, The President of the United Arab Emirates; and with the vision and guidance of H.H. Sheikh Mohamed bin Zayed Al Nahyan, Crown Prince of Abu Dhabi, Deputy Supreme Commander of the UAE Armed Forces and Chairman of the Abu Dhabi Executive Council.
The Abu Dhabi Government is keen to follow a clear policy of H.H Sheikh Hazza bin Zayed Al Nahyan, Vice Chairman of the Executive Council of the Emirate of Abu Dhabi on enhancing the competitiveness of both semi-government and private sectors, by measuring the efficiency and growth of productivity, and innovation, which are the main pillars pursued by many countries aspiring to be the leaders in international competitiveness, and to enable their national economies with achieving sustainable economic growth and long-term prosperity.
Achieving the highest competitiveness levels and improving productivity is among the main objectives associated with the priorities of the economic policy of the emirate of building a sustainable economy in accordance with the Abu Dhabi Economic Vision 2030; which is designed to unleash the economic potential of the emirate and to enable the people and enterprises to contribute effectively within the sustainable development sectors.
As the lead entity responsible for delivering the economic agenda of the Emirate, the Abu Dhabi Department of Economic Development (ADDED) follows a clear policy aimed at strengthening the competitiveness of the Emirate of Abu Dhabi, at the heart of which is economic diversification. The focus will be on developing non - oil industries that will create a range of employment opportunities requiring high skilled jobs, while increasing the technical and innovative capabilities of local companies.
To this scope, it is my pleasure to present the second edition of the Abu Dhabi Competitiveness Report. This comprehensive study is prepared by the Competitiveness Office of Abu Dhabi (COAD) with support of key stakeholders, and provides a thorough assessment of all elements driving competitiveness. Since the previous edition, Abu Dhabi has continued its progress on its path for economic prosperity and diversification.
Robust investments in infrastructure, relentless focus on education and the firm commitment to innovation have enhanced the Emirate’s competitiveness and provided an optimal environment for economic growth. Thanks to years of fiscal responsibility, and investment in the non-hydrocarbon sector, Abu Dhabi’s economy is shrugging off the global slump in oil prices and posing healthy growth in other sectors.
Looking ahead, ADDED is keen to further increase the Emirate’s level of competitiveness, supported by the government of Abu Dhabi to build a knowledge – based economy. Based on the findings of this report, ADDED will continue working with key stakeholders in government, enterprises and academia on achieving the following goals:
• Support the national agenda towards creating a highly skilled national labor force, matched with value added private sector employment opportunities
• Grow and deepen national supply chains to boost diversification, SME growth and productivity
• Align the innovation agenda with demand side policies and regulations to boost innovation output
• Achieve a next-generation alignment and coordination among government institutions on key competitiveness priorities to develop an environment that encourages growth and investment
• Continue increasing awareness of the competitiveness agenda in local, national and international forums
With this study, the Department wishes to contribute to achieving the goal announced by H.H. Sheikh Mohammed bin Zayed Al Nahyan, Crown Prince of Abu Dhabi, Deputy Supreme Commander of the UAE Armed Forces, to have the UAE ready for the day when it bid farewell to the last drop of oil, through investing in an efficient human capital as the backbone of sustainable economic development.
We would like to thank and acknowledge all those who have contributed to this report, and extend our gratitude for the invaluable encouragement from the institutions who have supported us and the society which we serve.
FOREWORDChairman, Abu Dhabi Department of Economic DevelopmentH.E. Ali Majed Al Mansoori
Abu Dhabi Competitiveness Report 20166 Abu Dhabi Competitiveness Report 2016 7
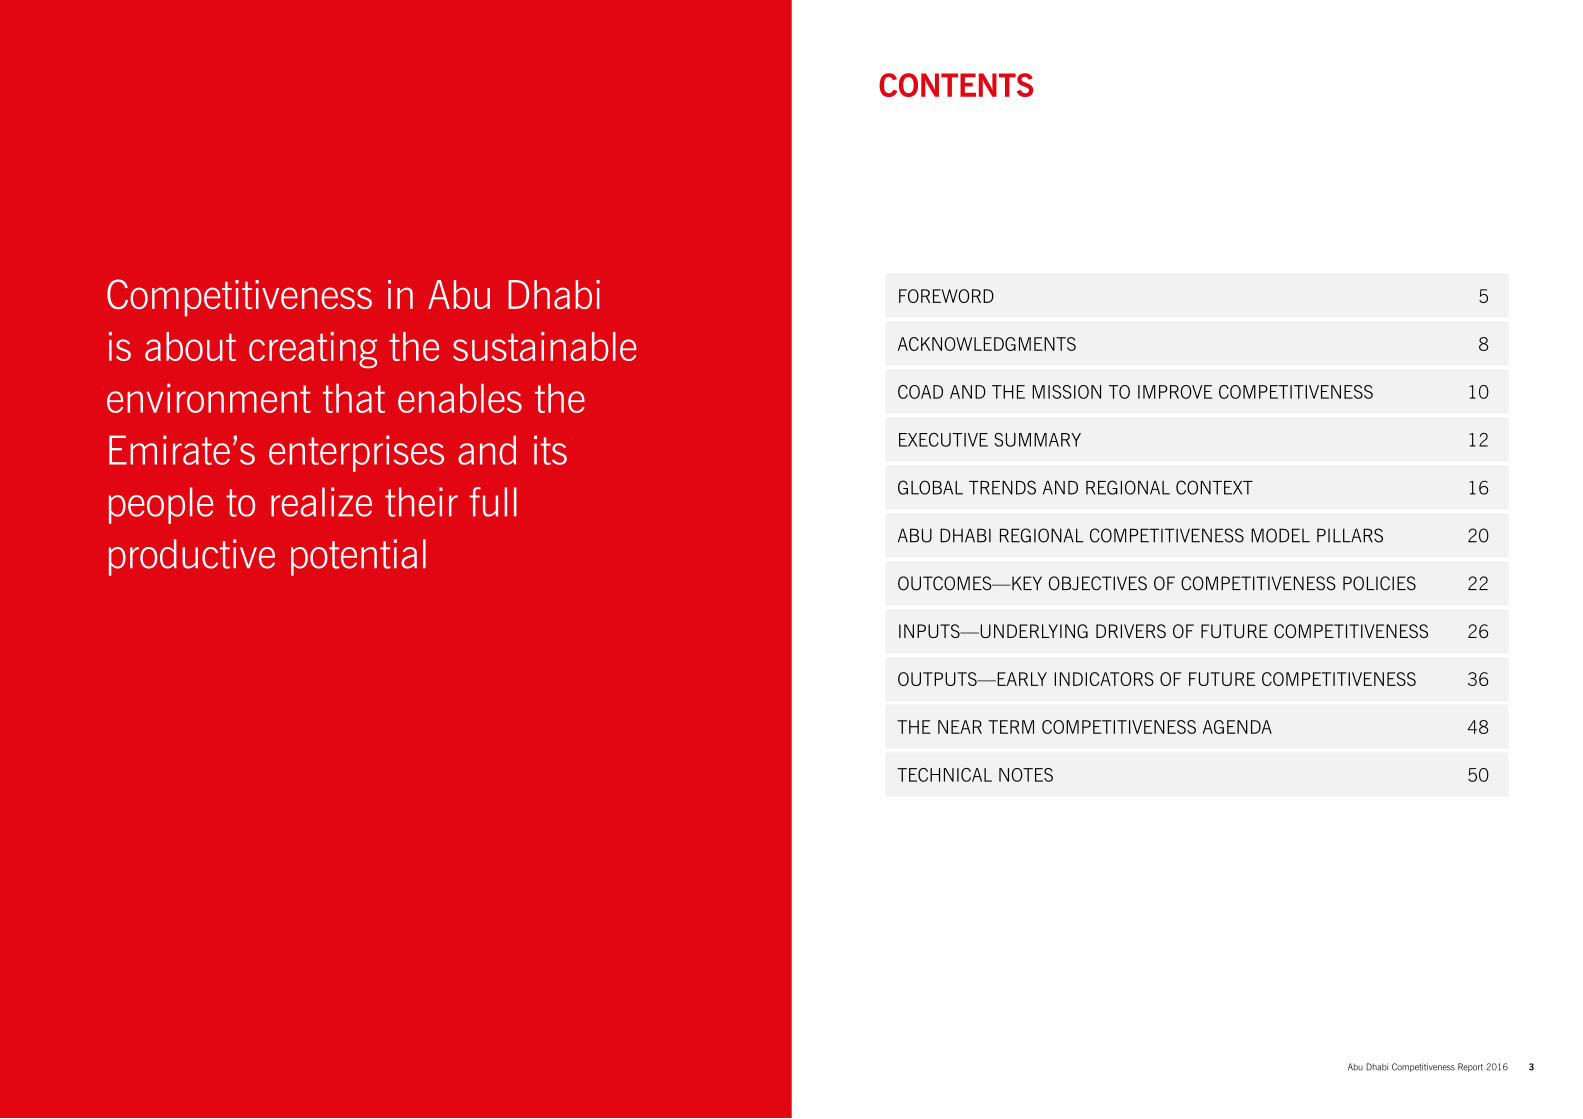
The Abu Dhabi Department of Economic Development (ADDED) has issued the second edition of the Abu Dhabi Competitiveness Report, as part of its role to enhance the competitiveness environment of Abu Dhabi.
The report aims to measure the competitiveness of the Emirate across a number of global benchmarks and regional indicators, highlight the challenges and the main success factors achieved in competitiveness, and makes recommendations to address these challenges and improve the current competitiveness situation by adopting efficient government initiatives which will achieve its full productive potential.
I would like to thank and acknowledge the support and valuable contribution of our stakeholders and strategic partners, who have contributed along with the Abu Dhabi Competitiveness Office in issuing the second edition of the Abu Dhabi Competitiveness Report, through joint efforts based on shared goals and combined coordination to implement the initiatives aimed at enhancing the competitiveness of Abu Dhabi.
The second edition of the Abu Dhabi Competitiveness Report focuses on the competitiveness of the local economy of the emirate, from the levels of microeconomics to macroeconomics, sets priorities for the implementation of policies, and defines initiatives intended to deal with these priorities, in addition to controlling the main competitiveness drivers.
The Abu Dhabi Department of Economic Development is keen on issuing the Abu Dhabi Competitiveness Report on a regular basis, to enable its strategic partners to build the three pillars which constitutes the basic elements of the competitiveness of the emirate: inputs, outputs and outcomes. The movement would allow for social and economic changes measuring the regional competitiveness of Abu Dhabi by providing a more accurate analysis of the economic data, which would allow the government, businesses and individuals to target the investments in the emirate and provide specific solutions for improvement and development.
The second edition has identified the regional competitiveness index of Abu Dhabi and its regions, across a number of twelve key elements, which are social well-being, economic growth, productivity, employment, exports, foreign direct investment, innovation, human capital, physical capital, financial, institutions and specialization.
FOREWORDActing Undersecretary of the Abu Dhabi Department of Economic Development H.E. Khaleefa Salem Al Mansouri
Abu Dhabi Competitiveness Report 20168 Abu Dhabi Competitiveness Report 2016 9
ACKNOWLEDGMENTS
This report would not have been possible without the support and contribution of numerous stakeholders. We would like to extend our gratitude to the following organizations for their dedication and commitment:
Abu Dhabi Department of Economic Development
Abu Dhabi Chamber
Abu Dhabi Education Council
Abu Dhabi Tourism and Culture Authority
A.T. Kearney
Borouge
Department of Municipal Affairs and Transport
Human Resources Authority
Khalifa Fund for Enterprise Development
Masdar Institute
Ministry of Economy
Mubadala
Securities and Commodity Authority
SEHA
Statistics Center Abu Dhabi
Strata
Urban Planning Council
Abu Dhabi Competitiveness Report 201610 Abu Dhabi Competitiveness Report 2016 11
Internationally, “a nation’s competitiveness is the degree to which a country can, under free and fair market conditions, produce goods and services that meet the test of international markets, while simultaneously maintaining and expanding the real incomes of its people over the long term.”1 For Abu Dhabi, improving competitiveness is about creating a sustainable environment that enables the Emirate’s enterprises and its people to realize their full productive potential. This entails providing the conditions for the Emirate’s workforce, businesses, sectors and regions to excel in both local and global markets. The leadership of Abu Dhabi has prioritized competitiveness as one of the primary objectives for building a sustainable economy, as defined in the Abu Dhabi Economic Vision 2030.
With this goal in mind, the Competitiveness Office of Abu Dhabi was launched in 2011 under the Abu Dhabi Department of Economic Development (ADDED), the lead entity responsible for delivering the economic development strategy outlined in the Abu Dhabi Economic Vision 2030.
The Competitiveness Office of Abu Dhabi (COAD) Vision and Mission
Vision: Work in collaboration with stakeholders to implement the best thinking in the field of competitiveness to support the people and enterprises of Abu Dhabi in reaching their full productive potential.
Mission: Enhance the global competitiveness of Abu Dhabi, its enterprises and private businesses by advocating policies, leading initiatives and creating a shared understanding and awareness among its stakeholders.
COAD AND THE MISSION TO IMPROVE COMPETITIVENESSAbu Dhabi Economic Vision
1. “Technology and the Economy: The Key Relationships,” Organisation for Economic Co-operation and Development, Paris, 1992
“Abu Dhabi as a sustainable, diversified, high-value-added economy that encourages enterprises and entrepreneurship, and well-integrated in the global economy, leading to better opportunities for all”
The Abu Dhabi Competitiveness Report 2016 has as its backbone the Abu Dhabi Regional Competitiveness Model, which consists of quantitative analysis enriched with qualitative insights from various stakeholder meetings in Abu Dhabi. To reveal the findings from the Regional Competitiveness Model and emphasize the future competitiveness agenda of the Emirate, the Abu Dhabi Competitiveness Report 2016 flows in the following structure:
Introductory elements: The report commences with three introductory elements, including Foreword, Acknowledgements, COAD and the Mission to improve Competitiveness.
Executive Summary: Condenses the key messages and serves as a quick guide to highlight the most relevant information presented in the report. Subsequent chapters provide further deep-dives.
Global Trends and Regional Context: Introduces the reader to the global context of events and dynamics that affect Abu Dhabi’s competitiveness.
Abu Dhabi Regional Competitiveness Model Pillars: Introduces the Abu Dhabi Regional Competitiveness Model and its three main pillars (inputs, outputs and outcomes).
Outcomes—Key objectives of competitiveness policies: Provides an overview of Abu Dhabi’s standing on competitiveness outcomes, i.e. economic growth and social well-being, as a starting baseline since competitiveness outcomes are often the ultimate objectives of competitiveness policies.
Inputs—Underlying drivers of future competitiveness: Reveals status-quo of Abu Dhabi Emirate and opportunities moving forward in competitiveness inputs —i.e. human capital, physical capital, financial capital, institutions and specialization.
Outputs—Early indicators of future competitiveness: Reveals status-quo of Abu Dhabi Emirate and opportunities moving forward in competitiveness outputs—i.e. productivity, employment, exports, Foreign Direct Investment (FDI) and innovation.
The Near Term Competitiveness Agenda: Builds the roadmap to enhance Abu Dhabi’s competitiveness. Building on the identified opportunities, the report defines the main priority areas for improvement.
The Appendix: Provides details regarding the Regional Competitiveness Model.
HOW TO READ THE ABU DHABI COMPETITIVENESS REPORT 2016
Abu Dhabi Competitiveness Report 2016 13
EXECUTIVE SUMMARY
Global trends and regional context
At the helm of the United Arab Emirates (UAE), Abu Dhabi powered into the 21st century with increasing hydrocarbon revenues, growing manufacturing industries, solid infrastructure and stable economic growth. Seeking to ensure the continued success of the Emirate’s development, the Government of Abu Dhabi has set guidelines and priorities for socioeconomic progress in Vision 2030, with diversifying away from hydrocarbon revenues at the top of the economic development agenda. Thanks to wise leadership, Abu Dhabi recorded a 4.6% average annual real growth rate in its GDP from 2012 to 2014 in constant 2007 prices, with growth mostly driven by non-hydrocarbon sectors.2 The share of non-oil sectors in Abu Dhabi’s GDP in constant 2007 prices rose from 40.7% in 2005 to 49.5% in 2014.3
Yet our world, including the Gulf Cooperation Council (GCC) region, is being affected by rapid global change. A new phase of growth—one where developed economies are expected to contribute more than developing economies to global GDP growth for the first time since the Great Recession—is on the horizon. In this new phase, global trends of regional developments, cyclical oil prices and a technological revolution are expected to be of utmost relevance for UAE and Abu Dhabi. The current oil slump has crucial implications for the governments of the Middle East and North Africa (MENA), with downward pressure on economic growth in most countries. Furthermore, the disruptive power of technology has become more pervasive in all aspects of business and in people’s personal lives—a trend that is more relevant than ever for national competitiveness.
This shifting global landscape is an endorsement of Abu Dhabi’s diversification ambition and all relevant efforts undertaken since 2008, right after the declaration of Abu Dhabi Vision 2030. In fact, the case for change toward a knowledge-based and innovation-driven economy is now more justified than ever. To strengthen current efforts, complete the transformation and achieve sustainable development for future generations, competitiveness will play a key role for Abu Dhabi. In this context, COAD is mandated to carry out its mission to “enhance global
2. Statistics Centre—Abu Dhabi 2015 Statistical Yearbook, page 173. Ibid.
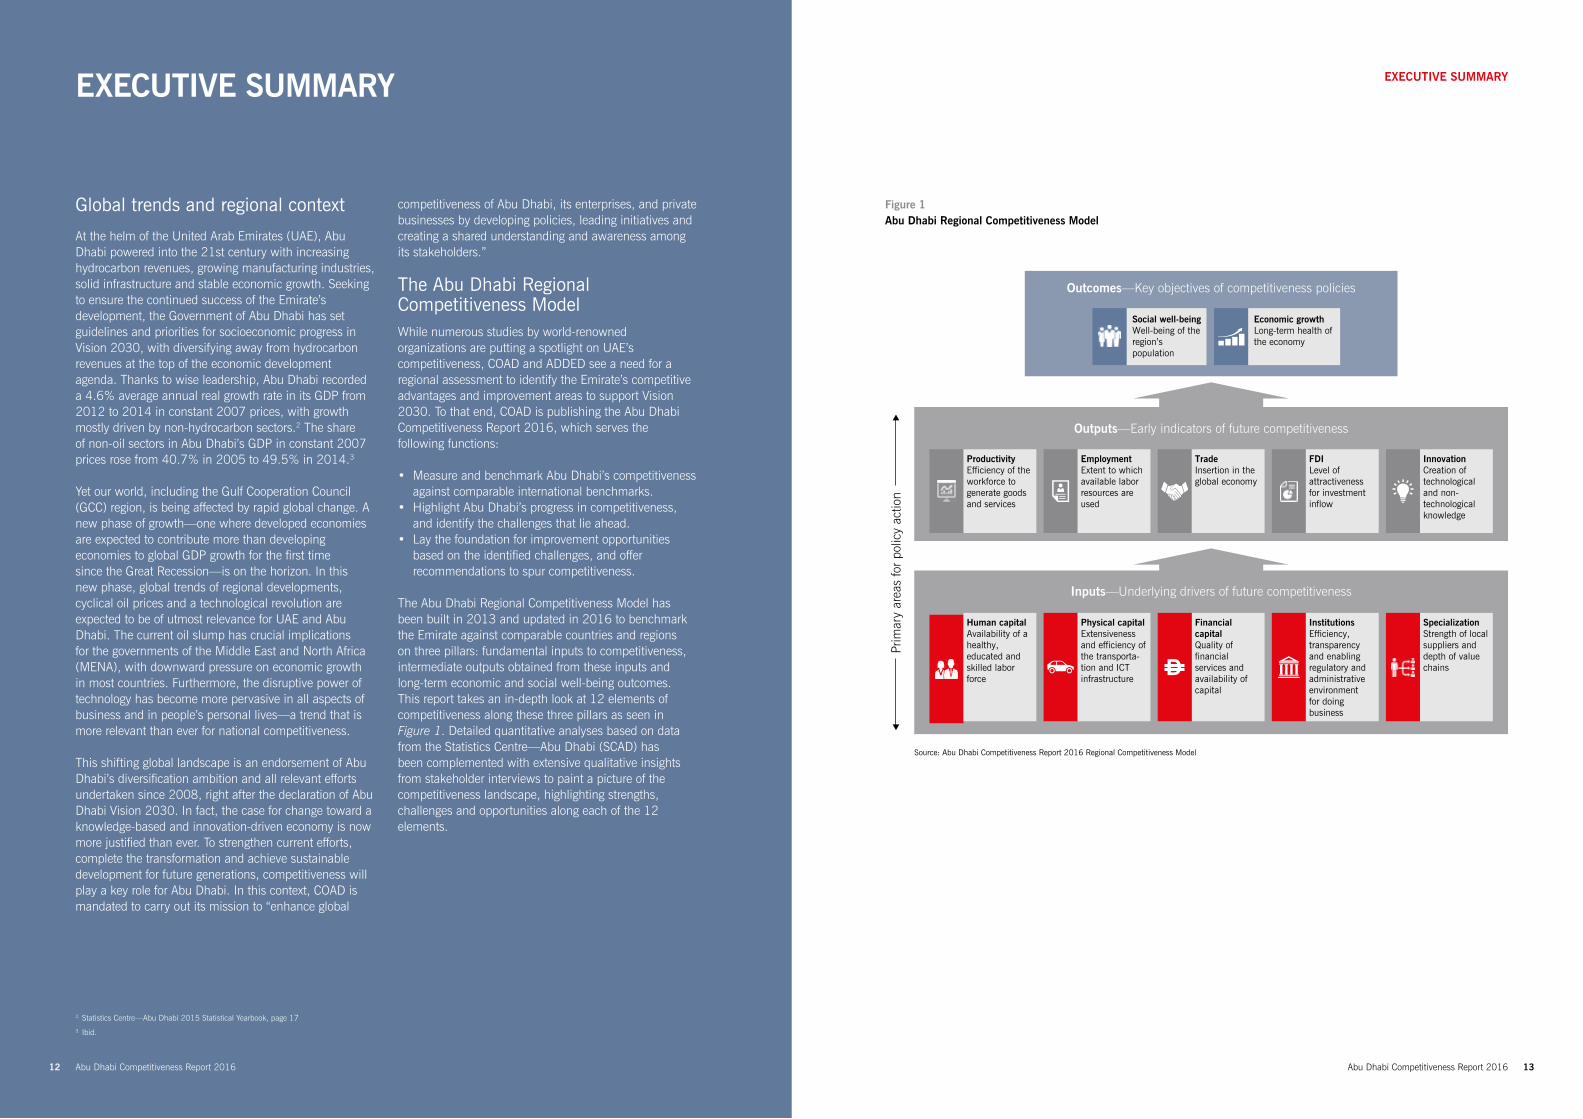
Figure 1 Abu Dhabi Regional Competitiveness Model
EXECUTIVE SUMMARY
competitiveness of Abu Dhabi, its enterprises, and private businesses by developing policies, leading initiatives and creating a shared understanding and awareness among its stakeholders.”
The Abu Dhabi Regional Competitiveness ModelWhile numerous studies by world-renowned organizations are putting a spotlight on UAE’s competitiveness, COAD and ADDED see a need for a regional assessment to identify the Emirate’s competitive advantages and improvement areas to support Vision 2030. To that end, COAD is publishing the Abu Dhabi Competitiveness Report 2016, which serves the following functions:
• Measure and benchmark Abu Dhabi’s competitiveness against comparable international benchmarks.
• Highlight Abu Dhabi’s progress in competitiveness, and identify the challenges that lie ahead.
• Lay the foundation for improvement opportunities based on the identified challenges, and offer recommendations to spur competitiveness.
The Abu Dhabi Regional Competitiveness Model has been built in 2013 and updated in 2016 to benchmark the Emirate against comparable countries and regions on three pillars: fundamental inputs to competitiveness, intermediate outputs obtained from these inputs and long-term economic and social well-being outcomes. This report takes an in-depth look at 12 elements of competitiveness along these three pillars as seen in Figure 1. Detailed quantitative analyses based on data from the Statistics Centre—Abu Dhabi (SCAD) has been complemented with extensive qualitative insights from stakeholder interviews to paint a picture of the competitiveness landscape, highlighting strengths, challenges and opportunities along each of the 12 elements.
Outcomes—Key objectives of competitiveness policies
Outputs—Early indicators of future competitiveness
Inputs—Underlying drivers of future competitiveness
Economic growthLong-term health ofthe economy
Social well-beingWell-being of theregion’s population
Source: Abu Dhabi Competitiveness Report 2016 Regional Competitiveness Model
Prim
ary
area
s fo
r po
licy
actio
n
ProductivityEfficiency of theworkforce togenerate goodsand services
EmploymentExtent to whichavailable laborresources are used
TradeInsertion in theglobal economy
FDILevel of attractiveness for investment inflow
InnovationCreation oftechnological and non-technological knowledge
Human capitalAvailability of ahealthy, educated andskilled labor force
Physical capitalExtensiveness and efficiency of the transporta-tion and ICTinfrastructure
Financial capitalQuality of financialservices andavailability of capital
InstitutionsEfficiency, transparency and enabling regulatory andadministrative environmentfor doing business
SpecializationStrength of localsuppliers and depth of value chains
Abu Dhabi Competitiveness Report 201612
Abu Dhabi Competitiveness Report 201614 Abu Dhabi Competitiveness Report 2016 15
EXECUTIVE SUMMARY
4. Statistics Centre—Abu Dhabi 2015 Statistical Yearbook, page185.Abu Dhabi 2015, The Business Year, page 9
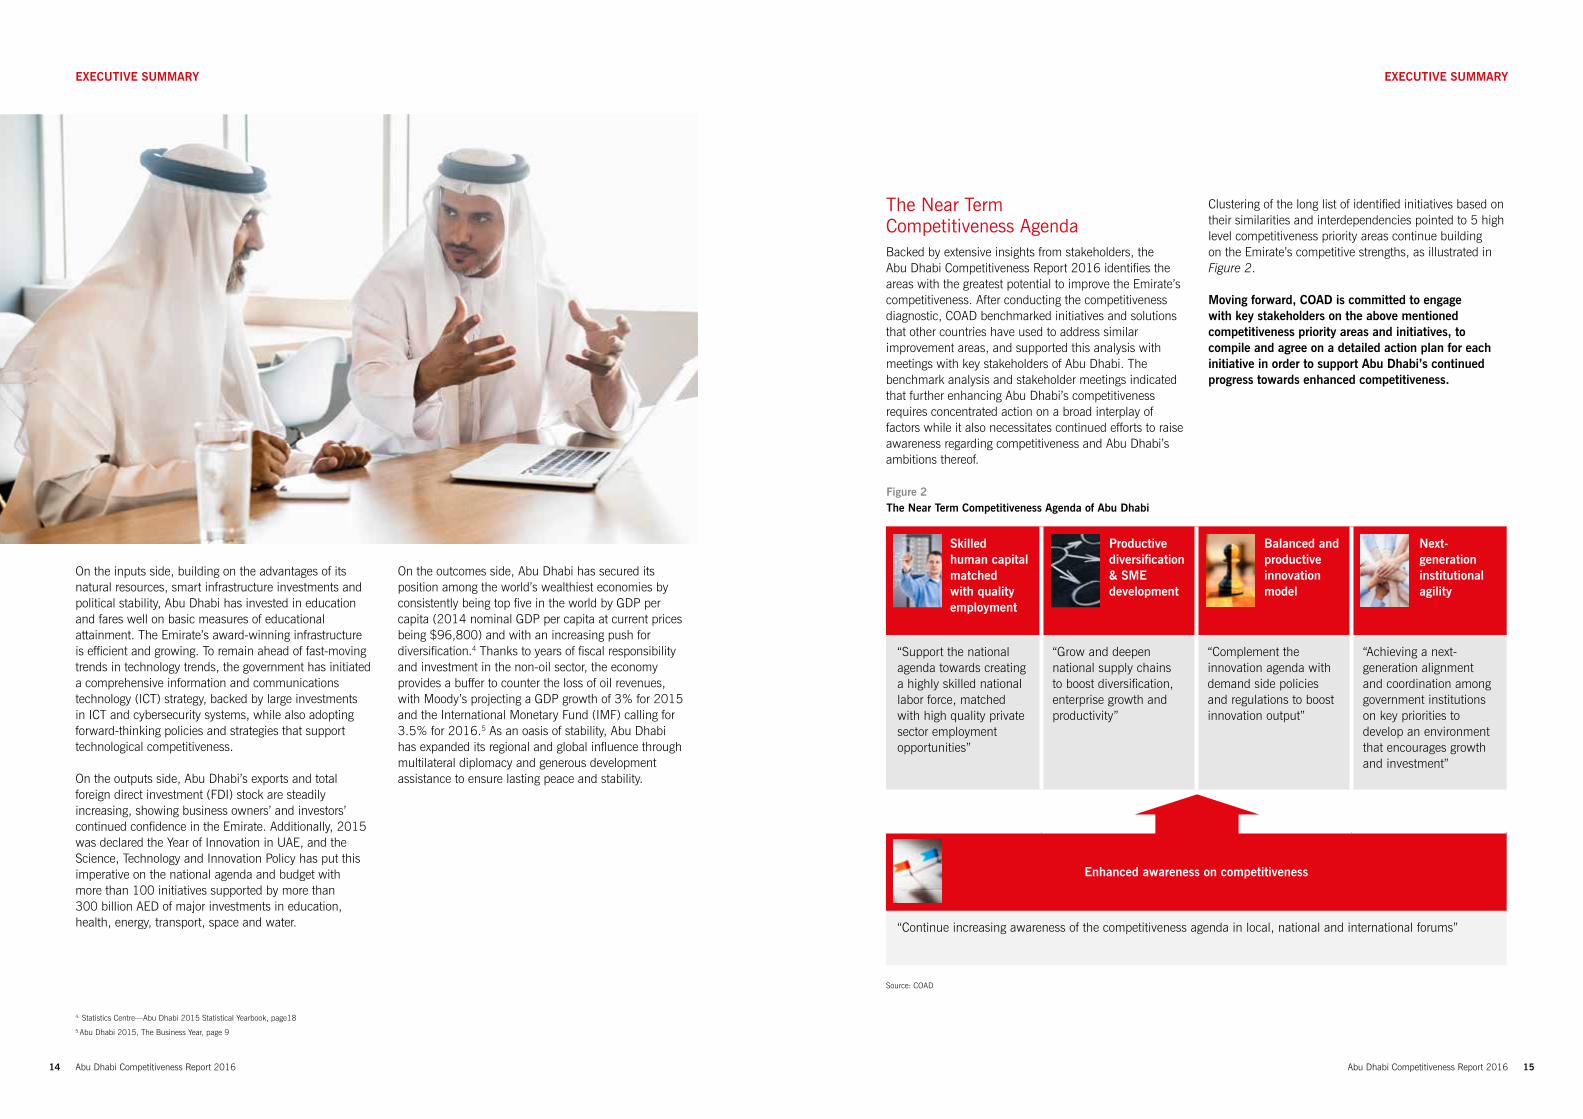
The Near Term Competitiveness AgendaBacked by extensive insights from stakeholders, the Abu Dhabi Competitiveness Report 2016 identifies the areas with the greatest potential to improve the Emirate’s competitiveness. After conducting the competitiveness diagnostic, COAD benchmarked initiatives and solutions that other countries have used to address similar improvement areas, and supported this analysis with meetings with key stakeholders of Abu Dhabi. The benchmark analysis and stakeholder meetings indicated that further enhancing Abu Dhabi’s competitiveness requires concentrated action on a broad interplay of factors while it also necessitates continued efforts to raise awareness regarding competitiveness and Abu Dhabi’s ambitions thereof.
Clustering of the long list of identified initiatives based on their similarities and interdependencies pointed to 5 high level competitiveness priority areas continue building on the Emirate’s competitive strengths, as illustrated in Figure 2.
Moving forward, COAD is committed to engage with key stakeholders on the above mentioned competitiveness priority areas and initiatives, to compile and agree on a detailed action plan for each initiative in order to support Abu Dhabi’s continued progress towards enhanced competitiveness.
On the inputs side, building on the advantages of its natural resources, smart infrastructure investments and political stability, Abu Dhabi has invested in education and fares well on basic measures of educational attainment. The Emirate’s award-winning infrastructure is efficient and growing. To remain ahead of fast-moving trends in technology trends, the government has initiated a comprehensive information and communications technology (ICT) strategy, backed by large investments in ICT and cybersecurity systems, while also adopting forward-thinking policies and strategies that support technological competitiveness.
On the outputs side, Abu Dhabi’s exports and total foreign direct investment (FDI) stock are steadily increasing, showing business owners’ and investors’ continued confidence in the Emirate. Additionally, 2015 was declared the Year of Innovation in UAE, and the Science, Technology and Innovation Policy has put this imperative on the national agenda and budget with more than 100 initiatives supported by more than 300 billion AED of major investments in education, health, energy, transport, space and water.
On the outcomes side, Abu Dhabi has secured its position among the world’s wealthiest economies by consistently being top five in the world by GDP per capita (2014 nominal GDP per capita at current prices being $96,800) and with an increasing push for diversification.4 Thanks to years of fiscal responsibility and investment in the non-oil sector, the economy provides a buffer to counter the loss of oil revenues, with Moody’s projecting a GDP growth of 3% for 2015 and the International Monetary Fund (IMF) calling for 3.5% for 2016. 5 As an oasis of stability, Abu Dhabi has expanded its regional and global influence through multilateral diplomacy and generous development assistance to ensure lasting peace and stability.
EXECUTIVE SUMMARY
Figure 2 The Near Term Competitiveness Agenda of Abu Dhabi
Source: COAD
Skilled human capital matched with quality employment
Productive diversification & SME development
Balanced and productive innovation model
Next-generation institutional agility
“Support the national agenda towards creating a highly skilled national labor force, matched with high quality private sector employment opportunities”
“Grow and deepen national supply chains to boost diversification, enterprise growth and productivity”
“Complement the innovation agenda with demand side policies and regulations to boost innovation output”
“Achieving a next-generation alignment and coordination among government institutions on key priorities to develop an environment that encourages growth and investment”
Enhanced awareness on competitiveness
“Continue increasing awareness of the competitiveness agenda in local, national and international forums”
Abu Dhabi Competitiveness Report 2016 17
As we welcome 2016, the world has entered a new phase of economic growth, one in which—as International Monetary Fund (IMF) Managing Director Christine Lagarde described it in October 2014—many economies are in a “new mediocre,” muddling through with subpar growth rates.6 The IMF is expecting only 3.1% global growth for 2015 compared to a 4.0% annual average growth from 2010 to 2014.7 A relatively strong recovery in the Americas and a modest recovery in the Eurozone are pushing developed markets ahead. Developing market growth is being hit by a growth slowdown in Brazil, Russia, India and China (BRIC). Lower global commodity prices and BRIC’s slowdown have had larger-than-expected repercussions on resource-driven economies.
Regional developments, cyclical oil price and the technological revolution are trends of utmost
relevance for Abu Dhabi’s competitiveness.
GLOBAL TRENDS AND REGIONAL CONTEXT
6. Global Economic Outlook 2015-2020: Beyond the New Mediocre?, A.T. Kearney Global Business Policy Council7. IMF World Economic Outlook October 2015, page 2; IMF Data World Economic Outlook Database October 2015 Dataset8. Ibid.9. World Bank Doing Business Rankings, 2016
10. Statistics Centre—Abu Dhabi 2015 Statistical Yearbook 2015, page 6511. Statistics Centre—Abu Dhabi 2014 Estimates of the Stock of Foreign Direct Investment, page 512. Abu Dhabi 2015, The Business Year, page 21
MENA World
MENA
World
120
110
100
90
80
70
60
50
40
30
20
2004 2005 2006 2007 2008 2009 2010 2011 2012 2013 2014
Source: UNCTAD World Investment Report 2015
2,100
1,800
1,500
1,200
900
600
300
0
GLOBAL TRENDS AND REGIONAL CONTEXT
Regional Developments
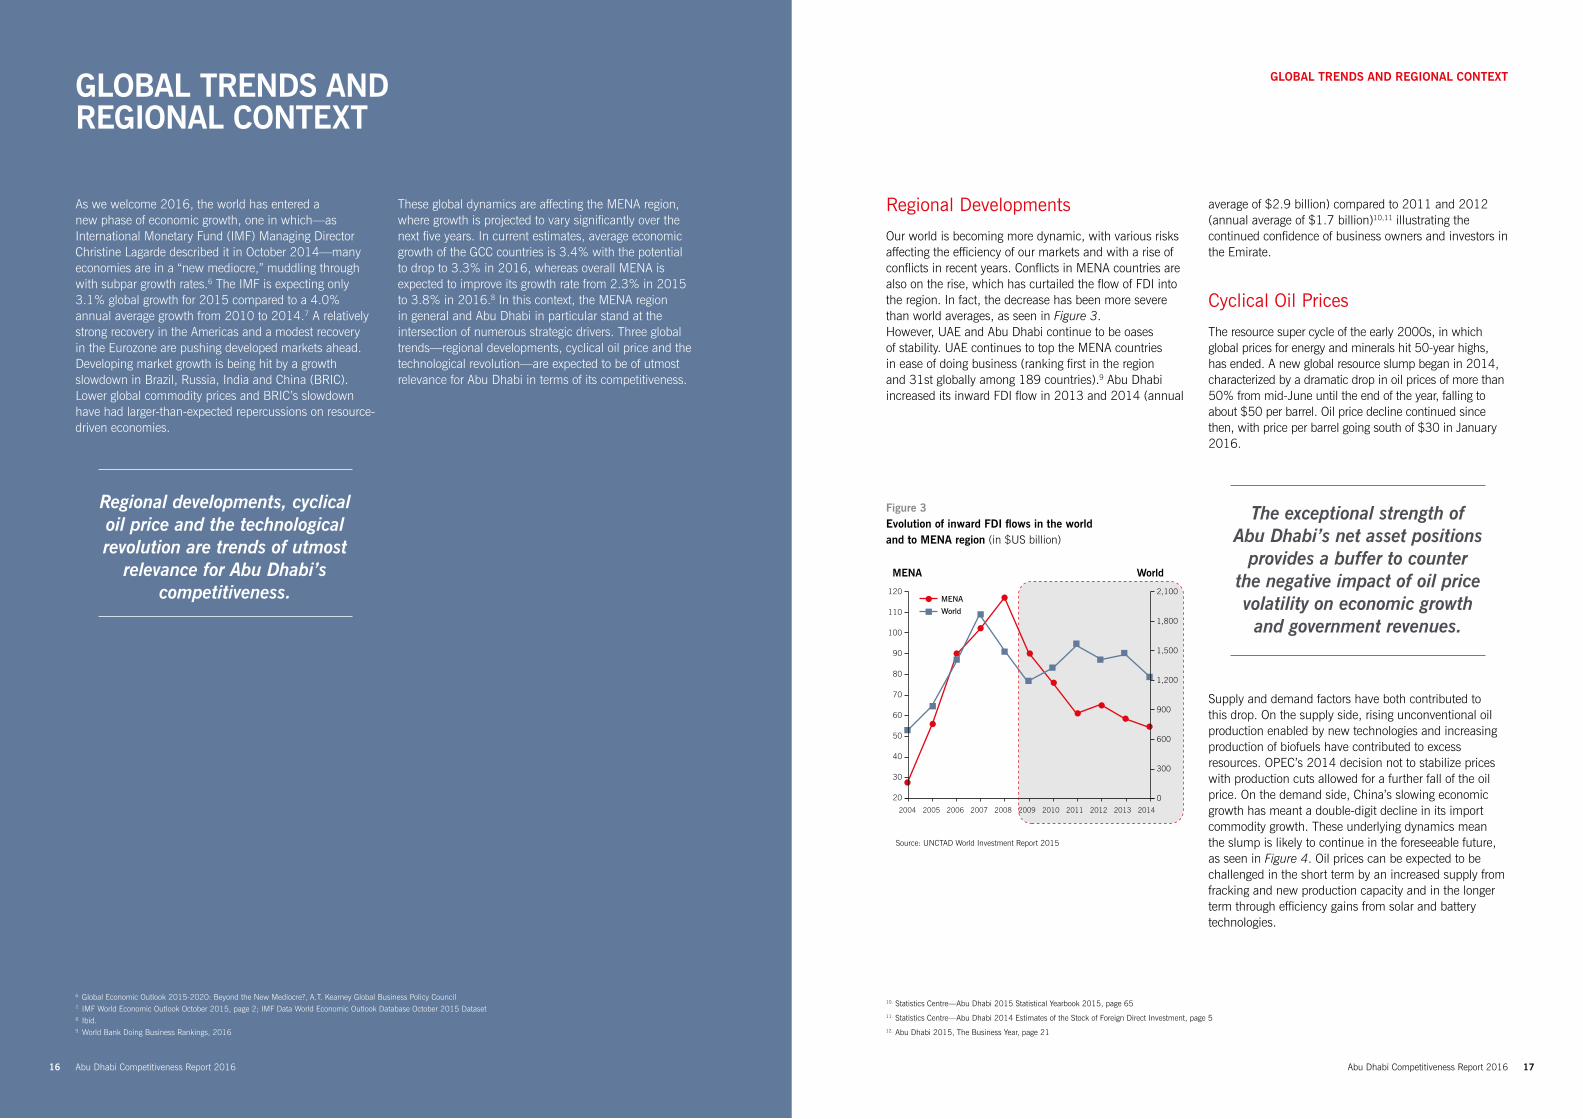
Our world is becoming more dynamic, with various risks affecting the efficiency of our markets and with a rise of conflicts in recent years. Conflicts in MENA countries are also on the rise, which has curtailed the flow of FDI into the region. In fact, the decrease has been more severe than world averages, as seen in Figure 3.However, UAE and Abu Dhabi continue to be oases of stability. UAE continues to top the MENA countries in ease of doing business (ranking first in the region and 31st globally among 189 countries).9 Abu Dhabi increased its inward FDI flow in 2013 and 2014 (annual
average of $2.9 billion) compared to 2011 and 2012 (annual average of $1.7 billion)10,11 illustrating the continued confidence of business owners and investors in the Emirate.
Cyclical Oil Prices
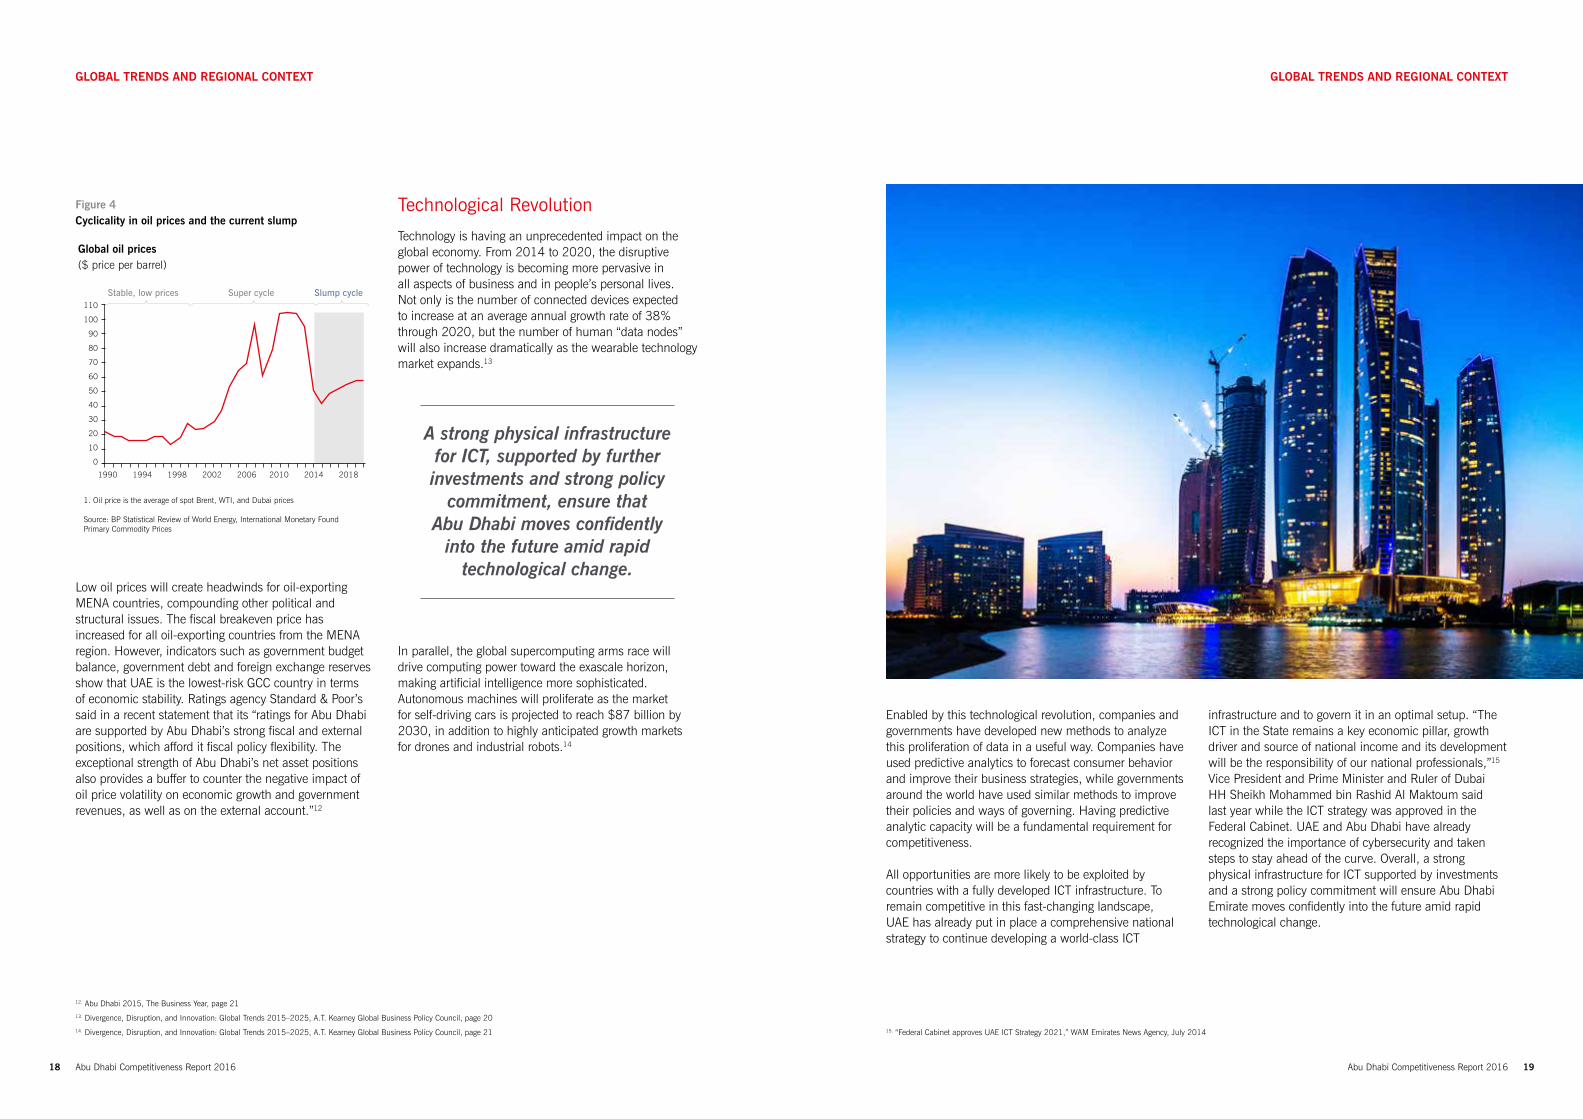
The resource super cycle of the early 2000s, in which global prices for energy and minerals hit 50-year highs, has ended. A new global resource slump began in 2014, characterized by a dramatic drop in oil prices of more than 50% from mid-June until the end of the year, falling to about $50 per barrel. Oil price decline continued since then, with price per barrel going south of $30 in January 2016.
The exceptional strength of Abu Dhabi’s net asset positions
provides a buffer to counter the negative impact of oil price volatility on economic growth and government revenues.
Supply and demand factors have both contributed to this drop. On the supply side, rising unconventional oil production enabled by new technologies and increasing production of biofuels have contributed to excess resources. OPEC’s 2014 decision not to stabilize prices with production cuts allowed for a further fall of the oil price. On the demand side, China’s slowing economic growth has meant a double-digit decline in its import commodity growth. These underlying dynamics mean the slump is likely to continue in the foreseeable future, as seen in Figure 4. Oil prices can be expected to be challenged in the short term by an increased supply from fracking and new production capacity and in the longer term through efficiency gains from solar and battery technologies.
Figure 3 Evolution of inward FDI flows in the world and to MENA region (in $US billion)
These global dynamics are affecting the MENA region, where growth is projected to vary significantly over the next five years. In current estimates, average economic growth of the GCC countries is 3.4% with the potential to drop to 3.3% in 2016, whereas overall MENA is expected to improve its growth rate from 2.3% in 2015 to 3.8% in 2016.|
8| In this context, the MENA region
in general and Abu Dhabi in particular stand at the intersection of numerous strategic drivers. Three global trends—regional developments, cyclical oil price and the technological revolution—are expected to be of utmost relevance for Abu Dhabi in terms of its competitiveness.
Abu Dhabi Competitiveness Report 201616
Abu Dhabi Competitiveness Report 201618 Abu Dhabi Competitiveness Report 2016 19
GLOBAL TRENDS AND REGIONAL CONTEXT
Low oil prices will create headwinds for oil-exporting MENA countries, compounding other political and structural issues. The fiscal breakeven price has increased for all oil-exporting countries from the MENA region. However, indicators such as government budget balance, government debt and foreign exchange reserves show that UAE is the lowest-risk GCC country in terms of economic stability. Ratings agency Standard & Poor’s said in a recent statement that its “ratings for Abu Dhabi are supported by Abu Dhabi’s strong fiscal and external positions, which afford it fiscal policy flexibility. The exceptional strength of Abu Dhabi’s net asset positions also provides a buffer to counter the negative impact of oil price volatility on economic growth and government revenues, as well as on the external account.”12
12. Abu Dhabi 2015, The Business Year, page 2113. Divergence, Disruption, and Innovation: Global Trends 2015–2025, A.T. Kearney Global Business Policy Council, page 2014. Divergence, Disruption, and Innovation: Global Trends 2015–2025, A.T. Kearney Global Business Policy Council, page 21 15. “Federal Cabinet approves UAE ICT Strategy 2021,” WAM Emirates News Agency, July 2014
GLOBAL TRENDS AND REGIONAL CONTEXT
Global oil prices($ price per barrel)
Stable, low prices Super cycle Slump cycle110
100
90
80
70
60
50
40
30
20
10
0
1990 1994 1998 2002 2006 2010 2014 2018
1. Oil price is the average of spot Brent, WTI, and Dubai prices
Source: BP Statistical Review of World Energy, International Monetary FoundPrimary Commodity Prices
Technological Revolution
Technology is having an unprecedented impact on the global economy. From 2014 to 2020, the disruptive power of technology is becoming more pervasive in all aspects of business and in people’s personal lives. Not only is the number of connected devices expected to increase at an average annual growth rate of 38% through 2020, but the number of human “data nodes” will also increase dramatically as the wearable technology market expands.13
A strong physical infrastructure for ICT, supported by further investments and strong policy
commitment, ensure that Abu Dhabi moves confidently
into the future amid rapid technological change.
In parallel, the global supercomputing arms race will drive computing power toward the exascale horizon, making artificial intelligence more sophisticated. Autonomous machines will proliferate as the market for self-driving cars is projected to reach $87 billion by 2030, in addition to highly anticipated growth markets for drones and industrial robots.14
Figure 4 Cyclicality in oil prices and the current slump
Enabled by this technological revolution, companies and governments have developed new methods to analyze this proliferation of data in a useful way. Companies have used predictive analytics to forecast consumer behavior and improve their business strategies, while governments around the world have used similar methods to improve their policies and ways of governing. Having predictive analytic capacity will be a fundamental requirement for competitiveness.
All opportunities are more likely to be exploited by countries with a fully developed ICT infrastructure. To remain competitive in this fast-changing landscape, UAE has already put in place a comprehensive national strategy to continue developing a world-class ICT
infrastructure and to govern it in an optimal setup. “The ICT in the State remains a key economic pillar, growth driver and source of national income and its development will be the responsibility of our national professionals,”15 Vice President and Prime Minister and Ruler of Dubai HH Sheikh Mohammed bin Rashid Al Maktoum said last year while the ICT strategy was approved in the Federal Cabinet. UAE and Abu Dhabi have already recognized the importance of cybersecurity and taken steps to stay ahead of the curve. Overall, a strong physical infrastructure for ICT supported by investments and a strong policy commitment will ensure Abu Dhabi Emirate moves confidently into the future amid rapid technological change.
Abu Dhabi Competitiveness Report 2016 21
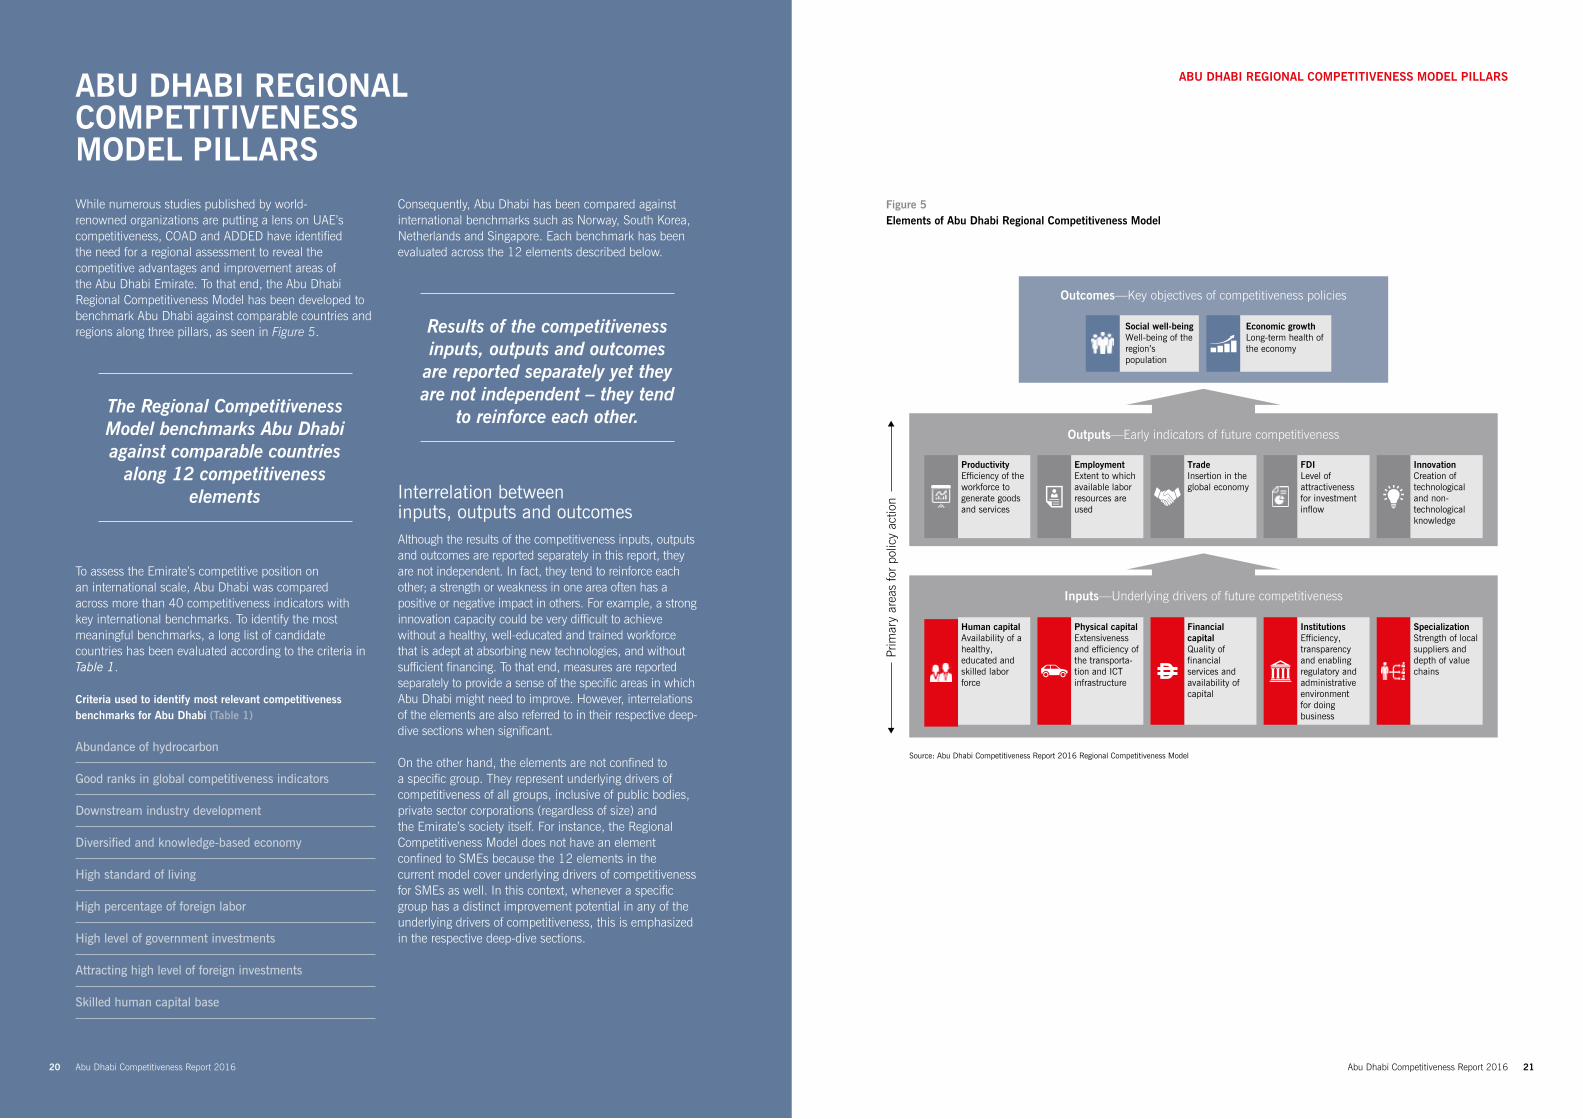
While numerous studies published by world-renowned organizations are putting a lens on UAE’s competitiveness, COAD and ADDED have identified the need for a regional assessment to reveal the competitive advantages and improvement areas of the Abu Dhabi Emirate. To that end, the Abu Dhabi Regional Competitiveness Model has been developed to benchmark Abu Dhabi against comparable countries and regions along three pillars, as seen in Figure 5.
The Regional Competitiveness Model benchmarks Abu Dhabi against comparable countries
along 12 competitiveness elements
To assess the Emirate’s competitive position on an international scale, Abu Dhabi was compared across more than 40 competitiveness indicators with key international benchmarks. To identify the most meaningful benchmarks, a long list of candidate countries has been evaluated according to the criteria in Table 1.
Criteria used to identify most relevant competitiveness benchmarks for Abu Dhabi (Table 1)
Abundance of hydrocarbon
Good ranks in global competitiveness indicators
Downstream industry development
Diversified and knowledge-based economy
High standard of living
High percentage of foreign labor
High level of government investments
Attracting high level of foreign investments
Skilled human capital base
ABU DHABI REGIONAL COMPETITIVENESS MODEL PILLARS
ABU DHABI REGIONAL COMPETITIVENESS MODEL PILLARS
Consequently, Abu Dhabi has been compared against international benchmarks such as Norway, South Korea, Netherlands and Singapore. Each benchmark has been evaluated across the 12 elements described below.
Results of the competitiveness inputs, outputs and outcomes
are reported separately yet they are not independent – they tend
to reinforce each other.
Interrelation between inputs, outputs and outcomesAlthough the results of the competitiveness inputs, outputs and outcomes are reported separately in this report, they are not independent. In fact, they tend to reinforce each other; a strength or weakness in one area often has a positive or negative impact in others. For example, a strong innovation capacity could be very difficult to achieve without a healthy, well-educated and trained workforce that is adept at absorbing new technologies, and without sufficient financing. To that end, measures are reported separately to provide a sense of the specific areas in which Abu Dhabi might need to improve. However, interrelations of the elements are also referred to in their respective deep-dive sections when significant.
On the other hand, the elements are not confined to a specific group. They represent underlying drivers of competitiveness of all groups, inclusive of public bodies, private sector corporations (regardless of size) and the Emirate’s society itself. For instance, the Regional Competitiveness Model does not have an element confined to SMEs because the 12 elements in the current model cover underlying drivers of competitiveness for SMEs as well. In this context, whenever a specific group has a distinct improvement potential in any of the underlying drivers of competitiveness, this is emphasized in the respective deep-dive sections.
Figure 5 Elements of Abu Dhabi Regional Competitiveness Model
Outcomes—Key objectives of competitiveness policies
Outputs—Early indicators of future competitiveness
Inputs—Underlying drivers of future competitiveness
Economic growthLong-term health ofthe economy
Social well-beingWell-being of theregion’s population
Source: Abu Dhabi Competitiveness Report 2016 Regional Competitiveness Model
Prim
ary
area
s fo
r po
licy
actio
n
ProductivityEfficiency of theworkforce togenerate goodsand services
EmploymentExtent to whichavailable laborresources are used
TradeInsertion in theglobal economy
FDILevel of attractiveness for investment inflow
InnovationCreation oftechnological and non-technological knowledge
Human capitalAvailability of ahealthy, educated andskilled labor force
Physical capitalExtensiveness and efficiency of the transporta-tion and ICTinfrastructure
Financial capitalQuality of financialservices andavailability of capital
InstitutionsEfficiency, transparency and enabling regulatory andadministrative environmentfor doing business
SpecializationStrength of localsuppliers and depth of value chains
Abu Dhabi Competitiveness Report 201620
Abu Dhabi Competitiveness Report 2016 23
OUTCOMES: KEY OBJECTIVES OF COMPETITIVENESS POLICIES
Given their importance as ultimate policy objectives rather than policy action areas, Abu Dhabi Competitiveness Report 2016 starts with shedding light on Abu Dhabi’s positioning on the competitiveness outcome elements, more specifically on Economic Growth and Social Well-being.
Abu Dhabi’s vision of diversification is paying off, keeping the latest economic growth realization as well as
forecasts for the Emirate up and running.
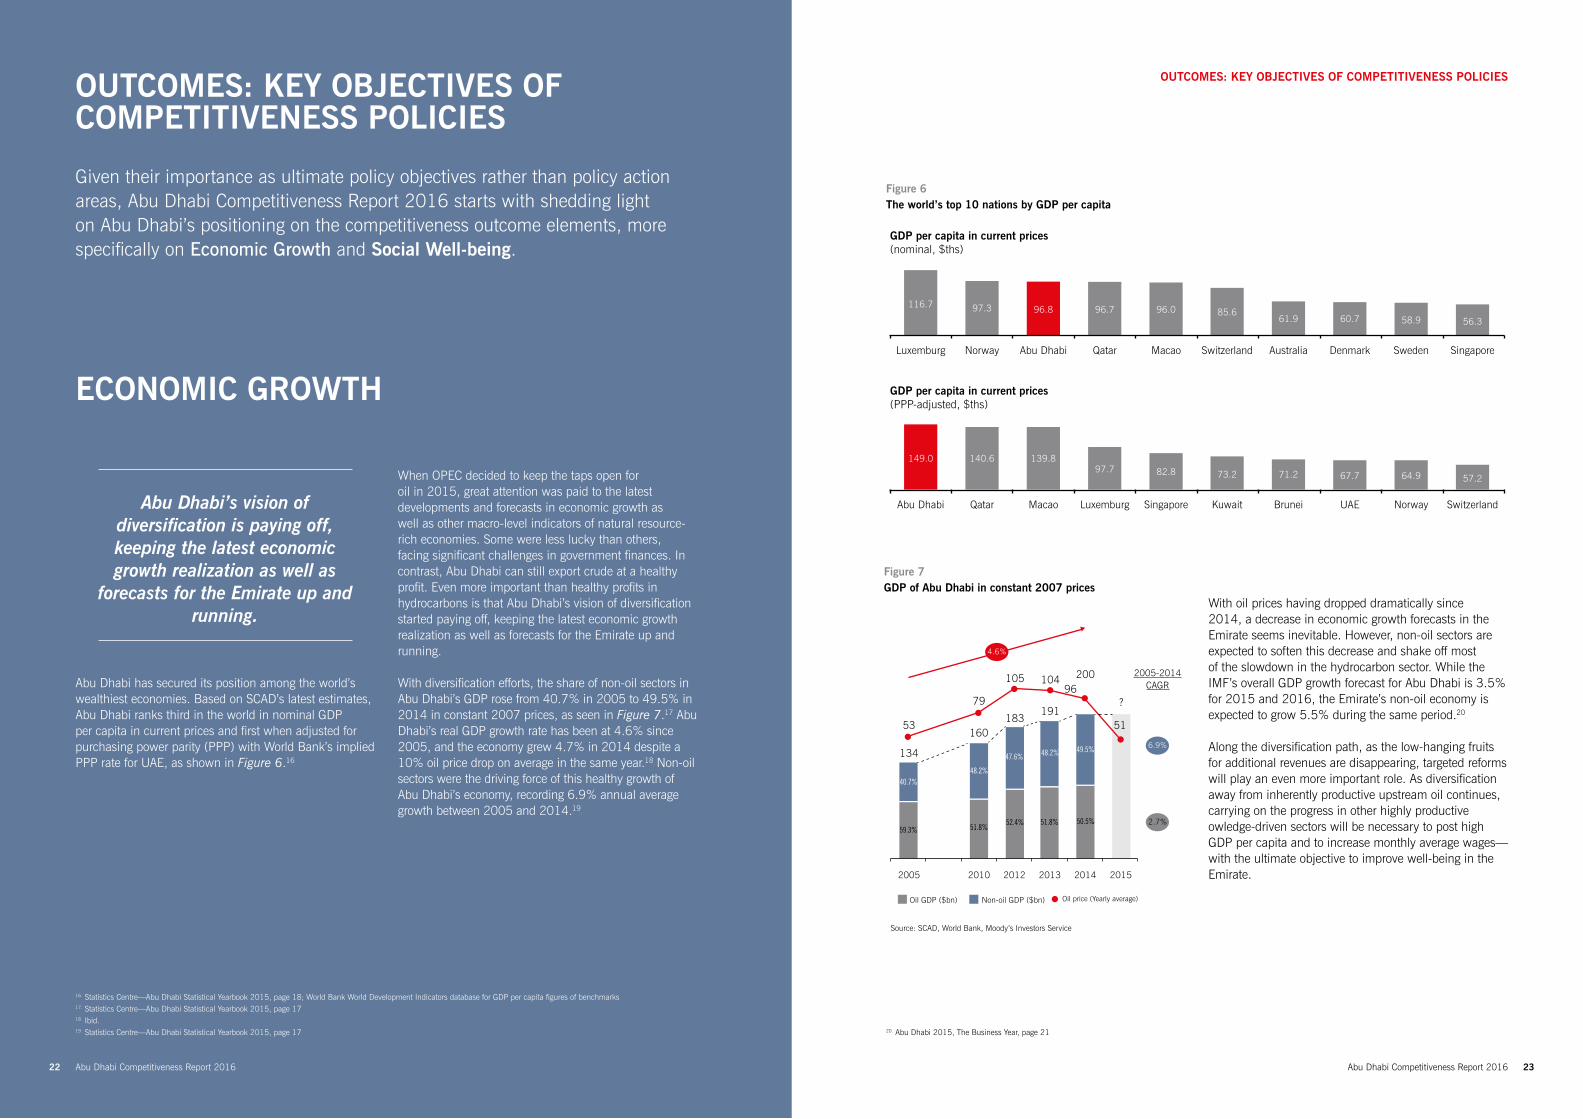
Abu Dhabi has secured its position among the world’s wealthiest economies. Based on SCAD’s latest estimates, Abu Dhabi ranks third in the world in nominal GDP per capita in current prices and first when adjusted for purchasing power parity (PPP) with World Bank’s implied PPP rate for UAE, as shown in Figure 6.|
16|
ECONOMIC GROWTH
16. Statistics Centre—Abu Dhabi Statistical Yearbook 2015, page 18; World Bank World Development Indicators database for GDP per capita figures of benchmarks17. Statistics Centre—Abu Dhabi Statistical Yearbook 2015, page 1718. Ibid.19. Statistics Centre—Abu Dhabi Statistical Yearbook 2015, page 17
Figure 6 The world’s top 10 nations by GDP per capita
OUTCOMES: KEY OBJECTIVES OF COMPETITIVENESS POLICIES
Luxemburg
GDP per capita in current prices(nominal, $ths)
GDP per capita in current prices(PPP-adjusted, $ths)
116.7
Switzerland
85.6
Australia
61.9
Denmark
60.7
Sweden
58.9
Singapore
56.3
Macao
96.0
Qatar
96.7
Abu Dhabi
96.8
Norway
97.3
Abu Dhabi
Source: SCAD, World Bank
149.0
Kuwait
73.2
Brunei
71.2
UAE
67.7
Norway
64.9
Switzerland
57.2
Singapore
82.8
Luxemburg
97.7
Macao
139.8
Qatar
140.6
2005 2010 2012 2013 2014 2015
Source: SCAD, World Bank, Moody’s Investors Service
Oil GDP ($bn) Non-oil GDP ($bn) Oil price (Yearly average)
134
53
79
105 10496
200 2005-2014CAGR
?
51
40.7%
59.3% 51.8%52.4% 51.8% 50.5%
48.2%
47.6% 48.2% 49.5%
160183
191
4.6%
6.9%
2.7%
When OPEC decided to keep the taps open for oil in 2015, great attention was paid to the latest developments and forecasts in economic growth as well as other macro-level indicators of natural resource-rich economies. Some were less lucky than others, facing significant challenges in government finances. In contrast, Abu Dhabi can still export crude at a healthy profit. Even more important than healthy profits in hydrocarbons is that Abu Dhabi’s vision of diversification started paying off, keeping the latest economic growth realization as well as forecasts for the Emirate up and running.
With diversification efforts, the share of non-oil sectors in Abu Dhabi’s GDP rose from 40.7% in 2005 to 49.5% in 2014 in constant 2007 prices, as seen in Figure 7.|
17| Abu
Dhabi’s real GDP growth rate has been at 4.6% since 2005, and the economy grew 4.7% in 2014 despite a 10% oil price drop on average in the same year.|
18| Non-oil
sectors were the driving force of this healthy growth of Abu Dhabi’s economy, recording 6.9% annual average growth between 2005 and 2014.|
19|
With oil prices having dropped dramatically since 2014, a decrease in economic growth forecasts in the Emirate seems inevitable. However, non-oil sectors are expected to soften this decrease and shake off most of the slowdown in the hydrocarbon sector. While the IMF’s overall GDP growth forecast for Abu Dhabi is 3.5% for 2015 and 2016, the Emirate’s non-oil economy is expected to grow 5.5% during the same period.|
20|
Along the diversification path, as the low-hanging fruits for additional revenues are disappearing, targeted reforms will play an even more important role. As diversification away from inherently productive upstream oil continues, carrying on the progress in other highly productive owledge-driven sectors will be necessary to post high GDP per capita and to increase monthly average wages—with the ultimate objective to improve well-being in the Emirate.
Figure 7 GDP of Abu Dhabi in constant 2007 prices
20. Abu Dhabi 2015, The Business Year, page 21
Abu Dhabi Competitiveness Report 201622
Abu Dhabi Competitiveness Report 201624
COMPETITIVENESS SUCCESS STORY
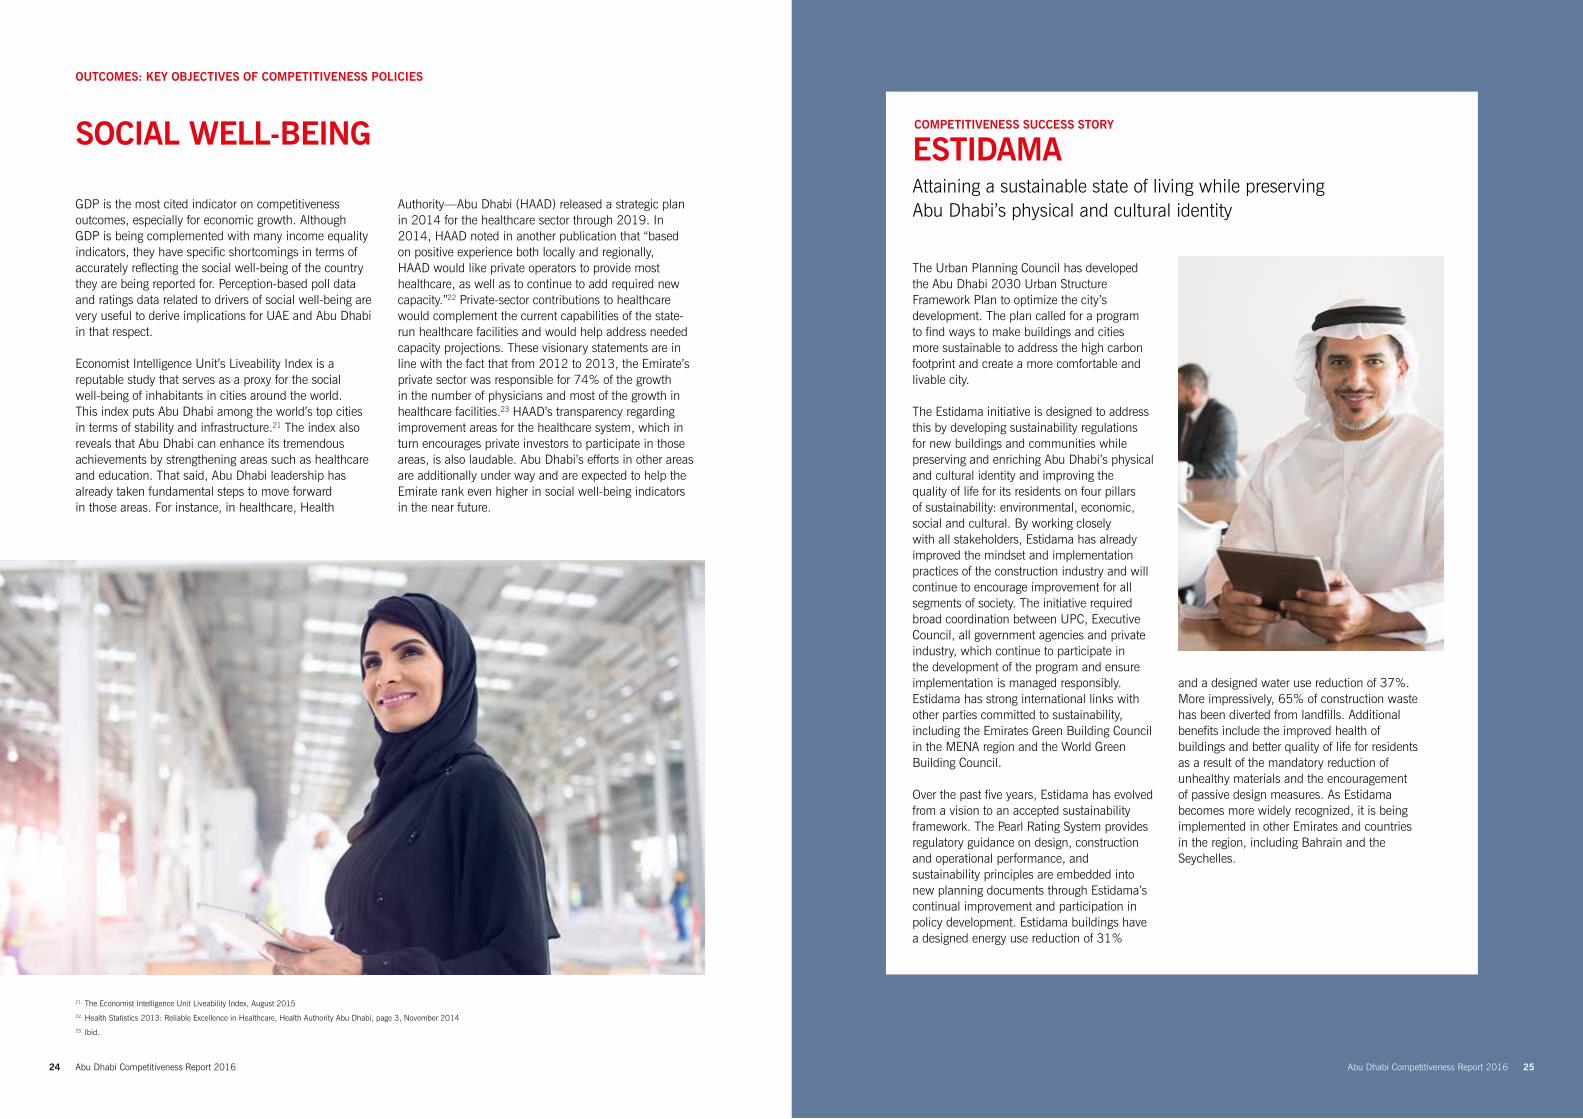
ESTIDAMAAttaining a sustainable state of living while preserving Abu Dhabi’s physical and cultural identity
The Urban Planning Council has developed the Abu Dhabi 2030 Urban Structure Framework Plan to optimize the city’s development. The plan called for a program to find ways to make buildings and cities more sustainable to address the high carbon footprint and create a more comfortable and livable city.
The Estidama initiative is designed to address this by developing sustainability regulations for new buildings and communities while preserving and enriching Abu Dhabi’s physical and cultural identity and improving the quality of life for its residents on four pillars of sustainability: environmental, economic, social and cultural. By working closely with all stakeholders, Estidama has already improved the mindset and implementation practices of the construction industry and will continue to encourage improvement for all segments of society. The initiative required broad coordination between UPC, Executive Council, all government agencies and private industry, which continue to participate in the development of the program and ensure implementation is managed responsibly. Estidama has strong international links with other parties committed to sustainability, including the Emirates Green Building Council in the MENA region and the World Green Building Council.
Over the past five years, Estidama has evolved from a vision to an accepted sustainability framework. The Pearl Rating System provides regulatory guidance on design, construction and operational performance, and sustainability principles are embedded into new planning documents through Estidama’s continual improvement and participation in policy development. Estidama buildings have a designed energy use reduction of 31%
and a designed water use reduction of 37%. More impressively, 65% of construction waste has been diverted from landfills. Additional benefits include the improved health of buildings and better quality of life for residents as a result of the mandatory reduction of unhealthy materials and the encouragement of passive design measures. As Estidama becomes more widely recognized, it is being implemented in other Emirates and countries in the region, including Bahrain and the Seychelles.
GDP is the most cited indicator on competitiveness outcomes, especially for economic growth. Although GDP is being complemented with many income equality indicators, they have specific shortcomings in terms of accurately reflecting the social well-being of the country they are being reported for. Perception-based poll data and ratings data related to drivers of social well-being are very useful to derive implications for UAE and Abu Dhabi in that respect.
Economist Intelligence Unit’s Liveability Index is a reputable study that serves as a proxy for the social well-being of inhabitants in cities around the world. This index puts Abu Dhabi among the world’s top cities in terms of stability and infrastructure.21 The index also reveals that Abu Dhabi can enhance its tremendous achievements by strengthening areas such as healthcare and education. That said, Abu Dhabi leadership has already taken fundamental steps to move forward in those areas. For instance, in healthcare, Health
Authority—Abu Dhabi (HAAD) released a strategic plan in 2014 for the healthcare sector through 2019. In 2014, HAAD noted in another publication that “based on positive experience both locally and regionally, HAAD would like private operators to provide most healthcare, as well as to continue to add required new capacity.”22 Private-sector contributions to healthcare would complement the current capabilities of the state-run healthcare facilities and would help address needed capacity projections. These visionary statements are in line with the fact that from 2012 to 2013, the Emirate’s private sector was responsible for 74% of the growth in the number of physicians and most of the growth in healthcare facilities.23 HAAD’s transparency regarding improvement areas for the healthcare system, which in turn encourages private investors to participate in those areas, is also laudable. Abu Dhabi’s efforts in other areas are additionally under way and are expected to help the Emirate rank even higher in social well-being indicators in the near future.
OUTCOMES: KEY OBJECTIVES OF COMPETITIVENESS POLICIES
SOCIAL WELL-BEING
21. The Economist Intelligence Unit Liveability Index, August 201522. Health Statistics 2013: Reliable Excellence in Healthcare, Health Authority Abu Dhabi, page 3, November 201423. Ibid.
Abu Dhabi Competitiveness Report 2016 25
Abu Dhabi Competitiveness Report 2016 27
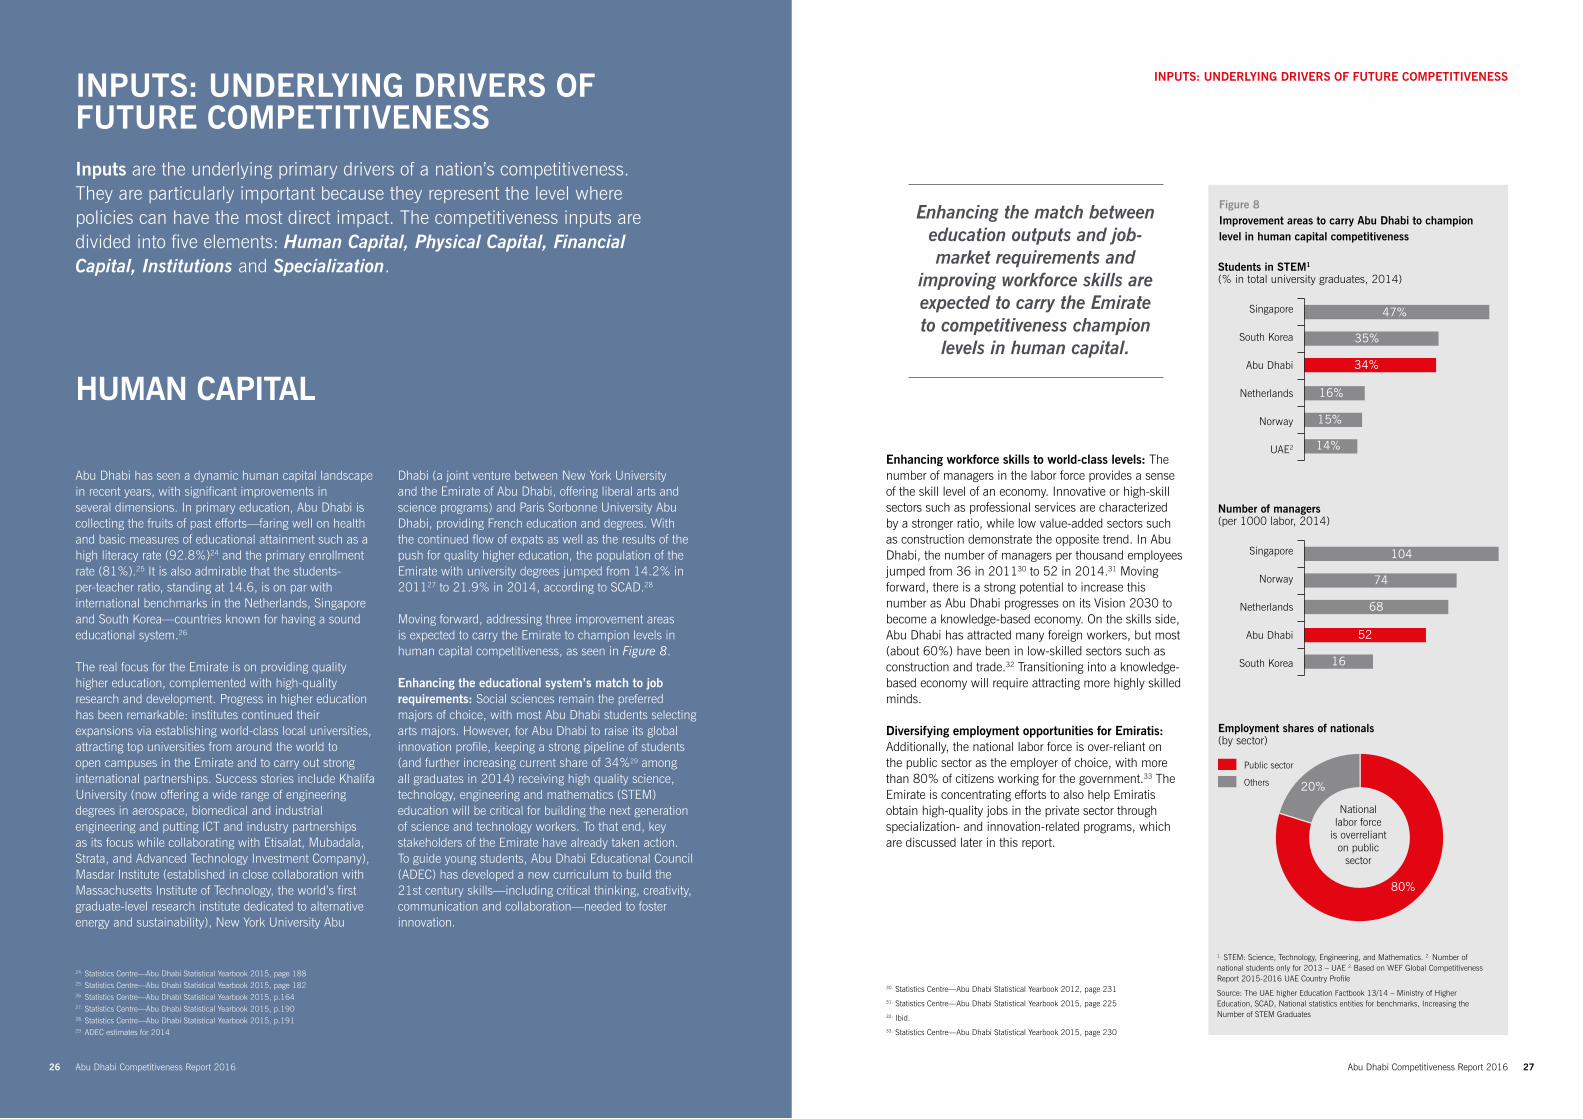
Enhancing the match between education outputs and job-market requirements and
improving workforce skills are expected to carry the Emirate to competitiveness champion
levels in human capital.
Enhancing workforce skills to world-class levels: The number of managers in the labor force provides a sense of the skill level of an economy. Innovative or high-skill sectors such as professional services are characterized by a stronger ratio, while low value-added sectors such as construction demonstrate the opposite trend. In Abu Dhabi, the number of managers per thousand employees jumped from 36 in 201130 to 52 in 2014.31 Moving forward, there is a strong potential to increase this number as Abu Dhabi progresses on its Vision 2030 to become a knowledge-based economy. On the skills side, Abu Dhabi has attracted many foreign workers, but most (about 60%) have been in low-skilled sectors such as construction and trade.32 Transitioning into a knowledge-based economy will require attracting more highly skilled minds.
Diversifying employment opportunities for Emiratis: Additionally, the national labor force is over-reliant on the public sector as the employer of choice, with more than 80% of citizens working for the government.33 The Emirate is concentrating efforts to also help Emiratis obtain high-quality jobs in the private sector through specialization- and innovation-related programs, which are discussed later in this report.
INPUTS: UNDERLYING DRIVERS OF FUTURE COMPETITIVENESSInputs are the underlying primary drivers of a nation’s competitiveness. They are particularly important because they represent the level where policies can have the most direct impact. The competitiveness inputs are divided into five elements: Human Capital, Physical Capital, Financial Capital, Institutions and Specialization.
HUMAN CAPITAL
Abu Dhabi has seen a dynamic human capital landscape in recent years, with significant improvements in several dimensions. In primary education, Abu Dhabi is collecting the fruits of past efforts—faring well on health and basic measures of educational attainment such as a high literacy rate (92.8%)|
24| and the primary enrollment
rate (81%).|
25| It is also admirable that the students-
per-teacher ratio, standing at 14.6, is on par with international benchmarks in the Netherlands, Singapore and South Korea—countries known for having a sound educational system.|
26|
The real focus for the Emirate is on providing quality higher education, complemented with high-quality research and development. Progress in higher education has been remarkable: institutes continued their expansions via establishing world-class local universities, attracting top universities from around the world to open campuses in the Emirate and to carry out strong international partnerships. Success stories include Khalifa University (now offering a wide range of engineering degrees in aerospace, biomedical and industrial engineering and putting ICT and industry partnerships as its focus while collaborating with Etisalat, Mubadala, Strata, and Advanced Technology Investment Company), Masdar Institute (established in close collaboration with Massachusetts Institute of Technology, the world’s first graduate-level research institute dedicated to alternative energy and sustainability), New York University Abu
Dhabi (a joint venture between New York University and the Emirate of Abu Dhabi, offering liberal arts and science programs) and Paris Sorbonne University Abu Dhabi, providing French education and degrees. With the continued flow of expats as well as the results of the push for quality higher education, the population of the Emirate with university degrees jumped from 14.2% in 2011|
27| to 21.9% in 2014, according to SCAD.|
28|
Moving forward, addressing three improvement areas is expected to carry the Emirate to champion levels in human capital competitiveness, as seen in Figure 8.
Enhancing the educational system’s match to job requirements: Social sciences remain the preferred majors of choice, with most Abu Dhabi students selecting arts majors. However, for Abu Dhabi to raise its global innovation profile, keeping a strong pipeline of students (and further increasing current share of 34%29 among all graduates in 2014) receiving high quality science, technology, engineering and mathematics (STEM) education will be critical for building the next generation of science and technology workers. To that end, key stakeholders of the Emirate have already taken action. To guide young students, Abu Dhabi Educational Council (ADEC) has developed a new curriculum to build the 21st century skills—including critical thinking, creativity, communication and collaboration—needed to foster innovation.
24. Statistics Centre—Abu Dhabi Statistical Yearbook 2015, page 18825. Statistics Centre—Abu Dhabi Statistical Yearbook 2015, page 18226. Statistics Centre—Abu Dhabi Statistical Yearbook 2015, p.16427. Statistics Centre—Abu Dhabi Statistical Yearbook 2015, p.19028. Statistics Centre—Abu Dhabi Statistical Yearbook 2015, p.19129. ADEC estimates for 2014
INPUTS: UNDERLYING DRIVERS OF FUTURE COMPETITIVENESS
Figure 8 Improvement areas to carry Abu Dhabi to champion level in human capital competitiveness
Students in STEM1 (% in total university graduates, 2014)
Singapore
South Korea
Abu Dhabi
Netherlands
Norway
UAE2
47%
35%
34%
16%
15%
14%
Number of managers(per 1000 labor, 2014)
Singapore
Norway
Netherlands
Abu Dhabi
South Korea
104
74
68
52
16
Others
Employment shares of nationals(by sector)
Nationallabor force
is overrelianton public
sector
80%
20%
Public sector
30. Statistics Centre—Abu Dhabi Statistical Yearbook 2012, page 23131. Statistics Centre—Abu Dhabi Statistical Yearbook 2015, page 22532. Ibid.33. Statistics Centre—Abu Dhabi Statistical Yearbook 2015, page 230
1. STEM: Science, Technology, Engineering, and Mathematics. 2. Number of national students only for 2013 – UAE 2. Based on WEF Global Competitiveness Report 2015-2016 UAE Country Profile
Source: The UAE higher Education Factbook 13/14 – Ministry of Higher Education, SCAD, National statistics entities for benchmarks, Increasing the Number of STEM Graduates
Abu Dhabi Competitiveness Report 201626
Abu Dhabi Competitiveness Report 2016 29
COMPETITIVENESS SUCCESS STORY
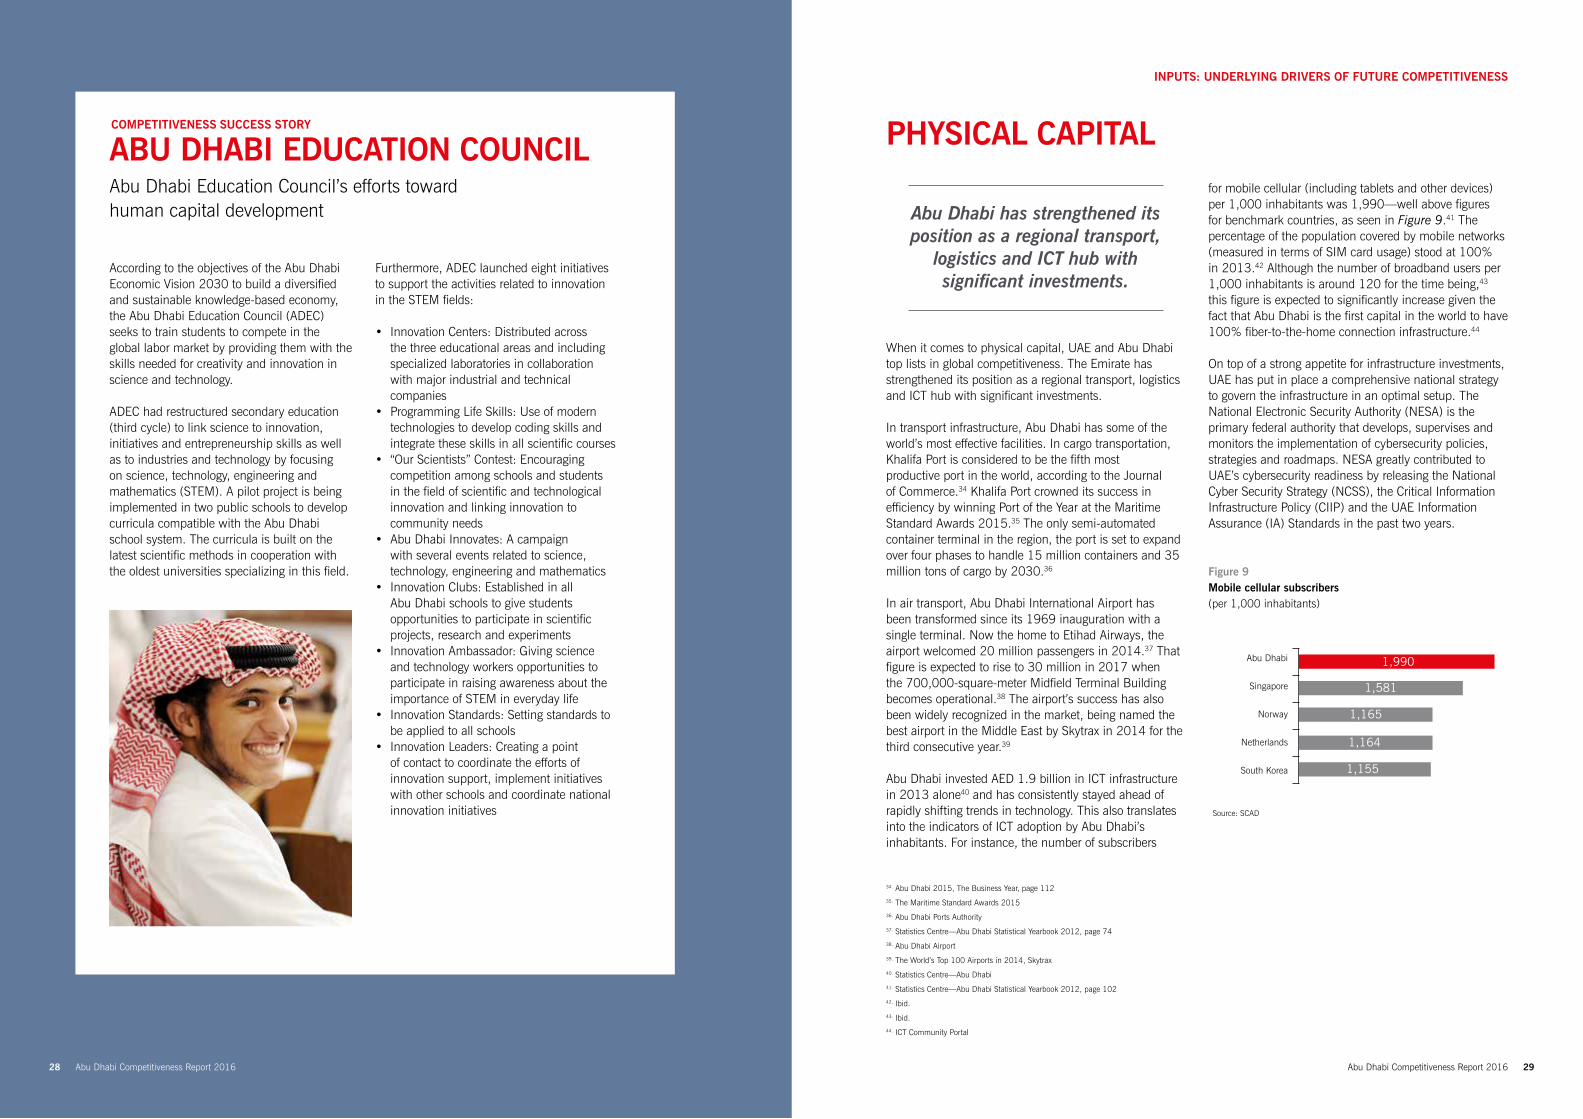
ABU DHABI EDUCATION COUNCILAbu Dhabi Education Council’s efforts toward human capital development
According to the objectives of the Abu Dhabi Economic Vision 2030 to build a diversified and sustainable knowledge-based economy, the Abu Dhabi Education Council (ADEC) seeks to train students to compete in the global labor market by providing them with the skills needed for creativity and innovation in science and technology.
ADEC had restructured secondary education (third cycle) to link science to innovation, initiatives and entrepreneurship skills as well as to industries and technology by focusing on science, technology, engineering and mathematics (STEM). A pilot project is being implemented in two public schools to develop curricula compatible with the Abu Dhabi school system. The curricula is built on the latest scientific methods in cooperation with the oldest universities specializing in this field.
Furthermore, ADEC launched eight initiatives to support the activities related to innovation in the STEM fields:
• Innovation Centers: Distributed across the three educational areas and including specialized laboratories in collaboration with major industrial and technical companies
• Programming Life Skills: Use of modern technologies to develop coding skills and integrate these skills in all scientific courses
• “Our Scientists” Contest: Encouraging competition among schools and students in the field of scientific and technological innovation and linking innovation to community needs
• Abu Dhabi Innovates: A campaign with several events related to science, technology, engineering and mathematics
• Innovation Clubs: Established in all Abu Dhabi schools to give students opportunities to participate in scientific projects, research and experiments
• Innovation Ambassador: Giving science and technology workers opportunities to participate in raising awareness about the importance of STEM in everyday life
• Innovation Standards: Setting standards to be applied to all schools
• Innovation Leaders: Creating a point of contact to coordinate the efforts of innovation support, implement initiatives with other schools and coordinate national innovation initiatives
PHYSICAL CAPITAL
INPUTS: UNDERLYING DRIVERS OF FUTURE COMPETITIVENESS
Abu Dhabi has strengthened its position as a regional transport,
logistics and ICT hub with significant investments.
When it comes to physical capital, UAE and Abu Dhabi top lists in global competitiveness. The Emirate has strengthened its position as a regional transport, logistics and ICT hub with significant investments.
In transport infrastructure, Abu Dhabi has some of the world’s most effective facilities. In cargo transportation, Khalifa Port is considered to be the fifth most productive port in the world, according to the Journal of Commerce.34 Khalifa Port crowned its success in efficiency by winning Port of the Year at the Maritime Standard Awards 2015.35 The only semi-automated container terminal in the region, the port is set to expand over four phases to handle 15 million containers and 35 million tons of cargo by 2030.36
In air transport, Abu Dhabi International Airport has been transformed since its 1969 inauguration with a single terminal. Now the home to Etihad Airways, the airport welcomed 20 million passengers in 2014.37 That figure is expected to rise to 30 million in 2017 when the 700,000-square-meter Midfield Terminal Building becomes operational.38 The airport’s success has also been widely recognized in the market, being named the best airport in the Middle East by Skytrax in 2014 for the third consecutive year.39
Abu Dhabi invested AED 1.9 billion in ICT infrastructure in 2013 alone40 and has consistently stayed ahead of rapidly shifting trends in technology. This also translates into the indicators of ICT adoption by Abu Dhabi’s inhabitants. For instance, the number of subscribers
for mobile cellular (including tablets and other devices) per 1,000 inhabitants was 1,990—well above figures for benchmark countries, as seen in Figure 9.41 The percentage of the population covered by mobile networks (measured in terms of SIM card usage) stood at 100% in 2013.42 Although the number of broadband users per 1,000 inhabitants is around 120 for the time being,43 this figure is expected to significantly increase given the fact that Abu Dhabi is the first capital in the world to have 100% fiber-to-the-home connection infrastructure.44
On top of a strong appetite for infrastructure investments, UAE has put in place a comprehensive national strategy to govern the infrastructure in an optimal setup. The National Electronic Security Authority (NESA) is the primary federal authority that develops, supervises and monitors the implementation of cybersecurity policies, strategies and roadmaps. NESA greatly contributed to UAE’s cybersecurity readiness by releasing the National Cyber Security Strategy (NCSS), the Critical Information Infrastructure Policy (CIIP) and the UAE Information Assurance (IA) Standards in the past two years.
34. Abu Dhabi 2015, The Business Year, page 11235. The Maritime Standard Awards 2015 36. Abu Dhabi Ports Authority37. Statistics Centre—Abu Dhabi Statistical Yearbook 2012, page 7438. Abu Dhabi Airport39. The World’s Top 100 Airports in 2014, Skytrax40. Statistics Centre—Abu Dhabi 41. Statistics Centre—Abu Dhabi Statistical Yearbook 2012, page 10242. Ibid.43. Ibid.44. ICT Community Portal
Source: SCAD
Mobile cellular subscribers(per 1000 population)
Abu Dhabi
Singapore
Norway
Netherlands
South Korea
1,990
1,581
1,165
1,164
1,155
Figure 9 Mobile cellular subscribers (per 1,000 inhabitants)
Abu Dhabi Competitiveness Report 201628
Abu Dhabi Competitiveness Report 201630 Abu Dhabi Competitiveness Report 2016 31
INPUTS: UNDERLYING DRIVERS OF FUTURE COMPETITIVENESS
FINANCIAL CAPITAL
UAE has five banks in 2015 list of the 50 Safest Banks in Emerging Markets. In fact, the National Bank of Abu Dhabi
tops the list.
Access to financial capital is the main catalyst for business growth globally. The case for enterprise growth is no different for Abu Dhabi, and the Emirate is doing its best to ensure enterprises have sufficient and easy options to access financial capital along their entire growth path.
UAE has continued to accumulate both federal and sovereign wealth financial capital in recent years. In 2015, UAE’s reported financial reserves reached $76.8 billion45—a more than 60% increase since $48 billion in early 201346—whereas assets under management of the Emirate’s sovereign wealth fund (ADIA) were more than tenfold of this figure, reported to be more than $773 billion.47
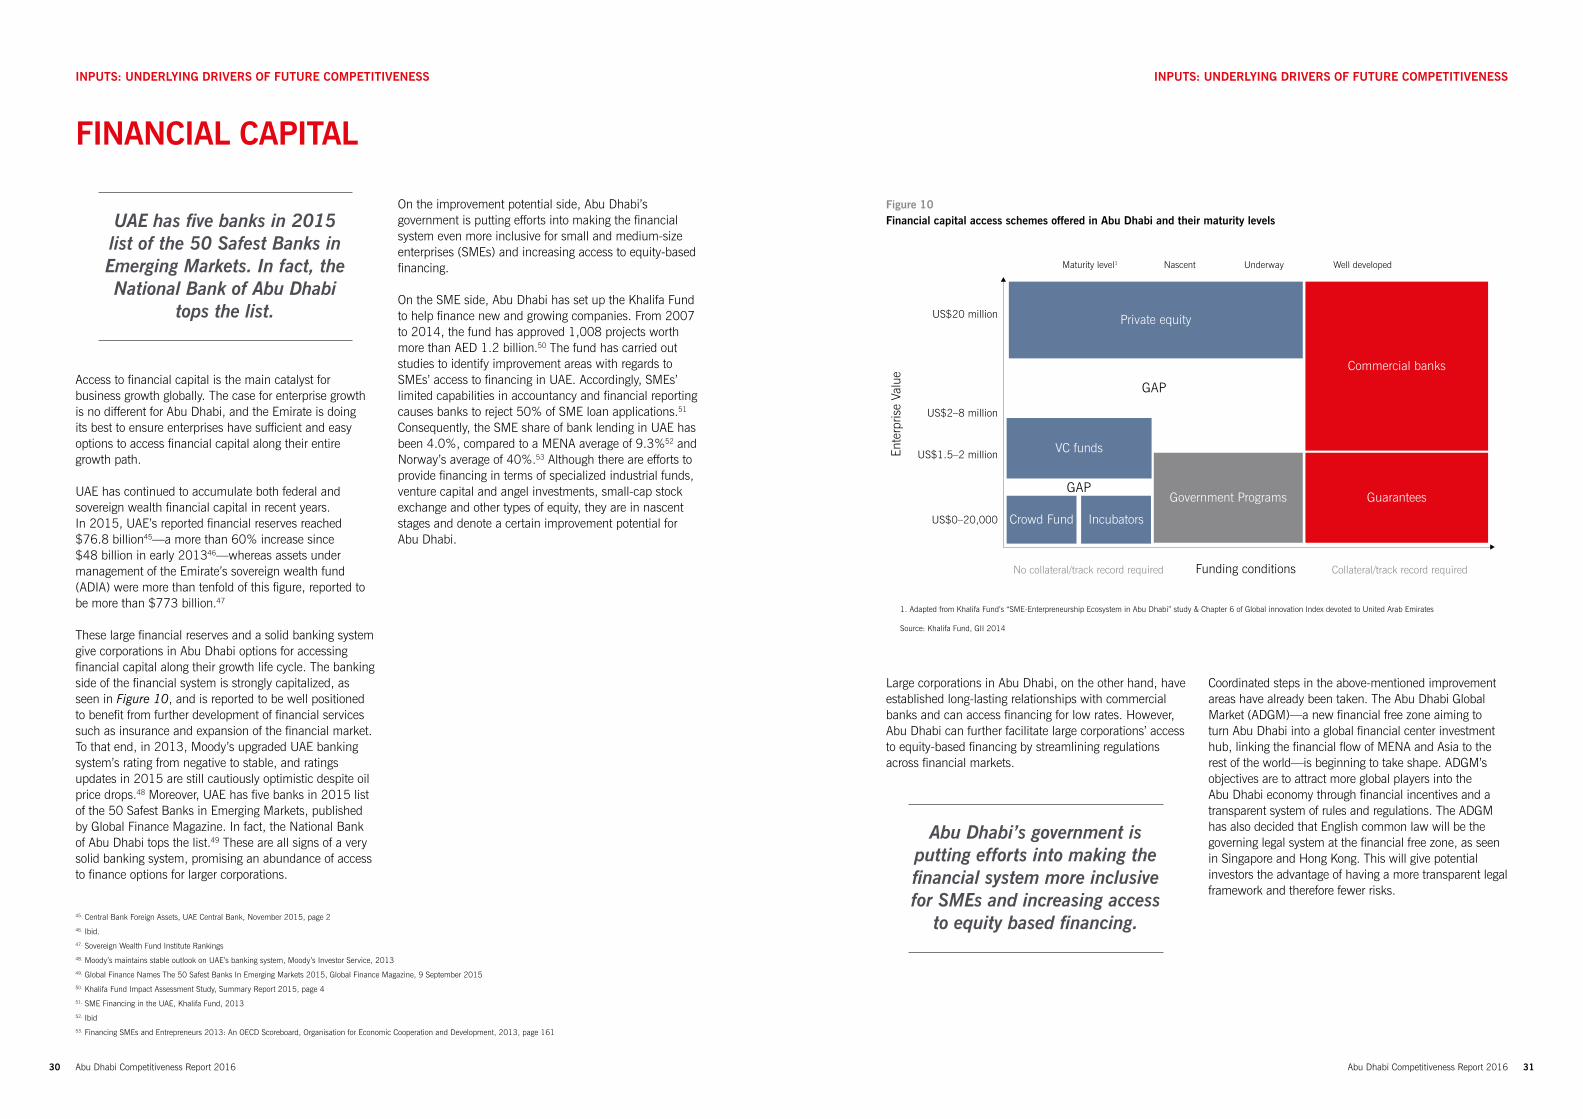
These large financial reserves and a solid banking system give corporations in Abu Dhabi options for accessing financial capital along their growth life cycle. The banking side of the financial system is strongly capitalized, as seen in Figure 10, and is reported to be well positioned to benefit from further development of financial services such as insurance and expansion of the financial market. To that end, in 2013, Moody’s upgraded UAE banking system’s rating from negative to stable, and ratings updates in 2015 are still cautiously optimistic despite oil price drops.48 Moreover, UAE has five banks in 2015 list of the 50 Safest Banks in Emerging Markets, published by Global Finance Magazine. In fact, the National Bank of Abu Dhabi tops the list.49 These are all signs of a very solid banking system, promising an abundance of access to finance options for larger corporations.
On the improvement potential side, Abu Dhabi’s government is putting efforts into making the financial system even more inclusive for small and medium-size enterprises (SMEs) and increasing access to equity-based financing.
On the SME side, Abu Dhabi has set up the Khalifa Fund to help finance new and growing companies. From 2007 to 2014, the fund has approved 1,008 projects worth more than AED 1.2 billion.50 The fund has carried out studies to identify improvement areas with regards to SMEs’ access to financing in UAE. Accordingly, SMEs’ limited capabilities in accountancy and financial reporting causes banks to reject 50% of SME loan applications.51 Consequently, the SME share of bank lending in UAE has been 4.0%, compared to a MENA average of 9.3%52 and Norway’s average of 40%.53 Although there are efforts to provide financing in terms of specialized industrial funds, venture capital and angel investments, small-cap stock exchange and other types of equity, they are in nascent stages and denote a certain improvement potential for Abu Dhabi.
Large corporations in Abu Dhabi, on the other hand, have established long-lasting relationships with commercial banks and can access financing for low rates. However, Abu Dhabi can further facilitate large corporations’ access to equity-based financing by streamlining regulations across financial markets.
Abu Dhabi’s government is putting efforts into making the financial system more inclusive for SMEs and increasing access
to equity based financing.45. Central Bank Foreign Assets, UAE Central Bank, November 2015, page 2 46. Ibid. 47. Sovereign Wealth Fund Institute Rankings48. Moody’s maintains stable outlook on UAE’s banking system, Moody’s Investor Service, 2013 49. Global Finance Names The 50 Safest Banks In Emerging Markets 2015, Global Finance Magazine, 9 September 201550. Khalifa Fund Impact Assessment Study, Summary Report 2015, page 451. SME Financing in the UAE, Khalifa Fund, 201352. Ibid53. Financing SMEs and Entrepreneurs 2013: An OECD Scoreboard, Organisation for Economic Cooperation and Development, 2013, page 161
US$20 million
Maturity level1 Nascent Underway Well developed
US$2–8 million
No collateral/track record required Collateral/track record required
US$0–20,000
US$1.5–2 million
1. Adapted from Khalifa Fund’s “SME-Enterpreneurship Ecosystem in Abu Dhabi” study & Chapter 6 of Global innovation Index devoted to United Arab Emirates
Source: Khalifa Fund, GII 2014
GAP
Private equity
VC funds
Crowd Fund Incubators
Government Programs GuaranteesGAP
Funding conditions
Ente
rpris
e Va
lue
Commercial banks
Coordinated steps in the above-mentioned improvement areas have already been taken. The Abu Dhabi Global Market (ADGM)—a new financial free zone aiming to turn Abu Dhabi into a global financial center investment hub, linking the financial flow of MENA and Asia to the rest of the world—is beginning to take shape. ADGM’s objectives are to attract more global players into the Abu Dhabi economy through financial incentives and a transparent system of rules and regulations. The ADGM has also decided that English common law will be the governing legal system at the financial free zone, as seen in Singapore and Hong Kong. This will give potential investors the advantage of having a more transparent legal framework and therefore fewer risks.
Figure 10 Financial capital access schemes offered in Abu Dhabi and their maturity levels
INPUTS: UNDERLYING DRIVERS OF FUTURE COMPETITIVENESS
Abu Dhabi Competitiveness Report 201632 Abu Dhabi Competitiveness Report 2016 33
The UAE has ranked top in MENA region in the World
Bank’s Doing Business ranking for the third year in a row
Both UAE and Abu Dhabi have strong, mandated and committed institutions in place to support the implementation of national and Emirate-level visions, strategies and policies. The strength of UAE institutions has already been recognized in multiple international studies and indices. The WEF Global Competitiveness Report 2015–2016 ranks UAE ninth out of 140 countries for institutions, emphasizing the country’s reliable, sound and fair institutional environment.54 The UAE has also ranked top in MENA region in World Bank’s Doing Business ranking for the third year in a row.55 The report, which measures the performance of 189 countries in facilitating an institutional and regulatory environment for opening and running businesses, ranks UAE 31st globally, far ahead of some of its regional peers such as Bahrain (65th), Qatar (68th) and Saudi Arabia (82nd)56 as seen in Figure 11.
Abu Dhabi’s institutions have also proved their strengths in facilitating business growth, investment and economic development. The Abu Dhabi Business Center has substantially reduced complexity, streamlined the procedures to start a business, and prepared a comprehensive plan and actions to improve business procedures and timelines.
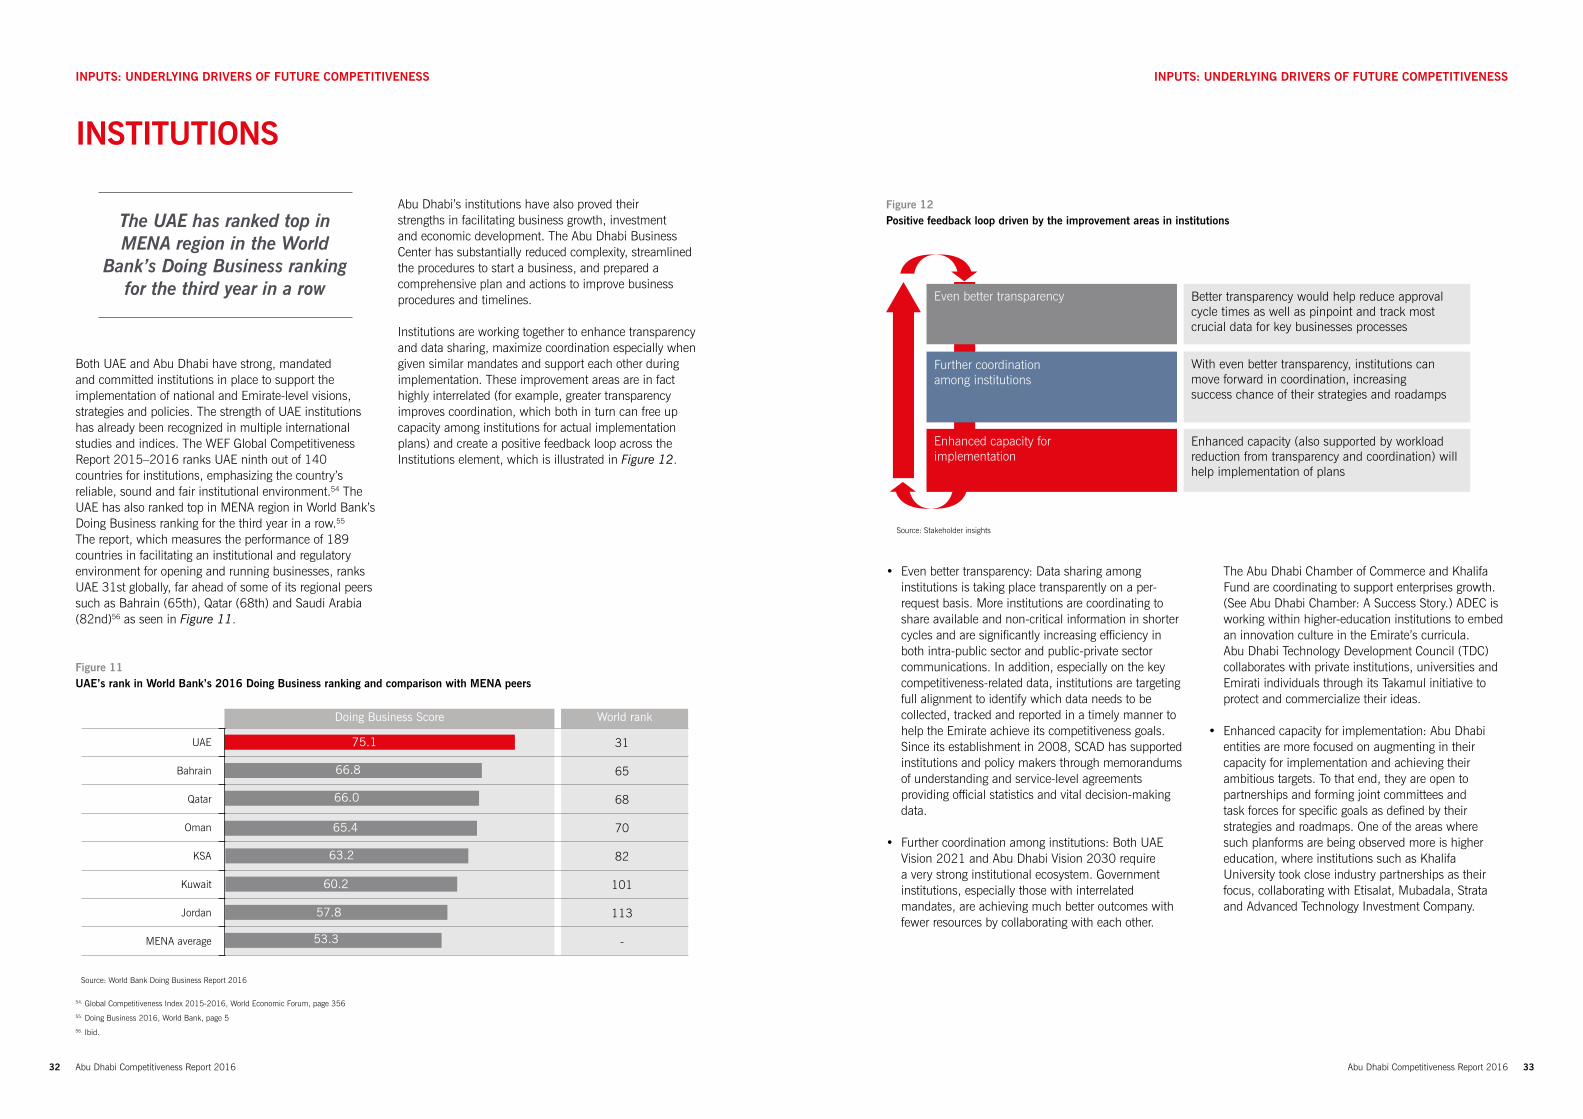
Institutions are working together to enhance transparency and data sharing, maximize coordination especially when given similar mandates and support each other during implementation. These improvement areas are in fact highly interrelated (for example, greater transparency improves coordination, which both in turn can free up capacity among institutions for actual implementation plans) and create a positive feedback loop across the Institutions element, which is illustrated in Figure 12.
INPUTS: UNDERLYING DRIVERS OF FUTURE COMPETITIVENESS
INSTITUTIONS
Source: World Bank Doing Business Report 2016
UAE
Bahrain
Qatar
Oman
KSA
Kuwait
Jordan
MENA average
31
65
68
70
82
101
113
-
75.1
Doing Business Score World rank
66.8
66.0
65.4
63.2
60.2
57.8
53.3
• Even better transparency: Data sharing among institutions is taking place transparently on a per-request basis. More institutions are coordinating to share available and non-critical information in shorter cycles and are significantly increasing efficiency in both intra-public sector and public-private sector communications. In addition, especially on the key competitiveness-related data, institutions are targeting full alignment to identify which data needs to be collected, tracked and reported in a timely manner to help the Emirate achieve its competitiveness goals. Since its establishment in 2008, SCAD has supported institutions and policy makers through memorandums of understanding and service-level agreements providing official statistics and vital decision-making data.
• Further coordination among institutions: Both UAE Vision 2021 and Abu Dhabi Vision 2030 require a very strong institutional ecosystem. Government institutions, especially those with interrelated mandates, are achieving much better outcomes with fewer resources by collaborating with each other.
Source: Stakeholder insights
Even better transparency Better transparency would help reduce approval cycle times as well as pinpoint and track most crucial data for key businesses processes
With even better transparency, institutions can move forward in coordination, increasingsuccess chance of their strategies and roadamps
Enhanced capacity (also supported by workload reduction from transparency and coordination) will help implementation of plans
Further coordinationamong institutions
Enhanced capacity forimplementation
The Abu Dhabi Chamber of Commerce and Khalifa Fund are coordinating to support enterprises growth. (See Abu Dhabi Chamber: A Success Story.) ADEC is working within higher-education institutions to embed an innovation culture in the Emirate’s curricula. Abu Dhabi Technology Development Council (TDC) collaborates with private institutions, universities and Emirati individuals through its Takamul initiative to protect and commercialize their ideas.
• Enhanced capacity for implementation: Abu Dhabi entities are more focused on augmenting in their capacity for implementation and achieving their ambitious targets. To that end, they are open to partnerships and forming joint committees and task forces for specific goals as defined by their strategies and roadmaps. One of the areas where such planforms are being observed more is higher education, where institutions such as Khalifa University took close industry partnerships as their focus, collaborating with Etisalat, Mubadala, Strata and Advanced Technology Investment Company.
Figure 12 Positive feedback loop driven by the improvement areas in institutions
Figure 11 UAE’s rank in World Bank’s 2016 Doing Business ranking and comparison with MENA peers
54. Global Competitiveness Index 2015-2016, World Economic Forum, page 356 55. Doing Business 2016, World Bank, page 5 56. Ibid.
INPUTS: UNDERLYING DRIVERS OF FUTURE COMPETITIVENESS
Abu Dhabi Competitiveness Report 201634 Abu Dhabi Competitiveness Report 2016 35
INPUTS: UNDERLYING DRIVERS OF FUTURE COMPETITIVENESS
SPECIALIZATION
Economic specialization within the context of industries is an important characteristic of competitiveness. In its traditional sense, it is possible to have two different yet related perspectives on specialization:
1. Specialization as in measuring from how many industries a country generates significant output, therefore a proxy for how diversified a country is in its own economic structure.
2. Specialization of a country in relative terms to its region, as in measuring how different or similar a country’s economic structure is, from that of its region.
The first perspective of specialization for Abu Dhabi is in fact an indicator of the progress of the diversification ambitions. In this context, hydrocarbon’s share of GDP in constant 2007 prices decreased from 59.3% in 2005 to 50.5% in 2014—indicating diversification is on track.57 As discussed in the productivity section, for Abu-Dhabi to keep productivity levels high and boost social well-being with higher wages, the Emirate will need to specialize in the next most-productive industries to hydrocarbons, such as knowledge-intensive sectors and financial services. In this context, Abu Dhabi continues to develop clusters that specialize in petrochemicals, aerospace and defense manufacturing and financial services, among others.
Hydrocarbon’s share of GDP decreased from 59.3% in 2005 to 50.5% in 2014—indicating that diversification is on track
The second perspective paints a more interesting picture of how differentiated a country’s economic value added structure is from its region. More specifically, if a country is more specialized in the relative sense, this means the country is more focused in certain sectors than its geographic competition—that is, it has succeeded in concentrating them within its boundaries with agglomeration benefits. Relative specialization in the right economic structure, such as covering value-added industries with agglomeration benefits, in turn brings competitive advantage to that country. Although the unavailability of data on a detailed sub-sector level for the GCC region prevents further analysis of the specifics of Abu Dhabi, the latest literature reveals implications about which sectors make more sense to specialize in.58 For instance, construction and medium-tech manufacturing, where Abu Dhabi has specialized in the past, has been observed to not bring significant location-based agglomeration benefits.59 Although most services are spread across regions, one counterintuitive finding is that financial services is quite concentrated (that is, it is an area for certain countries to specialize in).60 This is probably driven by the fact that for their headquarters and regional offices, most financial services firms require highly skilled human capital, which then increases the location-based agglomeration benefits. In that sense, Abu Dhabi’s recent progress in the financial services sector GDP growth and increasing FDI in this sector are fundamental steps taken to specialize in the right sectors. High-technology manufacturing has also been observed to present the biggest benefits to geographical concentration among all manufacturing sectors while also being quite open to international trade to receive necessary inputs.61 In that sense, Abu Dhabi’s Masdar City initiative is a visionary step that is likely to provide agglomeration benefits for renewable energy.
57. Statistics Centre—Abu Dhabi Statistical Yearbook 2015, page 1758. Regional Competitiveness and Smart Specialization in Europe, Netherlands Environmental Assessment Agency, 201359. Ibid., page 1460. Ibid., page 7361. Regional Competitiveness and Smart Specialization in Europe, Netherlands Environmental Assessment Agency, 2013, page 73–80
INPUTS: UNDERLYING DRIVERS OF FUTURE COMPETITIVENESS
Abu Dhabi Competitiveness Report 2016 37
OUTPUTS—EARLY INDICATORS OF FUTURE COMPETITIVENESSOutputs are intermediate performance indicators and early indicators of competitiveness and could be seen as vital signals of an economy’s status. The outputs are divided into five elements: Productivity, Employment, Exports, Foreign Direct Investment (FDI) and Innovation.
PRODUCTIVITY
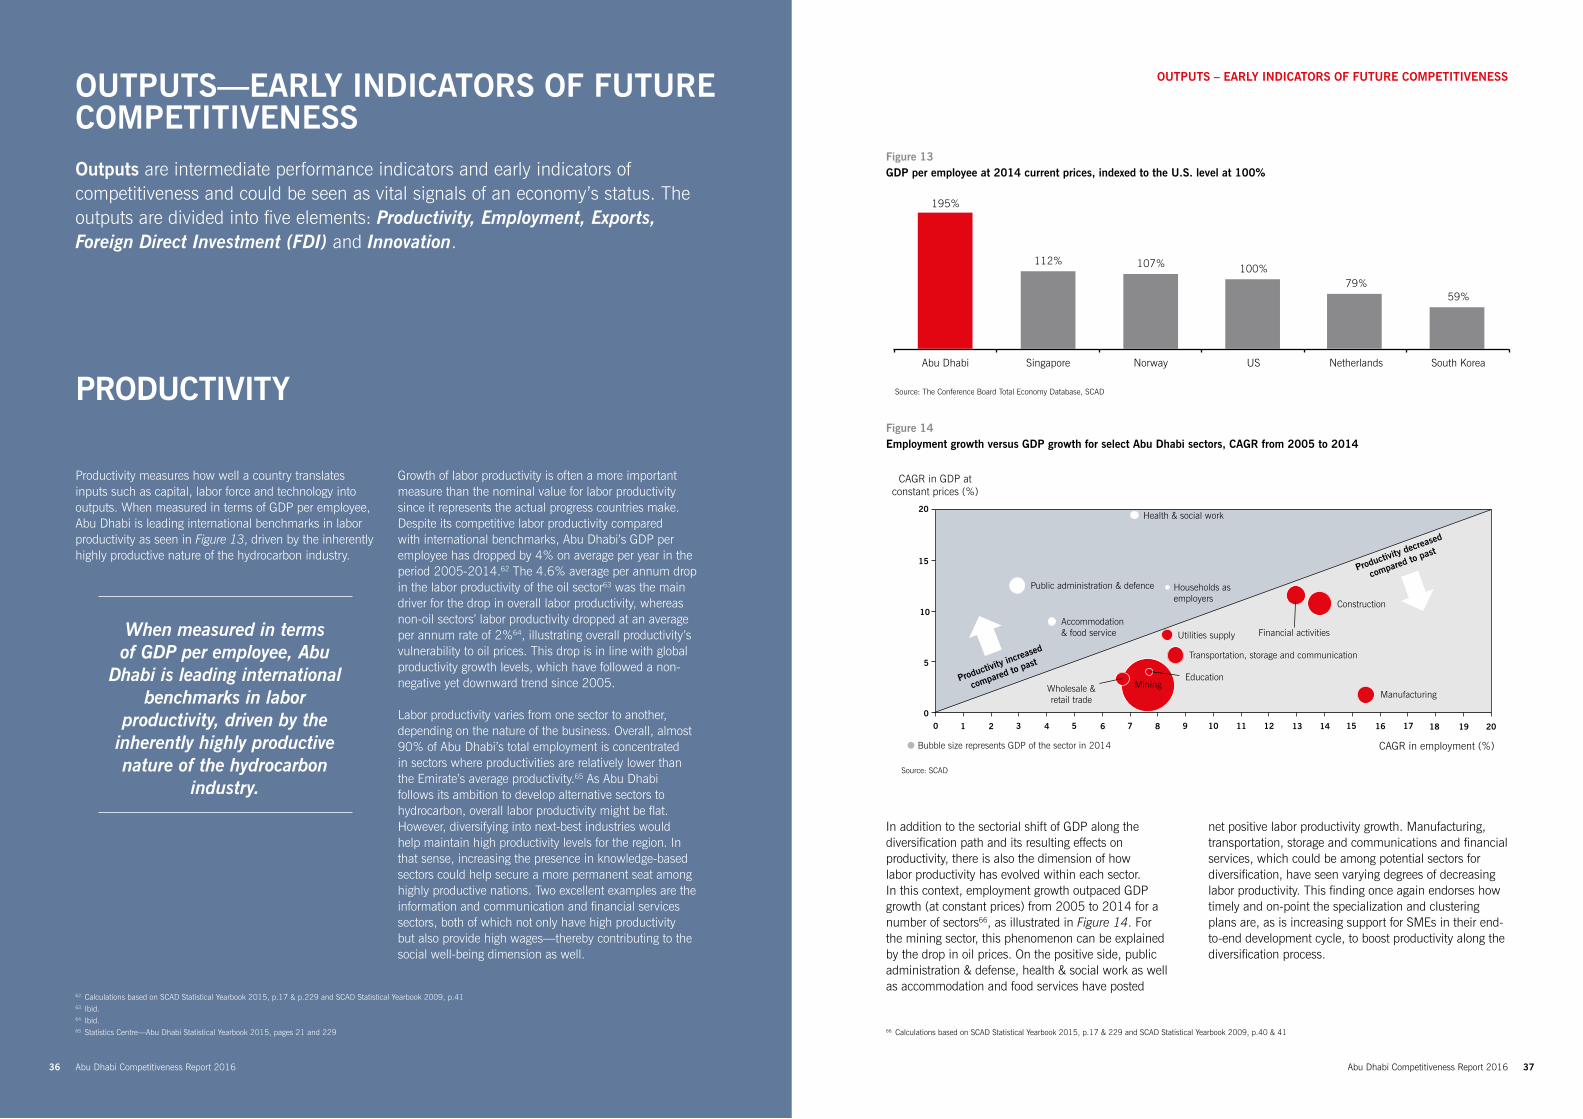
Productivity measures how well a country translates inputs such as capital, labor force and technology into outputs. When measured in terms of GDP per employee, Abu Dhabi is leading international benchmarks in labor productivity as seen in Figure 13, driven by the inherently highly productive nature of the hydrocarbon industry.
When measured in terms of GDP per employee, Abu
Dhabi is leading international benchmarks in labor
productivity, driven by the inherently highly productive nature of the hydrocarbon
industry.
Growth of labor productivity is often a more important measure than the nominal value for labor productivity since it represents the actual progress countries make. Despite its competitive labor productivity compared with international benchmarks, Abu Dhabi’s GDP per employee has dropped by 4% on average per year in the period 2005-2014.62 The 4.6% average per annum drop in the labor productivity of the oil sector63 was the main driver for the drop in overall labor productivity, whereas non-oil sectors’ labor productivity dropped at an average per annum rate of 2%64, illustrating overall productivity’s vulnerability to oil prices. This drop is in line with global productivity growth levels, which have followed a non-negative yet downward trend since 2005.
Labor productivity varies from one sector to another, depending on the nature of the business. Overall, almost 90% of Abu Dhabi’s total employment is concentrated in sectors where productivities are relatively lower than the Emirate’s average productivity.65 As Abu Dhabi follows its ambition to develop alternative sectors to hydrocarbon, overall labor productivity might be flat. However, diversifying into next-best industries would help maintain high productivity levels for the region. In that sense, increasing the presence in knowledge-based sectors could help secure a more permanent seat among highly productive nations. Two excellent examples are the information and communication and financial services sectors, both of which not only have high productivity but also provide high wages—thereby contributing to the social well-being dimension as well.
CAGR in GDP atconstant prices (%)
CAGR in employment (%)
Source: SCAD
Bubble size represents GDP of the sector in 2014
0
Health & social work
Public administration & defence Households as employers
Accommodation& food service Financial activities
Productivity decreased
compared to past
Transportation, storage and communication
EducationWholesale &retail trade Manufacturing
Mining
Construction
Utilities supply
0
5
10
15
20
1 2 3 4 5 6 7 8 9 10 11 12 13 14 15 16 17 18 19 20
Productivity increased
compared to past
Source: The Conference Board Total Economy Database, SCAD
Abu Dhabi South KoreaNetherlandsUSNorwaySingapore
195%
59%79%
100%107%112%
Figure 14 Employment growth versus GDP growth for select Abu Dhabi sectors, CAGR from 2005 to 2014
Figure 13 GDP per employee at 2014 current prices, indexed to the U.S. level at 100%
OUTPUTS – EARLY INDICATORS OF FUTURE COMPETITIVENESS
62. Calculations based on SCAD Statistical Yearbook 2015, p.17 & p.229 and SCAD Statistical Yearbook 2009, p.4163. Ibid.64. Ibid.65. Statistics Centre—Abu Dhabi Statistical Yearbook 2015, pages 21 and 229
In addition to the sectorial shift of GDP along the diversification path and its resulting effects on productivity, there is also the dimension of how labor productivity has evolved within each sector. In this context, employment growth outpaced GDP growth (at constant prices) from 2005 to 2014 for a number of sectors66, as illustrated in Figure 14. For the mining sector, this phenomenon can be explained by the drop in oil prices. On the positive side, public administration & defense, health & social work as well as accommodation and food services have posted
net positive labor productivity growth. Manufacturing, transportation, storage and communications and financial services, which could be among potential sectors for diversification, have seen varying degrees of decreasing labor productivity. This finding once again endorses how timely and on-point the specialization and clustering plans are, as is increasing support for SMEs in their end-to-end development cycle, to boost productivity along the diversification process.
66. Calculations based on SCAD Statistical Yearbook 2015, p.17 & 229 and SCAD Statistical Yearbook 2009, p.40 & 41
Abu Dhabi Competitiveness Report 201636
Abu Dhabi Competitiveness Report 2016 39
COMPETITIVENESS SUCCESS STORY
ABU DHABI CHAMBERFranchising as a tool for increasing the international competitiveness of the private sector
In 2013, the Abu Dhabi Chamber of Commerce and Industry (ADCCI) embarked on a mission to establish the Emirates Association for Franchise Development to organize franchising opportunities in the UAE with a focus on Abu Dhabi. This initiative was prompted by entrepreneurs’ need to quickly enter into new activities with minimal risks by adopting a process, product or service successfully tested in other parts of the world.
The chamber organized three exhibitions and conferences in 2013, 2014 and 2015 with more than 1,000 franchisees and franchisers. During these events, entrepreneurs were trained, guided and supported in starting a franchise business or buying a new franchise. The events also provided networking opportunities, highlighted best practices in international franchising, and were used as a platform for constructive discussions and debates by world-renowned experts, investors, practitioners, major players in the private sector, and relevant government organizations.
In organizing these events, ADCCI collaborated with the International Franchise Association, the World Franchise Council, legal experts, local and international banks and other local government agencies, most notably the Khalifa Fund. The events attracted world-class franchising companies from the United States, France, the United Kingdom, Canada, Germany and South Africa, among many others. The events provided a networking platform for local SMEs with global franchising associations, promoted business-to-business (B2B) meetings and supported local brands and SMEs to expand into regional (especially the GCC) and international markets. After the event, local SMEs participated in international franchising events and conferences that culminated in participation in the New York franchising event and conference in June 2015.
OUTPUTS—EARLY INDICATORS OF FUTURE COMPETITIVENESS
EMPLOYMENTAbu Dhabi’s employed population has been steadily growing, driven by increased economic activity and market demand. In 2014, Abu Dhabi had slightly more than two million workers67—growing by 5% from 2013 levels and generating almost 90,000 jobs.68 The unemployment rate stood at 3.4%69, comparable with other regional economies. Both overall unemployment (at 3.4%70) and youth unemployment (12%71) levels for Abu Dhabi are much better compared to both world averages (5.9%72 and 13%73 respectively) and developed economies averages (7.8%74 and 16.7%75).
Youth and females remain the two priority areas for employment to support
Vision 2030
Youth make up 16% of Abu Dhabi’s overall population76 but 37% of its unemployed population77. The main driver for this unemployment is the mismatch of graduates’ specializations with market demands. This skills mismatch is a problem that almost every developed country now faces. Both B20 and G20, representing the business and government legs of world’s 20 largest economies, put skills mismatches on their agenda in November 2015.78 UAE and Abu Dhabi are pioneers in tackling this problem, with many initiatives being either already completed or well under way. Complementing this with more efforts to provide quality higher education and to develop targeted scalable innovative programs to increase youth employment will be key to harness the potential of Abu Dhabi’s youth.
Women represent almost 60% of all people enrolled in tertiary education79, yet they only have about a 14% share in the entire labor force.80 Part of the reason for this is the influx of male laborers in construction
67. Statistics Centre—Abu Dhabi Statistical Yearbook 2015, page 21368. Statistics Centre—Abu Dhabi Statistical Yearbook 2015, pages 213 and 21569. Statistics Centre—Abu Dhabi Statistical Yearbook 2015, page 21370. Ibid.71. Statistics Centre—Abu Dhabi Statistical Yearbook 2015, pages 216 and 24072. World Employment and Social Outlook: Trends 2015,
International Labour Organization, page 1673. Ibid, page 2174. Ibid, page 1975. Ibid, page 34
76. Statistics Centre—Abu Dhabi Statistical Yearbook 2015, page 11877. Statistics Centre—Abu Dhabi Statistical Yearbook 2015, page 24078. B20 Employment Task Force Policy Paper, B20 Turkey, September 2015, page 1579. The UAE Higher Education Fact Book 2013/2014, Ministry of Higher Education &
Scientific Research, page 3980. Statistics Centre—Abu Dhabi Statistical Yearbook 2015, page 21281. The percentage of economically active women above age 1582. Statistics Centre—Abu Dhabi Statistical Yearbook 2015, page 21783. Arab Women Entrepreneurs: Untraditional Choice, The Economist, 13 July 2013
and infrastructure-related industries, where there are few jobs for women. Yet as Figure 15 illustrates, the refined female labor force participation rate81 stands at 45%82, signaling an improvement potential when compared with benchmarks like Norway, Singapore and the Netherlands. Bringing the Emirate’s educated women into the labor force and connecting them with high-quality jobs would give a fundamental boost to economic growth. Initiatives are already under way to promote women as leaders. For instance, the Abu Dhabi Hub of the Global Shapers Community, launched by the World Economic Forum in 2013, seeks to support women through Fikrati, a competition aimed at fostering an entrepreneurial culture among Emirati women. On a related note, more tech entrepreneurs in the Middle East are women than in many other parts of the world: women account for 35% of tech entrepreneurs in the region, compared with the global average of 10%.83 To that end, following the innovation imperative will be an important drive for women to take an even larger role in the labor force.
Figure 15 Female labor force refined participation rates, 2014
61%
59%
58%
50%
45%
Norway
Singapore
Netherlands
South Korea
Abu Dhabi
Source: SCAD, ILD World Employment and Social Outlook 2015
Abu Dhabi Competitiveness Report 201638
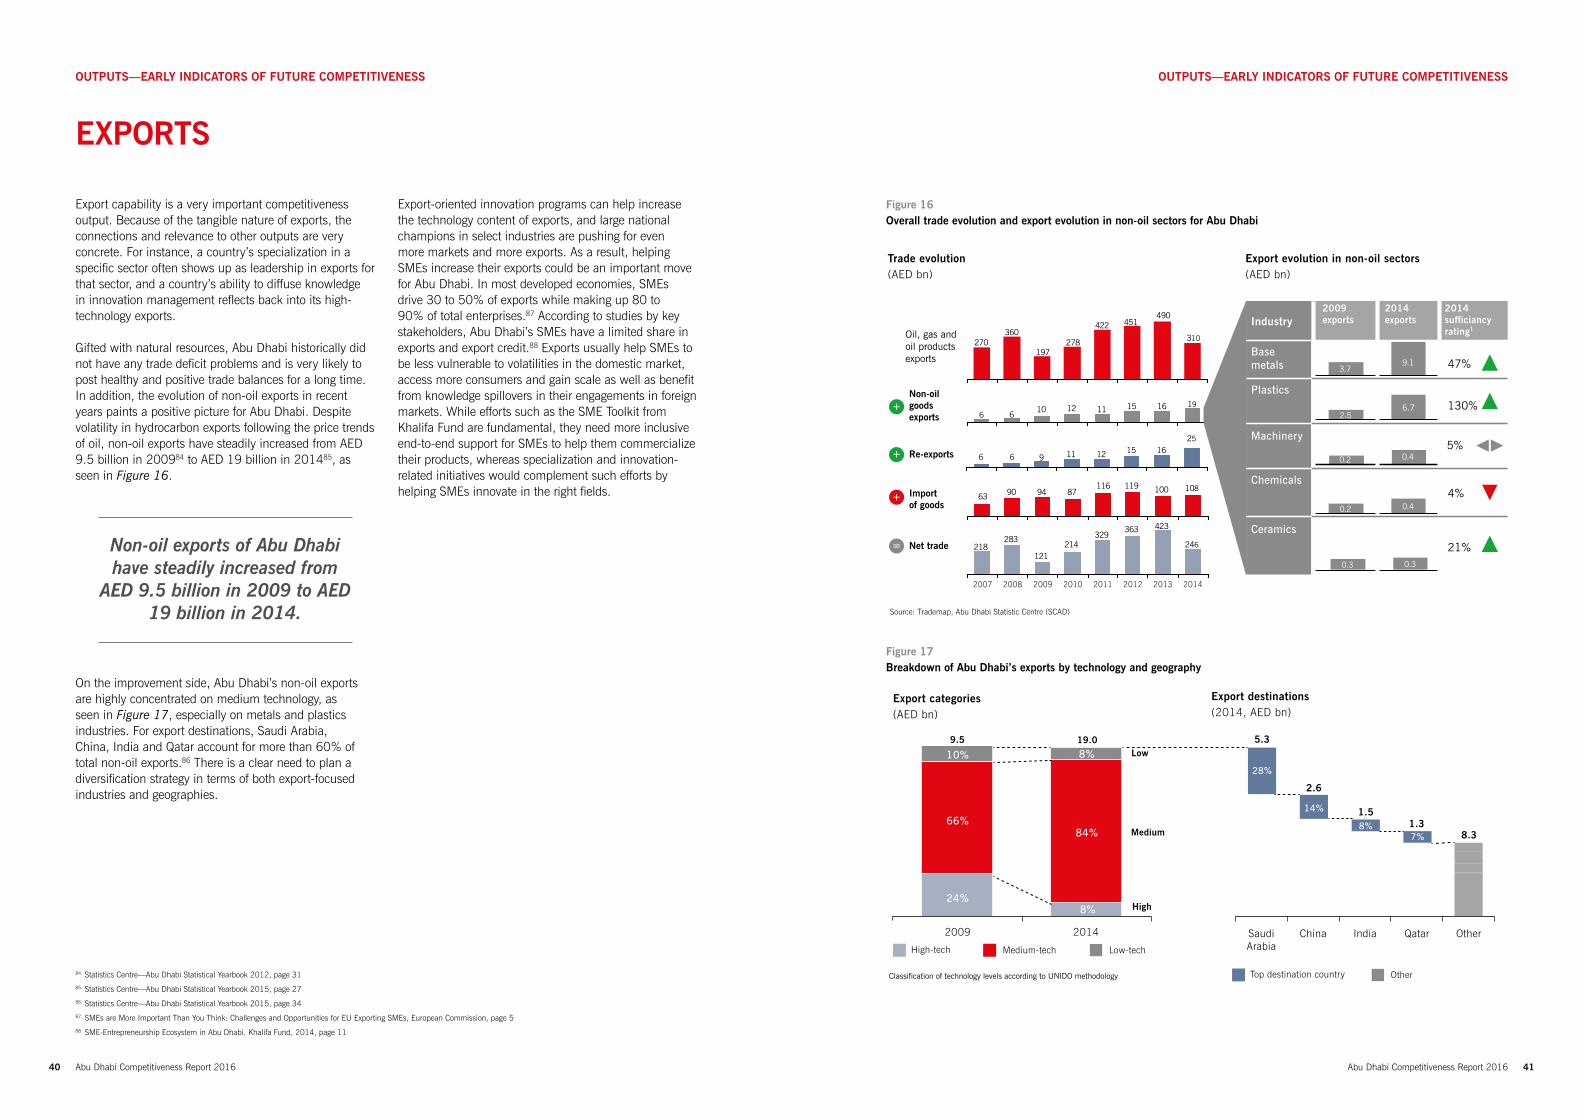
Abu Dhabi Competitiveness Report 201640 Abu Dhabi Competitiveness Report 2016 41
OUTPUTS—EARLY INDICATORS OF FUTURE COMPETITIVENESS OUTPUTS—EARLY INDICATORS OF FUTURE COMPETITIVENESS
EXPORTS
Export capability is a very important competitiveness output. Because of the tangible nature of exports, the connections and relevance to other outputs are very concrete. For instance, a country’s specialization in a specific sector often shows up as leadership in exports for that sector, and a country’s ability to diffuse knowledge in innovation management reflects back into its high-technology exports.
Gifted with natural resources, Abu Dhabi historically did not have any trade deficit problems and is very likely to post healthy and positive trade balances for a long time. In addition, the evolution of non-oil exports in recent years paints a positive picture for Abu Dhabi. Despite volatility in hydrocarbon exports following the price trends of oil, non-oil exports have steadily increased from AED 9.5 billion in 200984 to AED 19 billion in 201485, as seen in Figure 16.
Non-oil exports of Abu Dhabi have steadily increased from
AED 9.5 billion in 2009 to AED 19 billion in 2014.
On the improvement side, Abu Dhabi’s non-oil exports are highly concentrated on medium technology, as seen in Figure 17, especially on metals and plastics industries. For export destinations, Saudi Arabia, China, India and Qatar account for more than 60% of total non-oil exports.86 There is a clear need to plan a diversification strategy in terms of both export-focused industries and geographies.
84. Statistics Centre—Abu Dhabi Statistical Yearbook 2012, page 3185. Statistics Centre—Abu Dhabi Statistical Yearbook 2015, page 2786. Statistics Centre—Abu Dhabi Statistical Yearbook 2015, page 3487. SMEs are More Important Than You Think: Challenges and Opportunities for EU Exporting SMEs, European Commission, page 588. SME-Entrepreneurship Ecosystem in Abu Dhabi, Khalifa Fund, 2014, page 11
Export-oriented innovation programs can help increase the technology content of exports, and large national champions in select industries are pushing for even more markets and more exports. As a result, helping SMEs increase their exports could be an important move for Abu Dhabi. In most developed economies, SMEs drive 30 to 50% of exports while making up 80 to 90% of total enterprises.87 According to studies by key stakeholders, Abu Dhabi’s SMEs have a limited share in exports and export credit.88 Exports usually help SMEs to be less vulnerable to volatilities in the domestic market, access more consumers and gain scale as well as benefit from knowledge spillovers in their engagements in foreign markets. While efforts such as the SME Toolkit from Khalifa Fund are fundamental, they need more inclusive end-to-end support for SMEs to help them commercialize their products, whereas specialization and innovation-related initiatives would complement such efforts by helping SMEs innovate in the right fields.
Export categories(AED bn)
2009
10%
66%
8%
84%
8%24%
9.5 19.0Low
1.38.3
1.5
2.6
5.3
28%
14%
8%7%Medium
High
SaudiArabia
China India Qatar Other2014
Export destinations(2014, AED bn)
Classification of technology levels according to UNIDO methodology
Source: SCAD
High-tech Medium-tech Low-tech
Top destination country Other
Figure 16 Overall trade evolution and export evolution in non-oil sectors for Abu Dhabi
Figure 17 Breakdown of Abu Dhabi’s exports by technology and geography
156 126 9
1611
25
9.13.7
6.72.5
0.40.2
0.40.2
0.30.3
451490
310
197270
360278
422
615 16 19
6111210
63 90 94 87116 119 100 108
423329
121218
363283
214 246
47%
130%
5%
4%
21%
Trade evolution (AED bn)
Export evolution in non-oil sectors (AED bn)
2009exports
2014exports
2014sufficiancyrating1
Industry
Base metals
Plastics
Machinery
Chemicals
Ceramics
2009 2010 2011 2012 2013 20142007 2008
Oil, gas andoil productsexports
Non-oil goodsexports
Re-exports
Importof goods
Net trade
Source: Trademap, Abu Dhabi Statistic Centre (SCAD)
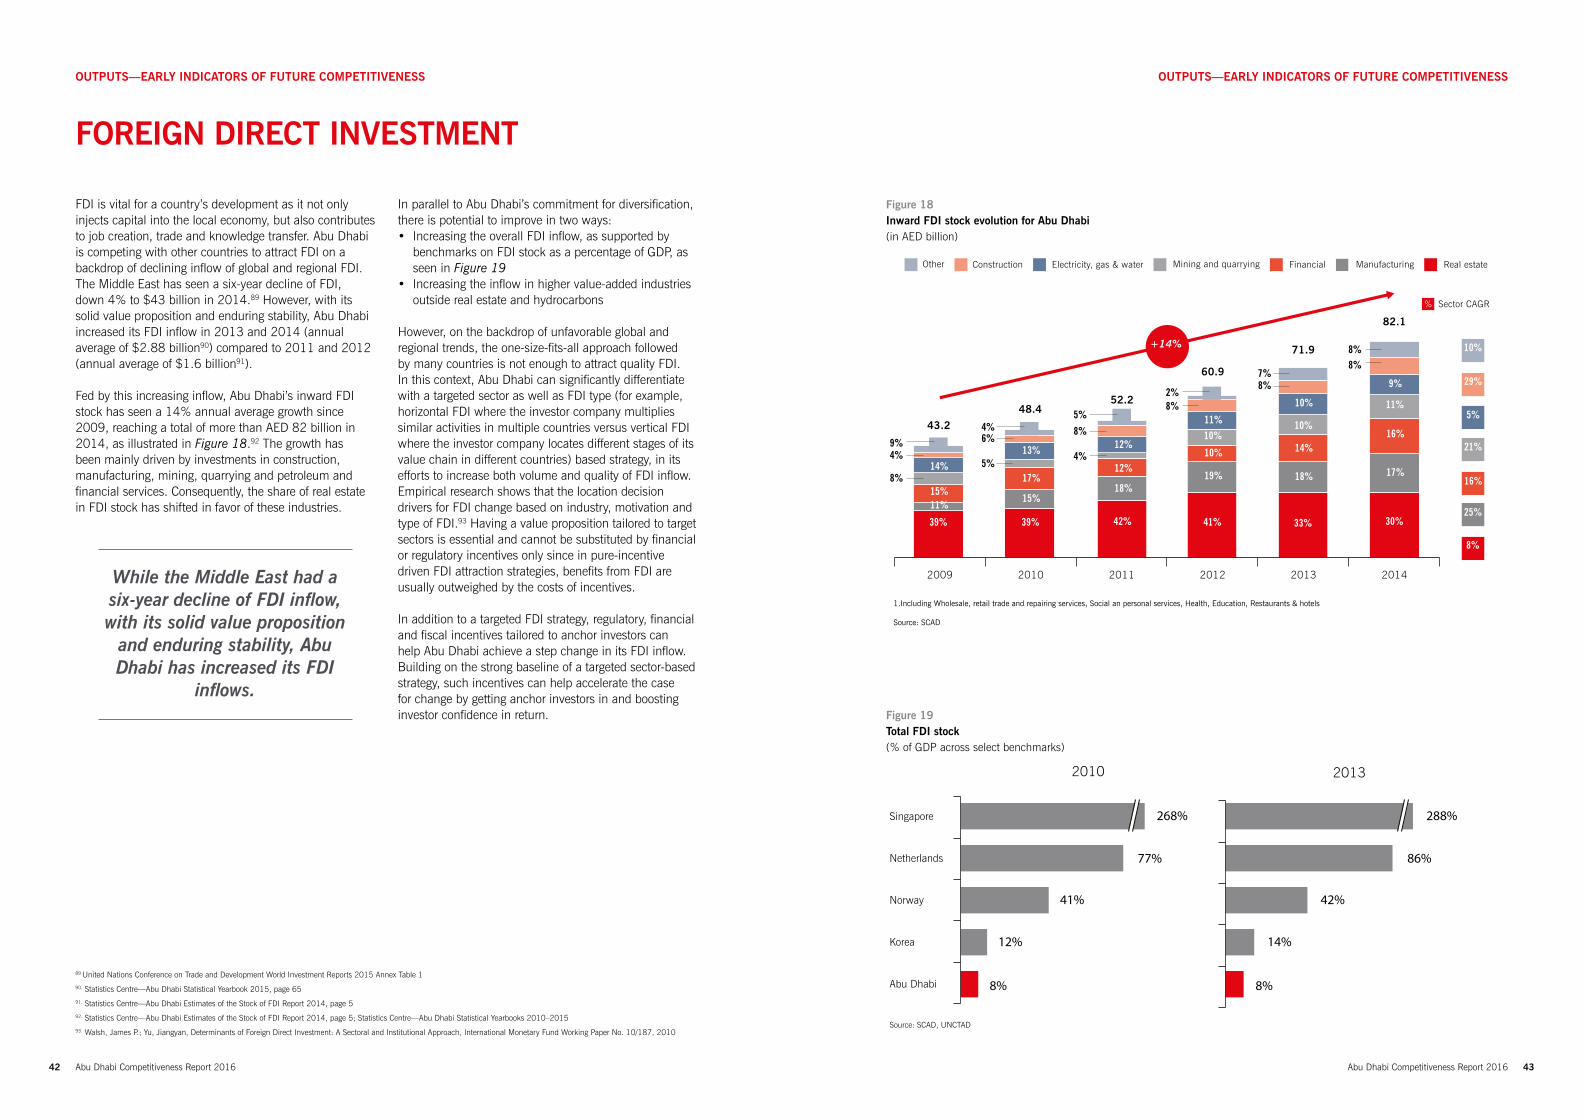
Abu Dhabi Competitiveness Report 201642 Abu Dhabi Competitiveness Report 2016 43
OUTPUTS—EARLY INDICATORS OF FUTURE COMPETITIVENESS OUTPUTS—EARLY INDICATORS OF FUTURE COMPETITIVENESS
FOREIGN DIRECT INVESTMENT
FDI is vital for a country’s development as it not only injects capital into the local economy, but also contributes to job creation, trade and knowledge transfer. Abu Dhabi is competing with other countries to attract FDI on a backdrop of declining inflow of global and regional FDI. The Middle East has seen a six-year decline of FDI, down 4% to $43 billion in 2014.89 However, with its solid value proposition and enduring stability, Abu Dhabi increased its FDI inflow in 2013 and 2014 (annual average of $2.88 billion90) compared to 2011 and 2012 (annual average of $1.6 billion91).
Fed by this increasing inflow, Abu Dhabi’s inward FDI stock has seen a 14% annual average growth since 2009, reaching a total of more than AED 82 billion in 2014, as illustrated in Figure 18.92 The growth has been mainly driven by investments in construction, manufacturing, mining, quarrying and petroleum and financial services. Consequently, the share of real estate in FDI stock has shifted in favor of these industries.
While the Middle East had a six-year decline of FDI inflow, with its solid value proposition
and enduring stability, Abu Dhabi has increased its FDI
inflows.
In parallel to Abu Dhabi’s commitment for diversification, there is potential to improve in two ways:• Increasing the overall FDI inflow, as supported by
benchmarks on FDI stock as a percentage of GDP, as seen in Figure 19
• Increasing the inflow in higher value-added industries outside real estate and hydrocarbons
However, on the backdrop of unfavorable global and regional trends, the one-size-fits-all approach followed by many countries is not enough to attract quality FDI. In this context, Abu Dhabi can significantly differentiate with a targeted sector as well as FDI type (for example, horizontal FDI where the investor company multiplies similar activities in multiple countries versus vertical FDI where the investor company locates different stages of its value chain in different countries) based strategy, in its efforts to increase both volume and quality of FDI inflow. Empirical research shows that the location decision drivers for FDI change based on industry, motivation and type of FDI.93 Having a value proposition tailored to target sectors is essential and cannot be substituted by financial or regulatory incentives only since in pure-incentive driven FDI attraction strategies, benefits from FDI are usually outweighed by the costs of incentives.
In addition to a targeted FDI strategy, regulatory, financial and fiscal incentives tailored to anchor investors can help Abu Dhabi achieve a step change in its FDI inflow. Building on the strong baseline of a targeted sector-based strategy, such incentives can help accelerate the case for change by getting anchor investors in and boosting investor confidence in return.
89.United Nations Conference on Trade and Development World Investment Reports 2015 Annex Table 190. Statistics Centre—Abu Dhabi Statistical Yearbook 2015, page 6591. Statistics Centre—Abu Dhabi Estimates of the Stock of FDI Report 2014, page 592. Statistics Centre—Abu Dhabi Estimates of the Stock of FDI Report 2014, page 5; Statistics Centre—Abu Dhabi Statistical Yearbooks 2010–201593. Walsh, James P.; Yu, Jiangyan, Determinants of Foreign Direct Investment: A Sectoral and Institutional Approach, International Monetary Fund Working Paper No. 10/187, 2010
1.Including Wholesale, retail trade and repairing services, Social an personal services, Health, Education, Restaurants & hotels
Source: SCAD
2009 2010 2011 2012 2013 2014
Other Construction Electricity, gas & water Mining and quarrying Financial Manufacturing Real estate
43.2
48.452.2
60.9
71.9
82.1
+14%
30%33%
17%18%
16%14%
11%
10%
9%
10%
8%
8%
10%
29%
5%
21%
16%
25%
8%
8%
7%
41%42%39%39%
19%18%
15%11%
10%12%
17%15%
10%
4%5%
8%
11%
12%13%14%
8%
8%
2%
9%4%
5%
6%
4%
% Sector CAGR
Source: SCAD, UNCTAD
2010 2013
Singapore
Netherlands
Norway
Korea
Abu Dhabi
268%
77%
41%
12%
8%
288%
86%
42%
14%
8%
Figure 18 Inward FDI stock evolution for Abu Dhabi (in AED billion)
Figure 19 Total FDI stock (% of GDP across select benchmarks)
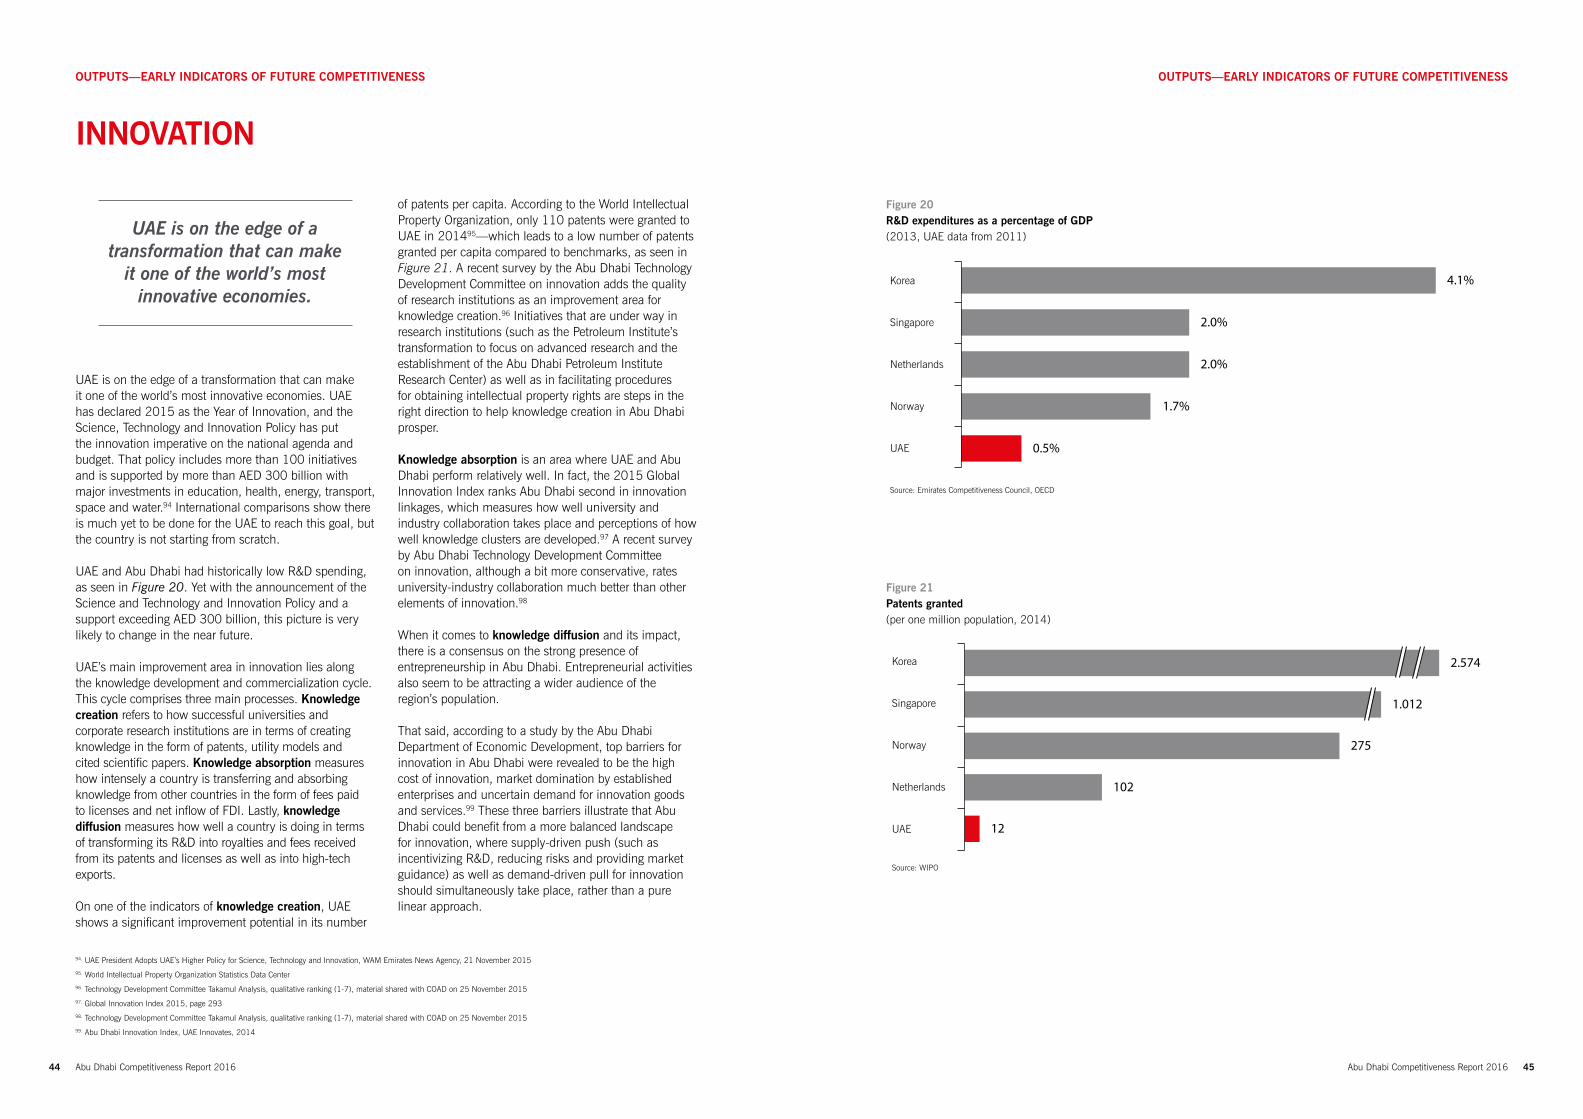
Abu Dhabi Competitiveness Report 201644 Abu Dhabi Competitiveness Report 2016 45
OUTPUTS—EARLY INDICATORS OF FUTURE COMPETITIVENESS OUTPUTS—EARLY INDICATORS OF FUTURE COMPETITIVENESS
INNOVATION
UAE is on the edge of a transformation that can make
it one of the world’s most innovative economies.
UAE is on the edge of a transformation that can make it one of the world’s most innovative economies. UAE has declared 2015 as the Year of Innovation, and the Science, Technology and Innovation Policy has put the innovation imperative on the national agenda and budget. That policy includes more than 100 initiatives and is supported by more than AED 300 billion with major investments in education, health, energy, transport, space and water.94 International comparisons show there is much yet to be done for the UAE to reach this goal, but the country is not starting from scratch.
UAE and Abu Dhabi had historically low R&D spending, as seen in Figure 20. Yet with the announcement of the Science and Technology and Innovation Policy and a support exceeding AED 300 billion, this picture is very likely to change in the near future.
UAE’s main improvement area in innovation lies along the knowledge development and commercialization cycle. This cycle comprises three main processes. Knowledge creation refers to how successful universities and corporate research institutions are in terms of creating knowledge in the form of patents, utility models and cited scientific papers. Knowledge absorption measures how intensely a country is transferring and absorbing knowledge from other countries in the form of fees paid to licenses and net inflow of FDI. Lastly, knowledge diffusion measures how well a country is doing in terms of transforming its R&D into royalties and fees received from its patents and licenses as well as into high-tech exports.
On one of the indicators of knowledge creation, UAE shows a significant improvement potential in its number
of patents per capita. According to the World Intellectual Property Organization, only 110 patents were granted to UAE in 201495—which leads to a low number of patents granted per capita compared to benchmarks, as seen in Figure 21. A recent survey by the Abu Dhabi Technology Development Committee on innovation adds the quality of research institutions as an improvement area for knowledge creation.96 Initiatives that are under way in research institutions (such as the Petroleum Institute’s transformation to focus on advanced research and the establishment of the Abu Dhabi Petroleum Institute Research Center) as well as in facilitating procedures for obtaining intellectual property rights are steps in the right direction to help knowledge creation in Abu Dhabi prosper.
Knowledge absorption is an area where UAE and Abu Dhabi perform relatively well. In fact, the 2015 Global Innovation Index ranks Abu Dhabi second in innovation linkages, which measures how well university and industry collaboration takes place and perceptions of how well knowledge clusters are developed.97 A recent survey by Abu Dhabi Technology Development Committee on innovation, although a bit more conservative, rates university-industry collaboration much better than other elements of innovation.98
When it comes to knowledge diffusion and its impact, there is a consensus on the strong presence of entrepreneurship in Abu Dhabi. Entrepreneurial activities also seem to be attracting a wider audience of the region’s population.
That said, according to a study by the Abu Dhabi Department of Economic Development, top barriers for innovation in Abu Dhabi were revealed to be the high cost of innovation, market domination by established enterprises and uncertain demand for innovation goods and services.99 These three barriers illustrate that Abu Dhabi could benefit from a more balanced landscape for innovation, where supply-driven push (such as incentivizing R&D, reducing risks and providing market guidance) as well as demand-driven pull for innovation should simultaneously take place, rather than a pure linear approach.
94. UAE President Adopts UAE’s Higher Policy for Science, Technology and Innovation, WAM Emirates News Agency, 21 November 201595. World Intellectual Property Organization Statistics Data Center96. Technology Development Committee Takamul Analysis, qualitative ranking (1-7), material shared with COAD on 25 November 201597. Global Innovation Index 2015, page 29398. Technology Development Committee Takamul Analysis, qualitative ranking (1-7), material shared with COAD on 25 November 201599. Abu Dhabi Innovation Index, UAE Innovates, 2014
Source: Emirates Competitiveness Council, OECD
Korea
Singapore
Netherlands
Norway
UAE
4.1%
2.0%
2.0%
1.7%
0.5%
Source: WIPO
Korea
Singapore
Norway
Netherlands
UAE
2.574
1.012
275
102
12
Figure 20 R&D expenditures as a percentage of GDP (2013, UAE data from 2011)
Figure 21 Patents granted (per one million population, 2014)
Abu Dhabi Competitiveness Report 2016 47
COMPETITIVENESS SUCCESS STORY
ABU DHABI DEPARTMENT OF ECONOMIC DEVELOPMENTCommercializing innovation
Takamul is an innovation support program operated by the Abu Dhabi Department of Economic Development (ADDED) to facilitate the integration of each stage of the innovation cycle, from the generation of ideas to the practical and commercial application of these ideas into products, solutions and services. Since 2013, Takamul has supported Emirati individuals, universities and enterprises in Abu Dhabi and the wider UAE to protect and commercialize their innovative ideas
Case 1: Abu Dhabi National Oil Company – drilling in oil and gas explorationClogging during the drilling process in oil and gas exploration is an expensive and time-consuming problem. Typically, this happens in rock formations where solid rock and soft layers alternate underground. The problem occurs when drilling into soft material where debris has more room to accumulate behind a drill bit. When clogging has advanced, the drill bit cannot be extracted from the borehole and must be abandoned. The only alternative is to drill a new borehole with a new drill bit. The damage is in the millions. A new invention, managed under a partnership between the Abu Dhabi National Oil Company (ADNOC) and the Abu Dhabi Department of Economic Development (ADDED), solves this problem by preventing clogging. The Takamul team helped secure the intellectual property (IP) via a patent. In addition to the company’s internal use, the invention has attracted the interest of drilling service providers that want to license this new technology. A licensing deal is in the final stage of negotiation.
Case 2: United Arab Emirates University – detecting Parkinson’s diseaseParkinson’s disease (PD) is the second most common neurodegenerative disorder after Alzheimer’s disease. The earliest clinical features of PD are typically identified retrospectively and are not specific to PD. Researchers at UAE University have discovered a method that can identify in the pre-symptomatic phase of the disease whether or not an individual has PD, or distinguish PD from
another neurological disorder. The invention can be used in clinical trials to measure the effect of drugs in both PD animal models and human PD patients. This is a huge step toward early detection and prevention of the disease. Large pharmaceutical companies have showed interest, resulting in the licensing of this method, which helps to develop the required applications for treating PD patients in an early stage where treatment is most effective. Takamul has supported the IP creation of this new technology and supported the licensing deal in the initial stage, introducing potential licensees and facilitating the initial negotiations.
Case 3: United Arab Emirates University – carbon nanotubes from waste materialsSince their discovery in 1991, carbon nanotubes (CNTS) have been used for their superior mechanical, electrical and thermal properties in manufacturing a wide range of products and materials.
UAE researchers have developed a process to synthesize CNTS from sources such as carbon-rich waste or microalgae, a byproduct in biofuel production. Through this new process, the production and refining process becomes cheaper and cleaner: cheaper because the feedstock, which is primarily waste or process byproducts, will reduce the reliance on highly purified carbon, and cleaner since carbon nanotubes can be produced in a less energy-intensive way.
Takamul has supported this technology from the very beginning, initially by providing legal and financial support to protect the IP. In later stages, the technology underwent a “proof of concept” exercise where the technical feasibility had been demonstrated.
Abu Dhabi Competitiveness Report 201646

Abu Dhabi Competitiveness Report 2016 49
THE NEAR TERM COMPETITIVENESS AGENDA
The Abu Dhabi Competitiveness Report 2016 outlines Abu Dhabi’s competitiveness achievements, all of which have contributed to the Emirate’s tremendous progress and economic prosperity in recent decades. Looking toward the years ahead, the government is keen to improve this remarkable competitiveness while achieving the goal announced by H.H. Sheikh Mohammed bin Zayed Al Nahyan, Crown Prince of Abu Dhabi and Deputy Supreme Commander of the UAE Armed Forces and Chairman of the Abu Dhabi Executive Council to have the UAE ready and prepared for the day when citizens can unconcernedly wave goodbye to the last oil cargo.
Priority Action Areas to Enhance CompetitivenessBacked by extensive insights from stakeholders, the Abu Dhabi Competitiveness Report 2016 identifies the areas with the greatest potential to improve the Emirate’s competitiveness. After conducting the competitiveness diagnostic, COAD benchmarked initiatives and solutions that other countries have used to address similar improvement areas, and supported this analysis with meetings with key stakeholders of Abu Dhabi. The benchmark analysis and stakeholder meetings indicated that further enhancing Abu Dhabi’s competitiveness requires concentrated action on a broad interplay of factors while it also necessitates continued efforts to raise awareness regarding competitiveness and Abu Dhabi’s ambitions thereof.
Clustering of the long list of identified initiatives based on their similarities and interdependencies pointed to 5 high level competitiveness priority areas continue building on the Emirate’s competitive strengths, as illustrated in Figure 22.
Action Area 1: Skilled human capital matched with quality employment – Support the national agenda towards creating a highly skilled national labor force, matched with high quality private sector employment opportunities
An educated, highly skilled and motivated labor force is vital for a diversified, knowledge-based economy. Abu Dhabi can further tap into its human capital potential by aligning the higher education outputs with market demand, creating employment opportunities for the youth, boosting female participation and aligning incentives to foster private sector employment. It is
necessary to support programs that encourage private sector employment of Nationals. Such potential programs include but are not limited to building a labor market intelligence tool to identify long-term human capital requirements of the economy, developing a youth employment program and attracting highly skilled expatriates in the Emirate.
Action Area 2: Productive diversification & SME development – Grow and deepen national supply chains to boost diversification, SME growth and productivity
Parallel to the continuing expansion of the Emirate’s primary economic segments of oil and gas, the focus will be on developing national supply chains in other sectors that will boost diversification, enterprise growth and productivity. The efforts will be concentrated in supporting SMEs and national champions to localize parts of the value chain in sectors where Abu Dhabi has or can build a competitive advantage and sustain it in the near future. This support should be covering all relevant areas, both in terms of development lifecycle and value chain, to nurture and grow enterprises including financing, export promotion and targeted investment packages.
Action Area 3: A balanced and productive innovation model – complementing the innovation agenda with demand-side policies and regulations to boost innovation output
UAE has declared 2015 as the year of Innovation, and the National Innovation Strategy and the Science, Technology and Innovation Policy have put the innovation imperative on the national agenda. This policy includes over 100 initiatives and is supported by more than AED 300 billion with major investments in education, health, energy, transport, space and water. The international comparisons show that there is much yet to be done for the UAE to take its place among world’s best innovators, but the country is not starting from scratch. It is necessary for key stakeholders to partner to strengthen the current innovation model with demand side policies and regulations to ensure that the current motivation and new funds to innovation are focused on the priority sectors and translated into outputs that are beneficial for Emirate’s greater economic goals.
Action Area 4: Next-generation institutional agility – achieving a next-generation alignment and coordination among government institutions on priorities to develop a transparent and agile business environment that encourages growth and investment
Coordinating government institutions to work together for a more efficient and citizen- and investor-centric government is a worldwide priority. In our globalized world, the institutions that can simplify and refocus delivery models have the most to gain. Abu Dhabi’s government institutions can greatly benefit from greater transparency and agility to adapt, hence quickly responding to stakeholders’ needs. COAD has identified strategic and tactical initiatives to enhance cross-government relations to ensure a transparent and agile business environment that encourages investment and growth while positioning Abu Dhabi as a leading competitive economy.
Action Area 5: Enhanced awareness of competitiveness – increase awareness of the competitiveness agenda in local, national and international forums
Since COAD was established in 2009, the competitiveness agenda has been firmly planted in government priorities. The Abu Dhabi Plan includes a specific economic objective to enhance the Emirate’s competitiveness. Given the crosscutting nature of the concept, it is important for COAD to continue increasing awareness of the key competitiveness strengths, opportunities and challenges and to facilitate government, private and academia alignment. Moving forward, COAD is committed to engage with key stakeholders on the above mentioned competitiveness priority areas and initiatives, to compile and agree on a detailed action plan for each initiative in order to support Abu Dhabi’s continued progress towards enhanced competitiveness.
THE NEAR TERM COMPETITIVENESS AGENDA
Source: COAD
Figure 22 The Near Term Competitiveness Agenda of Abu Dhabi
Skilled human capital matched with quality employment
Productive diversification & SME development
Balanced and productive innovation model
Next-generation institutional agility
“Support the national agenda towards creating a highly skilled national labor force, matched with high quality private sector employment opportunities”
“Grow and deepen national supply chains to boost diversification, enterprise growth and productivity”
“Complement the innovation agenda with demand side policies and regulations to boost innovation output”
“Achieving a next-generation alignment and coordination among government institutions on key priorities to develop an environment that encourages growth and investment”
Enhanced awareness on competitiveness
“Continue increasing awareness of the competitiveness agenda in local, national and international forums”
Abu Dhabi Competitiveness Report 201648

Abu Dhabi Competitiveness Report 2016 51
APPENDIX
Technical Notes
The sources used for analysis rely primarily on Statistics Centre—Abu Dhabi Yearbooks for Abu Dhabi data and on international databases and national statistics centers for international benchmarks as available before January 2016.
The United Arab Emirates dirham (AED) is the currency of choice throughout this report in denoting Abu Dhabi specific figures. The U.S. dollars has been used for benchmarking purposes.
Definitions of the Regional Competitiveness Model Elements
Competitiveness Inputs
Inputs are the underlying drivers of future competitiveness. They are particularly important because they represent the level where policies can have the most direct impact. The competitiveness inputs are divided into five elements: Human Capital, Physical Capital, Financial Capital, Institutions and Specialization.
Human CapitalA nation’s human capital endowment—the skills and capacities that reside in people and that are put to productive use—can be a more important determinant of its long term economic competitiveness than virtually any other resource. Transforming the economy requires a pool of well-educated workforce with the necessary skills and capacity to innovate.
Physical Capital Extensive and efficient infrastructure is an essential driver of competitiveness. It is critical for ensuring the effective functioning of the economy and for integrating the national market to other regions and countries. Effective modes of transport —such as quality roads, railroads, ports, and air transport—enable the movement of goods and workers. A solid and extensive telecommunications network allows for a rapid and free flow of information, which increases overall economic efficiency by ensuring that decisions made by economic actors take into account all available relevant information.
Financial Capital An efficient financial sector allocates financial resources to their most productive uses, channeling resources to those entrepreneurial or investment projects with the highest expected rates of return. Economies require sophisticated financial markets that can make capital available for private-sector investment from sources such as loans from a sound banking sector, well-regulated securities exchanges, venture capital, and other financial products.
InstitutionsInstitutions constitute the legal and administrative framework within which individuals, firms and governments interact. The quality of institutions has a strong bearing on competitiveness and growth, influencing investment decisions and the organization of production. The role of institutions goes beyond the legal framework. Public sector’s approach to markets and the efficiency of its operations are also very important: excessive bureaucracy and red tape, overregulation, lack of transparency, inability to provide appropriate services for the business sector and
APPENDIX
ProductivityA country’s ability to improve its standard of living over time depends on its ability to raise its output per worker. Productivity measures how efficiently the production inputs—such as labor and capital—are being used in an economy to produce a given level of output. Productivity is considered as a key source of economic growth and competitiveness and, as such, is a vital statistical indicator for numerous country assessments focusing on growth accounting.
EmploymentThe efficiency and flexibility of the labor market is critical to ensure that workers are allocated to their most effective use in the economy and provided with incentives to give their best effort in their jobs. Labor markets that function well have the flexibility to allocate the workforce its optimal use in a timely manner, along the economic lifecycle of the country. Rigid labor markets, on the other hand, usually aggravate fundamental problems in education system and skill mismatches, hence resulting in persistently high youth unemployment and low female participation in the economy.
ExportsA nation’s export levels capture the extent at which its economy is interconnected with the outside world, as well as the economy’s ability to compete with goods and services produced outside the country. A vast empirical literature stresses the strongly positive relationship between export diversification and growth. Similarly, consensus appears to emerge recently that the structure of exports or their diversification is crucial for productivity and resource allocation to achieve economic growth.
Foreign Direct Investment (FDI)Foreign investment is critical for a country’s development, as it not only injects capital in the local economy, but also contributes to job creation, trade, competition and knowledge transfer. The level of FDI, and its variety across sectors and investor profile illustrate the confidence of the investors in a nation’s future prospects and indicates the potential for future growth. Despite a country’s economic attractiveness for investors, competitiveness for FDI can be hindered by distortionary or burdensome taxes and by restrictive and discriminatory rules that limit foreign ownership.
InnovationIn the long run, productivity can be expanded only with technological innovation. Innovation is particularly important for economies as they approach the frontiers of knowledge and the possibility of integrating and adapting exogenous technologies tends to disappear. Firms must design and develop cutting-edge products and processes to maintain a competitive edge. This requires an environment that is conducive to innovative activity, supported by both the public and the private sectors. In particular, this means sufficient investment in research and development (R&D) especially by the private sector, the presence of high-quality scientific research institutions, extensive collaboration in research between universities and industry, and the protection of intellectual property to ensure appetite for investment into innovation.
political dependence of the judicial system impose significant economic costs to businesses and slow the process of economic development.
SpecializationA country’s competitiveness is positively correlated with its ability to develop specialized business networks and supporting industries, through sizable and high quality networks of local suppliers. When companies and suppliers of a particular sector are interconnected in geographically proximate groups, called clusters, greater opportunities for innovation in processes and products are created, and barriers to entry for new firms are reduced. Specialization is especially important for countries at an advanced stage of development when, largely, the low hanging fruits on productivity improvements have been exhausted.
Competitiveness Outputs
Outputs represent early indicators of future competitiveness. While outputs may not be the direct aims of policymaking, they provide insights on the underlying mechanisms of a region’s competitiveness and are often regarded as vital signals of an economy’s status. The outputs are divided into five elements: Productivity, Employment, Exports, Foreign Direct Investment (FDI) and Innovation.
Competitiveness Outcomes
Outcomes represent the key objective of competitiveness policymaking, which include the overall goals to be achieved in terms of citizens’ well-being. The outcomes are divided into two elements: Economic Growth and Social Well-being.
Economic growthEconomic growth is a function of competitiveness fundamentals and it is usually measured through multiple indicators such as GDP growth, average GDP per capita and average monthly income. These indicators provide an aggregate view of the level of economic prosperity that a nation’s inhabitants can enjoy.
Social well-beingSocial well-being covers non-income qualitative measures of the standards of living, such as happiness and environmental quality. These measures provide additional insights into the actual ability of a country’s economy to support a general high standard of living.
Abu Dhabi Competitiveness Report 201650
Abu Dhabi Competitiveness Report 201652 Abu Dhabi Competitiveness Report 2016 53
TABLE OF FIGURES
Figure Page
1 Abu Dhabi Regional Competitiveness Model 13
2 The Near Term Competitiveness Agenda of Abu Dhabi 15
3 Evolution of inward FDI flows in the world and to MENA region (in $US billion) 17
4 Cyclicality in oil prices and the current slump 18
5 Elements of Abu Dhabi Regional Competitiveness Model 21
6 The world’s top 10 nations by GDP per capita 23
7 GDP of Abu Dhabi in constant 2007 prices 23
8 Improvement areas to carry Abu Dhabi to champion level in human capital competitiveness 27
9 Mobile cellular subscribers (includes tablets and other devices) per 1,000 inhabitants 29
10 Financial capital access schemes offered in Abu Dhabi and their maturity levels 31
11 UAE’s rank in World Bank’s 2016 Doing Business ranking and comparison with MENA peers 32
12 Positive feedback loop driven by the improvement areas in institutions 33
13 GDP per employee at 2014 current prices, indexed to the U.S. level at 100% 37
14 Employment growth versus GDP growth for select Abu Dhabi sectors, CAGR from 2005 to 2014 37
15 Female labor force refined participation rates, 2014 39
16 Overall trade evolution and export evolution in non-oil sectors for Abu Dhabi 41
17 Breakdown of Abu Dhabi’s exports by technology and geography 41
18 Inward FDI stock evolution for Abu Dhabi in AED billion 43
19 Total FDI stock, % of GDP across select benchmarks 43
20 R&D expenditures as a percentage of GDP (2013, UAE data from 2011) 45
21 Patents granted (per one million population, 2014) 45
22 The Near Term Competitiveness Agenda of Abu Dhabi 49