Embed Size (px)
Citation preview
March 10, 2016
Fourth Quarter and Full Year 2015 Results
WARDED2014\7. Analyst Presentation\Cruise_AP_v31.pptx
2 2
Safe Harbor Statement
This material contains forward-looking statements. These statements constitute “forward-looking” statements within the meaning of Section
21E of the Securities Exchange Act of 1934, as amended, and as defined in the U.S. Private Securities Litigation Reform Act of 1995. These
forward-looking statements can be identified by terminology such as “will,” “expects,” “anticipates,” “future,” “intends,” “plans,” “believes,”
“estimates,” “target,” “confident” and similar statements.
Such statements are based upon management’s current expectations and current market and operating conditions, and relate to events that
involve known or unknown risks, uncertainties and other factors, all of which are difficult to predict and many of which are
beyond Yirendai’s control. Forward-looking statements involve risks, uncertainties and other factors that could cause actual results to differ
materially from those contained in any such statements.
Potential risks and uncertainties include, but are not limited to, uncertainties as to Yirendai’s ability to attract and retain borrowers and
investors on its marketplace, its ability to introduce new loan products and platform enhancements, its ability to compete effectively, PRC
regulations and policies relating to the peer-to-peer lending service industry in China, general economic conditions in China, and Yirendai’s
ability to meet the standards necessary to maintain listing of its ADSs on the NYSE or other stock exchange, including its ability to cure any
non-compliance with the NYSE’s continued listing criteria.
Further information regarding these and other risks, uncertainties or factors is included in Yirendai’s filings with the U.S. Securities and
Exchange Commission. All information provided in this material is as of the date of this material, and Yirendai does not undertake any
obligation to update any forward-looking statement as a result of new information, future events or otherwise, except as required under
applicable law.

Offering borrowers in China easy
access to unsecured credit and
investors an attractive investment
opportunity, by connecting them
directly through our online
marketplace
Our Mission
3
WARDED2014\7. Analyst Presentation\Cruise_AP_v31.pptx
4 4
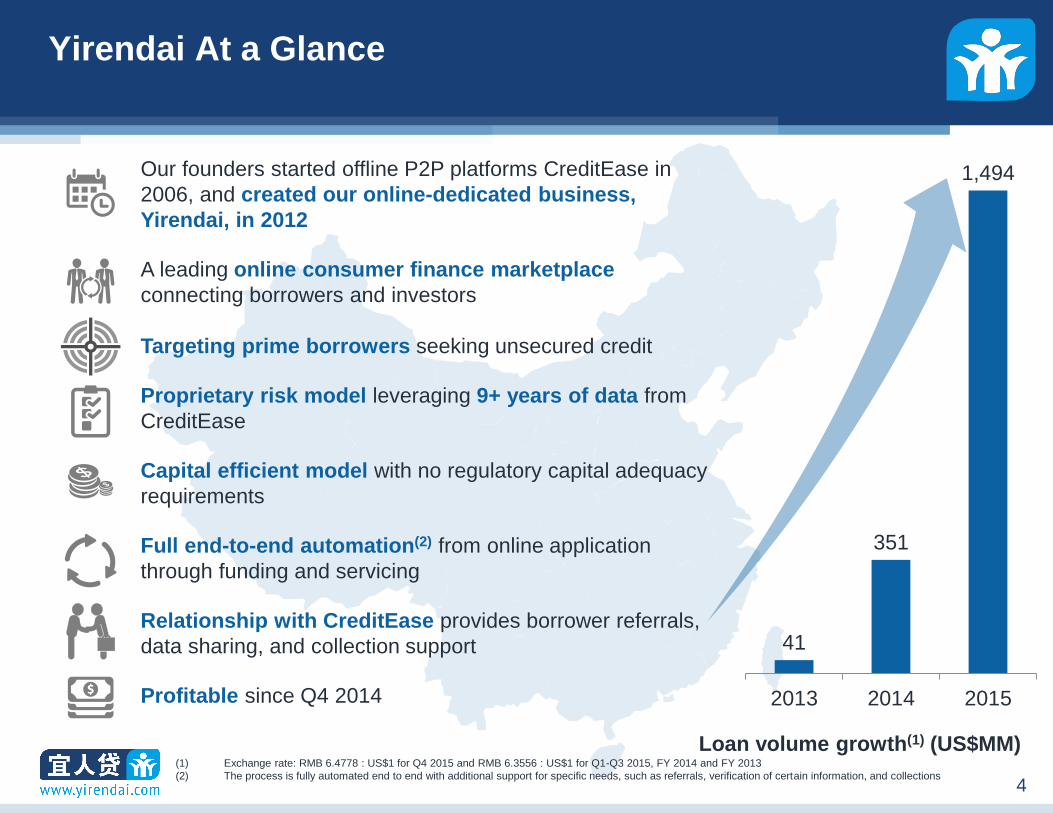
Yirendai At a Glance
Loan volume growth(1) (US$MM)
(1) Exchange rate: RMB 6.4778 : US$1 for Q4 2015 and RMB 6.3556 : US$1 for Q1-Q3 2015, FY 2014 and FY 2013
(2) The process is fully automated end to end with additional support for specific needs, such as referrals, verification of certain information, and collections
Our founders started offline P2P platforms CreditEase in
2006, and created our online-dedicated business,
Yirendai, in 2012
A leading online consumer finance marketplace
connecting borrowers and investors
Targeting prime borrowers seeking unsecured credit
Proprietary risk model leveraging 9+ years of data from
CreditEase
Capital efficient model with no regulatory capital adequacy
requirements
Full end-to-end automation(2) from online application
through funding and servicing
Relationship with CreditEase provides borrower referrals,
data sharing, and collection support
Profitable since Q4 2014
41
351
1,494
2013 2014 2015
WARDED2014\7. Analyst Presentation\Cruise_AP_v31.pptx
5 5
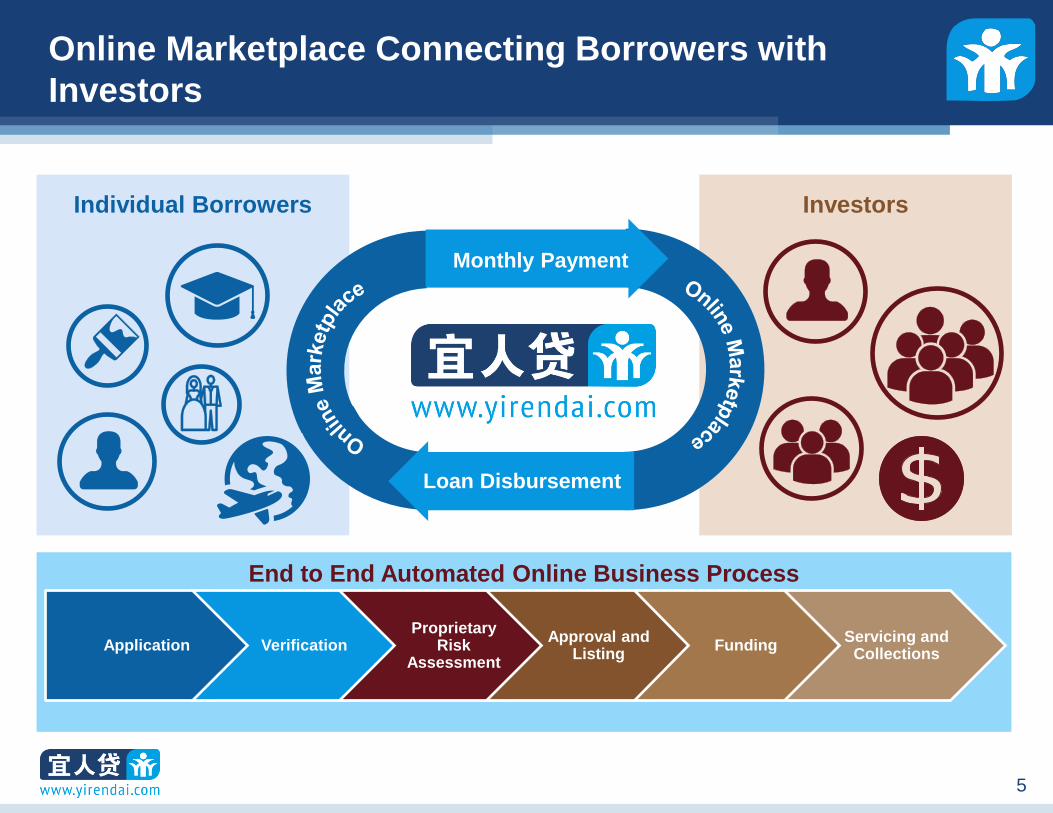
Online Marketplace Connecting Borrowers with
Investors
Application Verification Proprietary
Risk Assessment
Approval and Listing
Funding Servicing and
Collections
End to End Automated Online Business Process
Investors Individual Borrowers
Loan Disbursement
Monthly Payment
WARDED2014\7. Analyst Presentation\Cruise_AP_v31.pptx
6 6
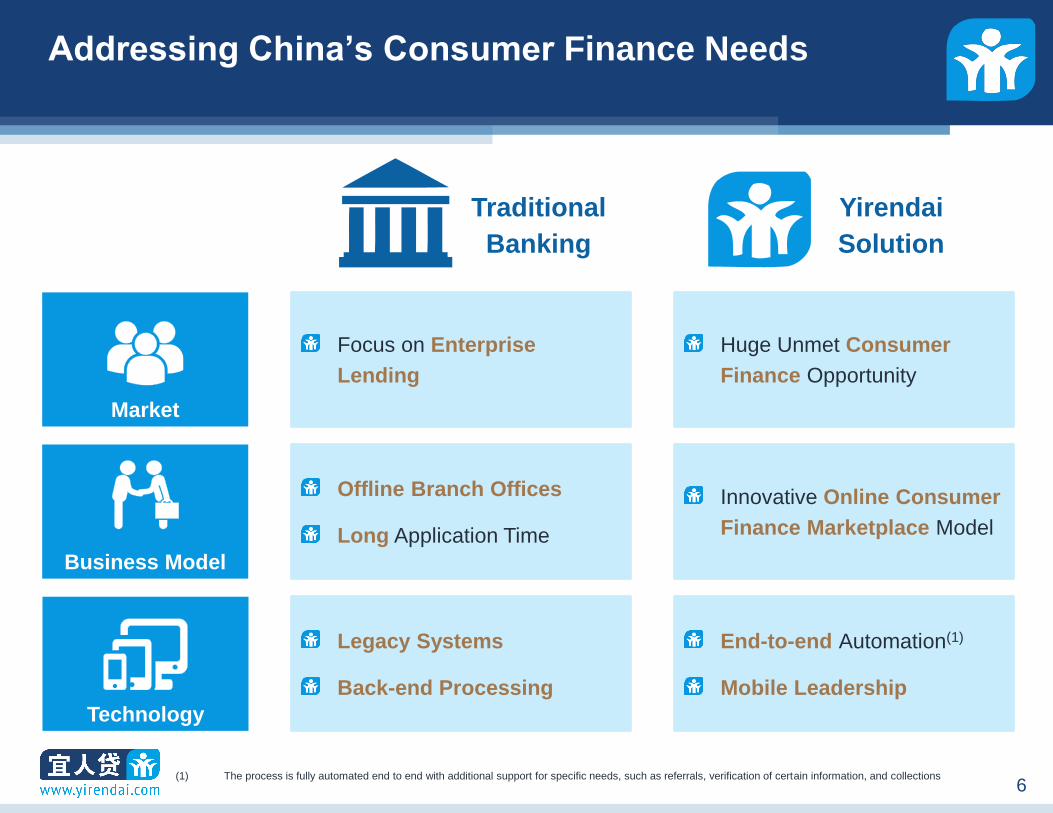
Addressing China’s Consumer Finance Needs
Market
Technology
Business Model
Offline Branch Offices
Long Application Time
Focus on Enterprise
Lending
Legacy Systems
Back-end Processing
Innovative Online Consumer
Finance Marketplace Model
Huge Unmet Consumer
Finance Opportunity
End-to-end Automation(1)
Mobile Leadership
Traditional
Banking
Yirendai
Solution
(1) The process is fully automated end to end with additional support for specific needs, such as referrals, verification of certain information, and collections
WARDED2014\7. Analyst Presentation\Cruise_AP_v31.pptx
7 7
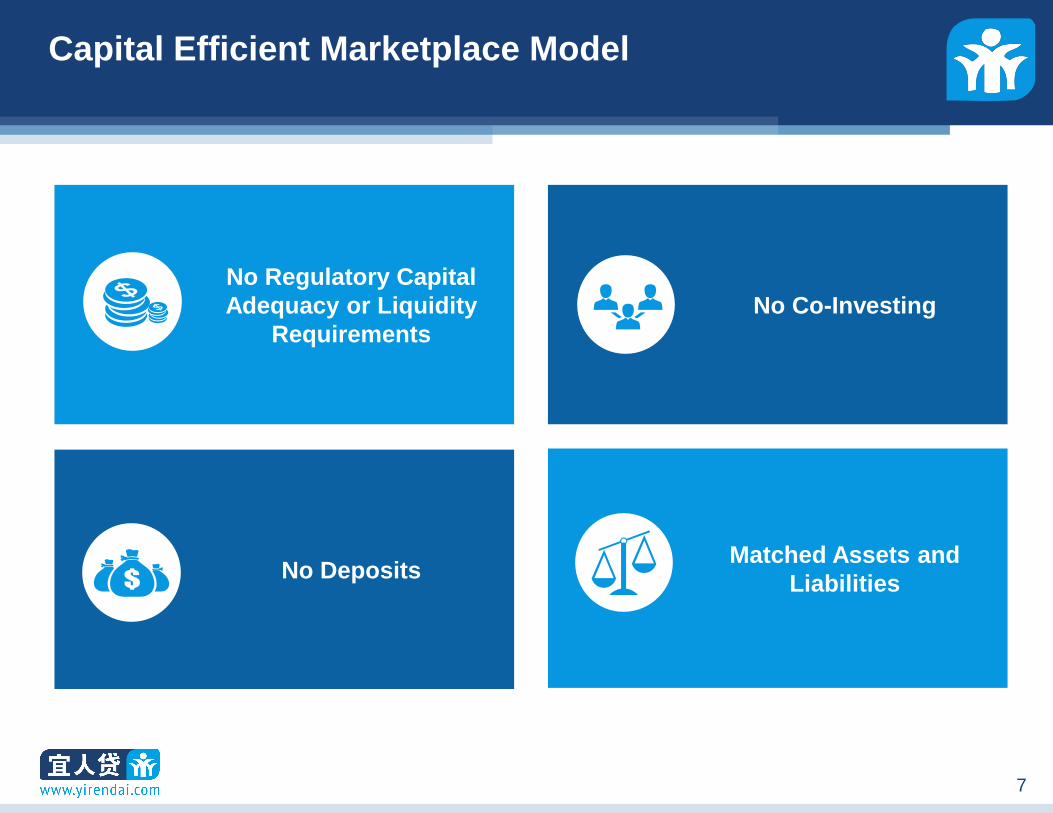
Capital Efficient Marketplace Model
No Regulatory Capital
Adequacy or Liquidity
Requirements
No Co-Investing
No Deposits Matched Assets and
Liabilities

Investment Highlights
WARDED2014\7. Analyst Presentation\Cruise_AP_v31.pptx
9 9
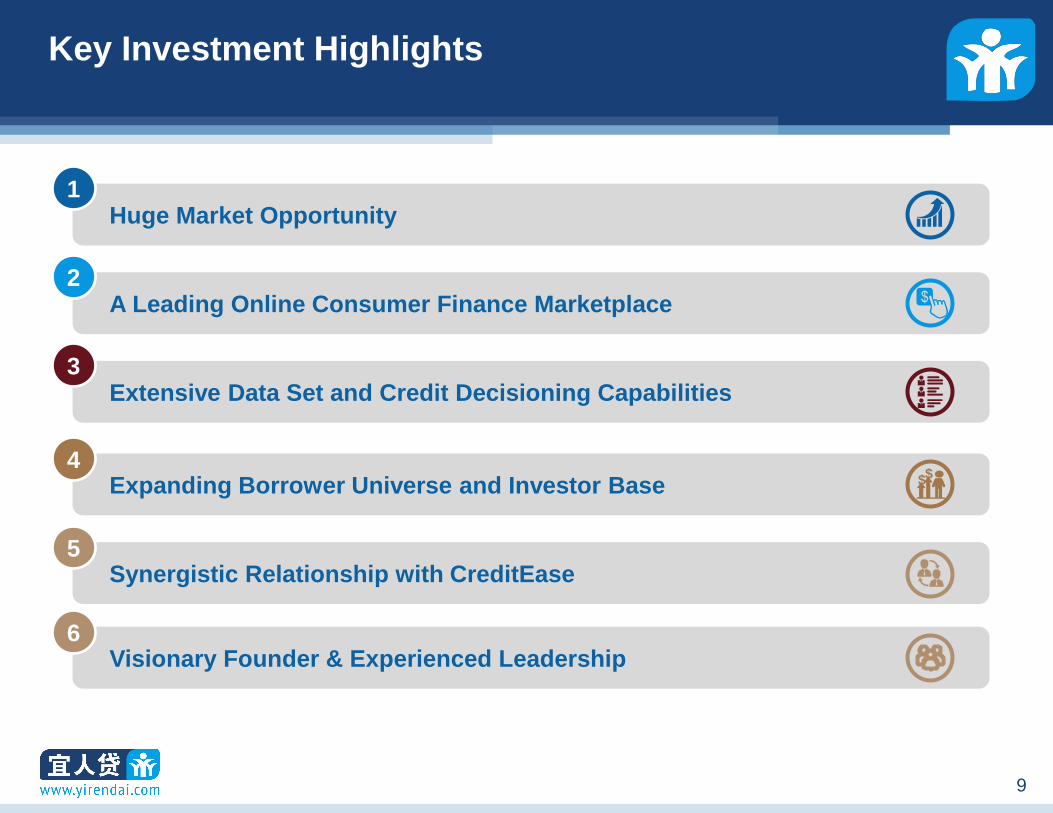
Key Investment Highlights
Huge Market Opportunity
A Leading Online Consumer Finance Marketplace
Extensive Data Set and Credit Decisioning Capabilities
Expanding Borrower Universe and Investor Base $ $
Synergistic Relationship with CreditEase
1
2
3
4
5
Visionary Founder & Experienced Leadership 6
WARDED2014\7. Analyst Presentation\Cruise_AP_v31.pptx
10 10
Large, Underpenetrated Consumer Finance
Market Opportunity
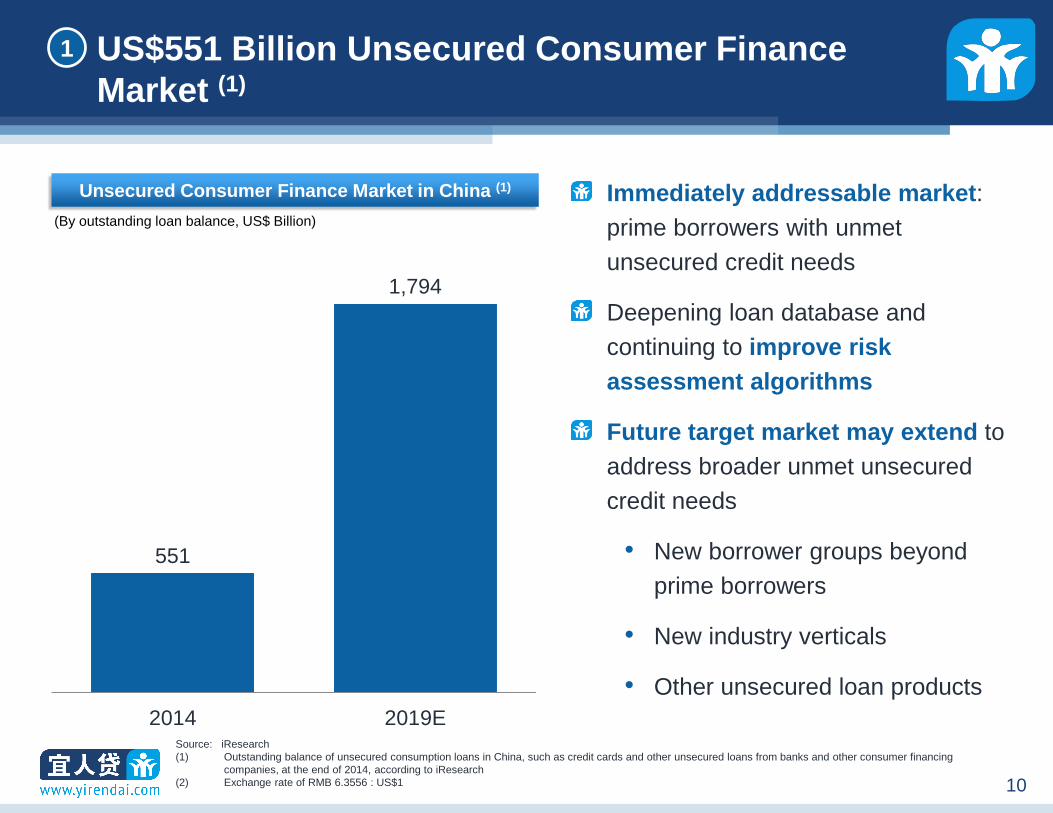
US$551 Billion Unsecured Consumer Finance
Market (1)
1
Source: iResearch
(1) Outstanding balance of unsecured consumption loans in China, such as credit cards and other unsecured loans from banks and other consumer financing
companies, at the end of 2014, according to iResearch
(2) Exchange rate of RMB 6.3556 : US$1
Unsecured Consumer Finance Market in China (1)
551
1,794
2014 2019E
(By outstanding loan balance, US$ Billion)
Immediately addressable market:
prime borrowers with unmet
unsecured credit needs
Deepening loan database and
continuing to improve risk
assessment algorithms
Future target market may extend to
address broader unmet unsecured
credit needs
• New borrower groups beyond
prime borrowers
• New industry verticals
• Other unsecured loan products
WARDED2014\7. Analyst Presentation\Cruise_AP_v31.pptx
11 11
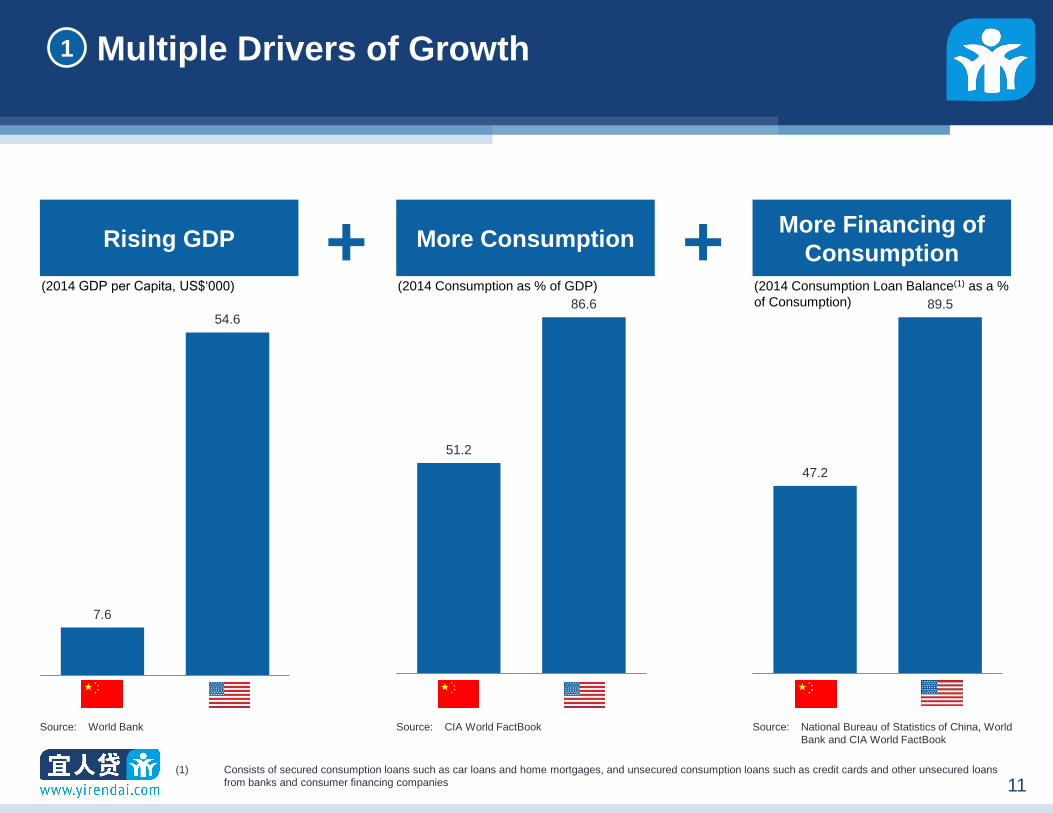
51.2
86.6
China USA
(2014 Consumption as % of GDP)
47.2
89.5
China USA
(2014 Consumption Loan Balance(1) as a %
of Consumption)
Multiple Drivers of Growth
Rising GDP
7.6
54.6
2011 2014
(2014 GDP per Capita, US$‘000)
Source: World Bank Source: CIA World FactBook Source: National Bureau of Statistics of China, World
Bank and CIA World FactBook
1
More Consumption More Financing of
Consumption + +
(1) Consists of secured consumption loans such as car loans and home mortgages, and unsecured consumption loans such as credit cards and other unsecured loans
from banks and consumer financing companies
WARDED2014\7. Analyst Presentation\Cruise_AP_v31.pptx
12 12
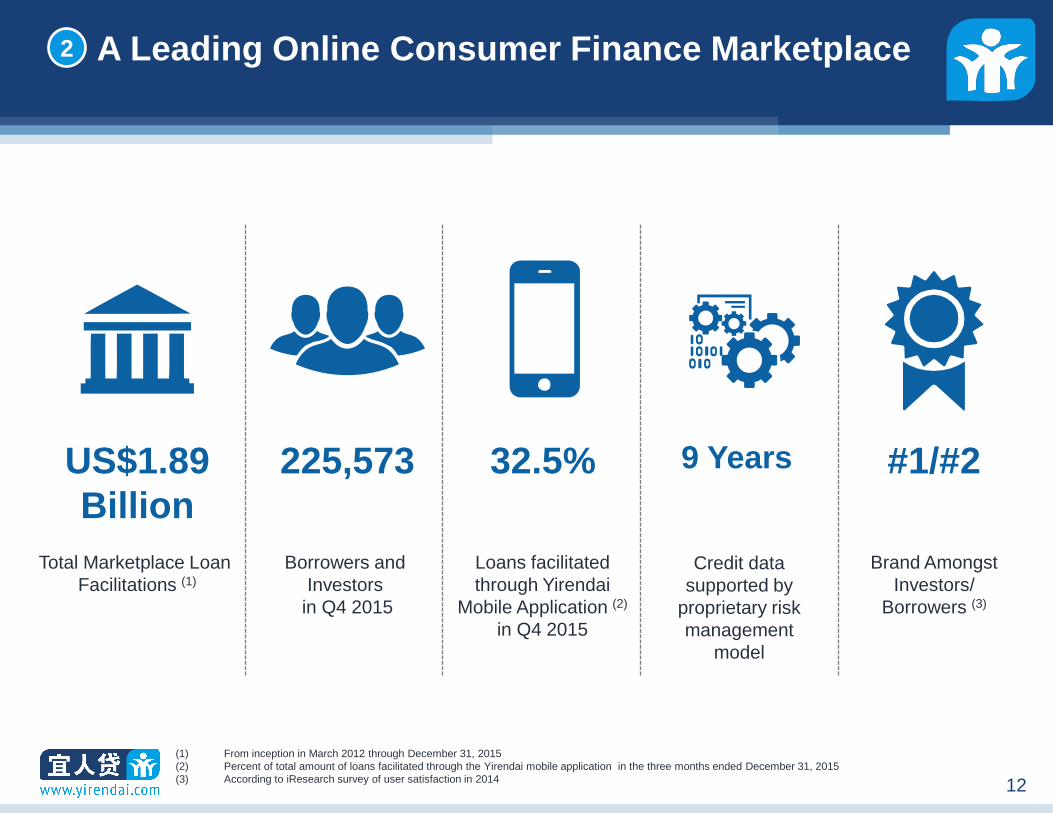
(1) From inception in March 2012 through December 31, 2015
(2) Percent of total amount of loans facilitated through the Yirendai mobile application in the three months ended December 31, 2015
(3) According to iResearch survey of user satisfaction in 2014
225,573
Borrowers and
Investors
in Q4 2015
US$1.89
Billion
Total Marketplace Loan
Facilitations (1)
#1/#2
Brand Amongst
Investors/
Borrowers (3)
32.5%
Loans facilitated
through Yirendai
Mobile Application (2)
in Q4 2015
9 Years
Credit data
supported by
proprietary risk
management
model
2 A Leading Online Consumer Finance Marketplace
WARDED2014\7. Analyst Presentation\Cruise_AP_v31.pptx
13 13
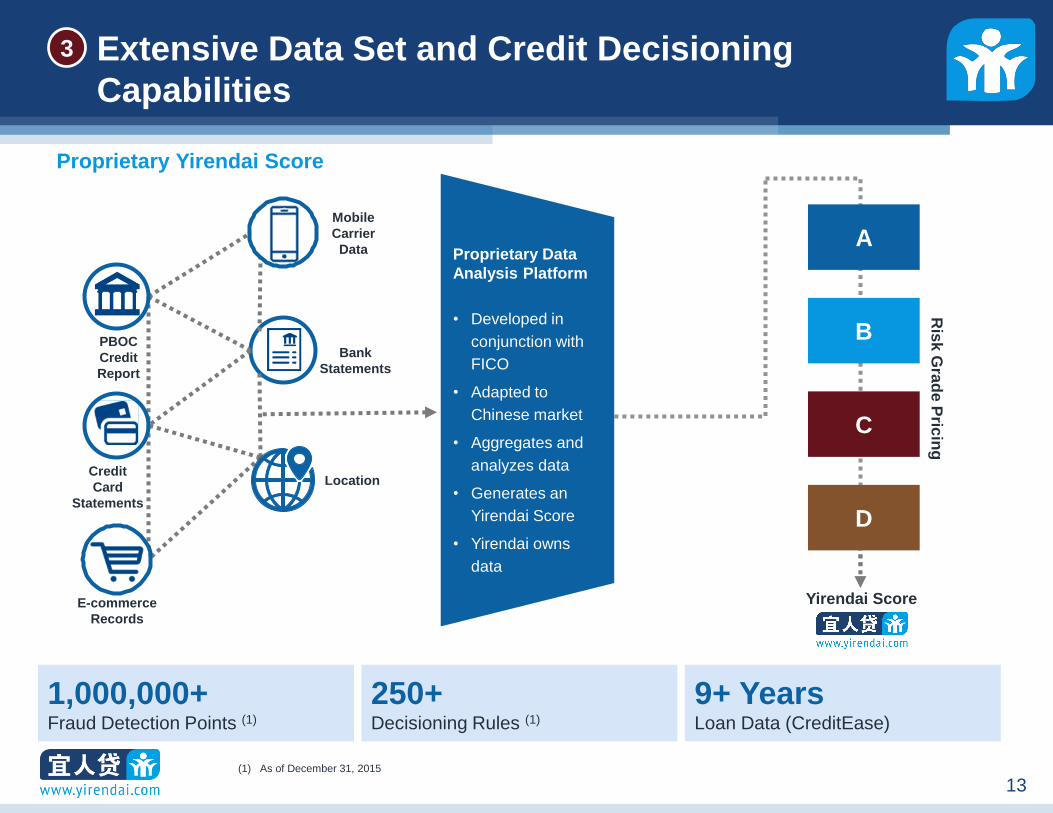
E-commerce
Records
Credit
Card
Statements
Bank
Statements
Location
Mobile
Carrier
Data A
B
C
D
Yirendai Score
PBOC
Credit
Report
Ris
k G
rad
e P
ricin
g
Proprietary Yirendai Score
9+ Years Loan Data (CreditEase)
1,000,000+ Fraud Detection Points (1)
250+ Decisioning Rules (1)
(1) As of December 31, 2015
Proprietary Data
Analysis Platform
• Developed in
conjunction with
FICO
• Adapted to
Chinese market
• Aggregates and
analyzes data
• Generates an
Yirendai Score
• Yirendai owns
data
3 Extensive Data Set and Credit Decisioning
Capabilities
WARDED2014\7. Analyst Presentation\Cruise_AP_v31.pptx
14 14
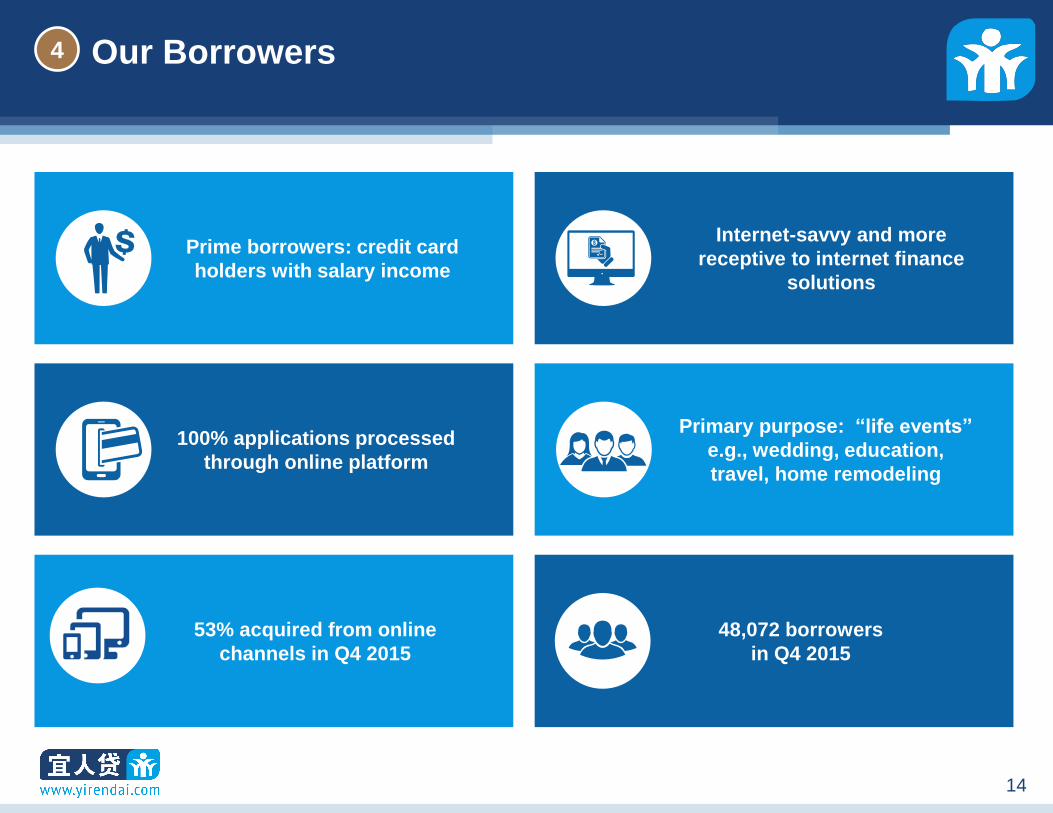
Our Borrowers
48,072 borrowers
in Q4 2015
53% acquired from online
channels in Q4 2015
Internet-savvy and more
receptive to internet finance
solutions
Prime borrowers: credit card
holders with salary income
100% applications processed
through online platform
Primary purpose: “life events”
e.g., wedding, education,
travel, home remodeling
4
WARDED2014\7. Analyst Presentation\Cruise_AP_v31.pptx
15 15
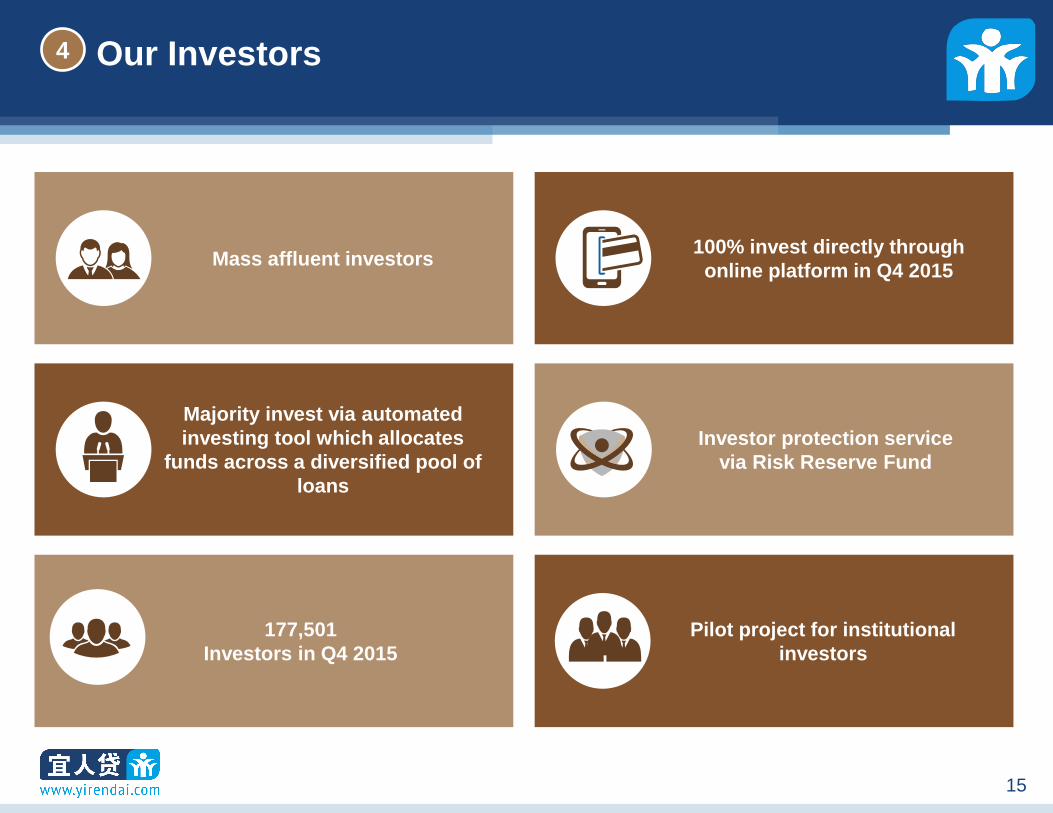
Our Investors
177,501
Investors in Q4 2015
Mass affluent investors 100% invest directly through
online platform in Q4 2015
Investor protection service
via Risk Reserve Fund
Majority invest via automated
investing tool which allocates
funds across a diversified pool of
loans
Pilot project for institutional
investors
4
WARDED2014\7. Analyst Presentation\Cruise_AP_v31.pptx
16 16
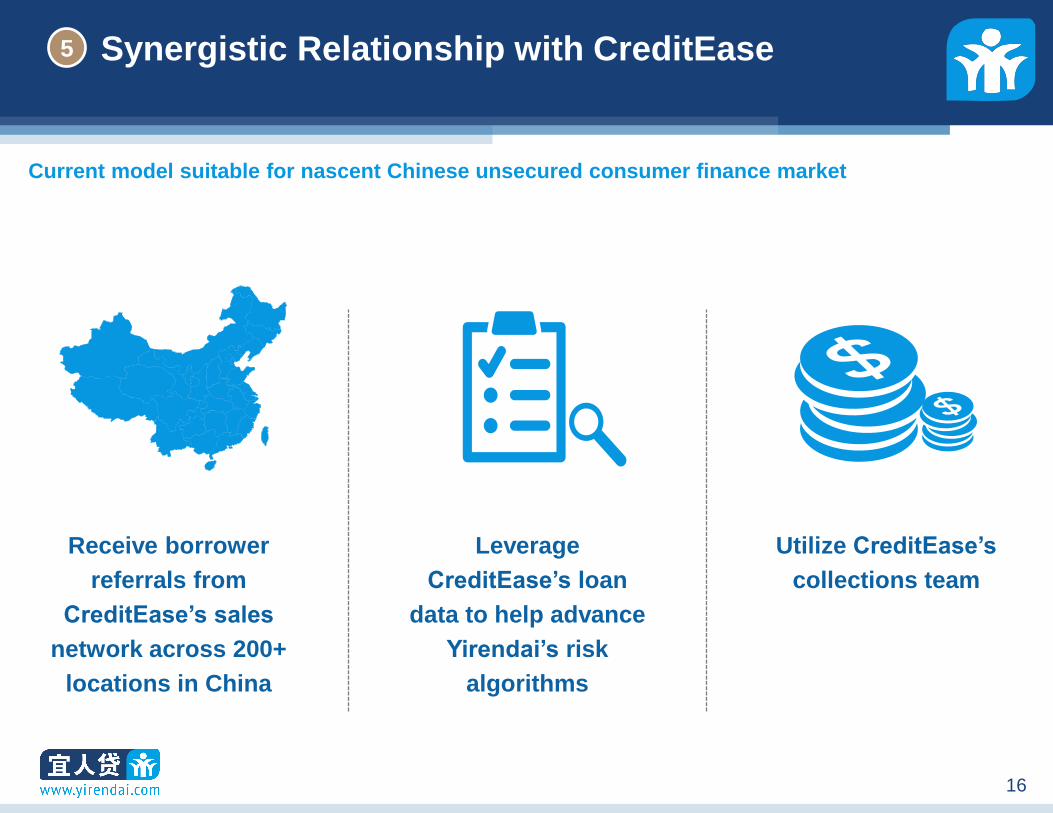
Current model suitable for nascent Chinese unsecured consumer finance market
Receive borrower
referrals from
CreditEase’s sales
network across 200+
locations in China
Leverage
CreditEase’s loan
data to help advance
Yirendai’s risk
algorithms
Utilize CreditEase’s
collections team
5 Synergistic Relationship with CreditEase
WARDED2014\7. Analyst Presentation\Cruise_AP_v31.pptx
17 17
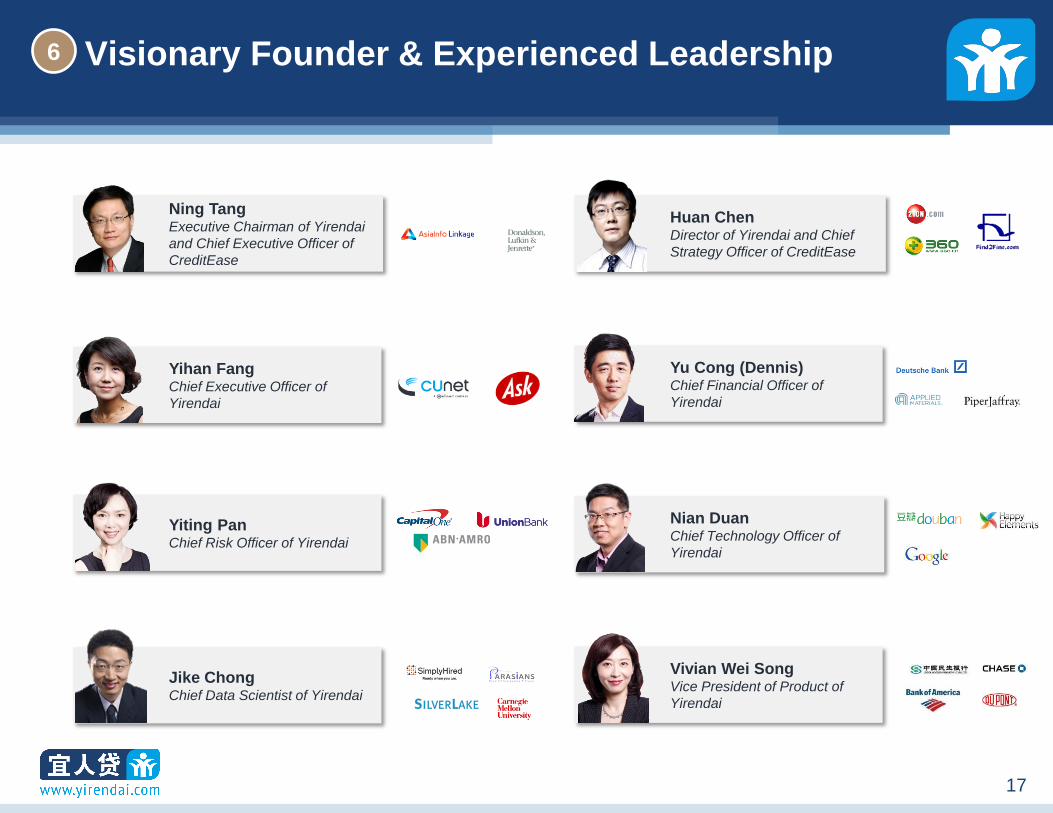
Jike Chong Chief Data Scientist of Yirendai
Ning Tang Executive Chairman of Yirendai
and Chief Executive Officer of
CreditEase
Yihan Fang Chief Executive Officer of
Yirendai
Yu Cong (Dennis) Chief Financial Officer of
Yirendai
Huan Chen Director of Yirendai and Chief
Strategy Officer of CreditEase
Yiting Pan Chief Risk Officer of Yirendai
Nian Duan Chief Technology Officer of
Yirendai
Vivian Wei Song Vice President of Product of
Yirendai
Visionary Founder & Experienced Leadership 6

Financial Highlights
WARDED2014\7. Analyst Presentation\Cruise_AP_v31.pptx
19 19
Financial Highlights
Marketplace Model
1
Disciplined Growth of Loan Facilitations
2
Sophisticated Risk Pricing Product Portfolio
3
Robust Growth and Profitability
4
Proven Credit Performance 5
WARDED2014\7. Analyst Presentation\Cruise_AP_v31.pptx
20 20
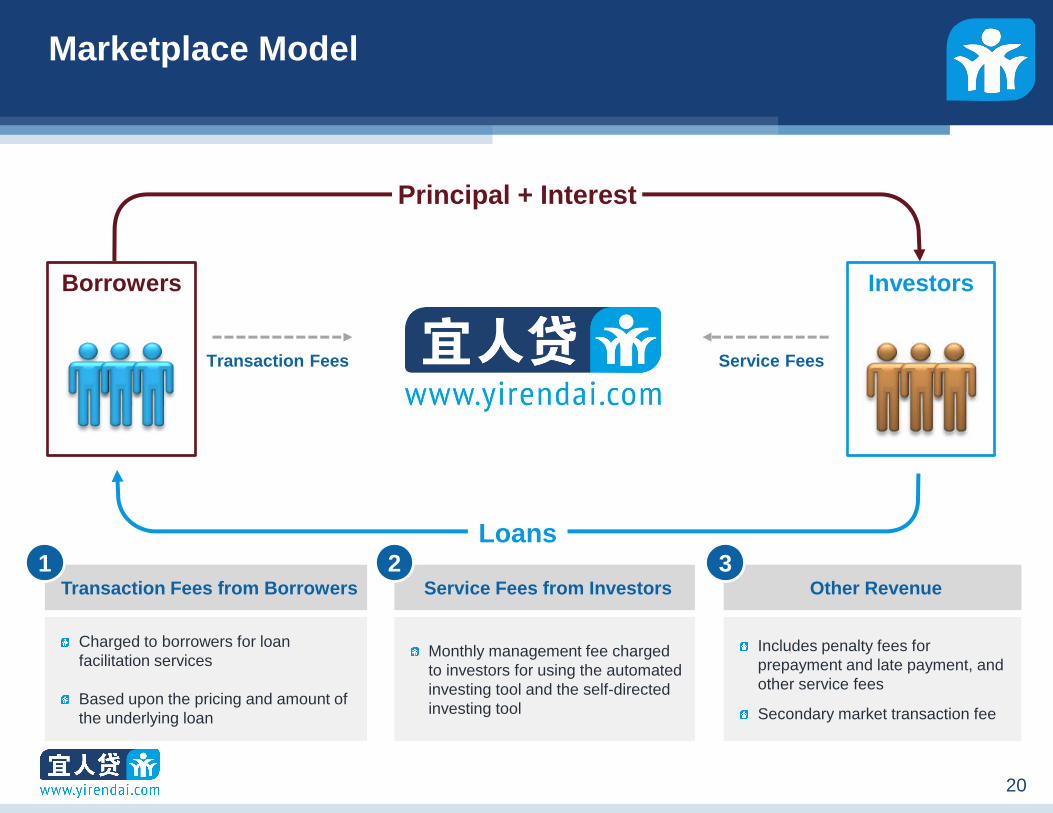
Marketplace Model
Principal + Interest
Transaction Fees Service Fees
Loans
Borrowers Investors
Monthly management fee charged
to investors for using the automated
investing tool and the self-directed
investing tool
Service Fees from Investors
2
Charged to borrowers for loan
facilitation services
Based upon the pricing and amount of
the underlying loan
Transaction Fees from Borrowers
1
Includes penalty fees for
prepayment and late payment, and
other service fees
Secondary market transaction fee
Other Revenue
3
WARDED2014\7. Analyst Presentation\Cruise_AP_v31.pptx
21 21
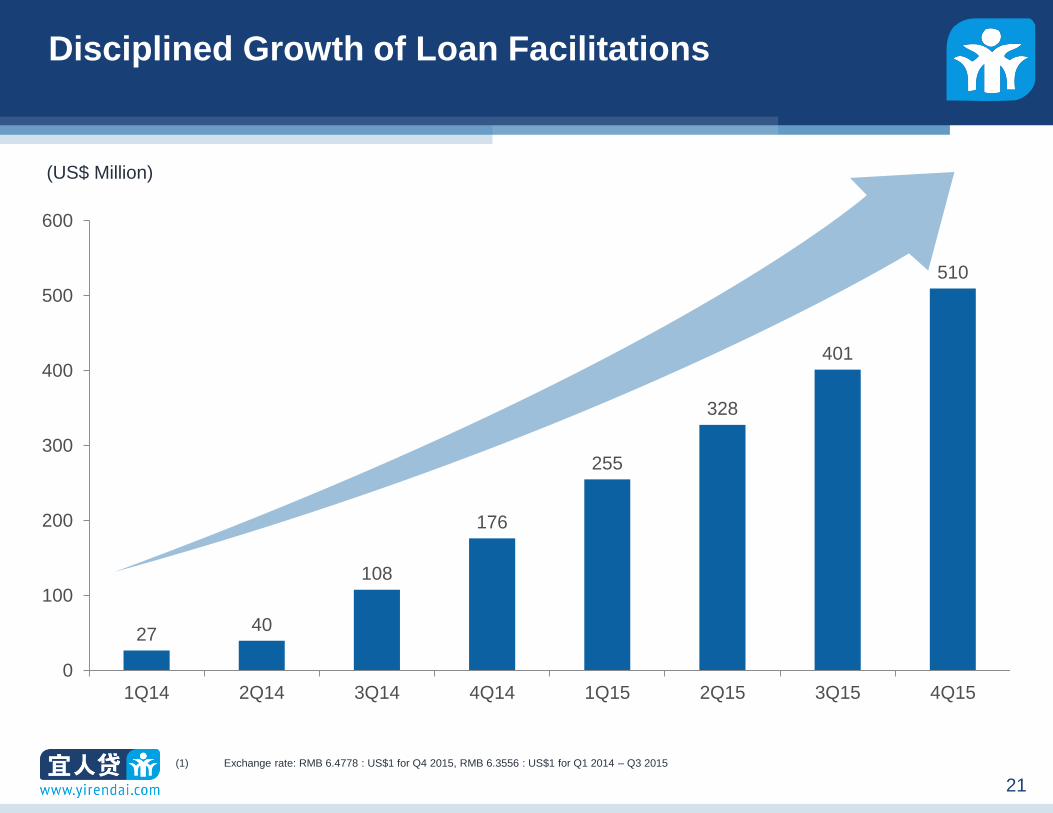
Disciplined Growth of Loan Facilitations
27 40
108
176
255
328
401
510
0
100
200
300
400
500
600
1Q14 2Q14 3Q14 4Q14 1Q15 2Q15 3Q15 4Q15
(1) Exchange rate: RMB 6.4778 : US$1 for Q4 2015, RMB 6.3556 : US$1 for Q1 2014 – Q3 2015
(US$ Million)
WARDED2014\7. Analyst Presentation\Cruise_AP_v31.pptx
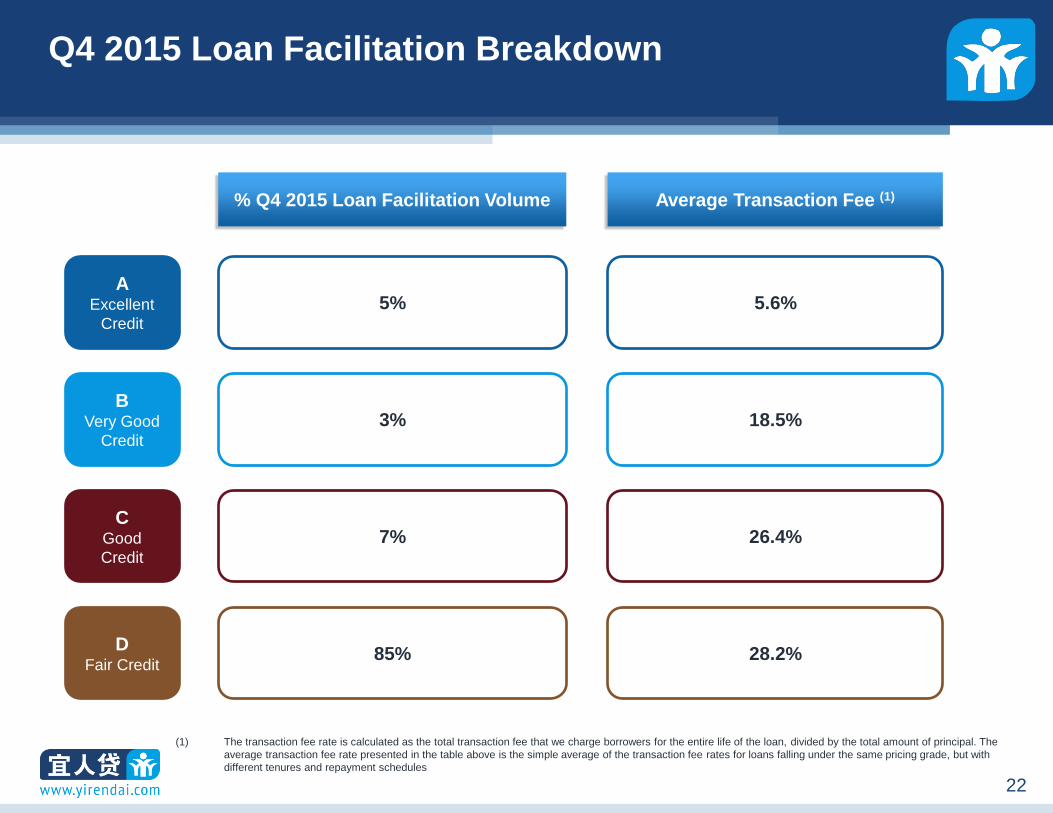
22 22
B Very Good
Credit
3% 18.5%
A Excellent
Credit
5% 5.6%
D Fair Credit
85% 28.2%
Q4 2015 Loan Facilitation Breakdown
(1) The transaction fee rate is calculated as the total transaction fee that we charge borrowers for the entire life of the loan, divided by the total amount of principal. The
average transaction fee rate presented in the table above is the simple average of the transaction fee rates for loans falling under the same pricing grade, but with
different tenures and repayment schedules
C Good
Credit
7% 26.4%
Average Transaction Fee (1) % Q4 2015 Loan Facilitation Volume
WARDED2014\7. Analyst Presentation\Cruise_AP_v31.pptx
23 23
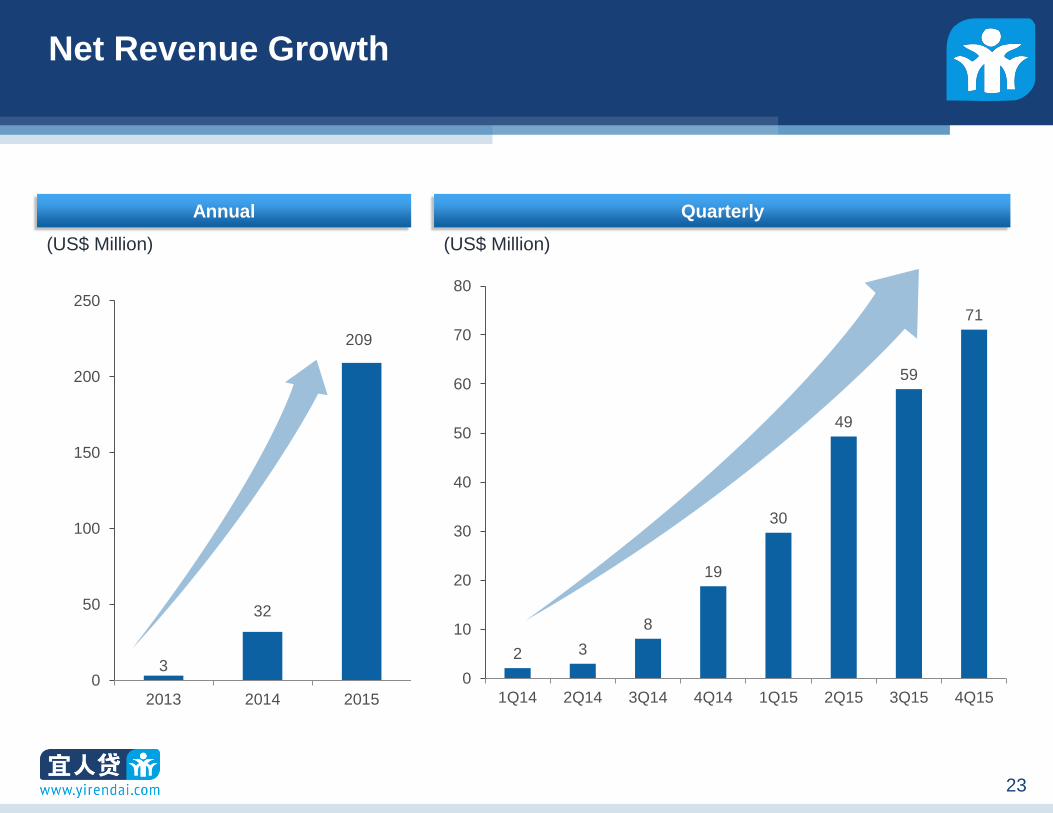
Net Revenue Growth
3
32
209
0
50
100
150
200
250
2013 2014 2015
Annual
2 3
8
19
30
49
59
71
0
10
20
30
40
50
60
70
80
1Q14 2Q14 3Q14 4Q14 1Q15 2Q15 3Q15 4Q15
Quarterly
(US$ Million) (US$ Million)
WARDED2014\7. Analyst Presentation\Cruise_AP_v31.pptx
24 24
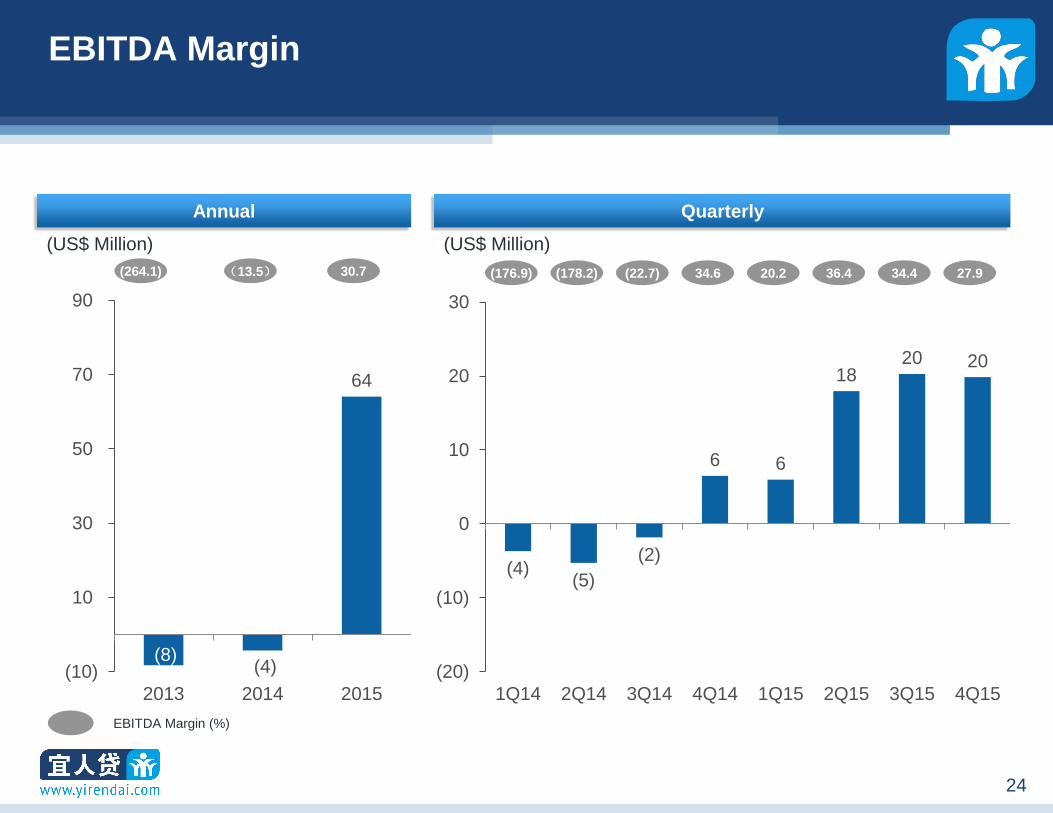
EBITDA Margin
(8) (4)
64
(10)
10
30
50
70
90
2013 2014 2015
Annual
(4) (5)
(2)
6 6
18 20 20
(20)
(10)
0
10
20
30
1Q14 2Q14 3Q14 4Q14 1Q15 2Q15 3Q15 4Q15
Quarterly
(US$ Million) (US$ Million)
EBITDA Margin (%)
(264.1) (13.5) 30.7 27.9 (176.9) (178.2) (22.7) 34.6 20.2 36.4 34.4
WARDED2014\7. Analyst Presentation\Cruise_AP_v31.pptx
25 25
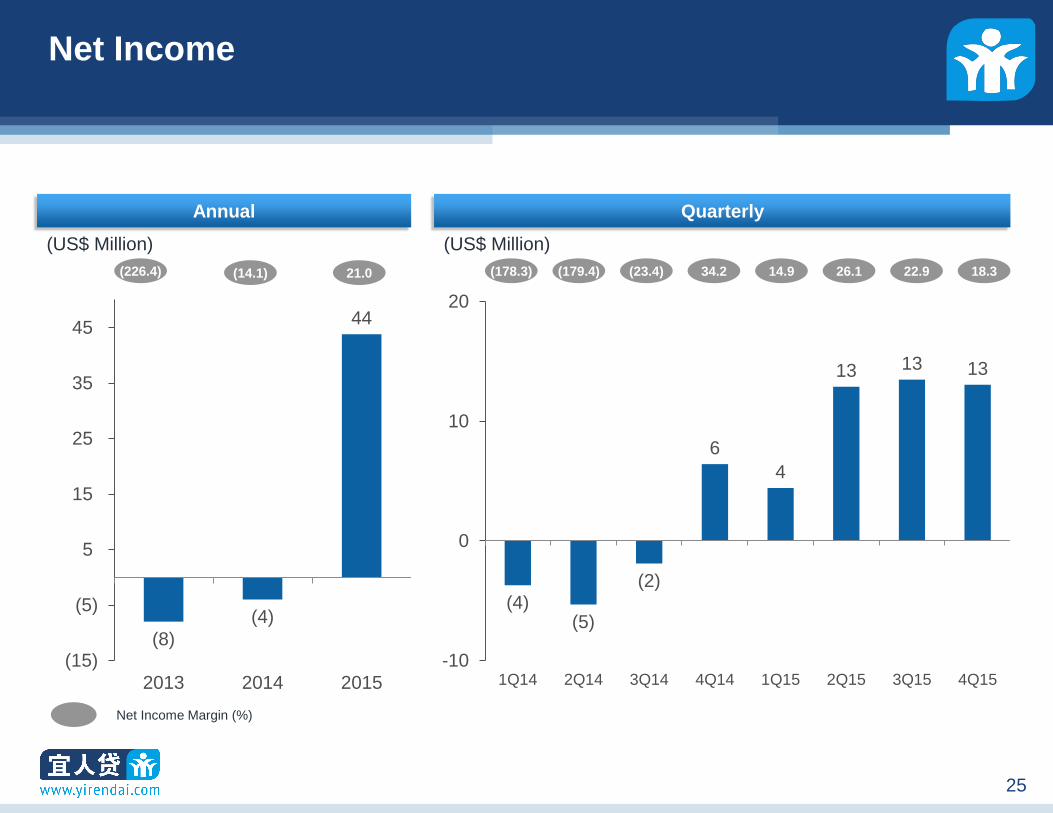
Net Income
(8)
(4)
44
(15)
(5)
5
15
25
35
45
2013 2014 2015
Annual
(4) (5)
(2)
6
4
13 13 13
-10
0
10
20
1Q14 2Q14 3Q14 4Q14 1Q15 2Q15 3Q15 4Q15
Quarterly
(US$ Million) (US$ Million)
(226.4) (14.1)
Net Income Margin (%)
21.0 (178.3) (179.4) (23.4) 34.2 14.9 26.1 22.9 18.3
WARDED2014\7. Analyst Presentation\Cruise_AP_v31.pptx
26 26
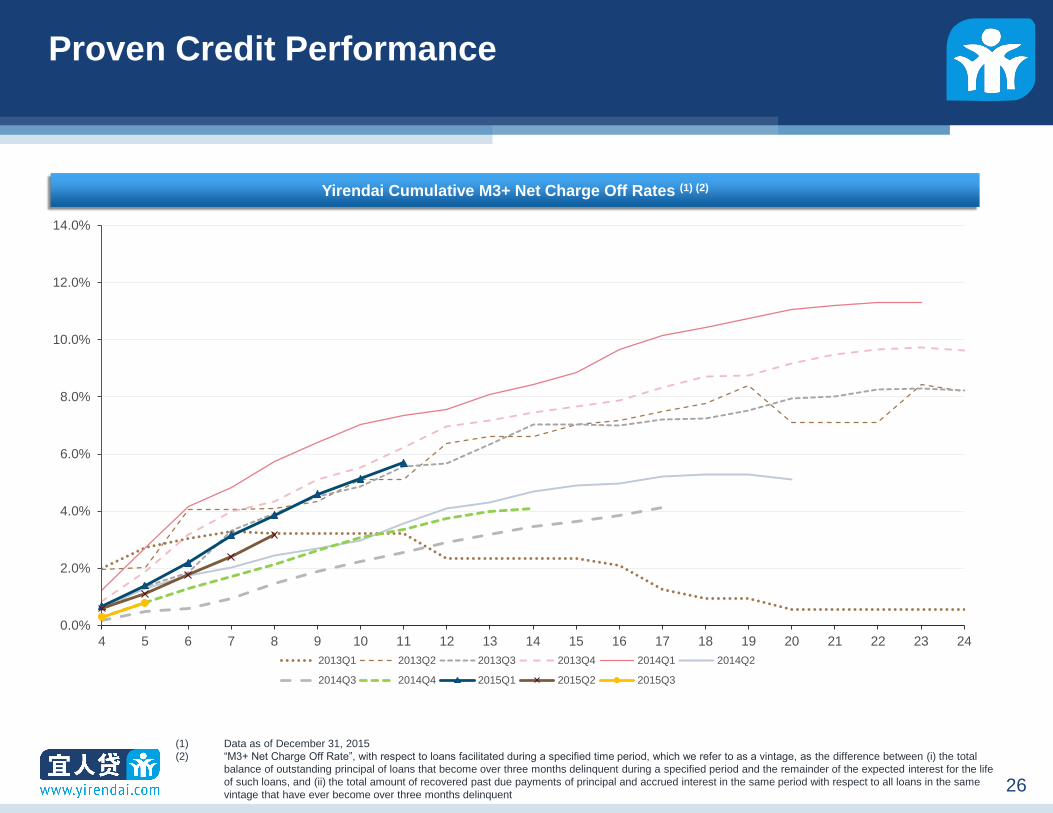
Yirendai Cumulative M3+ Net Charge Off Curve (1) (2) Yirendai Cumulative M3+ Net Charge Off Rates (1) (2)
0.0%
2.0%
4.0%
6.0%
8.0%
10.0%
12.0%
14.0%
4 5 6 7 8 9 10 11 12 13 14 15 16 17 18 19 20 21 22 23 24
2013Q1 2013Q2 2013Q3 2013Q4 2014Q1 2014Q2
2014Q3 2014Q4 2015Q1 2015Q2 2015Q3
(1) Data as of December 31, 2015
(2) “M3+ Net Charge Off Rate”, with respect to loans facilitated during a specified time period, which we refer to as a vintage, as the difference between (i) the total
balance of outstanding principal of loans that become over three months delinquent during a specified period and the remainder of the expected interest for the life
of such loans, and (ii) the total amount of recovered past due payments of principal and accrued interest in the same period with respect to all loans in the same
vintage that have ever become over three months delinquent
Proven Credit Performance
WARDED2014\7. Analyst Presentation\Cruise_AP_v31.pptx
27 27
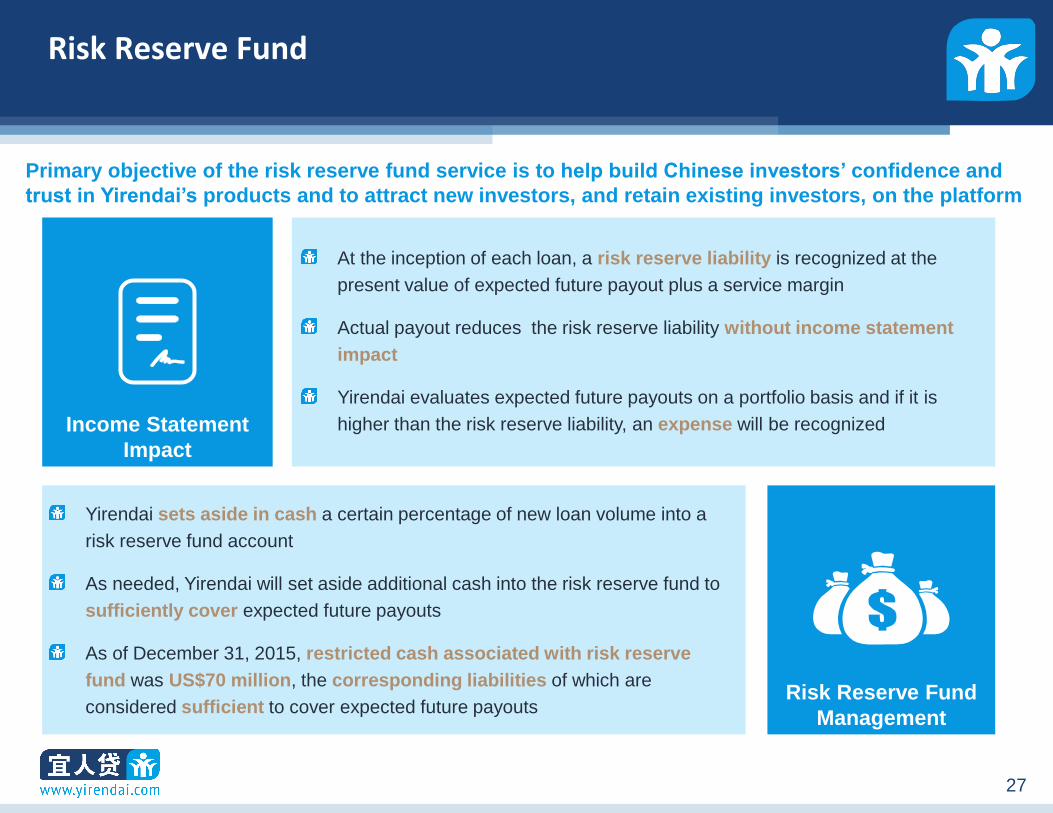
Risk Reserve Fund
Inception of a Loan
Primary objective of the risk reserve fund service is to help build Chinese investors’ confidence and
trust in Yirendai’s products and to attract new investors, and retain existing investors, on the platform
Income Statement
Impact
Risk Reserve Fund
Management
At the inception of each loan, a risk reserve liability is recognized at the
present value of expected future payout plus a service margin
Actual payout reduces the risk reserve liability without income statement
impact
Yirendai evaluates expected future payouts on a portfolio basis and if it is
higher than the risk reserve liability, an expense will be recognized
Yirendai sets aside in cash a certain percentage of new loan volume into a
risk reserve fund account
As needed, Yirendai will set aside additional cash into the risk reserve fund to
sufficiently cover expected future payouts
As of December 31, 2015, restricted cash associated with risk reserve
fund was US$70 million, the corresponding liabilities of which are
considered sufficient to cover expected future payouts
WARDED2014\7. Analyst Presentation\Cruise_AP_v31.pptx
28 28
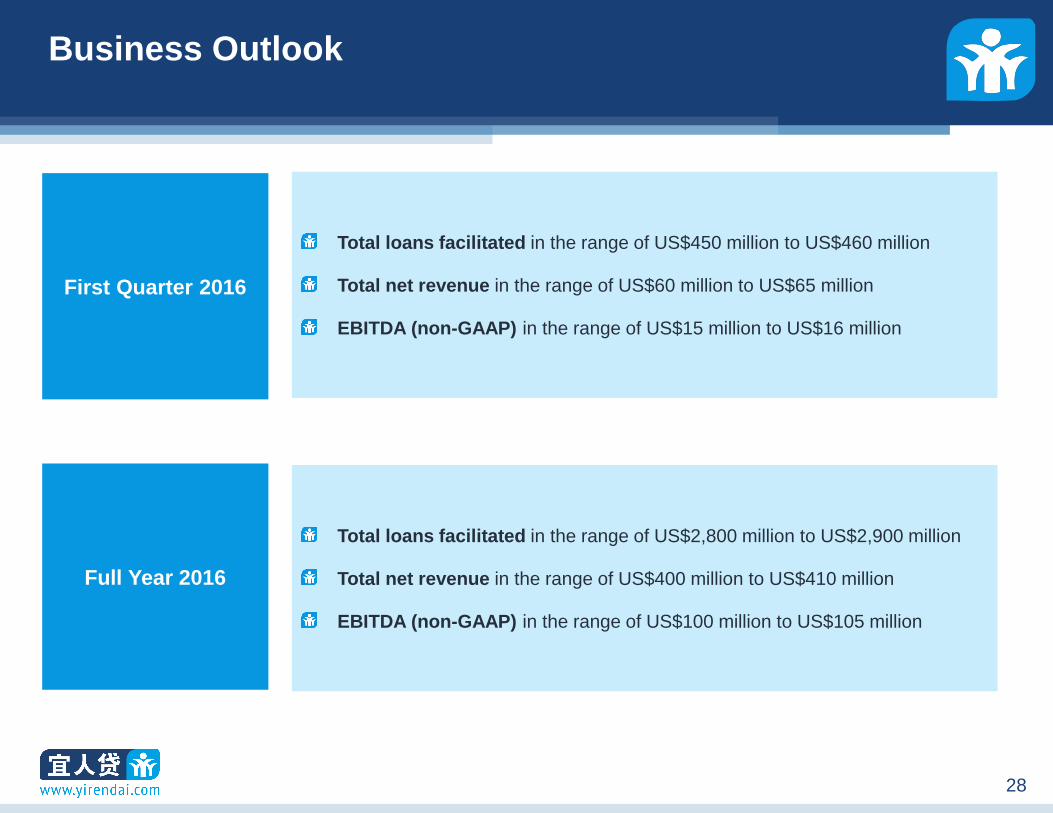
Business Outlook
First Quarter 2016
Total loans facilitated in the range of US$450 million to US$460 million
Total net revenue in the range of US$60 million to US$65 million
EBITDA (non-GAAP) in the range of US$15 million to US$16 million
Full Year 2016
Total loans facilitated in the range of US$2,800 million to US$2,900 million
Total net revenue in the range of US$400 million to US$410 million
EBITDA (non-GAAP) in the range of US$100 million to US$105 million

Appendix
WARDED2014\7. Analyst Presentation\Cruise_AP_v31.pptx
30 30
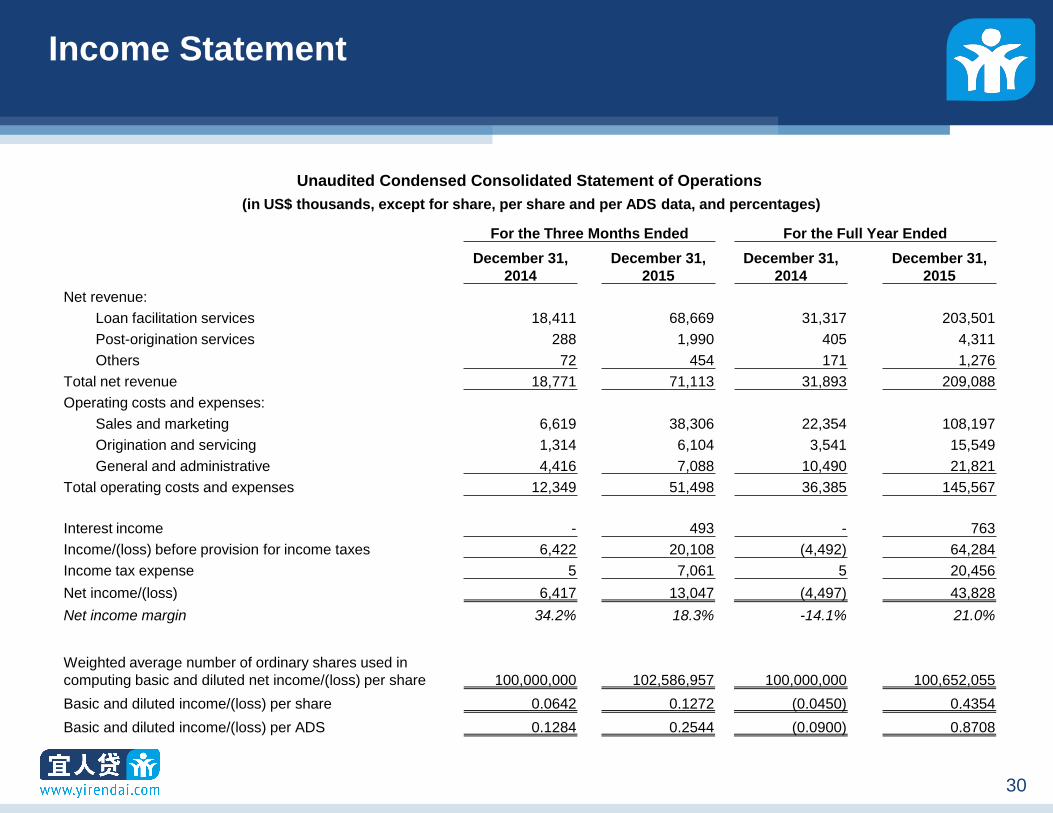
Income Statement
Unaudited Condensed Consolidated Statement of Operations
(in US$ thousands, except for share, per share and per ADS data, and percentages)
For the Three Months Ended For the Full Year Ended
December 31,
2014
December 31,
2015
December 31,
2014
December 31,
2015
Net revenue:
Loan facilitation services 18,411 68,669 31,317 203,501
Post-origination services 288 1,990 405 4,311
Others 72 454 171 1,276
Total net revenue 18,771 71,113 31,893 209,088
Operating costs and expenses:
Sales and marketing 6,619 38,306 22,354 108,197
Origination and servicing 1,314 6,104 3,541 15,549
General and administrative 4,416 7,088 10,490 21,821
Total operating costs and expenses 12,349 51,498 36,385 145,567
Interest income - 493 - 763
Income/(loss) before provision for income taxes 6,422 20,108 (4,492) 64,284
Income tax expense 5 7,061 5 20,456
Net income/(loss) 6,417 13,047 (4,497) 43,828
Net income margin 34.2% 18.3% -14.1% 21.0%
Weighted average number of ordinary shares used in
computing basic and diluted net income/(loss) per share 100,000,000 102,586,957 100,000,000 100,652,055
Basic and diluted income/(loss) per share 0.0642 0.1272 (0.0450) 0.4354
Basic and diluted income/(loss) per ADS 0.1284 0.2544 (0.0900) 0.8708
WARDED2014\7. Analyst Presentation\Cruise_AP_v31.pptx
31 31
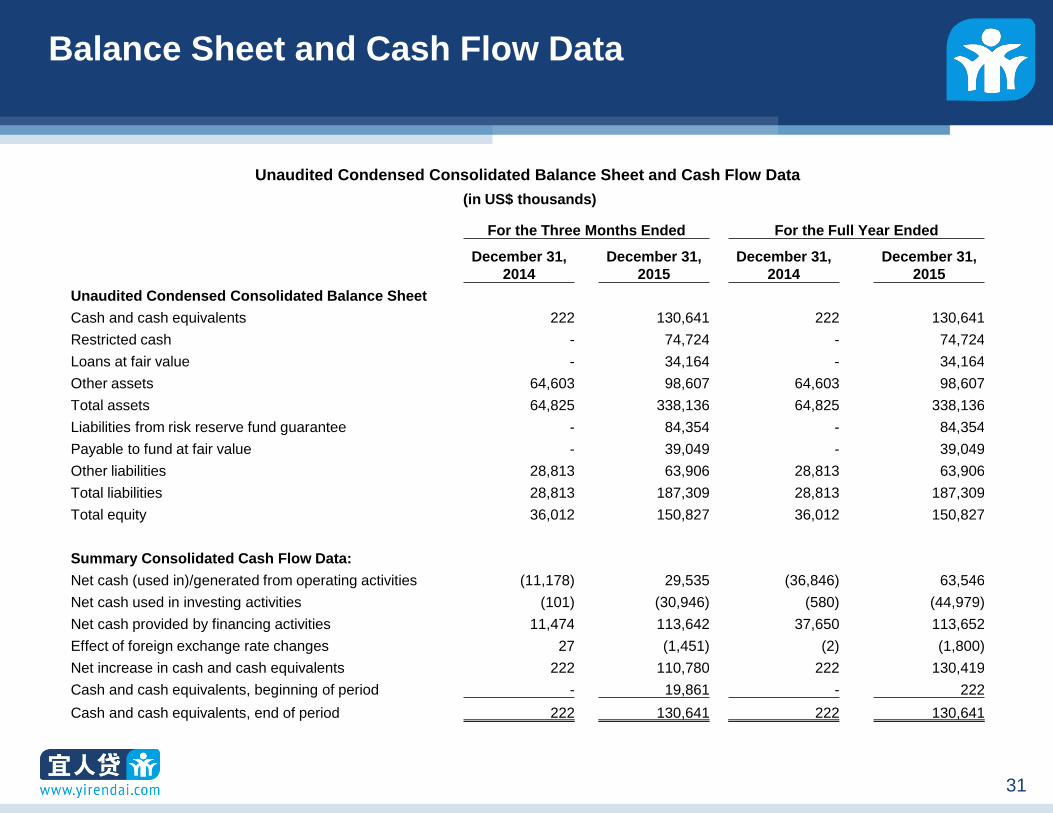
Balance Sheet and Cash Flow Data
Unaudited Condensed Consolidated Balance Sheet and Cash Flow Data
(in US$ thousands)
For the Three Months Ended For the Full Year Ended
December 31,
2014
December 31,
2015
December 31,
2014
December 31,
2015
Unaudited Condensed Consolidated Balance Sheet
Cash and cash equivalents 222 130,641 222 130,641
Restricted cash - 74,724 - 74,724
Loans at fair value - 34,164 - 34,164
Other assets 64,603 98,607 64,603 98,607
Total assets 64,825 338,136 64,825 338,136
Liabilities from risk reserve fund guarantee - 84,354 - 84,354
Payable to fund at fair value - 39,049 - 39,049
Other liabilities 28,813 63,906 28,813 63,906
Total liabilities 28,813 187,309 28,813 187,309
Total equity 36,012 150,827 36,012 150,827
Summary Consolidated Cash Flow Data:
Net cash (used in)/generated from operating activities (11,178) 29,535 (36,846) 63,546
Net cash used in investing activities (101) (30,946) (580) (44,979)
Net cash provided by financing activities 11,474 113,642 37,650 113,652
Effect of foreign exchange rate changes 27 (1,451) (2) (1,800)
Net increase in cash and cash equivalents 222 110,780 222 130,419
Cash and cash equivalents, beginning of period - 19,861 - 222
Cash and cash equivalents, end of period 222 130,641 222 130,641
WARDED2014\7. Analyst Presentation\Cruise_AP_v31.pptx
32 32
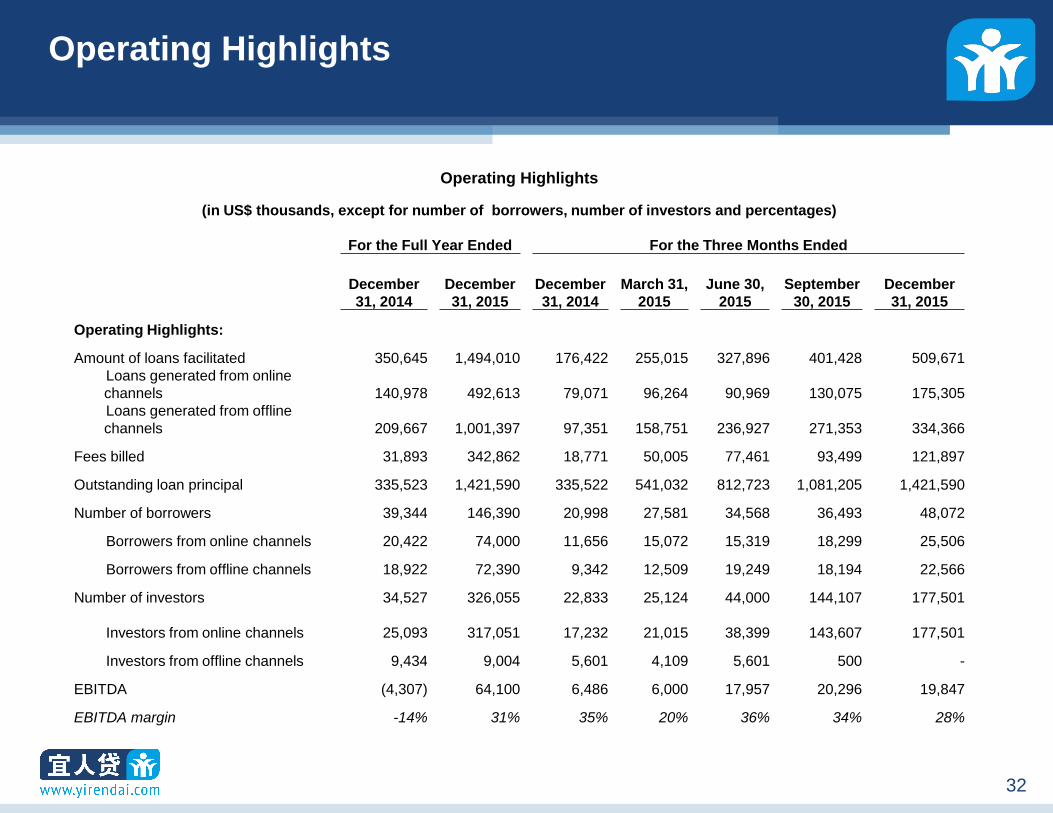
Operating Highlights
Operating Highlights
(in US$ thousands, except for number of borrowers, number of investors and percentages)
For the Full Year Ended For the Three Months Ended
December
31, 2014
December
31, 2015
December
31, 2014
March 31,
2015
June 30,
2015
September
30, 2015
December
31, 2015
Operating Highlights:
Amount of loans facilitated 350,645 1,494,010 176,422 255,015 327,896 401,428 509,671
Loans generated from online
channels 140,978 492,613 79,071 96,264 90,969 130,075 175,305
Loans generated from offline
channels 209,667 1,001,397 97,351 158,751 236,927 271,353 334,366
Fees billed 31,893 342,862 18,771 50,005 77,461 93,499 121,897
Outstanding loan principal 335,523 1,421,590 335,522 541,032 812,723 1,081,205 1,421,590
Number of borrowers 39,344 146,390 20,998 27,581 34,568 36,493 48,072
Borrowers from online channels 20,422 74,000 11,656 15,072 15,319 18,299 25,506
Borrowers from offline channels 18,922 72,390 9,342 12,509 19,249 18,194 22,566
Number of investors 34,527 326,055 22,833 25,124 44,000 144,107 177,501
Investors from online channels 25,093 317,051 17,232 21,015 38,399 143,607
177,501
Investors from offline channels 9,434 9,004 5,601 4,109 5,601 500 -
EBITDA (4,307) 64,100 6,486 6,000 17,957 20,296 19,847
EBITDA margin -14% 31% 35% 20% 36% 34% 28%
WARDED2014\7. Analyst Presentation\Cruise_AP_v31.pptx
33 33
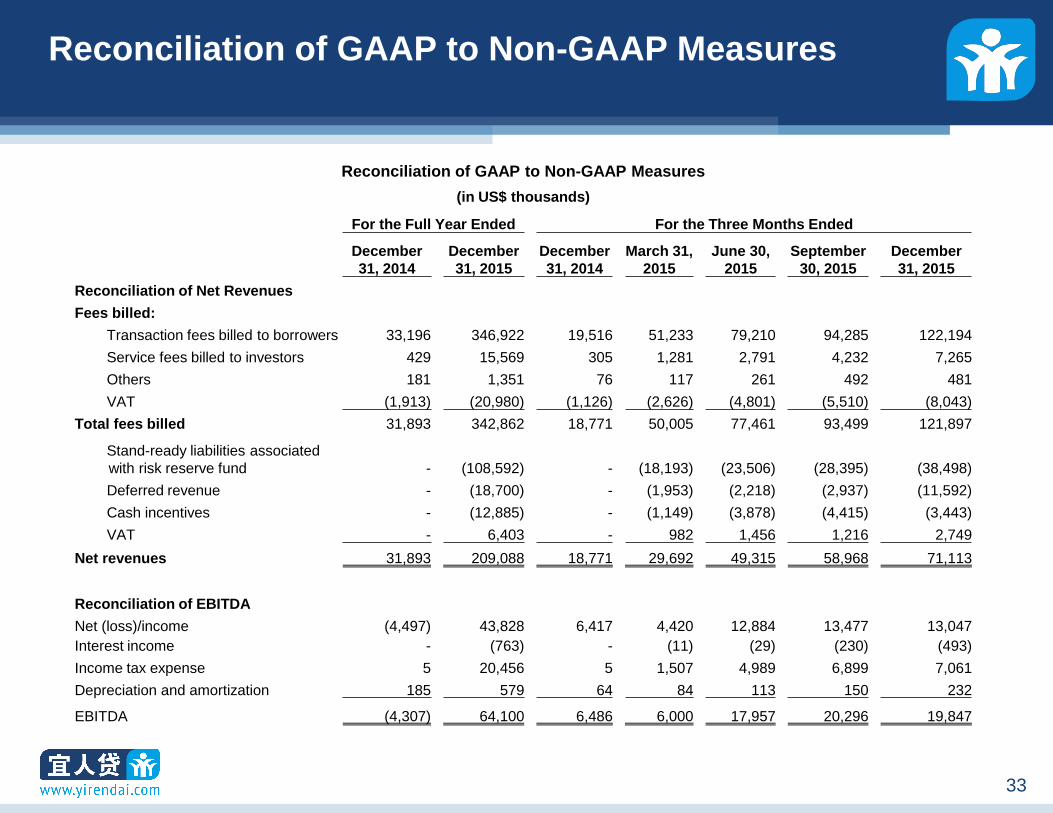
Reconciliation of GAAP to Non-GAAP Measures
Reconciliation of GAAP to Non-GAAP Measures
(in US$ thousands)
For the Full Year Ended For the Three Months Ended
December
31, 2014
December
31, 2015
December
31, 2014
March 31,
2015
June 30,
2015
September
30, 2015
December
31, 2015
Reconciliation of Net Revenues
Fees billed:
Transaction fees billed to borrowers 33,196 346,922 19,516 51,233 79,210 94,285 122,194
Service fees billed to investors 429 15,569 305 1,281 2,791 4,232 7,265
Others 181 1,351 76 117 261 492 481
VAT (1,913) (20,980) (1,126) (2,626) (4,801) (5,510) (8,043)
Total fees billed 31,893 342,862 18,771 50,005 77,461 93,499 121,897
Stand-ready liabilities associated
with risk reserve fund - (108,592) - (18,193) (23,506) (28,395) (38,498)
Deferred revenue - (18,700) - (1,953) (2,218) (2,937) (11,592)
Cash incentives - (12,885) - (1,149) (3,878) (4,415) (3,443)
VAT - 6,403 - 982 1,456 1,216 2,749
Net revenues 31,893 209,088 18,771 29,692 49,315 58,968 71,113
Reconciliation of EBITDA
Net (loss)/income (4,497) 43,828 6,417 4,420 12,884 13,477 13,047
Interest income - (763) - (11) (29) (230) (493)
Income tax expense 5 20,456 5 1,507 4,989 6,899 7,061
Depreciation and amortization 185 579 64 84 113 150 232
EBITDA (4,307) 64,100 6,486 6,000 17,957 20,296 19,847
WARDED2014\7. Analyst Presentation\Cruise_AP_v31.pptx
34 34
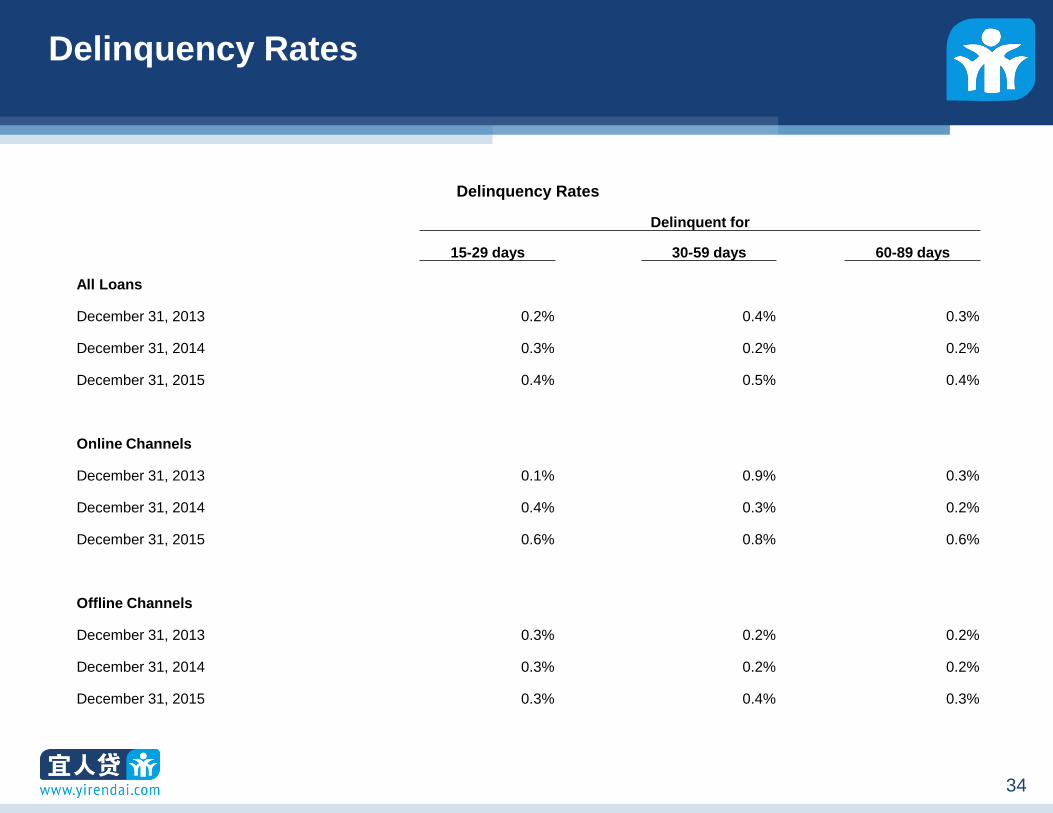
Delinquency Rates
Delinquency Rates
Delinquent for
15-29 days 30-59 days 60-89 days
All Loans
December 31, 2013 0.2% 0.4% 0.3%
December 31, 2014 0.3% 0.2% 0.2%
December 31, 2015 0.4% 0.5% 0.4%
Online Channels
December 31, 2013 0.1% 0.9% 0.3%
December 31, 2014 0.4% 0.3% 0.2%
December 31, 2015 0.6% 0.8% 0.6%
Offline Channels
December 31, 2013 0.3% 0.2% 0.2%
December 31, 2014 0.3% 0.2% 0.2%
December 31, 2015 0.3% 0.4% 0.3%
WARDED2014\7. Analyst Presentation\Cruise_AP_v31.pptx
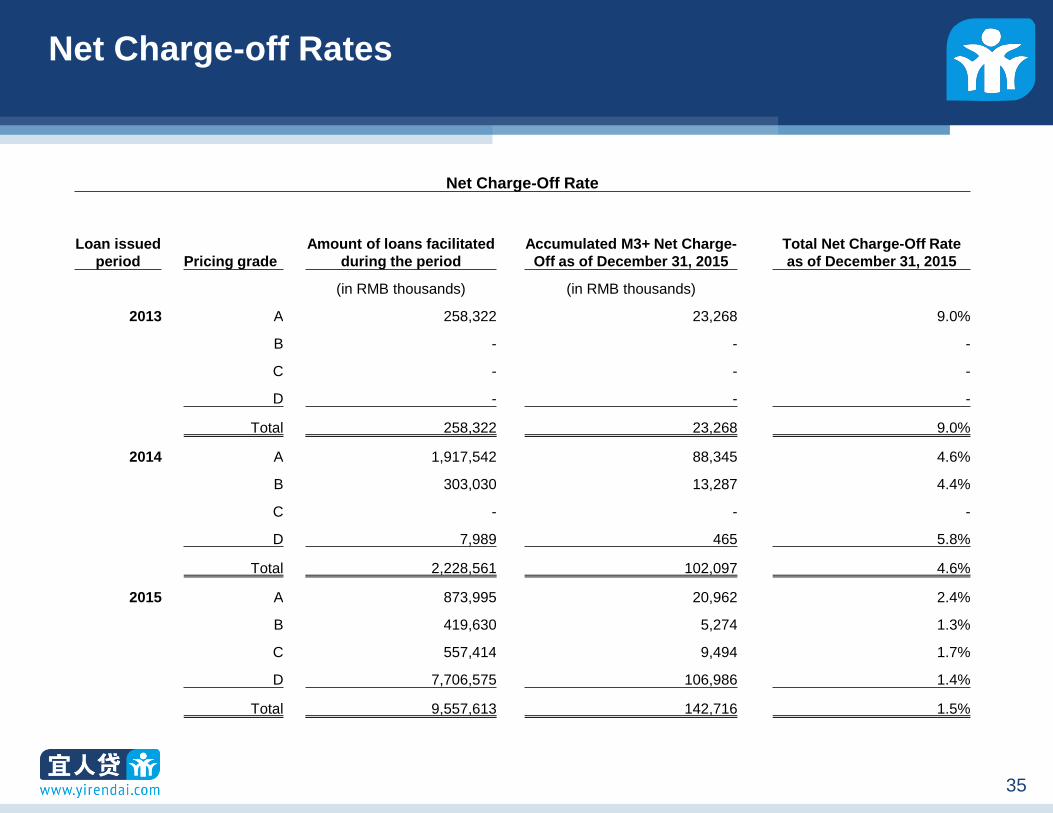
35 35
Net Charge-off Rates
Net Charge-Off Rate
Loan issued
period Pricing grade
Amount of loans facilitated
during the period
Accumulated M3+ Net Charge-
Off as of December 31, 2015
Total Net Charge-Off Rate
as of December 31, 2015
(in RMB thousands) (in RMB thousands)
2013 A 258,322 23,268 9.0%
B - - -
C - - -
D - - -
Total 258,322 23,268 9.0%
2014 A 1,917,542 88,345 4.6%
B 303,030 13,287 4.4%
C - - -
D 7,989 465 5.8%
Total 2,228,561 102,097 4.6%
2015 A 873,995 20,962 2.4%
B 419,630 5,274 1.3%
C 557,414 9,494 1.7%
D 7,706,575 106,986 1.4%
Total 9,557,613 142,716 1.5%

36
A Leading Online Consumer
Finance Marketplace in China