Embed Size (px)
Citation preview
Food Price Monitoring and Analysis10 December 2018
MONTHLY REPORT ON FOOD PRICE TRENDS
BULLETIN#10
GIEWS - Global Information and Early Warning System on Food and Agriculture
KEY MESSAGES ↗ International prices of wheat and maize remained under downward pressure in November, mostly on account of large nearby supplies. For rice, new crop arrivals continued to weigh on export price quotations.
↗ In East Africa, in the Sudan, a further sharp devaluation of the currency triggered a marked increase in the prices of grains, which reached record to near-record highs despite the ongoing harvest.
↗ In Southern Africa, in Zimbabwe, a drop in the value of the country’s currency, as well as a shortage of foreign exchange, curbed imports and underpinned the increases in cereal prices. Elsewhere in the subregion, reduced 2018 harvests pushed the prices of maize to levels above those recorded a year earlier in several countries.
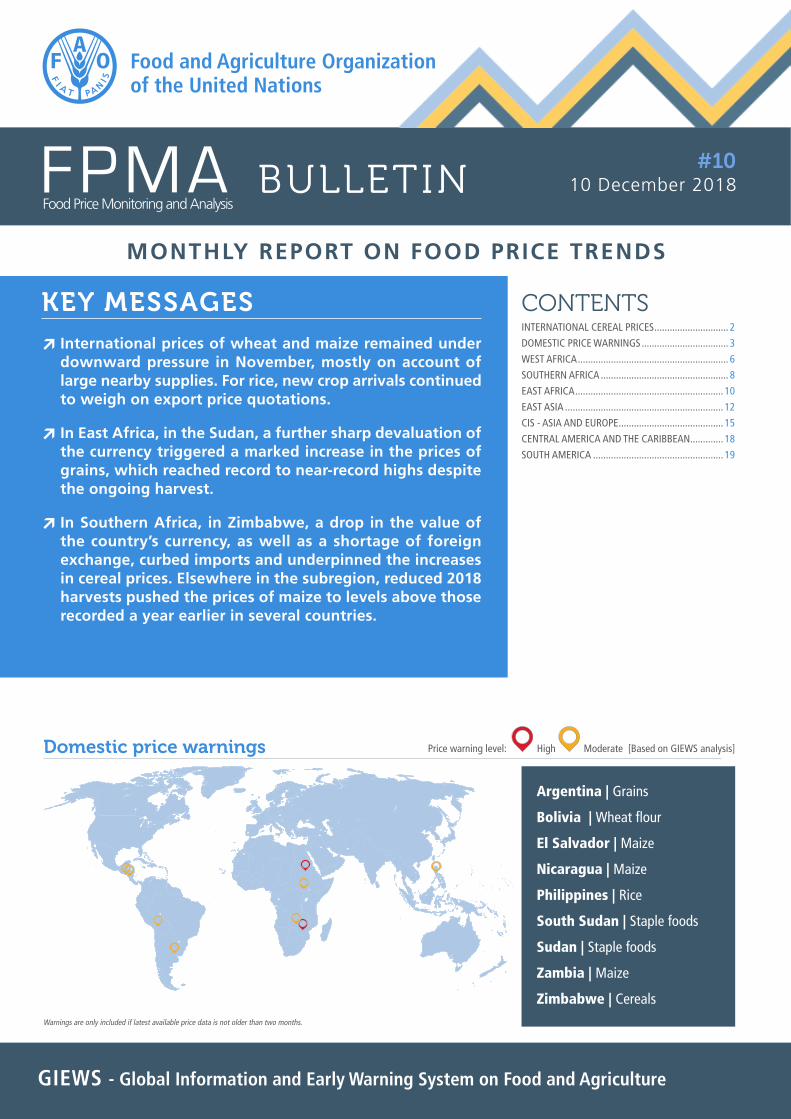
Price warning level: High Moderate [Based on GIEWS analysis]
CONTENTSINTERNATIONAL CEREAL PRICES ............................. 2
DOMESTIC PRICE WARNINGS .................................. 3
WEST AFRICA ........................................................... 6
SOUTHERN AFRICA .................................................. 8
EAST AFRICA .......................................................... 10
EAST ASIA .............................................................. 12
CIS - ASIA AND EUROPE ......................................... 15
CENTRAL AMERICA AND THE CARIBBEAN ............. 18
SOUTH AMERICA ................................................... 19
Argentina | Grains
Bolivia | Wheat flour
El Salvador | Maize
Nicaragua | Maize
Philippines | Rice
South Sudan | Staple foods
Sudan | Staple foods
Zambia | Maize
Zimbabwe | Cereals
Domestic price warnings
Warnings are only included if latest available price data is not older than two months.
2 10 December 2018GIEWS FPMA Bulletin
For more information visit the FPMA website here
INTERNATIONAL CEREAL PRICES
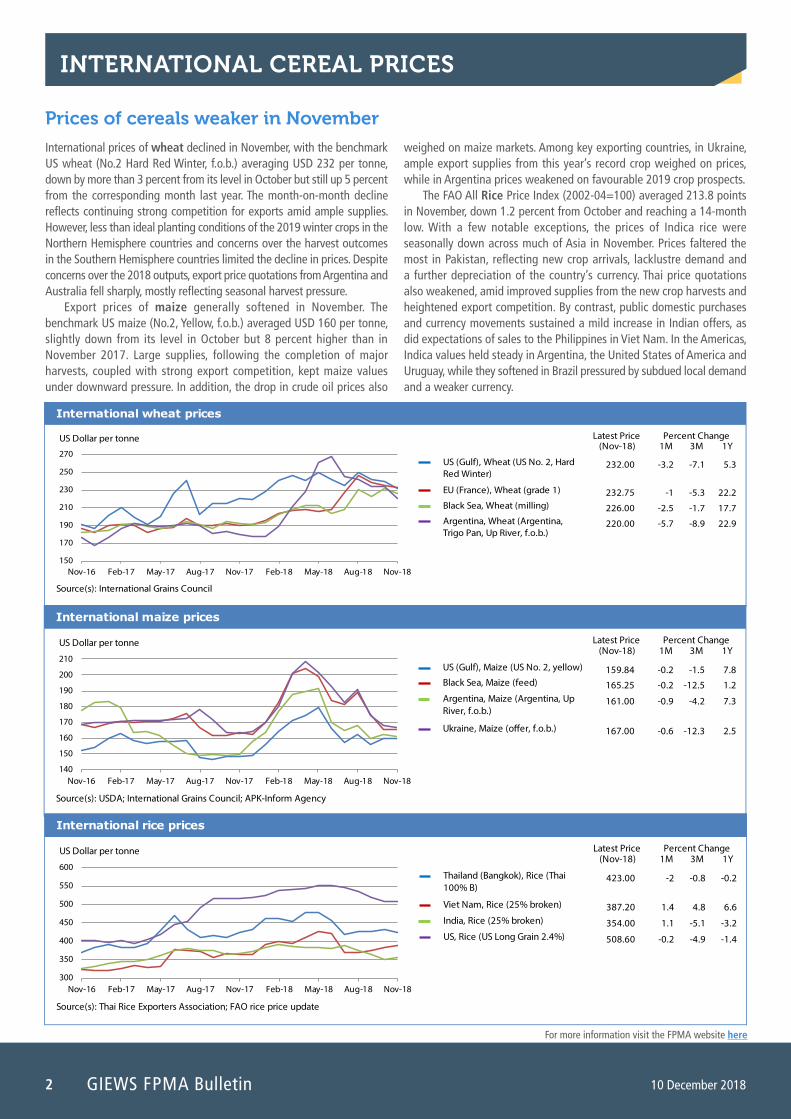
International prices of wheat declined in November, with the benchmark US wheat (No.2 Hard Red Winter, f.o.b.) averaging USD 232 per tonne, down by more than 3 percent from its level in October but still up 5 percent from the corresponding month last year. The month-on-month decline reflects continuing strong competition for exports amid ample supplies. However, less than ideal planting conditions of the 2019 winter crops in the Northern Hemisphere countries and concerns over the harvest outcomes in the Southern Hemisphere countries limited the decline in prices. Despite concerns over the 2018 outputs, export price quotations from Argentina and Australia fell sharply, mostly reflecting seasonal harvest pressure.
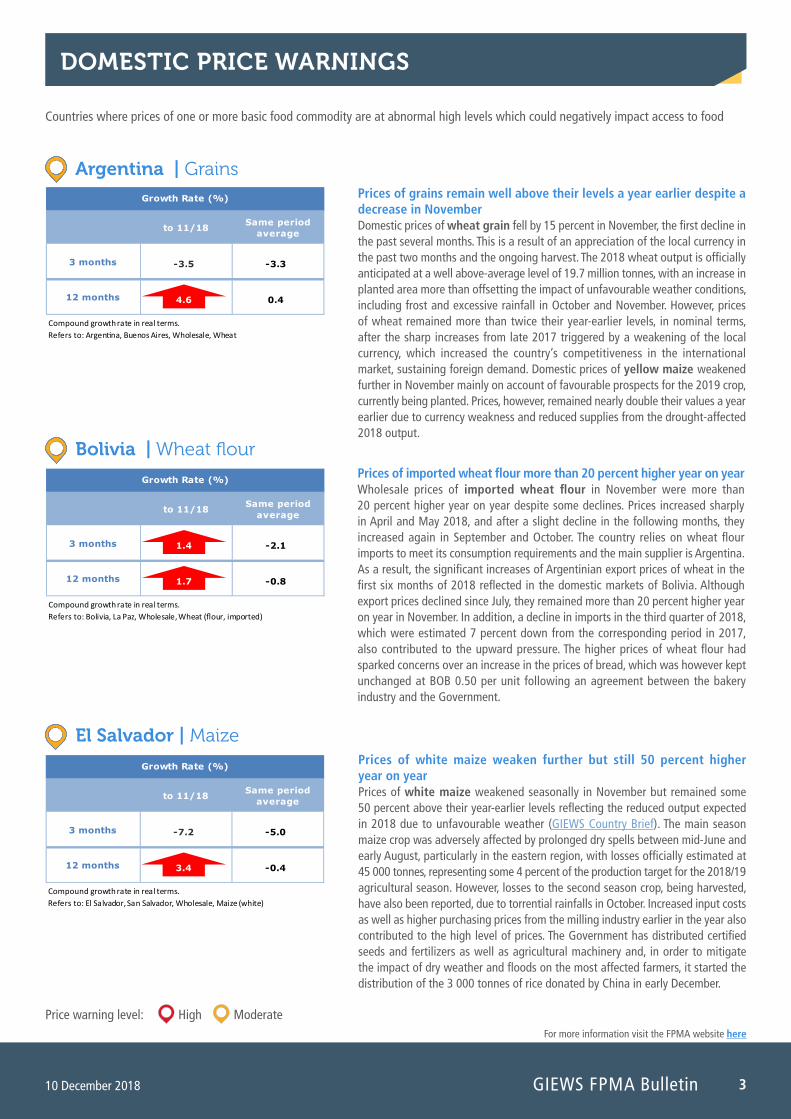
Export prices of maize generally softened in November. The benchmark US maize (No.2, Yellow, f.o.b.) averaged USD 160 per tonne, slightly down from its level in October but 8 percent higher than in November 2017. Large supplies, following the completion of major harvests, coupled with strong export competition, kept maize values under downward pressure. In addition, the drop in crude oil prices also
weighed on maize markets. Among key exporting countries, in Ukraine, ample export supplies from this year’s record crop weighed on prices, while in Argentina prices weakened on favourable 2019 crop prospects.
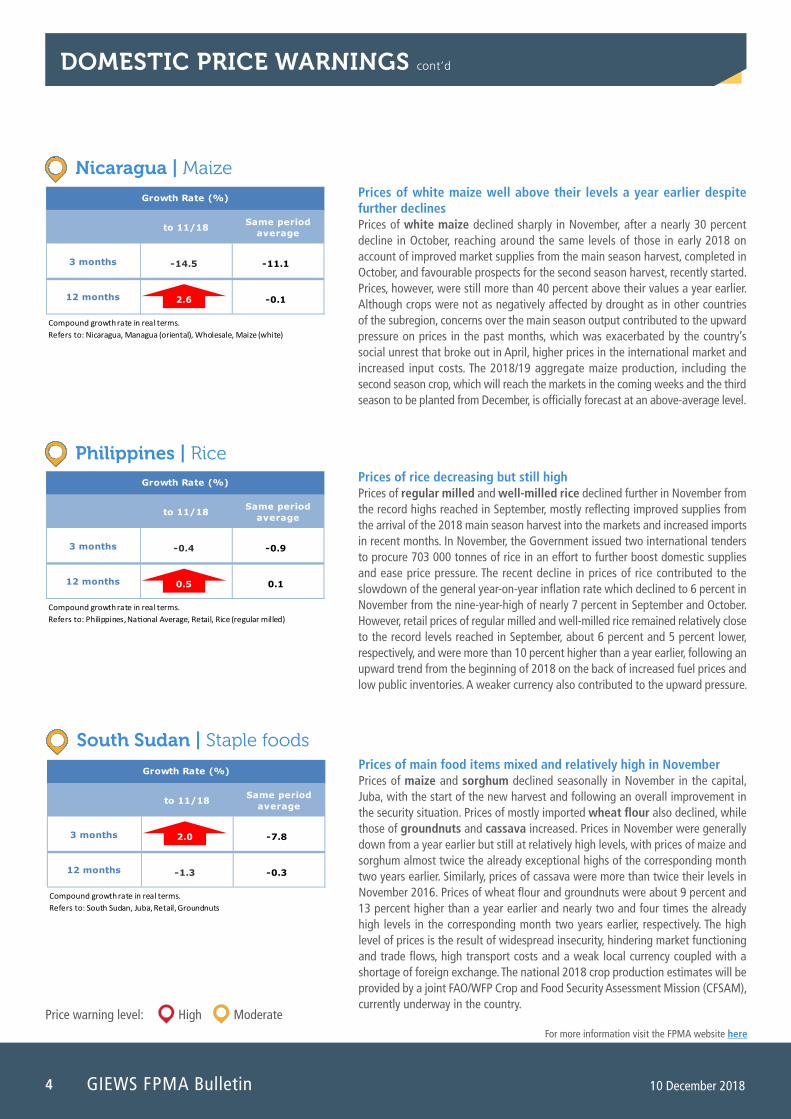
The FAO All Rice Price Index (2002-04=100) averaged 213.8 points in November, down 1.2 percent from October and reaching a 14-month low. With a few notable exceptions, the prices of Indica rice were seasonally down across much of Asia in November. Prices faltered the most in Pakistan, reflecting new crop arrivals, lacklustre demand and a further depreciation of the country’s currency. Thai price quotations also weakened, amid improved supplies from the new crop harvests and heightened export competition. By contrast, public domestic purchases and currency movements sustained a mild increase in Indian offers, as did expectations of sales to the Philippines in Viet Nam. In the Americas, Indica values held steady in Argentina, the United States of America and Uruguay, while they softened in Brazil pressured by subdued local demand and a weaker currency.
Prices of cereals weaker in November
Latest Price(Nov-18) 1M 3M 1Y
International wheat prices
Percent Change
150
170
190
210
230
250
270
Nov-16 Feb-17 May-17 Aug-17 Nov-17 Feb-18 May-18 Aug-18 Nov-18
US (Gulf), Wheat (US No. 2, Hard Red Winter)
EU (France), Wheat (grade 1)
Black Sea, Wheat (milling)
Argentina, Wheat (Argentina, Trigo Pan, Up River, f.o.b.)
US Dollar per tonne
232.00
232.75
226.00
220.00
-3.2
-1
-2.5
-5.7
-7.1
-5.3
-1.7
-8.9
5.3
22.2
17.7
22.9
Source(s): International Grains Council
Latest Price(Nov-18) 1M 3M 1Y
International maize prices
Percent Change
140
150
160
170
180
190
200
210
Nov-16 Feb-17 May-17 Aug-17 Nov-17 Feb-18 May-18 Aug-18 Nov-18
US (Gulf), Maize (US No. 2, yellow)
Black Sea, Maize (feed)
Argentina, Maize (Argentina, Up River, f.o.b.)
Ukraine, Maize (o�er, f.o.b.)
US Dollar per tonne
159.84
165.25
161.00
167.00
-0.2
-0.2
-0.9
-0.6
-1.5
-12.5
-4.2
-12.3
7.8
1.2
7.3
2.5
Source(s): USDA; International Grains Council; APK-Inform Agency
Latest Price(Nov-18) 1M 3M 1Y
International rice prices
Percent Change
300
350
400
450
500
550
600
Nov-16 Feb-17 May-17 Aug-17 Nov-17 Feb-18 May-18 Aug-18 Nov-18
Thailand (Bangkok), Rice (Thai 100% B)
Viet Nam, Rice (25% broken)
India, Rice (25% broken)
US, Rice (US Long Grain 2.4%)
US Dollar per tonne
423.00
387.20
354.00
508.60
-2
1.4
1.1
-0.2
-0.8
4.8
-5.1
-4.9
-0.2
6.6
-3.2
-1.4
Source(s): Thai Rice Exporters Association; FAO rice price update
Price warning level: High Moderate
3
For more information visit the FPMA website here
10 December 2018 GIEWS FPMA Bulletin
DOMESTIC PRICE WARNINGS
Prices of grains remain well above their levels a year earlier despite a decrease in November Domestic prices of wheat grain fell by 15 percent in November, the first decline in the past several months. This is a result of an appreciation of the local currency in the past two months and the ongoing harvest. The 2018 wheat output is officially anticipated at a well above-average level of 19.7 million tonnes, with an increase in planted area more than offsetting the impact of unfavourable weather conditions, including frost and excessive rainfall in October and November. However, prices of wheat remained more than twice their year-earlier levels, in nominal terms, after the sharp increases from late 2017 triggered by a weakening of the local currency, which increased the country’s competitiveness in the international market, sustaining foreign demand. Domestic prices of yellow maize weakened further in November mainly on account of favourable prospects for the 2019 crop, currently being planted. Prices, however, remained nearly double their values a year earlier due to currency weakness and reduced supplies from the drought-affected 2018 output.
Argentina | Grains
Countries where prices of one or more basic food commodity are at abnormal high levels which could negatively impact access to food
El Salvador | Maize
Bolivia | Wheat flour
Prices of white maize weaken further but still 50 percent higher year on year Prices of white maize weakened seasonally in November but remained some 50 percent above their year-earlier levels reflecting the reduced output expected in 2018 due to unfavourable weather (GIEWS Country Brief). The main season maize crop was adversely affected by prolonged dry spells between mid-June and early August, particularly in the eastern region, with losses officially estimated at 45 000 tonnes, representing some 4 percent of the production target for the 2018/19 agricultural season. However, losses to the second season crop, being harvested, have also been reported, due to torrential rainfalls in October. Increased input costs as well as higher purchasing prices from the milling industry earlier in the year also contributed to the high level of prices. The Government has distributed certified seeds and fertilizers as well as agricultural machinery and, in order to mitigate the impact of dry weather and floods on the most affected farmers, it started the distribution of the 3 000 tonnes of rice donated by China in early December.
Prices of imported wheat flour more than 20 percent higher year on year Wholesale prices of imported wheat flour in November were more than 20 percent higher year on year despite some declines. Prices increased sharply in April and May 2018, and after a slight decline in the following months, they increased again in September and October. The country relies on wheat flour imports to meet its consumption requirements and the main supplier is Argentina. As a result, the significant increases of Argentinian export prices of wheat in the first six months of 2018 reflected in the domestic markets of Bolivia. Although export prices declined since July, they remained more than 20 percent higher year on year in November. In addition, a decline in imports in the third quarter of 2018, which were estimated 7 percent down from the corresponding period in 2017, also contributed to the upward pressure. The higher prices of wheat flour had sparked concerns over an increase in the prices of bread, which was however kept unchanged at BOB 0.50 per unit following an agreement between the bakery industry and the Government.
to 11/18 Same periodaverage
3 months
12 months
Growth Rate (%)
4.6
-3.5
Compound growth rate in real terms.Refers to: Argentina, Buenos Aires, Wholesale, Wheat
-3.3
0.4
to 11/18 Same periodaverage
3 months
12 months
Growth Rate (%)
1.7
1.4
Compound growth rate in real terms.Refers to: Bolivia, La Paz, Wholesale, Wheat (flour, imported)
-2.1
-0.8
to 11/18 Same periodaverage
3 months
12 months
Growth Rate (%)
3.4
-7.2
Compound growth rate in real terms.Refers to: El Salvador, San Salvador, Wholesale, Maize (white)
-5.0
-0.4
Price warning level: High Moderate
4 10 December 2018
For more information visit the FPMA website here
GIEWS FPMA Bulletin
DOMESTIC PRICE WARNINGS cont’d
Nicaragua | Maize Prices of white maize well above their levels a year earlier despite further declines Prices of white maize declined sharply in November, after a nearly 30 percent decline in October, reaching around the same levels of those in early 2018 on account of improved market supplies from the main season harvest, completed in October, and favourable prospects for the second season harvest, recently started. Prices, however, were still more than 40 percent above their values a year earlier. Although crops were not as negatively affected by drought as in other countries of the subregion, concerns over the main season output contributed to the upward pressure on prices in the past months, which was exacerbated by the country’s social unrest that broke out in April, higher prices in the international market and increased input costs. The 2018/19 aggregate maize production, including the second season crop, which will reach the markets in the coming weeks and the third season to be planted from December, is officially forecast at an above-average level.
Philippines | RicePrices of rice decreasing but still high Prices of regular milled and well-milled rice declined further in November from the record highs reached in September, mostly reflecting improved supplies from the arrival of the 2018 main season harvest into the markets and increased imports in recent months. In November, the Government issued two international tenders to procure 703 000 tonnes of rice in an effort to further boost domestic supplies and ease price pressure. The recent decline in prices of rice contributed to the slowdown of the general year-on-year inflation rate which declined to 6 percent in November from the nine-year-high of nearly 7 percent in September and October. However, retail prices of regular milled and well-milled rice remained relatively close to the record levels reached in September, about 6 percent and 5 percent lower, respectively, and were more than 10 percent higher than a year earlier, following an upward trend from the beginning of 2018 on the back of increased fuel prices and low public inventories. A weaker currency also contributed to the upward pressure.
to 11/18 Same periodaverage
3 months
12 months
Growth Rate (%)
2.6
-14.5
Compound growth rate in real terms.Refers to: Nicaragua, Managua (oriental), Wholesale, Maize (white)
-11.1
-0.1
to 11/18 Same periodaverage
3 months
12 months
Growth Rate (%)
0.5
-0.4
Compound growth rate in real terms.Refers to: Philippines, National Average, Retail, Rice (regular milled)
-0.9
0.1
South Sudan | Staple foodsPrices of main food items mixed and relatively high in November Prices of maize and sorghum declined seasonally in November in the capital, Juba, with the start of the new harvest and following an overall improvement in the security situation. Prices of mostly imported wheat flour also declined, while those of groundnuts and cassava increased. Prices in November were generally down from a year earlier but still at relatively high levels, with prices of maize and sorghum almost twice the already exceptional highs of the corresponding month two years earlier. Similarly, prices of cassava were more than twice their levels in November 2016. Prices of wheat flour and groundnuts were about 9 percent and 13 percent higher than a year earlier and nearly two and four times the already high levels in the corresponding month two years earlier, respectively. The high level of prices is the result of widespread insecurity, hindering market functioning and trade flows, high transport costs and a weak local currency coupled with a shortage of foreign exchange. The national 2018 crop production estimates will be provided by a joint FAO/WFP Crop and Food Security Assessment Mission (CFSAM), currently underway in the country.
to 11/18 Same periodaverage
3 months
12 months
Growth Rate (%)
-1.3
2.0
Compound growth rate in real terms.Refers to: South Sudan, Juba, Retail, Groundnuts
-7.8
-0.3
5
For more information visit the FPMA website here
10 December 2018 GIEWS FPMA Bulletin
DOMESTIC PRICE WARNINGS cont’d
Price warning level: High Moderate
Sudan | Staple foods Prices of staple foods rise again to record or near-record highs Prices of locally grown sorghum and millet spiked in November and reached record to near-record highs due to a further sharp devaluation of the local currency. Similarly, prices of wheat, mostly imported, increased to record highs in the capital, Khartoum. The Government devaluated the local currency from SDG 17.96 per US dollar to SDG 47.5 per US dollar in early October in an effort to tackle the shortage of foreign exchange. This is part of a number of measures the Government is implementing to address the ongoing economic crisis, which include the removal of import restrictions on 19 selected food items and the introduction of austerity measures such as the elimination of all customs tax exemptions and a reduction in government expenses. In an attempt to curb the recent surge in prices, the Government also announced the reintroduction of the wheat subsidies, which were removed in the 2018 budget. The surge in prices in November comes in spite of the ongoing 2018/19 harvest, which had triggered some declines in September and October. Although crops benefited from favourable precipitation, high prices of agricultural inputs and shortages of fuel and cash have affected farming activities. An ongoing nationwide government-led crop assessment, supported by FAO, will provide detailed production estimates in early 2019.
to 11/18 Same periodaverage
3 months
12 months
Growth Rate (%)
2.8
5.1
Compound growth rate in real terms.Refers to: Sudan, Kadugli, Wholesale, Millet
-0.2
-0.2
Zambia | Maize Prices of maize products on the increase Prices of maize meal products increased in November and were nearly 30 percent above their year-earlier values following sustained increases since August. The seasonal month-on-month gains were amplified by the impact of a sharply reduced 2018 maize output, 23 percent below the five-year average, due to rainfall deficits at the key stage for the crop’s development earlier in the year. This is likely to result in a significant drawdown in national inventories to meet consumption needs. In response to the tighter supply situation, the Government imposed temporary export restrictions to shore-up national availabilities (FPMA Food Policies). On top of the supply pressure, an abrupt depreciation of the local currency in recent months added further inflationary pressure that underpinned prices.
to 11/18 Same periodaverage
3 months
12 months
Growth Rate (%)
1.6
4.9
Compound growth rate in real terms.Refers to: Zambia, National Average, Retail, White roller maize meal
0.9
-0.5
Zimbabwe | Cereals Prices of cereals surged to record levels in October Prices of rice and wheat products increased sharply in October underpinned by foreign exchange shortages that acutely constrained the capacity to import adequate quantities of grains and by a drop in the value of the local currency - bond notes were introduced two years ago to alleviate liquidity constraints - against the US dollar. A new tax on electronic money transactions, widely used in the country, added upward pressure on prices. The reduced access to external supplies of wheat, given the country’s position as a net importer, reportedly curtailed milling operations, which further exerted upward pressure on prices. As of October, prices of wheat flour were double their year-earlier values, following month-on-month increases by up to 90 percent. Similarly, prices of rice rose by comparable rates, but year-on-year variations were not as significant. The recent inflationary pressures amplified seasonal price increases of the main food staple, maize meal, however, prices remained broadly unchanged relative to the previous year on account of adequate domestic supplies. In an effort to curb food prices, the Government responded by suspending import restrictions on basic commodities in late October (FPMA Food Policies).
to 10/18 Same periodaverage
3 months
12 months
Growth Rate (%)
4.7
20.5
Compound growth rate in real terms.Refers to: Zimbabwe, Mash central, Retail, Wheat (flour)
0.0
0.0

GIEWS FPMA Bulletin6 10 December 2018
For more information visit the FPMA website here
WEST AFRICA
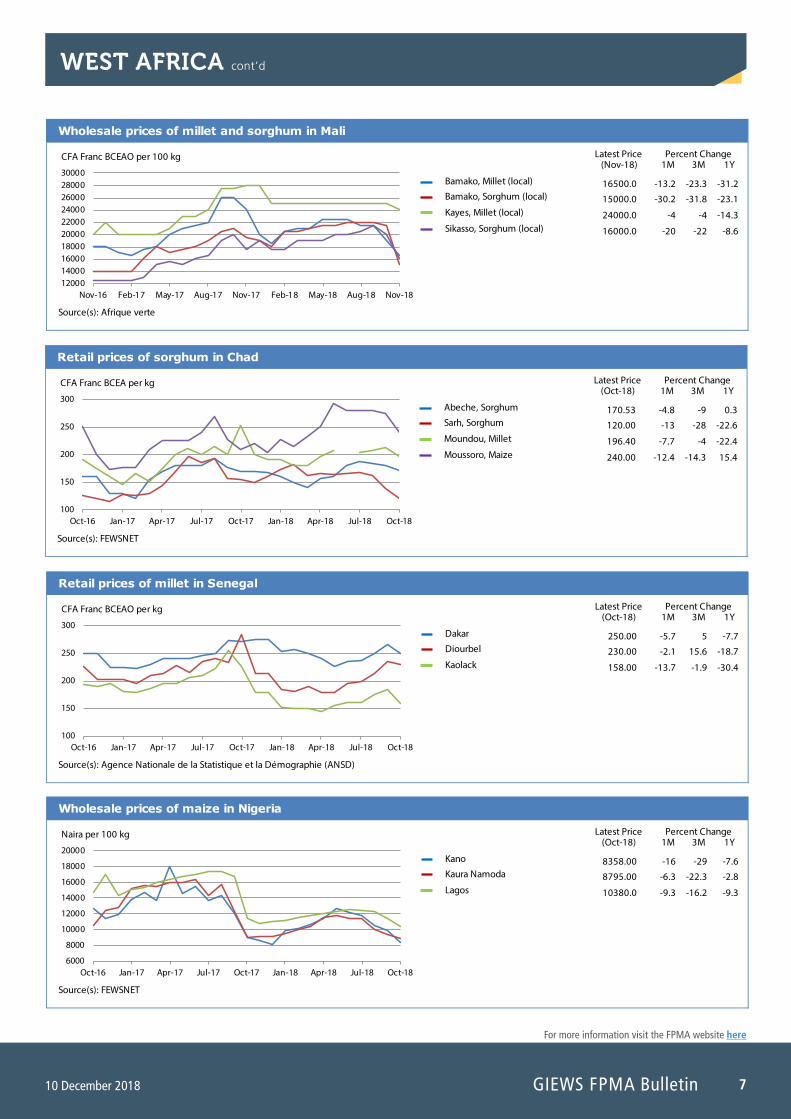
Prices of cereals continue to generally decline in line with seasonal trends In Sahelian countries, prices of coarse grains continued to decline in November reflecting improved supplies from this year’s record harvests, imports and farmers’ destocking. Prices were generally lower than a year earlier with some exceptions, particularly in the northeast of Nigeria and the Lake Chad area, where civil insecurity and armed conflict continued to disrupt market activities. In Burkina Faso, seasonal harvest pressure on prices of millet, sorghum and maize was further compounded by sales at subsidized prices. In Niger, prices of sorghum declined seasonally in November, with imports also contributing to the downward pressure. By contrast, prices of millet generally strengthened, supported by strong domestic demand and pending the bulk of the harvest towards the end of the month. Despite the recent increases, prices remained well below their year-earlier values. In the Diffa Region, however, market supplies remained disrupted in southern parts due to insecurity. In Mali, prices of coarse grains declined significantly in November to levels well below those a year earlier as a result of this year’s bumper harvests and farmers’ destocking. However, in southern areas affected by floods and in northern and central parts where civil insecurity persists, food access was reported to be hampered. In Chad, prices of coarse grains declined in most markets in October and were lower than a year earlier, reflecting
improved market availabilities from this year’s good harvest. However, insecurity in some areas continued to disrupt market activities and access to food. In Senegal, prices of millet generally declined in October with the good 2018 harvest and were significantly down from a year earlier. Prices of imported rice, the most consumed cereal in the country, remained relatively stable, while those of husked rice, locally produced and of higher quality, recorded some increases in October, with the new harvest to begin in November. In coastal countries along the Gulf of Guinea, in Ghana, prices of maize remained stable or declined in November as a result of improved availabilities from the new harvest, while prices of mostly imported rice remained relatively stable. In Togo, prices of maize, the country’s main staple food, stabilized or declined in October following seasonal trends and were above or around their year-earlier levels. Similarly, in Benin, prices of maize declined significantly in most markets in October with the new harvest and were lower than a year earlier. In Nigeria, prices of cereals, maize in particular, declined further in October with the progress of the main 2018 harvest. Prices were well below their levels a year earlier but still relatively high, particularly in the northeast, due to persisting civil conflict, which also triggered some localized food price increases in October.
Latest Price(Nov-18) 1M 3M 1Y
Wholesale prices of millet and sorghum in Burkina Faso
Percent Change
12000140001600018000200002200024000260002800030000
Nov-16 Feb-17 May-17 Aug-17 Nov-17 Feb-18 May-18 Aug-18 Nov-18
Ouagadougou, Millet (local)
Ouagadougou, Sorghum (local)
Dori, Millet (local)
Fada N'gourma, Sorghum (local)
CFA Franc BCEAO per 100 kg
20000.0
15000.0
23500.0
19000.0
-7
-11.8
-6
0
-13
-25
-13
-9.5
-14.9
-9.1
-13
5.6
Source(s): Afrique verte
Latest Price(Nov-18) 1M 3M 1Y
Wholesale prices of sorghum in Niger
Percent Change
15000170001900021000230002500027000290003100033000
Nov-16 Feb-17 May-17 Aug-17 Nov-17 Feb-18 May-18 Aug-18 Nov-18
Agadez
Tillaberi
Zinder
Dosso
CFA Franc BCEAO per 100 kg
23000.0
21000.0
19000.0
18000.0
-2.1
-4.5
-5
-14.3
-8
-4.5
-5
-14.3
-4.2
5
5.6
-10
Source(s): Afrique verte
7
For more information visit the FPMA website here
10 December 2018 GIEWS FPMA Bulletin
Latest Price(Nov-18) 1M 3M 1Y
Wholesale prices of millet and sorghum in Mali
Percent Change
12000140001600018000200002200024000260002800030000
Nov-16 Feb-17 May-17 Aug-17 Nov-17 Feb-18 May-18 Aug-18 Nov-18
Bamako, Millet (local)
Bamako, Sorghum (local)
Kayes, Millet (local)
Sikasso, Sorghum (local)
CFA Franc BCEAO per 100 kg
16500.0
15000.0
24000.0
16000.0
-13.2
-30.2
-4
-20
-23.3
-31.8
-4
-22
-31.2
-23.1
-14.3
-8.6
Source(s): Afrique verte
Latest Price(Oct-18) 1M 3M 1Y
Retail prices of sorghum in Chad
Percent Change
100
150
200
250
300
Oct-16 Jan-17 Apr-17 Jul-17 Oct-17 Jan-18 Apr-18 Jul-18 Oct-18
Abeche, Sorghum
Sarh, Sorghum
Moundou, Millet
Moussoro, Maize
CFA Franc BCEA per kg
170.53
120.00
196.40
240.00
-4.8
-13
-7.7
-12.4
-9
-28
-4
-14.3
0.3
-22.6
-22.4
15.4
Source(s): FEWSNET
Latest Price(Oct-18) 1M 3M 1Y
Retail prices of millet in Senegal
Percent Change
100
150
200
250
300
Oct-16 Jan-17 Apr-17 Jul-17 Oct-17 Jan-18 Apr-18 Jul-18 Oct-18
Dakar
Diourbel
Kaolack
CFA Franc BCEAO per kg
250.00
230.00
158.00
-5.7
-2.1
-13.7
5
15.6
-1.9
-7.7
-18.7
-30.4
Source(s): Agence Nationale de la Statistique et la Démographie (ANSD)
Latest Price(Oct-18) 1M 3M 1Y
Wholesale prices of maize in Nigeria
Percent Change
6000
8000
10000
12000
14000
16000
18000
20000
Oct-16 Jan-17 Apr-17 Jul-17 Oct-17 Jan-18 Apr-18 Jul-18 Oct-18
Kano
Kaura Namoda
Lagos
Naira per 100 kg
8358.00
8795.00
10380.0
-16
-6.3
-9.3
-29
-22.3
-16.2
-7.6
-2.8
-9.3
Source(s): FEWSNET
WEST AFRICA cont’d
GIEWS FPMA Bulletin8 10 December 2018
For more information visit the FPMA website here
SOUTHERN AFRICA
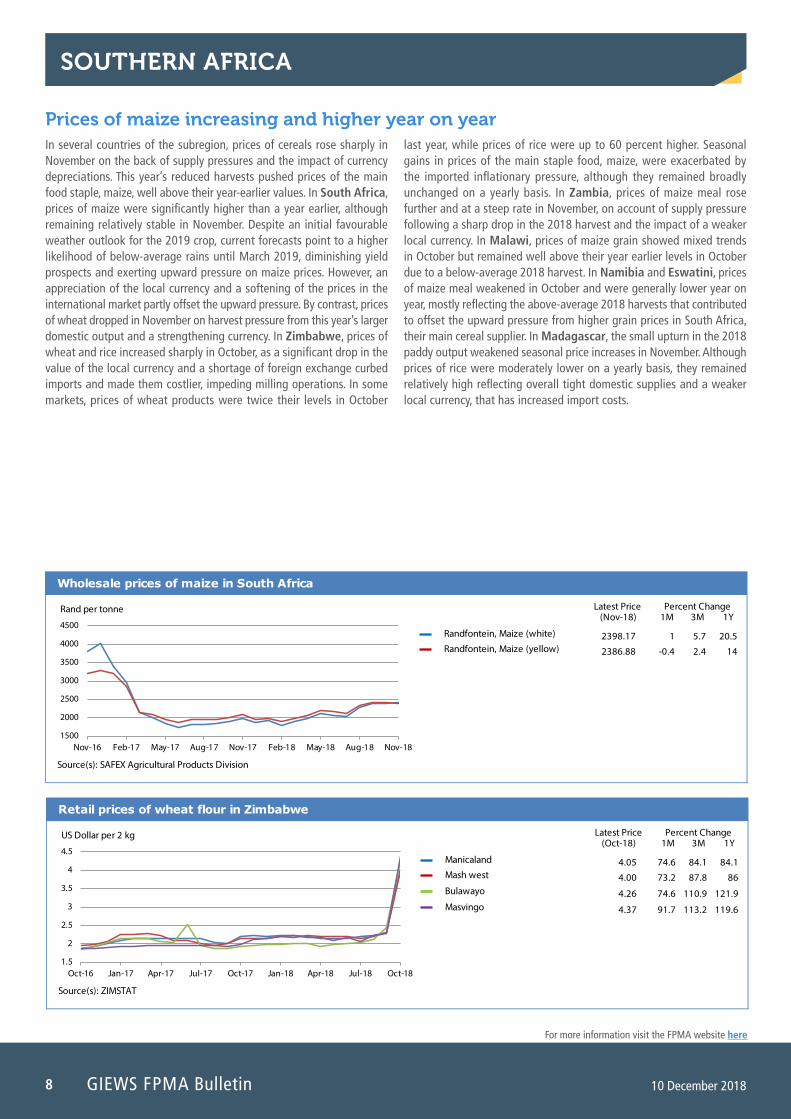
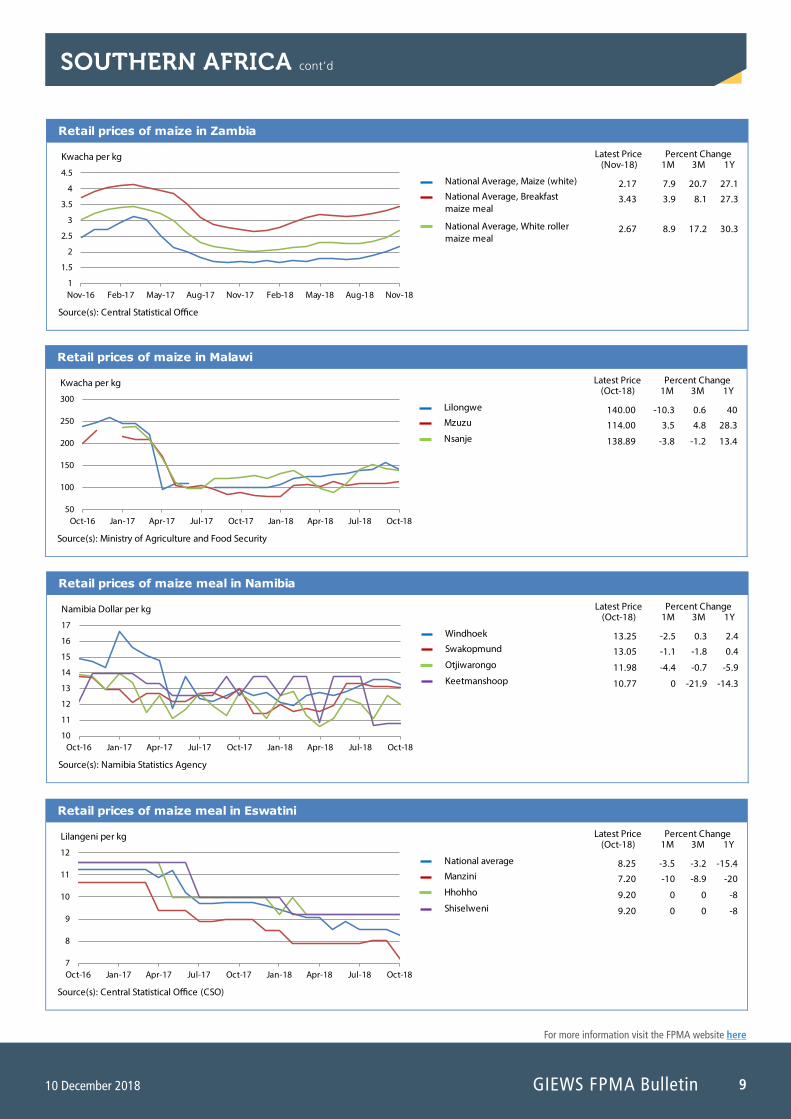
Prices of maize increasing and higher year on year In several countries of the subregion, prices of cereals rose sharply in November on the back of supply pressures and the impact of currency depreciations. This year’s reduced harvests pushed prices of the main food staple, maize, well above their year-earlier values. In South Africa, prices of maize were significantly higher than a year earlier, although remaining relatively stable in November. Despite an initial favourable weather outlook for the 2019 crop, current forecasts point to a higher likelihood of below-average rains until March 2019, diminishing yield prospects and exerting upward pressure on maize prices. However, an appreciation of the local currency and a softening of the prices in the international market partly offset the upward pressure. By contrast, prices of wheat dropped in November on harvest pressure from this year’s larger domestic output and a strengthening currency. In Zimbabwe, prices of wheat and rice increased sharply in October, as a significant drop in the value of the local currency and a shortage of foreign exchange curbed imports and made them costlier, impeding milling operations. In some markets, prices of wheat products were twice their levels in October
last year, while prices of rice were up to 60 percent higher. Seasonal gains in prices of the main staple food, maize, were exacerbated by the imported inflationary pressure, although they remained broadly unchanged on a yearly basis. In Zambia, prices of maize meal rose further and at a steep rate in November, on account of supply pressure following a sharp drop in the 2018 harvest and the impact of a weaker local currency. In Malawi, prices of maize grain showed mixed trends in October but remained well above their year earlier levels in October due to a below-average 2018 harvest. In Namibia and Eswatini, prices of maize meal weakened in October and were generally lower year on year, mostly reflecting the above-average 2018 harvests that contributed to offset the upward pressure from higher grain prices in South Africa, their main cereal supplier. In Madagascar, the small upturn in the 2018 paddy output weakened seasonal price increases in November. Although prices of rice were moderately lower on a yearly basis, they remained relatively high reflecting overall tight domestic supplies and a weaker local currency, that has increased import costs.
Latest Price(Nov-18) 1M 3M 1Y
Wholesale prices of maize in South Africa
Percent Change
1500
2000
2500
3000
3500
4000
4500
Nov-16 Feb-17 May-17 Aug-17 Nov-17 Feb-18 May-18 Aug-18 Nov-18
Randfontein, Maize (white)
Randfontein, Maize (yellow)
Rand per tonne
2398.17
2386.88
1
-0.4
5.7
2.4
20.5
14
Source(s): SAFEX Agricultural Products Division
Latest Price(Oct-18) 1M 3M 1Y
Retail prices of wheat flour in Zimbabwe
Percent Change
1.5
2
2.5
3
3.5
4
4.5
Oct-16 Jan-17 Apr-17 Jul-17 Oct-17 Jan-18 Apr-18 Jul-18 Oct-18
Manicaland
Mash west
Bulawayo
Masvingo
US Dollar per 2 kg
4.05
4.00
4.26
4.37
74.6
73.2
74.6
91.7
84.1
87.8
110.9
113.2
84.1
86
121.9
119.6
Source(s): ZIMSTAT
9
For more information visit the FPMA website here
10 December 2018 GIEWS FPMA Bulletin
Latest Price(Nov-18) 1M 3M 1Y
Retail prices of maize in Zambia
Percent Change
1
1.5
2
2.5
3
3.5
4
4.5
Nov-16 Feb-17 May-17 Aug-17 Nov-17 Feb-18 May-18 Aug-18 Nov-18
National Average, Maize (white)
National Average, Breakfast maize meal
National Average, White roller maize meal
Kwacha per kg
2.17
3.43
2.67
7.9
3.9
8.9
20.7
8.1
17.2
27.1
27.3
30.3
Source(s): Central Statistical O�ce
Latest Price(Oct-18) 1M 3M 1Y
Retail prices of maize in Malawi
Percent Change
50
100
150
200
250
300
Oct-16 Jan-17 Apr-17 Jul-17 Oct-17 Jan-18 Apr-18 Jul-18 Oct-18
Lilongwe
Mzuzu
Nsanje
Kwacha per kg
140.00
114.00
138.89
-10.3
3.5
-3.8
0.6
4.8
-1.2
40
28.3
13.4
Source(s): Ministry of Agriculture and Food Security
SOUTHERN AFRICA cont’d
Latest Price(Oct-18) 1M 3M 1Y
Retail prices of maize meal in Namibia
Percent Change
10
11
12
13
14
15
16
17
Oct-16 Jan-17 Apr-17 Jul-17 Oct-17 Jan-18 Apr-18 Jul-18 Oct-18
Windhoek
Swakopmund
Otjiwarongo
Keetmanshoop
Namibia Dollar per kg
13.25
13.05
11.98
10.77
-2.5
-1.1
-4.4
0
0.3
-1.8
-0.7
-21.9
2.4
0.4
-5.9
-14.3
Source(s): Namibia Statistics Agency
Latest Price(Oct-18) 1M 3M 1Y
Retail prices of maize meal in Eswatini
Percent Change
7
8
9
10
11
12
Oct-16 Jan-17 Apr-17 Jul-17 Oct-17 Jan-18 Apr-18 Jul-18 Oct-18
National average
Manzini
Hhohho
Shiselweni
Lilangeni per kg
8.25
7.20
9.20
9.20
-3.5
-10
0
0
-3.2
-8.9
0
0
-15.4
-20
-8
-8
Source(s): Central Statistical O�ce (CSO)
GIEWS FPMA Bulletin10 10 December 2018
For more information visit the FPMA website here
EAST AFRICA
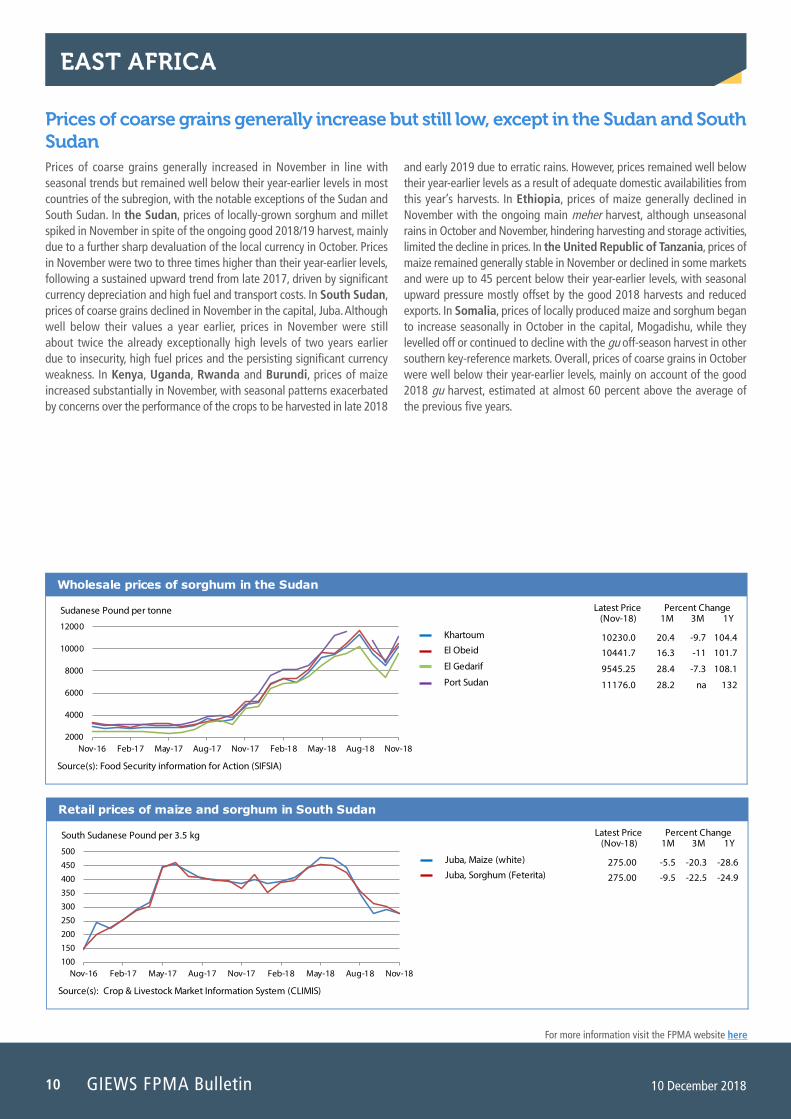
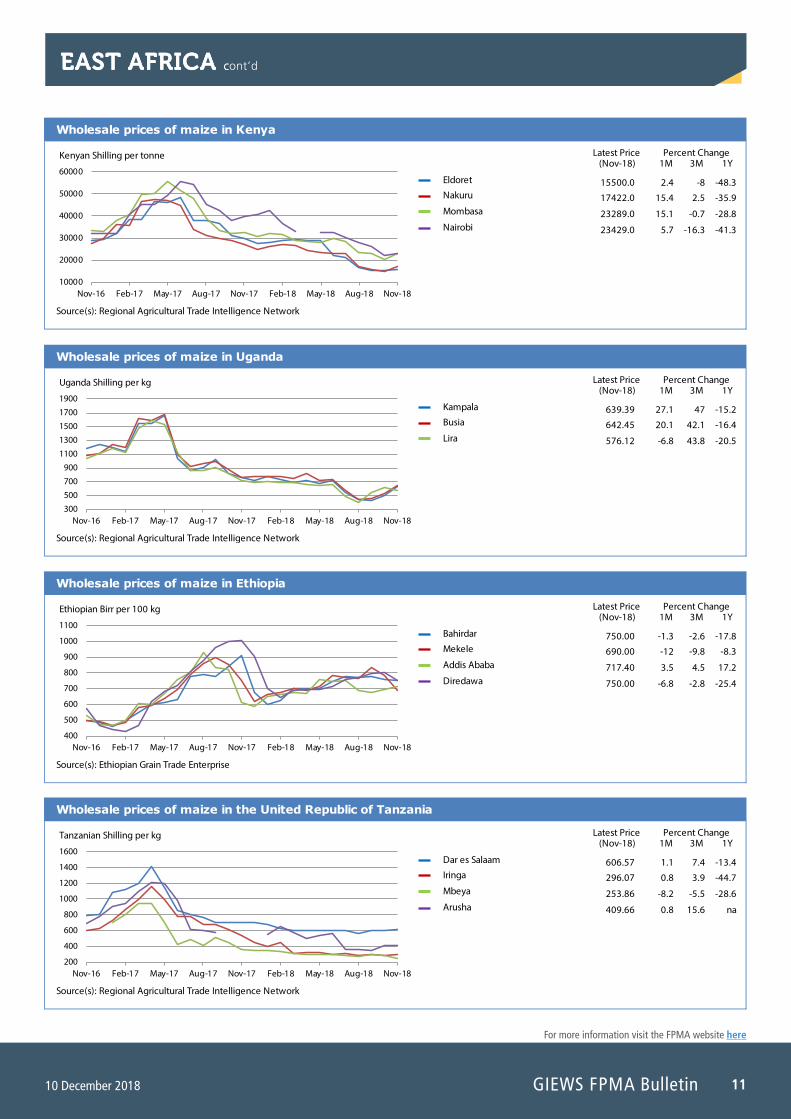
Prices of coarse grains generally increase but still low, except in the Sudan and South Sudan Prices of coarse grains generally increased in November in line with seasonal trends but remained well below their year-earlier levels in most countries of the subregion, with the notable exceptions of the Sudan and South Sudan. In the Sudan, prices of locally-grown sorghum and millet spiked in November in spite of the ongoing good 2018/19 harvest, mainly due to a further sharp devaluation of the local currency in October. Prices in November were two to three times higher than their year-earlier levels, following a sustained upward trend from late 2017, driven by significant currency depreciation and high fuel and transport costs. In South Sudan, prices of coarse grains declined in November in the capital, Juba. Although well below their values a year earlier, prices in November were still about twice the already exceptionally high levels of two years earlier due to insecurity, high fuel prices and the persisting significant currency weakness. In Kenya, Uganda, Rwanda and Burundi, prices of maize increased substantially in November, with seasonal patterns exacerbated by concerns over the performance of the crops to be harvested in late 2018
and early 2019 due to erratic rains. However, prices remained well below their year-earlier levels as a result of adequate domestic availabilities from this year’s harvests. In Ethiopia, prices of maize generally declined in November with the ongoing main meher harvest, although unseasonal rains in October and November, hindering harvesting and storage activities, limited the decline in prices. In the United Republic of Tanzania, prices of maize remained generally stable in November or declined in some markets and were up to 45 percent below their year-earlier levels, with seasonal upward pressure mostly offset by the good 2018 harvests and reduced exports. In Somalia, prices of locally produced maize and sorghum began to increase seasonally in October in the capital, Mogadishu, while they levelled off or continued to decline with the gu off-season harvest in other southern key-reference markets. Overall, prices of coarse grains in October were well below their year-earlier levels, mainly on account of the good 2018 gu harvest, estimated at almost 60 percent above the average of the previous five years.
Latest Price(Nov-18) 1M 3M 1Y
Retail prices of maize and sorghum in South Sudan
Percent Change
100
150
200
250300
350
400
450
500
Nov-16 Feb-17 May-17 Aug-17 Nov-17 Feb-18 May-18 Aug-18 Nov-18
Juba, Maize (white)
Juba, Sorghum (Feterita)
South Sudanese Pound per 3.5 kg
275.00
275.00
-5.5
-9.5
-20.3
-22.5
-28.6
-24.9
Source(s): Crop & Livestock Market Information System (CLIMIS)
Latest Price(Nov-18) 1M 3M 1Y
Wholesale prices of sorghum in the Sudan
Percent Change
2000
4000
6000
8000
10000
12000
Nov-16 Feb-17 May-17 Aug-17 Nov-17 Feb-18 May-18 Aug-18 Nov-18
Khartoum
El Obeid
El Gedarif
Port Sudan
Sudanese Pound per tonne
10230.0
10441.7
9545.25
11176.0
20.4
16.3
28.4
28.2
-9.7
-11
-7.3
na
104.4
101.7
108.1
132
Source(s): Food Security information for Action (SIFSIA)
11
For more information visit the FPMA website here
10 December 2018 GIEWS FPMA Bulletin
EAST AFRICA cont’dEAST AFRICA c
Latest Price(Nov-18) 1M 3M 1Y
Wholesale prices of maize in Kenya
Percent Change
10000
20000
30000
40000
50000
60000
Nov-16 Feb-17 May-17 Aug-17 Nov-17 Feb-18 May-18 Aug-18 Nov-18
Eldoret
Nakuru
Mombasa
Nairobi
Kenyan Shilling per tonne
15500.0
17422.0
23289.0
23429.0
2.4
15.4
15.1
5.7
-8
2.5
-0.7
-16.3
-48.3
-35.9
-28.8
-41.3
Source(s): Regional Agricultural Trade Intelligence Network
Latest Price(Nov-18) 1M 3M 1Y
Wholesale prices of maize in Uganda
Percent Change
300
500
700
9001100
1300
1500
1700
1900
Nov-16 Feb-17 May-17 Aug-17 Nov-17 Feb-18 May-18 Aug-18 Nov-18
Kampala
Busia
Lira
Uganda Shilling per kg
639.39
642.45
576.12
27.1
20.1
-6.8
47
42.1
43.8
-15.2
-16.4
-20.5
Source(s): Regional Agricultural Trade Intelligence Network
Latest Price(Nov-18) 1M 3M 1Y
Wholesale prices of maize in Ethiopia
Percent Change
400
500
600
700
800
900
1000
1100
Nov-16 Feb-17 May-17 Aug-17 Nov-17 Feb-18 May-18 Aug-18 Nov-18
Bahirdar
Mekele
Addis Ababa
Diredawa
Ethiopian Birr per 100 kg
750.00
690.00
717.40
750.00
-1.3
-12
3.5
-6.8
-2.6
-9.8
4.5
-2.8
-17.8
-8.3
17.2
-25.4
Source(s): Ethiopian Grain Trade Enterprise
Latest Price(Nov-18) 1M 3M 1Y
Wholesale prices of maize in the United Republic of Tanzania
Percent Change
200
400
600
800
1000
1200
1400
1600
Nov-16 Feb-17 May-17 Aug-17 Nov-17 Feb-18 May-18 Aug-18 Nov-18
Dar es Salaam
Iringa
Mbeya
Arusha
Tanzanian Shilling per kg
606.57
296.07
253.86
409.66
1.1
0.8
-8.2
0.8
7.4
3.9
-5.5
15.6
-13.4
-44.7
-28.6
na
Source(s): Regional Agricultural Trade Intelligence Network
GIEWS FPMA Bulletin12 10 December 2018
For more information visit the FPMA website here
EAST ASIA
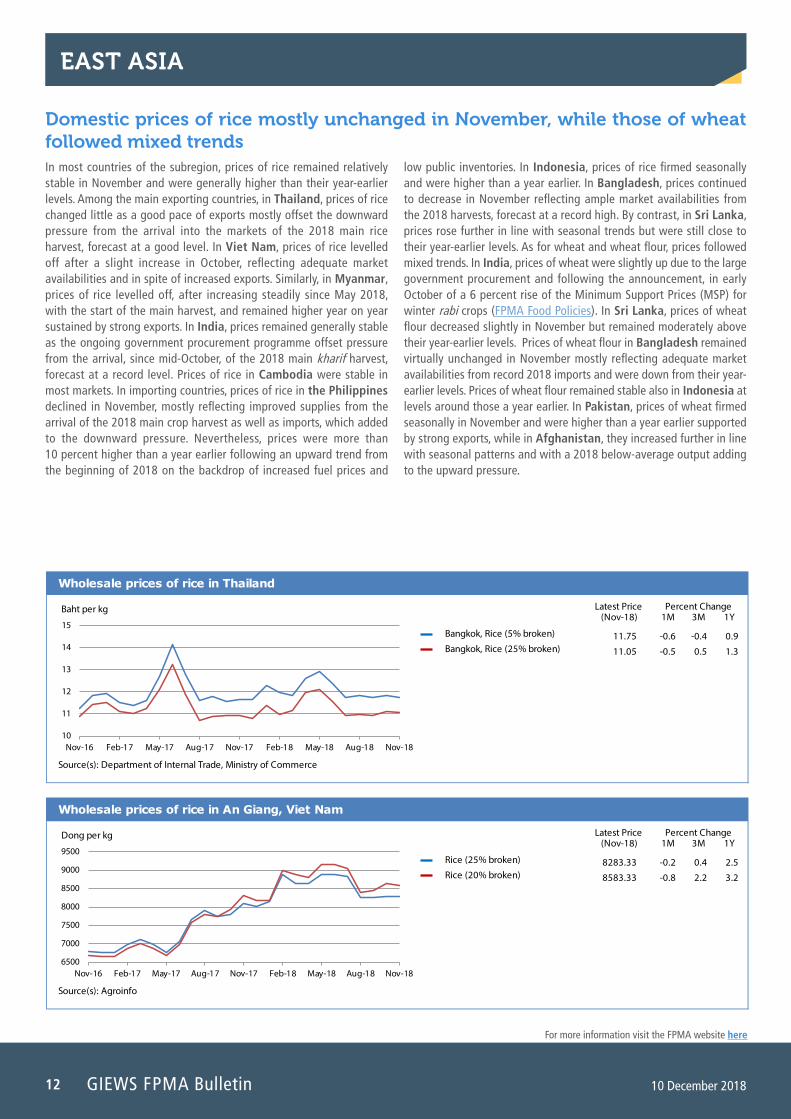
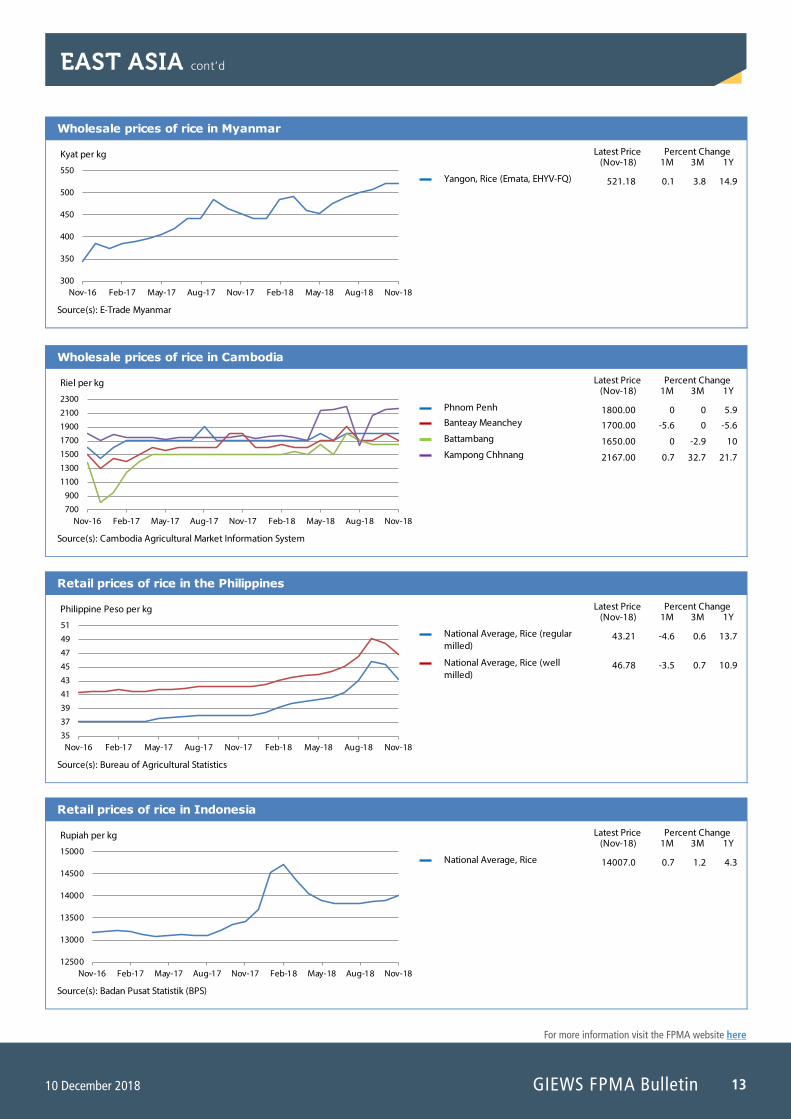
Domestic prices of rice mostly unchanged in November, while those of wheat followed mixed trends In most countries of the subregion, prices of rice remained relatively stable in November and were generally higher than their year-earlier levels. Among the main exporting countries, in Thailand, prices of rice changed little as a good pace of exports mostly offset the downward pressure from the arrival into the markets of the 2018 main rice harvest, forecast at a good level. In Viet Nam, prices of rice levelled off after a slight increase in October, reflecting adequate market availabilities and in spite of increased exports. Similarly, in Myanmar, prices of rice levelled off, after increasing steadily since May 2018, with the start of the main harvest, and remained higher year on year sustained by strong exports. In India, prices remained generally stable as the ongoing government procurement programme offset pressure from the arrival, since mid-October, of the 2018 main kharif harvest, forecast at a record level. Prices of rice in Cambodia were stable in most markets. In importing countries, prices of rice in the Philippines declined in November, mostly reflecting improved supplies from the arrival of the 2018 main crop harvest as well as imports, which added to the downward pressure. Nevertheless, prices were more than 10 percent higher than a year earlier following an upward trend from the beginning of 2018 on the backdrop of increased fuel prices and
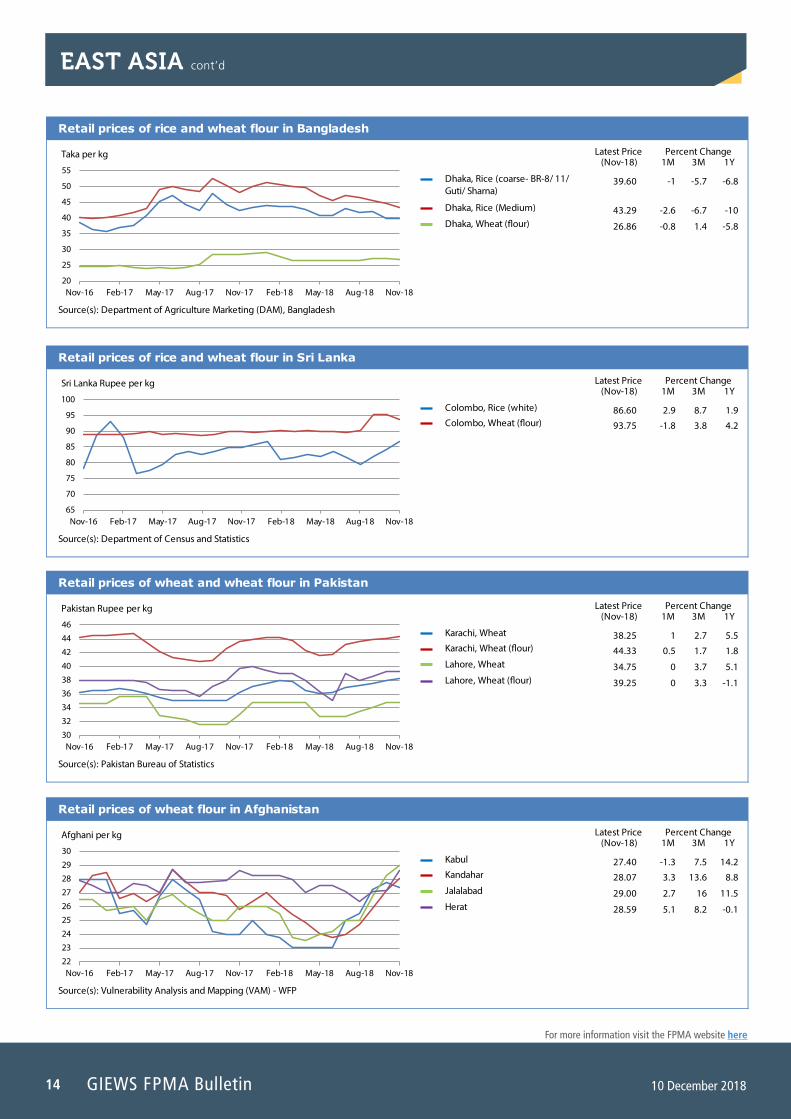
low public inventories. In Indonesia, prices of rice firmed seasonally and were higher than a year earlier. In Bangladesh, prices continued to decrease in November reflecting ample market availabilities from the 2018 harvests, forecast at a record high. By contrast, in Sri Lanka, prices rose further in line with seasonal trends but were still close to their year-earlier levels. As for wheat and wheat flour, prices followed mixed trends. In India, prices of wheat were slightly up due to the large government procurement and following the announcement, in early October of a 6 percent rise of the Minimum Support Prices (MSP) for winter rabi crops (FPMA Food Policies). In Sri Lanka, prices of wheat flour decreased slightly in November but remained moderately above their year-earlier levels. Prices of wheat flour in Bangladesh remained virtually unchanged in November mostly reflecting adequate market availabilities from record 2018 imports and were down from their year-earlier levels. Prices of wheat flour remained stable also in Indonesia at levels around those a year earlier. In Pakistan, prices of wheat firmed seasonally in November and were higher than a year earlier supported by strong exports, while in Afghanistan, they increased further in line with seasonal patterns and with a 2018 below-average output adding to the upward pressure.
Latest Price(Nov-18) 1M 3M 1Y
Wholesale prices of rice in Thailand
Percent Change
10
11
12
13
14
15
Nov-16 Feb-17 May-17 Aug-17 Nov-17 Feb-18 May-18 Aug-18 Nov-18
Bangkok, Rice (5% broken)
Bangkok, Rice (25% broken)
Baht per kg
11.75
11.05
-0.6
-0.5
-0.4
0.5
0.9
1.3
Source(s): Department of Internal Trade, Ministry of Commerce
Latest Price(Nov-18) 1M 3M 1Y
Wholesale prices of rice in An Giang, Viet Nam
Percent Change
6500
7000
7500
8000
8500
9000
9500
Nov-16 Feb-17 May-17 Aug-17 Nov-17 Feb-18 May-18 Aug-18 Nov-18
Rice (25% broken)
Rice (20% broken)
Dong per kg
8283.33
8583.33
-0.2
-0.8
0.4
2.2
2.5
3.2
Source(s): Agroinfo
13
For more information visit the FPMA website here
10 December 2018 GIEWS FPMA Bulletin
EAST ASIA cont’d
Latest Price(Nov-18) 1M 3M 1Y
Wholesale prices of rice in Myanmar
Percent Change
300
350
400
450
500
550
Nov-16 Feb-17 May-17 Aug-17 Nov-17 Feb-18 May-18 Aug-18 Nov-18
Yangon, Rice (Emata, EHYV-FQ)
Kyat per kg
521.18 0.1 3.8 14.9
Source(s): E-Trade Myanmar
Latest Price(Nov-18) 1M 3M 1Y
Wholesale prices of rice in Cambodia
Percent Change
700
900
1100
13001500
1700
1900
2100
2300
Nov-16 Feb-17 May-17 Aug-17 Nov-17 Feb-18 May-18 Aug-18 Nov-18
Phnom Penh
Banteay Meanchey
Battambang
Kampong Chhnang
Riel per kg
1800.00
1700.00
1650.00
2167.00
0
-5.6
0
0.7
0
0
-2.9
32.7
5.9
-5.6
10
21.7
Source(s): Cambodia Agricultural Market Information System
Latest Price(Nov-18) 1M 3M 1Y
Retail prices of rice in the Philippines
Percent Change
35
37
39
4143
45
47
49
51
Nov-16 Feb-17 May-17 Aug-17 Nov-17 Feb-18 May-18 Aug-18 Nov-18
National Average, Rice (regular milled)
National Average, Rice (well milled)
Philippine Peso per kg
43.21
46.78
-4.6
-3.5
0.6
0.7
13.7
10.9
Source(s): Bureau of Agricultural Statistics
Latest Price(Nov-18) 1M 3M 1Y
Retail prices of rice in Indonesia
Percent Change
12500
13000
13500
14000
14500
15000
Nov-16 Feb-17 May-17 Aug-17 Nov-17 Feb-18 May-18 Aug-18 Nov-18
National Average, Rice
Rupiah per kg
14007.0 0.7 1.2 4.3
Source(s): Badan Pusat Statistik (BPS)
GIEWS FPMA Bulletin14 10 December 2018
For more information visit the FPMA website here
Latest Price(Nov-18) 1M 3M 1Y
Retail prices of wheat flour in Afghanistan
Percent Change
22
23
24
2526
27
28
29
30
Nov-16 Feb-17 May-17 Aug-17 Nov-17 Feb-18 May-18 Aug-18 Nov-18
Kabul
Kandahar
Jalalabad
Herat
Afghani per kg
27.40
28.07
29.00
28.59
-1.3
3.3
2.7
5.1
7.5
13.6
16
8.2
14.2
8.8
11.5
-0.1
Source(s): Vulnerability Analysis and Mapping (VAM) - WFP
Latest Price(Nov-18) 1M 3M 1Y
Retail prices of rice and wheat flour in Sri Lanka
Percent Change
65
70
75
80
85
90
95
100
Nov-16 Feb-17 May-17 Aug-17 Nov-17 Feb-18 May-18 Aug-18 Nov-18
Colombo, Rice (white)
Colombo, Wheat (�our)
Sri Lanka Rupee per kg
86.60
93.75
2.9
-1.8
8.7
3.8
1.9
4.2
Source(s): Department of Census and Statistics
Latest Price(Nov-18) 1M 3M 1Y
Retail prices of rice and wheat flour in Bangladesh
Percent Change
20
25
30
35
40
45
50
55
Nov-16 Feb-17 May-17 Aug-17 Nov-17 Feb-18 May-18 Aug-18 Nov-18
Dhaka, Rice (coarse- BR-8/ 11/ Guti/ Sharna)
Dhaka, Rice (Medium)
Dhaka, Wheat (�our)
Taka per kg
39.60
43.29
26.86
-1
-2.6
-0.8
-5.7
-6.7
1.4
-6.8
-10
-5.8
Source(s): Department of Agriculture Marketing (DAM), Bangladesh
EAST ASIA cont’d
Latest Price(Nov-18) 1M 3M 1Y
Retail prices of wheat and wheat flour in Pakistan
Percent Change
30
32
34
3638
40
42
44
46
Nov-16 Feb-17 May-17 Aug-17 Nov-17 Feb-18 May-18 Aug-18 Nov-18
Karachi, Wheat
Karachi, Wheat (�our)
Lahore, Wheat
Lahore, Wheat (�our)
Pakistan Rupee per kg
38.25
44.33
34.75
39.25
1
0.5
0
0
2.7
1.7
3.7
3.3
5.5
1.8
5.1
-1.1
Source(s): Pakistan Bureau of Statistics
15
For more information visit the FPMA website here
10 December 2018 GIEWS FPMA Bulletin
CIS - ASIA AND EUROPE
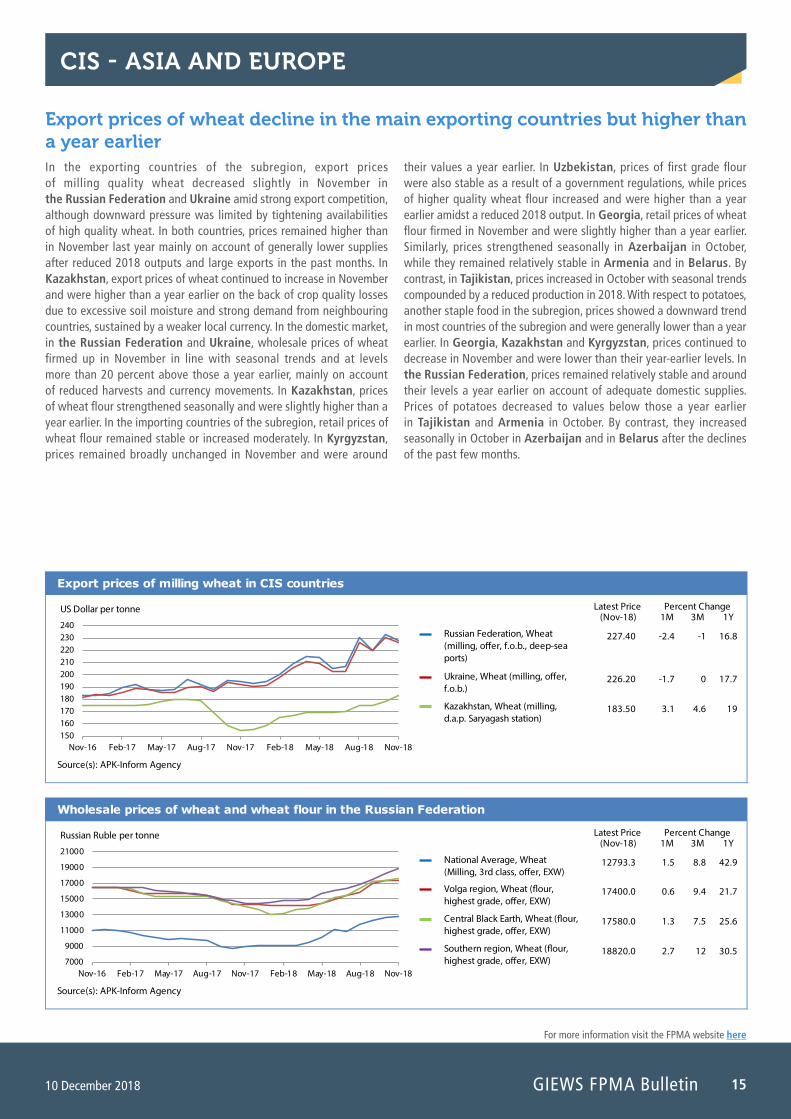
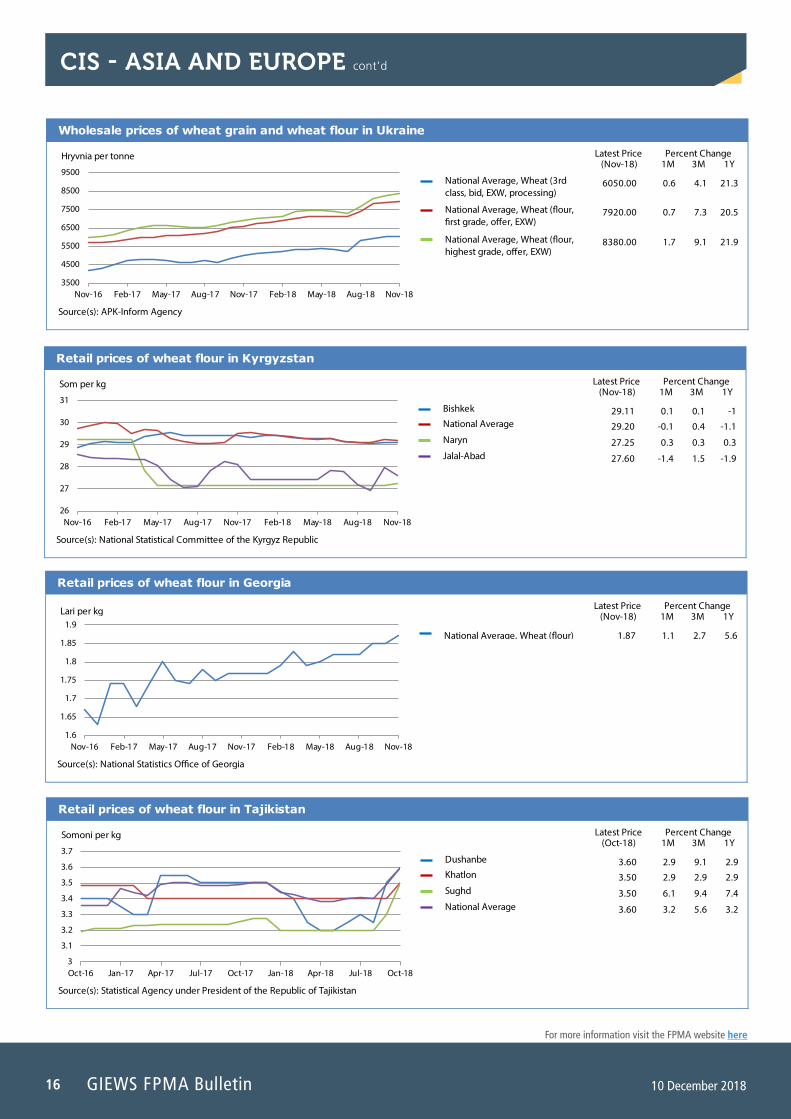
Export prices of wheat decline in the main exporting countries but higher than a year earlier In the exporting countries of the subregion, export prices of milling quality wheat decreased slightly in November in the Russian Federation and Ukraine amid strong export competition, although downward pressure was limited by tightening availabilities of high quality wheat. In both countries, prices remained higher than in November last year mainly on account of generally lower supplies after reduced 2018 outputs and large exports in the past months. In Kazakhstan, export prices of wheat continued to increase in November and were higher than a year earlier on the back of crop quality losses due to excessive soil moisture and strong demand from neighbouring countries, sustained by a weaker local currency. In the domestic market, in the Russian Federation and Ukraine, wholesale prices of wheat firmed up in November in line with seasonal trends and at levels more than 20 percent above those a year earlier, mainly on account of reduced harvests and currency movements. In Kazakhstan, prices of wheat flour strengthened seasonally and were slightly higher than a year earlier. In the importing countries of the subregion, retail prices of wheat flour remained stable or increased moderately. In Kyrgyzstan, prices remained broadly unchanged in November and were around
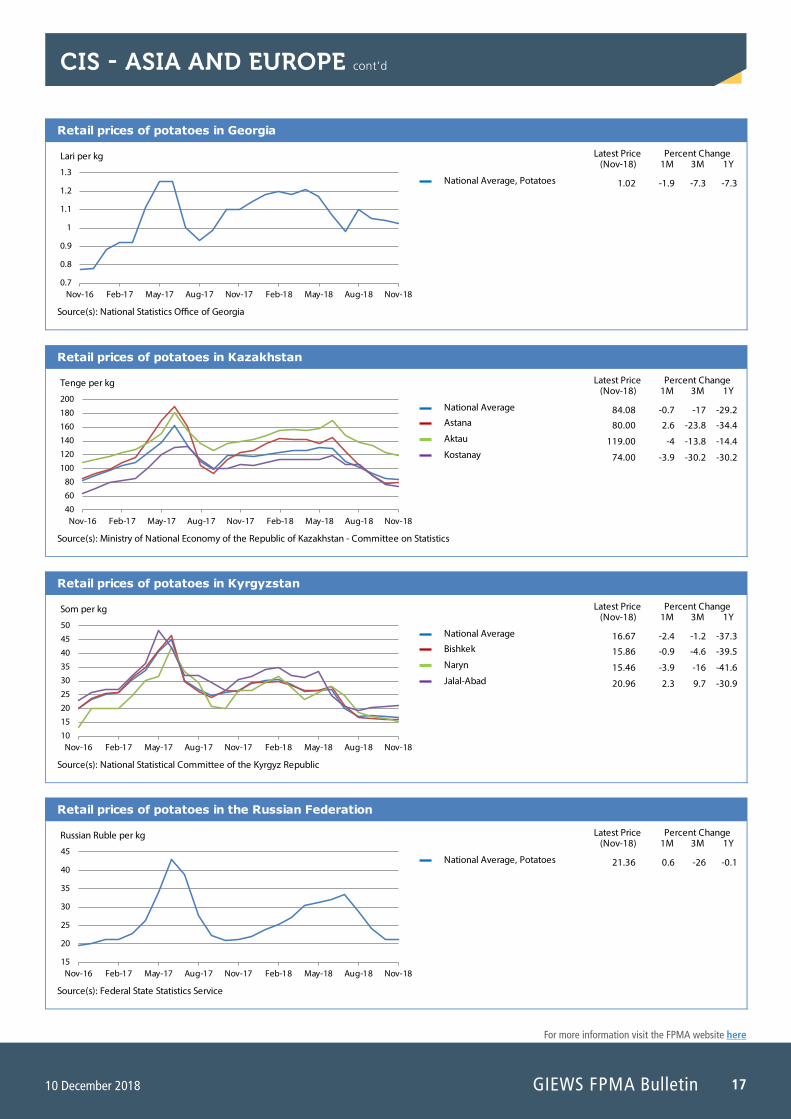
their values a year earlier. In Uzbekistan, prices of first grade flour were also stable as a result of a government regulations, while prices of higher quality wheat flour increased and were higher than a year earlier amidst a reduced 2018 output. In Georgia, retail prices of wheat flour firmed in November and were slightly higher than a year earlier. Similarly, prices strengthened seasonally in Azerbaijan in October, while they remained relatively stable in Armenia and in Belarus. By contrast, in Tajikistan, prices increased in October with seasonal trends compounded by a reduced production in 2018. With respect to potatoes, another staple food in the subregion, prices showed a downward trend in most countries of the subregion and were generally lower than a year earlier. In Georgia, Kazakhstan and Kyrgyzstan, prices continued to decrease in November and were lower than their year-earlier levels. In the Russian Federation, prices remained relatively stable and around their levels a year earlier on account of adequate domestic supplies. Prices of potatoes decreased to values below those a year earlier in Tajikistan and Armenia in October. By contrast, they increased seasonally in October in Azerbaijan and in Belarus after the declines of the past few months.
Latest Price(Nov-18) 1M 3M 1Y
Wholesale prices of wheat and wheat flour in the Russian Federation
Percent Change
7000
9000
11000
13000
15000
17000
19000
21000
Nov-16 Feb-17 May-17 Aug-17 Nov-17 Feb-18 May-18 Aug-18 Nov-18
National Average, Wheat (Milling, 3rd class, o�er, EXW)
Volga region, Wheat (�our, highest grade, o�er, EXW)
Central Black Earth, Wheat (�our, highest grade, o�er, EXW)
Southern region, Wheat (�our, highest grade, o�er, EXW)
Russian Ruble per tonne
12793.3
17400.0
17580.0
18820.0
1.5
0.6
1.3
2.7
8.8
9.4
7.5
12
42.9
21.7
25.6
30.5
Source(s): APK-Inform Agency
Latest Price(Nov-18) 1M 3M 1Y
Export prices of milling wheat in CIS countries
Percent Change
150160170180190200210220230240
Nov-16 Feb-17 May-17 Aug-17 Nov-17 Feb-18 May-18 Aug-18 Nov-18
Russian Federation, Wheat (milling, o�er, f.o.b., deep-sea ports)
Ukraine, Wheat (milling, o�er, f.o.b.)
Kazakhstan, Wheat (milling, d.a.p. Saryagash station)
US Dollar per tonne
227.40
226.20
183.50
-2.4
-1.7
3.1
-1
0
4.6
16.8
17.7
19
Source(s): APK-Inform Agency
GIEWS FPMA Bulletin16 10 December 2018
For more information visit the FPMA website here
CIS - ASIA AND EUROPE cont’d
Latest Price(Nov-18) 1M 3M 1Y
Retail prices of wheat flour in Georgia
Percent Change
1.6
1.65
1.7
1.75
1.8
1.85
1.9
Nov-16 Feb-17 May-17 Aug-17 Nov-17 Feb-18 May-18 Aug-18 Nov-18
National Average, Wheat (�our)
Lari per kg
1.87 1.1 2.7 5.6
Source(s): National Statistics O�ce of Georgia
Latest Price(Oct-18) 1M 3M 1Y
Retail prices of wheat flour in Tajikistan
Percent Change
3
3.1
3.2
3.3
3.4
3.5
3.6
3.7
Oct-16 Jan-17 Apr-17 Jul-17 Oct-17 Jan-18 Apr-18 Jul-18 Oct-18
Dushanbe
Khatlon
Sughd
National Average
Somoni per kg
3.60
3.50
3.50
3.60
2.9
2.9
6.1
3.2
9.1
2.9
9.4
5.6
2.9
2.9
7.4
3.2
Source(s): Statistical Agency under President of the Republic of Tajikistan
Latest Price(Nov-18) 1M 3M 1Y
Wholesale prices of wheat grain and wheat flour in Ukraine
Percent Change
3500
4500
5500
6500
7500
8500
9500
Nov-16 Feb-17 May-17 Aug-17 Nov-17 Feb-18 May-18 Aug-18 Nov-18
National Average, Wheat (3rd class, bid, EXW, processing)
National Average, Wheat (�our, �rst grade, o�er, EXW)
National Average, Wheat (�our, highest grade, o�er, EXW)
Hryvnia per tonne
6050.00
7920.00
8380.00
0.6
0.7
1.7
4.1
7.3
9.1
21.3
20.5
21.9
Source(s): APK-Inform Agency
Latest Price(Nov-18) 1M 3M 1Y
Retail prices of wheat flour in Kyrgyzstan
Percent Change
26
27
28
29
30
31
Nov-16 Feb-17 May-17 Aug-17 Nov-17 Feb-18 May-18 Aug-18 Nov-18
Bishkek
National Average
Naryn
Jalal-Abad
Som per kg
29.11
29.20
27.25
27.60
0.1
-0.1
0.3
-1.4
0.1
0.4
0.3
1.5
-1
-1.1
0.3
-1.9
Source(s): National Statistical Committee of the Kyrgyz Republic
17
For more information visit the FPMA website here
10 December 2018 GIEWS FPMA Bulletin
CIS - ASIA AND EUROPE cont’d
Latest Price(Nov-18) 1M 3M 1Y
Retail prices of potatoes in Georgia
Percent Change
0.7
0.8
0.9
1
1.1
1.2
1.3
Nov-16 Feb-17 May-17 Aug-17 Nov-17 Feb-18 May-18 Aug-18 Nov-18
National Average, Potatoes
Lari per kg
1.02 -1.9 -7.3 -7.3
Source(s): National Statistics O�ce of Georgia
Latest Price(Nov-18) 1M 3M 1Y
Retail prices of potatoes in Kazakhstan
Percent Change
40
60
80
100120
140
160
180
200
Nov-16 Feb-17 May-17 Aug-17 Nov-17 Feb-18 May-18 Aug-18 Nov-18
National Average
Astana
Aktau
Kostanay
Tenge per kg
84.08
80.00
119.00
74.00
-0.7
2.6
-4
-3.9
-17
-23.8
-13.8
-30.2
-29.2
-34.4
-14.4
-30.2
Source(s): Ministry of National Economy of the Republic of Kazakhstan - Committee on Statistics
Latest Price(Nov-18) 1M 3M 1Y
Retail prices of potatoes in Kyrgyzstan
Percent Change
10
15
20
2530
35
40
45
50
Nov-16 Feb-17 May-17 Aug-17 Nov-17 Feb-18 May-18 Aug-18 Nov-18
National Average
Bishkek
Naryn
Jalal-Abad
Som per kg
16.67
15.86
15.46
20.96
-2.4
-0.9
-3.9
2.3
-1.2
-4.6
-16
9.7
-37.3
-39.5
-41.6
-30.9
Source(s): National Statistical Committee of the Kyrgyz Republic
Latest Price(Nov-18) 1M 3M 1Y
Retail prices of potatoes in the Russian Federation
Percent Change
15
20
25
30
35
40
45
Nov-16 Feb-17 May-17 Aug-17 Nov-17 Feb-18 May-18 Aug-18 Nov-18
National Average, Potatoes
Russian Ruble per kg
21.36 0.6 -26 -0.1
Source(s): Federal State Statistics Service
GIEWS FPMA Bulletin18 10 December 2018
For more information visit the FPMA website here
CENTRAL AMERICA AND THE CARIBBEAN
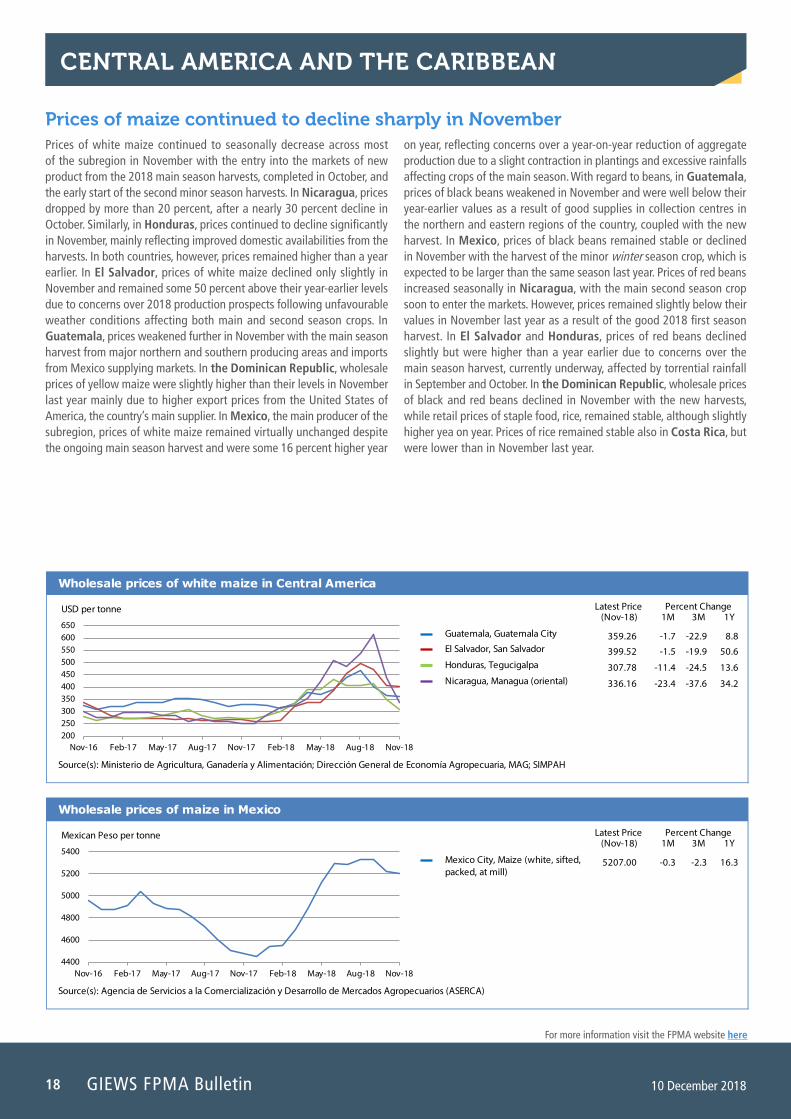
Prices of maize continued to decline sharply in November Prices of white maize continued to seasonally decrease across most of the subregion in November with the entry into the markets of new product from the 2018 main season harvests, completed in October, and the early start of the second minor season harvests. In Nicaragua, prices dropped by more than 20 percent, after a nearly 30 percent decline in October. Similarly, in Honduras, prices continued to decline significantly in November, mainly reflecting improved domestic availabilities from the harvests. In both countries, however, prices remained higher than a year earlier. In El Salvador, prices of white maize declined only slightly in November and remained some 50 percent above their year-earlier levels due to concerns over 2018 production prospects following unfavourable weather conditions affecting both main and second season crops. In Guatemala, prices weakened further in November with the main season harvest from major northern and southern producing areas and imports from Mexico supplying markets. In the Dominican Republic, wholesale prices of yellow maize were slightly higher than their levels in November last year mainly due to higher export prices from the United States of America, the country’s main supplier. In Mexico, the main producer of the subregion, prices of white maize remained virtually unchanged despite the ongoing main season harvest and were some 16 percent higher year
on year, reflecting concerns over a year-on-year reduction of aggregate production due to a slight contraction in plantings and excessive rainfalls affecting crops of the main season. With regard to beans, in Guatemala, prices of black beans weakened in November and were well below their year-earlier values as a result of good supplies in collection centres in the northern and eastern regions of the country, coupled with the new harvest. In Mexico, prices of black beans remained stable or declined in November with the harvest of the minor winter season crop, which is expected to be larger than the same season last year. Prices of red beans increased seasonally in Nicaragua, with the main second season crop soon to enter the markets. However, prices remained slightly below their values in November last year as a result of the good 2018 first season harvest. In El Salvador and Honduras, prices of red beans declined slightly but were higher than a year earlier due to concerns over the main season harvest, currently underway, affected by torrential rainfall in September and October. In the Dominican Republic, wholesale prices of black and red beans declined in November with the new harvests, while retail prices of staple food, rice, remained stable, although slightly higher yea on year. Prices of rice remained stable also in Costa Rica, but were lower than in November last year.
Latest Price(Nov-18) 1M 3M 1Y
Wholesale prices of maize in Mexico
Percent Change
4400
4600
4800
5000
5200
5400
Nov-16 Feb-17 May-17 Aug-17 Nov-17 Feb-18 May-18 Aug-18 Nov-18
Mexico City, Maize (white, sifted, packed, at mill)
Mexican Peso per tonne
5207.00 -0.3 -2.3 16.3
Source(s): Agencia de Servicios a la Comercialización y Desarrollo de Mercados Agropecuarios (ASERCA)
Latest Price(Nov-18) 1M 3M 1Y
Wholesale prices of white maize in Central America
Percent Change
200250300350400450500550600650
Nov-16 Feb-17 May-17 Aug-17 Nov-17 Feb-18 May-18 Aug-18 Nov-18
Guatemala, Guatemala City
El Salvador, San Salvador
Honduras, Tegucigalpa
Nicaragua, Managua (oriental)
USD per tonne
359.26
399.52
307.78
336.16
-1.7
-1.5
-11.4
-23.4
-22.9
-19.9
-24.5
-37.6
8.8
50.6
13.6
34.2
Source(s): Ministerio de Agricultura, Ganadería y Alimentación; Dirección General de Economía Agropecuaria, MAG; SIMPAH
19
For more information visit the FPMA website here
10 December 2018 GIEWS FPMA Bulletin
SOUTH AMERICA
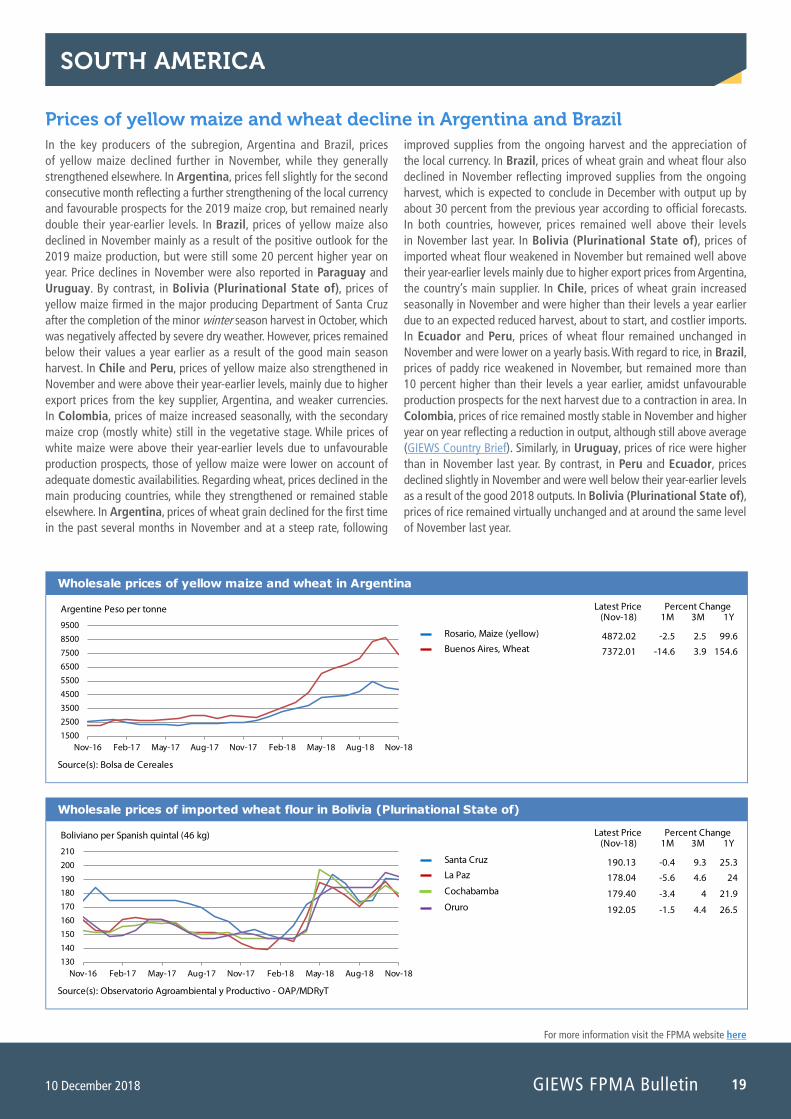
Prices of yellow maize and wheat decline in Argentina and Brazil In the key producers of the subregion, Argentina and Brazil, prices of yellow maize declined further in November, while they generally strengthened elsewhere. In Argentina, prices fell slightly for the second consecutive month reflecting a further strengthening of the local currency and favourable prospects for the 2019 maize crop, but remained nearly double their year-earlier levels. In Brazil, prices of yellow maize also declined in November mainly as a result of the positive outlook for the 2019 maize production, but were still some 20 percent higher year on year. Price declines in November were also reported in Paraguay and Uruguay. By contrast, in Bolivia (Plurinational State of), prices of yellow maize firmed in the major producing Department of Santa Cruz after the completion of the minor winter season harvest in October, which was negatively affected by severe dry weather. However, prices remained below their values a year earlier as a result of the good main season harvest. In Chile and Peru, prices of yellow maize also strengthened in November and were above their year-earlier levels, mainly due to higher export prices from the key supplier, Argentina, and weaker currencies. In Colombia, prices of maize increased seasonally, with the secondary maize crop (mostly white) still in the vegetative stage. While prices of white maize were above their year-earlier levels due to unfavourable production prospects, those of yellow maize were lower on account of adequate domestic availabilities. Regarding wheat, prices declined in the main producing countries, while they strengthened or remained stable elsewhere. In Argentina, prices of wheat grain declined for the first time in the past several months in November and at a steep rate, following
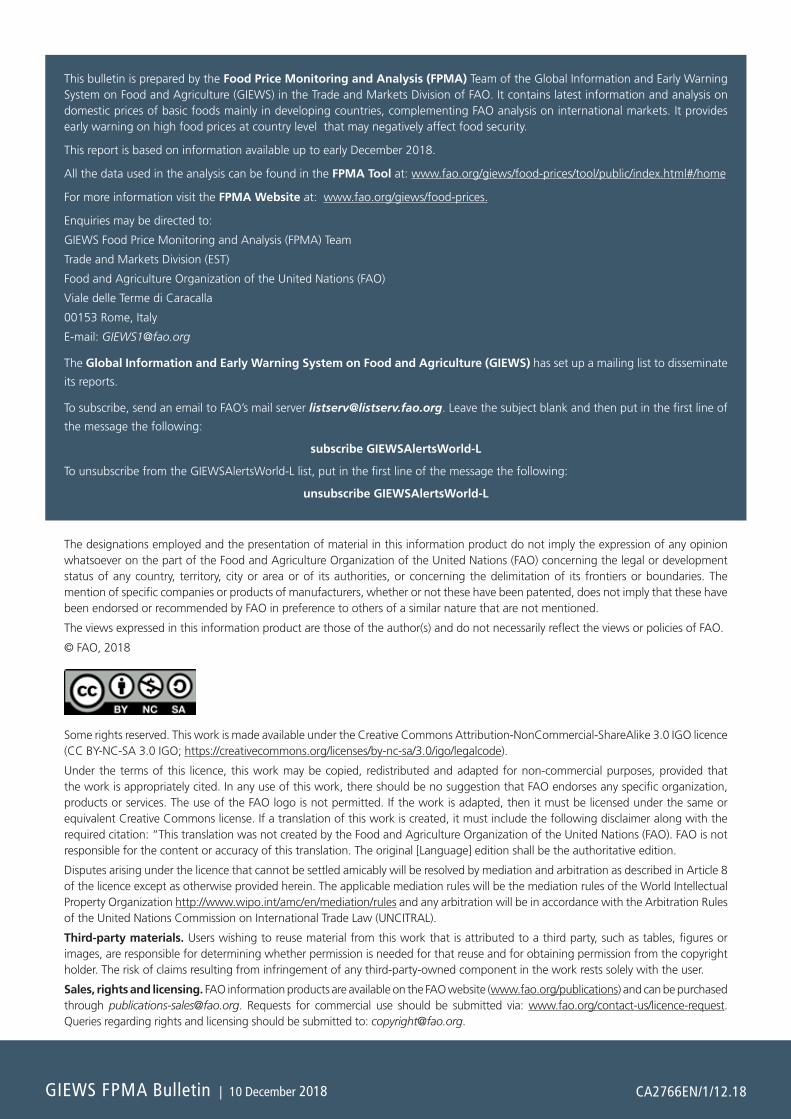
improved supplies from the ongoing harvest and the appreciation of the local currency. In Brazil, prices of wheat grain and wheat flour also declined in November reflecting improved supplies from the ongoing harvest, which is expected to conclude in December with output up by about 30 percent from the previous year according to official forecasts. In both countries, however, prices remained well above their levels in November last year. In Bolivia (Plurinational State of), prices of imported wheat flour weakened in November but remained well above their year-earlier levels mainly due to higher export prices from Argentina, the country’s main supplier. In Chile, prices of wheat grain increased seasonally in November and were higher than their levels a year earlier due to an expected reduced harvest, about to start, and costlier imports. In Ecuador and Peru, prices of wheat flour remained unchanged in November and were lower on a yearly basis. With regard to rice, in Brazil, prices of paddy rice weakened in November, but remained more than 10 percent higher than their levels a year earlier, amidst unfavourable production prospects for the next harvest due to a contraction in area. In Colombia, prices of rice remained mostly stable in November and higher year on year reflecting a reduction in output, although still above average (GIEWS Country Brief). Similarly, in Uruguay, prices of rice were higher than in November last year. By contrast, in Peru and Ecuador, prices declined slightly in November and were well below their year-earlier levels as a result of the good 2018 outputs. In Bolivia (Plurinational State of), prices of rice remained virtually unchanged and at around the same level of November last year.
Latest Price(Nov-18) 1M 3M 1Y
Wholesale prices of yellow maize and wheat in Argentina
Percent Change
1500
2500
3500
45005500
6500
7500
8500
9500
Nov-16 Feb-17 May-17 Aug-17 Nov-17 Feb-18 May-18 Aug-18 Nov-18
Rosario, Maize (yellow)
Buenos Aires, Wheat
Argentine Peso per tonne
4872.02
7372.01
-2.5
-14.6
2.5
3.9
99.6
154.6
Source(s): Bolsa de Cereales
Latest Price(Nov-18) 1M 3M 1Y
Wholesale prices of imported wheat flour in Bolivia (Plurinational State of)
Percent Change
130
140
150
160170
180
190
200
210
Nov-16 Feb-17 May-17 Aug-17 Nov-17 Feb-18 May-18 Aug-18 Nov-18
Santa Cruz
La Paz
Cochabamba
Oruro
Boliviano per Spanish quintal (46 kg)
190.13
178.04
179.40
192.05
-0.4
-5.6
-3.4
-1.5
9.3
4.6
4
4.4
25.3
24
21.9
26.5
Source(s): Observatorio Agroambiental y Productivo - OAP/MDRyT
This bulletin is prepared by the Food Price Monitoring and Analysis (FPMA) Team of the Global Information and Early Warning System on Food and Agriculture (GIEWS) in the Trade and Markets Division of FAO. It contains latest information and analysis on domestic prices of basic foods mainly in developing countries, complementing FAO analysis on international markets. It provides early warning on high food prices at country level that may negatively affect food security.
This report is based on information available up to early December 2018.
All the data used in the analysis can be found in the FPMA Tool at: www.fao.org/giews/food-prices/tool/public/index.html#/home
For more information visit the FPMA Website at: www.fao.org/giews/food-prices.
Enquiries may be directed to:
GIEWS Food Price Monitoring and Analysis (FPMA) Team
Trade and Markets Division (EST)
Food and Agriculture Organization of the United Nations (FAO)
Viale delle Terme di Caracalla
00153 Rome, Italy
E-mail: [email protected]
The Global Information and Early Warning System on Food and Agriculture (GIEWS) has set up a mailing list to disseminate
its reports.
To subscribe, send an email to FAO’s mail server [email protected]. Leave the subject blank and then put in the first line of
the message the following:
subscribe GIEWSAlertsWorld-L
To unsubscribe from the GIEWSAlertsWorld-L list, put in the first line of the message the following:
unsubscribe GIEWSAlertsWorld-L
The designations employed and the presentation of material in this information product do not imply the expression of any opinion whatsoever on the part of the Food and Agriculture Organization of the United Nations (FAO) concerning the legal or development status of any country, territory, city or area or of its authorities, or concerning the delimitation of its frontiers or boundaries. The mention of specific companies or products of manufacturers, whether or not these have been patented, does not imply that these have been endorsed or recommended by FAO in preference to others of a similar nature that are not mentioned.
The views expressed in this information product are those of the author(s) and do not necessarily reflect the views or policies of FAO.
© FAO, 2018
Some rights reserved. This work is made available under the Creative Commons Attribution-NonCommercial-ShareAlike 3.0 IGO licence (CC BY-NC-SA 3.0 IGO; https://creativecommons.org/licenses/by-nc-sa/3.0/igo/legalcode).
Under the terms of this licence, this work may be copied, redistributed and adapted for non-commercial purposes, provided that the work is appropriately cited. In any use of this work, there should be no suggestion that FAO endorses any specific organization, products or services. The use of the FAO logo is not permitted. If the work is adapted, then it must be licensed under the same or equivalent Creative Commons license. If a translation of this work is created, it must include the following disclaimer along with the required citation: “This translation was not created by the Food and Agriculture Organization of the United Nations (FAO). FAO is not responsible for the content or accuracy of this translation. The original [Language] edition shall be the authoritative edition.
Disputes arising under the licence that cannot be settled amicably will be resolved by mediation and arbitration as described in Article 8 of the licence except as otherwise provided herein. The applicable mediation rules will be the mediation rules of the World Intellectual Property Organization http://www.wipo.int/amc/en/mediation/rules and any arbitration will be in accordance with the Arbitration Rules of the United Nations Commission on International Trade Law (UNCITRAL).
Third-party materials. Users wishing to reuse material from this work that is attributed to a third party, such as tables, figures or images, are responsible for determining whether permission is needed for that reuse and for obtaining permission from the copyright holder. The risk of claims resulting from infringement of any third-party-owned component in the work rests solely with the user.
Sales, rights and licensing. FAO information products are available on the FAO website (www.fao.org/publications) and can be purchased through publications‑[email protected]. Requests for commercial use should be submitted via: www.fao.org/contact-us/licence-request. Queries regarding rights and licensing should be submitted to: [email protected].
CA2766EN/1/12.18GIEWS FPMA Bulletin | 10 December 2018