Embed Size (px)
Citation preview
Food Price Monitoring and Analysis9 September 2021
MONTHLY REPORT ON FOOD PRICE TRENDS
BULLETIN#7
GIEWS - Global Information and Early Warning System on Food and Agriculture
ISS
N 2
707-
1952
KEY MESSAGES ↗ International cereal prices followed mixed trends in August. Wheat prices surged as production prospects deteriorated significantly in several major producing countries. Among coarse grains, reduced production forecasts also boosted barley prices, while maize and sorghum prices continued to decline from their multi‑year highs reached in May. International rice prices remained on a downward trajectory in August, influenced by efforts to attract sales and by currency movements.
↗ In East Africa, prices of coarse grains generally increased in August, especially in countries where first/main season harvests dropped sharply. Prices were generally higher than one year earlier, with exceptionally high levels still prevailing in the Sudan and South Sudan.
↗ In West Africa, solid domestic demand amidst constrained market availabilities hindered by supply chain bottlenecks and locally volatile security conditions exacerbated seasonal upward trends in the prices of domestically produced coarse grains, which lingered at levels well above their year‑earlier values.
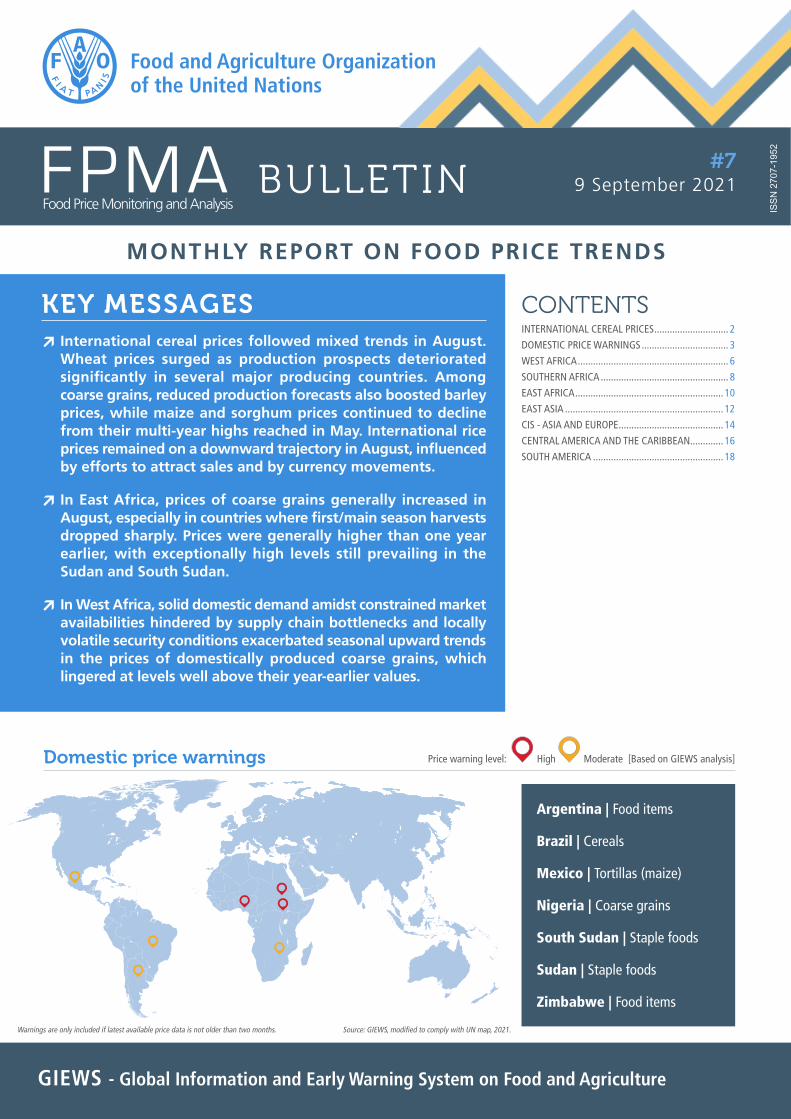
Price warning level: High Moderate [Based on GIEWS analysis]
CONTENTSINTERNATIONAL CEREAL PRICES ............................. 2
DOMESTIC PRICE WARNINGS .................................. 3
WEST AFRICA ........................................................... 6
SOUTHERN AFRICA .................................................. 8
EAST AFRICA .......................................................... 10
EAST ASIA .............................................................. 12
CIS - ASIA AND EUROPE ......................................... 14
CENTRAL AMERICA AND THE CARIBBEAN ............. 16
SOUTH AMERICA ................................................... 18
Argentina | Food items
Brazil | Cereals
Mexico | Tortillas (maize)
Nigeria | Coarse grains
South Sudan | Staple foods
Sudan | Staple foods
Zimbabwe | Food items
Domestic price warnings
Warnings are only included if latest available price data is not older than two months. Source: GIEWS, modified to comply with UN map, 2021.

2 9 September 2021GIEWS FPMA Bulletin
For more information visit the FPMA website here
INTERNATIONAL CEREAL PRICES
International wheat prices surged in August, reflecting a deterioration of production prospects in several major producers. Adverse conditions reduced yields and lowered output forecasts in Canada, the Russian Federation and the United States of America, and crop quality concerns rose in the European Union. With global wheat production in 2021 now forecast to decline below the record 2020 output, export quotations from all major origins increased. The upward surge was led by an increase in the European Union origin (France grade 1) price by 18.4 percent, followed closely by the Russian Federation (milling, offer, f.o.b. deep-sea ports) and Ukraine (milling, offer, f.o.b) quotations, which increased by 17.5 and 17.4 percent, respectively. The benchmark US wheat price (No. 2, HRW) also increased, by 11.2 percent, nearly 47 percent above its value one year earlier.
Among coarse grains, international maize prices declined slightly since July, continuing the decreasing trend since the nearly eight-and-a-half year peaks reached in May 2021, but still well above their values one year ago. The benchmark US maize (No.2, Yellow, f.o.b.) declined by 8.8 percent in August, reflecting slower demand for ethanol production, a slight strengthening of the US dollar, and still good production prospects. The Ukraine (offer, f.o.b.) quotation also fell, by 1.9 percent, on improved production prospects
and expectations of a record output. By contrast, a significant cut to the production forecast and tighter supplies lifted Brazil’s maize export prices (Paranaguá, feed) by 1.5 percent. While international sorghum prices also declined, by 2.5 percent, feed barley prices firmed by nearly 11 percent in August, driven by reduced production outlooks, especially in Canada and the United States of America, as well as rising wheat prices.
The FAO All Rice Price Index (2014-2016=100) averaged 97.9 points in August 2021, down 3.3 percent from July and its lowest level since May 2017. A generally slow pace of sales weighed on quotations in all the rice market segments in August. Exports prices of Asian Indica rice remained bearish during August, reflecting efforts to stimulate fresh sales, which remained limited by high freight costs and a lack of containers. In Thailand, currency depreciations further influenced prices, as did additional early summer-autumn arrivals in Viet Nam, where trading activities remained subdued due to the COVID-19 containment measures. Quotations also eased in India, although consistent demand from African buyers and news of another import duty remission approved in Bangladesh tended to cap the price decreases. In the United States of America, prices moved little as the 2021 crop entered the harvest stage.
Wheat prices surged, while coarse grain prices followed mixed trends and rice prices continued to decline in August
United States Dollar per tonne Latest PriceAug-21 1M 3M 1Y
323.80 11.2 8.5 46.7
294.00 18.4 0.2 33.9
286.50 17.5 5.0 40.1
283.75 17.4 3.7 39.3
International wheat prices
Percent Change
Sources: International Grains Council; APK-Inform Agency.
United States of America (Gulf), Wheat (US No. 2, Hard Red Winter)
European Union (France), Wheat (grade 1)
Russian Federation, Wheat (milling, offer, f.o.b., deep-sea ports)
Ukraine, Wheat (milling, offer, f.o.b.)180
200
220
240
260
280
300
320
340
Aug-19 Nov-19 Feb-20 May-20 Aug-20 Nov-20 Feb-21 May-21 Aug-21
United States Dollar per tonne Latest PriceAug-21 1M 3M 1Y
254.30 -8.8 -16.5 72.0
268.80 -0.8 -8.0 47.9
236.80 0.8 -12.9 45.3
270.50 -1.9 -8.8 49.7
International maize prices
Percent Change
Sources: USDA; International Grains Council; APK-Inform Agency.
United States of America (Gulf), Maize (US No. 2, Yellow)
Black Sea, Maize (feed)
Argentina, Maize (Argentina, Up River, f.o.b.)
Ukraine, Maize (offer, f.o.b.)140160180200220240260280300320
Aug-19 Nov-19 Feb-20 May-20 Aug-20 Nov-20 Feb-21 May-21 Aug-21
United States Dollar per tonne Latest PriceAug-21 1M 3M 1Y
417.50 -3.8 -17.9 -19.8
364.00 -3.2 -21.3 -20.1
361.00 -0.6 -2.4 -1.8
560.00 0.5 -7.4 -8.9
International rice prices
Percent Change
Sources: Thai Rice Exporters Association; FAO rice price update.
Thailand (Bangkok), Rice (Thai 100% B)
Viet Nam, Rice (25% broken)
India, Rice (25% broken)
United States of America, Rice (US Long Grain 2.4%)
300
350
400
450
500
550
600
650
Aug-19 Nov-19 Feb-20 May-20 Aug-20 Nov-20 Feb-21 May-21 Aug-21

Price warning level: High Moderate
3
For more information visit the FPMA website here
9 September 2021 GIEWS FPMA Bulletin
DOMESTIC PRICE WARNINGS
Retail food prices continued their steady increase in June and JulyThe inflation rate for food items and non-alcoholic beverages continued its upward trend in June and July, increasing by more than 3 percent each month amid a difficult macro-economic situation, including the sustained weakening of the currency. As of July 2021, the Argentine peso was worth 35 percent less than its value a year earlier. Among food items, prices of vegetables, tubers, beans, cooking oil, milk, eggs and sugar registered high monthly increases, which were partially offset by declines in fruit prices. As of September, two programmes remain in place to curb the price increases by setting reference levels for staple food items in supermarkets and by fixing prices of 70 selected food items in small-sized retail outlets. However, the prices set under the programmes have had to be revised upward several times to account for increasing costs of production.
Argentina | Food items
Countries where prices of one or more basic food commodity are at abnormal high levels which could negatively impact access to food
Brazil | Cereals Prices of cereals remained higher year on year Prices of yellow maize increased in July and August after a short-lived weakening in the previous month. The increase is underpinned by tight supply prospects resulting from the drought-reduced main season output, which more than offset the downward pressure from the ongoing harvest. Production in 2021 is officially estimated at a slightly below-average level of 86.6 million tonnes, which represents an annual contraction of more than 15 percent. Prices in August were more than 80 percent higher year on year following sustained increases since July 2020 supported by strong export demand. Prices of rice and wheat were also above their year-earlier levels in August due to strong demand and elevated import costs in the past few months, respectively. In July and August, prices of wheat were stable as seasonally tight supplies were offset by larger year-on-year imports in the second quarter of 2021. Prices of rice weakened reflecting adequate market availabilities from the 2021 harvest, completed in May, and lower year on year exports during the first seven months of 2021.
to 07/21 Same periodaverage
3 months
12 months
Growth Rate (%)
-2.2
1.1
Compound growth rate in real terms.Refers to: Argentina, Greater Buenos Aires, Retail, Wheat (flour).
3.8
0.4
to 08/21 Same periodaverage
3 months
12 months
Growth Rate (%)
4.4
1.0
Compound growth rate in real terms.Refers to: Brazil, Mato Grosso, Wholesale, Maize (yellow).
0.4
1.2
Mexico | Tortillas (maize) Prices of staple maize tortillas on the sharp rise Retail prices of maize tortillas continued to rise in August and reached more than 30 percent above their year-earlier levels in the capital city. The sustained sharp increases mainly reflect high price levels of maize grain and elevated transportation costs. Prices of white maize, the main ingredient of tortillas, have increased sharply in the first half of 2021 following trends in the international market, exacerbated by the lower year on year supply on account of reduced opening stocks. The harvest of the main season crop will start in October, which is likely to boost market availabilities. According to official sources, supplies of white maize in the 2021/22 marketing year are forecast to increase, supported by larger opening stocks as well as an increase in production by 3 percent year on year.
to 08/21 Same periodaverage
3 months
12 months
Growth Rate (%)
1.8
5.3
Compound growth rate in real terms.Refers to: Mexico, Mexico City, Retail, Tortillas.
-0.3
0.0
Price warning level: High Moderate
4 9 September 2021
For more information visit the FPMA website here
GIEWS FPMA Bulletin
DOMESTIC PRICE WARNINGS cont’d
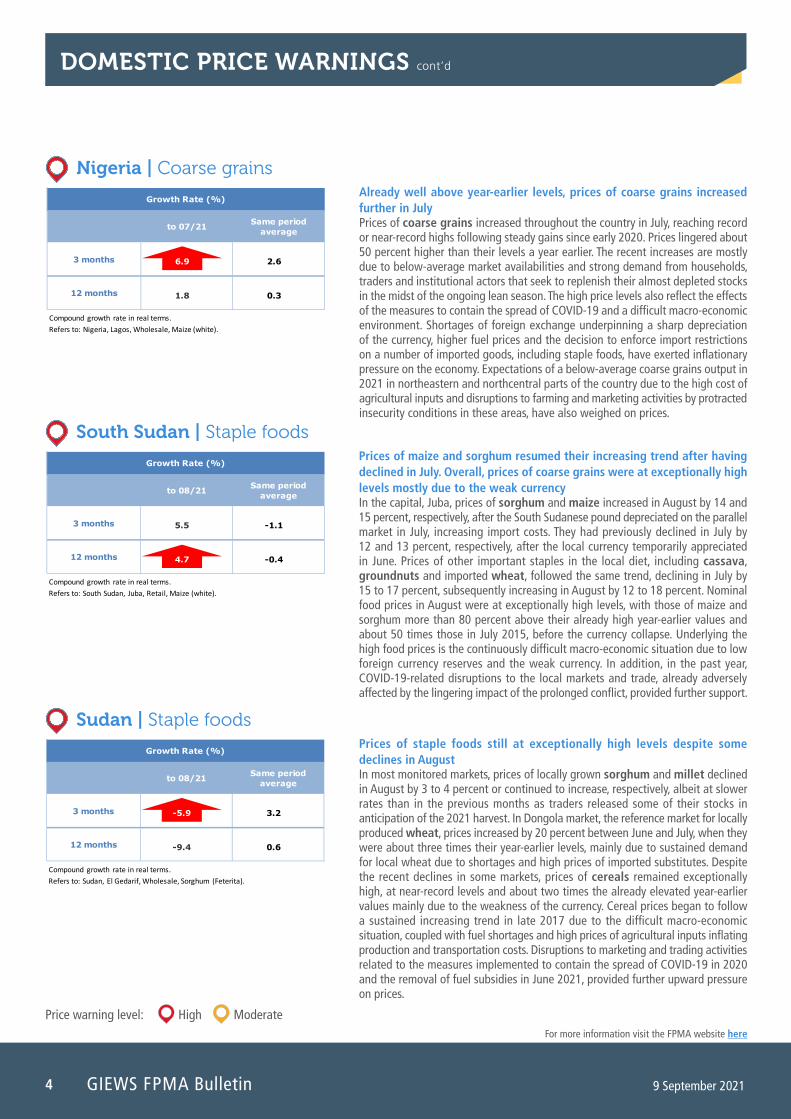
Sudan | Staple foods Prices of staple foods still at exceptionally high levels despite some declines in August In most monitored markets, prices of locally grown sorghum and millet declined in August by 3 to 4 percent or continued to increase, respectively, albeit at slower rates than in the previous months as traders released some of their stocks in anticipation of the 2021 harvest. In Dongola market, the reference market for locally produced wheat, prices increased by 20 percent between June and July, when they were about three times their year-earlier levels, mainly due to sustained demand for local wheat due to shortages and high prices of imported substitutes. Despite the recent declines in some markets, prices of cereals remained exceptionally high, at near-record levels and about two times the already elevated year-earlier values mainly due to the weakness of the currency. Cereal prices began to follow a sustained increasing trend in late 2017 due to the difficult macro-economic situation, coupled with fuel shortages and high prices of agricultural inputs inflating production and transportation costs. Disruptions to marketing and trading activities related to the measures implemented to contain the spread of COVID-19 in 2020 and the removal of fuel subsidies in June 2021, provided further upward pressure on prices.
to 08/21 Same periodaverage
3 months
12 months
Growth Rate (%)
-9.4
-5.9
Compound growth rate in real terms.Refers to: Sudan, El Gedarif, Wholesale, Sorghum (Feterita).
3.2
0.6
South Sudan | Staple foodsPrices of maize and sorghum resumed their increasing trend after having declined in July. Overall, prices of coarse grains were at exceptionally high levels mostly due to the weak currency In the capital, Juba, prices of sorghum and maize increased in August by 14 and 15 percent, respectively, after the South Sudanese pound depreciated on the parallel market in July, increasing import costs. They had previously declined in July by 12 and 13 percent, respectively, after the local currency temporarily appreciated in June. Prices of other important staples in the local diet, including cassava, groundnuts and imported wheat, followed the same trend, declining in July by 15 to 17 percent, subsequently increasing in August by 12 to 18 percent. Nominal food prices in August were at exceptionally high levels, with those of maize and sorghum more than 80 percent above their already high year-earlier values and about 50 times those in July 2015, before the currency collapse. Underlying the high food prices is the continuously difficult macro-economic situation due to low foreign currency reserves and the weak currency. In addition, in the past year, COVID-19-related disruptions to the local markets and trade, already adversely affected by the lingering impact of the prolonged conflict, provided further support.
to 08/21 Same periodaverage
3 months
12 months
Growth Rate (%)
4.7
5.5
Compound growth rate in real terms.Refers to: South Sudan, Juba, Retail, Maize (white).
-1.1
-0.4
Nigeria | Coarse grains Already well above year-earlier levels, prices of coarse grains increased further in July Prices of coarse grains increased throughout the country in July, reaching record or near-record highs following steady gains since early 2020. Prices lingered about 50 percent higher than their levels a year earlier. The recent increases are mostly due to below-average market availabilities and strong demand from households, traders and institutional actors that seek to replenish their almost depleted stocks in the midst of the ongoing lean season. The high price levels also reflect the effects of the measures to contain the spread of COVID-19 and a difficult macro-economic environment. Shortages of foreign exchange underpinning a sharp depreciation of the currency, higher fuel prices and the decision to enforce import restrictions on a number of imported goods, including staple foods, have exerted inflationary pressure on the economy. Expectations of a below-average coarse grains output in 2021 in northeastern and northcentral parts of the country due to the high cost of agricultural inputs and disruptions to farming and marketing activities by protracted insecurity conditions in these areas, have also weighed on prices.
to 07/21 Same periodaverage
3 months
12 months
Growth Rate (%)
1.8
6.9
Compound growth rate in real terms.Refers to: Nigeria, Lagos, Wholesale, Maize (white).
2.6
0.3

Price warning level: High Moderate
5
For more information visit the FPMA website here
9 September 2021 GIEWS FPMA Bulletin
Zimbabwe | Food itemsFood price rises remained relatively low, but price levels were still significantly higher year on year The official monthly food inflation rate was estimated at about 3 percent in August, generally unchanged compared to the previous month. The annual rate continued to fall and was estimated at 50 percent in August, still an exceptionally high level but significantly lower than the rates in 2020 when inflation peaked at more than 900 percent. The reduction in the price increases reflects the stability of the official exchange rate since the last quarter of 2020, and with the recent issuance of the Special Drawing Rights by the International Monetary Fund (IMF), which the country is expected to partly use to shore up foreign currency reserves, this is expected to further bolster the stability of the currency. Additionally, the country harvested a large maize crop in 2021, estimated at 2.7 million tonnes, owing to supportive government policies and conducive weather conditions. The improved supply situation has also contributed to easing pressure on cereal prices.
to 08/21 Same periodaverage
3 months
12 months
Growth Rate (%)
n.a
n.a
Compound growth rate in real terms.Refers to: Zimbabwe, Harare, Retail, Food items.
n.a
n.a
DOMESTIC PRICE WARNINGS cont’d
GIEWS FPMA Bulletin6 9 September 2021
For more information visit the FPMA website here
WEST AFRICA
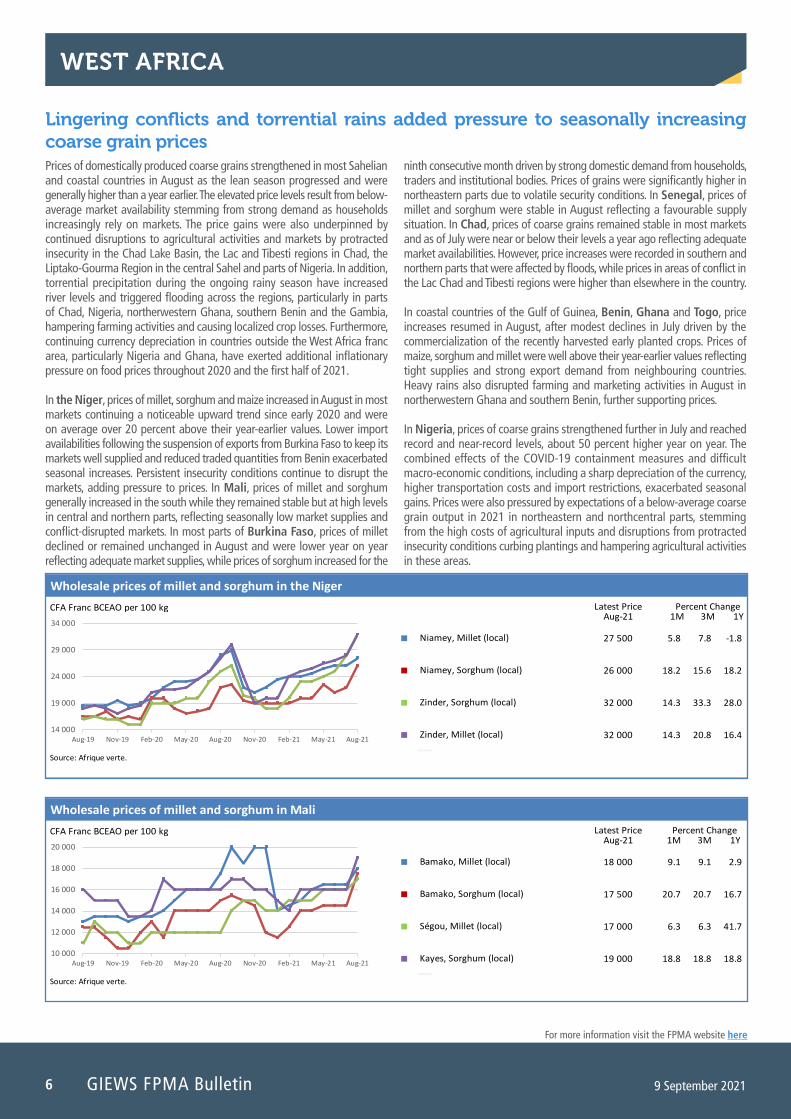
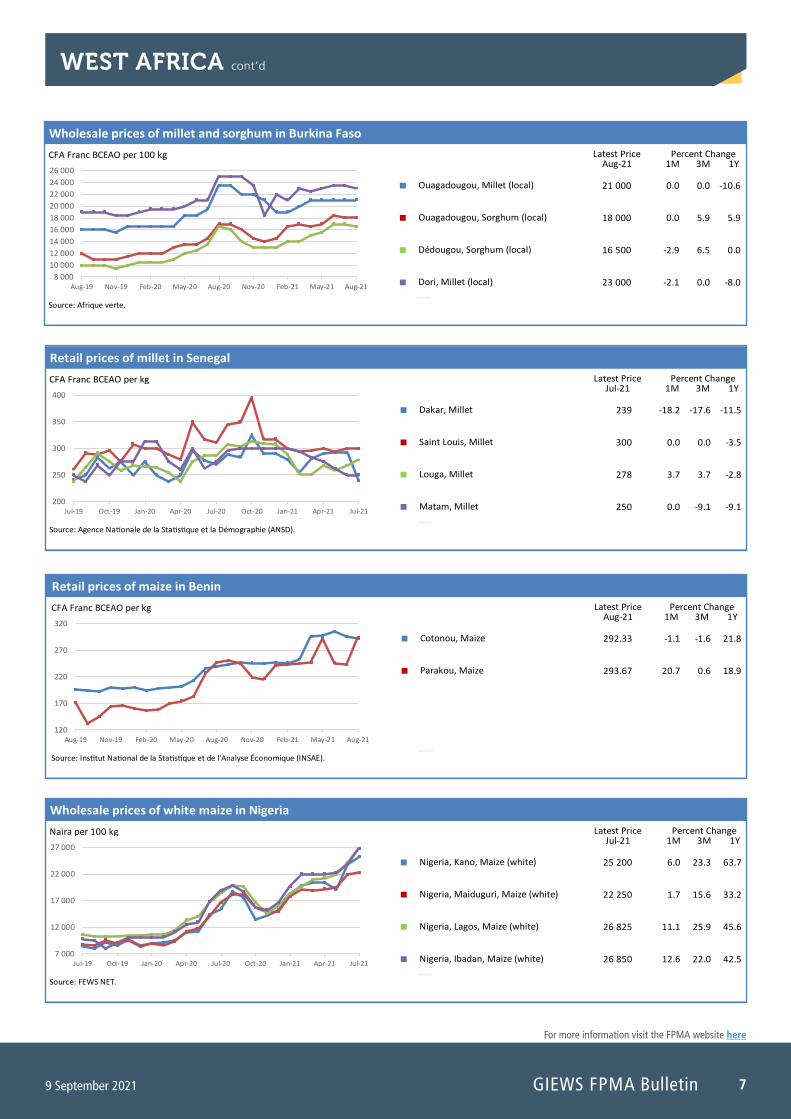
Lingering conflicts and torrential rains added pressure to seasonally increasing coarse grain prices Prices of domestically produced coarse grains strengthened in most Sahelian and coastal countries in August as the lean season progressed and were generally higher than a year earlier. The elevated price levels result from below-average market availability stemming from strong demand as households increasingly rely on markets. The price gains were also underpinned by continued disruptions to agricultural activities and markets by protracted insecurity in the Chad Lake Basin, the Lac and Tibesti regions in Chad, the Liptako-Gourma Region in the central Sahel and parts of Nigeria. In addition, torrential precipitation during the ongoing rainy season have increased river levels and triggered flooding across the regions, particularly in parts of Chad, Nigeria, northerwestern Ghana, southern Benin and the Gambia, hampering farming activities and causing localized crop losses. Furthermore, continuing currency depreciation in countries outside the West Africa franc area, particularly Nigeria and Ghana, have exerted additional inflationary pressure on food prices throughout 2020 and the first half of 2021.
In the Niger, prices of millet, sorghum and maize increased in August in most markets continuing a noticeable upward trend since early 2020 and were on average over 20 percent above their year-earlier values. Lower import availabilities following the suspension of exports from Burkina Faso to keep its markets well supplied and reduced traded quantities from Benin exacerbated seasonal increases. Persistent insecurity conditions continue to disrupt the markets, adding pressure to prices. In Mali, prices of millet and sorghum generally increased in the south while they remained stable but at high levels in central and northern parts, reflecting seasonally low market supplies and conflict-disrupted markets. In most parts of Burkina Faso, prices of millet declined or remained unchanged in August and were lower year on year reflecting adequate market supplies, while prices of sorghum increased for the
ninth consecutive month driven by strong domestic demand from households, traders and institutional bodies. Prices of grains were significantly higher in northeastern parts due to volatile security conditions. In Senegal, prices of millet and sorghum were stable in August reflecting a favourable supply situation. In Chad, prices of coarse grains remained stable in most markets and as of July were near or below their levels a year ago reflecting adequate market availabilities. However, price increases were recorded in southern and northern parts that were affected by floods, while prices in areas of conflict in the Lac Chad and Tibesti regions were higher than elsewhere in the country.
In coastal countries of the Gulf of Guinea, Benin, Ghana and Togo, price increases resumed in August, after modest declines in July driven by the commercialization of the recently harvested early planted crops. Prices of maize, sorghum and millet were well above their year-earlier values reflecting tight supplies and strong export demand from neighbouring countries. Heavy rains also disrupted farming and marketing activities in August in northerwestern Ghana and southern Benin, further supporting prices.
In Nigeria, prices of coarse grains strengthened further in July and reached record and near-record levels, about 50 percent higher year on year. The combined effects of the COVID-19 containment measures and difficult macro-economic conditions, including a sharp depreciation of the currency, higher transportation costs and import restrictions, exacerbated seasonal gains. Prices were also pressured by expectations of a below-average coarse grain output in 2021 in northeastern and northcentral parts, stemming from the high costs of agricultural inputs and disruptions from protracted insecurity conditions curbing plantings and hampering agricultural activities in these areas.
CFA Franc BCEAO per 100 kg Latest PriceAug-21 1M 3M 1Y
18 000 9.1 9.1 2.9
17 500 20.7 20.7 16.7
17 000 6.3 6.3 41.7
19 000 18.8 18.8 18.8
Wholesale prices of millet and sorghum in Mali
Percent Change
Source: Afrique verte.
Bamako, Millet (local)
Bamako, Sorghum (local)
Ségou, Millet (local)
Kayes, Sorghum (local)10 000
12 000
14 000
16 000
18 000
20 000
Aug-19 Nov-19 Feb-20 May-20 Aug-20 Nov-20 Feb-21 May-21 Aug-21
CFA Franc BCEAO per 100 kg Latest PriceAug-21 1M 3M 1Y
27 500 5.8 7.8 -1.8
26 000 18.2 15.6 18.2
32 000 14.3 33.3 28.0
32 000 14.3 20.8 16.4
Wholesale prices of millet and sorghum in the Niger
Percent Change
Source: Afrique verte.
Niamey, Millet (local)
Niamey, Sorghum (local)
Zinder, Sorghum (local)
Zinder, Millet (local)14 000
19 000
24 000
29 000
34 000
Aug-19 Nov-19 Feb-20 May-20 Aug-20 Nov-20 Feb-21 May-21 Aug-21
7
For more information visit the FPMA website here
9 September 2021 GIEWS FPMA Bulletin
WEST AFRICA cont’d
CFA Franc BCEAO per kg Latest PriceAug-21 1M 3M 1Y
292.33 -1.1 -1.6 21.8
293.67 20.7 0.6 18.9
Retail prices of maize in Benin
Percent Change
Source: Institut National de la Statistique et de l'Analyse Économique (INSAE).
Cotonou, Maize
Parakou, Maize
120
170
220
270
320
Aug-19 Nov-19 Feb-20 May-20 Aug-20 Nov-20 Feb-21 May-21 Aug-21
CFA Franc BCEAO per kg Latest PriceJul-21 1M 3M 1Y
239 -18.2 -17.6 -11.5
300 0.0 0.0 -3.5
278 3.7 3.7 -2.8
250 0.0 -9.1 -9.1
Retail prices of millet in Senegal
Percent Change
Source: Agence Nationale de la Statistique et la Démographie (ANSD).
Dakar, Millet
Saint Louis, Millet
Louga, Millet
Matam, Millet 200
250
300
350
400
Jul-19 Oct-19 Jan-20 Apr-20 Jul-20 Oct-20 Jan-21 Apr-21 Jul-21
Naira per 100 kg Latest PriceJul-21 1M 3M 1Y
25 200 6.0 23.3 63.7
22 250 1.7 15.6 33.2
26 825 11.1 25.9 45.6
26 850 12.6 22.0 42.5
Wholesale prices of white maize in Nigeria
Percent Change
Source: FEWS NET.
Nigeria, Kano, Maize (white)
Nigeria, Maiduguri, Maize (white)
Nigeria, Lagos, Maize (white)
Nigeria, Ibadan, Maize (white)7 000
12 000
17 000
22 000
27 000
Jul-19 Oct-19 Jan-20 Apr-20 Jul-20 Oct-20 Jan-21 Apr-21 Jul-21
CFA Franc BCEAO per 100 kg Latest PriceAug-21 1M 3M 1Y
21 000 0.0 0.0 -10.6
18 000 0.0 5.9 5.9
16 500 -2.9 6.5 0.0
23 000 -2.1 0.0 -8.0
Wholesale prices of millet and sorghum in Burkina Faso
Percent Change
Source: Afrique verte.
Ouagadougou, Millet (local)
Ouagadougou, Sorghum (local)
Dédougou, Sorghum (local)
Dori, Millet (local)8 00010 00012 00014 00016 00018 00020 00022 00024 00026 000
Aug-19 Nov-19 Feb-20 May-20 Aug-20 Nov-20 Feb-21 May-21 Aug-21
GIEWS FPMA Bulletin8 9 September 2021
For more information visit the FPMA website here
SOUTHERN AFRICA
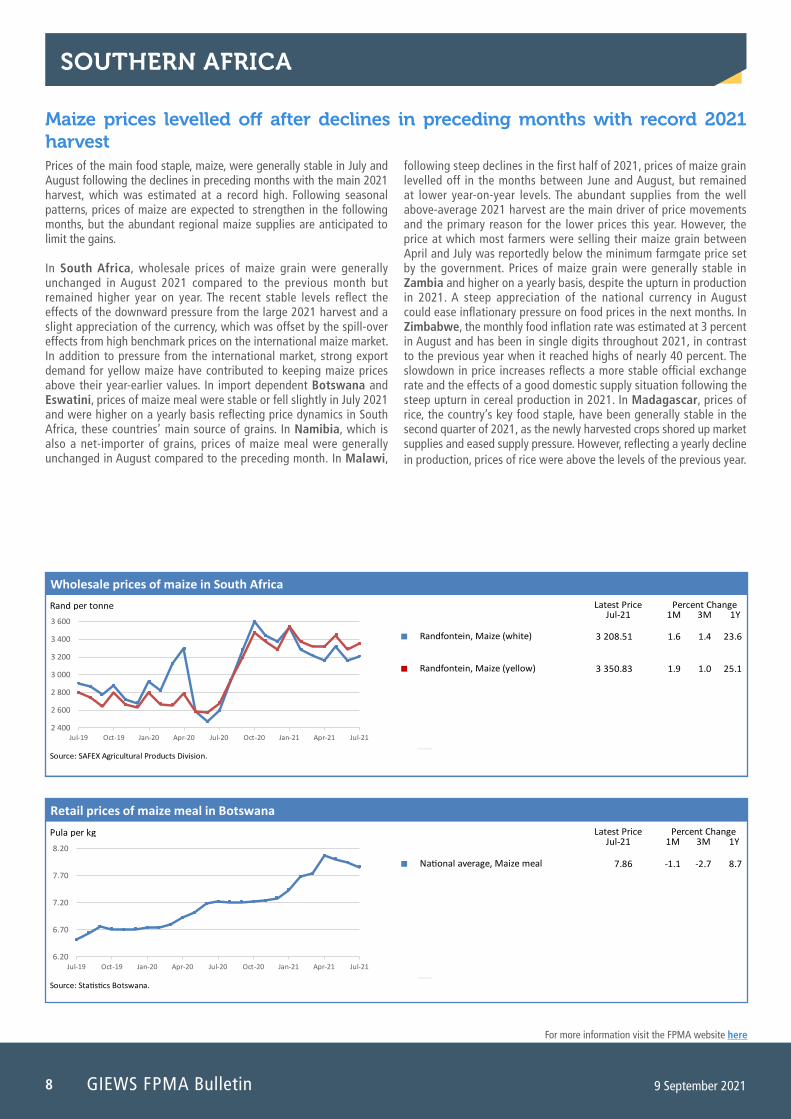
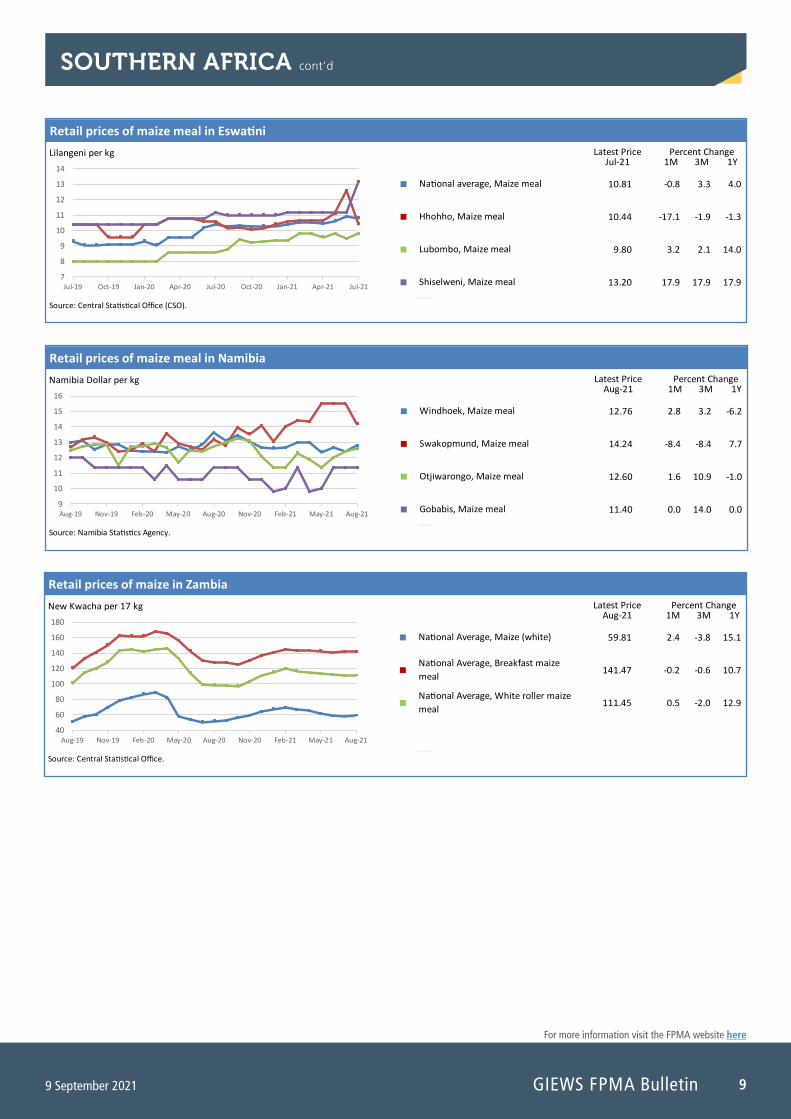
Maize prices levelled off after declines in preceding months with record 2021 harvest Prices of the main food staple, maize, were generally stable in July and August following the declines in preceding months with the main 2021 harvest, which was estimated at a record high. Following seasonal patterns, prices of maize are expected to strengthen in the following months, but the abundant regional maize supplies are anticipated to limit the gains.
In South Africa, wholesale prices of maize grain were generally unchanged in August 2021 compared to the previous month but remained higher year on year. The recent stable levels reflect the effects of the downward pressure from the large 2021 harvest and a slight appreciation of the currency, which was offset by the spill-over effects from high benchmark prices on the international maize market. In addition to pressure from the international market, strong export demand for yellow maize have contributed to keeping maize prices above their year-earlier values. In import dependent Botswana and Eswatini, prices of maize meal were stable or fell slightly in July 2021 and were higher on a yearly basis reflecting price dynamics in South Africa, these countries’ main source of grains. In Namibia, which is also a net-importer of grains, prices of maize meal were generally unchanged in August compared to the preceding month. In Malawi,
following steep declines in the first half of 2021, prices of maize grain levelled off in the months between June and August, but remained at lower year-on-year levels. The abundant supplies from the well above-average 2021 harvest are the main driver of price movements and the primary reason for the lower prices this year. However, the price at which most farmers were selling their maize grain between April and July was reportedly below the minimum farmgate price set by the government. Prices of maize grain were generally stable in Zambia and higher on a yearly basis, despite the upturn in production in 2021. A steep appreciation of the national currency in August could ease inflationary pressure on food prices in the next months. In Zimbabwe, the monthly food inflation rate was estimated at 3 percent in August and has been in single digits throughout 2021, in contrast to the previous year when it reached highs of nearly 40 percent. The slowdown in price increases reflects a more stable official exchange rate and the effects of a good domestic supply situation following the steep upturn in cereal production in 2021. In Madagascar, prices of rice, the country’s key food staple, have been generally stable in the second quarter of 2021, as the newly harvested crops shored up market supplies and eased supply pressure. However, reflecting a yearly decline in production, prices of rice were above the levels of the previous year.
Rand per tonne Latest PriceJul-21 1M 3M 1Y
3 208.51 1.6 1.4 23.6
3 350.83 1.9 1.0 25.1
Wholesale prices of maize in South Africa
Percent Change
Source: SAFEX Agricultural Products Division.
Randfontein, Maize (white)
Randfontein, Maize (yellow)
2 400
2 600
2 800
3 000
3 200
3 400
3 600
Jul-19 Oct-19 Jan-20 Apr-20 Jul-20 Oct-20 Jan-21 Apr-21 Jul-21
Pula per kg Latest PriceJul-21 1M 3M 1Y
7.86 -1.1 -2.7 8.7
Retail prices of maize meal in Botswana
Percent Change
Source: Statistics Botswana.
National average, Maize meal
6.20
6.70
7.20
7.70
8.20
Jul-19 Oct-19 Jan-20 Apr-20 Jul-20 Oct-20 Jan-21 Apr-21 Jul-21
9
For more information visit the FPMA website here
9 September 2021 GIEWS FPMA Bulletin
SOUTHERN AFRICA cont’d
New Kwacha per 17 kg Latest PriceAug-21 1M 3M 1Y
59.81 2.4 -3.8 15.1
141.47 -0.2 -0.6 10.7
111.45 0.5 -2.0 12.9
Retail prices of maize in Zambia
Percent Change
Source: Central Statistical Office.
National Average, Maize (white)
National Average, Breakfast maize meal
National Average, White roller maize meal
40
60
80
100
120
140
160
180
Aug-19 Nov-19 Feb-20 May-20 Aug-20 Nov-20 Feb-21 May-21 Aug-21
Lilangeni per kg Latest PriceJul-21 1M 3M 1Y
10.81 -0.8 3.3 4.0
10.44 -17.1 -1.9 -1.3
9.80 3.2 2.1 14.0
13.20 17.9 17.9 17.9
Retail prices of maize meal in Eswatini
Percent Change
Source: Central Statistical Office (CSO).
National average, Maize meal
Hhohho, Maize meal
Lubombo, Maize meal
Shiselweni, Maize meal 7
8
9
10
11
12
13
14
Jul-19 Oct-19 Jan-20 Apr-20 Jul-20 Oct-20 Jan-21 Apr-21 Jul-21
Namibia Dollar per kg Latest PriceAug-21 1M 3M 1Y
12.76 2.8 3.2 -6.2
14.24 -8.4 -8.4 7.7
12.60 1.6 10.9 -1.0
11.40 0.0 14.0 0.0
Retail prices of maize meal in Namibia
Percent Change
Source: Namibia Statistics Agency.
Windhoek, Maize meal
Swakopmund, Maize meal
Otjiwarongo, Maize meal
Gobabis, Maize meal 9
10
11
12
13
14
15
16
Aug-19 Nov-19 Feb-20 May-20 Aug-20 Nov-20 Feb-21 May-21 Aug-21

GIEWS FPMA Bulletin10 9 September 2021
For more information visit the FPMA website here
EAST AFRICA
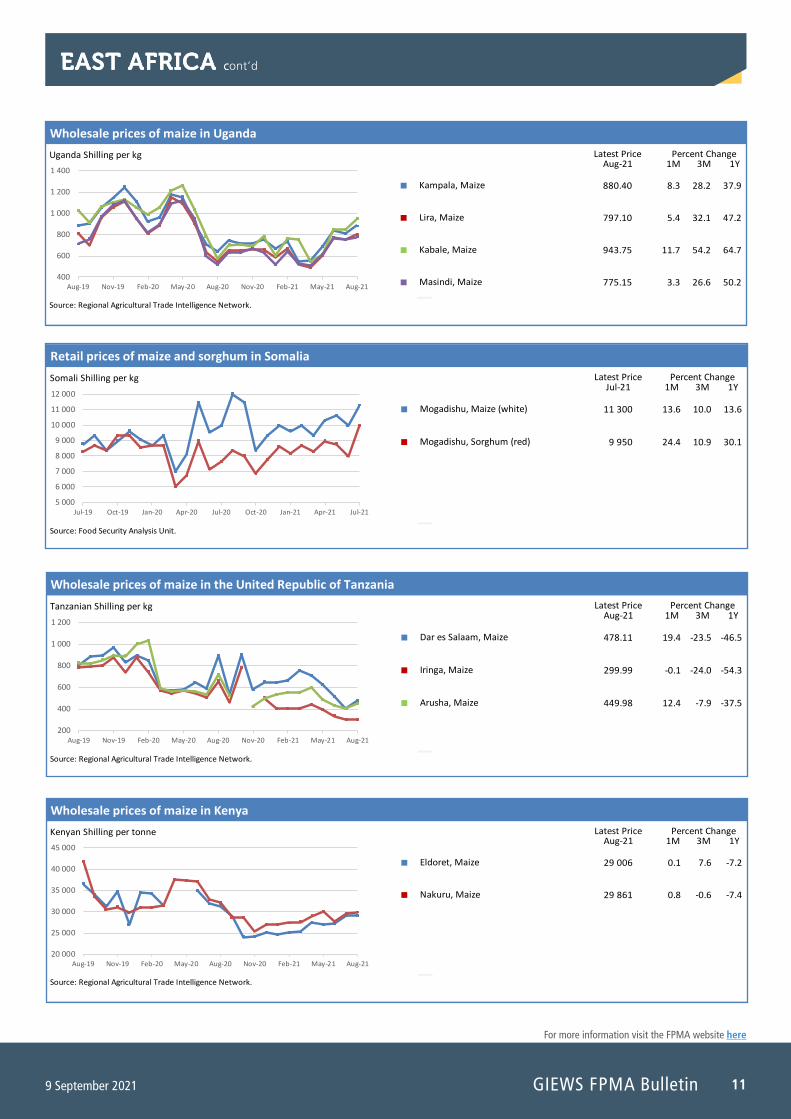
Prices of coarse grains generally increased in August and higher than one year earlier, with exceptionally high levels recorded in South Sudan and the Sudan Prices of coarse grains generally increased in August, either following seasonal patterns or unseasonally in the cases of Uganda and Somalia, where the first season and the “Gu” harvest, respectively, were reduced and did not result in a significant increase in market availabilities. Prices in August were higher than a year earlier in several countries, with exceptionally high levels recorded again in South Sudan and in the Sudan, reinforced by insufficient supplies and severe macro-economic difficulties, including currency weakness underpinning food inflation. Prices were higher year on year also in Uganda and Somalia due to reduced availabilities, and in Ethiopia, mainly due to macro-economic challenges. By contrast, prices were at low levels in Kenya and in the United Republic of Tanzania, due to adequate domestic availabilities.
In several markets of the Sudan, prices of sorghum and millet declined in August or continued to increase but at slower rates than in previous months, as traders released some of their stocks in anticipation of fresh supplies from the 2021 harvest. Prices in August were at near record to record levels, about twice their already elevated values a year earlier, mainly due to the difficult macro-economic situation, coupled with fuel shortages and high prices of agricultural inputs inflating production and transportation costs. In South Sudan, prices of sorghum and maize increased in August in the capital, Juba, after the South Sudanese pound depreciated on the parallel market in July, increasing import costs. August prices were at exceptionally high levels due to the lingering impact of the prolonged conflict and a weak currency. In Uganda, prices of maize unseasonally increased in August after having remained firm in July, as the recently completed first season harvest was estimated at below-average levels due to poor seasonal rains. Sustained exports to Kenya and South
Sudan exerted further upward pressure on prices, which in August were well above their levels of one year earlier, despite the reinstatement, in late June, of COVID-19-related movement restrictions which substantially depressed domestic demand. Similarly, in Somalia, prices of maize and sorghum unseasonally increased in July despite the start of the main “Gu” harvest, as cereal production is estimated at 30 to 40 percent below average due to erratic rains and insecurity. As a result of the recent increases, prices in July were higher than the already elevated values a year earlier. In the United Republic of Tanzania, prices of maize seasonally increased or levelled off in August after having substantially declined in previous months as the major “Msimu” harvest, concluded in July and estimated at above-average levels, increased market supplies. Prices in August were well below their year-earlier levels due to adequate domestic availabilities. In Ethiopia, prices of maize continued in July the increasing trend which began in early 2021, with seasonal patterns compounded by concerns for the performance of the secondary season “Belg” harvest, recently concluded with about a one-month delay and estimated at well below-average levels due to poor rains. Prices in July were well above their year-earlier levels mainly due to the continuous depreciation of the country’s currency, which has resulted in high prices of imported fuel and inputs inflating transportation and production costs. In Kenya, prices of maize remained mostly stable in August below or around their year-earlier values, despite the 2021 “long-rains” main harvest, accounting for the bulk of the aggregate cereal production and to be harvested from October, is forecast at 5 to 10 percent below average due to erratic rains. The stability and the low levels of prices are due to adequate domestic availabilities from the above-average 2020 cereal production and to sustained imports from Uganda and the United Republic of Tanzania.
South Sudanese Pound per 3.5 kg Latest PriceAug-21 1M 3M 1Y
1 314 15.2 -0.2 81.5
1 312 13.8 -2.7 82.7
Retail prices of maize and sorghum in South Sudan
Percent Change
Source: Crop and Livestock Market Information System (CLiMIS).
Juba, Maize (white)
Juba, Sorghum (Feterita)
200
400
600
800
1 000
1 200
1 400
1 600
Aug-19 Nov-19 Feb-20 May-20 Aug-20 Nov-20 Feb-21 May-21 Aug-21
Sudanese Pound per tonne Latest PriceAug-21 1M 3M 1Y
98 083 -6.3 24.5 54.7
177 826 19.7 26.0 104.2
138 325 3.9 25.2 80.5
117 333 4.9 24.3 75.3
Wholesale prices of sorghum and millet in the Sudan
Percent Change
Source: Food Security information for Action (SIFSIA).
El Gedarif, Sorghum (Feterita)
El Obeid, Millet
El Gedarif, Millet
El Obeid, Sorghum (Feterita) 0
50 000
100 000
150 000
200 000
Aug-19 Nov-19 Feb-20 May-20 Aug-20 Nov-20 Feb-21 May-21 Aug-21
11
For more information visit the FPMA website here
9 September 2021 GIEWS FPMA Bulletin
EAST AFRICA cont’dEAST AFRICA c
Uganda Shilling per kg Latest PriceAug-21 1M 3M 1Y
880.40 8.3 28.2 37.9
797.10 5.4 32.1 47.2
943.75 11.7 54.2 64.7
775.15 3.3 26.6 50.2
Wholesale prices of maize in Uganda
Percent Change
Source: Regional Agricultural Trade Intelligence Network.
Kampala, Maize
Lira, Maize
Kabale, Maize
Masindi, Maize 400
600
800
1 000
1 200
1 400
Aug-19 Nov-19 Feb-20 May-20 Aug-20 Nov-20 Feb-21 May-21 Aug-21
Somali Shilling per kg Latest PriceJul-21 1M 3M 1Y
11 300 13.6 10.0 13.6
9 950 24.4 10.9 30.1
Retail prices of maize and sorghum in Somalia
Percent Change
Source: Food Security Analysis Unit.
Mogadishu, Maize (white)
Mogadishu, Sorghum (red)
5 000
6 000
7 000
8 000
9 000
10 000
11 000
12 000
Jul-19 Oct-19 Jan-20 Apr-20 Jul-20 Oct-20 Jan-21 Apr-21 Jul-21
Tanzanian Shilling per kg Latest PriceAug-21 1M 3M 1Y
478.11 19.4 -23.5 -46.5
299.99 -0.1 -24.0 -54.3
449.98 12.4 -7.9 -37.5
Wholesale prices of maize in the United Republic of Tanzania
Percent Change
Source: Regional Agricultural Trade Intelligence Network.
Dar es Salaam, Maize
Iringa, Maize
Arusha, Maize
200
400
600
800
1 000
1 200
Aug-19 Nov-19 Feb-20 May-20 Aug-20 Nov-20 Feb-21 May-21 Aug-21
Kenyan Shilling per tonne Latest PriceAug-21 1M 3M 1Y
29 006 0.1 7.6 -7.2
29 861 0.8 -0.6 -7.4
Wholesale prices of maize in Kenya
Percent Change
Source: Regional Agricultural Trade Intelligence Network.
Eldoret, Maize
Nakuru, Maize
20 000
25 000
30 000
35 000
40 000
45 000
Aug-19 Nov-19 Feb-20 May-20 Aug-20 Nov-20 Feb-21 May-21 Aug-21
GIEWS FPMA Bulletin12 9 September 2021
For more information visit the FPMA website here
EAST ASIA
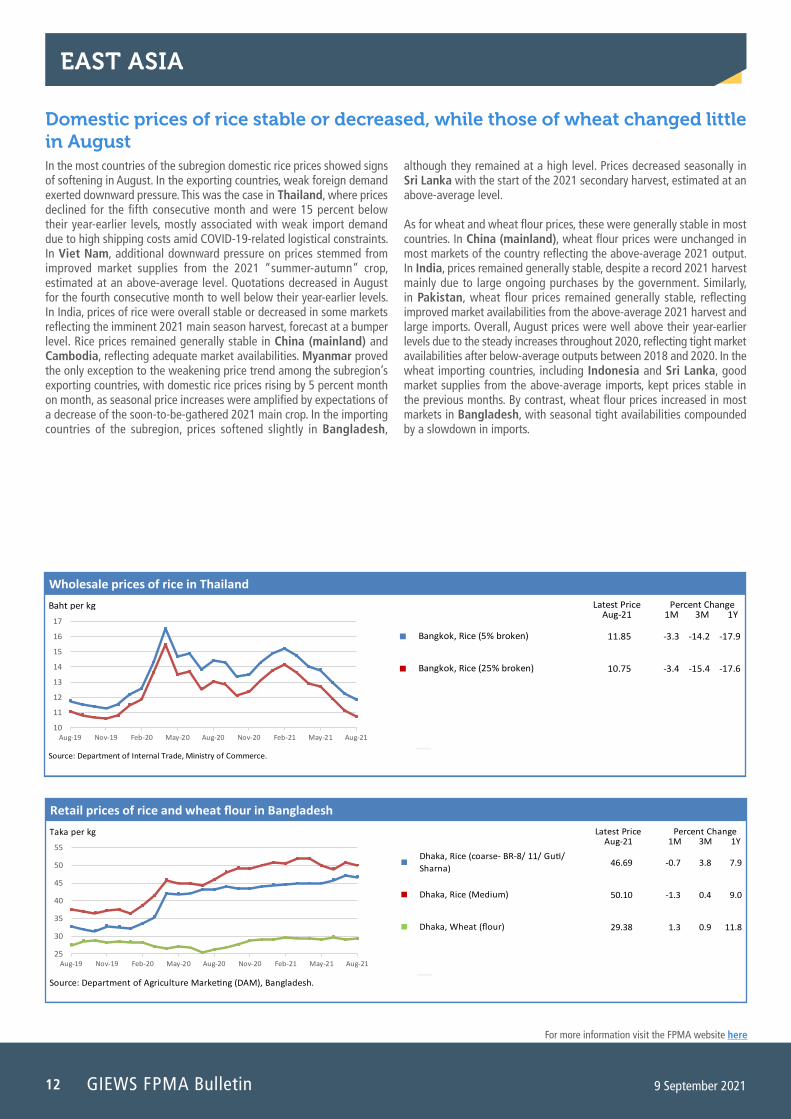
Domestic prices of rice stable or decreased, while those of wheat changed little in August In the most countries of the subregion domestic rice prices showed signs of softening in August. In the exporting countries, weak foreign demand exerted downward pressure. This was the case in Thailand, where prices declined for the fifth consecutive month and were 15 percent below their year-earlier levels, mostly associated with weak import demand due to high shipping costs amid COVID-19-related logistical constraints. In Viet Nam, additional downward pressure on prices stemmed from improved market supplies from the 2021 “summer-autumn” crop, estimated at an above-average level. Quotations decreased in August for the fourth consecutive month to well below their year-earlier levels. In India, prices of rice were overall stable or decreased in some markets reflecting the imminent 2021 main season harvest, forecast at a bumper level. Rice prices remained generally stable in China (mainland) and Cambodia, reflecting adequate market availabilities. Myanmar proved the only exception to the weakening price trend among the subregion’s exporting countries, with domestic rice prices rising by 5 percent month on month, as seasonal price increases were amplified by expectations of a decrease of the soon-to-be-gathered 2021 main crop. In the importing countries of the subregion, prices softened slightly in Bangladesh,
although they remained at a high level. Prices decreased seasonally in Sri Lanka with the start of the 2021 secondary harvest, estimated at an above-average level.
As for wheat and wheat flour prices, these were generally stable in most countries. In China (mainland), wheat flour prices were unchanged in most markets of the country reflecting the above-average 2021 output. In India, prices remained generally stable, despite a record 2021 harvest mainly due to large ongoing purchases by the government. Similarly, in Pakistan, wheat flour prices remained generally stable, reflecting improved market availabilities from the above-average 2021 harvest and large imports. Overall, August prices were well above their year-earlier levels due to the steady increases throughout 2020, reflecting tight market availabilities after below-average outputs between 2018 and 2020. In the wheat importing countries, including Indonesia and Sri Lanka, good market supplies from the above-average imports, kept prices stable in the previous months. By contrast, wheat flour prices increased in most markets in Bangladesh, with seasonal tight availabilities compounded by a slowdown in imports.
Baht per kg Latest PriceAug-21 1M 3M 1Y
11.85 -3.3 -14.2 -17.9
10.75 -3.4 -15.4 -17.6
Wholesale prices of rice in Thailand
Percent Change
Source: Department of Internal Trade, Ministry of Commerce.
Bangkok, Rice (5% broken)
Bangkok, Rice (25% broken)
10
11
12
13
14
15
16
17
Aug-19 Nov-19 Feb-20 May-20 Aug-20 Nov-20 Feb-21 May-21 Aug-21
Taka per kg Latest PriceAug-21 1M 3M 1Y
46.69 -0.7 3.8 7.9
50.10 -1.3 0.4 9.0
29.38 1.3 0.9 11.8
Retail prices of rice and wheat flour in Bangladesh
Percent Change
Source: Department of Agriculture Marketing (DAM), Bangladesh.
Dhaka, Rice (coarse- BR-8/ 11/ Guti/ Sharna)
Dhaka, Rice (Medium)
Dhaka, Wheat (flour)
25
30
35
40
45
50
55
Aug-19 Nov-19 Feb-20 May-20 Aug-20 Nov-20 Feb-21 May-21 Aug-21

13
For more information visit the FPMA website here
9 September 2021 GIEWS FPMA Bulletin
EAST ASIA cont’d
Sri Lanka Rupee per kg Latest PriceAug-21 1M 3M 1Y
106.63 -4.6 -4.0 10.8
95.30 -0.2 2.8 3.1
Retail prices of rice and wheat flour in Sri Lanka
Percent Change
Source: Department of Census and Statistics.
Colombo, Rice (white)
Colombo, Wheat (flour)
85
90
95
100
105
110
115
Aug-19 Nov-19 Feb-20 May-20 Aug-20 Nov-20 Feb-21 May-21 Aug-21
Yuan Renminbi per tonne Latest PriceAug-21 1M 3M 1Y
2 596 0.5 3.0 9.5
2 554 -0.7 0.1 8.7
2 598 0.3 1.1 7.6
2 580 0.6 2.4 6.0
Wholesale prices of wheat in China (mainland)
Percent Change
Source: CnAgri - China Agriculture Consultant.
Zhengzhou, Wheat
Linyi, Wheat
National Average, Wheat
Sijiazhuang, Wheat2 200
2 250
2 300
2 350
2 400
2 450
2 500
2 550
2 600
Aug-19 Nov-19 Feb-20 May-20 Aug-20 Nov-20 Feb-21 May-21 Aug-21
Pakistan Rupee per kg Latest PriceAug-21 1M 3M 1Y
62.78 1.5 -2.6 -7.2
55.01 1.0 3.7 27.9
56.33 1.3 5.8 2.6
53.57 -0.2 0.7 24.6
Retail prices of wheat flour in Pakistan
Percent Change
Source: Pakistan Bureau of Statistics.
Karachi, Wheat (flour)
Lahore, Wheat (flour)
Peshawar, Wheat (flour)
Multan, Wheat (flour) 35
40
45
50
55
60
65
70
75
Aug-19 Nov-19 Feb-20 May-20 Aug-20 Nov-20 Feb-21 May-21 Aug-21
Indian Rupee per tonne Latest PriceAug-21 1M 3M 1Y
30 000 0.0 -1.2 10.1
19 160 4.5 1.4 2.1
Wholesale prices of wheat in India
Percent Change
Source: Ministry of Consumer Affairs.
Mumbai, Wheat
New Delhi, Wheat
14 000
19 000
24 000
29 000
34 000
Aug-19 Nov-19 Feb-20 May-20 Aug-20 Nov-20 Feb-21 May-21 Aug-21
GIEWS FPMA Bulletin14 9 September 2021
For more information visit the FPMA website here
CIS - ASIA AND EUROPE
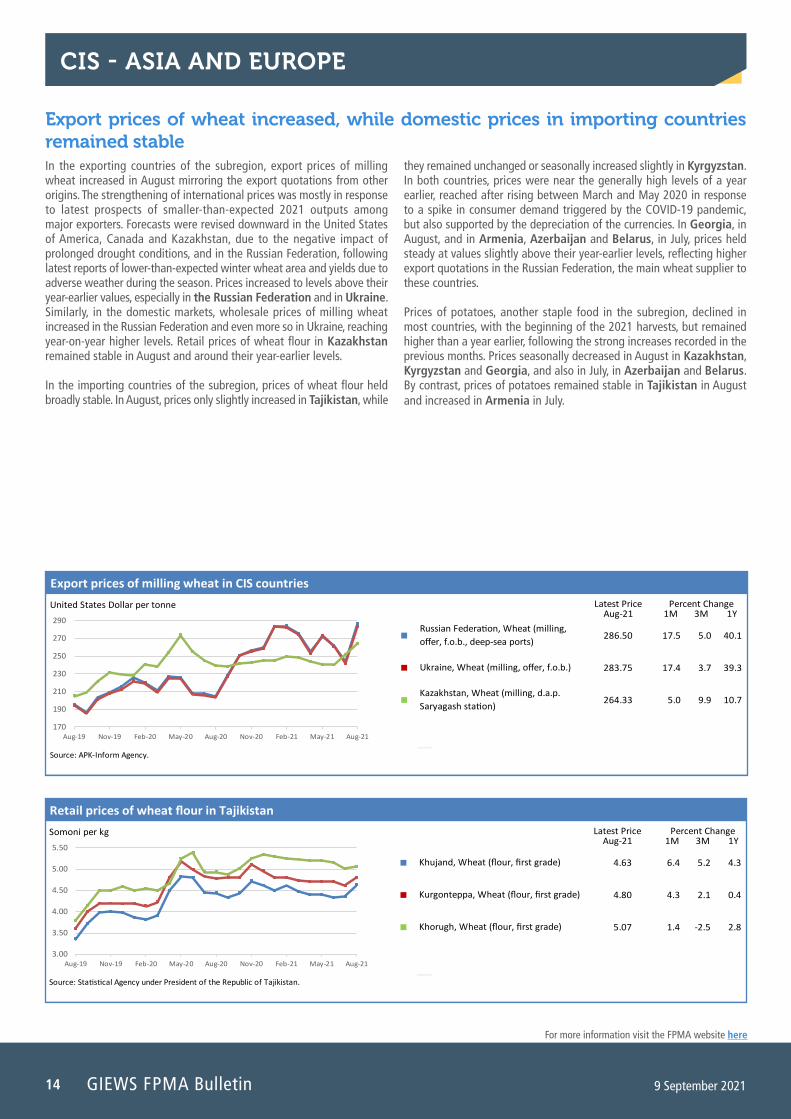
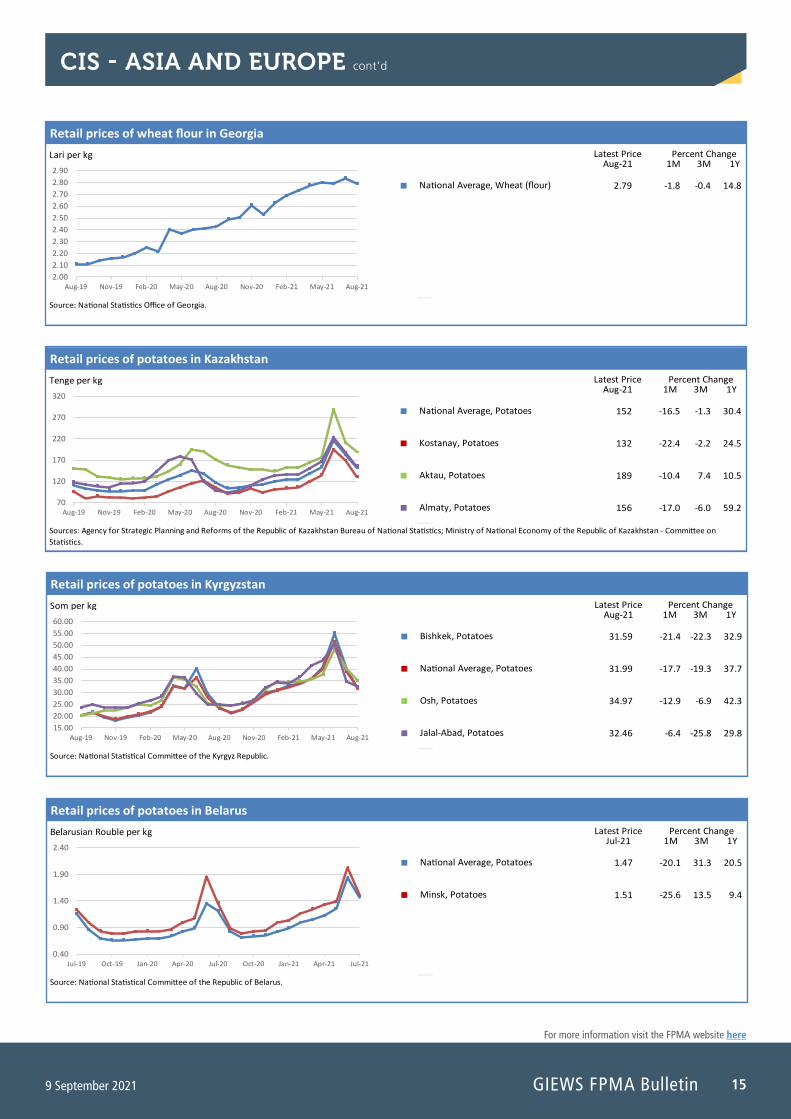
Export prices of wheat increased, while domestic prices in importing countries remained stable In the exporting countries of the subregion, export prices of milling wheat increased in August mirroring the export quotations from other origins. The strengthening of international prices was mostly in response to latest prospects of smaller-than-expected 2021 outputs among major exporters. Forecasts were revised downward in the United States of America, Canada and Kazakhstan, due to the negative impact of prolonged drought conditions, and in the Russian Federation, following latest reports of lower-than-expected winter wheat area and yields due to adverse weather during the season. Prices increased to levels above their year-earlier values, especially in the Russian Federation and in Ukraine. Similarly, in the domestic markets, wholesale prices of milling wheat increased in the Russian Federation and even more so in Ukraine, reaching year-on-year higher levels. Retail prices of wheat flour in Kazakhstan remained stable in August and around their year-earlier levels.
In the importing countries of the subregion, prices of wheat flour held broadly stable. In August, prices only slightly increased in Tajikistan, while
they remained unchanged or seasonally increased slightly in Kyrgyzstan. In both countries, prices were near the generally high levels of a year earlier, reached after rising between March and May 2020 in response to a spike in consumer demand triggered by the COVID-19 pandemic, but also supported by the depreciation of the currencies. In Georgia, in August, and in Armenia, Azerbaijan and Belarus, in July, prices held steady at values slightly above their year-earlier levels, reflecting higher export quotations in the Russian Federation, the main wheat supplier to these countries.
Prices of potatoes, another staple food in the subregion, declined in most countries, with the beginning of the 2021 harvests, but remained higher than a year earlier, following the strong increases recorded in the previous months. Prices seasonally decreased in August in Kazakhstan, Kyrgyzstan and Georgia, and also in July, in Azerbaijan and Belarus. By contrast, prices of potatoes remained stable in Tajikistan in August and increased in Armenia in July.
Somoni per kg Latest PriceAug-21 1M 3M 1Y
4.63 6.4 5.2 4.3
4.80 4.3 2.1 0.4
5.07 1.4 -2.5 2.8
Retail prices of wheat flour in Tajikistan
Percent Change
Source: Statistical Agency under President of the Republic of Tajikistan.
Khujand, Wheat (flour, first grade)
Kurgonteppa, Wheat (flour, first grade)
Khorugh, Wheat (flour, first grade)
3.00
3.50
4.00
4.50
5.00
5.50
Aug-19 Nov-19 Feb-20 May-20 Aug-20 Nov-20 Feb-21 May-21 Aug-21
United States Dollar per tonne Latest PriceAug-21 1M 3M 1Y
286.50 17.5 5.0 40.1
283.75 17.4 3.7 39.3
264.33 5.0 9.9 10.7
Export prices of milling wheat in CIS countries
Percent Change
Source: APK-Inform Agency.
Russian Federation, Wheat (milling, offer, f.o.b., deep-sea ports)
Ukraine, Wheat (milling, offer, f.o.b.)
Kazakhstan, Wheat (milling, d.a.p. Saryagash station)
170
190
210
230
250
270
290
Aug-19 Nov-19 Feb-20 May-20 Aug-20 Nov-20 Feb-21 May-21 Aug-21
15
For more information visit the FPMA website here
9 September 2021 GIEWS FPMA Bulletin
CIS - ASIA AND EUROPE cont’d
Lari per kg Latest PriceAug-21 1M 3M 1Y
2.79 -1.8 -0.4 14.8
Retail prices of wheat flour in Georgia
Percent Change
Source: National Statistics Office of Georgia.
National Average, Wheat (flour)
2.00 2.10 2.20 2.30 2.40 2.50 2.60 2.70 2.80 2.90
Aug-19 Nov-19 Feb-20 May-20 Aug-20 Nov-20 Feb-21 May-21 Aug-21
Tenge per kg Latest PriceAug-21 1M 3M 1Y
152 -16.5 -1.3 30.4
132 -22.4 -2.2 24.5
189 -10.4 7.4 10.5
156 -17.0 -6.0 59.2
Retail prices of potatoes in Kazakhstan
Percent Change
Sources: Agency for Strategic Planning and Reforms of the Republic of Kazakhstan Bureau of National Statistics; Ministry of National Economy of the Republic of Kazakhstan - Committee on Statistics.
National Average, Potatoes
Kostanay, Potatoes
Aktau, Potatoes
Almaty, Potatoes 70
120
170
220
270
320
Aug-19 Nov-19 Feb-20 May-20 Aug-20 Nov-20 Feb-21 May-21 Aug-21
Som per kg Latest PriceAug-21 1M 3M 1Y
31.59 -21.4 -22.3 32.9
31.99 -17.7 -19.3 37.7
34.97 -12.9 -6.9 42.3
32.46 -6.4 -25.8 29.8
Retail prices of potatoes in Kyrgyzstan
Percent Change
Source: National Statistical Committee of the Kyrgyz Republic.
Bishkek, Potatoes
National Average, Potatoes
Osh, Potatoes
Jalal-Abad, Potatoes 15.00 20.00 25.00 30.00 35.00 40.00 45.00 50.00 55.00 60.00
Aug-19 Nov-19 Feb-20 May-20 Aug-20 Nov-20 Feb-21 May-21 Aug-21
Belarusian Rouble per kg Latest PriceJul-21 1M 3M 1Y
1.47 -20.1 31.3 20.5
1.51 -25.6 13.5 9.4
Retail prices of potatoes in Belarus
Percent Change
Source: National Statistical Committee of the Republic of Belarus.
National Average, Potatoes
Minsk, Potatoes
0.40
0.90
1.40
1.90
2.40
Jul-19 Oct-19 Jan-20 Apr-20 Jul-20 Oct-20 Jan-21 Apr-21 Jul-21

GIEWS FPMA Bulletin16 9 September 2021
For more information visit the FPMA website here
CENTRAL AMERICA AND THE CARIBBEAN
Prices of maize increased seasonally and higher year on year In the subregion, the harvest of 2021 main season maize crops started in end-August and prices generally increased in the July-August period in line with seasonal trends. Production is expected at average to slightly below-average level as yields were affected by a delayed start of seasonal rains and subsequent torrential rains in August. In Guatemala and Nicaragua, after a sharp increase in July, prices were stable or strengthened modestly in August. In Guatemala, new crops have increased market availabilities since mid-August, although the quality of the grain is reported to be less than ideal due to its high moisture content. In El Salvador and Honduras, prices increased in July and August reflecting seasonal tight supplies, exacerbated by concerns over the impact of unfavourable weather conditions on crop yields. In El Salvador, the strengthening of prices was somewhat limited by improved access to maize following the government’s food assistance programmes. As of August 2021, prices of white maize were higher year on year across the subregion except in Honduras. In Mexico, prices were kept steady or decreased in the July-August period due to improved market availabilities from the minor harvest completed in July as well as larger imports in the second quarter of 2021 compared to a year earlier. However, prices were well above their year-earlier levels following sustained increases in the first half of the year, supported by upward trends in international markets and high production costs. High prices of maize grains contributed to the sharp increases in prices of staple maize tortilla in retail markets, which were more than 30 percent higher year on year in August.
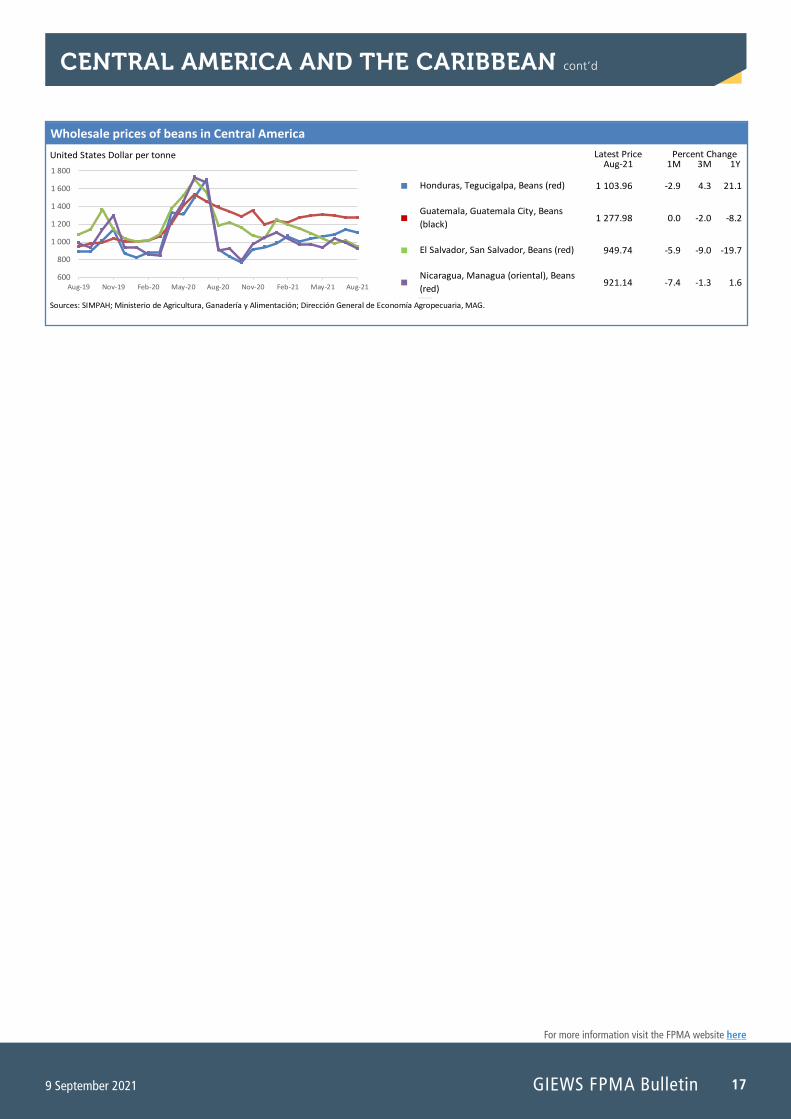
With regard to beans, the harvest of the minor season crops and planting of the main season crops are about to begin in September. Prices were stable or decreased in the July-August period reflecting adequate market availabilities and weaker year-on-year retail demand. Prices of black beans were stable in Guatemala on account of ample carryover stocks, and in Mexico driven by large year-on-year imports during the first half of 2021. In these countries, prices were lower than
a year earlier, when they were still at high levels following the upsurge in retail demand amid the first wave of the COVID-19 pandemic. In El Salvador, Honduras and Nicaragua, prices of red beans overall decreased in August, as the upward seasonal pressure was limited by adequate carryover stocks from the 2020 harvests. As of August 2021, while prices were about 20 percent below their high year-earlier levels in El Salvador, they were higher year on year in Honduras and Nicaragua.
In the Caribbean, retail prices of red beans were stable in July and August with the ongoing harvest and remained higher year on year in the Dominican Republic. The elevated price level reflects the sustained increases in the second half of 2020, when dry conditions affected the output. Retail prices of black beans strengthened marginally in August as concerns over the impact of dry conditions on the rest of 2021 crops have more than offset the downward pressure from the ongoing harvest. Prices of rice continued to rise in August and reached 10 percent above their year-earlier levels in August, supported by high production costs.
In Haiti, prices of maize meal overall declined in July as the harvest of the main “printemps” season crops increased market supplies. Prices of black beans also decreased in departments of Centre and Sud-Est with the ongoing harvest, although prices strengthened in other areas. Prices of rice, mostly imported, continued to rise in July, following the weakening of the currency. Additional upward pressure was exerted by lower imports during the first five months of 2021 compared to the same period in 2020. The volatile insecurity and socio-political situation have resulted in disruptions of market and trade activities, including road blockage, with negative effects on access to food. Although the August price data are not yet available, damages to infrastructure and market facilities caused by the 7.2-magnitude earthquake and tropical storm Grace are likely to exacerbate the increases in food prices in the affected southwestern region.
United States Dollar per tonne Latest PriceAug-21 1M 3M 1Y
500.50 -0.1 22.2 20.5
385.00 3.9 11.0 8.0
399.74 7.3 24.4 2.1
473.22 1.8 57.9 37.9
Wholesale prices of white maize in Central America
Percent Change
Sources: Ministerio de Agricultura, Ganadería y Alimentación; Dirección General de Economía Agropecuaria, MAG; SIMPAH.
Guatemala, Guatemala City, Maize (white)
El Salvador, San Salvador, Maize (white)
Honduras, Tegucigalpa, Maize (white)
Nicaragua, Managua (oriental), Maize (white)
250
300
350
400
450
500
550
Aug-19 Nov-19 Feb-20 May-20 Aug-20 Nov-20 Feb-21 May-21 Aug-21
17
For more information visit the FPMA website here
9 September 2021 GIEWS FPMA Bulletin
United States Dollar per tonne Latest PriceAug-21 1M 3M 1Y
1 103.96 -2.9 4.3 21.1
1 277.98 0.0 -2.0 -8.2
949.74 -5.9 -9.0 -19.7
921.14 -7.4 -1.3 1.6
Wholesale prices of beans in Central America
Percent Change
Sources: SIMPAH; Ministerio de Agricultura, Ganadería y Alimentación; Dirección General de Economía Agropecuaria, MAG.
Honduras, Tegucigalpa, Beans (red)
Guatemala, Guatemala City, Beans (black)
El Salvador, San Salvador, Beans (red)
Nicaragua, Managua (oriental), Beans (red)
600
800
1 000
1 200
1 400
1 600
1 800
Aug-19 Nov-19 Feb-20 May-20 Aug-20 Nov-20 Feb-21 May-21 Aug-21
CENTRAL AMERICA AND THE CARIBBEAN cont’d
GIEWS FPMA Bulletin18 9 September 2021
For more information visit the FPMA website here
SOUTH AMERICA
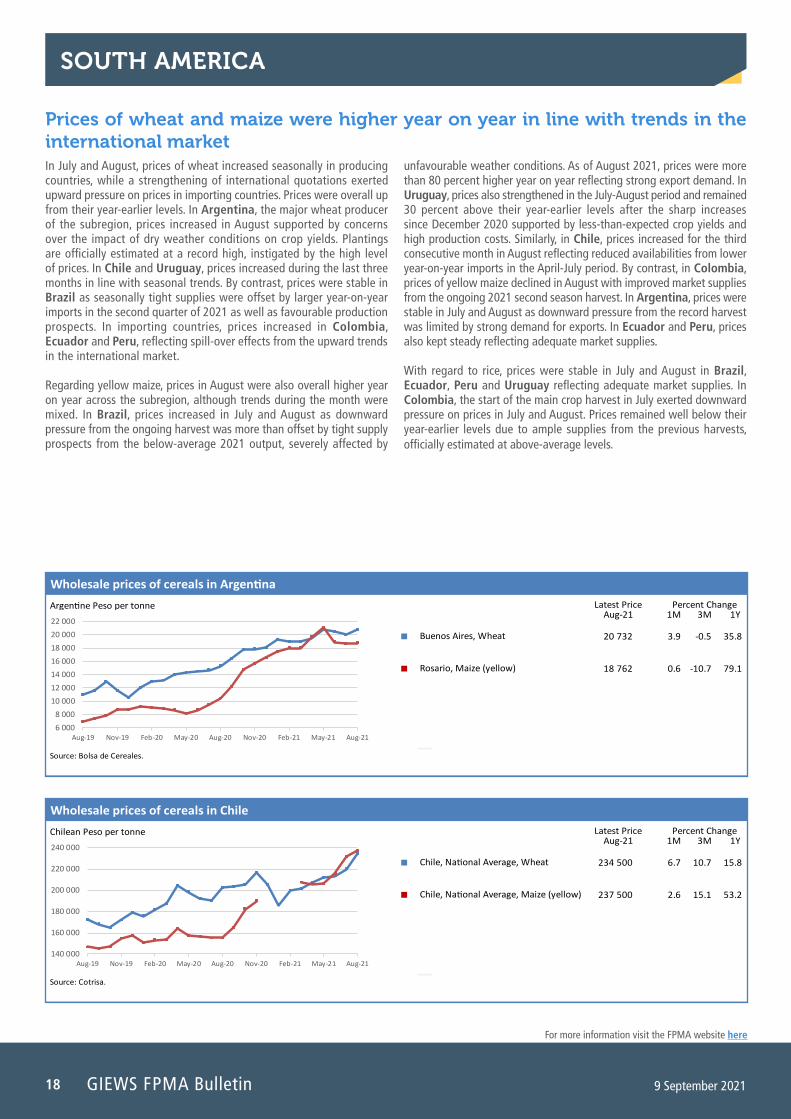
Prices of wheat and maize were higher year on year in line with trends in the international market In July and August, prices of wheat increased seasonally in producing countries, while a strengthening of international quotations exerted upward pressure on prices in importing countries. Prices were overall up from their year-earlier levels. In Argentina, the major wheat producer of the subregion, prices increased in August supported by concerns over the impact of dry weather conditions on crop yields. Plantings are officially estimated at a record high, instigated by the high level of prices. In Chile and Uruguay, prices increased during the last three months in line with seasonal trends. By contrast, prices were stable in Brazil as seasonally tight supplies were offset by larger year-on-year imports in the second quarter of 2021 as well as favourable production prospects. In importing countries, prices increased in Colombia, Ecuador and Peru, reflecting spill-over effects from the upward trends in the international market.
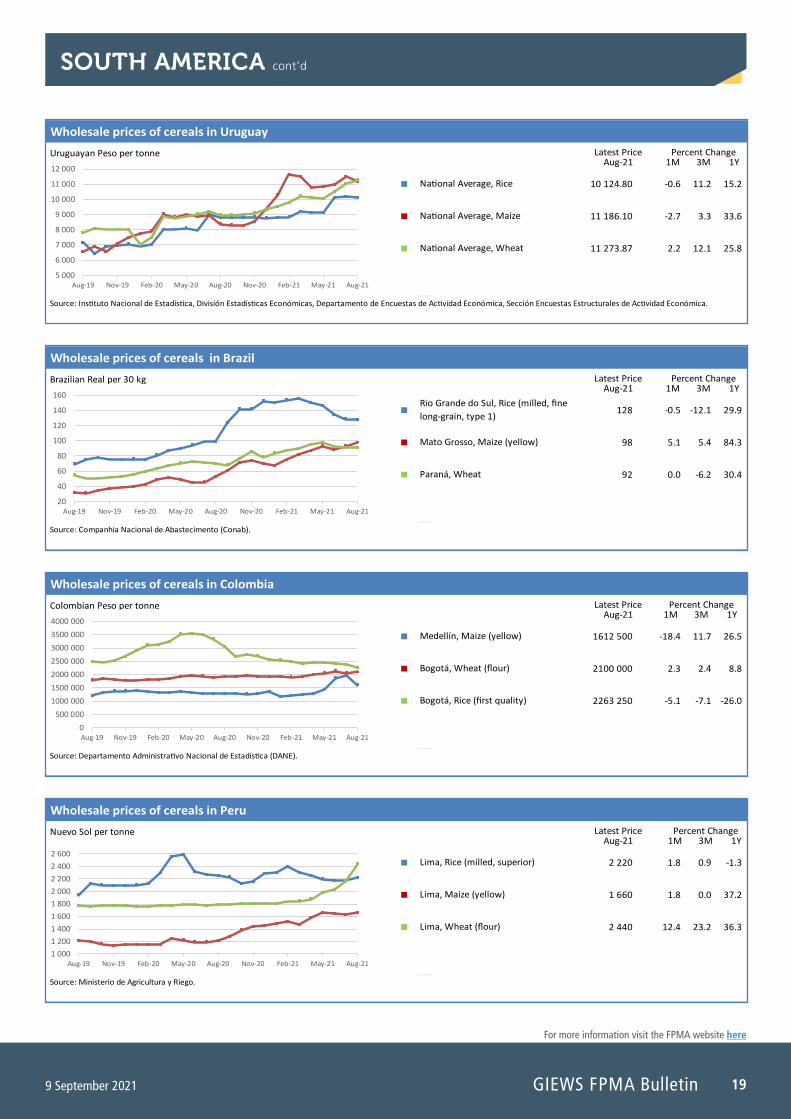
Regarding yellow maize, prices in August were also overall higher year on year across the subregion, although trends during the month were mixed. In Brazil, prices increased in July and August as downward pressure from the ongoing harvest was more than offset by tight supply prospects from the below-average 2021 output, severely affected by
unfavourable weather conditions. As of August 2021, prices were more than 80 percent higher year on year reflecting strong export demand. In Uruguay, prices also strengthened in the July-August period and remained 30 percent above their year-earlier levels after the sharp increases since December 2020 supported by less-than-expected crop yields and high production costs. Similarly, in Chile, prices increased for the third consecutive month in August reflecting reduced availabilities from lower year-on-year imports in the April-July period. By contrast, in Colombia, prices of yellow maize declined in August with improved market supplies from the ongoing 2021 second season harvest. In Argentina, prices were stable in July and August as downward pressure from the record harvest was limited by strong demand for exports. In Ecuador and Peru, prices also kept steady reflecting adequate market supplies.
With regard to rice, prices were stable in July and August in Brazil, Ecuador, Peru and Uruguay reflecting adequate market supplies. In Colombia, the start of the main crop harvest in July exerted downward pressure on prices in July and August. Prices remained well below their year-earlier levels due to ample supplies from the previous harvests, officially estimated at above-average levels.
Argentine Peso per tonne Latest PriceAug-21 1M 3M 1Y
20 732 3.9 -0.5 35.8
18 762 0.6 -10.7 79.1
Wholesale prices of cereals in Argentina
Percent Change
Source: Bolsa de Cereales.
Buenos Aires, Wheat
Rosario, Maize (yellow)
6 000
8 000
10 000
12 000
14 000
16 000
18 000
20 000
22 000
Aug-19 Nov-19 Feb-20 May-20 Aug-20 Nov-20 Feb-21 May-21 Aug-21
Chilean Peso per tonne Latest PriceAug-21 1M 3M 1Y
234 500 6.7 10.7 15.8
237 500 2.6 15.1 53.2
Wholesale prices of cereals in Chile
Percent Change
Source: Cotrisa.
Chile, National Average, Wheat
Chile, National Average, Maize (yellow)
140 000
160 000
180 000
200 000
220 000
240 000
Aug-19 Nov-19 Feb-20 May-20 Aug-20 Nov-20 Feb-21 May-21 Aug-21
19
For more information visit the FPMA website here
9 September 2021 GIEWS FPMA Bulletin
SOUTH AMERICA cont’d
Uruguayan Peso per tonne Latest PriceAug-21 1M 3M 1Y
10 124.80 -0.6 11.2 15.2
11 186.10 -2.7 3.3 33.6
11 273.87 2.2 12.1 25.8
Wholesale prices of cereals in Uruguay
Percent Change
Source: Instituto Nacional de Estadística, División Estadísticas Económicas, Departamento de Encuestas de Actividad Económica, Sección Encuestas Estructurales de Actividad Económica.
National Average, Rice
National Average, Maize
National Average, Wheat
5 000
6 000
7 000
8 000
9 000
10 000
11 000
12 000
Aug-19 Nov-19 Feb-20 May-20 Aug-20 Nov-20 Feb-21 May-21 Aug-21
Brazilian Real per 30 kg Latest PriceAug-21 1M 3M 1Y
128 -0.5 -12.1 29.9
98 5.1 5.4 84.3
92 0.0 -6.2 30.4
Wholesale prices of cereals in Brazil
Percent Change
Source: Companhia Nacional de Abastecimento (Conab).
Rio Grande do Sul, Rice (milled, fine long-grain, type 1)
Mato Grosso, Maize (yellow)
Paraná, Wheat
20
40
60
80
100
120
140
160
Aug-19 Nov-19 Feb-20 May-20 Aug-20 Nov-20 Feb-21 May-21 Aug-21
Colombian Peso per tonne Latest PriceAug-21 1M 3M 1Y
1612 500 -18.4 11.7 26.5
2100 000 2.3 2.4 8.8
2263 250 -5.1 -7.1 -26.0
Wholesale prices of cereals in Colombia
Percent Change
Source: Departamento Administrativo Nacional de Estadística (DANE).
Medellín, Maize (yellow)
Bogotá, Wheat (flour)
Bogotá, Rice (first quality)
0
500 000
1000 000
1500 000
2000 000
2500 000
3000 000
3500 000
4000 000
Aug-19 Nov-19 Feb-20 May-20 Aug-20 Nov-20 Feb-21 May-21 Aug-21
Nuevo Sol per tonne Latest PriceAug-21 1M 3M 1Y
2 220 1.8 0.9 -1.3
1 660 1.8 0.0 37.2
2 440 12.4 23.2 36.3
Wholesale prices of cereals in Peru
Percent Change
Source: Ministerio de Agricultura y Riego.
Lima, Rice (milled, superior)
Lima, Maize (yellow)
Lima, Wheat (flour)
1 000
1 200
1 400
1 600
1 800
2 000
2 200
2 400
2 600
Aug-19 Nov-19 Feb-20 May-20 Aug-20 Nov-20 Feb-21 May-21 Aug-21
This bulletin was prepared by the Food Price Monitoring and Analysis (FPMA) Team of the Global Information and Early Warning System on Food and Agriculture (GIEWS) in the Markets and Trade Division of FAO. It contains latest information and analysis on domestic prices of basic foods mainly in developing countries, complementing FAO analysis on international markets. It provides early warning on high food prices at country level that may negatively affect food security.
This report is based on information available up to early September 2021, collected from various sources.
All the data used in the analysis can be found in the FPMA Tool at: https://fpma.apps.fao.org/giews/food-prices/tool/public/#/home.
For more information visit the FPMA Website at: www.fao.org/giews/food-prices.
Enquiries may be directed to:GIEWS Food Price Monitoring and Analysis (FPMA) TeamMarkets and Trade - Economic and Social [email protected]
Food and Agriculture Organization of the United Nations (FAO)Rome, Italy
The Global Information and Early Warning System on Food and Agriculture (GIEWS) has set up a mailing list to disseminate its reports. To subscribe, submit the Registration Form on the following link: http://newsletters.fao.org/k/Fao/markets_and_trade_english_giews_world.
CB6677EN/1/09.21GIEWS FPMA Bulletin | 9 September 2021
The designations employed and the presentation of material in this information product do not imply the expression of any opinion whatsoever on the part of the Food and Agriculture Organization of the United Nations (FAO) concerning the legal or development status of any country, territory, city or area or of its authorities, or concerning the delimitation of its frontiers or boundaries. Dashed lines on maps represent approximate border lines for which there may not yet be full agreement. The mention of specific companies or products of manufacturers, whether or not these have been patented, does not imply that these have been endorsed or recommended by FAO in preference to others of a similar nature that are not mentioned.
The views expressed in this information product are those of the author(s) and do not necessarily reflect the views or policies of FAO.
ISSN 2707-1952 [Print]ISSN 2707-1960 [Online]
© FAO, 2021
Some rights reserved. This work is made available under the Creative Commons Attribution-NonCommercial-ShareAlike 3.0 IGO licence (CC BY-NC-SA 3.0 IGO; https://creativecommons.org/licenses/by-nc-sa/3.0/igo/legalcode).
Under the terms of this licence, this work may be copied, redistributed and adapted for non-commercial purposes, provided that the work is appropriately cited. In any use of this work, there should be no suggestion that FAO endorses any specific organization, products or services. The use of the FAO logo is not permitted. If the work is adapted, then it must be licensed under the same or equivalent Creative Commons licence. If a translation of this work is created, it must include the following disclaimer along with the required citation: “This translation was not created by the Food and Agriculture Organization of the United Nations (FAO). FAO is not responsible for the content or accuracy of this translation. The original [Language] edition shall be the authoritative edition.
Disputes arising under the licence that cannot be settled amicably will be resolved by mediation and arbitration as described in Article 8 of the licence except as otherwise provided herein. The applicable mediation rules will be the mediation rules of the World Intellectual Property Organization http://www.wipo.int/amc/en/mediation/rules and any arbitration will be in accordance with the Arbitration Rules of the United Nations Commission on International Trade Law (UNCITRAL).
Third‑party materials. Users wishing to reuse material from this work that is attributed to a third party, such as tables, figures or images, are responsible for determining whether permission is needed for that reuse and for obtaining permission from the copyright holder. The risk of claims resulting from infringement of any third-party-owned component in the work rests solely with the user.
Sales, rights and licensing. FAO information products are available on the FAO website (www.fao.org/publications) and can be purchased through publications‑[email protected]. Requests for commercial use should be submitted via: www.fao.org/contact-us/licence-request. Queries regarding rights and licensing should be submitted to: [email protected].