Embed Size (px)
DESCRIPTION
Cermets
Citation preview
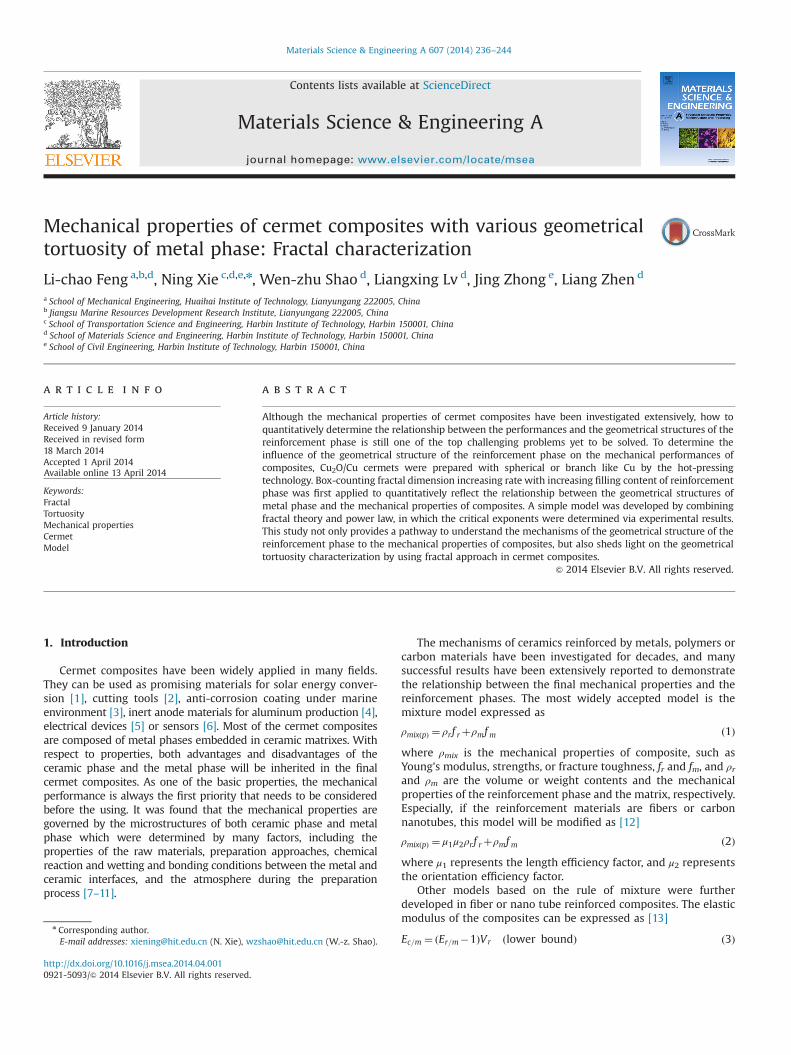
Mechanical properties of cermet composites with various geometricaltortuosity of metal phase: Fractal characterization
Li-chao Feng a,b,d, Ning Xie c,d,e,n, Wen-zhu Shao d, Liangxing Lv d, Jing Zhong e, Liang Zhen d
a School of Mechanical Engineering, Huaihai Institute of Technology, Lianyungang 222005, Chinab Jiangsu Marine Resources Development Research Institute, Lianyungang 222005, Chinac School of Transportation Science and Engineering, Harbin Institute of Technology, Harbin 150001, Chinad School of Materials Science and Engineering, Harbin Institute of Technology, Harbin 150001, Chinae School of Civil Engineering, Harbin Institute of Technology, Harbin 150001, China
a r t i c l e i n f o
Article history:Received 9 January 2014Received in revised form18 March 2014Accepted 1 April 2014Available online 13 April 2014
Keywords:FractalTortuosityMechanical propertiesCermetModel
a b s t r a c t
Although the mechanical properties of cermet composites have been investigated extensively, how toquantitatively determine the relationship between the performances and the geometrical structures of thereinforcement phase is still one of the top challenging problems yet to be solved. To determine theinfluence of the geometrical structure of the reinforcement phase on the mechanical performances ofcomposites, Cu2O/Cu cermets were prepared with spherical or branch like Cu by the hot-pressingtechnology. Box-counting fractal dimension increasing rate with increasing filling content of reinforcementphase was first applied to quantitatively reflect the relationship between the geometrical structures ofmetal phase and the mechanical properties of composites. A simple model was developed by combiningfractal theory and power law, in which the critical exponents were determined via experimental results.This study not only provides a pathway to understand the mechanisms of the geometrical structure of thereinforcement phase to the mechanical properties of composites, but also sheds light on the geometricaltortuosity characterization by using fractal approach in cermet composites.
& 2014 Elsevier B.V. All rights reserved.
1. Introduction
Cermet composites have been widely applied in many fields.They can be used as promising materials for solar energy conver-sion [1], cutting tools [2], anti-corrosion coating under marineenvironment [3], inert anode materials for aluminum production [4],electrical devices [5] or sensors [6]. Most of the cermet compositesare composed of metal phases embedded in ceramic matrixes. Withrespect to properties, both advantages and disadvantages of theceramic phase and the metal phase will be inherited in the finalcermet composites. As one of the basic properties, the mechanicalperformance is always the first priority that needs to be consideredbefore the using. It was found that the mechanical properties aregoverned by the microstructures of both ceramic phase and metalphase which were determined by many factors, including theproperties of the raw materials, preparation approaches, chemicalreaction and wetting and bonding conditions between the metal andceramic interfaces, and the atmosphere during the preparationprocess [7–11].
The mechanisms of ceramics reinforced by metals, polymers orcarbon materials have been investigated for decades, and manysuccessful results have been extensively reported to demonstratethe relationship between the final mechanical properties and thereinforcement phases. The most widely accepted model is themixture model expressed as
ρmixðpÞ ¼ ρr f rþρmfm ð1Þwhere ρmix is the mechanical properties of composite, such asYoung's modulus, strengths, or fracture toughness, fr and fm, and ρrand ρm are the volume or weight contents and the mechanicalproperties of the reinforcement phase and the matrix, respectively.Especially, if the reinforcement materials are fibers or carbonnanotubes, this model will be modified as [12]
ρmixðpÞ ¼ μ1μ2ρr f rþρmfm ð2Þwhere μ1 represents the length efficiency factor, and μ2 representsthe orientation efficiency factor.
Other models based on the rule of mixture were furtherdeveloped in fiber or nano tube reinforced composites. The elasticmodulus of the composites can be expressed as [13]
Ec=m ¼ ðEr=m�1ÞVr ðlower boundÞ ð3Þ
Contents lists available at ScienceDirect
journal homepage: www.elsevier.com/locate/msea
Materials Science & Engineering A
http://dx.doi.org/10.1016/j.msea.2014.04.0010921-5093/& 2014 Elsevier B.V. All rights reserved.
n Corresponding author.E-mail addresses: [email protected] (N. Xie), [email protected] (W.-z. Shao).
Materials Science & Engineering A 607 (2014) 236–244
Ec=m ¼ ðEr=m�1ÞVr
Er=mþð1�Er=mÞVrðupper boundÞ ð4Þ
where Vr is the volume fraction of the reinforcement, Ec/m¼(Ec�Em)/Em, Er/m¼Er/Em, and Ec, Er and Em are the longitudinalelastic moduli of the composites, reinforcement phase, and thematrix, respectively. However, some experimental data reportedthat the mechanical property of composites as a function of thefilling content of the reinforcement is not linear, especially whenthe filling content takes large values. Consequently, a revised formof the rule of mixtures was developed with exponential form [13]:
Ec=m ¼ ðεlεoεwEr=m�1ÞVrexpαVr ð5Þ
where
α¼ ln β
V r; β¼ Ec=m
ðεlεoεwEr=m�1ÞV r; Ec=m ¼ ðEc�EmÞ=Em ð6Þ
The hat sign means that the values need to be determined byexperimental results, and εl, εo, εw are constants.
Another well accepted model is Halpin–Tsai equation [14–16]which gives the prediction of tensile modulus of nano-composites,expressed as
Ec ¼ 381þ2ðl=dÞρLVr
1�ρLVrþ581þ2ρDVr
1�ρDVr
� �Em
ρL ¼ðEr=EmÞ�ðdm=4tÞðEr=EmÞþðlm=2tÞ
; ρD ¼ ðEr=EmÞ�ðdm=4tÞðEr=EmÞþðdm=2tÞ
ð7Þ
where Ec and Em are Young's moduli of the composite and thematrix, respectively, l/d and Vm represent the aspect ratio and the
filling content of the nano-fibers or nano-tubes, t is the thicknessof the graphite layer.
Apart from the above mentioned models, the “compositesphere method” (CSM) was also used to predict the modulus ofcomposites, which can be expressed as [17]
Kcom ¼ Krþ Vm
ð1=Km�KrÞþð3Vr=ð3Krþ4GrÞÞð8Þ
Gcom ¼ Grþ Vm
ð1=Km�KrÞþð6Vr=ð3Krþ2GrÞ=ð5G2ð3Krþ4GrÞÞÞð9Þ
where Kcom and Gcom are the bulk and shear modulus of compo-sites. Vm and Vr are volume contents of the matrix and thereinforcement phase, Km, Gm, and Kr, Gr are the bulk moduliand shear moduli of the matrix and the reinforcement phase,respectively.
Although the mechanical performances of composites wereextensively studied, and numerous methods were applied tocharacterize the relationship between the reinforcement phaseand the final properties, the disagreement between the someexperimental results and theoretical models, which was resultedfrom the complexity of the reinforcement phase, is always aproblem that needs to be solved, especially how to quantitativelypredict the mechanical properties of the composites with differentgeometrical structure of the reinforcements is still one of the topchallenge topics in composite science and technology.
Recently, Cu2O/Cu cermet has gained significant interests dueto its potential applications in solar energy conversion [18],electrode materials [4,19], sensors [20], and catalysis [21]. Thephysical properties of Cu2O/Cu cermets with different geometrical
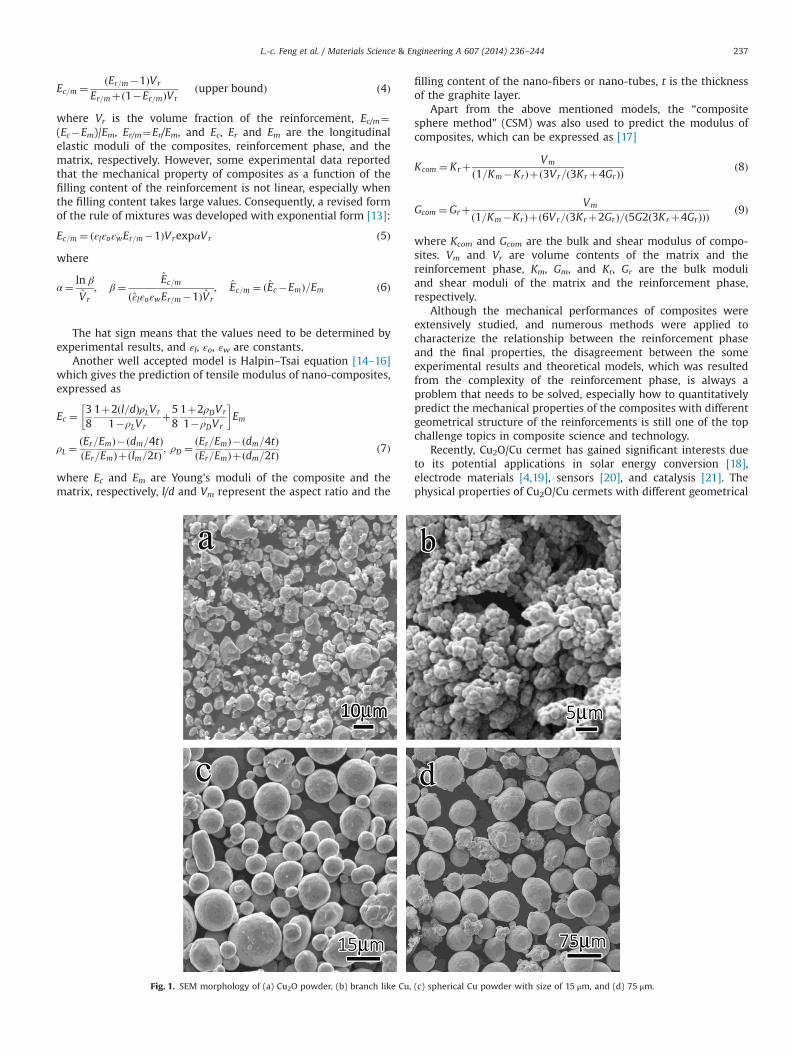
Fig. 1. SEM morphology of (a) Cu2O powder, (b) branch like Cu, (c) spherical Cu powder with size of 15 μm, and (d) 75 μm.
L.-c. Feng et al. / Materials Science & Engineering A 607 (2014) 236–244 237
structures of Cu phase have been studied systematically [22–25];however, the mechanical properties of them were barely reported.Here, to quantitatively characterize the relationship between thegeometrical structures of the Cu phase and the mechanicalproperties, the Cu2O/Cu cermets were prepared with differentgeometrical structures of Cu. By combining with fractal theory andpower law, a simple model was developed to represent therelationship between the mechanical properties and geometricalstructures of the Cu phase in the Cu2O/Cu cermets.
2. Experimental
To prepare the Cu2O/Cu cermets, the Cu2O powder and Cupowders with different geometrical structures were directly mixedand followed by hot pressing. As shown in Fig. 1, the average particlesize of Cu2O was about 5–10 μm, the Cu powders were branch like orspherical with diameters of 15 μm and 75 μm. Fig. 1(a) shows theSEM morphology of the Cu2O powder, Fig. 1(b)–(d) shows the SEMmorphology of the branch like Cu, the spherical Cu with diameters of15 μm and 75 μm, respectively. As can be seen in this figure, themorphology of the Cu powder was either branch-like or spherical,while the shape of the Cu2O powder was irregular. To diminish theoxygen from the Cu surfaces, the Cu powders were heated in H2 at450 1C for 2 h before preparing the composites.
In the hot pressing process, the Cu powders and Cu2O powderwere ball-milled in dehydrated ethyl alcohol for 12 h, and subse-quently dried in a vacuum furnace at 80 1C. After drying, themixture powders were ramped up to 1050 1C with heating rate of20 1C/min, and followed by hot pressing with 25 MPa and 40 minsoak in a graphite mold. The furnace chamber was purged with1.0 atm of argon gas from the start of the hot pressing procedure.
Young's modulus, flexural strength and fracture toughness of theprepared cermet composites were performed on a universal tester
(INSTRON-5569). The size of the samples for the three point flexuralstrength testing was 3�4�20 mm3, the span of the supportingpoints was 16 mm, and the loading rate was 0.5 mm/min. Young'smodulus was calculated according to the stress–strain relationship ofthe flexural strength. The fracture toughness was tested on the sameuniversal tester by pre-cracked single edge beam method. The depthof the pre-crack was 2 mm, and the loading rate was 0.05 mm/min.All results were average values of three samples. The fracturesurfaces were observed on a scanning electron microscope (HitachiS-4700).
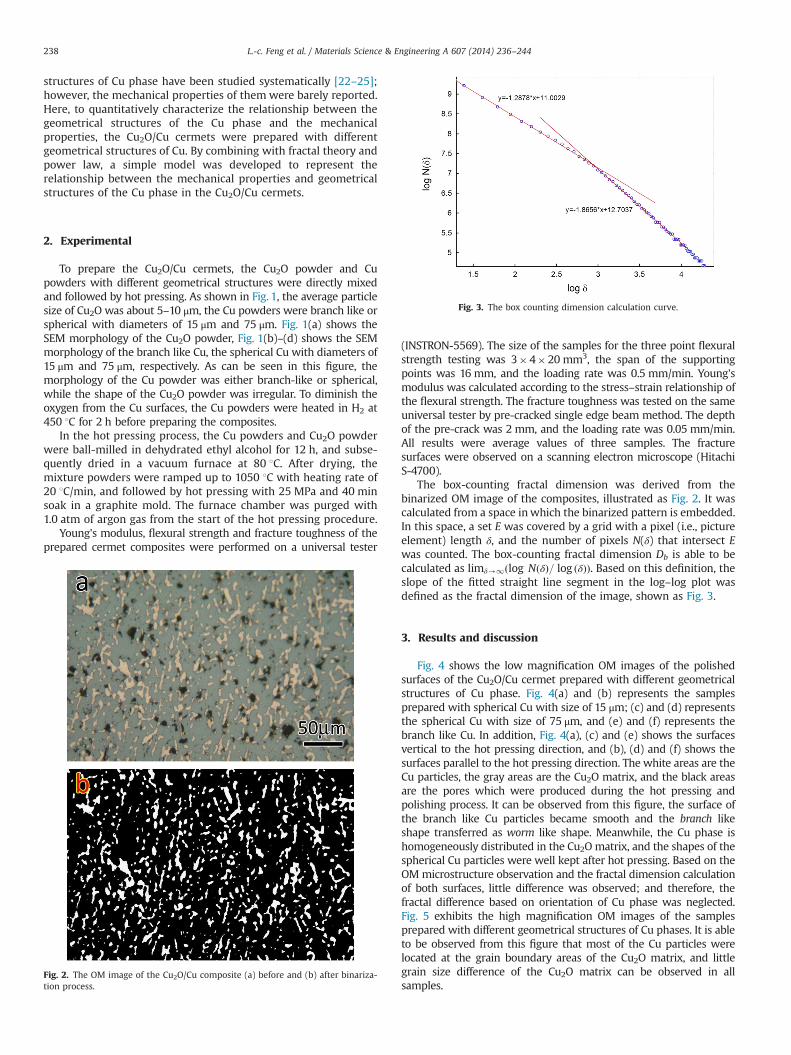
The box-counting fractal dimension was derived from thebinarized OM image of the composites, illustrated as Fig. 2. It wascalculated from a space inwhich the binarized pattern is embedded.In this space, a set E was covered by a grid with a pixel (i.e., pictureelement) length δ, and the number of pixels N(δ) that intersect Ewas counted. The box-counting fractal dimension Db is able to becalculated as limδ-1ðlog NðδÞ= log ðδÞÞ. Based on this definition, theslope of the fitted straight line segment in the log–log plot wasdefined as the fractal dimension of the image, shown as Fig. 3.
3. Results and discussion
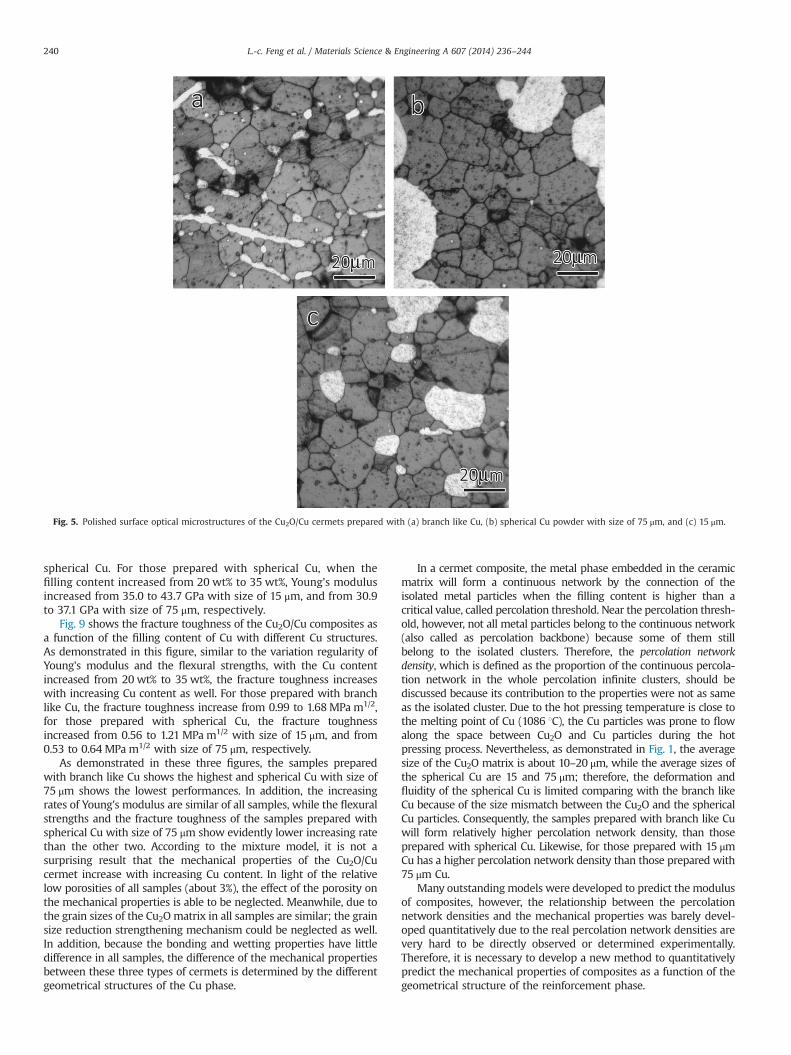
Fig. 4 shows the low magnification OM images of the polishedsurfaces of the Cu2O/Cu cermet prepared with different geometricalstructures of Cu phase. Fig. 4(a) and (b) represents the samplesprepared with spherical Cu with size of 15 μm; (c) and (d) representsthe spherical Cu with size of 75 μm, and (e) and (f) represents thebranch like Cu. In addition, Fig. 4(a), (c) and (e) shows the surfacesvertical to the hot pressing direction, and (b), (d) and (f) shows thesurfaces parallel to the hot pressing direction. The white areas are theCu particles, the gray areas are the Cu2O matrix, and the black areasare the pores which were produced during the hot pressing andpolishing process. It can be observed from this figure, the surface ofthe branch like Cu particles became smooth and the branch likeshape transferred as worm like shape. Meanwhile, the Cu phase ishomogeneously distributed in the Cu2O matrix, and the shapes of thespherical Cu particles were well kept after hot pressing. Based on theOMmicrostructure observation and the fractal dimension calculationof both surfaces, little difference was observed; and therefore, thefractal difference based on orientation of Cu phase was neglected.Fig. 5 exhibits the high magnification OM images of the samplesprepared with different geometrical structures of Cu phases. It is ableto be observed from this figure that most of the Cu particles werelocated at the grain boundary areas of the Cu2O matrix, and littlegrain size difference of the Cu2O matrix can be observed in allsamples.
Fig. 2. The OM image of the Cu2O/Cu composite (a) before and (b) after binariza-tion process.
Fig. 3. The box counting dimension calculation curve.
L.-c. Feng et al. / Materials Science & Engineering A 607 (2014) 236–244238
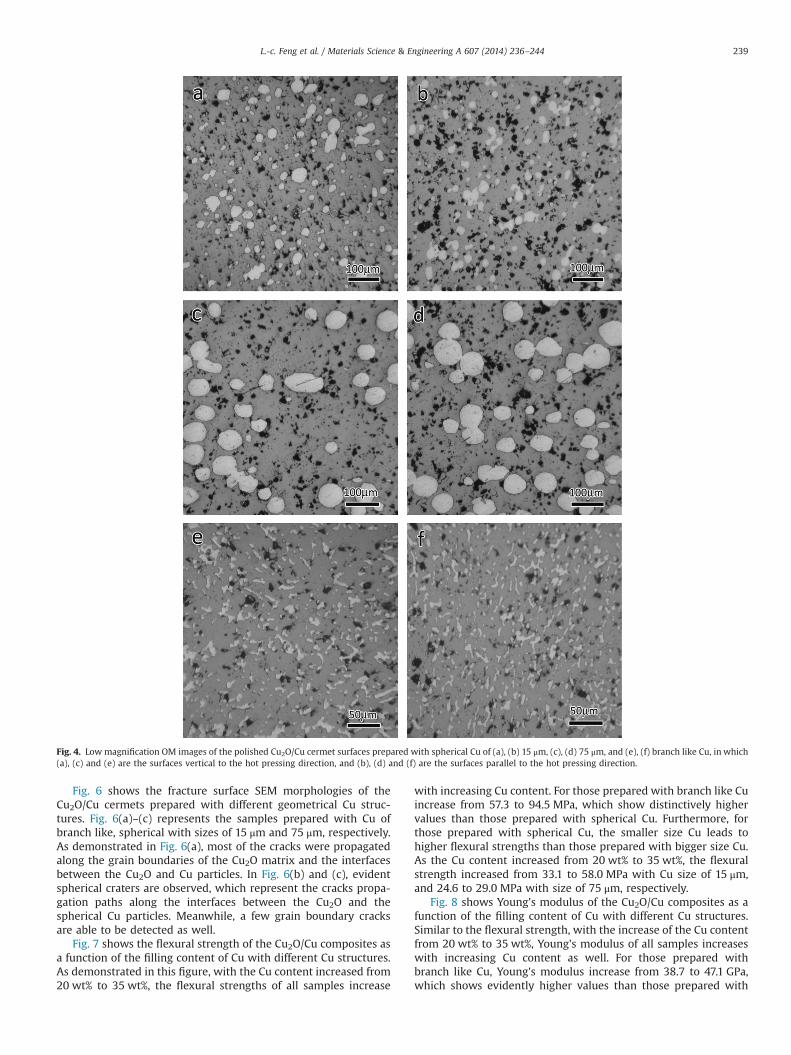
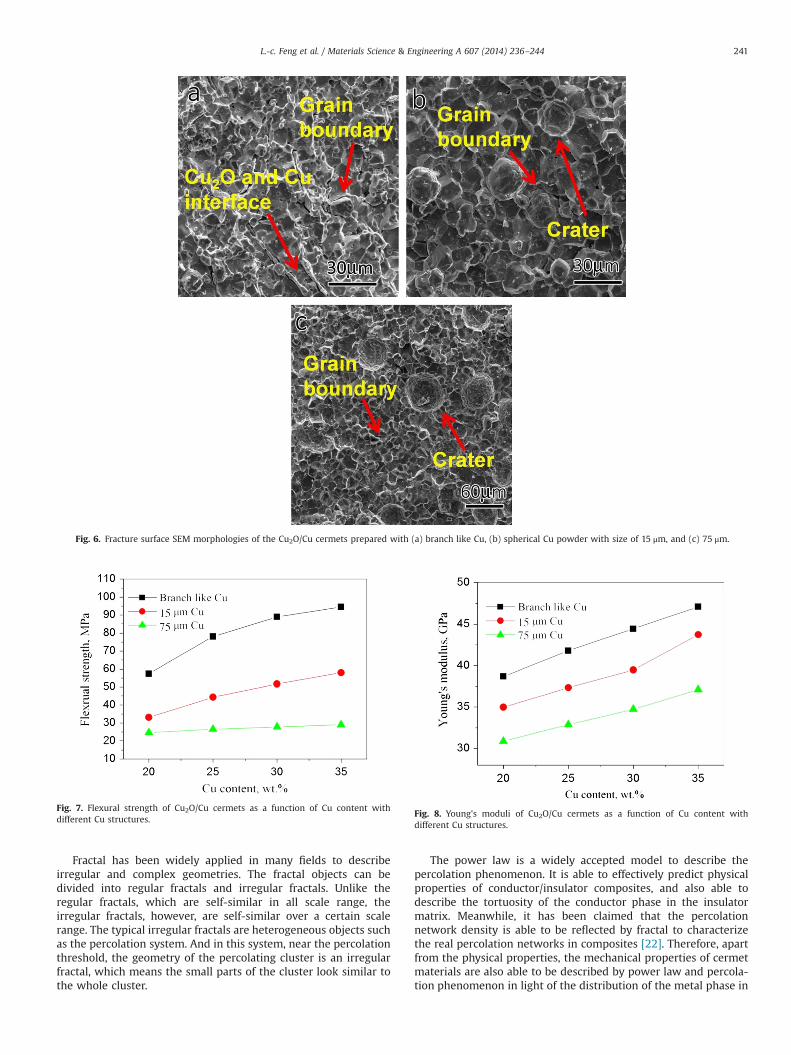
Fig. 6 shows the fracture surface SEM morphologies of theCu2O/Cu cermets prepared with different geometrical Cu struc-tures. Fig. 6(a)–(c) represents the samples prepared with Cu ofbranch like, spherical with sizes of 15 μm and 75 μm, respectively.As demonstrated in Fig. 6(a), most of the cracks were propagatedalong the grain boundaries of the Cu2O matrix and the interfacesbetween the Cu2O and Cu particles. In Fig. 6(b) and (c), evidentspherical craters are observed, which represent the cracks propa-gation paths along the interfaces between the Cu2O and thespherical Cu particles. Meanwhile, a few grain boundary cracksare able to be detected as well.
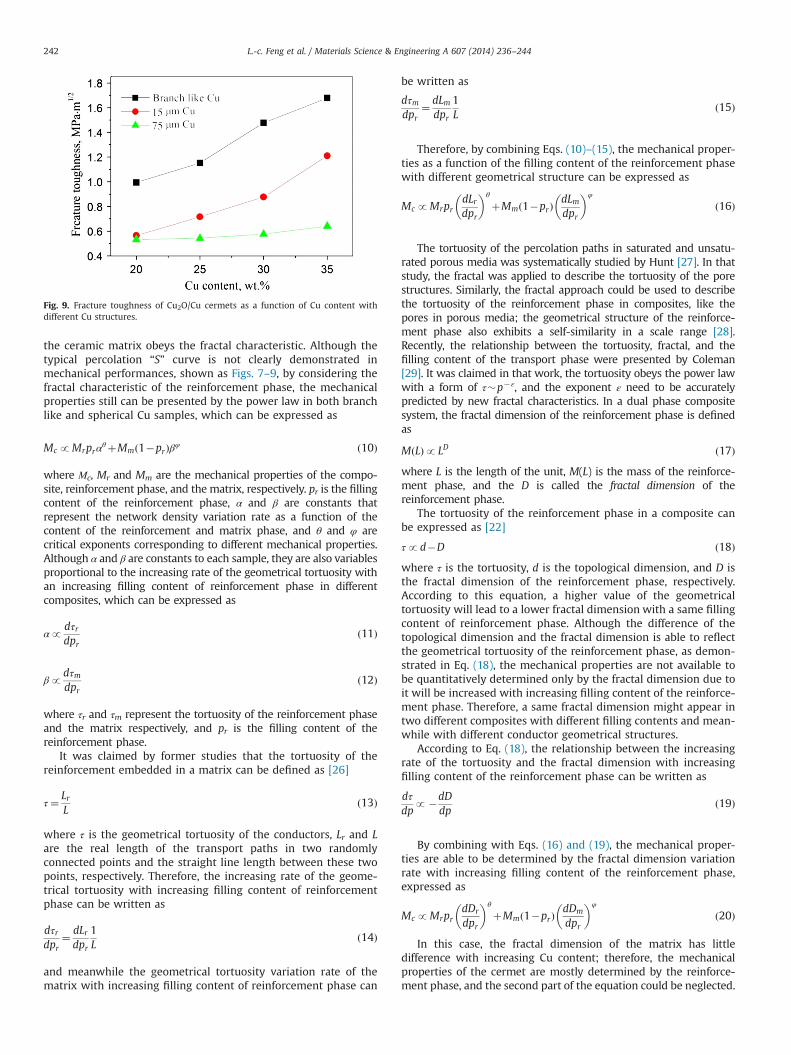
Fig. 7 shows the flexural strength of the Cu2O/Cu composites asa function of the filling content of Cu with different Cu structures.As demonstrated in this figure, with the Cu content increased from20 wt% to 35 wt%, the flexural strengths of all samples increase
with increasing Cu content. For those prepared with branch like Cuincrease from 57.3 to 94.5 MPa, which show distinctively highervalues than those prepared with spherical Cu. Furthermore, forthose prepared with spherical Cu, the smaller size Cu leads tohigher flexural strengths than those prepared with bigger size Cu.As the Cu content increased from 20 wt% to 35 wt%, the flexuralstrength increased from 33.1 to 58.0 MPa with Cu size of 15 μm,and 24.6 to 29.0 MPa with size of 75 μm, respectively.
Fig. 8 shows Young's modulus of the Cu2O/Cu composites as afunction of the filling content of Cu with different Cu structures.Similar to the flexural strength, with the increase of the Cu contentfrom 20 wt% to 35 wt%, Young's modulus of all samples increaseswith increasing Cu content as well. For those prepared withbranch like Cu, Young's modulus increase from 38.7 to 47.1 GPa,which shows evidently higher values than those prepared with
Fig. 4. Low magnification OM images of the polished Cu2O/Cu cermet surfaces prepared with spherical Cu of (a), (b) 15 μm, (c), (d) 75 μm, and (e), (f) branch like Cu, in which(a), (c) and (e) are the surfaces vertical to the hot pressing direction, and (b), (d) and (f) are the surfaces parallel to the hot pressing direction.
L.-c. Feng et al. / Materials Science & Engineering A 607 (2014) 236–244 239
spherical Cu. For those prepared with spherical Cu, when thefilling content increased from 20 wt% to 35 wt%, Young's modulusincreased from 35.0 to 43.7 GPa with size of 15 μm, and from 30.9to 37.1 GPa with size of 75 μm, respectively.
Fig. 9 shows the fracture toughness of the Cu2O/Cu composites asa function of the filling content of Cu with different Cu structures.As demonstrated in this figure, similar to the variation regularity ofYoung's modulus and the flexural strengths, with the Cu contentincreased from 20 wt% to 35 wt%, the fracture toughness increaseswith increasing Cu content as well. For those prepared with branchlike Cu, the fracture toughness increase from 0.99 to 1.68MPa m1/2,for those prepared with spherical Cu, the fracture toughnessincreased from 0.56 to 1.21 MPa m1/2 with size of 15 μm, and from0.53 to 0.64 MPa m1/2 with size of 75 μm, respectively.
As demonstrated in these three figures, the samples preparedwith branch like Cu shows the highest and spherical Cu with size of75 μm shows the lowest performances. In addition, the increasingrates of Young's modulus are similar of all samples, while the flexuralstrengths and the fracture toughness of the samples prepared withspherical Cu with size of 75 μm show evidently lower increasing ratethan the other two. According to the mixture model, it is not asurprising result that the mechanical properties of the Cu2O/Cucermet increase with increasing Cu content. In light of the relativelow porosities of all samples (about 3%), the effect of the porosity onthe mechanical properties is able to be neglected. Meanwhile, due tothe grain sizes of the Cu2O matrix in all samples are similar; the grainsize reduction strengthening mechanism could be neglected as well.In addition, because the bonding and wetting properties have littledifference in all samples, the difference of the mechanical propertiesbetween these three types of cermets is determined by the differentgeometrical structures of the Cu phase.
In a cermet composite, the metal phase embedded in the ceramicmatrix will form a continuous network by the connection of theisolated metal particles when the filling content is higher than acritical value, called percolation threshold. Near the percolation thresh-old, however, not all metal particles belong to the continuous network(also called as percolation backbone) because some of them stillbelong to the isolated clusters. Therefore, the percolation networkdensity, which is defined as the proportion of the continuous percola-tion network in the whole percolation infinite clusters, should bediscussed because its contribution to the properties were not as sameas the isolated cluster. Due to the hot pressing temperature is close tothe melting point of Cu (1086 1C), the Cu particles was prone to flowalong the space between Cu2O and Cu particles during the hotpressing process. Nevertheless, as demonstrated in Fig. 1, the averagesize of the Cu2O matrix is about 10–20 μm, while the average sizes ofthe spherical Cu are 15 and 75 μm; therefore, the deformation andfluidity of the spherical Cu is limited comparing with the branch likeCu because of the size mismatch between the Cu2O and the sphericalCu particles. Consequently, the samples prepared with branch like Cuwill form relatively higher percolation network density, than thoseprepared with spherical Cu. Likewise, for those prepared with 15 μmCu has a higher percolation network density than those prepared with75 μm Cu.
Many outstanding models were developed to predict the modulusof composites, however, the relationship between the percolationnetwork densities and the mechanical properties was barely devel-oped quantitatively due to the real percolation network densities arevery hard to be directly observed or determined experimentally.Therefore, it is necessary to develop a new method to quantitativelypredict the mechanical properties of composites as a function of thegeometrical structure of the reinforcement phase.
Fig. 5. Polished surface optical microstructures of the Cu2O/Cu cermets prepared with (a) branch like Cu, (b) spherical Cu powder with size of 75 μm, and (c) 15 μm.
L.-c. Feng et al. / Materials Science & Engineering A 607 (2014) 236–244240
Fractal has been widely applied in many fields to describeirregular and complex geometries. The fractal objects can bedivided into regular fractals and irregular fractals. Unlike theregular fractals, which are self-similar in all scale range, theirregular fractals, however, are self-similar over a certain scalerange. The typical irregular fractals are heterogeneous objects suchas the percolation system. And in this system, near the percolationthreshold, the geometry of the percolating cluster is an irregularfractal, which means the small parts of the cluster look similar tothe whole cluster.
The power law is a widely accepted model to describe thepercolation phenomenon. It is able to effectively predict physicalproperties of conductor/insulator composites, and also able todescribe the tortuosity of the conductor phase in the insulatormatrix. Meanwhile, it has been claimed that the percolationnetwork density is able to be reflected by fractal to characterizethe real percolation networks in composites [22]. Therefore, apartfrom the physical properties, the mechanical properties of cermetmaterials are also able to be described by power law and percola-tion phenomenon in light of the distribution of the metal phase in
Fig. 6. Fracture surface SEM morphologies of the Cu2O/Cu cermets prepared with (a) branch like Cu, (b) spherical Cu powder with size of 15 μm, and (c) 75 μm.
Fig. 7. Flexural strength of Cu2O/Cu cermets as a function of Cu content withdifferent Cu structures.
Fig. 8. Young's moduli of Cu2O/Cu cermets as a function of Cu content withdifferent Cu structures.
L.-c. Feng et al. / Materials Science & Engineering A 607 (2014) 236–244 241
the ceramic matrix obeys the fractal characteristic. Although thetypical percolation “S” curve is not clearly demonstrated inmechanical performances, shown as Figs. 7–9, by considering thefractal characteristic of the reinforcement phase, the mechanicalproperties still can be presented by the power law in both branchlike and spherical Cu samples, which can be expressed as
McpMrprαθþMmð1�prÞβφ ð10Þ
where Μc, Mr and Mm are the mechanical properties of the compo-site, reinforcement phase, and the matrix, respectively. pr is the fillingcontent of the reinforcement phase, α and β are constants thatrepresent the network density variation rate as a function of thecontent of the reinforcement and matrix phase, and θ and φ arecritical exponents corresponding to different mechanical properties.Although α and β are constants to each sample, they are also variablesproportional to the increasing rate of the geometrical tortuosity withan increasing filling content of reinforcement phase in differentcomposites, which can be expressed as
αpdτrdpr
ð11Þ
βpdτmdpr
ð12Þ
where τr and τm represent the tortuosity of the reinforcement phaseand the matrix respectively, and pr is the filling content of thereinforcement phase.
It was claimed by former studies that the tortuosity of thereinforcement embedded in a matrix can be defined as [26]
τ¼ LrL
ð13Þ
where τ is the geometrical tortuosity of the conductors, Lr and Lare the real length of the transport paths in two randomlyconnected points and the straight line length between these twopoints, respectively. Therefore, the increasing rate of the geome-trical tortuosity with increasing filling content of reinforcementphase can be written as
dτrdpr
¼ dLrdpr
1L
ð14Þ
and meanwhile the geometrical tortuosity variation rate of thematrix with increasing filling content of reinforcement phase can
be written as
dτmdpr
¼ dLmdpr
1L
ð15Þ
Therefore, by combining Eqs. (10)–(15), the mechanical proper-ties as a function of the filling content of the reinforcement phasewith different geometrical structure can be expressed as
McpMrprdLrdpr
� �θ
þMmð1�prÞdLmdpr
� �φ
ð16Þ
The tortuosity of the percolation paths in saturated and unsatu-rated porous media was systematically studied by Hunt [27]. In thatstudy, the fractal was applied to describe the tortuosity of the porestructures. Similarly, the fractal approach could be used to describethe tortuosity of the reinforcement phase in composites, like thepores in porous media; the geometrical structure of the reinforce-ment phase also exhibits a self-similarity in a scale range [28].Recently, the relationship between the tortuosity, fractal, and thefilling content of the transport phase were presented by Coleman[29]. It was claimed in that work, the tortuosity obeys the power lawwith a form of τ�p�ε, and the exponent ε need to be accuratelypredicted by new fractal characteristics. In a dual phase compositesystem, the fractal dimension of the reinforcement phase is definedas
MðLÞpLD ð17Þwhere L is the length of the unit, M(L) is the mass of the reinforce-ment phase, and the D is called the fractal dimension of thereinforcement phase.
The tortuosity of the reinforcement phase in a composite canbe expressed as [22]
τpd�D ð18Þwhere τ is the tortuosity, d is the topological dimension, and D isthe fractal dimension of the reinforcement phase, respectively.According to this equation, a higher value of the geometricaltortuosity will lead to a lower fractal dimension with a same fillingcontent of reinforcement phase. Although the difference of thetopological dimension and the fractal dimension is able to reflectthe geometrical tortuosity of the reinforcement phase, as demon-strated in Eq. (18), the mechanical properties are not available tobe quantitatively determined only by the fractal dimension due toit will be increased with increasing filling content of the reinforce-ment phase. Therefore, a same fractal dimension might appear intwo different composites with different filling contents and mean-while with different conductor geometrical structures.
According to Eq. (18), the relationship between the increasingrate of the tortuosity and the fractal dimension with increasingfilling content of the reinforcement phase can be written as
dτdp
p�dDdp
ð19Þ
By combining with Eqs. (16) and (19), the mechanical proper-ties are able to be determined by the fractal dimension variationrate with increasing filling content of the reinforcement phase,expressed as
McpMrprdDr
dpr
� �θ
þMmð1�prÞdDm
dpr
� �φ
ð20Þ
In this case, the fractal dimension of the matrix has littledifference with increasing Cu content; therefore, the mechanicalproperties of the cermet are mostly determined by the reinforce-ment phase, and the second part of the equation could be neglected.
Fig. 9. Fracture toughness of Cu2O/Cu cermets as a function of Cu content withdifferent Cu structures.
L.-c. Feng et al. / Materials Science & Engineering A 607 (2014) 236–244242
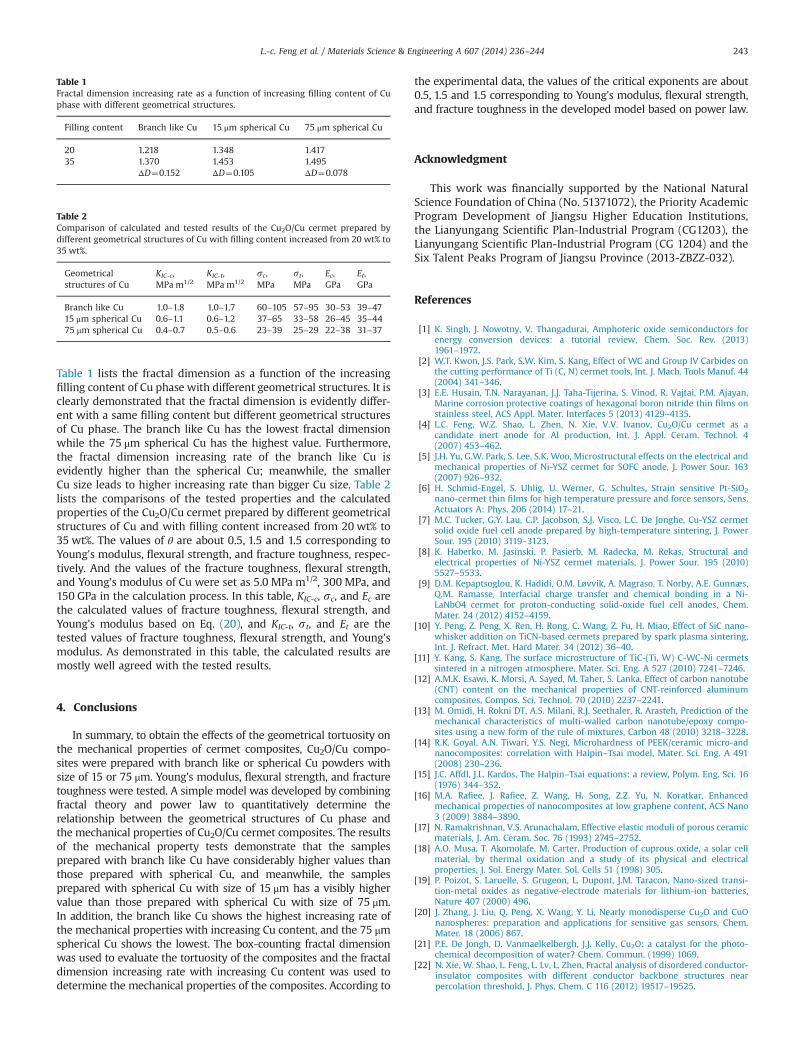
Table 1 lists the fractal dimension as a function of the increasingfilling content of Cu phase with different geometrical structures. It isclearly demonstrated that the fractal dimension is evidently differ-ent with a same filling content but different geometrical structuresof Cu phase. The branch like Cu has the lowest fractal dimensionwhile the 75 μm spherical Cu has the highest value. Furthermore,the fractal dimension increasing rate of the branch like Cu isevidently higher than the spherical Cu; meanwhile, the smallerCu size leads to higher increasing rate than bigger Cu size. Table 2lists the comparisons of the tested properties and the calculatedproperties of the Cu2O/Cu cermet prepared by different geometricalstructures of Cu and with filling content increased from 20 wt% to35 wt%. The values of θ are about 0.5, 1.5 and 1.5 corresponding toYoung's modulus, flexural strength, and fracture toughness, respec-tively. And the values of the fracture toughness, flexural strength,and Young's modulus of Cu were set as 5.0 MPa m1/2, 300 MPa, and150 GPa in the calculation process. In this table, KIC-c, sc, and Ec arethe calculated values of fracture toughness, flexural strength, andYoung's modulus based on Eq. (20), and KIC-t, st, and Et are thetested values of fracture toughness, flexural strength, and Young'smodulus. As demonstrated in this table, the calculated results aremostly well agreed with the tested results.
4. Conclusions
In summary, to obtain the effects of the geometrical tortuosity onthe mechanical properties of cermet composites, Cu2O/Cu compo-sites were prepared with branch like or spherical Cu powders withsize of 15 or 75 μm. Young's modulus, flexural strength, and fracturetoughness were tested. A simple model was developed by combiningfractal theory and power law to quantitatively determine therelationship between the geometrical structures of Cu phase andthe mechanical properties of Cu2O/Cu cermet composites. The resultsof the mechanical property tests demonstrate that the samplesprepared with branch like Cu have considerably higher values thanthose prepared with spherical Cu, and meanwhile, the samplesprepared with spherical Cu with size of 15 μm has a visibly highervalue than those prepared with spherical Cu with size of 75 μm.In addition, the branch like Cu shows the highest increasing rate ofthe mechanical properties with increasing Cu content, and the 75 μmspherical Cu shows the lowest. The box-counting fractal dimensionwas used to evaluate the tortuosity of the composites and the fractaldimension increasing rate with increasing Cu content was used todetermine the mechanical properties of the composites. According to
the experimental data, the values of the critical exponents are about0.5, 1.5 and 1.5 corresponding to Young's modulus, flexural strength,and fracture toughness in the developed model based on power law.
Acknowledgment
This work was financially supported by the National NaturalScience Foundation of China (No. 51371072), the Priority AcademicProgram Development of Jiangsu Higher Education Institutions,the Lianyungang Scientific Plan-Industrial Program (CG1203), theLianyungang Scientific Plan-Industrial Program (CG 1204) and theSix Talent Peaks Program of Jiangsu Province (2013-ZBZZ-032).
References
[1] K. Singh, J. Nowotny, V. Thangadurai, Amphoteric oxide semiconductors forenergy conversion devices: a tutorial review, Chem. Soc. Rev. (2013)1961–1972.
[2] W.T. Kwon, J.S. Park, S.W. Kim, S. Kang, Effect of WC and Group IV Carbides onthe cutting performance of Ti (C, N) cermet tools, Int. J. Mach. Tools Manuf. 44(2004) 341–346.
[3] E.E. Husain, T.N. Narayanan, J.J. Taha-Tijerina, S. Vinod, R. Vajtai, P.M. Ajayan,Marine corrosion protective coatings of hexagonal boron nitride thin films onstainless steel, ACS Appl. Mater. Interfaces 5 (2013) 4129–4135.
[4] L.C. Feng, W.Z. Shao, L. Zhen, N. Xie, V.V. Ivanov, Cu2O/Cu cermet as acandidate inert anode for Al production, Int. J. Appl. Ceram. Technol. 4(2007) 453–462.
[5] J.H. Yu, G.W. Park, S. Lee, S.K. Woo, Microstructural effects on the electrical andmechanical properties of Ni-YSZ cermet for SOFC anode, J. Power Sour. 163(2007) 926–932.
[6] H. Schmid-Engel, S. Uhlig, U. Werner, G. Schultes, Strain sensitive Pt-SiO2
nano-cermet thin films for high temperature pressure and force sensors, Sens.Actuators A: Phys. 206 (2014) 17–21.
[7] M.C. Tucker, G.Y. Lau, C.P. Jacobson, S.J. Visco, L.C. De Jonghe, Cu-YSZ cermetsolid oxide fuel cell anode prepared by high-temperature sintering, J. PowerSour. 195 (2010) 3119–3123.
[8] K. Haberko, M. Jasinski, P. Pasierb, M. Radecka, M. Rekas, Structural andelectrical properties of Ni-YSZ cermet materials, J. Power Sour. 195 (2010)5527–5533.
[9] D.M. Kepaptsoglou, K. Hadidi, O.M. Løvvik, A. Magraso, T. Norby, A.E. Gunnæs,Q.M. Ramasse, Interfacial charge transfer and chemical bonding in a Ni-LaNbO4 cermet for proton-conducting solid-oxide fuel cell anodes, Chem.Mater. 24 (2012) 4152–4159.
[10] Y. Peng, Z. Peng, X. Ren, H. Rong, C. Wang, Z. Fu, H. Miao, Effect of SiC nano-whisker addition on TiCN-based cermets prepared by spark plasma sintering,Int. J. Refract. Met. Hard Mater. 34 (2012) 36–40.
[11] Y. Kang, S. Kang, The surface microstructure of TiC-(Ti, W) C-WC-Ni cermetssintered in a nitrogen atmosphere, Mater. Sci. Eng. A 527 (2010) 7241–7246.
[12] A.M.K. Esawi, K. Morsi, A. Sayed, M. Taher, S. Lanka, Effect of carbon nanotube(CNT) content on the mechanical properties of CNT-reinforced aluminumcomposites, Compos. Sci. Technol. 70 (2010) 2237–2241.
[13] M. Omidi, H. Rokni DT, A.S. Milani, R.J. Seethaler, R. Arasteh, Prediction of themechanical characteristics of multi-walled carbon nanotube/epoxy compo-sites using a new form of the rule of mixtures, Carbon 48 (2010) 3218–3228.
[14] R.K. Goyal, A.N. Tiwari, Y.S. Negi, Microhardness of PEEK/ceramic micro-andnanocomposites: correlation with Halpin–Tsai model, Mater. Sci. Eng. A 491(2008) 230–236.
[15] J.C. Affdl, J.L. Kardos, The Halpin–Tsai equations: a review, Polym. Eng. Sci. 16(1976) 344–352.
[16] M.A. Rafiee, J. Rafiee, Z. Wang, H. Song, Z.Z. Yu, N. Koratkar, Enhancedmechanical properties of nanocomposites at low graphene content, ACS Nano3 (2009) 3884–3890.
[17] N. Ramakrishnan, V.S. Arunachalam, Effective elastic moduli of porous ceramicmaterials, J. Am. Ceram. Soc. 76 (1993) 2745–2752.
[18] A.O. Musa, T. Akomolafe, M. Carter, Production of cuprous oxide, a solar cellmaterial, by thermal oxidation and a study of its physical and electricalproperties, J. Sol. Energy Mater. Sol. Cells 51 (1998) 305.
[19] P. Poizot, S. Laruelle, S. Grugeon, L. Dupont, J.M. Taracon, Nano-sized transi-tion-metal oxides as negative-electrode materials for lithium-ion batteries,Nature 407 (2000) 496.
[20] J. Zhang, J. Liu, Q. Peng, X. Wang, Y. Li, Nearly monodisperse Cu2O and CuOnanospheres: preparation and applications for sensitive gas sensors, Chem.Mater. 18 (2006) 867.
[21] P.E. De Jongh, D. Vanmaelkelbergh, J.J. Kelly, Cu2O: a catalyst for the photo-chemical decomposition of water? Chem. Commun. (1999) 1069.
[22] N. Xie, W. Shao, L. Feng, L. Lv, L. Zhen, Fractal analysis of disordered conductor-insulator composites with different conductor backbone structures nearpercolation threshold, J. Phys. Chem. C 116 (2012) 19517–19525.
Table 1Fractal dimension increasing rate as a function of increasing filling content of Cuphase with different geometrical structures.
Filling content Branch like Cu 15 μm spherical Cu 75 μm spherical Cu
20 1.218 1.348 1.41735 1.370 1.453 1.495
ΔD¼0.152 ΔD¼0.105 ΔD¼0.078
Table 2Comparison of calculated and tested results of the Cu2O/Cu cermet prepared bydifferent geometrical structures of Cu with filling content increased from 20 wt% to35 wt%.
Geometricalstructures of Cu
KIC-c,MPa m1/2
KIC-t,MPa m1/2
sc,MPa
st,MPa
Ec,GPa
Et,GPa
Branch like Cu 1.0–1.8 1.0–1.7 60–105 57–95 30–53 39–4715 μm spherical Cu 0.6–1.1 0.6–1.2 37–65 33–58 26–45 35–4475 μm spherical Cu 0.4–0.7 0.5–0.6 23–39 25–29 22–38 31–37
L.-c. Feng et al. / Materials Science & Engineering A 607 (2014) 236–244 243

[23] W.Z. Shao, N. Xie, L. Zhen, L.C. Feng, Conductivity critical exponents lower thanthe universal value in continuum percolation systems, J. Phys.: Condens.Matter 20 (2008) 395235.
[24] W.Z. Shao, L.C. Feng, L. Zhen, N. Xie, Thermal expansion behavior of Cu/Cu2Ocermets with different Cu structures, Ceram. Int. 35 (2009) 2803–2807.
[25] N. Xie, W.Z. Shao, L. Zhen, L.C. Feng, Electrical conductivity of inhomogeneousCu2O-10CuAlO2-xCu cermets, J. Am. Ceram. Soc. 88 (2005) 2589–2593.
[26] S.W. Coleman, J.C. Vassilicos, Tortuosity of unsaturated porous fractal materi-als, Phys. Rev. E 78 (2008) 016308.
[27] A. Hunt, R. Ewing, R.P. Ewing, Percolation Theory for Flow in Porous Media,Springer, Berlin Heidelberg, Germany, 2009.
[28] D. Van der Putten, J.T. Moonen, H.B. Brom, J.C.M. Brokken-Zijp, M.A.J. Michels,Evidence for superlocalization on a fractal network in conductive carbon-black–polymer composites, Phys. Rev. Lett. 69 (1992) 494.
[29] S.W. Coleman, J.C. Vassilicos, Transport properties of saturated and unsatu-rated porous fractal materials, Phys. Rev. Lett. 100 (2008) 035504.
L.-c. Feng et al. / Materials Science & Engineering A 607 (2014) 236–244244