Embed Size (px)
Citation preview

Fracture Analysis of Spherical Fuel Elements 1 | 30
Fracture Analysis of Reduced Diameter Spherical Graphite Fuel Elements
under Diametrical Loading Conditions
Grant Buster
Michael Laufer
Per Peterson
UCBTH-15-004
May 21, 2015
Department of Nuclear Engineering
University of California, Berkeley
This research is being performed using funding received from the U.S. Department of Energy
Office of Nuclear Energy’s Nuclear Energy University Programs.
This document is for distribution.

Fracture Analysis of Spherical Fuel Elements 2 | 30
Contents
Fracture Analysis of Reduced Diameter Spherical Graphite Fuel Elements under
Diametrical Loading Conditions ................................................................................................. 1
Contents ......................................................................................................................................... 2
List of Figures ................................................................................................................................ 3
List of Tables ................................................................................................................................. 4
Acronyms and Abbreviations ...................................................................................................... 5
1 Introduction ............................................................................................................................ 6
2 Methodology ............................................................................................................................ 6
3 Pebble Fuel Physical Description and Published Mechanical Specifications ................... 7 3.1 HTGR and Mk1 PB-FHR Fuel Physical Description ............................................................... 7 3.2 Previously Reported HTGR Fuel Pebble Mechanical Specifications ................................... 10 3.3 Material Properties .................................................................................................................... 11
3.3.1 Graphite Material Properties.................................................................................................. 11 3.3.2 Control Blade Material Properties ......................................................................................... 12
4 Assessment of Stress Models for Spheres under Compression ........................................ 13 4.1 Hertzian Contact Analysis for the Stress Distribution in a Sphere ....................................... 13 4.2 Shook Model for the Stress Distribution in a Brittle Sphere ................................................. 16 4.3 Fracture Analysis of Brittle Spheres ........................................................................................ 17
5 Compression-Dominant Failure Analysis for HTGR Fuel ............................................... 19
6 Tension-Dominant Failure Analysis for HTGR Fuel ........................................................ 21
7 Calculated Mk1 PB-FHR Fuel Specifications .................................................................... 21 7.1 Mk1 PB-FHR Fuel Pebble Specifications Based on Compressive-Dominant Stress States 22 7.2 Mk1 PB-FHR Fuel Pebble Specifications Based on Tension-Dominant Stress States ........ 24
8 Discussion of Fuel Specification Results and Likelihood of Failure Mechanisms .......... 25
9 Conclusions and Recommendations for Future Work ...................................................... 27
References .................................................................................................................................... 28

Fracture Analysis of Spherical Fuel Elements 3 | 30
List of Figures
Figure 2-1. Analysis methodology represented as a block diagram. .............................................. 7 Figure 3-1. HTGR 6.0 cm pebble fuel physical arrangement [5]. Prismatic fuel compacts loaded
with fuel particles are also shown, but are not analyzed in this report. .................... 8 Figure 3-2. Mk1 PB-FHR fuel pebble schematic. .......................................................................... 9 Figure 3-3. Measured crushing forces for pebble fuel in the THTR and the AVR [6]. ................ 11 Figure 4-1. Hertzian contact schematic between two spheres (Credit: Eberhard Bamberg,
University of Utah). ................................................................................................ 14
Figure 4-2. Stress distribution inside a sphere for the arbitrary loading condition seen in Figure
4-1. σ/σmax is the stress normalized to the maximum pressure at the center of the
deformation contact circle. z/a is the depth in a sphere on the z-axis below the
deformation contact circle, normalized by the radius of the circle. Negative stress
represents compression. .......................................................................................... 16 Figure 4-3. Fracture of a dicalcium phosphate anhydrous disk under compression. Uf is the
compressive displacement, D is the disk diameter, delta is the diameter of the
contact deformation circle [10]. ............................................................................. 18 Figure 5-1. Calculated stress distribution (as a function of z) in a 6cm graphite fuel pebble
undergoing a 23.6 kN applied stress by a flat steel plate. ...................................... 20 Figure 6-1. Comparison of stress distributions orthogonal to the axis of compression. ............... 21 Figure 7-1. Deformation contact circle radius (left) and maximum internal combined Von Mises
stress (right) as a function of force applied by a flat steel plate, calculated using
equations ( 4.1 ) and ( 4.7 ), respectively. .............................................................. 22
Figure 7-2. Von Mises combined stress distribution (calculated by the Hertz analysis) in a 3cm
Mk1 PB-FHR fuel sphere (left) and a 6cm sphere (right), with a line marking the
start of the TRISO/graphite matrix. Force is applied by a flat steel plate. ............. 23 Figure 7-3. Internal stress profile calculated by the Shook model limited by a 17 MPa maximum
internal tensile stress for a 3.0-cm sphere under compression by a steel plate. ..... 25 Figure 8-1. Experimental and Burchell-model-predicted tensile failure probabilities for four
nuclear graphites [24]. ............................................................................................ 26

Fracture Analysis of Spherical Fuel Elements 4 | 30
List of Tables
Table 3-1. PB-FHR fuel pebble specifications [1].......................................................................... 9 Table 3-2. Coated fuel particle and pebble fuel dimensions and relevant properties. .................. 10
Table 3-3. Material properties of H-451 nuclear graphite. ........................................................... 12 Table 3-4. Material properties of 316 stainless steel. ................................................................... 13 Table 7-1. Maximum allowable applied force to a PB-FHR fuel element for various loading
scenarios. Calculated based on a maximum internal Von Mises stress of 888 ± 10
MPa (calculated, Hertz model), resulting from a 6cm pebble crushing strength of
23.6 ± 0.8 kN (experimental [25]). ......................................................................... 22 Table 7-2. Maximum allowable applied force to a PB-FHR fuel element for various loading
scenarios. Calculated based on an internal Von Mises stress of 481 ± 12 MPa
(calculated, Hertz model) at the TRISO/graphite matrix, resulting from a 6.0-cm
pebble crushing strength of 23.6 ± 0.8 kN (experimental [25]). ............................ 24 Table 7-3. Maximum allowable applied force to a PB-FHR fuel element for various loading
scenarios. Calculated based on a maximum internal tensile stress of 17.0± 0.3 MPa
(calculated, Shook model), resulting from a 6.0-cm pebble crushing strength of
23.6 ± 0.8 kN (experimental). ................................................................................ 25
Fracture Analysis of Spherical Fuel Elements 5 | 30
Acronyms and Abbreviations
AVR – German Pebble Bed Research Reactor (AVR is an acronym for Arbeitsgemeinschaft
Versuchsreaktor)
BISO Fuel Particle – Bistructural-Isotropic Fuel Particle
DEM – Discrete Element Method
FHR – Fluoride Salt-Cooled High-Temperature Reactor
HTR – High Temperature Reactor
HTGR – High Temperature Gas Reactor
INET – Institute of Nuclear Energy Technology (INET), Tsinghua University
PB-FHR – Pebble-Bed Fluoride Salt-Cooled, High-Temperature Reactor
SINAP – Shanghai Institute of Applied Physics
THTR – Thorium High Temperature Reactor
TMSR-SF – Thorium Molten Salt Reactor – Solid Fuel
TRISO Fuel Particle – Tristructural-Isotropic Fuel Particle
UCB – University of California, Berkeley
USNRC – U.S. Nuclear Regulatory Commission

Fracture Analysis of Spherical Fuel Elements 6 | 30
1 Introduction
With the advancement of nuclear reactor design comes a requisite for advanced fuel
technologies. Arguably the most important performance requirement for advanced fuel
technologies is fission retention rate at very high temperatures. Tri-Structural Isotropic (TRISO)
fuel particles embedded in a spherical graphite fuel element have been identified as a strong
potential candidate to meet this requirement [7]. This fuel can be fabricated in a variety of
geometries, including spherical “pebble fuel” forms that enable online refueling. The mechanical
strength of such spherical fuel elements is a key issue affecting their use and safety.
Spherical fuel elements (also referred to as “pebble fuel”) have been fabricated and tested by
various organizations for operation in test reactors. Specifically, Germany and China have tested
pebble fuel for High Temperature Gas Reactors (HTGRs) such as the THTR, AVR and HTR-10
[6][7][25]. Pebble fuel has also been identified as a potential fuel element for use in Fluoride Salt
Cooled High Temperature Reactor (FHRs) by both China and the United States [1].
The Mark 1 Pebble Bed Fluoride Salt Cooled High Temperature Reactor (Mk1 PB-FHR) in
development at UC Berkeley identifies an ideal pebble fuel with half the diameter of pebble fuels
previously tested in Germany and China [1]. Pebble fuel fabricated for helium cooled HTGRs
has impressive strength—pebbles fabricated by the NUKEM company in Germany were
reported to survive 466 drop tests onto a steel plate from 4 meters in height [25]. However, with
pebble-bed reactor cores it would be valuable to be able to insert control rod elements directly
into the pebble bed, if this can be done without damaging or breaking fuel elements. Due to
previously experienced operational difficulties regarding pebble fuel mechanical strength under
control rod insertion in Germany [2], to be able to use control blades for reactivity shutdown in
PB-FHRs [3] it becomes important that the reduced diameter fuel elements be analyzed for
mechanical strength under control-blade insertion forces. This report examines previously
reported data on pebble fuel strengths and calculates equivalent strengths for a reduced diameter
pebble fuel based on assumed similarities in fracture properties and failure mechanisms.
2 Methodology
Pebble crushing strengths for 6.0-cm diameter fuel spheres have been published for several
studies [6][7][25]. The standard test reported in the literature is a diametrical compression test
between two flat steel plates. The compressive force that fails the pebble is the commonly
reported quantity. A detailed analysis of how this external loading condition causes failure in the
fuel elements has never been documented in publically available literature (to the knowledge of
the author). This report explores various models for the calculation of stress distribution in a
sphere under compression, and applies these models to the compressive testing of spherical fuel
elements. Three internal stress conditions are identified as possible criteria for failure in a fuel
pebble, with each being calculated and assessed for likelihood. These internal stress conditions
are then set as the criteria for failure in a Mk1 PB-FHR fuel pebble. An iterative solver is then
used to calculate the external load limits on a 3cm Mk1 PB-FHR fuel pebble that would result in
failure by the aforementioned internal stress conditions. The final result of this methodology is a

Fracture Analysis of Spherical Fuel Elements 7 | 30
set of maximum loading forces for three loading scenarios. This methodology can be seen
outlined in a block diagram in Figure 2-1.
Figure 2-1. Analysis methodology represented as a block diagram.
3 Pebble Fuel Physical Description and Published Mechanical
Specifications
3.1 HTGR and Mk1 PB-FHR Fuel Physical Description
Pebble fuel elements that have been fabricated and tested by German and Chinese reactor
programs have traditionally been comprised of fuel particles embedded in a 5cm diameter
spherical graphite matrix coated by a 0.5cm fuel-free outer graphite coating [6][7][25]. The mean
outer diameter of all previously tested and recorded HTGR spherical fuel elements is 6.0 cm.
German reactors also originally tested fuel spheres with Bi-Structural Isotropic (BISO) fuel
particles, but the Tri-Structural Isotropic (TRISO) fuel particles have become the norm in recent
years. The arrangement of HTGR fuel spheres can be seen in Figure 3-1.
Fracture Analysis of Spherical Fuel Elements 8 | 30
Figure 3-1. HTGR 6.0 cm pebble fuel physical arrangement [5]. Prismatic fuel compacts
loaded with fuel particles are also shown, but are not analyzed in this report.
The Mk1 PB-FHR fuel pebble design has an inner fuel-free low density graphite kernel,
surrounded by a fuel particle embedded graphite matrix annular shell, coated with an outer fuel-
free layer [1]. The low-density core allows the buoyancy of the pebbles to be adjusted. The
German and Chinese design uses a larger 6.0-cm sphere, while the Mk1 PB-FHR design uses a
smaller 3.0 cm sphere. Mk1 PB-FHR fuel specifications can be seen in Table 3-1, with the
physical schematic seen in Figure 3-2.

Fracture Analysis of Spherical Fuel Elements 9 | 30
Table 3-1. PB-FHR fuel pebble specifications [1].
Figure 3-2. Mk1 PB-FHR fuel pebble schematic.

Fracture Analysis of Spherical Fuel Elements 10 | 30
3.2 Previously Reported HTGR Fuel Pebble Mechanical Specifications
Because the 3.0-cm Mk1 PB-FHR fuel pebble design has never been fabricated nor tested, the
approach taken in this report is to extrapolate expected strengths for 3.0-cm pebbles based on
previously published strengths for 6.0-cm fuel pebbles. The common methodology for pebble
fuel strength testing is to crush a single pebble between two flat steel plates and record the force
required to cause failure. Data from the German and Chinese HTGR programs were collected for
this analysis and are displayed in Table 3-2 and Figure 3-3.
Table 3-2. Coated fuel particle and pebble fuel dimensions and relevant properties.
THTR AVR NUKEM INET (HTR-
10)
PB-FHR
Location of
Fabrication
Germany Germany Germany China -
Approximate
Fabrication Date
1986 1967 1985 2000 -
Type of Coated Fuel
Particle
BISO BISO TRISO TRISO TRISO
Fuel Kernel Diameter
(µm)
400 400 509 ± 9.7 497.7 ± 6.5 400
Porous PyC (Buffer)
Layer Thickness (µm)
80 50 100 ± 12.4 94.5 ± 4.9 100
Inner PyC Layer
Thickness (µm)
- - 39 ± 3.9 41.6 ± 3.3 35
SiC Layer Thickness
(µm)
- - 35 ± 1.9 36.6 ± 1.9 35
Outer PyC Layer
Thickness (µm)
110 120 39 ± 3.6 41.8 ± 1.8 35
Pebble Diameter
(mm)
60 60 60 59.2 - 60.2 30
Fuel-Free Zone
Thickness (mm)
7.5 7.5 Not
Documented
4.0 - 6.0 1
Documented Crushing
forces* (kN)
See Figure
3-3
See Figure
3-3 ⊥: 22.2 ∥: 24.1
⊥: 23.6 ± 0.8 ∥: 25.7 ± 1.0
-
Reference [6] [6] [25] [25] [1]
*⊥ and ∥ indicate perpendicular and parallel to the graphite C-axis orientation, respectively.
Fracture Analysis of Spherical Fuel Elements 11 | 30
Figure 3-3. Measured crushing forces for pebble fuel in the THTR and the AVR [6].
It should be noted that graphite for use in pebble fuel is typically fabricated to avoid a
preferential orientation of graphite grains in the graphite matrix [7]. The goal is to produce
graphite that exhibits isotropic properties, and thus contracts and swells isotropically under
neutron irradiation so it does not build up large stresses. The 10% difference in crushing
strengths between compressions parallel and perpendicular to the C-axis orientation of graphite
is therefore worth noting. It seems that while various articles have reported a high degree of
isotropic conformity in pebble fabrication, there are still detectable directional effects regarding
anisotropic strength properties. This emphasizes the importance of using pebble fabrication
methods that result in graphite matrix material that is as anisotropic as possible.
3.3 Material Properties
3.3.1 Graphite Material Properties
For a basic stress distribution analysis in a pebble fuel sphere, it is a logical simplification to
assume isotropic material properties for the fuel element as a whole. This analysis will treat the
fuel element as homogenous graphite, neglecting the effects that imbedded fuel particles will
have on the fuel element’s strength as a whole.
Material properties of graphite can be easily found in published literature, although their variance
is considerable. Graphite as a structural material has been continually modified and tested since
it was first utilized in Chicago Pile 1 in 1942. The variety and diversity of graphite materials,
considering they have only a single constituent element, is staggering. A simple literature review
can find a massive range of measured graphite properties [16][17][18][19][20][21][22][23][24].

Fracture Analysis of Spherical Fuel Elements 12 | 30
The DOE handbook on graphite design [17] has previously identified grade H-451 nuclear
graphite as an ideal reference graphite for nuclear core structure applications, with near-isotropic
properties. H-451 is used as the reference material in this study due to the lack of material
properties for graphite in fuel spheres. H-451 provides nuclear graphite properties that can be
used as inputs to the stress distribution models, which will likely be close to but not identical to
the material properties for graphite in fuel spheres. A more complete outline of H-451 properties
can be found in reference [18], although the level of detail is superfluous for this analysis. The
compiled material properties for H-451 graphite are summarized below in Table 3-3:
Table 3-3. Material properties of H-451 nuclear graphite.
It should be noted that graphite exhibits significant increase in elastic modulus after significant
radiation. These effects are neglected in this report, as the variation in crushing strength of AVR
spherical fuel elements has been measured as minimal for fast neutron fluences up to 5x1021 cm-2
[7].
3.3.2 Control Blade Material Properties
Control blade insertion directly into the Mk1 PB-FHR core has been studied as an attractive
shutdown mechanism [4]. Control blade contact with a pebble fuel sphere in the reactor core
during a shutdown event is of concern for fuel failure. The ideal control blade cladding material
is largely undefined for PB-FHR technology. For previous studies on HTGRs, control rods are
simply specified as “metal-clad” [12]. For application in FHR technology, 316-grade stainless
steel has been identified as a material with promising corrosion properties when in contact with
flibe [13]. For the purpose of this mechanical analysis, the control blade will be assumed to be a
homogeneous constructed using 316 stainless steel with a rounded edge with a minimum radius
of curvature of half the radius of a fuel sphere. The resulting control blade material properties are
seen here:
Parameter Value Reference
Elastic Modulus E 11.0 9.6 GPa [24]
Poisson’s Ratio 0.12 [17]
Fracture Toughness ICK 1.4 MPa m [17]

Fracture Analysis of Spherical Fuel Elements 13 | 30
Table 3-4. Material properties of 316 stainless steel.
Parameter Value Reference
Elastic Modulus 316SSE 193 GPa [14][15]
Poisson’s Ratio 316SS 0.25 [14][15]
Diameter of Curvature
(Mk1 PB-FHR Control
Blade) 1.5cm [4]
4 Assessment of Stress Models for Spheres under Compression
In this section, Hertzian contact mechanics are used to analyze spherical fuel elements under
compression [8]. Use of the Shook model is identified as an additional tool specifically
applicable for the failure of brittle spheres by internal tension [26]. Finally, each model is
assessed from a fracture mechanics perspective. For both the Hertz and Shook analyses, the fuel
sphere is assumed to be under diametrical two-point loading. This is a conservative assumption,
as it neglects a widely distributed load.
4.1 Hertzian Contact Analysis for the Stress Distribution in a Sphere
Contact forces on a single fuel pebble can be modeled by the Hertzian solution for contact stress
distribution between two spherical objects. A general schematic of the contact between two
spheres can be seen in Figure 4-1.

Fracture Analysis of Spherical Fuel Elements 14 | 30
Figure 4-1. Hertzian contact schematic between two spheres (Credit: Eberhard Bamberg,
University of Utah).
The major assumptions involved in this analysis are that only small strains are involved, the
contacts are frictionless, and that the spheres are in the elastic deformation regime. These are
reasonable approximations for graphite spherical fuel elements.
The Hertzian contact problem considers that if the spheres were not to deform, the contact area
would be infinitely small and the contact pressure would be infinitely large. In reality, a circular
contact area is created due to the elastic deformation of the spheres. The radius of contact
deformation circle is defined as follows [8]:
2 2
1 1 2 23
1 2
1 13
8 1 1
E EFa
d d
( 4.1 )
With variables defined as follows, many of which can be referred to in Figure 4-1.
a [m] is the radius of the contact deformation circle between two spheres.
F [N] is the uniaxial force applied to each sphere in contact.
[fraction] is Poisson’s Ratio. Subscript signifies which sphere.
E [Pa] is Young’s modulus. Subscript signifies which sphere.
d [m] is the diameter of the sphere before deformation. Subscript signifies which
sphere.

Fracture Analysis of Spherical Fuel Elements 15 | 30
This contact problem can also be used for a sphere contacting a flat plate, in which case the
diameter of the flat plate is set to infinity [8]. This will be useful when analyzing previously
performed fuel crushing tests between two steel plates.
The maximum pressure in the system can be found at the center of the contact circle, which is
defined as follows [8]:
max 2
3
2
FP
a ( 4.2 )
where maxP is the maximum pressure at the contact area in units of Pascals, and F and a are
defined the same as in equation ( 4.1 ).
The Cauchy Stress Tensor is used to fully define the stress state of the fuel elements. The stress
tensor is defined for this problem as follows with the Cartesian coordinate system as shown in
Figure 4-1:
11 12 13
21 22 23
31 32 33
x xy xz
yx y yz
zx zy z
( 4.3 )
The principle stresses in the Hertzian contact problem are the stresses in the ,x y and z
directions. Negative stresses are indicative of a compressive stress. The maximum stresses occur
on the z-axis, and are therefore of interest for the mechanical failure problem. The principle
stresses are defined as follows, with z defined as the depth on the z-axis below the contact circle
[8]:
1
1 2 max 2
2
1 11 tan 1
2 1x y
zP
a z a za
( 4.4 )
max
3 2
21
z
P
z
a
( 4.5 )
The shear stresses are defined as follows [8]:
max2 2
0
y zx z
xz yz
yx xy
( 4.6 )
The Von Mises stress is defined as [9]:

Fracture Analysis of Spherical Fuel Elements 16 | 30
2 2 22 2 2 21
62
VM x y y z z x xy xz yz
( 4.7 )
The Von Mises, shear and internal tensile stresses can be calculated to reach a maximum at a z-
value beneath the contact surface of the sphere (Figure 4-1). This implies that elastic spheres
under compression may experience internal mechanical fracture before such defects can be
observed externally. Figure 4-2 shows the resulting stress distribution for a sphere with graphite
material properties (Table 3-3) under an arbitrary loading force.
Figure 4-2. Stress distribution inside a sphere for the arbitrary loading condition seen in
Figure 4-1. σ/σmax is the stress normalized to the maximum pressure at the center of the
deformation contact circle. z/a is the depth in a sphere on the z-axis below the deformation
contact circle, normalized by the radius of the circle. Negative stress represents
compression.
4.2 Shook Model for the Stress Distribution in a Brittle Sphere
An analysis was developed specifically for the failure of brittle spheres undergoing a diametrical
compression by W. B. Shook [26] at the Department of Ceramics Engineering at Ohio State
University. Experimental crushing tests on glass spheres show failure by tension at the sphere’s
centroid. Shook developed a model to calculate the radial tension in a brittle sphere undergoing
diametrical compression, supporting these experimental results. The model is a modification of a
spherical stress distribution in a semi-infinite solid presented by Timoshenko and Goodier [27].
The Shook analysis calculates the internal radial stress (with a positive value signifying tension)
with equation ( 4.8 ):

Fracture Analysis of Spherical Fuel Elements 17 | 30
21
3
2r rr sphere z cd z c dz cd
F
d
( 4.8 )
where:
r sphere
[MPa] is the radial stress in a sphere
r [MPa] is the spherical stress distribution in a semi-infinite solid (equation ( 4.9 ))
z [m] is the depth in the sphere from the point of contact
c is a dimensionless distance such that c z d and 0 1c
d [m] is the diameter of the sphere
F [N] is the loading force
r is calculated using a modified Timoshenko and Goodier correlation for the spherical stress
distribution in a semi-infinite solid:
3
2 2 2 2 2
2 11 2
2r
zF z
a a z a z
( 4.9 )
with variables defined the same as in equation ( 4.8 ) and:
a [m] is the radius of the deformation contact circle
is the dimensionless Poisson’s Ratio
Additionally, for a 6.0-cm diameter sphere with graphite material properties (Table 3-3) as
inputs, the Hertz analysis can be shown to yield a similar internal tensile stresses as the Shook
analysis. The Shook analysis is used in this report as the preferred internal tension model because
of its specified use in brittle spheres.
4.3 Fracture Analysis of Brittle Spheres
Graphite is a brittle ceramic material with high strength but low fracture toughness. Accordingly,
graphite almost always fails by the rapid propagation of a crack, which acts as a stress raiser.
Because of the brittle properties of graphite, crack tips form relatively small plastic regions
compared to crack tips in ductile materials. The small plastic region in a brittle material cannot
sufficiently distribute the deformation energy, which causes the crack to propagate rapidly [11].
Previous tests have been able to experimentally show the propagation of cracks in brittle ceramic
discs made of anhydrous dicalcium phosphate [10]. A disk undergoing diametrical compressive
loading is an analogous problem to the spherical graphite contact problem. That is, disks and
spheres under compression will have similar Hertzian stress distributions. Furthermore, the Hertz
governing equations for stress distributions indicate that maximum combined stresses occur at
similar points in disks as in spheres [10]. Consequently, crack propagation is observed to
originate internally in disks, below the contact surface, as would be expected in spheres. The
crack is then observed to propagate inwards. The fracture of disks is particularly useful to
visualize the problem, as the fracture can be seen on the surface using microscopy (Figure 4-3).

Fracture Analysis of Spherical Fuel Elements 18 | 30
Figure 4-3. Fracture of a dicalcium phosphate anhydrous disk under compression. Uf is the
compressive displacement, D is the disk diameter, delta is the diameter of the contact
deformation circle [10].
The relationship of the material properties with the design stress controls the design process of
spherical graphite fuel elements. Fracture toughness and defect size are the material properties of
interest, and the design stress can be solved for using a Hertz or Shook contact analysis. The
appropriate governing equation to relate these variables is as follows [11]:
cK K c ( 4.10 )
with variables defined as follows:
cK [ MPa m ] is the critical stress intensity factor of a given loading scenario
[MPa] is the critical internal stress state
c [m] is the critical crack size
Equation ( 4.10 ) is also sometimes portrayed with a dimensionless geometry correction factor,
.Y In this analysis, the geometry factor will not be included because the actual mode and
geometry of fracture in fuel-particle-loaded spherical fuel elements is unknown. The mode and
geometry of fracture can be assumed to be the same between the 6.0-cm HTGR and 3.0-cm Mk1
PB-FHR fuel elements.
When using equation ( 4.10 ) for design, it becomes clear that two of the three variables can be
defined based on material properties, leaving the third variable (the stress state) to be a design
specification. For this analysis, cK and c are assumed to be fixed as material properties. cK and
c are also assumed to be the same between the 6cm HTGR and 3.0-cm Mk1 PB-FHR fuel

Fracture Analysis of Spherical Fuel Elements 19 | 30
elements. Therefore, the design variable becomes the internal stress state that results in fracture,
.
The internal stress state that causes fracture can be assumed to be one of several variables based
on the Hertz and Shook stress models.
One possibility is that a critical combined stress (Von Mises stress) will cause failure in a sphere
under compression [8][10]. This can be assumed to cause failure either anywhere in the fuel
sphere, or specifically at the TRISO matrix. Failure by combined stress at the TRISO matrix
presumes a stress concentration and therefore a likely failure location at the TRISO/graphite
interface. This theory assumes failure by a combined stress, which can be seen in Figure 4-2 as
dominated by compressive stresses. Graphite is very strong under compression, so this mode of
failure may not be realistic. This failure mode is still examined in this report as a conservative
analysis.
Another failure mode is failure by a maximum internal tensile stress. This would result in a
“Mode 1” fracture failure [11], supported and observed by the Shook analysis [26]. Because
ceramics are weak in tension, this failure mode is most likely and is likely to be a best-estimate
failure criteria.
5 Compression-Dominant Failure Analysis for HTGR Fuel
This section calculates the internal stress state of INET fuel pebbles under the crushing strength
of 23.6 ± 0.8 kN (by a flat steel plate) using a Hertzian analysis. The critical stress for failure is
assessed at the combined maximum Von Mises stress anywhere in the fuel sphere, and also
specifically at the TRISO/graphite matrix. The graphite properties are taken to be the same as H-
451 nuclear graphite (Table 3-3) based on the recommendations of the DOE graphite design
handbook for nuclear structural components [17]. H-451 nuclear graphite is likely to have
different properties than the graphite used in fuel spheres, but it is used as a reference material
due to the lack of recorded fuel sphere graphite properties. An average elastic modulus of 10.3
GPa for graphite is used as a nominally isotropic modulus. Properties for a stainless steel plate
are taken from Table 3-4 for 316 stainless steel, where the elastic modulus is 193 GPa, over an
order of magnitude stiffer than the graphite. A Hertzian contact analysis is performed, with
object 1 representing the 6.0 cm INET pebble, and object 2 representing a flat steel plate with
infinite radius. A sample calculation is shown here:
3 2 9 2 9
33 23.6 10 1 0.12 10.3 10 1 0.25 193 10
8 1 0.06 1
3.77
N Pa Paa
m
a mm
3
max 22
3 3 23.6 10794.72 MPa
2 2 0.00377
F NP
a m

Fracture Analysis of Spherical Fuel Elements 20 | 30
6 1
2
2
1 1794.72 10 1 tan 1 0.12
0.003772 10.00377
0.00377
x y
zz z Pa
zm zm
m
6
2
2
794.72 10
10.00377
z
Paz
z
m
2 2
0
y zx z
xz yz
yx xy
z zz zz z
The corresponding stress distribution (as a function of z) for the 6cm HTGR pebble can be seen
in Figure 5-1:
Figure 5-1. Calculated stress distribution (as a function of z) in a 6cm graphite fuel pebble
undergoing a 23.6 kN applied stress by a flat steel plate.
With the absolute maximum Von Mises stress calculated as:
23.6 0.8
max z 888 10
1.6
crushing
VM
F kN
MPa
z mm
And the maximum Von Mises stress calculated at the TRISO/graphite matrix:

Fracture Analysis of Spherical Fuel Elements 21 | 30
23.6 0.8
5 481 12
crushing
VM
F kN
z mm MPa
These values will be used as potential critical internal stress criteria in following sections.
6 Tension-Dominant Failure Analysis for HTGR Fuel
In this section, 6cm pebbles are analyzed for failure by the maximum internal tension calculated
by the Shook model. The loading scenario of the 6cm INET fuel sphere undergoing 23.6 ± 0.8
kN by flat steel plates is used, considering H-451 graphite properties (Table 3-3). The radius of
the deformed contact circle, a , is taken to be 3.77mm as calculated by the Hertzian analysis. The
stress distribution in the orientation perpendicular to the axis of compression can be seen here
calculated by both the Hertz (equation ( 4.4 )) and the Shook (equation ( 4.8 )) models:
Figure 6-1. Comparison of stress distributions orthogonal to the axis of compression.
The maximum tensile stress calculated by the Shook model is 17.0 0.3 MPa . This value will be
used as a potentially critical internal stress state in the following sections.
7 Calculated Mk1 PB-FHR Fuel Specifications
In this section, an iterative solver is used to calculate the external loading conditions of a 3.0-cm
Mk1 PB-FHR fuel pebble that would generate the same maximum internal stress conditions of a
6.0-cm pebble undergoing 23.6 ± 0.8 kN compression by a flat steel plate (as calculated in the
previous section).

Fracture Analysis of Spherical Fuel Elements 22 | 30
7.1 Mk1 PB-FHR Fuel Pebble Specifications Based on Compressive-
Dominant Stress States
The first possible failure criteria explored is the maximum internal combined Von Mises stress.
The major difference between compression of a 3cm and 6cm sphere is the deformation contact
circle area (equation ( 4.1 )) which is directly proportional to the sphere diameter. By decreasing
the sphere radius, the contact area is decreased, resulting in a much more concentrated contact
force. This effect can be seen below in Figure 7-1.
Figure 7-1. Deformation contact circle radius (left) and maximum internal combined Von
Mises stress (right) as a function of force applied by a flat steel plate, calculated using
equations ( 4.1 ) and ( 4.7 ), respectively.
Because of the increase in internal stress as a result of decreased sphere size, the external load
limits for a 3.0-cm PB-FHR pebble will be less than that of a 6.0-cm sphere. The result of
solving the external loading conditions for a maximum internal Von Mises stress of 888 ± 10
MPa can be seen below in Table 7-1.
Table 7-1. Maximum allowable applied force to a PB-FHR fuel element for various loading
scenarios. Calculated based on a maximum internal Von Mises stress of 888 ± 10 MPa
(calculated, Hertz model), resulting from a 6cm pebble crushing strength of 23.6 ± 0.8 kN
(experimental [25]).
Loading Scenario Maximum Allowable
Applied Force (kN) on a
3cm Fuel Pebble Based on
Maximum Von Mises
Steel Plate on Pebble
(Crushing Test) 5.9 ± 0.3

Fracture Analysis of Spherical Fuel Elements 23 | 30
Pebble on Pebble 5.3 ± 0.3
Steel Control Blade
on Pebble 0.66 ± 0.03
The second internal stress state that is considered as a failure condition is the combined Von
Mises stress specifically at the TRISO/graphite matrix interface. In a 6.0-cm pebble undergoing a
23.6 ± 0.8 kN compression by a flat steel plate, the Von Mises stress can be seen to be
concentrated in the 5mm outer fuel-free layer (see Figure 7-2, right). The Von Mises stress at the
TRISO/graphite interface (z=5mm) is calculated by the Hertz model to be 481 ± 12 MPa.
Analyzing a 3.0-cm spherical fuel element undergoing a compression by a steel plate, it is
evident that the Von Mises stress is concentrated at the TRISO/graphite interface (z=1mm) (see
Figure 7-2, left). It is not known how the presence of the TRISO particles changes the strength of
the pebble material. Further characterization of these limits is important in assessing the
compressive strength of the 3.0-cm Mk1 pebble design. The results of this analysis can be seen
summarized in Table 7-2.
Figure 7-2. Von Mises combined stress distribution (calculated by the Hertz analysis) in a
3cm Mk1 PB-FHR fuel sphere (left) and a 6cm sphere (right), with a line marking the start
of the TRISO/graphite matrix. Force is applied by a flat steel plate.
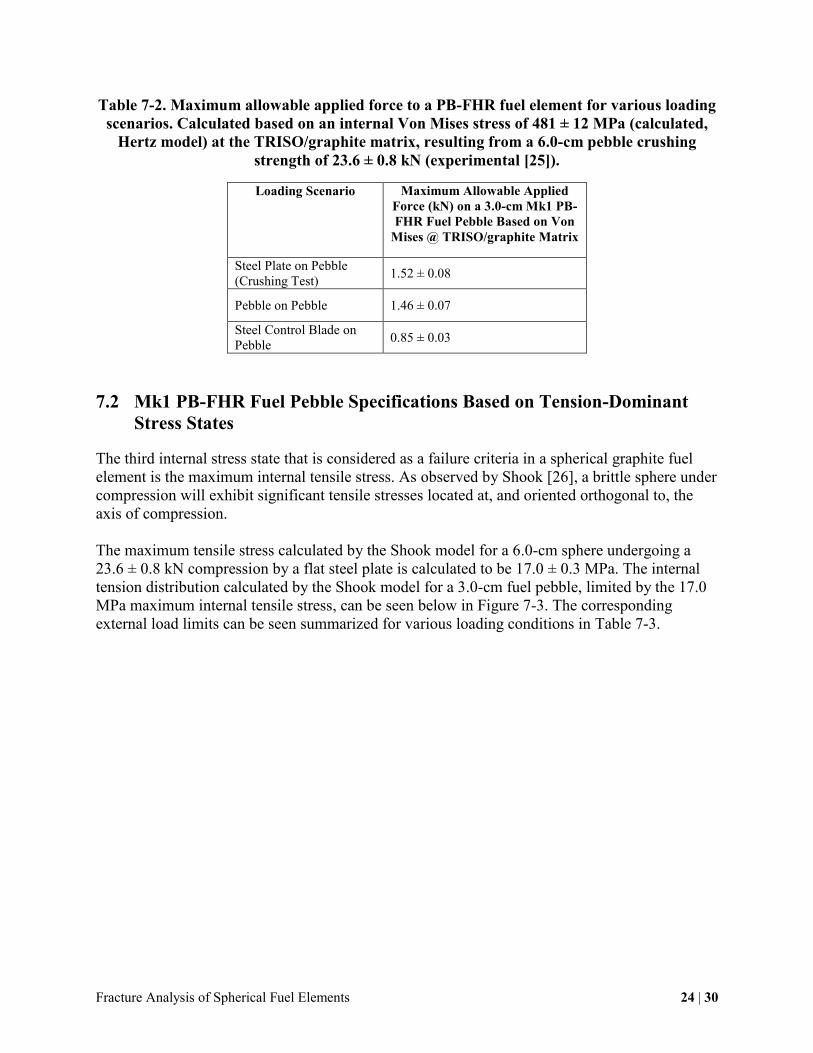
Fracture Analysis of Spherical Fuel Elements 24 | 30
Table 7-2. Maximum allowable applied force to a PB-FHR fuel element for various loading
scenarios. Calculated based on an internal Von Mises stress of 481 ± 12 MPa (calculated,
Hertz model) at the TRISO/graphite matrix, resulting from a 6.0-cm pebble crushing
strength of 23.6 ± 0.8 kN (experimental [25]).
Loading Scenario Maximum Allowable Applied
Force (kN) on a 3.0-cm Mk1 PB-
FHR Fuel Pebble Based on Von
Mises @ TRISO/graphite Matrix
Steel Plate on Pebble
(Crushing Test) 1.52 ± 0.08
Pebble on Pebble 1.46 ± 0.07
Steel Control Blade on
Pebble 0.85 ± 0.03
7.2 Mk1 PB-FHR Fuel Pebble Specifications Based on Tension-Dominant
Stress States
The third internal stress state that is considered as a failure criteria in a spherical graphite fuel
element is the maximum internal tensile stress. As observed by Shook [26], a brittle sphere under
compression will exhibit significant tensile stresses located at, and oriented orthogonal to, the
axis of compression.
The maximum tensile stress calculated by the Shook model for a 6.0-cm sphere undergoing a
23.6 ± 0.8 kN compression by a flat steel plate is calculated to be 17.0 ± 0.3 MPa. The internal
tension distribution calculated by the Shook model for a 3.0-cm fuel pebble, limited by the 17.0
MPa maximum internal tensile stress, can be seen below in Figure 7-3. The corresponding
external load limits can be seen summarized for various loading conditions in Table 7-3.
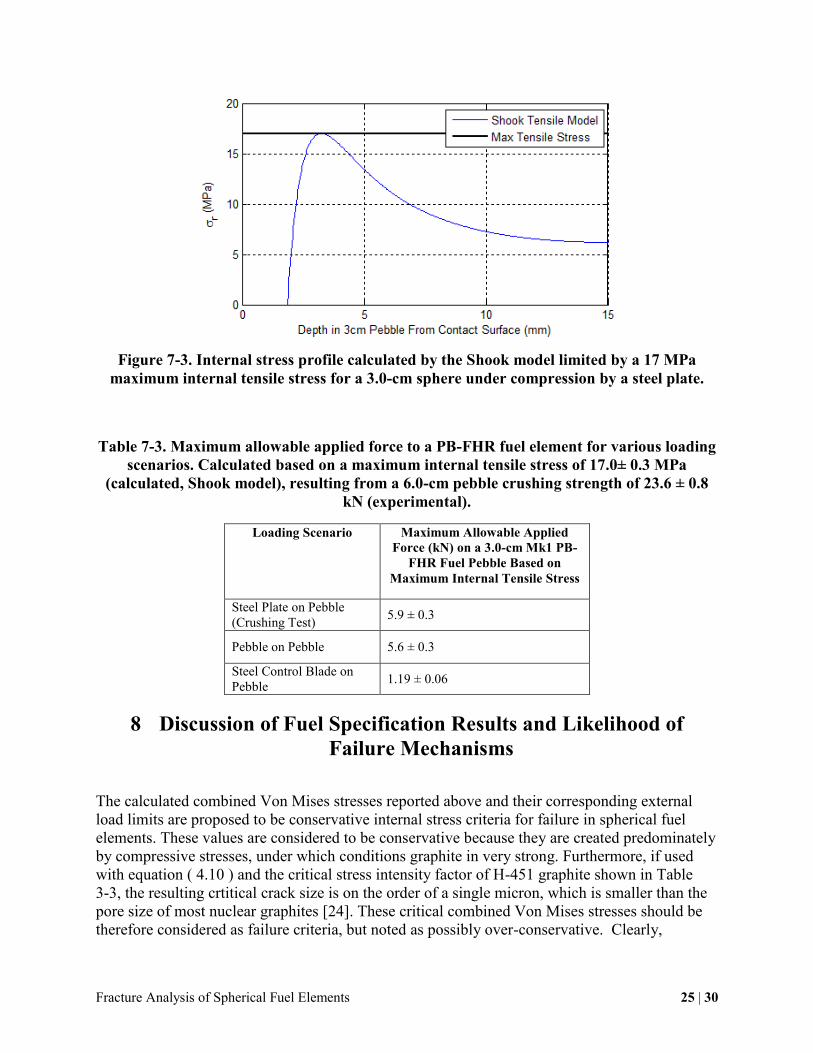
Fracture Analysis of Spherical Fuel Elements 25 | 30
Figure 7-3. Internal stress profile calculated by the Shook model limited by a 17 MPa
maximum internal tensile stress for a 3.0-cm sphere under compression by a steel plate.
Table 7-3. Maximum allowable applied force to a PB-FHR fuel element for various loading
scenarios. Calculated based on a maximum internal tensile stress of 17.0± 0.3 MPa
(calculated, Shook model), resulting from a 6.0-cm pebble crushing strength of 23.6 ± 0.8
kN (experimental).
Loading Scenario Maximum Allowable Applied
Force (kN) on a 3.0-cm Mk1 PB-
FHR Fuel Pebble Based on
Maximum Internal Tensile Stress
Steel Plate on Pebble
(Crushing Test) 5.9 ± 0.3
Pebble on Pebble 5.6 ± 0.3
Steel Control Blade on
Pebble 1.19 ± 0.06
8 Discussion of Fuel Specification Results and Likelihood of
Failure Mechanisms
The calculated combined Von Mises stresses reported above and their corresponding external
load limits are proposed to be conservative internal stress criteria for failure in spherical fuel
elements. These values are considered to be conservative because they are created predominately
by compressive stresses, under which conditions graphite in very strong. Furthermore, if used
with equation ( 4.10 ) and the critical stress intensity factor of H-451 graphite shown in Table
3-3, the resulting crtitical crack size is on the order of a single micron, which is smaller than the
pore size of most nuclear graphites [24]. These critical combined Von Mises stresses should be
therefore considered as failure criteria, but noted as possibly over-conservative. Clearly,

Fracture Analysis of Spherical Fuel Elements 26 | 30
experimental data for Mk1 fuel pebbles, once they have been fabricated, will be helpful to
further assess the force required to cause pebble failure.
The maximum tensile stress calculated by the Shook model for a 6.0-cm sphere undergoing a
23.6 ± 0.8 kN compression by a flat steel plate is calculated to be 17.0 ± 0.3 MPa. This critical
tensile stress value is corroborated by experimentally measured tensile tests (Figure 8-1)
performed under four-point bending tests in accordance with ASTM testing standards
[24][28][29].
Figure 8-1. Experimental and Burchell-model-predicted tensile failure probabilities for
four nuclear graphites [24].
The tensile strengths seen in Figure 8-1 for H-451 graphite are in the precise range that the
Shook model calculates as the maximum internal tensile stress in a 6-0cm fuel pebble
undergoing 23.6 kN of compression.
Furthermore, a calculation of the critical crack size (equation ( 4.10 )) for a tensile stress of
17.0 MPa and a fracture toughness of 1.4 MPa m yields a critical crack size on the order of a
millimeter, which is the size of the TRISO fuel particles. This calculated critical crack size is
also similar in magnitude to the observed pore sizes in nuclear graphites caused by the
manufacturing processes [24]. These data support the use of the maximum internal tensile stress
of a fuel pebble undergoing diametrical compression as the best-estimate failure criteria.
Based on this reasoning and the common vulnerability of brittle materials to tension, Table 7-3 is
expected to be the most accurate calculation of external load limits for a 3cm Mk1 PB-FHR fuel

Fracture Analysis of Spherical Fuel Elements 27 | 30
element. Further analysis could be done to calculate the external load limits based on a maximum
internal tensile stress specifically at the TRISO/graphite matrix, but the data in Figure 8-1
supports the use of 17.0 MPa as an absolute maximum tensile stress in a fuel element, until
measurements can be made with actual fuel pebbles.
Additionally, it should be noted that the immense variability in graphite properties adds further
uncertainty to this calculation. The exact properties of the graphites used in the German and
Chinese fuel fabrication processes are not recorded [6][7][25]. H-451 graphite properties were
chosen for this analysis, as recommended by the DOE graphite design handbook [17]. Taking
into consideration these assumptions, this analysis should be interpreted as a best estimate
warranting further investigation of exact properties.
9 Conclusions and Recommendations for Future Work
The results of this report highlight various potential criteria for failure in brittle graphite fuel
spheres. Expected limits on compressive loading conditions are set for the Mk1 PB-FHR reduced
diameter fuel spheres. While the Mk1 PB-FHR design specifies reduced diameter spherical fuel
elements for various improvements in the reactor design, it must be understood that sphere
diameter is directly proportional to compressive strength, although with smaller spheres bed
forces will be carried through larger numbers of stress chains, reducing the forces in individual
stress chains. The calculated external loading limits set forth in this report should help to assess
whether these fuel spheres are feasible. It is very likely that the reduced diameter fuel spheres
will exhibit a more even load distribution than large spheres, ensuring operation below the
reduced compressive limits. Additionally, the benefits from near-neutrally-buoyant spheres in
liquid salt should help to further reduce contact forces.
Additional work is required on fracture mechanics due to kinetic impact, as opposed to static
loading (which analyzed in this report). An analysis similar to the one in this report could be
performed on pebble drop tests, which are commonly performed to test pebble fuel impact
strength. This analysis would set limits on control blade approach velocity as a blade initially
contacts the pebble bed during an insertion event.
Further investigation of probable failure mechanisms in fuel-particle-loaded spheres is also
recommended. Crush tests of optically clear spheres (acrylic or glass) in a refraction-matched
liquid could help to reveal fracture mechanisms and locations. Additionally, optically clear
spheres loaded with representative fuel particles made of a relatively strong material could help
to show whether fracture is expected at the TRISO/graphite matrix or in an isotopically brittle
region.

Fracture Analysis of Spherical Fuel Elements 28 | 30
References
[1] C. Andreades, et al., “Technical Description of the ‘Mark 1’ Pebble-Bed Fluoride-Salt-
Cooled High-Temperature Reactor (PB-FHR) Power Plant,” Department of Nuclear
Engineering, U.C. Berkeley, Report UCBTH-14-002, 2014.
[2] S. Rubin. “Briefing on Visit of the NRC Delegation to Germany on Safety Aspects of
HTR Technology”. Nuclear Regulatory Commission. August 1, 2001. Document number
ML021960035. pbadupws.nrc.gov/docs/ML0219/.
[3] G. Buster, R. Sawadichai, M. Laufer, P. Peterson. “Control Blade Insertion Dynamics in
Pebble-Bed Fluoride-Salt-Cooled High-Temperature Reactors”. Department of Nuclear
Engineering, U.C. Berkeley, Report UCBTH-15-005, 2015.
[4] S. Chang, A. Gonzalez, J. Kong, N. Satterlee. “PB-FHR Reserve Shutdown System”.
Department of Nuclear Engineering, U.C. Berkeley, Report UCBTH-12-008, 2012.
[5] J. P. Duarte, J. J. R. Oliva and P. F. F. Frutuoso e Melo. “Generation IV Nuclear
Systems: State of the Art and Current Trends with Emphasis on Safety and Security
Features”. Department of Nuclear Engineering, Polytechnic School, Federal University of
Rio de Janeiro, Brazil. DOI: 10.5772/53140. August, 2012.
[6] K. Rollig, W. Theymann. “Operational Requirements of Spherical HTR Fuel Elements
and their Performance”. Hochtemperatur-Reactorbau GmbH. Mannheim, Federal
Republic of Germany. IAEA. INIS Vol. 31 Issue 41 Ref. Number: 31049614.
[7] A. W. Mehner, W. Heit, K. Rolling, H. Ragoss, H Muller. “Spherical Fuel Elements For
Advanced HTR Manufacture and Qualification by Irradiation Testing”. Journal of
Nuclear Materials. Issue 171 (1990). Pg. 9-18.
[8] R. G. Budynas, J. K. Nisbett. “Shigley’s Mechanical Engineering Design”. McGraw-Hill
Education, New York, NY. 10th Edition. 2015. Pgs. 136-140.
[9] N. E. Dowling. “Mechanical Behavior of Materials, Engineering Methods for
Deformation, Fracture, and Fatigue”. Prentice Hall. 4th Edition. 2012. Pg. 270-272.
[10] A.T. Procopio, A. Zavaliangos, J.C Cunningham. “Analysis of the Diametrical
Compression Test and the Applicability to Plastically Deforming Materials”. Journal of
Materials Science. 38 (2003) 3629-3639.
[11] R. W. Hertzberg. “Deformation and Fracture Mechanics of Engineering Materials”. John
Wiley & Sons Inc. 3rd Edition. 1989. Pgs. 287-289.
[12] General Atomics. “General Atomic’s Prismatic Modular High Temperature Gas Cooled
Reactor”. International Atomic Energy Agency, Advanced Reactors Information System
(IAEA, ARIS), Technical Data on Gas Cooled Reactors (GCR).
[13] G. Zheng, B. Kelleher, G. Cao, M. Anderson, T. Allen, K Sridharan. “Corrosion of 316
Stainless Steel in High Temperature Molten Salt Li2BeF4 (FLiBe) Salt”. Journal of
Nuclear Materials 461, 2015, 143-150.
[14] North American Stainless. “Flat Product Stainless Steel Grade Sheet 316 (S31600)/EN
1.4401”. ASTM and ASME certified. 2010.

Fracture Analysis of Spherical Fuel Elements 29 | 30
[15] AK Steel. “Product Data Sheet. 316/316L Stainless Steel UNS S31600 AND UNS
S31603”. AK Steel Corporation, West Chester, OH, 2007.
[16] J. J. Gebhardt, J. M. Berry. “Mechanical Properties of Pyrolytic Graphite”. Space
Sciences Laboratory, General Electric, Materials Sciences Section. Technical Information
Series 437144, Unclassified by the Defense Documentatin Center for Scientific and
Technical Information, AD 437144. Report #R64SD26, April 1964.
[17] General Atomics. “Graphite Design Handbook”. DOE-HTGR-88111 Revision 0.
September 1988.
[18] G. B. Engle. “Assessment of Grade H-451 Graphite for Replaceable Fuel and Reflector
Elements in HTGR”. General Atomic Company. GA-A14690 UC-77. December, 1977.
[19] G. B. Engle. "Properties of Unirradiated HTGR Core Support and Permanent Side
Reflector Graphites: PGX, HLM, 2020, and H-440N." ERDA Report GA-A14328, May
1977.
[20] G. B. Engle, L. A. Beavan, "Properties of Unirradiated Graphites PGX, HLM, and 2020
for Support and Permanent Side Reflector LHTGR Components," DOE Report GA-
A14646, June 1978.
[21] Ho, F. H., et al., “Biaxial Failure Surfaces of 2020 and PGX Graphites”, Paper No. L4/6,
P. 127, Transactions of the 7th International Conference on Structural Mechanics in
Reactor Technology, Chicago, IL, August 22, 1983.
[22] F. H. Vitovec, “Work of Fracture and Fracture Toughness of Graphite.” Journal of
Testing and Evaluation, JTEVA, Vol. 1, No. 3, May 1973, pp. 250-254.
[23] J. H. Yoon, T. S. Byun, J. P. Strizak, L. L. Snead. “Characterization of Tensile Strength
and Fracture Toughness of Nuclear Graphite NBG-18 Using Subsize Specimens.”
Journal of Nuclear Materials, Vol. 412, 2001, 315-320.
[24] T. D. Burchell. “Carbon Materials for Advanced Technologies”. Oak Ridge National
Laboratory. Elsevier Science Ltd. Oxford, UK, 1999. Pgs. 427-531.
[25] C. Tang, Y. Tang, J. Zhu, Y. Zou, J. Li, X. Ni. “Design and Manufacture of the Fuel
Element for the 10 MW High Temperature Gas-Cooled Reactor”. Nuclear Engineering
and Design, Vol. 218 (2008) pg. 91-102.
[26] D. R. Petrak, R. Ruh, W. B. Shook. “Elastic Properties of Boron Suboxide and the
Diametrical Compression of Brittle Spheres”. Ohio State University and the Air Force
Materials Laboratory at the Wright-Patterson Air Force Base. Distributed by the National
Technical Information Service, Vol. 22151. Technical Report AFML-TR-73-84. June
1973.
[27] S. P. Timoshenko, J. N. Goodier. “Theory of Elasticity”. Third Edition. McGraw-Hill.
1934. Pg. 406.
[28] ASTM C 749-92. “Standard Test Method for Tensile Stress-Strain of Carbon and
Graphite”. ASTM Standards Vol. 15.01, pp. 196 207, Pub. American Society for Testing
of Materials, Philadelphia, USA (1994).

Fracture Analysis of Spherical Fuel Elements 30 | 30
[29] ASTM Standard C651-91. “Standard Test Method for Flexural Strength of Manufactured
Carbon and Graphite Articles Using Four-Point Loading at Room Temperature”,
American Society for Testing and Materials, 1991.