Embed Size (px)
Citation preview

w w w . a u t o s t e e l . o r g
Fracture Prediction and Correlation of AlSi Hot Stamped
Steels with Different Models in LS DYNA
Gang Huang, Sriram Sadagopan, Hong Zhu, Min Kuo
ArcelorMittal
Yijung Chen, Cedric Xia, Omar Faruque
Ford Motor Company

w w w . a u t o s t e e l . o r g
Outline
• Introduction
• Selected fracture criteria in LS DYNA
• Calibration tests
– Determination of fracture strains
• FE simulations and parameter identification for
fracture criteria
• Model validation
– Test samples
– Components
• Conclusions

w w w . a u t o s t e e l . o r g
Introduction
• Overview
– Lightweighting of body structures to meet upcoming CAFÉ standards of 54.5 Mpg by 2025 while meeting stringent safety standards
– Use of CAE is a critical step in the design process
•Critical to ensure prediction accuracy when modeling crash loading
– ArcelorMittal’s AlSi coated hot stamping product, USIBOR® provides an excellent combination of manufacturability and performance
• Project Scope
– Characterize fracture behavior of USIBOR®
– Calibrate recently developed fracture models
– Use of fracture models in addition to computationally advanced CAE techniques to improve simulation accuracy

w w w . a u t o s t e e l . o r g
Fracture Criteria: Some Definitions
m
Stress triaxiality
6 21 1 cosarc
3
cos(3 )r
1 , 1
1 2 3
2 2 2
1 2 2 3 3 1
1/3
1 2 3
1( )
3
1( ) ( ) ( )
2
27( )( )( )
2
m
m m mr
Hydrostatic mean stress
von Mises stress
The third deviatoric stress invariant
Lode Angle
The normalized third stress invariant

w w w . a u t o s t e e l . o r g
Selected Fracture Criteria in LS DYNA
• Three fracture models implemented in LS DYNA are selected for fracture prediction
– MIT MMC Model
•Closed form solution for fracture strain as a function of the triaxiality factor and Lode angle – Implemented as discrete point input
– GISSMO Model
•Discrete points for fracture strain as a function of triaxiality factor and Lode angle
•Damage parameter included in calculation of stresses during solution process
– Modified Johnson-Cook Model
•Discrete points for fracture strain as a function of triaxiality factor

w w w . a u t o s t e e l . o r g
Selected Fracture Criteria in LS DYNA
• MIT MMC Model
• GISSMO Model
• Modified Johnson Cook Model
n
ss
f ff
CCC
K
1
2
6sin
3
1
6cos
3
11
6sec1
32
3
n
f
pD
pwp
n
n
f
dfdDn
dD
1
),(
,)(1
ppww dfD
f
ppww dfD
f
)(1
3
21
C
f eCC

w w w . a u t o s t e e l . o r g
Cut (a) Uniaxial (b) out test (c) Plane strain (d) Biaxial stretch (e) Equibiaxial
Calibration Tests
• Necessary for determination of fracture strains and
the stress state variables
• DIC for strain measurements
• FEA for stress history

w w w . a u t o s t e e l . o r g
Calibration Tests
• Uniaxial tension and cut-out tests
• Strain evolution and fracture strain measured by DIC
Test set-up Uniaxial tension Cut-out test

w w w . a u t o s t e e l . o r g
Calibration Tests
• Plane strain, biaxial and equibiaxial stretch
Test set-up
cameras
MTS LDH machine
Plane strain
Equibiaxial

w w w . a u t o s t e e l . o r g
Calibration Tests: Fracture strains
Major Minor Effective strain
Test 1-L 0.381 -0.238 0.385
Test 2-L 0.402 -0.232 0.404
Test 3-L 0.415 -0.259 0.419
Average 0.399 -0.243 0.403
Test 1-T 0.355 -0.228 0.360
Test 2-T 0.335 -0.212 0.339
Test 3-T 0.326 -0.241 0.338
Average 0.339 -0.227 0.346
Major strain Minor strain Effective strain
Test 1 0.183 -0.034 0.195
Test 2 0.189 -0.041 0.199
Test 3 0.2168 -0.047 0.228
Average 0.196 -0.041 0.207
Uniaxial tension Cut out test
w w w . a u t o s t e e l . o r g
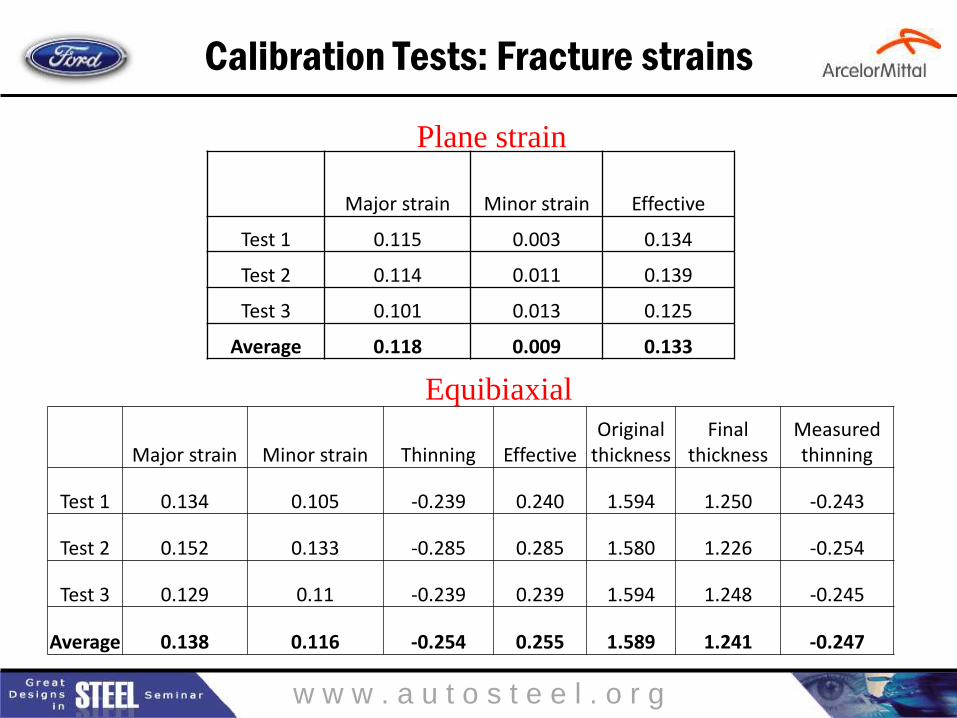
Calibration Tests: Fracture strains
Major strain Minor strain Thinning Effective Original
thickness Final
thickness Measured thinning
Test 1 0.134 0.105 -0.239 0.240 1.594 1.250 -0.243
Test 2 0.152 0.133 -0.285 0.285 1.580 1.226 -0.254
Test 3 0.129 0.11 -0.239 0.239 1.594 1.248 -0.245
Average 0.138 0.116 -0.254 0.255 1.589 1.241 -0.247
Equibiaxial
Major strain Minor strain Effective
Test 1 0.115 0.003 0.134
Test 2 0.114 0.011 0.139
Test 3 0.101 0.013 0.125
Average 0.118 0.009 0.133
Plane strain

w w w . a u t o s t e e l . o r g
Calibration Tests: Stress State History
12
0
5000
10000
15000
20000
25000
30000
35000
40000
45000
0 0.3 0.6 0.9 1.2 1.5
Load
(N)
Displacement (mm)
Load-displacement curve - cut-out sample
Experiment
Simulation
Cut out test
0
0.1
0.2
0.3
0.4
0.5
0.6
0.7
0.8
0 0.1 0.2 0.3 0.4
Tria
xial
ity/
Lod
e a
ngl
e
Effective plastic strain
Lode parameter
Triaxiality
Sample with cut-outStress state variables – cut out test

w w w . a u t o s t e e l . o r g 13
0
50
100
150
200
250
300
0 5 10 15 20 25 30
Load
(kN
)
Displacement (mm)
Load-displacement curves - Equibiaxial
Experiment -1
Experiment -2
Experiment -3
Simulation
Calibration Tests: Stress State History
-1.2
-1
-0.8
-0.6
-0.4
-0.2
0
0.2
0.4
0.6
0.8
0 0.1 0.2 0.3 0.4 0.5Tr
iaxi
alit
y/Lo
de
an
gle
Effective plastic strain
Lode parameter
Triaxiality
EquibiaxialStress state variables – equibiaxial test

w w w . a u t o s t e e l . o r g
Parameter Identification for Models
• Use of MATLAB to determine parameters for the
fracture model
Triaxiality Lode angle Fracture strain
Uniaxial 0.379 0.839 0.346
Cut-out 0.537 0.295 0.207
Plane strain 0.565 0.040 0.133
Biaxial 0.645 -0.870 0.232
Equi-biaxial 0.662 -0.999 0.255
Data points for MIT MMC model parameter identification

w w w . a u t o s t e e l . o r g 15
Calibration Results: MIT MMC Model

w w w . a u t o s t e e l . o r g
Calibration Results – GISSMO model

w w w . a u t o s t e e l . o r g
Calibration Results –Johnson-Cook Model
17
0.2 0.3 0.4 0.5 0.6 0.7 0.8 0.9 10
0.1
0.2
0.3
0.4
0.5
0.6
0.7
0.8
0.9
1
triaxility
fractu
re s
train
Modified Johnson-Cook model
Experimental data

w w w . a u t o s t e e l . o r g
0
5
10
15
20
25
30
35
0 1 2 3 4
Load
(KN
)
Displacement (mm)
Uniaxial Test
Experiment
CAE-GISSMO
CAE-MIT MMC
CAE-no fracture criterion
Model Validation: Test Samples
• Use of MIT-MMC and GISSMO models yield very
accurate predictions of failure

w w w . a u t o s t e e l . o r g
Model Validation: Test Samples
• Use of MIT-MMC and GISSMO models yield very
accurate predictions of failure
0
5
10
15
20
25
30
35
40
45
50
0 0.5 1 1.5Lo
ad (K
N)
Displacement (mm)
Cut-out sample
Experiment
CAE-GISSMO
CAE-MIT MMC
CAE-no fracture criterion

w w w . a u t o s t e e l . o r g
Model Validation: Components
• Sled tests
• Very fine model (100 M solid elements) for the B pillar
• 8 elements through the thickness
• Incorporation of weld properties in the simulation

w w w . a u t o s t e e l . o r g
Model Validation: Components

w w w . a u t o s t e e l . o r g
Model Validation: Components
• CAE predictions correlate very well to component test results
• Factors responsible for very good correlation
– Very fine mesh with solid elements
– Inclusion of damage in the simulations
– Incorporation of spot weld properties and HAZ in the simulation
• However computational resources required are very high

w w w . a u t o s t e e l . o r g
Conclusions
• Five tests with different stress states were used in
calibration of the 3 models in LS DYNA
• FEA simulation with implemented fracture models
performed on the calibration tests to verify
applicability of fracture models
• Incorporation of damage and spot weld properties
are very important for accurate predictions of
fracture behavior in component level testing