Embed Size (px)
Citation preview

Framework for Biodiversity Assessment
NSW Biodiversity Offsets Policy for Major Projects

© 2014 State of NSW and Office of Environment and Heritage With the exception of photographs, the State of NSW and Office of Environment and Heritage are pleased to allow this material to be reproduced in whole or in part for educational and non-commercial use, provided the meaning is unchanged and its source, publisher and authorship are acknowledged. Specific permission is required for the reproduction of photographs. Published by: Office of Environment and Heritage for the NSW Government 59 Goulburn Street, Sydney NSW 2000 PO Box A290, Sydney South NSW 1232 Phone: +61 2 9995 5000 (switchboard) Phone: 131 555 (environment information and publications requests) Fax: +61 2 9995 5999 TTY users: phone 133 677, then ask for 131 555 Speak and listen users: phone 1300 555 727, then ask for 131 555 Email: [email protected] Website: www.environment.nsw.gov.au Report pollution and environmental incidents Environment Line: 131 555 (NSW only) or [email protected] See also www.epa.nsw.gov.au ISBN 978 1 74359 754 5 OEH 2014/0675 September 2014

Contents iii
Contents List of figures ...................................................................................................................... vi
List of tables........................................................................................................................ vi
1 Background to the Framework for Biodiversity Assessment ....................................... 1
1.1 NSW Biodiversity Offsets Policy for Major Projects ............................................ 1
1.2 Relationship to the NSW planning legislation ..................................................... 1
1.3 Relationship to the Environment Protection and Biodiversity Conservation Act 1999 ............................................................................................................. 1
2 Overview of the Framework for Biodiversity Assessment ............................................ 2
2.1 Purpose and structure of the FBA ...................................................................... 2
2.2 Administration of the FBA ................................................................................... 2
2.2.1 Assessor accreditation ............................................................................ 2 2.2.2 Use of certified local data ........................................................................ 2 2.2.3 Updates to the Credit Calculator and databases .................................... 3
2.3 Environmental values not assessed under the FBA ........................................... 3
2.4 Assessment of impacts on aquatic biodiversity .................................................. 4
Stage 1 – Biodiversity assessment ................................................................................. 5
3 Introduction to Stage 1 ................................................................................................. 5
3.2 Format and content of the BAR .......................................................................... 5
3.3 Assessment of biodiversity values ...................................................................... 5
4 Assessing landscape features ..................................................................................... 7
4.1 Identifying landscape features ............................................................................ 7
4.2 Determining landscape value ............................................................................. 8
4.2.1 Assessment requirements ...................................................................... 8 4.2.2 Assessing percent native vegetation cover ............................................. 8 4.2.3 Assessing the connectivity value ............................................................ 9 4.2.4 Assessing the patch size ........................................................................ 9 4.2.5 Assessing the area to perimeter ratio ..................................................... 9
5 Assessing native vegetation ...................................................................................... 10
5.1 Mapping native vegetation extent on the development site .............................. 10
5.2 Stratifying native vegetation on the development site ...................................... 10
5.2.1 Identifying native PCTs and ecological communities ............................ 10 5.2.2 Identifying vegetation zones ................................................................. 12
5.3 Assessing site value (vegetation condition) ...................................................... 12
5.3.2 Plot and transect surveys ...................................................................... 14 5.3.3 Assessing the current site value score ................................................. 16
6 Assessing threatened species and populations ......................................................... 17
6.1 Threatened Species Profile Database .............................................................. 17

iv Framework for Biodiversity Assessment
6.2 Species that can be predicted by habitat surrogates (ecosystem credits) ........ 18
6.3 Steps for identifying ecosystem credit species on a development site ............. 18
6.4 Assessing species that cannot be predicted by habitat surrogates (species credits) .............................................................................................................. 19
6.5 Steps for identifying species credit species ...................................................... 19
6.6 Undertaking a threatened species survey ......................................................... 22
6.6.2 Using expert reports instead of undertaking a survey ........................... 22
Stage 2 – Impact assessment (biodiversity values) ..................................................... 23
7 Introduction to Stage 2 ............................................................................................... 23
7.1 Documenting Stage 2 outcomes ....................................................................... 23
8 Avoid and minimise impacts on biodiversity values ................................................... 24
8.2 Assessment of impacts ..................................................................................... 24
8.3 Demonstrating avoidance and minimisation of direct impacts on biodiversity values ................................................................................................................ 24
8.3.2 Guidelines for the avoidance and minimisation of impacts to biodiversity values during the project life cycle...................................... 26
8.3.3 Confirming the proposed boundary of the development footprint .......... 28 8.4 Demonstrating minimisation of indirect impacts on biodiversity values using
reasonable onsite measures ............................................................................. 28
9 Thresholds for the assessment and offsetting of unavoidable impacts of development ............................................................................................................... 30
9.2 Impacts on biodiversity that require further consideration ................................. 31
9.2.2 Information to be provided with impacts that require further consideration ......................................................................................... 32
9.2.3 Impacts on landscape features .............................................................. 32 9.2.4 Impacts on native vegetation ................................................................. 34 9.2.5 Impacts on threatened species .............................................................. 35
9.3 Impacts for which the assessor is required to determine an offset requirement ....................................................................................................... 36
9.3.1 Impacts on native vegetation ................................................................. 36 9.3.2 Impacts on species and populations ..................................................... 36
9.4 Impacts for which the assessor is not required to determine an offset ............. 37
9.4.1 Impacts on native vegetation ................................................................. 37 9.4.2 Impacts on species and populations ..................................................... 37
9.5 Impacts that do not require further assessment by the assessor ...................... 37
10 Determining the offset requirement ............................................................................ 38
10.2 Calculating the credit requirement .................................................................... 38
10.2.1 Ecosystem credits and species credits .................................................. 38 10.3 Calculating the future site value score for vegetation zones on the
development site ............................................................................................... 38

Contents v
10.4 Calculating the change in the site value score for vegetation zones on the development site .............................................................................................. 39
10.4.2 Assessing the direct impact of the Major Project on landscape values 40 10.4.3 Calculating the ecosystem credits that measure the direct impact on
vegetation that is a CEEC/EEC or contains threatened species habitat ................................................................................................... 40
10.4.4 Calculating the species credits that measure the direct impact of a Major Project on threatened species .................................................... 41
10.4.5 Credit profile for ecosystem credits and species credits ....................... 41 10.5 Offset rules for biodiversity values .................................................................... 42
10.5.2 Ecosystem credit offset requirement ..................................................... 43 10.5.3 Using an ecosystem credit created at an offset site to offset a
required ecosystem credit ..................................................................... 43 10.5.4 Variation of the offset rules and supplementary measures for
ecosystem credits ................................................................................. 43 10.5.5 Defining a suitable offset for individual threatened species .................. 44 10.5.6 Using a species credit created from an offset site to offset a required
species credit ........................................................................................ 44 10.5.7 Variation of the offset rules and supplementary measures for species
credits ................................................................................................... 44
Stage 3 – Biodiversity Offset Strategy .......................................................................... 46
11 Introduction to Stage 3 ............................................................................................... 46
11.1 Documenting Stage 3 outcomes ...................................................................... 46
11.2 Conservation measures that can be used to provide an offset ........................ 46
12 Calculating gain in biodiversity values at an offset site .............................................. 47
12.1 Assessing biodiversity values at an offset site ................................................. 47
12.2 Generating biodiversity credits for ecological rehabilitation of previously mined land ........................................................................................................ 47
12.2.2 Calculating biodiversity credits for the rehabilitation of mined land ...... 50
Definitions ......................................................................................................................... 53
Appendix 1: Mathematical equations used in the FBA ..................................................... 62
Appendix 2: Ordering of waterways and riparian buffer distances ................................... 71
Appendix 3: Guidelines for the collection of benchmark data from local reference sites or published sources .................................................................................... 73
Appendix 4: Assessing landscape value for site-based developments ............................ 74
Appendix 5: Assessing landscape value for linear shaped developments, or multiple fragmentation impacts .................................................................................. 83
Appendix 6: Map of IBRA subregions in major catchment areas of NSW ........................ 89
Appendix 7: Reporting requirements for the FBA ............................................................. 98

vi Framework for Biodiversity Assessment
List of figures Figure 1: Strahler stream ordering system ..................................................................... 71
Figure 2: Map of IBRA subregions in major catchment areas of NSW .......................... 89
List of tables Table 1: Floristic survey data collected at the development site .................................. 11
Table 2: Scoring and weighting of the site attributes .................................................... 13
Table 3: Minimum number of transects/plots required per zone area ........................... 15
Table 4: Impact thresholds for landscape features, native vegetation, and threatened species and populations ............................................................... 30
Table 5: Attributes of the credit profile for ecosystem credits ....................................... 42
Table 6: Maximum allowable increases in the site attribute condition score as a result of proposed ecological rehabilitation works .......................................... 51
Table 7: Riparian buffer distances ................................................................................ 72
Table 8: Allowable combinations of inner and outer assessment circles ...................... 74
Table 9: Determining percent native vegetation cover in the landscape ...................... 75
Table 10: Connectivity value classes for site based development ................................. 77
Table 11: Linkage width classes for site based developments ....................................... 77
Table 12: Linkage condition classes (woody vegetation) ............................................... 79
Table 13: Linkage condition classes (non-woody vegetation) ........................................ 79
Table 14: Scores for loss of linkage condition/width, based on number of thresholds crossed .......................................................................................... 81
Table 15: Criteria for assessing patch size ..................................................................... 82
Table 16: Determining percent native vegetation cover in the landscape (550 m buffer from the centre point of the development) ............................................ 84
Table 17: Connectivity value scores for linear shaped developments or development that has multiple fragmentation impacts .................................... 85
Table 18: Criteria for assessing patch size ..................................................................... 86
Table 19: Scores for proportional change in area to perimeter ratio .............................. 88
Table 20: Minimum information requirements for the Biodiversity Assessment Report (Stage 1) ............................................................................................. 99
Table 21: Minimum information requirements for the Biodiversity Assessment Report (Stage 2) ........................................................................................... 102
Table 22: Minimum information requirements for the Biodiversity Offset Strategy (Stage 3) ....................................................................................................... 104

Background to the Framework for Biodiversity Assessment 1
1 Background to the Framework for Biodiversity Assessment
1.1 NSW Biodiversity Offsets Policy for Major Projects 1.1.1.1 The NSW Government has developed a NSW Biodiversity Offsets Policy for
Major Projects (the policy). Major projects include State Significant Development (SSD) and State Significant Infrastructure (SSI).
1.1.1.2 The policy: (a) establishes a set of offsetting principles for Major Projects (b) defines key thresholds for when offsetting is required (c) adopts an assessment methodology to quantify and describe the offset
required (d) defines mechanisms required to establish offset sites (e) provides a range of flexible options that can be used in lieu of providing
offsets, including rehabilitation actions and supplementary measures.
1.1.1.3 Further information on the policy can be found at www.environment.nsw.gov.au/biodivoffsets/bioffsetspol.htm.
1.2 Relationship to the NSW planning legislation 1.2.1.1 As part of an application for a Major Project under the Environmental Planning
and Assessment Act 1979 (EP&A Act), a proponent must prepare an Environmental Impact Statement (EIS). Before preparing an EIS, proponents must apply to the Secretary of the Department of Planning and Environment (DP&E) for the Secretary’s Environmental Assessment Requirements (SEARs). The SEARs set out matters to be addressed in the EIS.
1.2.1.2 Under the NSW Biodiversity Offsets Policy for Major Projects, the SEARs will require a proponent to apply the Framework for Biodiversity Assessment (FBA) to assess impacts on biodiversity. The FBA will also be applied to identify reasonable measures and strategies that can be taken to avoid and minimise impacts on biodiversity. A Biodiversity Assessment Report (BAR) will describe the biodiversity values present on the development site and the impact of the Major Project on these values. The Biodiversity Offset Strategy (BOS) will outline how the proponent intends to offset the impacts of the Major Project. These reports form part of the EIS.
1.2.1.3 The Secretary may identify in the SEARs additional assessment requirements for biodiversity impacts not considered by the FBA (refer to Section 2.3). These impacts will be documented separately in the EIS.
1.3 Relationship to the Environment Protection and Biodiversity Conservation Act 1999
1.3.1.1 Matters of National Environmental Significance (MNES) are protected under the Environment Protection and Biodiversity Conservation Act 1999 (EPBC Act).
1.3.1.2 The FBA requires proponents to identify and assess the impacts on all nationally listed threatened species and threatened ecological communities that may be on the development site. Other MNES are not considered by the FBA.

2 Framework for Biodiversity Assessment
2 Overview of the Framework for Biodiversity Assessment
2.1 Purpose and structure of the FBA 2.1.1.1 The Framework for Biodiversity Assessment (FBA) underpins the Biodiversity
Offsets Policy for Major Projects. It contains the assessment methodology that is adopted by the policy to quantify and describe the impact assessment requirements and offset guidance that apply to Major Projects.
2.1.1.2 The FBA sets out: (a) requirements for a reliable and transparent assessment of biodiversity
values on land in order to: (i) identify the biodiversity values subject to a proposed major
development (ii) determine the impacts of Major Projects on biodiversity as part of an
application for approval to undertake the Major Project under NSW planning legislation
(iii) quantify and describe the biodiversity offsets required for the unavoidable impacts of Major Projects on biodiversity values
(b) types of conservation measures that are available to offset the unavoidable impacts of Major Projects, and how they may be used by a proponent to prepare a BOS as part of an application for approval to undertake the Major Project.
2.1.1.3 The FBA must be used by a proponent to assess all biodiversity values on the development site for a Major Project.
2.1.1.4 Where a proponent is proposing to establish an offset site as part of the BOS for the Major Project, the Biobanking Assessment Methodology (BBAM) must be used to assess the biodiversity values of the offset site and to identify the number and type of biodiversity credits that may be created on the offset site.
2.2 Administration of the FBA 2.2.1 Assessor accreditation 2.2.1.1 For the purpose of preparing a Biodiversity Assessment Report (BAR) and a
Biodiversity Offset Strategy (BOS), the application of the FBA to determine the number of biodiversity credits required at a development site must be made by a person accredited in accordance with section 142B(1)(c) of the Threatened Species Conservation Act 1995 (TSC Act).
2.2.2 Use of certified local data 2.2.2.1 When preparing a BAR, an assessor is generally required to make use of the
following databases maintained by the Office of Environment and Heritage (OEH): (a) NSW Vegetation Information System Classification Database (VIS
Classification Database) (b) Threatened Species Profile Database (c) Vegetation Benchmarks Database (d) Over-cleared landscapes database (Mitchell landscapes).
Overview of the Framework for Biodiversity Assessment 3
2.2.2.2 The Directory of Important Wetlands of Australia (DIWA), maintained by the Australian Government, is also used in the FBA.
2.2.2.3 The consent authority, in consultation with OEH, may certify that more appropriate local data can be used instead of the data in these databases.
2.2.2.4 Local data may be used if the consent authority, in consultation with OEH, is of the opinion that it more accurately reflects local environmental conditions than the data in the databases.
2.2.2.5 Benchmark data that more accurately reflect the local environmental conditions for a plant community type (PCT) may be collected from local reference sites, or obtained from relevant published sources using the procedures set out in Appendix 3.
2.2.2.6 The certified local data can then be used in applying the FBA in accordance with any procedures outlined in the FBA Operational Manual.
2.2.3 Updates to the Credit Calculator and databases 2.2.3.1 The Credit Calculator is a decision support system provided by OEH to assist
assessors to comply with the requirements of the FBA.
2.2.3.2 An accredited assessor must use the Credit Calculator to undertake an assessment of the impacts of the Major Project on biodiversity values and to prepare a BAR. The Biobanking Credit Calculator must be used by an accredited assessor to undertake an assessment of the biodiversity values of an offset site for a Major Project and to prepare a BOS.
2.2.3.3 The databases listed in Subsection 2.2.2, which are used in the FBA and the Credit Calculator, are updated periodically in response to increased knowledge about biodiversity values and relevant biodiversity data. Changes to the databases may require an updated version of the Credit Calculator to be issued by OEH.
2.2.3.4 OEH will notify persons accredited to use the FBA and Credit Calculator when an updated version of the Credit Calculator is available. The most recent version of the Credit Calculator must be used when using the FBA to assess a development site for a Major Project unless the consent authority has provided approval in writing for a previous version of the Credit Calculator to be used.
2.3 Environmental values not assessed under the FBA 2.3.1.1 Biodiversity values not considered under the FBA include:
(a) marine mammals (b) wandering sea birds (c) biodiversity that is endemic to Lord Howe Island.
2.3.1.2 In addition, the FBA does not assess the direct impacts of a project that are not associated with clearing of vegetation. Examples of these impacts include, but are not limited to: (a) bird and bat strike associated with wind farm developments (b) vehicle strike (c) subsidence and cliff falls associated with mining developments (d) downstream impacts on hydrology and environmental flows on surface
vegetation and groundwater dependent ecosystems (e) impacts on karst ecosystems.

4 Framework for Biodiversity Assessment
2.3.1.3 Separate assessment of these and other impacts not covered in the FBA may be required. Any additional biodiversity assessment requirements will be incorporated into the SEARs.
2.3.1.4 Impacts on other environmental values, including hydrology, flooding, water quality, air quality, salinity, land and soils, Aboriginal cultural heritage and historic heritage are also not considered by the FBA. Separate assessments may be required for these matters, and may be set out in the SEARs.
2.4 Assessment of impacts on aquatic biodiversity 2.4.1.1 If there are likely to be impacts on aquatic biodiversity, proponents should
refer to the Fisheries NSW policy and guidelines for fish habitat conservation and management (Update 2013) (Fisheries NSW policy and guidelines). These provide guidance on assessment of impacts on aquatic biodiversity and requirements for avoiding, minimising and offsetting these impacts. The Fisheries NSW policy and guidelines can be found at: www.dpi.nsw.gov.au/fisheries/habitat/publications/policies,-guidelines-and-manuals/fish-habitat-conservation.
2.4.1.2 For clarity, impacts on PCTs classified as saline wetlands are to be assessed under the Fisheries NSW policy and guidelines. All other impacts on PCTs, including those classified as other types of wetlands, are to be assessed under the FBA.
Introduction to Stage 1 5
Stage 1 – Biodiversity assessment 3 Introduction to Stage 1 3.1.1.1 The Biodiversity Assessment Report (BAR) (Stage 1):
(a) may be provided to OEH in draft form for consultation during the preparation of the EIS and before the applicant proceeds to Stage 2 (optional); and/or
(b) combined with the reporting requirements from Stage 2 and submitted as part of the EIS and an application for development consent or infrastructure approval (refer to Section 7.1).
3.2 Format and content of the BAR 3.2.1.1 The outcomes of Stage 1 are documented in a BAR. The BAR must be
prepared by an accredited assessor and must contain the matters identified in Appendix 7.
3.2.1.2 The assessor must include in the BAR two base maps which are to be based on digital aerial photography (such as ADS–40 imagery) or the best available imagery of the development site: (a) a Site Map of the development site(s), recommended at a scale of 1:1,000
or finer, showing: (i) boundary of the development site (ii) cadastre
(b) a Location Map recommended at a scale of 1:10,000 or finer and showing: (i) all landscape features assessed in Chapter 4 (ii) boundary of the development site (iii) additional relevant detail such as local government area boundaries
or other base data relevant at this scale.
3.2.1.3 The extent of the Location Map must, at the minimum, include the area covered by the outer assessment circle according to Appendix 4, or the buffer area surrounding the development footprint according to Appendix 5.
3.2.1.4 The digital shape-files for all maps and spatial information contained in the BAR must be provided as part of the application for approval.
3.3 Assessment of biodiversity values 3.3.1.1 Unless exempt in accordance with Paragraph 3.3.1.3 below, the assessor
must undertake an assessment of the biodiversity values of the development site by assessing the: (a) landscape value of the development site in accordance with Chapter 4,
and (b) biodiversity values of native vegetation on the development site in
accordance with Chapter 5, and (c) biodiversity values of threatened species at the development site in
accordance with Chapter 6.

6 Framework for Biodiversity Assessment
3.3.1.2 In this section, vegetation zone means a vegetation zone identified in accordance with Section 5.3.
3.3.1.3 If, during the assessment of biodiversity values of a vegetation zone, the assessor determines that: (a) it does not contain native vegetation; or (b) it has a site value score of 17 or less, and (c) a PCT identified in the vegetation zone is not listed as a critically
endangered or endangered ecological community
then for that vegetation zone: (d) assessment of native vegetation is not required beyond Subsection 5.3.3;
and (e) an assessment of threatened species habitat according to Sections 6.2
and 6.3 is not required.
Sections within Stage 1 4 Assessing landscape features ...................................................................................... 7
4.1 Identifying landscape features ............................................................................ 7
4.2 Determining landscape value .............................................................................. 8
5 Assessing native vegetation ....................................................................................... 10
5.1 Mapping native vegetation extent on the development site .............................. 10
5.2 Stratifying native vegetation on the development site ....................................... 10
5.3 Assessing site value (vegetation condition) ...................................................... 12
6 Assessing threatened species and populations ......................................................... 17
6.1 Threatened Species Profile Database .............................................................. 17
6.2 Species that can be predicted by habitat surrogates (ecosystem credits) ........ 18
6.3 Steps for identifying ecosystem credit species on a development site ............. 18
6.4 Assessing species that cannot be predicted by habitat surrogates (species credits) .............................................................................................................. 19
6.5 Steps for identifying species credit species ...................................................... 19
6.6 Undertaking a threatened species survey ......................................................... 22

Assessing landscape features 7
4 Assessing landscape features
4.1 Identifying landscape features 4.1.1.1 In this section, a range of landscape features must be identified. These
landscape features will: (a) include features that are protected under legislation, regulation, policy or
inter-governmental agreement, and therefore have a range of biodiversity values that are important to assess
(b) help guide the location and delineation of vegetation zone boundaries.
4.1.1.2 The following features should be shown on both the Site Map and Location Map: (a) IBRA bioregions and IBRA subregions (b) Mitchell landscapes (c) rivers and streams (d) wetlands (e) extent of native vegetation in the outer assessment circle or the buffer
area surrounding the development footprint (f) any other landscape features that are required by the SEARs for
assessment at a development site.
IBRA bioregions and IBRA subregions
4.1.1.3 All IBRA bioregions and IBRA subregions within the development site must be identified and shown on the Site Map.
4.1.1.4 Any other regions within the outer assessment circle must be identified and shown on the Location Map.
Mitchell landscapes
4.1.1.5 All Mitchell landscapes within the development site must be identified and shown on the Site Map.
4.1.1.6 Any other Mitchell landscapes that occur within the outer assessment circle must be identified and shown on the Location Map.
4.1.1.7 This is relevant to assessing the landscape value of the development site.
Rivers, streams and estuaries
4.1.1.8 All rivers, streams and estuaries that occur within the development site, and their riparian buffer areas, must be identified and shown on the Site Map.
4.1.1.9 All other rivers, streams and estuaries that occur within the outer assessment circle, and their riparian buffer areas, must be identified and shown on the Location Map.
4.1.1.10 The mapped rivers and streams must be classified according to their stream order (Strahler). The riparian buffer areas for rivers, streams and estuaries must be applied according to Appendix 2.

8 Framework for Biodiversity Assessment
Wetlands
4.1.1.11 All important and local wetlands that occur within the development site must be identified and shown on the Site Map.
4.1.1.12 Any other important and local wetlands that are adjacent to or downstream from the development site and within the outer assessment circle must be identified and shown on the Location Map.
4.1.1.13 Important wetlands must also be separately identified and shown on the Site Map and the Location Map.
Native vegetation extent (outer assessment circle or buffer area surrounding the development footprint)
4.1.1.14 The extent of native vegetation within the outer assessment circle, or the buffer area surrounding the development footprint, must be mapped onto digital aerial photography (such as ADS–40 imagery) or the best available imagery of the development site, and shown on the Location Map.
4.1.1.15 The capture scale for native vegetation extent should be 1:1,000 – 1:5,000, and preferably not greater than 1:10,000.
State or regionally significant biodiversity links
4.1.1.16 All state or regionally significant biodiversity links that occur within the development site must be identified and shown on the Site Map.
4.1.1.17 All state or regionally significant biodiversity links that occur within the outer assessment circle must be identified and shown on the Location Map.
Other landscape features
4.1.1.18 Other landscape features should be mapped on both the Site Map and Location Map if this is a requirement of the SEARs.
4.2 Determining landscape value
4.2.1 Assessment requirements 4.2.1.1 To determine the landscape value of a development site an assessor must
assess the following landscape attributes of the site, in accordance with Subsections 4.2.2 to 4.2.5: (a) percent native vegetation cover in the landscape (b) connectivity value (c) patch size (d) area to perimeter ratio.
4.2.2 Assessing percent native vegetation cover 4.2.2.1 For a Major Project that is a site-based development:
(a) the current percent native vegetation cover, and (b) the future percent native vegetation cover
of the development site must be assessed in accordance with Appendix 4.

Assessing landscape features 9
4.2.2.2 For a Major Project that is a linear shaped development or a multiple fragmentation impact development: (a) the current percent native vegetation cover, and (b) the future percent native vegetation cover
of the development site must be assessed in accordance with Appendix 5.
4.2.3 Assessing the connectivity value 4.2.3.1 For a Major Project that is a site-based development the connectivity value
score of the development site must be assessed in accordance with Appendix 4.
4.2.3.2 For a Major Project that is a linear shaped development or multiple fragmentation impact development, the connectivity value score of the development site must be assessed in accordance with Appendix 5.
4.2.4 Assessing the patch size 4.2.4.1 For a Major Project that is a site-based development the patch size score
must be assessed in accordance with Appendix 4.
4.2.4.2 For a Major Project that is a linear shaped development or a multiple fragmentation impact development the patch size score must be assessed in accordance with Appendix 5.
4.2.5 Assessing the area to perimeter ratio 4.2.5.1 For a Major Project that is a linear shaped development, or a multiple
fragmentation impact development, the area to perimeter ratio must be assessed in accordance with Appendix 5.

10 Framework for Biodiversity Assessment
5 Assessing native vegetation 5.1 Mapping native vegetation extent on the development site 5.1.1.1 The extent of native vegetation within the development site must be mapped
onto digital aerial photography (such as ADS-40 imagery) or the best available imagery of the development site, using existing maps of native vegetation in the area and an assessment of the site. The capture scale should be 1:1,000 – 1:5,000, and not greater than 1:10,000.
5.1.1.2 The native vegetation extent on the development site must be shown on the Site Map, which must include all land in the development site.
5.1.1.3 Areas that are not native vegetation (i.e. land not included in native vegetation extent) do not require further assessment in the FBA except where it is assessed as habitat for threatened species according to Section 6.4.
Changes to the mapped native vegetation extent
5.1.1.4 The extent of native vegetation within a development site may have changed since the satellite or ortho-rectified aerial image was made. For example, clearing may have been permitted under the Native Vegetation Act 2003 (NV Act) or the EP&A Act. Where the clearing was approved or permitted, vegetation extent is to be mapped to reflect the current situation and confirmed by field survey. Any amendment or deletion of vegetation in the native vegetation extent map requires information identifying these areas specifically, and the reasons for the change in the extent of native vegetation.
5.2 Stratifying native vegetation on the development site 5.2.1 Identifying native PCTs and ecological communities 5.2.1.1 An assessor must identify and map the distribution of PCTs on a development
site according to the NSW PCT classification as described in the VIS Classification Database.
5.2.1.2 A detailed description of each PCT and its geographic distribution is contained within the VIS Classification Database and is publicly available from www.environment.nsw.gov.au/research/vegetationinformationsystem.htm.
5.2.1.3 The assessor should review any existing data and information that is currently available on native vegetation that is relevant to the development site and land in the outer assessment circle. This includes: (a) survey data that is held in the VIS Classification Database, or (b) existing maps of native vegetation in the area such as those held by OEH,
or a local government authority, or (c) existing data or information in ecological reports, soil surveys or previous
native vegetation surveys that are relevant to the development site.
5.2.1.4 Using the information collected in Paragraph 5.2.1.3, the assessor can develop a survey design and survey extent for determining PCTs on the development site based on: (a) an assessment of the expected environmental variation (b) the scale of further assessment required for PCT identification (c) gaps in existing mapping and site information (d) the survey extent.

Assessing native vegetation 11
5.2.1.5 The assessor must undertake a plot-based full floristic survey of the development site that is stratified and targeted to assess the expected environmental variation and any areas with gaps in existing mapping and site information.
5.2.1.6 The assessor must include a description of the stratified and targeted survey in the BAR, that demonstrates: (a) the survey design and survey extent of the development site, and (b) the review of existing data and information on native vegetation, and (c) that field-based vegetation activities were conducted systematically using
explicit and repeatable processes, and (d) the survey effort of the development site was commensurate with the
expected environmental variation, and (e) the plot-based full floristic survey intensity has sampled the expected
environmental variation between stratified environmental units, and (f) that the survey effort was targeted to filling any gaps in the existing
mapping and site information.
5.2.1.7 The plot-based full floristic survey is based on a 20 m × 20 m quadrat (or 400 m2 equivalent for linear areas). The assessor must assess the plot for the information contained in Table 1 and include this data in the BAR.
Table 1: Floristic survey data collected at the development site
Attribute Survey requirement
Stratum (& layer) Stratum & layer in which each species occurs
Growth form Growth form for each recorded species
Species name Scientific name and common name
Cover A measure or estimate of the appropriate cover measure for each recorded species; recorded from 1–5% and then to the nearest 5%. If the cover of a species is less than 1% and the species is considered important, then the estimated cover should be entered (e.g. 0.4)
Abundance rating A relative measure of the number of individuals or shoots of a species within the plot. Use the following intervals; numbers above about 20 are estimates only: 1,2,3,4,5,6,7,8,9,10,20,50,100,500,1000 or specify a number greater than 1000 if required
5.2.1.8 The assessor is required to provide justification in the BAR of evidence used to identify a PCT at the development site. This includes: (a) evidence of a quantitative analysis of existing and new site survey data, and (b) matching the outputs of the quantitative analysis of existing and new site
survey data to PCTs in the VIS Classification Database (c) a map showing the distribution of the PCTs on the development site.
5.2.1.9 The assessor must identify any threatened ecological communities that are associated with a PCT, and map the distribution of the ecological community on the development site. The VIS Classification Database indicates where a PCT may be associated with a threatened ecological community.

12 Framework for Biodiversity Assessment
5.2.1.10 The assessor must also record the estimated percent cleared value of the PCT based on the associated biometric vegetation type for the PCT in the major catchment area.
5.2.1.11 The assessor must only identify PCTs on the development site that are described in the VIS Classification Database as derived or secondary vegetation communities where the assessor cannot determine the original PCT.
5.2.1.12 PCTs that are classified under the VIS Classification Database as being in the saline wetlands vegetation formation must be assessed according to the Fisheries NSW policy and guidelines. This includes PCTs such as saltmarsh and mangroves and any threatened ecological communities which are classified under the saline wetland vegetation formation. The distribution of PCTs classified under the saline wetland formation must be shown on the map.
5.2.2 Identifying vegetation zones 5.2.2.1 The assessor must use the map of PCTs referred to in Subsection 5.2.1, to
identify and map the area of each PCT into a vegetation zone on the development site.
5.2.2.2 In Section 5.3 a vegetation zone means an area of native vegetation on a development site that is the same PCT and has a similar broad condition state.
5.2.2.3 In order to stratify the development site into vegetation zones, the assessor may first stratify the extent of a PCT on the development site into areas that are in low condition and areas that are in moderate to good condition.
5.2.2.4 The assessor must stratify areas of the same PCT that are in a different broad condition state into separate vegetation zones. In identifying areas that are in a similar broad condition state, the assessor may consider areas of the PCT that have a similar over-storey cover, mid-storey cover, ground cover, weediness or combinations of these.
5.2.2.5 A vegetation zone must not contain a mix of vegetation in low condition and vegetation in moderate to good condition.
5.2.2.6 A vegetation zone may comprise a number of discontinuous areas, provided the vegetation within the zone is the same PCT and in a similar broad condition state.
5.2.2.7 Vegetation zones that are in low condition, or are in a derived grassland form, or have a current site value score of less than 17 in accordance with Section 5.3, must be identified as a separate vegetation zone and shown on the map of vegetation zones.
5.3 Assessing site value (vegetation condition) 5.3.1.1 In this subsection references to the map means the map of the development
site prepared under Subsection 5.2.1.
5.3.1.2 The assessor must survey each vegetation zone identified on the map to obtain a quantitative measure for each zone of each of the 10 site attributes listed in Table 2.

Assessing native vegetation 13
Table 2: Scoring and weighting of the site attributes
Site attribute Site attribute score (see notes below)
Weighting for site attribute score 0 1 2 3
a) Native plant species richness
0–10% >10 – <50% of benchmark
50 – <100% of benchmark
≥ benchmark 25
b) Native over-storey cover
0 – 10% or >200% of benchmark
> 10 – <50% or >150 – 200% of benchmark
50 – <100% or >100 – 150% of benchmark
within benchmark
10
c) Native mid-storey cover
0 – 10% or >200% of benchmark
>10 – <50% or >150 – 200% of benchmark
50 – <100% or >100 – 150% of benchmark
within benchmark
10
d) Native ground cover (grasses)
0 – 10% or >200% of benchmark
>10 – <50% or >150 – 200% of benchmark
50 – <100% or >100 – 150% of benchmark
within benchmark
2.5
e) Native ground cover (shrubs)
0 – 10% or >200% of benchmark
>10 – <50% or >150 – 200% of benchmark
50 – <100% or >100 – 150% of benchmark
within benchmark
2.5
f) Native ground cover (other)
0 – 10% or >200% of benchmark
>10 – <50% or >150 – 200% of benchmark
50 – <100% or >100 – 150% of benchmark
within benchmark
2.5
g) Exotic plant cover (calculated as percentage of total ground and mid-storey cover)
>66% >33 – 66% >5 – 33% 0 – 5% 5
h) Number of trees with hollows
0 (unless benchmark includes zero)
>0 – <50% of benchmark (or if zero included)
50 – <100% of benchmark
≥ benchmark 20
i) Proportion of over-storey species occurring as regeneration
0 >0 – <50% 50 – <100% 100% 12.5
j) Total length of fallen logs
0 – 10% of benchmark
>10 – <50% of benchmark
50 – <100% of benchmark
≥ benchmark 10
In this table: ‘within benchmark’ means a measurement that is within and including the range of measurement for attributes that are assessed by percent foliage cover, or equal to/or greater than the number for attributes assessed by a number or length that is identified as the benchmark that PCT ‘<benchmark’ means a measurement that is less than the minimum measurement in the benchmark range ‘> benchmark’ means a measurement that is greater than the maximum measurement in the benchmark range.
14 Framework for Biodiversity Assessment
5.3.1.3 The assessor must assess the 10 site attributes listed in Table 2 for each zone against benchmark data for the relevant PCT, except where the zone is derived vegetation, in which case it must be assessed against the benchmark data for the most likely original PCT or against the benchmark data for the vegetation class of the most likely original PCT.
5.3.1.4 The assessor must calculate the site value score for each vegetation zone on the development site, in accordance with Subsection 5.3.3.
5.3.1.5 If, during the assessment of the site value of a vegetation zone, the assessor determines that: (a) it has a site value score of 17 or less; and (b) in the opinion of the assessor, the PCT present in the vegetation zone is
not listed as a critically endangered or endangered ecological community,
then for that vegetation zone: (c) no further assessment of native vegetation is required, and (d) an assessment of threatened species that can be predicted by habitat
surrogates (ecosystem credits) in accordance with Section 6.3 is not required, and
(e) an assessment of threatened species that cannot be predicted by habitat surrogates is undertaken in accordance with Section 6.4 and Section 6.5.
5.3.1.6 For the purposes of Section 5.3, the assessor must use benchmark data from the Vegetation Benchmarks Database unless benchmark data is obtained from local reference sites or from relevant published sources in accordance with Appendix 3.
5.3.2 Plot and transect surveys 5.3.2.1 Line transects must be used to assess site attributes that can be measured by
percent foliage cover.
5.3.2.2 Site attributes that are not measured by percent foliage cover must be assessed by plots. Native plant species richness is assessed within a 20 m × 20 m plot. The number of trees with hollows and the total length of fallen logs is assessed within a 50 m × 20 m plot.
5.3.2.3 Floristic data collected in Section 5.2.1 can be used to assess the native plant species richness attribute at the site where the plot used in Section 5.2.1 is also used to determine the site value score.
5.3.2.4 The number of trees with hollows is estimated by counting the number of trees with hollows visible from the ground in the 50 m × 20 m plot.
5.3.2.5 The total length of fallen logs is the total length of woody material greater than 10 cm in diameter that is on the ground in the 50 m × 20 m plot.
5.3.2.6 Regeneration is measured as the proportion of over-storey species that are regenerating. Regeneration must be assessed across the entire vegetation zone.
5.3.2.7 The level of survey effort across the vegetation zone must be consistent with the practice of random stratified sampling.

Assessing native vegetation 15
5.3.2.8 Plots and transects must be established randomly, or stratified randomly within a vegetation zone, accounting for the level of variation in broad condition of the vegetation zone.
5.3.2.9 Establishing or stratifying plots and transects randomly may be done by: (a) marking points randomly on the map of vegetation zones in the
assessment area and establishing plots and transects at all or some of these points, or
(b) pacing a random distance into the vegetation zone. The survey data must be collected from that point, with the process repeated elsewhere within the vegetation zone.
5.3.2.10 The minimum number of transects and plots detailed in Table 3 must be used for each vegetation zone.
5.3.2.11 If the broad condition of the vegetation is more variable across the zone, additional transects and plots to the number specified in Table 3 may be required to ensure a representative sample is taken for the vegetation zone.
Table 3: Minimum number of transects/plots required per zone area
Vegetation zone area (ha)
Minimum number of transects/plots
0–4 1 transect/plot per 2 ha (or part thereof) or 1 transect/plot if vegetation is in low condition
> 4–20 3 transects/plots or 2 transects/plots if vegetation is in low condition
> 20–50 4 transects/plots or 3 transects/plots if vegetation is in low condition
> 50–100 5 transects/plots or 3 transects/plots if vegetation is in low condition
> 100–250 6 transects/plots or 4 transects/plots if vegetation is in low condition
> 250–1000 7 transects/plots or 5 transects/plots if vegetation is in low condition More transects/plots may be needed if the condition of the vegetation is variable across the zone
> 1000 8 transects/plots or 5 transects/plots if vegetation is in low condition or in a homogenous landscape in the Western Division More transects/plots may be needed if the condition of the vegetation is variable across the zone

16 Framework for Biodiversity Assessment
5.3.3 Assessing the current site value score 5.3.3.1 Using the plot and transect survey data collected for a vegetation zone, the
assessor must determine the site attribute score for each site attribute within a vegetation zone on the development site in accordance with Table 2.
5.3.3.2 The assessor must then use those site attribute scores to calculate the site value score for each vegetation zone on the development site using Equation 1 as set out in Appendix 1, except to the extent provided otherwise below: (a) If the lower benchmark value for any site attribute is zero, and the
measure of that attribute on the site is zero, then the site attribute score for that attribute against the benchmark is 3.
(b) If the only benchmark value for any site attribute is zero, then the attribute is not included in Equation 1 and c (that is, the maximum total where the relevant attributes are in benchmark condition) is scaled accordingly.
(c) The multipliers for ‘native over-storey cover × proportion of over-storey species occurring as regeneration’ and ‘number of trees with hollows × total length of fallen logs’ may be omitted from Equation 1 (and c is recalculated accordingly) for determining site value at a site if the PCT is from one of the following vegetation formations: (i) Grasslands (ii) Heathlands (iii) Alpine Complex (iv) Freshwater Wetlands (v) Saline Wetlands (vi) Arid Shrublands.
Summary of Equation 1: Determine the current site value score for a vegetation zone
Note to reader: To assist reader understanding, a simplified, diagrammatic representation is provided for each equation used in the FBA. Full mathematical representations of all equations are presented in Appendix 1. The simplified, diagrammatic representations do not form part of the FBA.

Assessing threatened species and populations 17
6 Assessing threatened species and populations
6.1 Threatened Species Profile Database 6.1.1.1 The assessor must obtain the following information from the Threatened
Species Profile Database: (a) description of each threatened species, its habitat, ecology and threats,
including the threatened species profile (b) the class of credit for the threatened species (c) description of the habitat requirements and/or constraints for each
threatened species (d) breeding, foraging or habitat information contained in the profile for the
threatened species (e) IBRA subregions within which the distribution of each threatened species
is either known or predicted to occur (the distribution of a species is not associated with an IBRA subregion if the species is identified by the database as being vagrant in that subregion)
(f) PCTs with which each threatened species is associated (g) the percent native vegetation cover class in the outer assessment circle
with which the threatened species is associated (h) minimum patch size in hectares, including low condition vegetation, with
which the threatened species is associated (i) whether the threatened species is able to occupy low condition vegetation (j) any specific habitat features associated with the occurrence of the
threatened species (k) the ability of a threatened species to respond to improvement in site value
or other habitat improvement at an offset site due to the management actions (the TG value)
(l) any geographic characteristics associated with the occurrence of the threatened species
(m) whether the threatened species is a species that cannot withstand further loss
(n) the months of the year that the species is identifiable through survey.
6.1.1.2 An assessor may use more appropriate local data instead of data from the Threatened Species Profile Database for the purpose of obtaining the information required at Paragraph 6.1.1.1, if: (a) in the opinion of the assessor, the local data more accurately reflects the
local environmental conditions of the development site, and (b) the Secretary of DP&E, in consultation with the Chief Executive of OEH,
approves the use of that data as more appropriate local data.
6.1.1.3 If the assessor uses more appropriate local data, the assessor must include the reasons for the use of more appropriate local data in the BAR.

18 Framework for Biodiversity Assessment
6.2 Species that can be predicted by habitat surrogates (ecosystem credits)
6.2.1.1 Threatened species that require ecosystem credits must be assessed in conjunction with general biodiversity values using data from the Threatened Species Profile Database.
6.2.1.2 Species that require ecosystem credits have a high likelihood of being present on the site, as predicted by Step 1 in Section 6.3 below. Therefore, a threatened species survey is not required to assess threatened species that require ecosystem credits as they are predicted to occur based on the presence of habitat surrogates.
6.2.1.3 The likely impacts on these species from clearing and development are measured in biodiversity credits by the loss of site and landscape value from clearing on the development site.
6.2.1.4 Species that require ecosystem credits for the impacts of development are assessed according to the two steps below.
6.3 Steps for identifying ecosystem credit species on a development site
6.3.1.1 The assessor must identify ecosystem credit species on the development site using the following steps.
Step 1: Identify predicted ecosystem credit species 6.3.1.2 Using the information obtained under Section 6.1, the assessor must identify a
threatened species as being a predicted species if that species meets all of the following criteria: (a) the distribution of the species includes the IBRA subregion in which the
development site is, in the opinion of the assessor, mostly located, and (b) the species is associated with any of the PCTs identified by the assessor
under Chapter 5 as occurring within the development site, and (c) except if the Major Project is, or is part of, a linear shaped or multiple
fragmentation development, the percent native vegetation cover class within the outer assessment circle as determined by the assessor in accordance with Appendices 4–6 (as relevant) is equal to or greater than the minimum class that is required for the species, and
(d) the condition of vegetation within any vegetation zone (as identified by the assessor under Chapter 5) within the development site is equal to or greater than the minimum condition required for that species, and
(e) the patch size which the vegetation zone is part of is equal to or greater than the minimum specified for that species, and
(f) the species is identified as an ecosystem credit species in the Threatened Species Profile Database.
6.3.1.3 Where a vegetation zone is across one or more IBRA subregions, the IBRA subregion in which most of the proposal occurs must be used. This provision is not applicable to linear shaped developments.
6.3.1.4 If any one of the criteria at Paragraph 6.3.1.2 is not met for a particular species, then no further assessment under Section 6.3 is required for that species at a development site

Assessing threatened species and populations 19
Step 2: Assess presence of habitat components 6.3.1.5 The assessor may opt to undertake an additional assessment of the habitat
components on the development site for a threatened species predicted to occur in Step 1.
6.3.1.6 The assessor must assess the habitat components for a predicted species using the habitat information in the profile for the species and any other habitat information in the Threatened Species Profile Database.
6.3.1.7 If the assessor determines that one or more of the habitat components for a predicted species is present in a vegetation zone, the assessor must identify the predicted species as being an ecosystem credit species present in a vegetation zone.
6.3.1.8 Where the assessor determines that none of the habitat components for the predicted species are present in a vegetation zone, the species does not need to be identified as being an ecosystem credit species present in the vegetation zone. The assessor must record the reasons for determining that a predicted species is not present in the vegetation zone in the BAR.
6.4 Assessing species that cannot be predicted by habitat surrogates (species credits)
6.4.1.1 Threatened species that cannot reliably be predicted to occur on a development site based on PCT, distribution and habitat criteria are identified by the Threatened Species Profile Database as species credit species. In some circumstances, the particular habitat components of species assessed for ecosystem credit species, such as the breeding habitat of a cave roosting bat, are also assessed for species credits.
6.4.1.2 Species that require species credits to offset the impacts of a Major Project on a development site must be identified and assessed in accordance with the five steps in Section 6.5.
6.5 Steps for identifying species credit species 6.5.1.1 The assessor must identify species credit species on the development site
using the following steps.
Step 1: Identify candidate species credit species 6.5.1.2 Using data from the Threatened Species Profile Database, the assessor must
identify a threatened species as a candidate species for the development site if: (a) the species is identified as a species credit species in the Threatened
Species Profile Database, and (b) the geographic distribution of the species is known or predicted to include
the IBRA subregion in which the development site is located, and (c) the development site contains habitat features or components associated
with the species, as identified in the Threatened Species Profile Database, OR
(d) past surveys undertaken at the development site indicate that the species is present.
These species are assessed under Step 2.

20 Framework for Biodiversity Assessment
Step 2: Identify candidate species for further assessment 6.5.1.3 A candidate species is not considered to be present on the development site
where: (a) after carrying out an assessment of the habitat components the assessor
determines that the habitat is substantially degraded such that the particular species is unlikely to utilise the development site, or
(b) an expert report prepared in accordance with Subsection 6.6.2 states that the species is unlikely to be present at the development site, or
(c) the species is a vagrant species and unlikely to use habitat on the development site, or
(d) records of the species presence in relation to the location of the development site are at least 20 years old or, in the opinion of the assessor, have doubtful authenticity.
6.5.1.4 A candidate species that is not considered to be present on the development site in accordance with Paragraph 6.5.1.3 does not require further assessment.
6.5.1.5 All other remaining candidate threatened species must be assessed further in accordance with Step 3 below.
6.5.1.6 The assessor must provide the reasons for determining that a candidate species is not present on the development site in the BAR.
6.5.1.7 Where the development site contains any of the specified geographic attributes and the habitat features or habitat components associated with a species that is on the list of candidate species for assessment at Step 3, an assessor may opt to assume the species or breeding habitat component is present on the development site, instead of undertaking a threatened species survey or obtaining an expert report.
6.5.1.8 Where a species is assumed to be present, the assessor must still determine the location and area of the species polygon in accordance with Step 5 below. The calculation of the number of species credits for a species assumed to be present on a clearing or development site is based on the area of the species polygon, or the number of individuals or area for flora species.
Step 3: Determine whether the candidate species is present 6.5.1.9 An assessor must establish whether any species that remains a candidate is
present on a development site, or is likely to use the potential habitat on the development site, by either: (a) assuming it is present (development sites only), or (b) undertaking a threatened species survey in accordance with Section 6.6, or (c) obtaining an expert report in accordance with Subsection 6.6.2.
6.5.1.10 Where the survey or expert report confirms that a remaining candidate species is present on a development site, or is likely to use the potential habitat on the development site, the remaining candidate species is a species credit species present on the development site and must be assessed further under Steps 4 and 5.

Assessing threatened species and populations 21
6.5.1.11 Where the survey or expert report confirms that a candidate species is: (a) not present or unlikely to be present on a development site, or (b) unlikely to use habitat on a development site
no further assessment is required and an assessor may assume that the remaining candidate species, or its habitat, is not present on the development site.
Step 4: Identify if the development site contains any threatened species that cannot withstand further loss 6.5.1.12 Using the information obtained under Section 6.1, the assessor must
determine whether the species credit species is a species that cannot withstand further loss in the major catchment area.
6.5.1.13 The assessor must identify all species credit species that cannot withstand further loss in the major catchment area in the BAR.
Step 5: Prepare species polygon 6.5.1.14 Where either:
(a) a threatened species survey or expert report confirms that a species credit species is present on the development site or is likely to use the habitat on a development site, or
(b) a species credit species is assumed to be present on the development site
the assessor must prepare species polygons for each of those species credit species.
6.5.1.15 Where a species is assumed to be present on the development site, the assessor must use an expert report to determine the location and area of the species polygon to include the fauna habitat or number of individual flora species assumed to be present on the development site.
6.5.1.16 The boundary of the species polygon must be finalised on completion of the targeted survey or expert report.
6.5.1.17 The species polygon must: (a) be mapped using a satellite (ADS–40) or the best available ortho-rectified
aerial image of the development site (b) use the unit of measurement identified for that species in the Threatened
Species Profile Database (c) include the locations of the species or areas occupied by the species (d) contain the specific habitat feature or habitat component associated with
that species on the development site (e) utilise GPS to confirm the location of the species polygon on the best
available ortho-rectified aerial image of the development site.
6.5.1.18 A description of the species and the habitat feature or habitat component associated with the species on the site and its abundance must be included in the BAR.

22 Framework for Biodiversity Assessment
6.6 Undertaking a threatened species survey 6.6.1.1 An assessor must only undertake a threatened species survey during the
period of time specified in the Threatened Species Profile Database as being suitable for identifying the species.
6.6.1.2 A threatened species survey should be undertaken and recorded using a method that can be replicated for repeat surveys.
6.6.1.3 A threatened species survey must be undertaken for all species identified in Step 3 in Section 6.5 unless: (a) an expert report prepared in accordance with Subsection 6.6.2 has been
obtained for the species, or (b) the species is assumed to be present and the area of habitat or number of
individuals is in a species polygon determined in accordance with Paragraph 6.5.1.8.
6.6.1.4 The timing, method and effort used for a threatened species survey must be described in the BAR.
6.6.1.5 Threatened species surveys for any species other than amphibians must be undertaken in accordance with the OEH threatened species survey guidelines.
6.6.1.6 A threatened species survey for amphibians must be undertaken in accordance with the OEH threatened species survey guidelines for amphibians.
6.6.2 Using expert reports instead of undertaking a survey 6.6.2.1 An expert report may be obtained instead of undertaking a threatened species
survey at a development site.
6.6.2.2 An expert report must only be prepared by a person who is accredited by the Chief Executive of OEH under section 142B(1)(b) of the TSC Act, or a person who, in the opinion of the Chief Executive of OEH possesses specialised knowledge based on training, study or experience to provide an expert opinion in relation to the biodiversity values to which an expert report relates.
6.6.2.3 The expert report must document the information that was considered, and/or rejected as unsuitable for consideration, to reach the determination made in the expert report.
6.6.2.4 An expert report can only be used instead of a survey for species to which species credits apply.
6.6.2.5 An expert report must set out whether: (a) for development sites – the species is unlikely to be present on the
development site – in this case no further assessment of the species is required, or
(b) for all development sites – the species is likely to be present on the site – in this case the expert report must provide an estimate of the number of individuals or area of habitat to be impacted by the development or the management actions (according to the unit of measurement identified for the species in the Threatened Species Profile Database).

Assessing threatened species and populations 23
Stage 2 – Impact assessment (biodiversity values) 7 Introduction to Stage 2
7.1 Documenting Stage 2 outcomes 7.1.1.1 The outcomes of Stage 2, combined with the outcomes of Stage 1, are
documented in the BAR (refer to Paragraph 3.1.1.1). The BAR must be prepared by an accredited assessor and must contain the matters identified in Appendix 7.
7.1.1.2 The BAR is to be submitted as part of the EIS and application for development consent or infrastructure approval.
Sections within Stage 2 8 Avoid and minimise impacts on biodiversity values ................................................... 24
8.2 Assessment of impacts ..................................................................................... 24
8.3 Demonstrating avoidance and minimisation of direct impacts on biodiversity values ............................................................................................................... 24
8.4 Demonstrating minimisation of indirect impacts on biodiversity values using reasonable onsite measures ............................................................................ 28
9 Thresholds for the assessment and offsetting of unavoidable impacts of development .............................................................................................................. 30
9.2 Impacts on biodiversity that require further consideration ................................ 31
9.3 Impacts for which the assessor is required to determine an offset requirement ...................................................................................................... 36
9.4 Impacts for which the assessor is not required to determine an offset ............. 37
9.5 Impacts that do not require further assessment by the assessor ..................... 37
10 Determining the offset requirement ........................................................................... 38
10.2 Calculating the credit requirement .................................................................... 38
10.3 Calculating the future site value score for vegetation zones on the development site .............................................................................................. 38
10.4 Calculating the change in the site value score for vegetation zones on the development site .............................................................................................. 39
10.5 Offset rules for biodiversity values .................................................................... 42

24 Framework for Biodiversity Assessment
8 Avoid and minimise impacts on biodiversity values 8.1.1.1 This section sets out the actions that the proponent of a Major Project must
undertake to demonstrate that reasonable measures are taken to avoid and minimise the direct and indirect impacts of a development proposal on biodiversity values.
8.2 Assessment of impacts 8.2.1.1 The assessor must assess the direct and indirect impacts of a Major Project
on biodiversity values in accordance with this section.
8.2.1.2 In assessing the direct and indirect impacts of a Major Project on biodiversity values, the assessor must use the information and data resulting from the assessment of biodiversity values undertaken in accordance with Chapters 3--6.
8.3 Demonstrating avoidance and minimisation of direct impacts on biodiversity values
8.3.1.1 The proponent and the assessor must consider whether biodiversity impacts of a Major Project can be avoided or minimised.
8.3.1.2 The proponent must incorporate the principles of avoiding and minimising impacts to biodiversity into the entire life cycle of the Major Project consistently with the guidelines in Subsection 8.3.2.
8.3.1.3 The proponent must seek to avoid the direct impacts of the Major Project on all biodiversity values at the development site including impacts on: (a) endangered ecological communities (EECs) and critically endangered
ecological communities (CEECs), and (b) PCTs that contain threatened species habitat, and (c) areas that contain habitat for vulnerable, endangered or critically
endangered threatened species or populations, as determined in accordance with Step 5 in Section 6.5, and
(d) an area of land that the Minister for Environment has declared as critical habitat in accordance with section 47 of the TSC Act, and
(e) the riparian areas of 4th order or higher streams and rivers, important wetlands and estuaries, and
(f) state significant biodiversity links.
8.3.1.4 If a proponent determines that a Major Project cannot proceed without impacting on biodiversity values despite seeking to avoid impacts in accordance with Paragraph 8.3.1.3, the proponent must identify reasonable measures and strategies to minimise the impact of development on biodiversity values.
8.3.1.5 A proponent may only use offsets to compensate for impacts on biodiversity values where those impacts have already been avoided and minimised as far as practicable in accordance with Paragraphs 8.3.1.3 and 8.3.1.4.
8.3.1.6 Measures that minimise the impact on biodiversity may be required for a particular threatened species, or apply to a particular phase of the project life cycle. These measures must be set out in the BAR.
Avoid and minimise impacts on biodiversity values 25
8.3.1.7 In determining the reasonableness of measures aimed at minimising impacts on biodiversity, a proponent can take into account: (a) industry best practices and standards that avoid and minimise impacts (b) the proportion of the total cost of the Major Project that is dedicated to
biodiversity protection (c) the risk of failure of the measure.
8.3.1.8 The BAR must: (a) demonstrate how the proponent has incorporated the principles of
avoiding and minimising impacts to biodiversity into the life cycle of the Major Project consistently with the guidelines at Subsection 8.3.2
(b) describe and document the reasonable measures and strategies that the proponent has taken or proposes to take to avoid and minimise the direct and cumulative adverse impacts of the Major Project on biodiversity values at the site selection, or route selection for linear projects, and planning phases of the Major Project consistently with the guidelines at Subsection 8.3.2. This includes: (i) describing the methods used to select a development site. If no
method was used to select a site, the reasons for this must also be provided in the BAR
(ii) explaining how the siting and layout of the Major Project was selected to avoid and minimise the adverse impacts on biodiversity values of the Major Project
(iii) explaining how the siting of the project minimises habitat loss and clearing. If there are areas on the development site that contain less vegetation or have lower biodiversity impact potential, an explanation must be provided as to why it is not reasonable for the Major Project to be sited on those areas
(iv) identifying constraints on the development site that the assessor considered in determining the siting and layout of the development footprint, e.g. bushfire protection requirements including clearing for asset protection zones, flood planning levels, servicing constraints
(v) for linear projects: describing the process to select a preferred option; outlining how biodiversity values were weighed in decision making; identifying how impacts on biodiversity values have been minimised through project design, including how the location of temporary construction infrastructure and permanent maintenance infrastructure minimises impacts on biodiversity values. Design and servicing constraints should also be identified
(c) describe and document the reasonable measures and strategies that the proponent has taken or proposes to take to avoid and minimise the direct and cumulative adverse impacts of the Major Project on biodiversity values during the construction phase and at the operation phase of the Major Project consistently with the guidelines at Subsection 8.3.2
(d) document the reasons why it is not practicable to undertake measures that would avoid and minimise the impacts on biodiversity values of the development site.

26 Framework for Biodiversity Assessment
8.3.2 Guidelines for the avoidance and minimisation of impacts to biodiversity values during the project life cycle
Site selection and planning phase
Site selection
8.3.2.2 Selecting a suitable development site for a Major Project or a route for linear projects, should be informed by knowledge of biodiversity values. An initial desktop assessment of biodiversity values would assist in identifying areas of native vegetation cover, EECs or CEECs, and potential habitat for threatened species.
8.3.2.3 Stage 1 of the FBA will provide the preliminary information necessary to inform project planning. Early consideration of biodiversity values is recommended in site selection, or route selection for linear projects, and the planning phase.
8.3.2.4 The site/route selection process should include consideration and analysis of the biodiversity constraints of the proposed development site and consider the suitability of the Major Project based on the types of biodiversity values present on the development site.
8.3.2.5 When considering and analysing the biodiversity constraints for the purpose of selecting a development site, the following matters should be addressed: (a) whether there are alternative sites within the property on which the
proposed development is located where siting the proposed Major Project would avoid and minimise impacts on biodiversity values
(b) how the development site can be selected to avoid and minimise impacts on biodiversity values as far as practicable
(c) whether an alternative development site to the proposed development site, which would avoid adversely impacting on biodiversity values, might be feasible.
8.3.2.6 For linear projects, the route selection process must include consideration and an analysis of the biodiversity constraints of the various route options. In selecting a preferred option, loss of biodiversity values must be weighed up and justified against social and economic costs and benefits.
Planning
8.3.2.7 Once a suitable development site has been selected, further analysis of the biodiversity constraints of the proposed development site can then be used to inform concept planning, project siting and design. This includes the proposed location of temporary construction infrastructure such as roads, camps, stockpile sites and parking bays.
8.3.2.8 The Major Project should be located in areas where the native vegetation or threatened species habitat is in the poorest condition (i.e. areas that have a lower site value) or which avoid an EEC or CEEC. The following matters should be considered for this purpose: (a) siting of the project – the Major Project should be located in areas where
the native vegetation or threatened species habitat is in the poorest condition (i.e. areas that have a lower site value score) or which avoid an EEC or CEEC
Avoid and minimise impacts on biodiversity values 27
(b) minimise the amount of clearing or habitat loss – the Major Project (and associated construction infrastructure) should be located in areas that do not have native vegetation, or in areas that require the least amount of vegetation to be cleared (i.e. the development footprint is minimised), and/or in areas where other impacts to biodiversity will be the lowest
(c) loss of connectivity – some developments can impact on the connectivity and movement of species through areas of adjacent habitat. Minimisation measures may include providing structures that allow movement of species across barriers or hostile gaps
(d) other site constraints – any other constraints that the assessor has considered in determining the siting and layout of the Major Project, e.g. bushfire protection requirements including clearing for asset protection zones, flood planning levels, servicing constraints.
Construction phase 8.3.2.9 The construction phase of the Major Project can have direct impacts on
biodiversity values that are additional to the impacts which occur during the site selection and planning phase. These impacts must be avoided and minimised during the construction phase of the project where reasonable.
8.3.2.10 The following matters should be considered in order to avoid and minimise impacts on biodiversity values during the construction phase: (a) method of clearing – using a method of clearing during the construction
phase that avoids damage to retained native vegetation and reduces soil disturbance. For example, removal of native vegetation by chain-saw, rather than heavy machinery, is preferable in situations where partial clearing is proposed
(b) clearing operations – minimising direct harm to native fauna during actual construction operations through onsite measures such as undertaking pre-clearing surveys, daily fauna surveys and the presence of a trained ecologist during clearing events
(c) timing of construction – identifying reasonable measures that minimise the impacts on biodiversity. For example, timing construction activities for when migratory species are absent from the site, or when particular species known to or likely to use the habitat on the site are not breeding or nesting, can minimise the impacts of construction activities on biodiversity
(d) other measures that minimise inadvertent impacts of the Major Project on the biodiversity values – measures such as installing temporary fencing to protect significant environmental features such as riparian zones, promoting the hygiene of construction vehicles to minimise spread of weeds or pathogens, appropriately training and inducting project staff and contractors so that they can implement all measures that minimise inadvertent adverse impacts of the Major Project on biodiversity values.
Operational phase 8.3.2.11 The proponent should consider implementing reasonable measures to avoid
and minimise any impacts that may occur during the operational phase of the Major Project that are additional to the impacts which occurred during the site selection, planning and construction phases.

28 Framework for Biodiversity Assessment
8.3.2.12 The following matters should be considered in order to avoid and minimise direct impacts on biodiversity values at the operational phase: (a) seasonal impacts – whether there are likely to be any impacts that occur
during specific seasons. Minimisation measures may include amending operational times to minimise impacts on biodiversity during periods when seasonal events such as breeding or species migration occur
(b) artificial habitats – using ‘artificial habitats’ for fauna where they may be effective in minimising impacts on such fauna. These include nest boxes, glider-crossings or habitat bridges.
8.3.3 Confirming the proposed boundary of the development footprint 8.3.3.1 Once all impacts to biodiversity have been avoided and minimised using all
reasonable measures, a proposed development footprint can be confirmed.
8.4 Demonstrating minimisation of indirect impacts on biodiversity values using reasonable onsite measures
8.4.1.1 The BAR must: (a) include an assessment of the adverse indirect impacts of the Major
Project on biodiversity values (b) identify and assess any relevant negative indirect impacts that the
development is likely to have on biodiversity values that may occur during the construction phase and those that occur once the development is operational
(c) incorporate any reasonable onsite measures that minimise the indirect impacts of the development.
8.4.1.2 When assessing indirect impacts, the assessor must consider all adverse impacts that can reasonably be predicted to result from the development. The assessor must consider indirect impacts on biodiversity where they are sufficiently related to the development to be considered a consequence of the development.
8.4.1.3 Well designed and reasonable onsite measures taken at the development site can be effective in minimising the indirect impacts of the development on biodiversity values on land that adjoins the development site and in the surrounding area.
8.4.1.4 The types of indirect impacts on biodiversity that may arise from the development, for which consideration of onsite measures is required to minimise those impacts, include but are not limited to: (a) sedimentation and run-off – sediment barriers or sedimentation ponds to
minimise impacts of the Major Project on biodiversity values on land that is adjoining the development site, and waterways downstream of the development site
(b) noise, dust or light spill – adopting onsite measures that can minimise the impacts on biodiversity values from noise, dust or light spill during the construction phase. For example, only undertake construction during daylight hours to avoid impacts from light spill where this may be detrimental to species habitat on adjoining lands

Avoid and minimise impacts on biodiversity values 29
(c) inadvertent impacts on adjacent habitat or vegetation – considering measures such as retaining vegetation on the development site as a buffer to protect significant environmental features (e.g. riparian zones, likely or known threatened species habitat)
(d) feral pest, weed and/or pathogen encroachment into vegetation on land adjoining the development site – one example is using protocols for hygiene that minimise the likelihood of construction vehicles spreading weeds or pathogens from the development site into native vegetation on land adjoining the development site
(e) impacts that are infrequent, cumulative or difficult to measure – where there are likely to be indirect impacts on biodiversity that are infrequent, cumulative or difficult to measure over time, consideration should be given to how an operational monitoring program can be used to assess the timing and/or extent of these impacts. A proposal for an operational monitoring program should be set out in the BAR. Development of a monitoring program may involve determining the base-line information that will be necessary to measure the impact over time. It should also consider how the results of the monitoring program could be used to inform ongoing operations in order to reduce the extent of indirect impacts
(f) impacts during the operational phase – measures to avoid or minimise the indirect impacts on threatened species and threatened species habitat on land adjoining the development site, migratory species or flight pathways as a result of the operation of the development. Such measures may include those adopted to avoid and minimise: (i) trampling of threatened flora species (ii) rubbish dumping (iii) noise (iv) light spill (v) weed encroachment (vi) nutrient run-off (vii) increased risk of fire, and (viii) pest animals.
8.4.1.5 All onsite measures that are proposed to avoid and minimise the indirect impacts of the Major Project should be documented in the BAR.
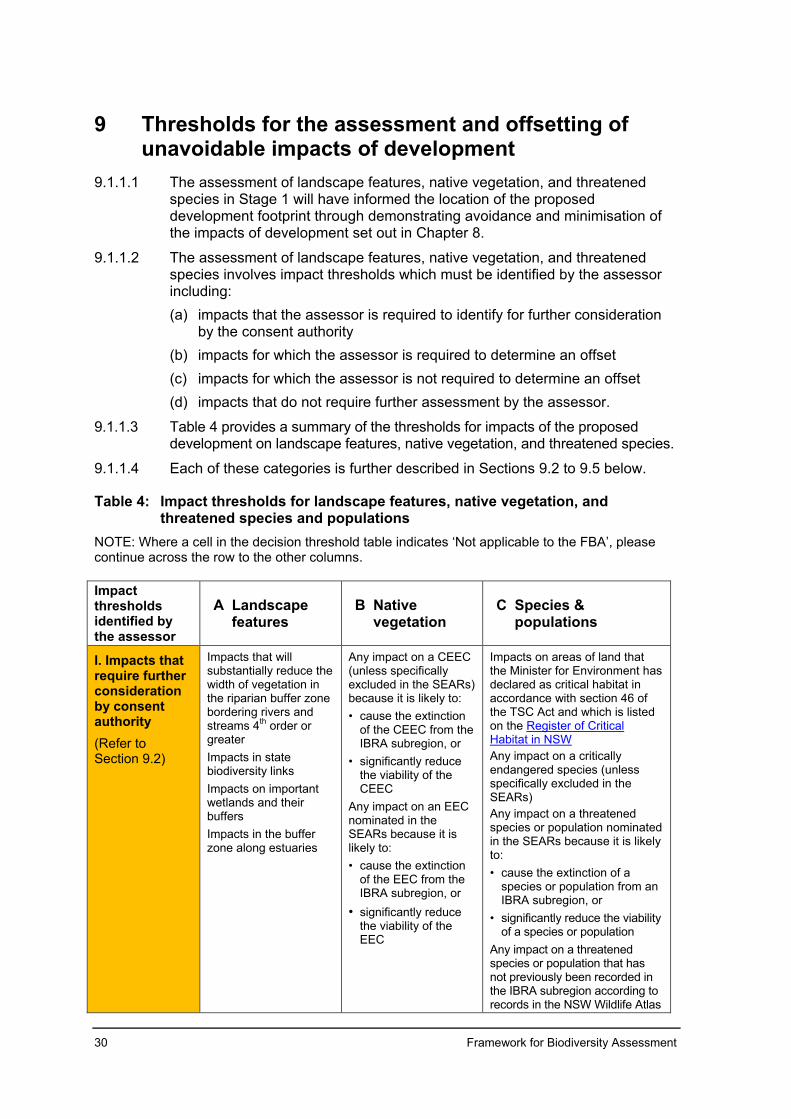
30 Framework for Biodiversity Assessment
9 Thresholds for the assessment and offsetting of unavoidable impacts of development
9.1.1.1 The assessment of landscape features, native vegetation, and threatened species in Stage 1 will have informed the location of the proposed development footprint through demonstrating avoidance and minimisation of the impacts of development set out in Chapter 8.
9.1.1.2 The assessment of landscape features, native vegetation, and threatened species involves impact thresholds which must be identified by the assessor including: (a) impacts that the assessor is required to identify for further consideration
by the consent authority (b) impacts for which the assessor is required to determine an offset (c) impacts for which the assessor is not required to determine an offset (d) impacts that do not require further assessment by the assessor.
9.1.1.3 Table 4 provides a summary of the thresholds for impacts of the proposed development on landscape features, native vegetation, and threatened species.
9.1.1.4 Each of these categories is further described in Sections 9.2 to 9.5 below.
Table 4: Impact thresholds for landscape features, native vegetation, and threatened species and populations
NOTE: Where a cell in the decision threshold table indicates ‘Not applicable to the FBA’, please continue across the row to the other columns.
Impact thresholds identified by the assessor
A Landscape features
B Native vegetation
C Species & populations
I. Impacts that require further consideration by consent authority (Refer to Section 9.2)
Impacts that will substantially reduce the width of vegetation in the riparian buffer zone bordering rivers and streams 4th order or greater Impacts in state biodiversity links Impacts on important wetlands and their buffers Impacts in the buffer zone along estuaries
Any impact on a CEEC (unless specifically excluded in the SEARs) because it is likely to: • cause the extinction
of the CEEC from the IBRA subregion, or
• significantly reduce the viability of the CEEC
Any impact on an EEC nominated in the SEARs because it is likely to: • cause the extinction
of the EEC from the IBRA subregion, or
• significantly reduce the viability of the EEC
Impacts on areas of land that the Minister for Environment has declared as critical habitat in accordance with section 46 of the TSC Act and which is listed on the Register of Critical Habitat in NSW Any impact on a critically endangered species (unless specifically excluded in the SEARs) Any impact on a threatened species or population nominated in the SEARs because it is likely to: • cause the extinction of a
species or population from an IBRA subregion, or
• significantly reduce the viability of a species or population
Any impact on a threatened species or population that has not previously been recorded in the IBRA subregion according to records in the NSW Wildlife Atlas

Thresholds for the assessment and offsetting of unavoidable impacts of development 31
Table 4 continued.
Impact thresholds identified by the assessor
A Landscape features
B Native vegetation
C Species & populations
II. Impacts for which the assessor is required to determine an offset (Refer to Section 9.3)
Not applicable to the FBA
Impacts on CEECs that are specifically excluded from requiring further consideration in the SEARS Impacts on PCTs that are EECs not specifically nominated as requiring further consideration in the SEARs Impacts on PCTs associated with threatened species habitat and which have a site value score ≥17
Impacts on a critically endangered species that is specifically excluded from requiring further consideration in the SEARS Impacts on threatened species, populations and threatened species habitat not specifically nominated as requiring further consideration in the SEARs Impacts on threatened species habitat associated with a PCT and which has a site value score of ≥17
III. Impacts for which the assessor is not required to determine an offset (Refer to Section 9.4)
Not applicable to the FBA
Impacts on PCTs that: • have a site value
score <17, or • are not identified as
CEECs / EECs Impacts on PCTs that are not associated with threatened species habitat and are not identified as CEECs / EECs
Impacts on non-threatened species and populations that do not form part of a CEEC or EEC Impacts on threatened species habitat associated with a PCT within a vegetation zone with a site value score of <17
IV. Impacts that do not require further assessment by the assessor (Refer to Section 9.5)
Areas of land without native vegetation, unless the area of land requires assessment under the SEARs issued for the Major Project
Areas of land without native vegetation, unless the area of land requires assessment under the SEARs issued for the Major Project
Not applicable since all areas of land must be assessed for threatened species, even if they do not contain native vegetation
9.2 Impacts on biodiversity that require further consideration 9.2.1.1 Certain impacts on biodiversity values will require further consideration by the
consent authority. These are impacts that are considered to be complicated or severe. A decision will be made by the consent authority on whether it is appropriate for these impacts to occur. The consent authority may determine: (a) the Major Project cannot be approved with that particular impact (b) modifications are required to the Major Project to reduce the severity of
the impact (c) the Major Project can be approved but it will require additional offsets,
supplementary measures or other actions to be undertaken with respect to that impact.

32 Framework for Biodiversity Assessment
9.2.1.2 If a Major Project proposal has an impact on biodiversity that is severe or complicated and requires further consideration (i.e. falls within the categories listed in Paragraph 9.2.1.3), it is recommended that a proponent discuss the impact with DP&E.
9.2.1.3 The assessor is required to identify impacts on biodiversity values that require further consideration. Impacts on biodiversity values that require further consideration are: (a) impacts on landscape features, being:
(i) impacts that will reduce the width of vegetation in the riparian buffer zone bordering significant streams and rivers, important wetlands or estuarine areas in accordance with Subsection 9.2.3, or
(ii) impacts that will prevent species movement along corridors that have been identified as providing significant biodiversity linkages across the state in accordance with Subsection 9.2.3, and
(b) impacts on native vegetation that are likely to cause the extinction of an EEC/CEEC from an IBRA subregion or significantly reduce its viability in accordance with Subsection 9.2.4, and
(c) impacts on critical habitat or on threatened species or populations that are likely to cause the extinction of a species or population from an IBRA subregion or significantly reduce its viability in accordance with Subsection 9.2.5.
9.2.2 Information to be provided with impacts that require further consideration
9.2.2.1 If it is unclear whether an impact falls into one of the categories in Section 9.2, the proponent must seek advice from OEH. Where there is still uncertainty on whether an impact falls into one of these categories, the assumption will be that the proposed development will have an impact on biodiversity that will require further consideration.
9.2.2.2 The BAR must contain details of the assessment of impacts which will require further consideration, in accordance with Subsections 9.2.3 to 9.2.5 below. This information will be considered by the consent authority when making a determination on the proposed Major Project.
9.2.3 Impacts on landscape features Impacts reducing width of riparian buffer of important rivers, streams and estuaries 9.2.3.2 This category is an impact of development on areas of native vegetation
within: (a) 20 m either side of a 4th and 5th order stream (b) 50 m either side of a 6th order stream or higher, or (c) 50 m around an estuarine area.
9.2.3.3 Additional information required in the BAR for impacts that reduce the width of riparian buffers: (a) the name and stream order of the riparian buffer being impacted (b) the total area of the riparian buffer that is impacted by the Major Project,
the extent to which the width of the link will be reduced and over what length, and the size of gaps being created or expanded

Thresholds for the assessment and offsetting of unavoidable impacts of development 33
(c) the PCT and condition of the vegetation in the riparian buffer being impacted
(d) any indirect impacts on wetlands or watercourses downstream of the development site
(e) the mitigation measures proposed to minimise the impact on the biodiversity values of the riparian or downstream area.
Impacts on important wetlands 9.2.3.4 This category includes any impact of development on any important wetland
and its buffer distances, as set out in Appendix 2.
9.2.3.5 For SEPP 14 Coastal wetlands, further consideration of the impact of development is only required when the development impacts on the actual buffer area of a SEPP14 Coastal wetland, and not the buffer area according to the mapped layer of SEPP 14 Coastal wetlands.
9.2.3.6 Additional information required in the BAR for impacts on important wetlands: (a) the category of wetland that is being impacted by the Major Project (b) whether the wetland itself, and/or its buffer area, is being impacted (c) the extent of impact to the wetland or buffer area (d) the condition of the area of the wetland or buffer area subject to the
impact (e) any indirect impacts on wetlands, or on wetlands or watercourses
downstream of the proposed development (f) the measures proposed to minimise the impact on the biodiversity values
of the wetland area.
Impacts on species movement along corridors 9.2.3.7 This category includes any impact of development on areas of native
vegetation on land that is mapped or defined as a state significant biodiversity link, as identified in Chapter 4, and where the impact: (a) creates a gap greater than 100 m between two areas of moderate to good
condition native vegetation with a patch size greater than 1 ha (30 m for non-woody ecosystems), or
(b) removes over-storey cover and mid-storey cover vegetation within the state significant biodiversity link to create a gap in over-storey cover and mid-storey cover vegetation greater than 100 m between two areas of moderate to good condition vegetation with a patch size greater than 1 ha (30 m for non-woody ecosystems), or
(c) creates a hostile barrier, such as a dual carriageway, wider highway, or similar hostile barrier within the state significant biodiversity link.
9.2.3.8 Additional information required in the BAR for impacts on species movement along corridors: (a) the category of biodiversity corridor being impacted (b) the total area of the biodiversity corridor that is impacted by the
development, the extent to which the width of the corridor will be reduced and over what length, and the size of gaps being created or expanded

34 Framework for Biodiversity Assessment
(c) identify the threatened species whose movement and/or dispersal pathways are likely to be affected by the impact, and the extent to which populations may become fragmented or isolated
(d) the likely effects of the impact on the movement and dispersal pathways, including impacts on the processes important to the species’ life cycle (such as in the case of a plant – pollination, seed set, seed dispersal, germination), genetic diversity and long-term evolutionary development
(e) the onsite measures proposed to minimise the likely impacts on species movement.
9.2.4 Impacts on native vegetation 9.2.4.1 Impacts on native vegetation that require further consideration include impacts
on: (a) any CEEC, unless the CEEC is specifically excluded by the SEARs (b) an EEC specifically nominated in the SEARS as an EEC that is likely to
become extinct or have its viability significantly reduced in the IBRA subregion if it is impacted on by development.
9.2.4.2 Where the impact of the proposed development meets these criteria, the assessor is required to provide the following further information in the BAR: (a) the area and condition of the CEEC or EEC to be impacted directly and
indirectly by the proposed development (b) the extent and overall condition of the CEEC or EEC within an area of
1000 ha and then 10,000 ha surrounding the proposed development footprint.
(c) an estimate of the extant area and overall condition of the CEEC or EEC remaining in the IBRA subregion after the impact of the proposed development has been taken into consideration
(d) the development proposal’s impact on: (i) abiotic factors critical to the long-term survival of the CEEC or EEC.
For example, will the impact lead to a reduction of groundwater levels or substantial alteration of surface water patterns?
(ii) characteristic and functionally important species through impacts such as, but not limited to, inappropriate fire/flooding regimes, removal of understorey species or harvesting of plants
(iii) the quality and integrity of an occurrence of the CEEC or EEC through threats and indirect impacts including, but not limited to, assisting invasive flora and fauna species to become established or causing regular mobilisation of fertilisers, herbicides or other chemicals or pollutants which may harm or inhibit growth of species in the CEEC or EEC.
(e) direct or indirect fragmentation and isolation of an important area of the CEEC or EEC.
(f) the measures proposed to contribute to the recovery of the CEEC or EEC in the IBRA subregion.

Thresholds for the assessment and offsetting of unavoidable impacts of development 35
9.2.5 Impacts on threatened species 9.2.5.1 This category includes further consideration of the impacts of development:
(a) on any critically endangered species, unless the critically endangered species is specifically excluded in the SEARs
(b) on a threatened species or population that is specifically nominated in the SEARS as a species or population that is likely to become extinct or have its viability significantly reduced in the IBRA subregion if it is impacted on by the development, or
(c) where the survey or expert report undertaken in Section 6.6 confirms that a threatened species is present on the proposed development site, and the threatened species has not previously been recorded in the IBRA subregion according to records in the NSW Wildlife Atlas.
9.2.5.2 Where the impacts of the proposed development meet these criteria, the assessor is required to provide the following further information in the BAR: (a) the size of the local population directly and indirectly impacted by the
development (b) the likely impact (including direct and indirect impacts) that the
development will have on the habitat of the local population, including but not limited to: (i) an estimate of the change in habitat available to the local population
as a result of the proposed development (ii) the proposed loss, modification, destruction or isolation of the
available habitat used by the local population, and (iii) modification of habitat required for the maintenance of processes
important to the species’ life cycle (such as in the case of a plant – pollination, seed set, seed dispersal, germination), genetic diversity and long-term evolutionary development.
Atlas records or other documented, quantifiable means must be used by the assessor to estimate what percentage of the species’ population and habitat is likely to be lost in the long term within the IBRA subregion due to the direct and indirect impacts of the development
(c) the likely impact on the ecology of the local population. At a minimum, address the following: (i) for fauna:
– breeding – foraging – roosting, and – dispersal or movement pathways
(ii) for flora, address how the proposal is likely to affect the ecology and biology of any residual plant population that will remain post development including where information is available:
– pollination cycle – seedbanks – recruitment, and – interactions with other species (e.g. pollinators, host species,
mycorrhizal associations)

36 Framework for Biodiversity Assessment
(d) a description of the extent to which the local population will become fragmented or isolated as a result of the proposed development
(e) the relationship of the local population to other population/populations of the species. This must include consideration of the interaction and importance of the local population to other population/populations for factors such as breeding, dispersal and genetic viability/diversity, and whether the local population is at the limit of the species’ range
(f) the extent to which the proposed development will lead to an increase in threats and indirect impacts, including impacts from invasive flora and fauna, that may in turn lead to a decrease in the viability of the local population
(g) the measure/s proposed to contribute to the recovery of the species in the IBRA subregion.
Impacts on critical habitat 9.2.5.3 This category includes any impact of development on areas of land that the
Minister for the Environment has declared ‘critical habitat’ in accordance with section 47 of the TSC Act and that are listed on the Register of Critical Habitat in NSW (see www.environment.nsw.gov.au/criticalhabitat/CriticalHabitatProtectionByDoctype.htm)
Additional information required for impacts on critical habitat 9.2.5.4 If a proposed Major Project impacts on an area of critical habitat, additional
information will be required. The nature of this additional information will be developed by OEH as required. Impacts to critical habitat require the approval of the Minister for the Environment.
9.3 Impacts for which the assessor is required to determine an offset requirement
9.3.1 Impacts on native vegetation 9.3.1.1 The assessor is required to determine an offset for impacts of development on
PCTs that: (a) are identified as a CEEC that is specifically nominated in the SEARS for
the Major Project as a CEEC for which an impact does not require further consideration according to Section 9.2
(b) are identified as an EEC, unless it is an EEC that is specifically nominated in the SEARs for the Major Project as an EEC for which an impact requires further consideration according to Section 9.2
(c) are associated with threatened species habitat and in a vegetation zone that has a site value score ≥17.
9.3.1.2 The offset requirement for impacts on native vegetation is determined in accordance with Chapter 10.
9.3.2 Impacts on species and populations 9.3.2.1 The assessor is required to determine an offset for threatened species,
populations and species habitat for the impacts of development on:

Thresholds for the assessment and offsetting of unavoidable impacts of development 37
(a) a critically endangered species that is specifically nominated in the SEARS for the Major Project as a critically endangered species for which an impact does not require further consideration according to Section 9.2
(b) any other threatened species or population that was not specifically nominated in the SEARs for the Major Project as a threatened species or population for which an impact requires further consideration
(c) threatened species habitat associated with a PCT in a vegetation zone with a site value score of ≥17.
9.3.2.2 The offset requirement for impacts on threatened species, populations and threatened species habitat is determined in accordance with Chapter 10.
9.4 Impacts for which the assessor is not required to determine an offset
9.4.1 Impacts on native vegetation 9.4.1.1 The assessor is not required to determine an offset for the impacts of
development on PCTs that are: (a) in a vegetation zone with a site value score of <17, and the PCT has not
been identified as a CEEC or EEC (b) not associated with threatened species habitat according to Section 6.4,
and are not identified as a CEEC or EEC.
9.4.2 Impacts on species and populations 9.4.2.1 The assessor is not required to determine an offset for the impacts of
development on species, populations and species habitat that are: (a) threatened species habitat associated with a PCT within a vegetation
zone that has a site value score of <17, or (b) species or populations that are not threatened and do not form part of a
CEEC or EEC.
9.5 Impacts that do not require further assessment by the assessor
9.5.1.1 An assessor is not required to assess areas of land on the development site without native vegetation under Chapter 4 or Chapter 5, unless the SEARs issued for the project require an assessment of the land in accordance with those chapters.
Note: Areas of land that do not contain native vegetation must still be assessed for threatened species, in accordance with Chapter 6.

38 Framework for Biodiversity Assessment
10 Determining the offset requirement 10.1.1.1 Once the impacts on biodiversity have been avoided and minimised to the
fullest extent practicable, the boundaries of the development site will be confirmed and calculation of an offset requirement can commence.
10.1.1.2 Any impacts that require further consideration as identified in Chapter 9 will be formally considered by the consent authority once the EIS for the Major Project has been submitted as part of the application for approval to undertake the Major Project.
10.1.1.3 An assessor may use Chapter 10 of the FBA to determine a proposed offset requirement for impacts that require further consideration; however, whether the project can be approved and whether the offset proposal is appropriate for an impact requiring further consideration may not be confirmed by the consent authority until the EIS has been considered as part of the entire application to undertake the Major Project.
10.2 Calculating the credit requirement 10.2.1 Ecosystem credits and species credits 10.2.1.1 Ecosystem credits and species credits will be used to measure the loss of
biodiversity values that remains following all reasonable measures to avoid and minimise the impacts of the development in accordance with Chapter 8. Ecosystem credits measure the value of EECs, CEECs and threatened species habitat for species that can be reliably predicted to occur with a PCT. Species credits measure the biodiversity value of threatened species individuals or habitat (using the appropriate unit of measurement). Ecosystem credits and species credits are together referred to as ‘biodiversity credits’.
10.2.1.2 Biodiversity credits are used to measure the remaining impact on biodiversity values to determine the offset requirement. The offset requirement is documented in the BAR as outlined in Appendix 7.
10.2.1.3 The offset requirement for the Major Project can be met by creating biodiversity credits on an offset site and other actions as set out in Stage 3 in accordance with Chapters 11 and 12.
10.3 Calculating the future site value score for vegetation zones on the development site
10.3.1.1 Taking into account the impact of the Major Project, the assessor must determine future site attribute scores for each site attribute within each vegetation zone on the development site in accordance with Table 2.
10.3.1.2 The assessor must then use those future site attribute scores to calculate the future site value score for each vegetation zone on the development site in accordance with Equation 2 as set out in Appendix 1, except to the extent provided otherwise below: (a) If the lower benchmark value for any future site attribute is zero, and the
measure of that attribute on the site is zero, then the site attribute score of that attribute against the benchmark is 3.
(b) If the only benchmark value for any future site attribute is zero, then the attribute is not included in Equation 2 and c (that is, the maximum total where the relevant attributes are in benchmark condition) is scaled accordingly.

Determining the offset requirement 39
(c) The multipliers for ‘native over-storey cover × proportion of over-storey species occurring as regeneration’ and ‘number of trees with hollows × total length of fallen logs’ may be omitted from Equation 2 (and c is recalculated accordingly) for determining site value in a vegetation zone if the PCT is from one of the following vegetation formations: (i) Grasslands (ii) Heathlands (iii) Alpine Complex (iv) Freshwater Wetlands (v) Saline Wetlands (vi) Arid Shrublands.
10.3.1.3 The assessor may calculate a different future site value score for separate parts of a vegetation zone to allow for any variation in the impact of development across the vegetation zone. This includes where the impact of development will result in partial clearing of the native vegetation and includes areas such as asset protection zones and easements. The assessor must map these areas of the vegetation zone as a management zone and include this in the BAR
10.3.1.4 The assessor is not required to assess the impacts of the development on a vegetation zone that has a site value score of <17.
Summary of Equation 2: Determine the future site value score of a vegetation zone
10.4 Calculating the change in the site value score for
vegetation zones on the development site 10.4.1.1 The assessor must calculate the change in site value score for the vegetation
zone or for a management zone using Equation 3 in Appendix 1.
10.4.1.2 The change in site value is the difference between the current site value score determined in Equation 1 and the future site value score determined in Equation 2.
Summary of Equation 3: Calculate the change in site value score at the development site

40 Framework for Biodiversity Assessment
10.4.2 Assessing the direct impact of the Major Project on landscape values 10.4.2.1 The assessor must calculate the change in landscape value score for the
development site using Equation 4 in Appendix 1.
Summary of Equation 4: Calculate the change (loss) in landscape value with development
10.4.3 Calculating the ecosystem credits that measure the direct impact on
vegetation that is a CEEC/EEC or contains threatened species habitat 10.4.3.1 The direct impact of a Major Project on vegetation in each vegetation zone,
including any part of the vegetation zone identified as a management zone that: (a) the assessor has identified as a CEEC/EEC under Chapter 5, or (b) contains habitat for a threatened species that is predicted to use the site
under Section 6.3
must be measured using ecosystem credits.
10.4.3.2 The assessor must calculate those ecosystem credits in accordance with Equation 5 in Appendix 1.
10.4.3.3 The assessor must record these ecosystem credits in the BAR.
10.4.3.4 For PCTs that, in the opinion of the assessor, are a threatened ecological community, the Threatened Species Offset Multiplier which must be used in Equation 5 is 3.
10.4.3.5 Where the total number of credits calculated for a vegetation zone by the assessor is not a whole number, the assessor is to round it to the nearest whole number using conventional rounding rules, except if the number being rounded is less than one, in which case the number of credits is rounded to one.
10.4.3.6 The assessor must use the Credit Calculator to obtain a biodiversity credit report setting out the number and type of ecosystem credits which measure the direct impact of the Major Project on the biodiversity values of the development site.
Summary of Equation 5: Calculate the number of ecosystem credits required for the impact on vegetation that is an EEC or contains threatened species habitat

Determining the offset requirement 41
10.4.4 Calculating the species credits that measure the direct impact of a Major Project on threatened species
10.4.4.1 The direct impact of the development on the species credit species determined to be present on the development site under Chapter 6 must be measured using species credits.
10.4.4.2 The assessor must calculate those species credits using Equation 6 in Appendix 1 using the area of habitat or number of individuals identified in the species polygon prepared in Step 5 of Section 6.5.
10.4.4.3 Where the total number of species credits calculated by the assessor is not a whole number, the assessor is to round it to the nearest whole number using conventional rounding rules, except if the number being rounded is less than one, in which case the number of credits is rounded to one.
10.4.4.4 The assessor must record these species credits in the BAR.
10.4.4.5 A proponent does not require an offset where no threatened species or habitat components that require species credits have been identified after completing Step 3 in Section 6.5.
10.4.4.6 The assessor must use the Credit Calculator to obtain a biodiversity credit report setting out the number and type of species credits which measure the impact of the development on species credit species.
Summary of Equation 6: Calculate the number of species credits required for the loss of individual threatened species at a development site
10.4.5 Credit profile for ecosystem credits and species credits 10.4.5.1 The credit profile of an ecosystem credit consists of the following two
attributes: (a) PCT (b) IBRA subregion.
10.4.5.2 The credit profile of a species credit consists only of the threatened species which is being impacted upon at the development site.
10.4.5.3 The credit profile for ecosystem credits is established according to Table 5. The credit profile is part of the biodiversity credit report (biodiversity credits) produced from the Credit Calculator which sets out the number and type of ecosystem credits required to offset the impacts of development in accordance with Subsection 10.4.3.
10.4.5.4 The credit profile for ecosystem credits is created for each vegetation zone at the development site.

42 Framework for Biodiversity Assessment
Table 5: Attributes of the credit profile for ecosystem credits
Credit profile attribute Credit profile for ecosystem credits at a development site
Attribute 1: PCTs
PCTs that meet the following criteria will appear on the credit profile for ecosystem credits at a development site:
a) the PCT for which the ecosystem credit is required for the impacts of development
b) any PCT of the same vegetation class as identified in a) that has:
○ a percent cleared value of the PCT in the major catchment area equal to or greater than the percent cleared of the PCT specified in a)
or ○ a percent cleared value up to 10% lower than the PCT
specified in a), if the percent cleared of the PCT specified in a) is less than or equal to 70% cleared.
Note: To illustrate condition b), a PCT proposed to be cleared that is 60% cleared in the major catchment area, may be offset by a PCT that is no less than 50% cleared in the major catchment area where it is of the same vegetation class.
Attribute 2: IBRA subregions
IBRA subregions that meet the following criteria will appear on the credit profile for ecosystem credits at a development site:
a) the IBRA subregion in which the development occurs
b) the adjoining IBRA subregions within the same IBRA region as identified in a)
c) any other IBRA subregions that immediately adjoin the IBRA subregion identified in a)
d) any other IBRA subregions that have the same geographic distribution of the threatened species assessed for the ecosystem credits in accordance with Section 6.2.
10.5 Offset rules for biodiversity values 10.5.1.1 This section sets out the rules which govern how impacts on the biodiversity
values at a development site are offset by the improvements in biodiversity values at an offset site.
10.5.1.2 Under the offsetting rules established in the FBA, the credit profiles for biodiversity credits created at an offset site are matched with the credit profiles for the type of biodiversity credits required to offset the impacts on biodiversity values at a development site.
10.5.1.3 The purpose of these offset rules is to ensure that losses of biodiversity values are offset by improvements on land with the same or similar biodiversity values.

Determining the offset requirement 43
10.5.2 Ecosystem credit offset requirement 10.5.2.1 For the purposes of this subsection, required ecosystem credit means an
ecosystem credit calculated for a development in accordance with Subsection 10.4.3.
10.5.2.2 An ecosystem credit created at an offset site can only be used to offset the required ecosystem credit in accordance with this chapter.
10.5.3 Using an ecosystem credit created at an offset site to offset a required ecosystem credit
10.5.3.1 An ecosystem credit created from a site assessed in accordance with the BioBanking Assessment Methodology (BBAM) is a matching ecosystem credit if: (a) the PCT identified in the credit profile for the ecosystem credit created
from an offset site is the same as any of the PCTs identified in attribute 1 of the required ecosystem credit, and
(b) the IBRA subregion identified in the credit profile for the ecosystem credit created from an offset site is the same as an IBRA subregion identified in attribute 2 of the required ecosystem credit.
10.5.3.2 A matching ecosystem credit may be used to offset a required ecosystem credit.
10.5.4 Variation of the offset rules and supplementary measures for ecosystem credits
10.5.4.1 Subject to the offset rules set out in Subsection 10.5.3 the consent authority may approve: (a) a variation of the offset rules for matching ecosystem credits, by allowing
ecosystem credits created for a PCT from the same vegetation formation as the PCT to which the required ecosystem credit relates to be proposed as an offset, or
(b) a supplementary measure to be proposed as an offset for the PCT where the PCT is associated with an EEC or a CEEC.
Variation of the offset rules for ecosystem credits 10.5.4.2 The consent authority may approve a variation of the offset rules for matching
ecosystem credits, by allowing ecosystem credits created for a PCT from the same vegetation formation as the required ecosystem credit to be proposed as part of the Biodiversity Offset Strategy (BOS), where in the consent authority’s opinion the BOS demonstrates that: (a) all reasonable steps to secure a matching ecosystem credit have been
taken by the proponent, and (b) the required ecosystem credit is not for a PCT associated with a CEEC
listed on the TSC Act or an ecological community listed on the EPBC Act, and
(c) the PCT from the same vegetation formation has a percent cleared value of the PCT in the major catchment area equal to or greater than the percent cleared of the PCT to which the required ecosystem credit relates, or
(d) where the required ecosystem credit is for a PCT that is associated with a CEEC/EEC, the PCT from the same formation is also associated with an CEEC/EEC.

44 Framework for Biodiversity Assessment
Use of supplementary measures for ecosystem credits 10.5.4.3 The consent authority may approve supplementary measures to be proposed
as part of the BOS for a PCT impacted at the development site, where in the consent authority’s opinion the BOS demonstrates that: (a) all reasonable steps have been taken by the proponent to secure a
matching ecosystem credit, and (b) the PCT to which a required ecosystem credit relates is associated with a
CEEC/EEC or for which the impact of development does not require further consideration according to Subsection 9.2.4, and
(c) the supplementary measure applies to that CEEC/EEC, and (d) the supplementary measure is carried out in accordance with the rules
governing supplementary measures, including calculating the financial contribution of the supplementary measures in accordance with Appendix B of the NSW Biodiversity Offsets Policy for Major Projects.
10.5.5 Defining a suitable offset for individual threatened species 10.5.5.1 The credit profile of a species credit relates only to the threatened species or
population which is impacted at a development site or is being managed at an offset site.
10.5.6 Using a species credit created from an offset site to offset a required species credit
10.5.6.1 In this section, required species credit means a species credit calculated for a Major Project in accordance with Chapter 6.
10.5.6.2 A required species credit must be offset with a species credit created for the same species, determined in accordance with the BBAM.
10.5.7 Variation of the offset rules and supplementary measures for species credits
10.5.7.1 Subject to the offset rules set out in Subsection 10.5.6, the consent authority may approve: (a) a variation of the offset rules for matching species credits by allowing a
different species to that impacted by the proposed development to be used to meet the offset requirement, or
(b) a supplementary measure to be proposed as an offset for the species impacted by the development.
Variation of the offset rules for species credits 10.5.7.2 The consent authority may allow species credits for a different species to that
impacted by the proposed development to be used to meet the offset requirement where: (a) the proponent can demonstrate that all reasonable steps have been taken
to secure the number and types of species credits impacted on at the development site, and
(b) the species to which the species credit relates is not listed on the EPBC Act or listed as critically endangered on the TSC Act.

Determining the offset requirement 45
10.5.7.3 In addition, the variation to use species credits for a different species must only be approved by the consent authority where: (a) the alternative species credits are created on land within the same IBRA
region in which the proposed Major Project occurs, and (b) for fauna, the alternative species is a species or population from the same
Order as the fauna species impacted on at the development site. In addition, the PCT containing threatened species habitat at an offset site is a PCT, which according to the Threatened Species Profile Database, is also associated with the fauna species impacted at the development site, or for flora, the alternative species is, according to the Threatened Species Profile Database, from the same life-form as the flora species impacted at the development site. In addition, the PCT containing the flora species at the offset site should preferably be the same PCT within which this species was located at the development site, and
(c) the alternative species credits are for a species or population listed in either Schedule 1 or 1A of the TSC Act, where the species credit required for the proposed development relates to a species or population listed in Schedule 1 of the TSC Act, or
(d) the alternative species credits are for a species or population listed in either Schedule 1, 1A or 2 of the TSC Act, where the species credit required for the proposed development relates to a species or population listed in Schedule 2 of the TSC Act.
10.5.7.4 The justification for applying a variation to the offset rules for individual threatened species or populations and the reasons for proposing the alternative species credits must be detailed in the BOS and must address the criteria set out in this section.
Use of supplementary measures for species credits 10.5.7.5 The consent authority may approve a variation of the offset rules for species
credits by allowing supplementary measures to be proposed as part of the BOS for a species impacted at the development site where: (a) the species or population to which the species credit relates is not a
species or population for which the impact of development requires further consideration according to Subsection 9.2.5, and
(b) the proponent can demonstrate that all reasonable steps have been taken to secure the number and types of species credits impacted at the development site, and
(c) the proposed supplementary measure only applies to the species impacted at the development site, and
(d) the supplementary measure is carried out in accordance with the rules governing supplementary measures, including calculating the financial contribution of the supplementary measures in accordance with Appendix B of the NSW Biodiversity Offsets Policy for Major Projects.
10.5.7.6 It is recommended that a proponent consult OEH on the proposed use of supplementary measures. The justification for applying a variation to the offset rules to use a supplementary measure to meet the offset requirement for an individual threatened species or population, and the reasons for proposing the supplementary measures, must be detailed in the BOS and must address the criteria set out in this section.

46 Framework for Biodiversity Assessment
Stage 3 – Biodiversity Offset Strategy 11 Introduction to Stage 3
11.1 Documenting Stage 3 outcomes 11.1.1.1 The outcomes of Stage 3 are documented in the Biodiversity Offset Strategy
(BOS). The BOS must be prepared by an accredited assessor and must contain the matters identified in Appendix 7.
11.1.1.2 The BOS is submitted with the Biodiversity Assessment Report (BAR) as part of the EIS and application for development consent or infrastructure approval.
11.2 Conservation measures that can be used to provide an offset
11.2.1.1 An offset requirement is represented as a number and type of biodiversity credits determined in accordance with Chapter 10. Subject to provisions in the NSW Biodiversity Offsets Policy for Major Projects, the conservation measures that may be used to satisfy this offset requirement include: (a) retirement of biodiversity credits from the biodiversity register established
under Part 7A of the TSC Act (b) ecological rehabilitation of previously mined land in accordance with
Section 12.2 (c) supplementary measures as determined in accordance with the NSW
Biodiversity Offsets Policy for Major Projects (d) a combination of the above.
Sections within Stage 3 12 Calculating gain in biodiversity values at an offset site .............................................. 47
12.1 Assessing biodiversity values at an offset site .................................................. 47
12.2 Generating biodiversity credits for ecological rehabilitation of previously mined land ......................................................................................................... 47
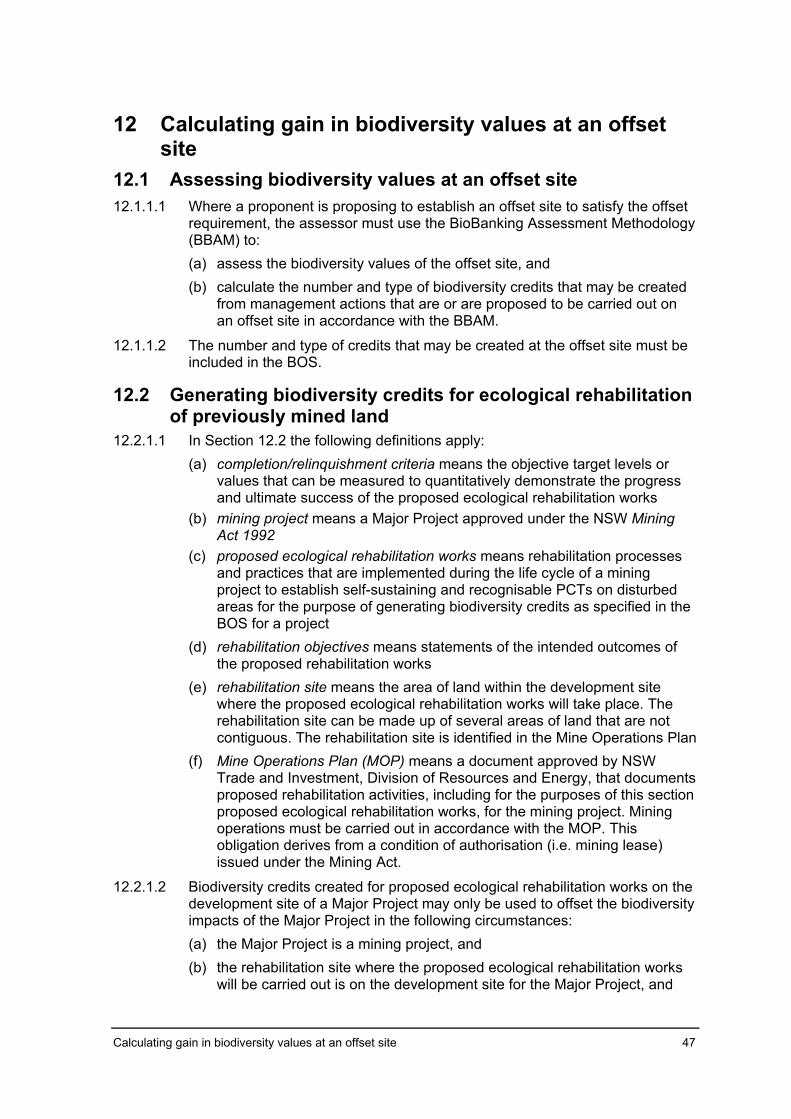
Calculating gain in biodiversity values at an offset site 47
12 Calculating gain in biodiversity values at an offset site
12.1 Assessing biodiversity values at an offset site 12.1.1.1 Where a proponent is proposing to establish an offset site to satisfy the offset
requirement, the assessor must use the BioBanking Assessment Methodology (BBAM) to: (a) assess the biodiversity values of the offset site, and (b) calculate the number and type of biodiversity credits that may be created
from management actions that are or are proposed to be carried out on an offset site in accordance with the BBAM.
12.1.1.2 The number and type of credits that may be created at the offset site must be included in the BOS.
12.2 Generating biodiversity credits for ecological rehabilitation of previously mined land
12.2.1.1 In Section 12.2 the following definitions apply: (a) completion/relinquishment criteria means the objective target levels or
values that can be measured to quantitatively demonstrate the progress and ultimate success of the proposed ecological rehabilitation works
(b) mining project means a Major Project approved under the NSW Mining Act 1992
(c) proposed ecological rehabilitation works means rehabilitation processes and practices that are implemented during the life cycle of a mining project to establish self-sustaining and recognisable PCTs on disturbed areas for the purpose of generating biodiversity credits as specified in the BOS for a project
(d) rehabilitation objectives means statements of the intended outcomes of the proposed rehabilitation works
(e) rehabilitation site means the area of land within the development site where the proposed ecological rehabilitation works will take place. The rehabilitation site can be made up of several areas of land that are not contiguous. The rehabilitation site is identified in the Mine Operations Plan
(f) Mine Operations Plan (MOP) means a document approved by NSW Trade and Investment, Division of Resources and Energy, that documents proposed rehabilitation activities, including for the purposes of this section proposed ecological rehabilitation works, for the mining project. Mining operations must be carried out in accordance with the MOP. This obligation derives from a condition of authorisation (i.e. mining lease) issued under the Mining Act.
12.2.1.2 Biodiversity credits created for proposed ecological rehabilitation works on the development site of a Major Project may only be used to offset the biodiversity impacts of the Major Project in the following circumstances: (a) the Major Project is a mining project, and (b) the rehabilitation site where the proposed ecological rehabilitation works
will be carried out is on the development site for the Major Project, and

48 Framework for Biodiversity Assessment
(c) for ecosystem credits, the PCT that is the target of the proposed ecological rehabilitation works: (i) occurs naturally within the same IBRA subregion as the Major Project
or any of the adjacent IBRA subregions, and (ii) is in the same vegetation class as the required ecosystem credit, and
(d) for species credits, a species credit that is proposed to be created from the proposed ecological rehabilitation works is the same species as the required species credit for the impacts of the Major Project.
12.2.1.3 Proposed ecological rehabilitation works to be carried out on the development site for a mining project may generate ecosystem credits in the following circumstances: (a) the rehabilitation objectives are for the creation of recognisable and self-
sustaining PCTs and are documented in the BOS, and (b) the PCTs that are the target of the proposed ecological rehabilitation
works are listed in the VIS Classification Database, and (c) the completion/relinquishment criteria documented in the BOS have been
prepared in accordance with Paragraph 12.2.1.5.
12.2.1.4 Proposed ecological rehabilitation works to be carried out on the development site for a mining project may generate species credits in the following circumstances: (a) the completion/relinquishment criteria documented in the BOS have been
prepared in accordance with Paragraph 12.2.1.5, and (b) the assessor demonstrates in the BOS that rehabilitation of habitat for the
fauna species that is the target of the proposed ecological rehabilitation works is feasible, or that the proposed ecological rehabilitation works are likely to result in the target flora species being present at the rehabilitation site, and
(c) the species for which the species credit is being created is listed in the Threatened Species Profile Database as being a species credit species for the IBRA subregion in which the mining project occurs.
12.2.1.5 For each PCT that is the target of the proposed ecological rehabilitation works the assessor must set out in the BOS completion/relinquishment criteria that: (a) are specific, measureable, achievable and realistic, and (b) specify the level of increase in the site attribute condition score and the
completion/relinquishment standard to be achieved for each site attribute, according to Table 6, and
(c) demonstrate that vegetation on the rehabilitation site is a recognisable PCT or strongly trending towards becoming a recognisable PCT, and
(d) demonstrate that the vegetation or other habitat features on the rehabilitation site are providing habitat for the fauna species for which species credits are proposed to be created, and
(e) demonstrate that the flora species for which species credits are proposed to be created are present on the rehabilitation site.

Calculating gain in biodiversity values at an offset site 49
12.2.1.6 Where biodiversity credits created from proposed ecological rehabilitation works are proposed to offset the biodiversity impacts of the Major Project, the BOS must set out all of the following: (a) the rehabilitation objectives for the rehabilitation site (b) the PCTs that are the target of the proposed ecological rehabilitation
works (c) evidence that the target PCTs occur naturally within the IBRA subregion
that the Major Project occurs in or the adjacent IBRA subregions (d) the completion/relinquishment criteria for each PCT as specified in
Paragraph 12.2.1.5 (e) for each site attribute for each PCT, the increase in the site attribute
condition score calculated as set out in Table 6, based on the completion/relinquishment criteria in the BOS
(f) the area of land that will be rehabilitated to each PCT (g) the total number of ecosystem credits proposed to be created for the
ecological rehabilitation for each PCT that is the target of the rehabilitation, calculated in accordance with Subsection 12.2.2
(h) the total number of species credits proposed to be created for each species, calculated in accordance with Subsection 12.2.2
(i) justification that the proposed ecological rehabilitation works and the achievement of the relinquishment/completion criteria will contribute to the restoration of habitat for the fauna species for which species credits are proposed to be created, or are likely to result in the presence on the rehabilitation site of the flora species for which species credits are proposed to be created
(j) the biodiversity credits required for the Major Project that will be met through rehabilitation.
12.2.1.7 The completion/relinquishment criteria set out in the BOS will be used in the Mine Operations Plan to demonstrate that the rehabilitation has been successfully completed.
12.2.1.8 Once the Minister administering the Mining Act has determined the rehabilitation site has met the completion/relinquishment criteria, a biobanking agreement may be established to provide for the ongoing protection and management of the site. The establishment of a biobanking agreement permits the creation of biodiversity credits in accordance with an assessment of the land using the BBAM. Biodiversity credits created at the time a biobanking agreement is established on the rehabilitation site are additional to those calculated as part of the BOS for the Major Project in accordance with Section 12.2.

50 Framework for Biodiversity Assessment
12.2.2 Calculating biodiversity credits for the rehabilitation of mined land 12.2.2.1 The number of ecosystem credits created from proposed ecological
rehabilitation works may only be calculated using Equation 7.
Summary of Equation 7: Ecosystem credits – number of ecosystem credits created for ecological rehabilitation of post mined land
12.2.2.2 The number of species credits created from proposed ecological rehabilitation works may only be calculated using Equation 8.
Summary of Equation 8: Species credits – number of credits created for ecological rehabilitation of post mined land
12.2.2.3 Ecosystem credits can only be created for the PCT that is the target of the proposed ecological rehabilitation works.
12.2.2.4 The current site value for mine rehabilitation is the site value taken immediately before the commencement of the proposed ecological rehabilitation works. This means that the score for each site attribute must start at zero and the overall site value score is also zero.
12.2.2.5 The future site value score that is to be achieved from the proposed ecological rehabilitation works must be determined based on the completion/relinquishment criteria stated in the BOS and the allowable increase in site attribute score for each completion/relinquishment criterion as specified in Table 6.
12.2.2.6 The use of habitat augmentation features such as logs and stags with hollows may be used to achieve the expected improvement in condition for site attributes in accordance with the criteria for that attribute. These may also be used to support habitat for threatened species that are assessed for species credits.
12.2.2.7 The attributes for landscape value must not be considered in the calculation of ecosystem credits for ecological rehabilitation.

Calculating gain in biodiversity values at an offset site 51
Table 6: Maximum allowable increases in the site attribute condition score as a result of proposed ecological rehabilitation works
Site attribute
Allowable increase in the site attribute
condition score from
zero Required completion/relinquishment standard for the increase in site
attribute condition score
Native plant species richness
0.5 The rehabilitation will achieve >25% of the native plant species richness benchmark for the nominated PCT. Only plant species characteristic of the target PCT may be counted towards native plant species richness.
1.0 The rehabilitation will achieve >50% of the native plant species richness benchmark for the nominated PCT. Only plant species characteristic of the target PCT may be counted towards native plant species richness.
Over-storey cover
0.5
The rehabilitation will achieve >10% and <25%, or >200% of the percent native over-storey cover benchmark for the nominated PCT. Only over-storey plant species characteristic of the target PCT may be counted towards percent native over-storey cover.
1
The rehabilitation will achieve >25% and <200% of the percent native over-storey cover benchmark for the nominated PCT. Only over-storey plant species characteristic of the target PCT may be counted towards percent native over-storey cover.
Mid-storey cover
0.5
The rehabilitation will achieve >10% and <25%, or >200% of the percent native mid-storey cover benchmark for the nominated PCT. Only mid-storey plant species characteristic of the target PCT may be counted towards percent native mid-storey cover.
1
The rehabilitation will achieve >25% and <200% of the percent native mid-storey cover benchmark for the nominated PCT. Only mid-storey plant species characteristic of the target PCT may be counted towards percent native mid-storey cover.
Native ground cover (grasses)
0.5
The rehabilitation will achieve >10% and <25%, or >200% of the percent native ground cover (grasses) benchmark for the nominated PCT. Only native ground cover (grasses) plant species characteristic of the target PCT may be counted towards percent native ground cover (grasses).
1.0
The rehabilitation will achieve >25% and <200% of the percent native ground cover (grasses) benchmark for the nominated PCT. Only native ground cover (grasses) plant species characteristic of the target PCT may be counted towards percent native ground cover (grasses).
Native ground cover (shrubs)
0.5
The rehabilitation will achieve >10% and <25%, or >200% of the percent native ground cover (shrubs) benchmark for the nominated PCT. Only native ground cover (shrubs) plant species characteristic of the target PCT may be counted towards percent native ground cover (shrubs)
1
The rehabilitation will achieve >25% and <200% of the percent native ground cover (shrubs) benchmark for the nominated PCT. Only native ground cover (shrubs) plant species characteristic of the target PCT may be counted towards percent native ground cover (shrubs).
Native ground cover (other)
0.5
The rehabilitation will achieve >10% and <25%, or >200% of the percent native ground cover (other) benchmark for the nominated PCT. Only native ground cover (other) plant species characteristic of the target PCT may be counted towards percent native ground cover (other).
1
The rehabilitation will achieve >25% and <200% of the percent native ground cover (other) benchmark for the nominated PCT. Only native ground cover (other) plant species characteristic of the target PCT may be counted towards percent native ground cover (other).

52 Framework for Biodiversity Assessment
Table 6 continued.
Site attribute
Allowable increase in the site attribute
condition score from
zero Required completion/relinquishment standard for the increase in site
attribute condition score
Exotic plant cover
0.5 The exotic plant cover will be <60%. Exotic plant cover must be calculated as a percentage of the total ground and mid-storey cover. Exotic plant cover is measured as total percent foliage cover of all exotics in all strata.
1 The exotic plant cover will be <45%. Exotic plant cover must be calculated as a percentage of the total ground and mid-storey cover. Exotic plant cover is measured as total percent foliage cover of all exotics in all strata.
Number of trees with hollows
0.5
The number of hollow bearing stags will be >25% of the number of hollow bearing trees benchmark for the nominated PCT. Only stags brought onto the site from an adjoining development area already containing hollows and properly secured may be used as habitat augmentation for this attribute.
Over-storey regeneration 0.5
At least 25% of over-storey species for the nominated PCT are naturally regenerating. Over-storey regeneration is when a second generation of over-storey plants naturally regenerates on the site as a result of reproduction of established over-storey species. Over-storey regeneration does not include juvenile or young plants which have been planted or seeded. Over-storey regeneration must be present across the vegetation zone.
Total length of fallen logs
0.5
The length of coarse woody debris will be >25% of the total length of fallen logs benchmark for the nominated PCT. The active placement of logs that are brought onto the site from an adjoining development area and are placed in a configuration that reflects natural systems can be used as habitat augmentation.

Definitions 53
Definitions References to legislation in the FBA are references to legislation as in force from time to time. References to sections are references to sections of this FBA unless otherwise indicated. The following terms are defined for the purposes of the FBA: Assessment circles: two circles (the inner and outer assessment circle) in which the percent native vegetation cover in the landscape is assessed, taking into account both cover and condition of vegetation. Assessor: the person referred to in Subsection 2.2.1 and who has been engaged by the proponent. Avoid: In the development planning processes, potential impacts on biodiversity values and the environment are avoided through careful site selection and project design. Refer to the FBA for operational guidance. Benchmarks: the quantitative measures of the range of variability in vegetation condition in vegetation with relatively little evidence of modification by humans since European (post 1750) settlement. Benchmarks are defined for specified variables for each PCT. Vegetation with relatively little evidence of modification generally has minimal timber harvesting (few stumps, coppicing, cut logs), minimal firewood collection, minimal exotic weed cover, minimal grazing and trampling by introduced or overabundant native herbivores, minimal soil disturbance, minimal canopy dieback, no evidence of recent fire or flood, is not subject to high frequency burning, and has evidence of recruitment of native species. BioBanking Assessment Methodology (BBAM): the rules established under section 127B of the TSC Act. Biobanking agreement: has the same meaning as in the TSC Act. Biodiversity Assessment Report (BAR): the report that must be prepared in accordance with Section 3.2. Biodiversity credit report: the report produced by the Credit Calculator that sets out the number and type of biodiversity credits required to offset the remaining adverse impacts on biodiversity values at a development site, or sets out the number and type of biodiversity credits that are created at an offset site. Biodiversity credits: ecosystem or species credits. Biodiversity Offset Strategy (BOS): has the meaning given to it in Chapter 11. Biodiversity offsets: are management actions that are undertaken to achieve a gain in biodiversity values on areas of land in order to compensate for losses to biodiversity values from the impacts of development. See also Offset requirement, and Offset site. Biodiversity values: has the same meaning as at section 4A of the TSC Act but excludes marine mammals, wandering sea birds and biodiversity that is endemic to Lord Howe Island. Biometric vegetation type (BVT): provides the occurrence of the PCT within a specific catchment management area. A BVT may be assigned catchment specific attributes such as benchmark data, percent cleared in the catchment area value and associations with threatened species, populations and communities. A PCT may be distributed across one or more major catchment areas and is assigned a BVT with each major catchment area occurrence. BVTs are managed in the VIS Classification Database. Broad condition state: are areas of the same PCT that are in relatively homogenous condition. Broad condition is used for stratifying areas of the same PCT into a vegetation zone for the purpose of determining the site value score.

54 Framework for Biodiversity Assessment
Connectivity: the measure of the degree to which an area(s) of native vegetation is linked with other areas of vegetation. Connectivity value: has the meaning given in Subsection 4.2.3. Consent authority: for Major Projects this will generally be the Minister for Planning, or by delegation including the Planning Assessment Commission or senior officers of the Department of Planning and Environment. Credit Calculator: the computer program that provides decision support to assessors and proponents by applying the FBA, and which calculates the number and type of biodiversity credits required to offset the impacts of a Major Project. Critical habitat: has the same meaning as in the TSC Act. Critically endangered ecological community (CEEC): an ecological community specified in Part 2 of Schedule 1A of the TSC Act and/or listed under Part 13, Division 1, Subdivision A of the EPBC Act. Derived PCTs: PCTs that have changed to an alternative stable state as a consequence of land management practices since European settlement. Derived communities can have one or more structural components of the vegetation entirely removed or severely reduced (e.g. over-storey of grassy woodland), or have developed new structural components where they were previously absent (e.g. shrubby mid-storey in an open woodland system). Development: has the same meaning as development at section 4 of the NSW Environmental Planning and Assessment Act 1979 (EP&A Act) and includes development as defined in section 115T of the EP&A Act. Development footprint: the area of land that is directly impacted on by a proposed Major Project that is under the EP&A Act, including access roads, and areas used to store construction materials. Development site: an area of land that is subject to a proposed Major Project that is under the EP&A Act. Direct impact on biodiversity values: an impact on biodiversity values that is a direct result of vegetation clearance from a development. It is predictable, usually occurs at or near to the development site and can be readily identified during the planning, design, construction, and operational phases of a development. Ecosystem credits: a measurement of the value of EECs, CEECs and threatened species habitat for species that can be reliably predicted to occur with a PCT. Ecosystem credits measure the loss in biodiversity values at a development site and the gain in biodiversity values at an offset site. Endangered ecological community (EEC): an ecological community specified in Part 3 of Schedule 1 of the TSC Act, or listed under the EPBC Act. EP&A Act: the NSW Environmental Planning and Assessment Act 1979. EPBC Act: the Commonwealth Environment Protection and Biodiversity Conservation Act 1999. Estuarine area: a semi-enclosed body of water having an open or intermittently open connection with the ocean, in which water levels do not vary with the ocean tide (when closed to the sea) or vary in a predictable, periodic way in response to the ocean tide at the entrance (when open to the sea). Environmental impact statement (EIS): an environmental impact statement referred to in section 78A, 112 or 115Y of the EP&A Act. Exotic plant cover: exotic plants are vascular plants not native to Australia. Exotic plant cover is measured as total percent foliage cover of all exotics in all strata.

Definitions 55
Expert: a person who is accredited by the Director-General under section 142B(1)(b) of the TSC Act, or if arrangements for accreditation under section 142B(1)(b) are not in place, a person who has the relevant experience and/or qualifications to provide expert opinion in relation to the biodiversity values to which an expert report relates. FBA: this Framework for Biodiversity Assessment. Gain: the gain in biodiversity values at an offset site, over time from undertaking management actions at an offset site. Gain in biodiversity values is the basis for creating biodiversity credits at the offset site. Grassland: native vegetation classified in the vegetation formation ‘Grasslands’ in Keith (2004)1. Grasslands are generally dominated by large perennial tussock grasses, lack of woody plants, the presence of broad-leaved herbs in inter-tussock spaces, and their ecological association with fertile, heavy clay soils on flat topography in regions with low to moderate rainfall. Habitat: an area or areas occupied, or periodically or occasionally occupied, by a species, population or ecological community, including any biotic or abiotic component. Habitat component: the component of habitat that is used by a threatened species for either breeding, foraging or shelter. Habitat surrogates: measures of habitat that predict the occurrence of threatened species, populations and communities: IBRA subregion, PCT, percent vegetation cover and vegetation condition. Herbfield: native vegetation which predominantly does not contain an over-storey or mid-storey and where the ground cover is dominated by non-grass species. Hollow bearing tree: a living or dead tree that has at least one hollow. A tree is considered to contain a hollow if: (a) the entrance can be seen; (b) the minimum entrance width is at least 5 cm across; (c) the hollow appears to have depth (i.e. you cannot see solid wood beyond the entrance); (d) the hollow is at least 1 m above the ground. Trees must be examined from all angles. IBRA region: a bioregion identified under the Interim Biogeographic Regionalisation for Australia (IBRA) system2, which divides Australia into bioregions on the basis of their dominant landscape-scale attributes. IBRA subregion: a subregion of a bioregion identified under the IBRA system and based on major catchment areas as shown in Appendix 6. Impact assessment: an assessment of the impact or likely impact of a Major Project on biodiversity values which is prepared in accordance with the FBA. Impacts on biodiversity values: loss in biodiversity values from direct or indirect impacts of the Major Project in accordance with Chapters 8, 9 and 10. Important area: an area of the CEEC or EEC that is necessary for the entities’ long-term persistence and recovery. This may include areas identified in recovery plans, and/or an area large in comparison to other stands of the CEEC or EEC or occurrences of the CEEC or EEC at the limit of the community’s range. Important wetland: a wetland that is listed in the Directory of Important Wetlands of Australia (DIWA), or is a wetland mapped under State Environmental Planning Policy 14 (SEPP 14 Coastal wetlands). 1 Keith, D (2004), Ocean shores to desert dunes: the native vegetation of New South Wales and the ACT, Department of Environment and Conservation NSW, Hurstville. 2 Thackway, R and Cresswell ID (1995), An interim biogeographic regionalisation for Australia: a framework for setting priorities in the National Reserves System Cooperative Program, Australian Nature Conservation Agency, Canberra.

56 Framework for Biodiversity Assessment
Indirect impact on biodiversity values: an impact on biodiversity values that occurs when development related activities affect threatened species, threatened species habitat, populations or ecological communities in a manner other than direct impact. Compared to direct impacts, indirect impacts often:
• occur over a wider area than just the site of the development • have a lower intensity of impact in the extent to which they occur compared to direct
impacts • occur off site • have a lower predictability of when the impact occurs • have unclear boundaries of responsibility.
Individual: in relation to organisms, a single, mature organism that is a threatened species defined in section 4(1) of the TSC Act, or any additional threatened species listed under Part 13 of the EPBC Act. Initial desktop assessment of biodiversity values: an assessment undertaken as part of concept-planning, and that informs project siting and design. The assessment compiles all existing environmental information about the site, and where necessary, additional information relating to features of biodiversity significance. Landscape attributes: in relation to a development site, native vegetation cover, vegetation connectivity, patch size and the area to perimeter ratio. Landscape value: the value given to landscape attributes of a development site or offset site after an assessment undertaken in accordance with Section 4.2. Life cycle: the series of stages of reproduction, growth, development, aging and death of an organism. Linear shaped development: development that is generally narrow in width and extends across the landscape for a distance greater than 3.5 kilometres in length. Local population: the population that occurs in the study area. In cases where multiple populations occur in the study area or a population occupies part of the study area, impacts on each subpopulation must be assessed separately. Local wetland: any wetland that is not identified as an important wetland (refer to definition of important wetland). Loss: the loss of biodiversity values from a development site. Major catchment area: the area of operation of a former catchment management authority, as described in Schedule 2 of the Catchment Management Authorities Act 2003 immediately before its repeal. Major Project: State Significant Development or State Significant Infrastructure projects, such as mines, hospitals and highways. Minimise: a process applied throughout the development planning and design life cycle which seeks to reduce the unavoidable impacts of development on biodiversity values. Mitchell landscape: landscapes with relatively homogeneous geomorphology, soils and broad vegetation types, mapped at a scale of 1:250,000. Multiple fragmentation impact development: Major Project developments such as wind farms and coal seam gas extraction that require multiple extraction points (wells) or turbines and a network of associated development including for roads, tracks, gathering systems/flow lines, transmission lines. Native ground cover: all native vegetation below 1 m in height, including all such species native to NSW (i.e. not confined to species indigenous to the area).

Definitions 57
Native ground cover (grasses): native ground cover contains all native vegetation below 1 m in height and includes all species native to NSW (i.e. it is not confined to species indigenous to the area). Native ground cover (grasses) refers specifically to native grasses. Native ground cover (other): native ground cover contains all native vegetation below 1 m in height and includes all species native to NSW (i.e. it is not confined to species indigenous to the area). Native ground cover (other) refers to non-woody native vegetation (vascular plants only) <1 m that is not grass (e.g. herbs, ferns). Native ground cover (shrubs): native ground cover contains all native vegetation below 1 m in height and includes all species native to NSW (i.e. it is not confined to species indigenous to the area). Native ground cover (shrubs) refers to native woody vegetation <1 m. Native mid-storey cover: native mid-storey contains all vegetation between the over-storey stratum and a height of 1 m (typically tall shrubs, under-storey trees and tree regeneration) and including all species native to NSW (i.e. native species not local to the area can contribute to mid-storey structure). Native over-storey cover: native over-storey is the tallest woody stratum present (including emergent) above 1 m and including all species native to NSW (i.e. native species not local to the area can contribute to over-storey structure). In a woodland community the over-storey stratum is the tree layer, and in a shrubland community the over-storey stratum is the tallest shrub layer. Some vegetation types (e.g. grasslands) may not have an over-storey stratum. Native plant species richness: the number of different native vascular plant species that are characteristic of a PCT. Native vegetation: has the same meaning as in section 6 of the Native Vegetation Act 2003 (NV Act). Number of trees with hollows: a count of the number of living and dead trees that are hollow bearing. Offset requirement: the number and type of biodiversity credits that are required to offset the remaining impacts of development on biodiversity values after all reasonable measures have been taken to avoid and minimise impacts. Offset site: an area of land that is assessed in accordance with the BBAM and managed for biodiversity conservation in accordance with a plan of management, and with sufficient resourcing available to implement the plan of management, and the arrangements for managing the land are secured in-perpetuity under an approved conservation mechanism. Offset rules: the circumstances in which credits created at an offset site can be used (retired) for a development to meet the offset requirement. Onsite measures: reasonable measures and strategies that are taken, or are proposed to be taken at a development site to avoid and minimise the direct and indirect impacts of the development on biodiversity values. Operational Manual: a guide to using the FBA. The Operational Manual is being prepared by OEH and will be available on the OEH website (when published). Patch size: an area of native vegetation that:
a) occurs on the development site or offset site, and b) is in moderate to good condition, and c) includes native vegetation that has a gap of less than 100 m from the next area
of moderate to good condition native vegetation (or ≤30 m for non-woody ecosystems).
Patch size may extend onto adjoining land that is not part of the development site.

58 Framework for Biodiversity Assessment
PCT classification system: the system of classifying native vegetation approved by the NSW Plant Community Type Control Panel and described in the VIS Classification Database. Percent cleared value: the percentage of a vegetation type that has been cleared within a major catchment area as a proportion of its pre-1750 extent, as identified in the VIS Classification Database. The percent cleared value is assigned to the BVT equivalent. Percent foliage cover: the percentage of ground that would be covered by a vertical projection of the foliage and branches and trunk of a plant or plants. Percent native vegetation cover: the percent of native vegetation cover in the inner and outer assessment circle, or the development footprint buffer area. Cover estimates are based on the cover of native woody and non-woody vegetation relative to the approximate benchmarks for the PCT, taking into account vegetation condition and extent. Native over-storey vegetation is used to determine the percent cover in woody vegetation types, and native ground cover is used to assess cover in non-woody vegetation types. Plant community type (PCT): a NSW plant community type identified using the PCT classification system. Plot: an area within a vegetation zone in which site attributes are assessed. Proponent: an organisation which is an applicant for a Major Project. Reasonable steps to secure a matching ecosystem credit/species credit: steps taken by the proponent that include, in addition to consideration of any feasible sites known to the proponent:
a) checking the biobanking public register and placing an expression of interest for credits wanted on it for at least six months
b) liaising with an OEH office (or Fisheries NSW office for aquatic biodiversity) and relevant local councils to obtain a list of potential sites that meet the requirements for offsetting
c) considering properties for sale in the required area d) providing evidence of why offset sites are not feasible; suitable evidence may
include: – the unwillingness of a landowner to sell or establish a biobank site – the cost of an offset site itself should not be a factor unless it can be
demonstrated the landowner is charging significantly above market rates.
Reference sites: the relatively unmodified sites that are assessed to obtain local benchmark information when benchmarks in the Vegetation Benchmarks Database are too broad or otherwise incorrect for the PCT and/or local situation. Benchmarks can also be obtained from published sources. Regeneration: the proportion of over-storey species characteristic of the PCT that are naturally regenerating and have a diameter at breast height <5 cm within a vegetation zone. Regionally significant biodiversity link: a biodiversity corridor that is important at a regional scale and is identified in a plan approved by the Chief Executive of OEH. Required ecosystem credit: has the meaning given by Subsection 10.5.2. Remaining impact: an impact on biodiversity values after all reasonable measures have been taken to avoid and minimise the impacts of development. Under the FBA, an offset requirement is calculated for the remaining impacts on biodiversity values. Retirement of credits: the purchase and retirement of biodiversity credits from an already-established offset area.

Definitions 59
Riparian buffer: an area of land determined according to Appendix 2. Risk of extinction: the likelihood that the local population or CEEC or EEC will become extinct either in the short term or in the long term as a result of direct or indirect impacts on the viability of that population or CEEC or EEC. Site attributes: the matters assessed to determine site value. They include: native plant species richness, native over-storey cover, native mid-storey cover, native ground cover (grasses), native ground cover (shrubs), native ground cover (other), exotic plant cover (as a percentage of total ground and mid-storey cover), number of trees with hollows, proportion of over-storey species occurring as regeneration, and total length of fallen logs. Site based development: a development other than a linear shaped development, or a multiple fragmentation impact development. Site value: the condition of native vegetation assessed for each vegetation zone against the benchmark for the PCT. Site value score: the quantitative measure of vegetation condition calculated in accordance with Equation 1. Species credit species: threatened species and populations that are assessed according to Section 6.4. Species credits: the class of biodiversity credits created or required for the impact on threatened species that cannot be reliably predicted to use an area of land based on habitat surrogates. Species that require species credits are listed in the Threatened Species Profile Database. Species that cannot withstand further loss: a species identified in the Threatened Species Profile Database as a species that cannot withstand further loss in the major catchment area in which the species occurs because of one or more of the following:
• the species is naturally very rare, has few populations or a restricted distribution • the species or population is critically endangered • the species has threats that are beyond control (of the management actions
undertaken on an offset site) • the species’ or its habitat’s needs/response to management are poorly known.
State significant biodiversity link: a biodiversity corridor that is important at a state scale and is identified in a plan approved by the Chief Executive of OEH. State Significant Development: has the same meaning as in section 4 of the EP&A Act. State Significant Infrastructure: has the same meaning as in section 4 of the EP&A Act. Stream order: has the same meaning as in Appendix 2. Study area: the area directly affected by the development and any additional areas likely to be affected by the development, either directly or indirectly. The study area should extend as far as necessary to take all potential impacts into account, for the purpose of an assessment under Subsections 9.2.4 and 9.2.5. Supplementary measure: another measure undertaken as part of the Biodiversity Offset Strategy that is likely to lead to improvements in biodiversity or other environmental values that are not on an offset site. TG value: the ability of a species to respond to improvement in site value or other habitat improvement at an offset site with management actions. TG is based on an assessment of effectiveness of management actions, life history characteristics, naturally very rare species, and very poorly known species. Threatened population: has the same meaning as in section 4(1) of the TSC Act.

60 Framework for Biodiversity Assessment
Threatened species: critically endangered, endangered or vulnerable threatened species and populations as defined in section 4(1) of the TSC Act, or any additional threatened species listed under Part 13 of the EPBC Act as critically endangered, endangered or vulnerable. Threatened Species Profile Database: is part the BIONET database, is maintained by OEH and can be accessed from the BIONET website at www.bionet.nsw.gov.au/. Threatened species survey: a targeted survey for threatened species undertaken in accordance with Section 6.6. Threatened species survey guidelines: survey methods or guidelines provided by OEH or published by OEH at www.environment.nsw.gov.au/threatenedspecies/surveyassessmentgdlns.htm. Total length of fallen logs: the total length of logs present in a vegetation zone that are at least 10 cm in diameter and at least 0.5 m long. Transect: a line or narrow belt along which environmental data is collected. TSC Act: the NSW Threatened Species Conservation Act 1995. Unavoidable impact: an impact on biodiversity values that cannot be avoided and/or minimised. Vegetation Benchmarks Database: a database of benchmarks for vegetation classes and some PCTs. The Vegetation Benchmarks Database is maintained by OEH and is part of the VIS Classification Database. It is available at www.environment.nsw.gov.au/research/Visclassification.htm. Vegetation class: a level of classification of vegetation communities defined in Keith (2004)3. There are 99 vegetation classes in NSW. Vegetation formation: a broad level of vegetation classification as defined in Keith (2004)3. There are 12 vegetation formations in NSW. Vegetation in low condition:
a) woody native vegetation with native over-storey percent foliage cover less than 25% of the lower value of the over-storey percent foliage cover benchmark for that vegetation type, and where either:
– less than 50% of ground cover vegetation is indigenous species, or – greater than 90% of ground cover vegetation is cleared
OR b) native grassland, wetland or herbfield where either:
– less than 50% of ground cover vegetation is indigenous species, or – more than 90% of ground cover vegetation is cleared.
Native vegetation that is not in low condition is in moderate to good condition. Vegetation in moderate to good condition: native vegetation that is not in low condition. Vegetation zone: a relatively homogenous area of native vegetation on a development site that is the same PCT and broad condition state. VIS Classification Database (NSW Vegetation Information System Classification Database): the master vegetation community-level classification for use in vegetation mapping programs and regulatory biodiversity impact assessment frameworks in NSW. The VIS Classification Database is maintained by OEH and available at www.environment.nsw.gov.au/research/Visclassification.htm. 3 Keith, D 2004, Ocean shores to desert dunes: the native vegetation of New South Wales and the ACT, Department of Environment and Conservation NSW, Hurstville.

Definitions 61
Viability: the capacity of a species to successfully complete each stage of its life cycle under normal conditions so as to retain long-term population densities. Wetland: an area of land that is wet by surface water or ground water, or both, for long enough periods that the plants and animals in it are adapted to, and depend on, moist conditions for at least part of their life cycle. Wetlands may exhibit wet and dry phases and may be wet permanently, cyclically or intermittently with fresh, brackish or saline water. Woody native vegetation: native vegetation that contains an over-storey and/or mid-storey that predominantly consists of trees and/or shrubs.

62 Framework for Biodiversity Assessment
Appendix 1: Mathematical equations used in the FBA The mathematical equations set out in this appendix correspond with the summarised versions set out in the relevant sections of the FBA. A decision support system (the Credit Calculator) allows accredited assessors to efficiently undertake the calculations, based on the site survey data collected during Stage 1 – Biodiversity assessment. The calculations used in the Credit Calculator are based on the mathematical equations as set out below.
Equation 1: Determine the current site value score for a vegetation zone
( ) ( ) ( ) ( ) ( )( )c
aaaaaaaawa SV
kcjhibga
j
avvv
c
1005 ×
++++
=∑=
where SVC is the current site value score of the vegetation zone av is the attribute score for the vth site attribute (a–j) as defined in Table 2 ak is equal to (ad + ae + af)/3, the average score for attributes d, e and f wv is the weighting for the vth site attribute (a–j) as defined in Table 2 c is the maximum score that can be obtained given the attributes a–j that occur in
the PCT when in benchmark condition (the maximum score varies depending on which attributes occur in the vegetation zone under assessment).
Summary of Equation 1: Determine the current site value score for a vegetation zone
Element Explanation of elements in Equation 1
cSV This represents the current condition of the vegetation based on a score out of 100 (biometric score). The biometric score is based on transect and plot data that is collected on site for each vegetation zone. The biometric score considers ecosystem structure, composition and function.
( )∑=
j
avvvwa
av is the site attribute score for each of the 10 site attributes. The site attribute score is based on the condition of the attribute against the benchmark (0, 1, 2 or 3), wv is the weighting given to that site attribute (shown in Table 2) based on its ecological importance. Each site attribute score is multiplied by its weighting and summed together. This part of the site value calculation considers ecosystem structure, composition and function.
(aaag) aa is the attribute score for Native plant species richness. It is multiplied by the attribute score for Exotic plant cover (represented by ag). The total is then multiplied by 5. This part of the calculation considers ecosystem composition and function.

Appendix 1: Mathematical equations used in the FBA 63
Element Explanation of elements in Equation 1
(abai) ab is the attribute score for Native over-storey cover. It is multiplied by the attribute score for Proportion of over-storey cover species occurring as regeneration (represented by ai). The total is then multiplied by 5. This part of the calculation considers ecosystem composition and function.
(ahaj) ah is the attribute score for Number of trees with hollows. It is multiplied by the attribute score for Total length of fallen logs (represented by aj). The total is then multiplied by 5. This part of the calculation considers ecosystem composition and function.
(acak) ac is the attribute score for Native mid-storey cover. It is multiplied by the average of the attribute scores for Native ground cover grasses, Native ground cover shrubs and Native ground cover other (collectively represented by ak). The total is then multiplied by 5. This part of the calculation considers ecosystem composition.
x 100 The totals for each of the elements are summed together and multiplied by 100. This final total for the calculation above the line is the numerator.
c
c is the maximum score that can be achieved for a particular vegetation zone (i.e. where all site attributes are in benchmark condition). The maximum score for c can vary according to whether a particular attribute occurs in a PCT. The maximum score for c is called the denominator. The total for the numerator is divided by the total for the denominator. This is the current site value score for that vegetation zone.
Equation 2: Determine the future site value score for a vegetation zone
( ) ( ) ( ) ( ) ( )( )c
aaaaaaaawa SV
kcjhibga
j
avvv
c
1005 ×
++++
=∑=
where SVC is the future site value score of the vegetation zone av is the attribute score for the vth site attribute (a–j) as defined in Table 2,
determined in accordance with Section 5.3 ak is equal to (ad + ae + af)/3, the average score for attributes d, e and f wv is the weighting for the vth site attribute (a–j) as defined in Table 2 c is the maximum score that can be obtained given the attributes a–j that occur in
the vegetation zone when in benchmark condition (the maximum score varies depending on which attributes occur in the vegetation zone under assessment).
Summary of Equation 2: Determine the future site value score for a vegetation zone

64 Framework for Biodiversity Assessment
Element Explanation of elements in Equation 2
cSV This represents the future condition of the vegetation based on a score out of 100 (biometric score). At a development site, the future condition of the vegetation accounts for the impact of development on the vegetation.
( )∑=
j
avvvwa
av is site attribute score for each of the 10 site attributes. The site attribute score is based on the future condition of the attribute against the benchmark (0, 1, 2 or 3), wv is the weighting given to that site attribute (shown in Table 2) based on its ecological importance. Each site attribute score is multiplied by its weighting and summed together. This part of the site value calculation considers ecosystem structure, composition and function.
(aaag) aa is the attribute score for future native plant species richness. It is multiplied by the attribute score for Exotic plant cover (represented by ag). The total is then multiplied by 5. This part of the calculation considers ecosystem composition and function.
(abai) ab is the attribute score for future native over-storey cover. It is multiplied by the attribute score for Proportion of over-storey cover species occurring as regeneration (represented by ai). The total is then multiplied by 5. This part of the calculation considers ecosystem composition and function.
(ahaj) ah is the attribute score for future number of tress with hollows. It is multiplied by the attribute score for Total length of fallen logs (represented by aj). The total is then multiplied by 5. This part of the calculation considers ecosystem composition and function.
(acak) ac is the attribute score for future native mid-storey cover. It is multiplied by the average of the attribute scores for Native ground cover grasses, native ground cover shrubs and native ground cover other (collectively represented by ak). The total is then multiplied by 5. This part of the calculation considers ecosystem composition.
x 100 The totals for each of the elements are summed together and multiplied by 100. This final total for the calculation above the line is the numerator.
c
c is the maximum score that can be achieved for a particular vegetation zone (i.e. where all site attributes are in benchmark). The maximum score for c can vary according to whether a particular attribute occurs in a PCT. The maximum score for c is called the denominator. The total for the numerator is divided by the total for the denominator. This is the future site value score for that vegetation zone.
Equation 3: Calculate change in site value score at the development site
∆SLoss = Scurrent – Sfuture
where ∆SLoss is the change (loss) in the site value score of a vegetation zone at the development site
Scurrent is the current site value score, as determined in accordance with Section 5.3.
Sfuture is the future (after clearing or development) site value score, as determined in accordance with Section 10.3.

Appendix 1: Mathematical equations used in the FBA 65
Summary of Equation 3: Calculate change in site value score at the development site
Element Explanation of elements in Equation 3
Scurrent Scurrent is the site value score for the vegetation zone in its current state. It represents the condition of the vegetation in the zone compared to the vegetation in benchmark condition. It is calculated in accordance with Section 5.3 and using Equation 1.
Sfuture Sfuture is the site value score for the vegetation zone after the impact of the clearing or development is taken into account. It is calculated in accordance with Section 10.3 and using Equation 2. Where native vegetation is to be totally cleared, Sfuture may be zero. The Sfuture score can also take into account partial clearing for purposes such as creating an asset protection zone.
∆SLoss ∆SLoss represents the quantified impact of the development on the vegetation condition. It is based on the loss in site value by calculating the difference in the condition of the vegetation in its current state, compared to its future condition state after the impacts of development are taken into account.
Equation 4: Determine the change (loss) in landscape value score for the development site
LVdevelopment site = ( ) ( )tdevelopmenWith
c
avv
Current
d
s -
++ ∑∑
==v
avvv wedws
where: sv is the score for the vth variable (a–c) as defined below
wv is the weighting for the vth variable. Each variable has a weighting of 1
a = score for percent extent native vegetation cover within an outer assessment circle of the site or the buffer area surrounding the development footprint (minimum area >1000 ha) calculated in accordance with Appendix 4 or Appendix 5
b = score for percent native vegetation cover within an inner assessment circle for the site (minimum of 100 ha) calculated in accordance with Appendix 4 (for linear shaped or multiple fragmentation development, this will be zero)
c = area to perimeter ratio of all patch size areas within the buffer area surrounding the development footprint for a development assessed in accordance with Appendix 5
d = connectivity value score for the Major Project determined in accordance with Appendix 4 or Appendix 5
e = total patch size score determined in accordance with Appendix 4 or Appendix 5.

66 Framework for Biodiversity Assessment
Summary of Equation 4: Determine the change (loss) in landscape value score for the development site
Element Explanation of elements in Equation 4
( ) Current
d
++∑
=
edwsav
vv
In this part of the calculation, the scores for each of the four landscape attributes are simply summed together
Sv represents the current extent of native vegetation cover in the landscape surrounding the Major Project. This is determined in accordance with Appendix 4 (for site based development) or Appendix 5 (for linear shaped development or multiple fragmentation impact development).
Wv represents the weighting for each of the landscape value attributes. For development sites, each of the landscape value attributes has a weighting of 1.
d represents the impact of the development on connectivity (the connectivity value score). This score is determined in accordance with Appendix 4 (for site based development) or Appendix 5 (for linear shaped development or multiple fragmentation impact development).
e represents the value of the size of the remnant vegetation which the development is part of (the patch size score) This score was determined in accordance with Appendix 4 (for site based development) or Appendix 5 (for linear shaped development or multiple fragmentation impact development).
( )tdevelopmen With
c
avvvws
∑=
Sv represents the future extent of native vegetation cover in the landscape after the impacts of the development are taken into account (the percent native cover score). This is determined in accordance with Chapter 4, including Appendix 4 (for site based development) or Appendix 5 (for linear shaped development or multiple fragmentation impact development).
Wv represents the weighting for each of the landscape value attributes. For development sites, each of the landscape value attributes has a weighting of 1.
LVdevelopment site LVdevelopment site then represents the impact of the development on the surrounding landscape (the loss in landscape value) from development or clearing.
This value is then used to calculate the number of ecosystem credits for the development site.

Appendix 1: Mathematical equations used in the FBA 67
Equation 5: Determine the number of ecosystem credits required for the impact on vegetation that is an EEC or contains threatened species habitat
n
= Σ [{(∆SLoss × × A) + (LVloss × A)}] × 0.25 i = 1
where
i is the i th vegetation zone impacted by development at the development site
∆SLoss is the change (loss) in the site value score of a vegetation zone at the development site as determined by Equation 3
LVloss is the total landscape value change (loss) score for the development site as determined by Equation 4
1/TG spp1 is the species offset multiplier. The TG value is based on the ability of a species to respond to improvement in site value with management actions at an offset site. A TG value is identified for each species in the Threatened Species Profile Database and has values between 0.1 and 1. Species 1 (spp1) is the species with the highest offset multiplier that is predicted to use habitat in the vegetation zone. For PCTs that are an EEC or a CEEC, the threatened species offset multiplier is 3.
A is the area in hectares of the vegetation zone
Summary of Equation 5: Determine the number of ecosystem credits required for the impact on vegetation that is an EEC or contains threatened species habitat
Element Explanation of elements in the Equation 5
n
= Σ
i = 1
This means that the equation is to apply to each vegetation zone.
Ecosystem credits required at a
development site 1
TG spp1
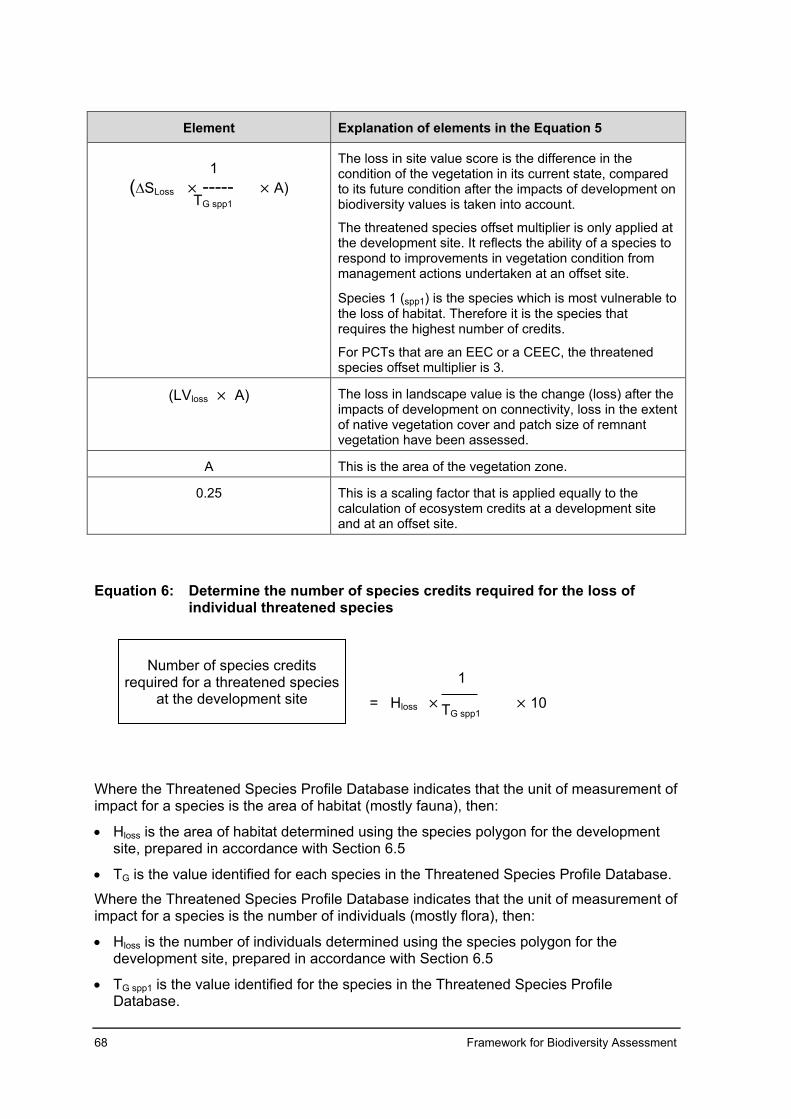
68 Framework for Biodiversity Assessment
Element Explanation of elements in the Equation 5
(∆SLoss × ----- × A)
The loss in site value score is the difference in the condition of the vegetation in its current state, compared to its future condition after the impacts of development on biodiversity values is taken into account.
The threatened species offset multiplier is only applied at the development site. It reflects the ability of a species to respond to improvements in vegetation condition from management actions undertaken at an offset site.
Species 1 (spp1) is the species which is most vulnerable to the loss of habitat. Therefore it is the species that requires the highest number of credits.
For PCTs that are an EEC or a CEEC, the threatened species offset multiplier is 3.
(LVloss × A) The loss in landscape value is the change (loss) after the impacts of development on connectivity, loss in the extent of native vegetation cover and patch size of remnant vegetation have been assessed.
A This is the area of the vegetation zone.
0.25 This is a scaling factor that is applied equally to the calculation of ecosystem credits at a development site and at an offset site.
Equation 6: Determine the number of species credits required for the loss of individual threatened species
Where the Threatened Species Profile Database indicates that the unit of measurement of impact for a species is the area of habitat (mostly fauna), then:
• Hloss is the area of habitat determined using the species polygon for the development site, prepared in accordance with Section 6.5
• TG is the value identified for each species in the Threatened Species Profile Database.
Where the Threatened Species Profile Database indicates that the unit of measurement of impact for a species is the number of individuals (mostly flora), then:
• Hloss is the number of individuals determined using the species polygon for the development site, prepared in accordance with Section 6.5
• TG spp1 is the value identified for the species in the Threatened Species Profile Database.
= Hloss × × 10
Number of species credits
required for a threatened species at the development site
1
TG spp1
1
TG spp1

Appendix 1: Mathematical equations used in the FBA 69
Summary of Equation 6: Determine the number of species credits required for the loss for individual threatened species
Element Explanation of elements in the Equation 6
Hloss This is the area of habitat for the species or the number of individual flora species impacted on by the development.
The threatened species offset multiplier is only applied at the development site. It reflects the ability of a species to respond to improvements in vegetation condition from management actions undertaken at an offset site.
Species 1 (spp1) is the species which is being impacted on by the development.
10 This is a general scaling factor that is applied equally to species credits at a development site and at an offset site.
Equation 7: Ecosystem credits – number of ecosystem credits created for ecological rehabilitation of post mined land
where i is the i th vegetation zone to be managed on land that is subject to the
ecological rehabilitation works
∆Srehab is the future site value score for the PCT that is to be achieved from the ecological rehabilitation works on the post mined land as defined by Equation 1
A is the area of land in hectares that is subject to ecological rehabilitation works for the PCT.
Summary of Equation 7: Ecosystem credits – number of ecosystem credits created for ecological rehabilitation of post mined land
Number of ecosystem credits created on post
mined land
{∆Srehab × A} × 0.25
n
= Σ i = 1
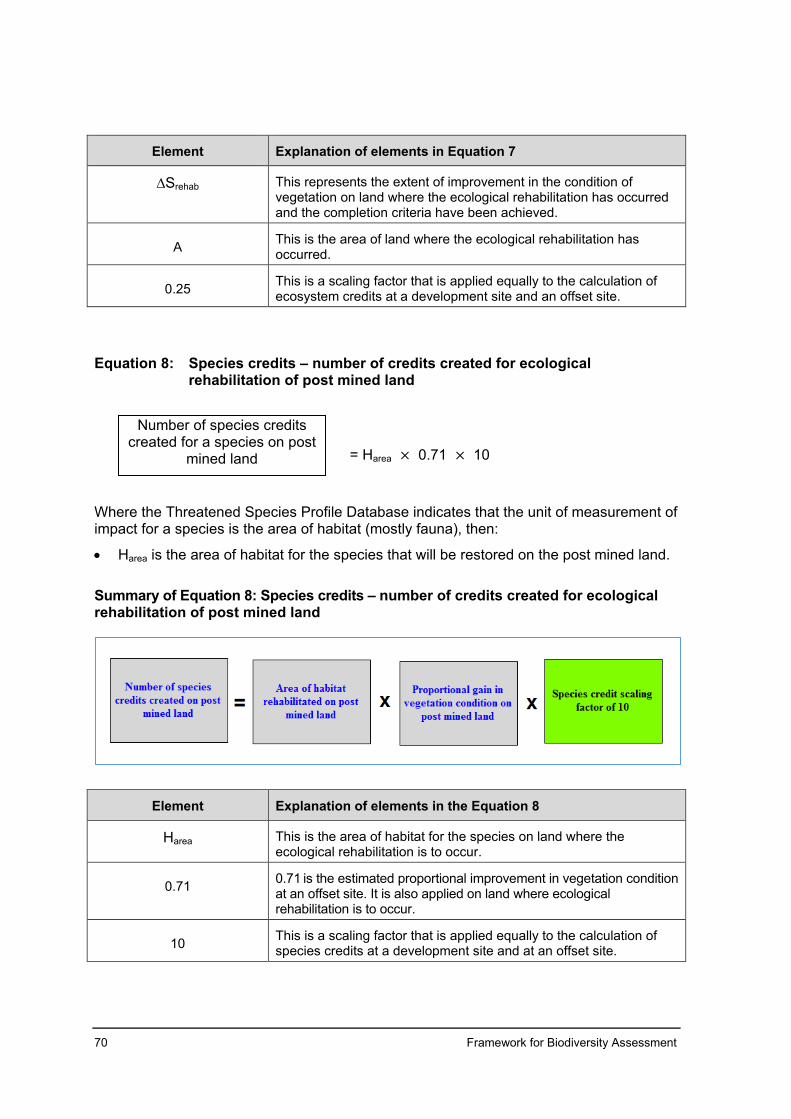
70 Framework for Biodiversity Assessment
Element Explanation of elements in Equation 7
∆Srehab This represents the extent of improvement in the condition of vegetation on land where the ecological rehabilitation has occurred and the completion criteria have been achieved.
A This is the area of land where the ecological rehabilitation has occurred.
0.25 This is a scaling factor that is applied equally to the calculation of ecosystem credits at a development site and an offset site.
Equation 8: Species credits – number of credits created for ecological rehabilitation of post mined land
Where the Threatened Species Profile Database indicates that the unit of measurement of impact for a species is the area of habitat (mostly fauna), then:
• Harea is the area of habitat for the species that will be restored on the post mined land.
Summary of Equation 8: Species credits – number of credits created for ecological rehabilitation of post mined land
Element Explanation of elements in the Equation 8
Harea This is the area of habitat for the species on land where the ecological rehabilitation is to occur.
0.71 0.71 is the estimated proportional improvement in vegetation condition at an offset site. It is also applied on land where ecological rehabilitation is to occur.
10 This is a scaling factor that is applied equally to the calculation of species credits at a development site and at an offset site.
= Harea × 0.71 × 10
Number of species credits created for a species on post
mined land

Appendix 2: Ordering of waterways and riparian buffer distances 71
Appendix 2: Ordering of waterways and riparian buffer distances
The Strahler stream ordering system is a classification system that gives a waterway an ‘order’ according to the number of tributaries associated with it (Strahler 19524). Figure 1 illustrates the Strahler stream ordering process. Numbering begins at the top of a catchment with headwater (‘new’) flow paths being assigned the number one. Where two flow paths of order one join, the section downstream of the junction is referred to as a second order stream. Where two second order streams join, the waterway downstream of the junction is referred to as a third order stream, and so on. Where a lower order stream (e.g. first order) joins a higher order stream (e.g. third order), the area downstream of the junction will retain the higher number (i.e. it will remain a third order stream). The stream ordering system is designed to produce results that are consistent between catchments, but also recognises regional differences.
Figure 1: Strahler stream ordering system
Riparian buffer distances must be measured on both sides of the stream from the top of bank, if this is defined, otherwise from the edge of the stream and only from the centre of the stream if the edge is not defined. Where a stream has more than one bank on either side, the bank closest to the main channel must be used, to protect vegetation on and within the stream banks.
4 Strahler, AN (1952), ‘Hypsometric (area-altitude) analysis of erosional topology’, Geological Society of America Bulletin 63 (11): 1117–1142.

72 Framework for Biodiversity Assessment
The riparian buffer distances for various water bodies are set out in Table 7. Riparian buffer distances do not include the width of the water body.
Table 7: Riparian buffer distances
Water body type Riparian corridor width (each side of waterway)
Unmapped & 1st order streams 10 2nd order stream 20 3rd order stream 30 4th & 5th order streams & above 40 6th order stream & above 50 Local wetland 20 Important wetland 50 Estuarine area 50
Wetland means areas of land that are wet by surface water or ground water, or both, for long enough periods that the plants and animals in them are adapted to, and depend on, moist conditions for at least part of their life cycle. Wetlands may exhibit wet and dry phases and may be wet permanently, cyclically or intermittently with fresh, brackish or saline water. Examples include lakes, lagoons, swamps, bogs, billabongs, marshes, floodplain areas that pond with water, saltmarshes and mangrove forests. To determine the location and extent of a wetland in its dry phase, vegetation type, soil properties (including egg and seed banks) and records of flooding can be used.
Important wetland means a wetland that is listed in the Directory of Important Wetlands of Australia (DIWA), or is a wetland mapped under State Environmental Planning Policy 14 (SEPP 14 Coastal wetlands). Local wetland means a wetland that is not identified as an important wetland. An estuary is a semi-enclosed body of water having an open or intermittently open connection with the ocean, in which water levels do not vary with the ocean tide (when closed to the sea) or vary in a predictable, periodic way in response to the ocean tide at the entrance (when open to the sea).
The DIWA wetlands are available from www.environment.gov.au/metadataexplorer/download_test_form.jsp?dataTitle=Directory%20of%20Important%20Wetlands%20in%20Australia%20(DIWA)%20Spatial%20Database&[email protected]&dataFormat=Shapefile SEPP 14 Coastal wetland data is available from www.planning.nsw.gov.au/spatial-data-download

Appendix 3: Guidelines for the collection of benchmark data from local reference sites or published sources 73
Appendix 3: Guidelines for the collection of benchmark data from local reference sites or published sources
Benchmark data from local reference sites may be used where that data more accurately reflects the local environmental conditions and condition attributes for a PCT. Where local benchmark data is developed, it must be derived from measurements taken on reference sites that measure the same PCT in a relatively unmodified condition or from published sources. The consent authority must approve the use of benchmark data from local reference sites or published sources.
Locating reference sites Reference sites are sites with relatively little evidence of modification by humans since European (post-1750) settlement, as indicated by minimal timber harvesting (few stumps, coppicing, cut logs), minimal firewood collection, minimal exotic weed cover, minimal grazing and trampling by introduced or overabundant native herbivores, minimal soil disturbance, dieback not in excess of normal senescence, no evidence of very recent major perturbation such as fire or flood, not subject to high frequency burning, and evidence of recruitment of native plant species. It may be difficult to find totally unmodified sites, particularly in highly cleared regions. Vegetation in relatively unmodified condition can be found in some travelling stock routes and reserves, national parks and nature reserves, state forests (especially flora reserves), cemeteries, roadsides and commons. Reference sites can occur in small remnants, such as narrow roadsides and cemeteries.
Number of reference plots To obtain a reasonable composite picture that encompasses the variation in condition variables, a minimum of three reference plots/transects for each variable should be measured for each PCT (or vegetation class), with more plots/transects being desirable.
Published sources Benchmarks may also be obtained from published sources.

74 Framework for Biodiversity Assessment
Appendix 4: Assessing landscape value for site-based developments
1. Assessing percent current extent of native vegetation cover To assess the percent current extent of native vegetation cover for site based developments, the assessor must do each of the following steps.
Step 1 Identify an inner and an outer assessment circle The inner assessment circle : outer assessment circle ratio must be 1:10. The assessor must choose the inner and outer assessment circle for a proposed development from the combinations in Table 8.
Table 8: Allowable combinations of inner and outer assessment circles
Inner assessment circle (ha) Outer assessment circle (ha) 100 1,000
200 2,000
300 3,000
400 4,000
500 5,000
1,000 10,000
1,500 15,000
The inner and outer assessment circles must be centred on the area of native vegetation that is most impacted by the Major Project.
Step 2 Calculate the percent native vegetation cover in the inner and outer assessment circles Estimate the native vegetation cover taking into account the extent and condition of over-storey cover compared to benchmark condition currently in:
a) the inner assessment circle, and
b) the outer assessment circle in increments of 5% using a Geographic Information System (GIS). The assessor must convert these calculations into a percent current extent native vegetation cover in the inner and outer assessment circles.
Step 3 Determine the scores for the percent current extent of native vegetation cover in the inner and outer assessment circles Use the percent current extent of native vegetation cover and Table 9 to determine the scores for the percent current extent of native vegetation cover in the inner and outer assessment circles. The assessor will later use these figures for Equation 4 set out in Appendix 1.

Appendix 4: Assessing landscape value for site-based developments 75
2. Assessing percent future extent of native vegetation cover To assess the percent future extent of native vegetation cover for site based developments, the assessor must do each of the following steps.
Step 1 Calculate the percent future extent of native vegetation cover in the inner and outer assessment circles Taking into account the impact of the Major Project and using the same assessment circles as identified in Step 1 of this appendix, estimate the area of future native vegetation cover, taking into account the extent and condition of over-storey cover compared to benchmark condition in:
a) the inner assessment circle, and b) the outer assessment circle
in increments of 5% using a GIS. Convert these calculations into a percent future extent of native vegetation cover in the inner and outer assessment circles.
Step 2 Determine the scores for the percent future extent of native vegetation cover in the inner and outer assessment circles Use the percent future extent of native vegetation cover and Table 9 to determine the scores for the percent future extent of native vegetation cover in the inner and outer assessment circles. The assessor will later use these figures for Equation 4 set out in Appendix 1.
Table 9: Determining percent native vegetation cover in the landscape
Percent native vegetation cover in the landscape – inner and
outer assessment circle (%)
Score for percent native vegetation cover in the
landscape – inner assessment circle
Score for percent native vegetation cover in the
landscape – outer assessment circle
0 0 0
≤5 0.75 1.25
6–10 1.5 2.5
11–15 2.25 3.75
16–20 3 5
21–25 3.75 6.25
26–30 4.5 7.5
31–35 5.1 8.45
36–40 5.7 9.4
41–45 6.3 10.35
46–50 6.9 11.3
51–55 7.3 11.95
56–60 7.7 12.6
61–65 8.1 13.25
66–70 8.5 13.9

76 Framework for Biodiversity Assessment
Table 9 continued.
Percent native vegetation cover in the landscape – inner and
outer assessment circle (%)
Score for percent native vegetation cover in the
landscape – inner assessment circle
Score for percent native vegetation cover in the
landscape – outer assessment circle
71–75 8.75 14.25
76–80 9 14.6
81–85 9.25 14.95
86–90 9.5 15.3
91–95 9.75 15.65
96–100 10 16
3. Assessing the connectivity value The assessor must assess the connectivity value for a Major Project that is a site based development using the following steps.
Step 1: Identify the connecting links For the purposes of this appendix, native vegetation on the development site is part of a connecting link when it is linked to adjoining vegetation and the native vegetation on the development site:
• is in moderate to good condition, and
• has a patch size >1 ha, and
• is separated by a distance of <100 m (or <30 m for non-woody ecosystems), and
• is not separated by a large water body, dual carriageway, wider highway or similar hostile link.
A site may have none, one, or more than one connecting link. Taking into account any mitigation or minimisation measures, the assessor must identify the connecting links that the development will impact on. Where the development impacts on more than one connecting link, the assessor must determine the connectivity value score for each connecting link.
Step 2: Determine whether the Major Project impacts on a state or regional biodiversity link State or regional biodiversity links are defined in the column titled Defining criteria in Table 10 below. A Major Project impacts on a state or regional biodiversity link where any part of the biodiversity link is:
a) on the development site, and
b) the vegetation zone/s on that part of the development site has a site value score ≥17.
If the Major Project impacts on a state or regional biodiversity link, then:

Appendix 4: Assessing landscape value for site-based developments 77
a) the final connectivity value score for the Major Project is the corresponding score set out in Table 10 for the relevant link. Where there is more than one state or regional biodiversity link, the higher score is the final connectivity value score
b) the assessor will later use the connectivity value score in Equation 4 to determine the landscape value score for the Major Project
c) no further assessment of connectivity value is required for the Major Project.
Table 10: Connectivity value classes for site based development
Connectivity value class Defining criteria Score
State significant biodiversity link
An area identified as being part of a state significant biodiversity link in a plan approved by the Chief Executive, OEH OR A riparian buffer 50 m either side of a 6th order stream or greater OR A riparian buffer 50 m around an important wetland or an estuarine area
12
Regionally significant biodiversity link
An area identified as being part of a regionally significant biodiversity link and in a plan approved by the Chief Executive, OEH OR A riparian buffer 20 m either side of a 4th or 5th order stream
9
Nil None of the above – proceed to Step 3
Note: Refer to the Definitions section for definitions of stream order and important wetland. The boundary around a SEPP 14 Coastal wetland may be adjusted according to the actual location of the wetland on the ground.
If the Major Project does not impact on a state or regional biodiversity link, a site based assessment of connectivity is required using Steps 3–9 below.
Step 3: Determine the current linkage width class at a site Determine the current linkage width class of each connecting link identified in Step 1 in this section by measuring the width of each connecting link at the narrowest area of the connecting link and looking up the corresponding linkage width class in Table 11. This area may be located on or off the site.
Table 11: Linkage width classes for site based developments
Linkage width (metres) 0 – 5 >5 – 30 >30 – 100 >100 – 500 >500
Linkage width class
Very narrow Narrow Moderate Wide Very wide
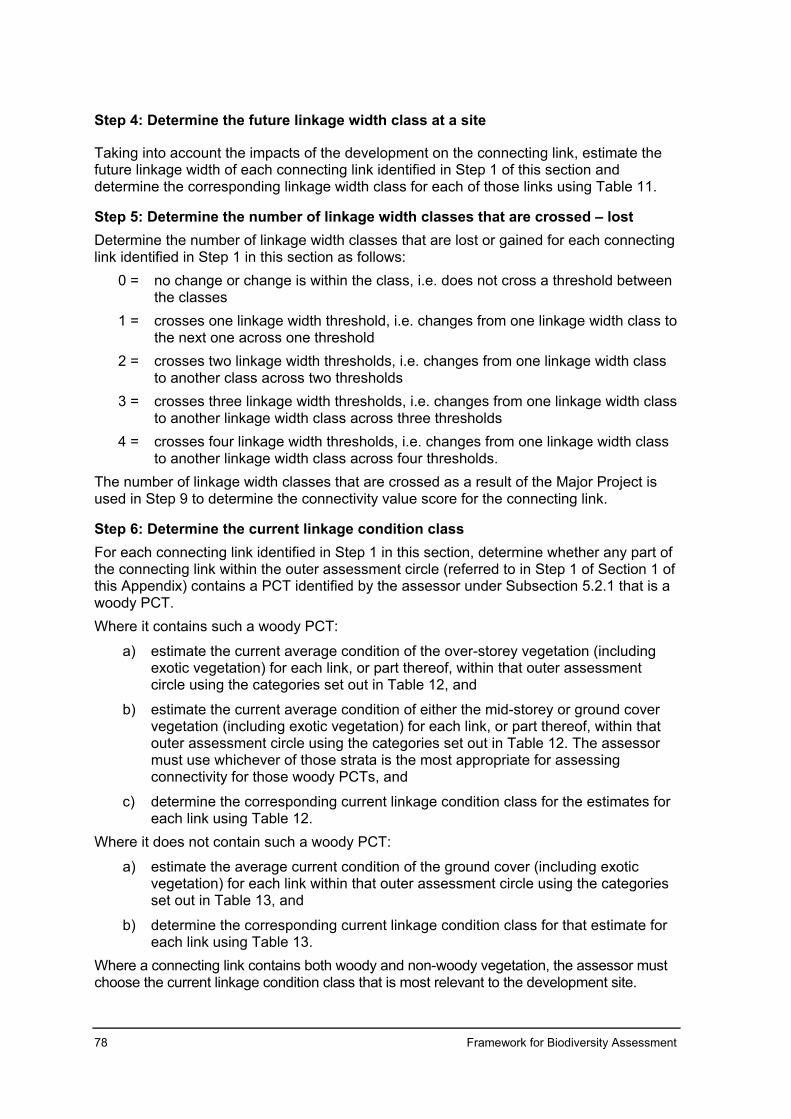
78 Framework for Biodiversity Assessment
Step 4: Determine the future linkage width class at a site
Taking into account the impacts of the development on the connecting link, estimate the future linkage width of each connecting link identified in Step 1 of this section and determine the corresponding linkage width class for each of those links using Table 11.
Step 5: Determine the number of linkage width classes that are crossed – lost Determine the number of linkage width classes that are lost or gained for each connecting link identified in Step 1 in this section as follows:
0 = no change or change is within the class, i.e. does not cross a threshold between the classes
1 = crosses one linkage width threshold, i.e. changes from one linkage width class to the next one across one threshold
2 = crosses two linkage width thresholds, i.e. changes from one linkage width class to another class across two thresholds
3 = crosses three linkage width thresholds, i.e. changes from one linkage width class to another linkage width class across three thresholds
4 = crosses four linkage width thresholds, i.e. changes from one linkage width class to another linkage width class across four thresholds.
The number of linkage width classes that are crossed as a result of the Major Project is used in Step 9 to determine the connectivity value score for the connecting link.
Step 6: Determine the current linkage condition class For each connecting link identified in Step 1 in this section, determine whether any part of the connecting link within the outer assessment circle (referred to in Step 1 of Section 1 of this Appendix) contains a PCT identified by the assessor under Subsection 5.2.1 that is a woody PCT. Where it contains such a woody PCT:
a) estimate the current average condition of the over-storey vegetation (including exotic vegetation) for each link, or part thereof, within that outer assessment circle using the categories set out in Table 12, and
b) estimate the current average condition of either the mid-storey or ground cover vegetation (including exotic vegetation) for each link, or part thereof, within that outer assessment circle using the categories set out in Table 12. The assessor must use whichever of those strata is the most appropriate for assessing connectivity for those woody PCTs, and
c) determine the corresponding current linkage condition class for the estimates for each link using Table 12.
Where it does not contain such a woody PCT:
a) estimate the average current condition of the ground cover (including exotic vegetation) for each link within that outer assessment circle using the categories set out in Table 13, and
b) determine the corresponding current linkage condition class for that estimate for each link using Table 13.
Where a connecting link contains both woody and non-woody vegetation, the assessor must choose the current linkage condition class that is most relevant to the development site.

Appendix 4: Assessing landscape value for site-based developments 79
Table 12: Linkage condition classes (woody vegetation) Over-storey condition
No native over-storey or exotic vegetation with similar structure to the proposal
% foliage cover <25% of lower benchmark or exotic vegetation with similar structure to the proposal
% foliage cover ≥25% of lower benchmark to lower benchmark
% foliage cover within benchmark
Mid-storey or ground cover condition
No mid-storey or ground cover or exotic vegetation with similar structure to the proposal
0 0.5 1 1.5
Linkage condition class
% foliage cover of mid-storey or ground cover <50% lower end benchmark or exotic vegetation with similar structure to the proposal
0.5 1 1.5 2
% foliage cover of mid-storey or ground cover ≥50% of lower benchmark
1 1.5 2 2.5
% foliage cover of mid-storey or ground cover within benchmark
1.5 2 2.5 3
Linkage condition class
Table 13: Linkage condition classes (non-woody vegetation)
Linkage condition
class Vegetation condition
0 Meets none of the definitions set out below
1 % foliage cover <50% of lower benchmark in native grassland, herbfield or wetland (herbaceous vegetation), or exotic vegetation with similar structure to the proposal
2 % foliage cover ≥50% of lower benchmark to lower benchmark in native grassland, herbfield or wetland (herbaceous vegetation)
3 % foliage cover is within benchmark in native grassland, herbfield or wetland (herbaceous vegetation)

80 Framework for Biodiversity Assessment
Step 7: Determine the future linkage condition class For each connecting link identified in Step 1 in this section, determine whether any part of the connecting link within the outer assessment circle (referred to in Section 1 in this appendix) contains a PCT identified by the assessor under Subsection 5.2.1 that is a woody PCT. Where it contains such a woody PCT:
a) take into account the impacts of the development to estimate the future average condition of the over-storey vegetation (including exotic vegetation) for each link, or part thereof, within that outer assessment circle using the categories set out in Table 12, and
b) take into account the impacts of the development to estimate the future average condition of either the mid-storey or ground cover vegetation (including exotic vegetation) for each link, or part thereof, within that outer assessment circle using the categories set out in Table 12. The assessor must use whichever of those strata is the most appropriate for assessing connectivity for those woody PCTs, and
c) determine the corresponding future linkage condition class for those estimates for each connecting link using Table 12.
Where it does not contain such a woody PCT:
a) take into account the impacts of the Major Project to estimate the average future condition of the ground cover (including exotic vegetation) for each link within that outer assessment circle using the categories set out in Table 13, and
b) determine the corresponding future linkage condition class for that estimate for each connecting link using Table 13.
Where a connecting link contains both woody and non-woody vegetation, the assessor must choose the future linkage condition class that is most relevant to assessing the impact on connectivity at the development site.
Step 8: Determine the number of linkage condition classes that are crossed – lost Determine the number of linkage condition class thresholds that are crossed for each connecting link identified in Step 1 of this section as follows:
0 = no change or change is within the same linkage condition class 1 = crosses one linkage condition threshold, i.e. changes from one linkage condition
class to the next one across one threshold 2 = crosses two linkage condition thresholds, i.e. changes from one linkage condition
class to another class across two thresholds 3 = crosses three linkage condition thresholds, i.e. changes from one linkage
condition class to another class across three thresholds. The number of linkage condition thresholds can include half points where the connectivity condition class crosses to another threshold for only one stratum, as can be seen in Table 13.
Step 9: Determine the connectivity value score Determine the corresponding final connectivity value score in Table 14 for each connecting link using:

Appendix 4: Assessing landscape value for site-based developments 81
a) the number of linkage condition width class thresholds crossed for that connecting link (as determined in Step 5 of this section), and
b) number of linkage condition class thresholds crossed for that connecting link (as determined in Step 8 of this section).
Where the assessor identifies more than one connecting link in Step 1 of this section, the final connectivity value score for the Major Project is the highest connectivity value score determined under this section. The assessor will later use these figures for Equation 4 set out in Appendix 1.
Table 14: Scores for loss of linkage condition/width, based on number of thresholds crossed
Number of linkage width class thresholds crossed
0 1 2 3 or 4
Num
ber o
f lin
kage
con
ditio
n cl
ass
thre
shol
ds c
ross
ed
0 0 2 4 6
0.5 1 3 5 7
1 2 4 6 8
1.5 3 5 7 9
2 4 6 8 10
2.5 5 7 9 11
3 6 8 10 12
4. Assessing the patch size The assessor must:
a) determine the percent native vegetation cleared in the Mitchell landscape in which most of the development occurs, using the categories in Table 15
b) determine the patch size class using the categories in Table 15, and
c) using those calculations, determine the corresponding patch size score using Table 15.
The assessor will later use this score for Equation 4 in Appendix 1.

82 Framework for Biodiversity Assessment
Table 15: Criteria for assessing patch size
Patch size class
Percent native vegetation cleared in the Mitchell landscape in which most of the Major Project occurs
Patch size
score <30% 30–70% >70–90% >90%
Extra large >1000 ha >200 ha >100 ha >50 ha 12
Very large >500 – 1000 ha >100 – 200 ha >50 – 100 ha >20 – 50 ha 9
Large >200 – 500 ha >50 – 100 ha >20 – 50 ha >10 – 20 ha 6
Medium >100 – 200 ha >20 – 50 ha >10 – 20 ha >1 – 10 ha 3
Small ≤100 ha ≤20 ha ≤10 ha ≤1 ha 1
nil 0 0 0 0 0

Appendix 5: Assessing landscape value for linear shaped developments, or multiple fragmentation impacts 83
Appendix 5: Assessing landscape value for linear shaped developments, or multiple fragmentation impacts
1. Assessing percent current extent of native vegetation cover To determine the percent current extent of native vegetation cover for linear shaped development, or development that has multiple fragmentation impacts, the assessor must do each of the following steps.
Step 1 Identify the buffer area surrounding the development footprint Using a GIS, establish a 550 m buffer along each side of the centre line of the linear shaped development footprint, or 550 m from the boundary of the development footprint. The buffer should extend 550 m beyond the centre line of a linear shaped development, or 550 m from the outer edge of development that has multiple fragmentation impacts.
Step 2 Calculate the area of the buffer Calculate the land area within the buffer.
Step 3 Calculate the percent current extent of native vegetation cover Using a GIS, calculate the area of native vegetation cover that is on land within the buffer, taking into account the extent and condition of over-storey cover compared to benchmark condition.
Convert these calculations into a percent current extent of native vegetation cover.
Step 4 Determine the scores for the percent current extent of native vegetation cover Use the percent current extent of native vegetation cover and Table 16 to determine the score for the percent current extent of native vegetation cover.
The assessor will later use these figures for Equation 4 in Appendix 1.
2. Assessing percent future extent of native vegetation cover To determine the percent future extent of native vegetation cover for linear shaped development, the assessor must do each of the following steps.
Step 1 Calculate the percent future extent of native vegetation cover Taking into account the impact of the Major Project, use a GIS to estimate the area of future native vegetation cover in the development footprint buffer, taking into account the extent and condition of over-storey cover compared to benchmark condition.
Using that calculation and the area of the development footprint buffer calculated under Step 2 of this appendix, calculate the percent future extent of native vegetation cover.
Step 2 Determine the score for the percent future extent of native vegetation cover Use the percent future extent of nature vegetation cover and Table 16 to determine the corresponding score for the percent future extent of native vegetation cover.
The assessor will later use these figures to determine the change in landscape value score for the project using Equation 4 set out in Appendix 1.

84 Framework for Biodiversity Assessment
Table 16: Determining percent native vegetation cover in the landscape (550 m buffer from the centre point of the development)
Percent native vegetation cover in the landscape – linear development buffer
area (%)
Score for percent native vegetation cover in the landscape – linear
development buffer area
0 0
<5 1.25
6–10 1.25
11–15 2.5
16–20 3.75
21–25 5
26–30 6.25
31–35 7.5
36–40 8.5
41–45 9.5
46–50 10.5
51–55 11
56–60 11.5
61–65 12
66–70 12.5
71–75 13
76–80 13.4
81–85 13.8
86–90 14.2
91–95 14.6
96–100 15
Example Area of
development footprint buffer
(ha) (Section 1, Step 2)
Area of native vegetation cover
(pre development)
(ha) (Section 1, Step 3)
Percent of native vegetation cover
(pre development)
(Section 1, Step 3)
Percent of native vegetation cover
(post development)
(Section 2, Step 1)
Score for percent native vegetation
cover in the development
footprint buffer area
1200 800 66% cover
(score 12.5)
50% cover
(score 10.5) 2.0

Appendix 5: Assessing landscape value for linear shaped developments, or multiple fragmentation impacts 85
3. Assessing the connectivity value The assessor must assess the connectivity value score for a Major Project that is a linear shaped development or a multiple fragmentation development using the following steps.
Step 1: Identify the connecting links A connecting link is when native vegetation on the site adjoins native vegetation surrounding the site and the native vegetation:
• is in moderate to good condition, and
• has an patch size >1 ha, and
• is separated by a distance of <100 m (or <30 m for non-woody ecosystems), and
• is not separated by a large water body, dual carriageway, wider highway or similar hostile link.
A site may have none, one, or more than one connecting link. Taking into account any mitigation or minimisation measures, the assessor must determine whether the Major Project will impact on any connecting link that falls within the categories of connecting links listed and defined in Table 17.
Step 2: Determine the connectivity value score If the assessor determines that the development will impact on such a connecting link, the connectivity value score is the highest corresponding score listed in Table 17 for any such connecting links. If the assessor determines that the development will not impact on such a connecting link, the connectivity value score is zero.
Table 17: Connectivity value scores for linear shaped developments or development that has multiple fragmentation impacts
Categories of connecting links
Definitions of connecting link Score
State significant biodiversity link
An area identified by the assessor as being part of a state significant biodiversity link and in a plan approved by the Chief Executive, OEH OR A riparian buffer 50 m either side of a 6th order stream or higher OR A riparian buffer 50 m around an important wetland or an estuarine area
12.5
Regionally significant biodiversity link
An area identified by the assessor as being part of a regionally significant biodiversity link and in a plan approved by the Chief Executive, OEH OR A riparian buffer 20 m either side of a 4th or 5th order stream Or A riparian buffer 30 m around a regionally significant wetland
10

86 Framework for Biodiversity Assessment
Table 17 continued.
Categories of connecting links
Definitions of connecting link Score
Very large area biodiversity link
Links areas of native vegetation in moderate to good condition that are >5000 ha in total AND Width of vegetation in moderate to good condition that is connecting the area is >500 m
7.5
Large area biodiversity link
Links areas of native vegetation in moderate to good condition that are ≥1000 ha and ≤5000 ha in total, or areas >5000 ha in total AND Width of vegetation in moderate to good condition that is connecting the area is >100 m and <500 m
5
Local area biodiversity link
Links areas of native vegetation in moderate to good condition that are ≥250 ha and <1000 ha in total, or areas greater than 1000 ha in total AND Width of vegetation in moderate to good condition that is connecting the area is >30 m and <100 m
2.5
Note: Refer to the Definitions section for definitions of stream order and important wetlands. The boundary around a SEPP 14 Coastal wetland may be adjusted according to the actual location of the wetland on the ground.
4. Assessing the patch size For a development that is linear shaped or a multiple fragmentation development, the assessor must assess the patch size for each Mitchell landscape in which the Major Project occurs.
The assessor must:
Step 1 – determine the percent native vegetation cleared in each Mitchell landscape in which the Major Project occurs using the categories in Table 18
Step 2 – determine the patch size class using the categories in Table 18
Table 18: Criteria for assessing patch size
Patch size class
Percent native vegetation cleared in each Mitchell landscape in which the Major Project occurs
Patch size
(score) <30% 30–70% >70–90% >90%
Extra large >1000 ha >200 ha >100 ha >50 ha 12.5
Very large >500 – 1000 ha >100 – 200 ha >50 – 100 ha >20 – 50 ha 10
Large >200 – 500 ha >50 – 100 ha >20 – 50 ha >10 – 20 ha 7.5
Medium >100 – 200 ha >20 – 50 ha >10 – 20 ha >1 – 10 ha 5
Small ≤100 ha ≤20 ha ≤10 ha ≤1 ha 2.5
nil 0 0 0 0 0

Appendix 5: Assessing landscape value for linear shaped developments, or multiple fragmentation impacts 87
Step 3 – using those calculations, determine the corresponding patch size score for each Mitchell landscape / patch size class, and
Step 4 – determine the final patch size score by averaging those scores.
The assessor will later use this score for Equation 4 in Appendix 1.
5. Assessing the change in area to perimeter ratio For a Major Project that is a linear shaped development or multiple fragmentation development, the assessor must assess the change in area to perimeter ratio of patch size areas that are impacted on by the Major Project.
The assessor must:
Step 1 – use a GIS to calculate the area (m2) and perimeter (m) of each separate patch size impacted on by the development within the buffer area surrounding the development footprint. Only the patch size and its perimeter that is within the buffer area surrounding the development footprint is to be calculated
Step 2 – calculate the total area (m2) and total perimeter length (m) of all patch size areas that are impacted on by the development
Step 3 – determine the current area to perimeter ratio by dividing the total of all patch size areas (m2) by the total perimeter length (m) of all patch size areas
Step 4 – taking into account the impact of the Major Project, use a GIS to estimate the future area and future perimeter (m) for each patch size that is impacted on by the development and identified in Step 1. The future perimeter must include the perimeter of all new and existing edges created by the impacts of development within or through the patch size identified in Step 1, regardless of the distance to other vegetation in moderation to good condition.
Step 5 – determine the future area to perimeter ratio by dividing the future total of all patch size areas (m2) by the future total perimeter length (m) of new edge for all patch size areas.
Step 6 – determine the proportional change in area to perimeter ratio by dividing the current area to perimeter ratio (from Step 3) by the future area to perimeter ratio (in Step 5)
Step 7 – determine the score for the change in area to perimeter ratio using the categories in Table 19 (overleaf).
The assessor may use a representative sample of patch size areas within the buffer area surrounding the development footprint to determine the proportional change in area to permitter ratio.

88 Framework for Biodiversity Assessment
Table 19: Scores for proportional change in area to perimeter ratio
Proportional change in area to perimeter ratio (%) Score for proportional
change in area to perimeter ratio
0 0
≤10 1
>10 – 20 2
>20 – 30 3
>30 – 40 4
>40 – 50 5
>50 – 60 6
>60 – 70 7
>70 – 80 8
>80 – 90 9
>90 – 100 10

Appendix 6: Map of IBRA subregions in major catchment areas of NSW 89
Appendix 6: Map of IBRA subregions in major catchment areas of NSW
Figure 2: Map of IBRA subregions in major catchment areas of NSW
IBRA subregions of major catchment areas in NSW
Key to map
Border Rivers/Gwydir major catchment area
1 Beardy River Hills
2 Binghi Plateau
3 Bundarra Downs
4 Castlereagh-Barwon
5 Deepwater Downs
6 Eastern Nandewars
7 Glenn Innes–Guyra Basalts
Major catchment areas

90 Framework for Biodiversity Assessment
8 Inverell Basalts
9 Kaputar
10 Moredun Volcanics
11 Nandewar, Northern Complex
12 Northeast Forest Lands
13 Northern Basalts
14 Northern Outwash
15 Peel
16 Severn River Volcanics
17 Tenterfield Plateau
18 Tingha Plateau
19 Yarrowyck–Kentucky Downs
Central West major catchment area
1 Bathurst
2 Bogan–Macquarie
3 Canbelego Downs
4 Capertee
5 Castlereagh–Barwon
6 Hill End
7 Kerrabee
8 Liverpool Range
9 Lower Slopes
10 Nymagee–Rankins Springs
11 Oberon
12 Orange
13 Pilliga

Appendix 6: Map of IBRA subregions in major catchment areas of NSW 91
14 Pilliga Outwash
15 Talbragar Valley
16 Upper Slopes
17 Wollemi
Hawkesbury/Nepean major catchment area
1 Bathurst
2 Bungonia
3 Burragorang
4 Capertee
5 Crookwell
6 Cumberland
7 Kanangra
8 Monaro
9 Moss Vale
10 Oberon
11 Pittwater
12 Sydney Cataract
13 Wollemi
14 Yengo
Hunter/Central Rivers and Sydney Metro major catchment area
1 Barrington
2 Comboyne Plateau
3 Ellerston
4 Hunter
5 Karuah Manning

92 Framework for Biodiversity Assessment
6 Kerrabee
7 Liverpool Range
8 Macleay Hastings
9 Mummel Escarpment
10 Pilliga
11 Tomalla
12 Upper Hunter
13 Walcha Plateau
14 Wollemi
15 Wyong
16 Yengo
Lachlan major catchment area
1 Barnato Downs
2 Crookwell
3 Darling Depression
4 Kanangra
5 Lachlan
6 Lachlan Plains
7 Lower Slopes
8 Murrumbateman
9 Nymagee–Rankins Springs
10 Oberon
11 Orange
12 South Olary Plain, Murray Basin Sands
13 Upper Slopes

Appendix 6: Map of IBRA subregions in major catchment areas of NSW 93
Lower Murray/ Darling major catchment area
1 Barrier Range
2 Barrier Range Outwash, Fans and Plains
3 Darling Depression
4 Great Darling Anabranch
5 Lachlan
6 Menindee
7 Murray Scroll Belt
9 Pooncarie–Darling
10 Robinvale Plains
11 South Olary Plain, Murray Basin Sands
Murray major catchment area
1 Bondo
2 Lower Slopes
3 Murray Fans
4 Murrumbidgee
5 New South Wales Alps
6 South Olary Plain, Murray Basin Sands
7 Upper Slopes
Murrumbidgee major catchment area
1 Bondo
2 Darling Depression
3 Kybeyan – Gourock
4 Lachlan
5 Lachlan Plains
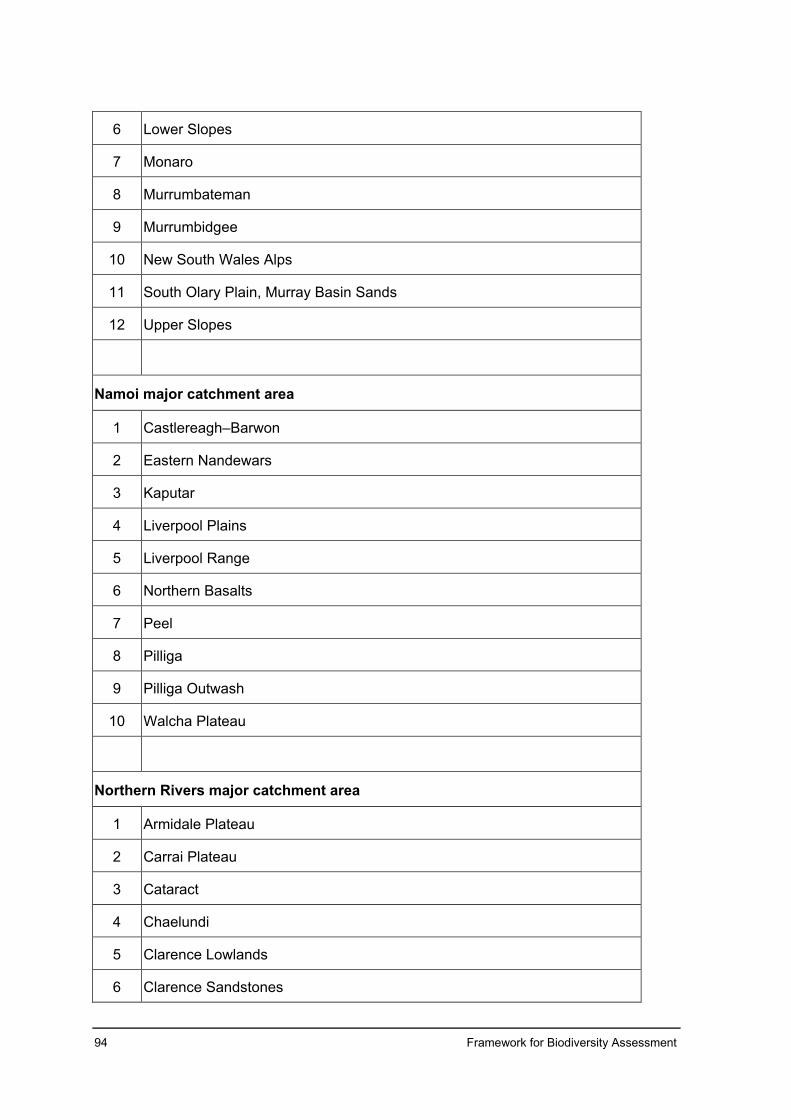
94 Framework for Biodiversity Assessment
6 Lower Slopes
7 Monaro
8 Murrumbateman
9 Murrumbidgee
10 New South Wales Alps
11 South Olary Plain, Murray Basin Sands
12 Upper Slopes
Namoi major catchment area
1 Castlereagh–Barwon
2 Eastern Nandewars
3 Kaputar
4 Liverpool Plains
5 Liverpool Range
6 Northern Basalts
7 Peel
8 Pilliga
9 Pilliga Outwash
10 Walcha Plateau
Northern Rivers major catchment area
1 Armidale Plateau
2 Carrai Plateau
3 Cataract
4 Chaelundi
5 Clarence Lowlands
6 Clarence Sandstones

Appendix 6: Map of IBRA subregions in major catchment areas of NSW 95
7 Coffs Coast & Escarpment
8 Comboyne Plateau
9 Dalmorton
10 Ebor Basalts
11 Glenn Innes–Guyra Basalts
12 Guy Fawkes
13 Macleay Gorges
14 Macleay Hastings
15 Murwillumbah (Qld – Southeast Hills and Ranges)
16 Nightcap
17 Northeast Forest Lands
18 Richmond – Tweed (Qld – Scenic Rim)
19 Rocky River Gorge
20 Round Mountain
21 Stanthorpe Plateau
22 Upper Manning
23 Walcha Plateau
24 Washpool
25 Wongwibinda Plateau
26 Woodenbong
27 Yuraygir
Southern Rivers major catchment area
1 Bateman
2 Bungonia
3 Burragorang
4 East Gippsland Lowlands (EGL)

96 Framework for Biodiversity Assessment
5 Ettrema
6 Illawarra
7 Jervis
8 Kybeyan – Gourock
9 Monaro
10 Moss Vale
11 New South Wales Alps
12 South East Coastal Ranges
13 South East Coastal Plains
Western major catchment area
1 Barnato Downs
2 Barrier Range
3 Barrier Range Outwash, Fans and Plains
4 Bogan–Macquarie
5 Boorindal Plains
6 Bulloo Dunefields
7 Bulloo Overflow
8 Canbelego Downs
9 Castlereagh–Barwon
10 Central Depression
11 Central Downs – Fringing Tablelands and Downs
12 Core Ranges
13 Core Ranges
14 Culgoa–Bokhara
15 Darling Depression
16 Kerribree Basin

Appendix 6: Map of IBRA subregions in major catchment areas of NSW 97
17 Louth Plains
18 Menindee
19 Moonie – Barwon Interfluve, Collarenebri Interfluve
20 Mootwingee Downs
21 Narrandool
22 Nebine Plains, Block Range
23 Nymagee–Rankins Springs
24 Paroo Overflow
25 Paroo Sand Sheets, Cuttaburra–Paroo
26 Paroo–Darling Sands
27 Scopes Range
28 South Olary Plain, Murray Basin Sands
29 Strzelecki Desert, Western Dunefields
30 Urisino Sandplains
31 Warrambool–Moonie
32 Warrego Plains
33 Warrego Sands
34 West Warrego – Tablelands and Downs
35 White Cliffs Plateau
36 Wilcannia Plains

98 Framework for Biodiversity Assessment
Appendix 7: Reporting requirements for the FBA There are three stages to the Framework for Biodiversity Assessment: Stage 1 – Biodiversity assessment Stage 2 – Impact assessment Stage 3 – Biodiversity Offset Strategy Each of these stages requires the documenting of outcomes, as follows.
Stages Report Timing
Stages 1 and 2 Biodiversity Assessment Report (BAR)
• The Stage 1 BAR may be undertaken as part of the Preliminary Environmental Assessment before the project application is lodged.
• If not prepared prior to application, it is recommended that the outcomes of Stage 1 are discussed with OEH prior to commencement of Stage 2, during the preparation of the EIS.
• If not discussed with OEH during preparation of the EIS, the combined outcomes of Stages 1 and 2 form the BAR and are to be submitted as part of the EIS.
Stage 3 Biodiversity Offset Strategy (BOS)
• To be submitted as part of the EIS.
Minimum information content for the two reports is outlined below.

Appendix 7: R
eporting requirements for the FB
A
99
Table 20: Minimum information requirements for the Biodiversity Assessment Report (Stage 1)
Report section Information Maps & data FBA reference
Introduction Introduction to the biodiversity assessment including: • identification of development site footprint, including:
○ operational footprint ○ construction footprint indicating clearing associated with
temporary construction facilities and infrastructure • general description of development site • sources of information used in the assessment, including reports
and spatial data.
• Site Map (as described in Section 3.2)
• Location Map (as described in Section 3.2)
• Digital shape files for all maps and spatial data
Chapter 3 and Section 3.2
Landscape features
Identification of landscape features at the development site, including: • IBRA bioregions and subregions, NSW landscape region and
area (ha) • native vegetation extent in the outer assessment circle or buffer
area • cleared areas • evidence to support differences between mapped vegetation extent
and aerial imagery • rivers and streams classified according to stream order • wetlands within, adjacent to and downstream of development site • landscape value score components, including:
○ identification of method applied (i.e. linear or site-based) ○ percent native vegetation cover in the landscape ○ connectivity value ○ patch size ○ area to perimeter ration
• landscape value score.
• IBRA bioregions and subregions (as described in Paragraphs 4.1.1.3–4)
• NSW landscape regions (as described in Paragraphs 4.1.1.5–6)
• Rivers and streams (as described in Paragraphs 4.1.1.8–10
• Wetlands (as described in Paragraphs 4.1.1.11–13)
• Other landscape features (as required by SEARs)
• Native vegetation extent (as described in Paragraphs 4.1.1.12–15)
• State, regional and local biodiversity links (as described in Paragraphs 4.1.1.16–17)
• Regional vegetation used to calculate patch size
Section 4.1, Appendix 4 and Appendix 5

100 Fram
ework for B
iodiversity Assessm
ent
Report section Information Maps & data FBA reference
Native vegetation
Identify native vegetation extent within the development site, including cleared areas and evidence to support differences between mapped vegetation extent and aerial imagery. Describe PCTs within the development site, including: • vegetation class • vegetation type • area (ha) for each vegetation type • species relied upon for identification of vegetation type and relative
abundance • justification of evidence used to identify a PCT (as outlined in
Paragraph 5.2.1.8) • EEC status (as outlined in Subsection 5.2.1) • estimate of percent cleared value of PCT.
Describe vegetation zones within the development site, including: • condition class and subcategory (where relevant) • area (ha) for each vegetation zone • survey effort as described in Paragraphs 5.2.1.5–7 (number of
plots/transects).
Where use of local data is proposed: • identify relevant vegetation type • identify source of information for local benchmark data • justify use of local data in preference to database values.
• Map of native vegetation extent within the development site (as described in Section 5.1)
• Map of PCTs within the development site
• Map of condition class and subcategory (where relevant)
• Map of plot and transect locations relative to PCTs and condition class
• Map of EECs • Plot and transect field data (MS
Excel format) • Plot and transect field data
sheets • Table of current site value scores
for each vegetation zone within the development site
• Map of vegetation zones with a current site value score of <17.
Chapter 5

Appendix 7: R
eporting requirements for the FB
A
101
Report section Information Maps & data FBA reference
Threatened species
Identify ecosystem credit species associated with PCTs on the development site as outlined in Section 6.3, including: • list of species derived • justification for exclusion of any ecosystem credit species predicted
above.
Identify species credit species on the development site as outlined in Sections 6.5 and 6.6, including: • list of candidate species • justification for inclusions and exclusions based on habitat features • indication of presence based on targeted survey or expert report • details of targeted survey technique, effort, timing and weather • species polygons • species that cannot withstand a further loss.
Where use of local data is proposed: • identify relevant species or population • identify aspect of species/population data • identify source of information for local data • justify use of local data in preference to database values.
Where expert reports are used in place of targeted survey: • identify the relevant species or population • justify the use of an expert report • indicate and justify the likelihood of presence of the species or
population and information considered in making this assessment • estimate the number of individuals or area of habitat (whichever unit
of measurement applies to the species/individual) for the development site, including a description of how the estimate was made
• identify the expert and provide evidence of their expert credentials.
• Table of vegetation zones and landscape Tg values, particularly indicating where these have changed due to species exclusion
• Targeted survey locations • Table detailing the list of species
credit species and presence status on site as determined by targeted survey, indicating also where presence was assumed and/or where presence was determined by expert report
• Species credit species polygons (as described in Paragraph 6.5.1.19)
• Table detailing species and habitat feature/component associated with species and its abundance on site (as described in Paragraph 6.5.1.19)
• Species polygons for species that cannot withstand a loss
Chapter 6

102 Fram
ework for B
iodiversity Assessm
ent
Table 21: Minimum information requirements for the Biodiversity Assessment Report (Stage 2)
Report section Information Maps & data FBA reference
Avoid and minimise impacts
Demonstration of efforts to avoid and minimise impact on biodiversity values in accordance with Section 8.3.
Identification of final project footprint during construction and operation in accordance with Subsection 8.3.3.
Assessment of direct and indirect impacts unable to be avoided at the development site in accordance with Sections 8.3 and 8.4. The assessment would include but not be limited to: type, frequency, intensity, duration and consequence of impact.
Statement of onsite measures proposed to avoid and minimise direct and indirect impacts of the Major Project.
• Table of measures to be implemented before, during and after construction to avoid and minimise the impacts of the project, including action, outcome, timing and responsibility
• Map of final project footprint, including construction and operation
• Maps demonstrating indirect impact zones where applicable
Chapter 8
Impact summary continued…
Identification of areas not requiring assessment in accordance with Section 9.5.
Identification of areas not requiring offset in accordance with Section 9.4.
Identification of PCTs and species polygons requiring offset in accordance with Section 9.3.
Identification of impacts that require further consideration in accordance with Section 9.2, including: • the entity and/or impact for which further consideration is necessary • supporting information relevant to the impact, as outlined in
Subsection 9.2.2.
• Map of areas not requiring assessment
• Map of PCTs and species polygons not requiring offset
• Map of PCTs and species polygons requiring offset
• Map of the occurrence of the entity or impact that requires further consideration
Chapter 9

Appendix 7: R
eporting requirements for the FB
A
103
Report section Information Maps & data FBA reference
Impact summary, continued
Ecosystem credits and species credits that measure the impact of the Major Project on biodiversity values at the development site, including: • future site value score for each vegetation zone at the development site • change in landscape value score • number of required ecosystem credits for the impact of development on
each vegetation zone at the development site • number of required species credits for the impact of development on
each threatened species that occurs on the development site.
• Table of PCTs requiring offset and the number of ecosystem credits required
• Table of species and populations requiring offset and the number of species credits required
• Full biodiversity Credit Calculator output
• Submitted proposal in the Credit Calculator
Subsections 10.4.3 and 10.4.4
Biodiversity credit report
Credit profiles for ecosystem credits and species credits at the development site.
• Table of credit type and matching credit profile
• Biodiversity credit report from the Credit Calculator
Subsection 10.4.5
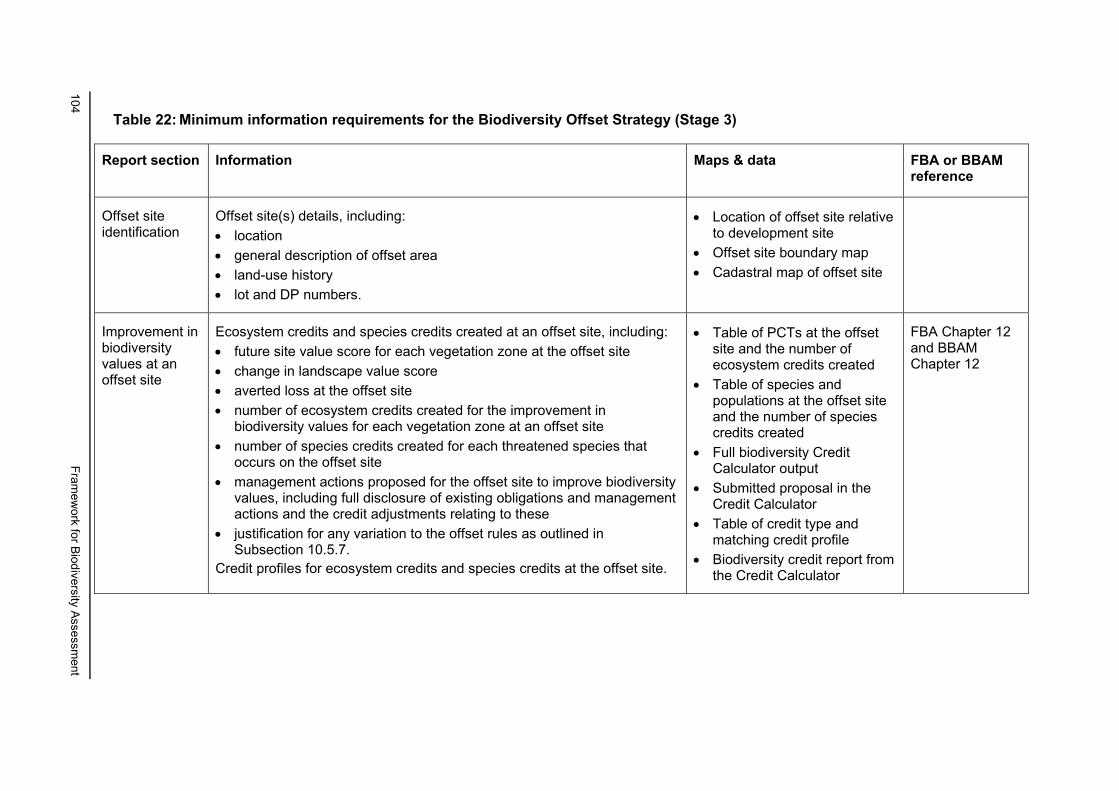
104 Fram
ework for B
iodiversity Assessm
ent
Table 22: Minimum information requirements for the Biodiversity Offset Strategy (Stage 3)
Report section Information Maps & data FBA or BBAM reference
Offset site identification
Offset site(s) details, including: • location • general description of offset area • land-use history • lot and DP numbers.
• Location of offset site relative to development site
• Offset site boundary map • Cadastral map of offset site
Improvement in biodiversity values at an offset site
Ecosystem credits and species credits created at an offset site, including: • future site value score for each vegetation zone at the offset site • change in landscape value score • averted loss at the offset site • number of ecosystem credits created for the improvement in
biodiversity values for each vegetation zone at an offset site • number of species credits created for each threatened species that
occurs on the offset site • management actions proposed for the offset site to improve biodiversity
values, including full disclosure of existing obligations and management actions and the credit adjustments relating to these
• justification for any variation to the offset rules as outlined in Subsection 10.5.7.
Credit profiles for ecosystem credits and species credits at the offset site.
• Table of PCTs at the offset site and the number of ecosystem credits created
• Table of species and populations at the offset site and the number of species credits created
• Full biodiversity Credit Calculator output
• Submitted proposal in the Credit Calculator
• Table of credit type and matching credit profile
• Biodiversity credit report from the Credit Calculator
FBA Chapter 12 and BBAM Chapter 12

Appendix 7: R
eporting requirements for the FB
A
105
Report section Information Maps & data FBA or BBAM reference
Rehabilitation site identification
Biodiversity credits to be created on land identified for ecological rehabilitation and other information about the proposed ecological rehabilitation including: • completion/relinquishment criteria in accordance with FBA
Paragraph 12.2.1.5 • the rehabilitation objectives for ecological rehabilitation works in
accordance with FBA Paragraph 12.2.1.6 • for each PCT, specify the increase in the site attribute score that will be
achieved for each site attribute set out in Table 2 • the total number of biodiversity credits proposed to be created for the
ecological rehabilitation for each PCT that is the target of the rehabilitation in accordance with FBA Section 12.2.
• Table of PCTs at the offset site and the number of ecosystem credits created
• Full biodiversity Credit Calculator output
• Submitted proposal in the Credit Calculator
FBA Chapter 12 and BBAM Chapter 12
Supplementary measures
Identification of ecosystem and species credits that are proposed to be converted to a supplementary measure, including: • entity to which the proposed supplementary measure would apply and
quantum of credits • justification for proposed use of supplementary measures, in accordance
with the guidance in FBA Paragraphs 10.5.4.3 and 10.5.7.5. • calculation of the amount of money to be spent on supplementary
measures must be based on the estimated costs (following the method described in the NSW Biodiversity Offsets Policy for Major Projects) and a description of the actions proposed to be funded
• proposed supplementary measure • statement of biodiversity outcome resulting from proposed
supplementary measure.
FBA Paragraphs 10.5.4.3 & 10.5.7.5
Summary Summary of biodiversity offset measures and how these match to credit requirements created by the development site. A management plan detailing management actions and the vegetation zones to which they will apply in accordance with BBAM Section 12.9.
BBAM Section 12.9