Embed Size (px)
Citation preview
Framework For thedevelopment oF
Carbon Footprints Forpaper and board produCts
September 2007
marco mensinkEnergy and Environment Director
Tel: +32 (0)2 627 49 [email protected]
2
aCknowledgements
This framework has been developed by the Confederation of European Paper Industries (CEPI, see www.cepi.org). Through its 17 member countries* CEPI represents 800 pulp, paper and board producing companies across Europe, ranging from small and medium sized companies to multi-nationals, and 1,200 paper mills. The European paper industry is one of the most competitive and sustainable in Europe producing 100 million tonnes of paper and board and 40 million tonnes of pulp annually. Together they represent 27% of world production.
In the development of this framework, CEPI has been working together closely with CEPIFINE, the European association of fine paper manufacturers (www.cepifine.org), CEPIPRINT, the Association of European Publication Paper Producers (www.cepiprint.com), ETS, the European Tissue Symposium (http://www.europeantissue.com) and the International Confederation of Paper and Board Converters in Europe (CITPA).
CITPA is the leading association of the paper and board converting industry in Europe. CITPA represents about 5.000 mostly small and medium-sized firms and the following associations:
ACE− , The Alliance for Beverage Cartons and the Environment (www.beveragecarton.eu).
CEPI− Eurokraft, the trade organization for European manufacturers of kraft paper for the flexible packaging industry (http://www.cepi-eurokraft.org)
ECMA− , the European Carton Makers Association http://w ww.ecma.org)
ECTA− , the European Core and Tube Association ([email protected])
ESBO− , the European Solid Board Organisation (http://www.esbo.nl)
EUROSAC− , the European Federation of Manufacturers of Multiwall Papersacks (http://www.eurosac.org)
EUROWAXPACK− , The European Association for manufacturers of Waxed paper packaging materials (www.eurowaxpack.org).
FEDES− , the European Federation for the Flexible Packaging Industry (www.fedes.com)
FEFCO− , the European Federation of Corrugated Board Manufacturers (www.fefco.org)
FEPE− , Fédération Européennes des Producteurs d’ Enveloppes (http://www.fepe.org)
FINAT− , the Féderation Internationale des fabricants et transformateurs d’Adhésifs et Thermocollants sur papiers et autres supports (www.finat.com)
PAPERIMPACT− , the Speciality Paper Manufacturers Association (http:// www.paperimpact.org )
PRO− CARTON, the European Association of Carton and Cartonboard manufacturers (www.procarton.com)
In this work, CEPI has been assisted by several experts in the field of Carbon footprint. The leading experts have been:
Reid Miner, Vice President− - Sustainable Manufacturing of The National Council for Air and Stream Improvement (NCASI), a US-based non-profit research institute that focuses on environmental topics of interest to the forest products industry (www.NCASI.org)
Angeline de Beaufort-Langeveld− , independent consultant and leading LCA expert in the European paper and board industry.
Elin Eriksson− , Assistant Department Manager and LCA expert of IVL Swedish Environmental Research Institute Ltd (www.IVL.se).
Finally, a group of company and national association experts has provided valuable advice and guidance in the drafting of this framework.
ACkN
OW
LED
gEM
ENTS
3
ExECUTIVE SUMMARy
Climate change has become a topic of high public interest. Building on this, politicians are increasingly looking at standards, labels and other instruments relevant to consumers that would lead them to participate in climate change mitigation. Therefore attention goes beyond CO2 emissions of production activities, companies or sectors, and is also focussing on CO2 emissions associated with products.
In this context, buyers are asking for the “carbon footprint” associated with the supply chain for the manufacture, distribution and disposal of products provided to them. Customers are asking for “carbon footprints” for different reasons:
to meet public concerns−to increase their own available information−to improve their image and reputation, −to position against competition−to compare different products−to reduce the climate effect of their own activities.−
Customers want a simple statement and the guarantee that the statement accurately reflects the real situation and is credible. However, behind the simple statement, there is a world of science, and a complexity of facts. Carbon footprint declarations can range from a single number to a full LCA (Life Cycle Assessment). In practice, a figure will be accompanied by a communication statement, based on background data and studies that can be shown as needed.
Often, companies’ choices and interpretations can make comparisons difficult. Harmonisation of approaches in the sector is desirable to limit the confusion at the customer level and in the marketplace From the Industry point of view, the more common the approach, the more credible the comparisons.
Some paper and board producers in Europe have already published footprint statements. Some paper brands outside Europe are being promoted as carbon neutral. Other material sectors are also working on the issue, but no public statements have been made yet.
As there is no standardized approach for the development of carbon footprints, the European paper and board industry has agreed to work together on a common framework, enabling companies to specify the carbon footprint for paper and board products.
Industry leaders instructed CEPI, the Confederation of European Paper Industries, to organise the process, through broad internal consultation, working closely together with all relevant industry sectors.
The establishment of a carbon footprint framework or the calculation of a carbon footprint of a product does not guarantee nor does it imply a positive or neutral result in itself. The proposed framework aims at bringing forward the unique positive attributes of our product and shows the way to get the best result possible.
ExEC
UTI
VE S
UM
MA
Ry
4
method oF working
Three steps have been taken to come to a common framework. We have worked “bottom-up”, as follows:
All− relevant developments, standards, definitions and information sources have been scoped. Most of this work is included as background information in the appendices to the Framework document, to assist the experts involved in the development of carbon footprints.
The− ten key elements (or “Toes”) of carbon footprints of paper and board products have been identified. guidance has been given how to make calculations.
A− proposal has been developed to reach a common approach for carbon footprints for paper and board products.
the ten elements oF a Carbon Footprint For paper and board produCts
The following ten elements must be examined when describing the relationship between forest products and making a carbon footprint for a product, an industry average number or a company profile:
1. Carbon sequestration in forests
2. Carbon stored in forest products
3. Greenhouse gas emissions from forest product manufacturing facilities
4. Greenhouse gas emissions associated with producing fibre
5. Greenhouse gas emissions associated with producing other raw materials/fuels
6. Greenhouse gas emissions associated with purchased electricity, steam and heat and
hot and cold water
7. Transport-related greenhouse gas emissions
8. Emissions associated with product use
9. Emissions associated with product end-of-life
10. Avoided emissions and offsets
The issues involved to reach a common framework have been extensively described in the document, indicating the choices for each element that need to be made at different levels in the industry.
Final result
One of the main results of this exercise is the fact that it is not possible to develop a “one-size-fits-all” standard for carbon footprints for paper and board products. A number of key choices cannot be made at CEPI level, as they have impact on different industry sectors. Also, many of the choices have market implications, benefiting one sector or company and limiting others. The aim of the framework is to enable companies to address their individual needs.
MET
HO
D O
F W
ORk
INg
, TE
N E
LEM
ENTS
, FIN
AL
RESU
LTS
5
proposal
Taking into consideration the possible level harmonisation and the open questions to reach it, CEPI proposes that the industry:
1. Work from the common understanding and background information established in this carbon footprint framework.
2. Include in all carbon footprints two qualitative statements on the two unique positive aspects of paper and board products:
− The fact that our products are based on a renewable raw material, using the starting point of our products – the capacity of forests to bind CO2.
− The fact that our products store carbon and, furthermore, that recycling of paper and board products keeps this CO2 from returning to the atmosphere.
3. Use the statement that Sustainable Forest Management (SFM) ensures that carbon stocks in forests stay stable or even improve over time and build on this statement.
4. Use as much as possible the same system boundaries (i.e. which elements are to be included). Define carbon footprints for basic paper and board products from the forest/the collection of the recycled fiber to the delivery to the customer of the product (1-7).
5. Decide at the level of industry sectors or converters of these basic paper and board products whether more aspects of a life cycle approach, the use phase of the product, end of life emissions and avoided emission concepts are included in the footprint (8-10). A key argument can be to make these footprints comparable to products of competing materials and existing databases.
6. Discuss at the level of the different industry sectors if the development and use of an industry average number is desirable and in the best interest of sector members.
7. Include in the footprint all relevant and significant emissions for the product, both the emissions under the companies’ control and the emissions not under companies’ control (e.g. of purchased electricity).
8. Aim to include 90% of all emissions within the system boundaries in the carbon footprint of the product (a cut-off criterion).
9. Advocate the choice of this 90% as a first paper industry proposal, discussing with other industrial sectors and standardization processes until a final industry-wide consensus is reached on how much of the total emissions should at least be included.
10. Include the option of carbon offsetting (e.g. planting trees to offset fuel use), but be very transparent about it and add additional information when using it in the carbon footprint.
11. Initiate the development of generic data on, for example, transport emissions and harvesting emissions in the forest.
12. Develop knowledge base on carbon storage in products and carbon storage in forests, in advocating in international organisations to acknowledge carbon storage in forests and forest products in policy development
13. Maintain the existing CEPI group structure to coordinate between the different industry sectors and see where more harmonisation is possible
PRO
POSA
L
6
The thirteen points above should form the common approach needed to put in practice the CEPI framework on carbon footprints. They take into consideration competition between different grades and processes.
The remaining debates and key issues for discussion and possible further harmonisation are listed in a separate document, as part of the proposal. The framework recognises that where consensus is not possible, transparency needs to be provided. As long as all involved in developing the carbon footprints are clear and transparent on their choices, the approaches taken in different cases can be understood.
Many choices will need to be made at industry, sector, and company level, whether now to reach a common approach, or in the future when further standardization takes place. The key goal for our industry in the carbon footprint issue must be to engage in the public debate and to proactively bring forward and get credit for the elements that are unique to our sector and ensure that they are included in the global concept of carbon footprints.
PRO
POSA
L
7
table oF Contents
This document consists of three parts.
1. part 1 presents general guidance on the framework for carbon footprints.
A. Introduction (Background, a common framework, intended use) 11
B. Description of the general structure of the CEPI framework 13
C. general guidance for forest product carbon footprints 14
D. A proposal for a common approach for paper and board products 17
2. part 2 presents the specific guidance on each of the 10 elements we think should be included or mentioned in a carbon footprint for paper and board products. also, further information is given on:
1. Carbon sequestration in forests 22
2. Carbon in forest products 24
3. greenhouse gas emissions from forest product manufacturing facilities 26
4. greenhouse gas emissions associated with producing fibre 28
5. greenhouse gas emissions associated with producing other raw materials and fuels 30
6. greenhouse gas emissions associated with purchased electricity,
steam and heat and hot and cold water 31
7. Transport-related greenhouse gas emissions 33
8. Emissions associated with product use 35
9. Emissions associated with product end-of-life 36
10. Avoided emissions 38
Additional information 40
The Carbon Footprint Balance Sheet 41
glossary 42
3. part 3 (appendices with background information, aiding the reader in understanding the general and specific guidance and steering the reader towards sources of information, standards, developments, etc) is in a separate document.

8

99
introduCtion and eXplanationgeneral guidanCe
PAR
T 1
10
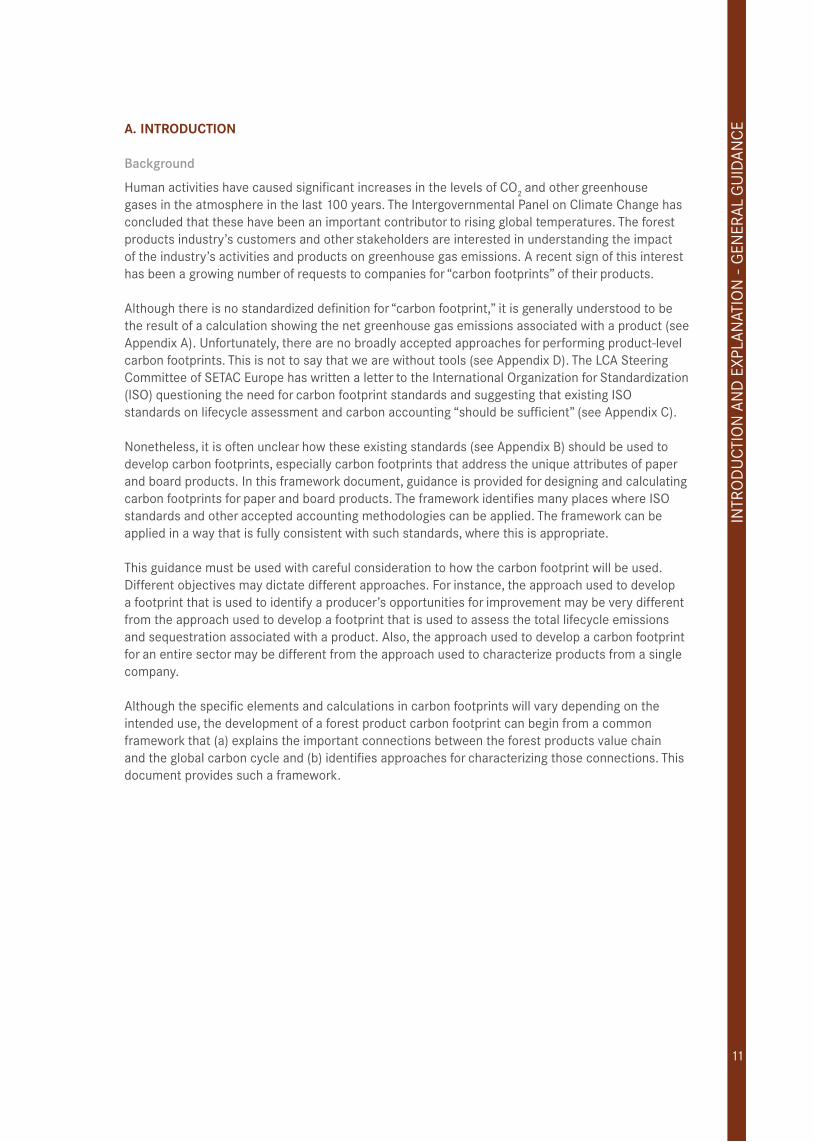
a. introduCtion
Background
Human activities have caused significant increases in the levels of CO2 and other greenhouse gases in the atmosphere in the last 100 years. The Intergovernmental Panel on Climate Change has concluded that these have been an important contributor to rising global temperatures. The forest products industry’s customers and other stakeholders are interested in understanding the impact of the industry’s activities and products on greenhouse gas emissions. A recent sign of this interest has been a growing number of requests to companies for “carbon footprints” of their products.
Although there is no standardized definition for “carbon footprint,” it is generally understood to be the result of a calculation showing the net greenhouse gas emissions associated with a product (see Appendix A). Unfortunately, there are no broadly accepted approaches for performing product-level carbon footprints. This is not to say that we are without tools (see Appendix D). The LCA Steering Committee of SETAC Europe has written a letter to the International Organization for Standardization (ISO) questioning the need for carbon footprint standards and suggesting that existing ISO standards on lifecycle assessment and carbon accounting “should be sufficient” (see Appendix C).
Nonetheless, it is often unclear how these existing standards (see Appendix B) should be used to develop carbon footprints, especially carbon footprints that address the unique attributes of paper and board products. In this framework document, guidance is provided for designing and calculating carbon footprints for paper and board products. The framework identifies many places where ISO standards and other accepted accounting methodologies can be applied. The framework can be applied in a way that is fully consistent with such standards, where this is appropriate.
This guidance must be used with careful consideration to how the carbon footprint will be used. Different objectives may dictate different approaches. For instance, the approach used to develop a footprint that is used to identify a producer’s opportunities for improvement may be very different from the approach used to develop a footprint that is used to assess the total lifecycle emissions and sequestration associated with a product. Also, the approach used to develop a carbon footprint for an entire sector may be different from the approach used to characterize products from a single company.
Although the specific elements and calculations in carbon footprints will vary depending on the intended use, the development of a forest product carbon footprint can begin from a common framework that (a) explains the important connections between the forest products value chain and the global carbon cycle and (b) identifies approaches for characterizing those connections. This document provides such a framework.
INTR
OD
UC
TIO
N A
ND
ExP
LAN
ATIO
N -
gEN
ERA
L g
UID
AN
CE
11
12
Establishing a common approach
As there is no standardized approach for the development of carbon footprints, the European paper and board industry has agreed to work together on a common framework, enabling companies to specify the carbon footprint for paper and board products. Industry leaders instructed CEPI, the Confederation of European Paper Industries, to organise the process, through broad internal consultation, working closely together with all relevant industry sectors. Three steps have been taken to come to a common framework:
First all relevant developments, standards, definitions and information sources have −been scoped. The majority of this work can be found as background information in the appendices and can be used by the experts involved in the development of carbon footprints. Second, the ten key elements (toes) of carbon footprints of paper and board products have −been identified. The key issues and choices that need to be made in order to develop each element have been described in the form of specific guidance.Third, a proposal has been made, incorporated in the structure of the framework, to define −a common approach for carbon footprints for paper and board products and the different sectors. This has been described in the form of general guidance.
There are of course existing approaches (e.g. Paper Profile) within the paper and board industry on a product level that do contain data on carbon as well (see Appendix g).
The intended use of the framework
This framework for preparing carbon footprints for pulp, paper and other forest products has been developed to address several needs:
To− provide a common starting point from which companies, customers, sector associations and other stakeholders can develop carbon footprint methodologies appropriate for particular uses.
To− outline some of the considerations involved in designing an approach for calculating a carbon footprint for a forest product.
To− assist in characterizing those aspects of the forest products lifecycle that can be important to the greenhouse gas emissions performance of forest products.
To− identify sources of information useful for doing carbon footprint calculations.
To− allow stakeholders, especially customers, to understand the emissions and sequestration associated with forest products.
Progress has been made. It has not been possible though to develop a one-size-fits-all standard for carbon footprints for paper and board products. As the development of the framework has involved practically all sectors connected to the paper and board industry, a number of choices cannot be made at CEPI level. Also, many of the choices have market implications, benefiting one sector or company and limiting others. The aim of the framework has been to enable all companies to address their individual needs
Experts use
In this phase of the work on carbon footprints, the attempt is made to cover all potentially relevant issues in the framework. This framework is meant to support the experts in the industry sectors and companies who develop the carbon footprints.
INTR
OD
UC
TIO
N A
ND
ExP
LAN
ATIO
N -
gEN
ERA
L g
UID
AN
CE
13
Customer communication
In the communication with customers, it will usually be necessary to reduce the results of the carbon footprint to one or two pages of easy-to-communicate information. By following this framework document, however, companies will be able to assure customers and other stakeholders that there is expertise and consensus, as well as transparency in methodology and data behind the single numbers in the final document.
b. desCription oF general struCture oF the Cepi Framework
The framework consists of five general points of guidance, a proposal for a common approach and a description of the ten (10) elements that can be included in carbon footprint calculations for paper and board products – e.g. the footprint “toes”:
The− general guidance describes the key issues in the development of a carbon footprint.
In− the proposal for a common approach, suggestions are made which already answer some of the questions in the general guidance.
The− toes describe the elements of the footprint and approaches for characterizing those elements, on which companies and sectors can further build.
The− appendices contain background information and assistance on calculating the different elements of the footprint.
The first two toes describe key attributes of forest-based products – carbon sequestration in forests and in products. These are issues the sector needs to bring forward. The next five toes contain the core of the Curriculum Vitae, the carbon footprint of products in general. The last three toes describe possible system boundary expansions – the use of products - end of life emissions and avoided emissions.
Many of the toes deal with emissions that can be estimated with reasonable confidence and can, therefore, be included in a balance sheet. Balance sheets will usually include, at a minimum, emissions estimates for the elements of the value chain with the footprint boundaries. In some cases, it is also possible to include balance sheet information on the net removals of CO2 from the atmosphere accomplished via sequestration, although these calculations often involve more uncertainty than associated with estimates of emissions. Finally, depending on the use of the footprint, it may be possible to use certain avoided emissions in a balance sheet.
The first two toes (forest carbon sequestration, product carbon sequestration) and the last two toes (end-of-life emissions and avoided emissions) deal with topics that can be more difficult to quantify, although they are important parts of the framework. Many of them involve both technical considerations as well as number of policy considerations. The ten toes are described and initial guidance is provided on how to develop the estimates. Additional guidance will be needed explaining in more detail on how to develop the estimates and use them in the balance sheet.
Offsets generated outside of the life cycle of the product described in the footprint (e.g. offsets purchased in carbon markets) are not included in this framework.
As stated, in the appendices background information is given, to enable further understanding of the carbon footprint issue. Also included in Appendix L are example formats for presenting results of a carbon footprint.
INTR
OD
UC
TIO
N A
ND
ExP
LAN
ATIO
N -
gEN
ERA
L g
UID
AN
CE
14
C. general guidanCe For Forest produCt Carbon Footprints
A carbon footprint must …
Be1. easy to use, easy to understand, easy to communicate, credible and transparent.
Help2. stakeholders understand the connections between the forest products value chain and the global carbon cycle
Include3. the important sources of emissions and sequestration and be consistent with physical realities (the footprint should not present a situation that does not exist in reality).
If4. used to compare products, must be developed using comparable system boundaries, cut-off criteria and methods and in accordance with applicable standards governing the comparisons of product environmental attributes.
If5. used to identify opportunities for a company to make improvements, reflect the amount of control that the company has over the sources of emissions and sequestration in the footprint.
In order to achieve these general guidance points, the following key issues should be taken into account when developing the carbon footprint of a sector, company or product:
transparency – describing your methods: Because transparency is an important guiding principle for developing carbon footprints, companies releasing carbon footprints to customers or other stakeholders should be willing to describe, on request, the methods used to develop the footprint, describing the way the issues below have been handled. Verification of the footprint is an option that may further enhance its credibility.
organizing emissions data to reflect control: There are different approaches to organizing information on emissions and sequestration in carbon footprints. In some cases, the data are organized only according to where in the lifecycle the emissions occur. In other cases, however, data are organized to reflect the degree of control the company has over the emissions. Emissions over which the company has control are called “Scope 1 emissions” under the WRI/WBCSD gHg Protocol, and “direct emissions” under ISO 14064:2006. Emissions not under the company’s control are “Scope 2” or “Scope 3” emissions under the WRI/WBCSD gHg Protocol, and “indirect emissions” under ISO 14064:2006. The approach used to organize emissions data should be consistent with the objectives of the footprint and should be used consistently throughout the footprint. Appendix k contains an overview of the approaches for organizing data to reflect ownership or control of emissions.
determining boundary conditions: There are many possible uses for carbon footprints. The boundary conditions used in the analysis (i.e. the decision on which elements of the value chain to include) must be appropriate for the intended use. The boundary conditions for a sector-level carbon footprint of a product may be different than those for a company-level carbon footprint of the same product. For instance, a sector-level footprint might include end-of-life emissions since generic data can be used that describe the average situation. The products from a specific company, however, may not follow the average situation and the true end-of-life destiny of products from the company may not be known, so the company might use footprint boundaries that exclude end-of-life. It is therefore important to describe these boundaries.
INTR
OD
UC
TIO
N A
ND
ExP
LAN
ATIO
N -
gEN
ERA
L g
UID
AN
CE
15
There are a number of factors to consider in selecting boundary conditions.To what extent is the footprint intended to reflect emissions and sequestration that are outside −of the company’s control?How accurate are the data for characterizing emissions and sequestration along the value −chain?What are the boundary conditions being used in carbon footprints against which your footprint −will be compared?
Cut-off criteria: It is not practical or necessary to include every substance or emission that enters or leaves the boundaries of the carbon footprint. In lifecycle studies (see Appendix E), cut-off criteria are set that determine which of the inputs and outputs should be included. (See ISO 14040:2006 and ISO 14044:2006.) In carbon accounting protocols, these cut-offs are sometimes called materiality thresholds. (See the WRI/WBCSD gHg Protocol Corporate Accounting Standard.) For footprints that are available to the public the cut-off criteria or other approaches that were used to decide which inputs and outputs to include in the footprint should be clear. As used here, cut-off criteria or materiality thresholds are suggested to be expressed as a fraction of the total footprint greenhouse gas emissions.
Comparing carbon footprints: A number of industry stakeholders have expectations that carbon footprints will be helpful in comparing products. Product comparisons, however, must be done with great care. ISO has developed standards that apply to the use of lifecycle studies for supporting product comparisons and these standards are relevant to comparisons of carbon footprints of different products. ISO 14044:2006 is especially relevant. When comparing carbon footprints, special attention must be paid to (a) ensuring that the products perform the same function (i.e. the study must be based on equivalent functional units), (b) using consistent boundary conditions, allocation methods and cut-off criteria, (c) transparency in reporting (d) obtaining an appropriate level of critical review. In addition, when comparing products it is important to remember there are environmental attributes other than greenhouse gas emissions that may be important to a product’s overall environmental performance.
allocating ghg emissions among products and co-products: In many cases, facilities produce several types of products, possible examples including different types of paper/paperboard, wood products, bioenergy, biomass fuels and calcium carbonate. In addition, some facilities produce other types of products – excess electricity, for instance. Allocation of gHg emissions to co-products should be done if these co-products are produced in large quantities. ISO 14044: 2006 gives guidance. In lifecycle studies, emissions are not usually allocated to co-products that are produced in small quantities. The method used to allocate gHg emissions among products and co-products should be made transparent when publishing a number or footprint.
INTR
OD
UC
TIO
N A
ND
ExP
LAN
ATIO
N -
gEN
ERA
L g
UID
AN
CE
16
allocation in systems involving recycling of used products: Forest product manufacturers, particularly those in the paper and paperboard sectors, rely heavily on recycled fibre as raw material. Through recycling, the virgin fibre (after its first use) may be used as a raw material in the original production system (closed-loop recycling), producing the same product or in another production system (open loop recycling), producing a different product. When determining industry averages or sector data and fibres are used several times, one must decide how to allocate the emissions from both the virgin and recycled fibre operations to the products that result from multiple uses of the fibre. Allocation rules should be used consistently throughout the carbon footprint calculations to avoid double counting. Handling allocation for recycling is especially important when the intention of the footprint is to compare products based on primary fibres and products based on (partly) recovered fibres. ISO 14044:2006 provides guidance in a stepwise procedure, starting with options to avoid allocation, wherever possible. Allocation needs for recycling may be different for different sectors. The corrugated box industry in Europe uses a closed-loop allocation approach that shares the emissions from the virgin and recycled fiber systems equally among all products. (FEFCO -CEPI Containerboard European Database for Corrugated Board Life Cycle Studies, 2006) The tissue sector (ETS), does not apply any allocation or avoided emissions for recycling in their Product Category Rules.
working with aggregated data: Many of the Toes in the framework described herein require disaggregated data. For instance, if one wants to include the emissions from the production of fuels, they would be in a different Toe than the emissions associated with burning those fuels. Some data sources, however, combine these into a single value. For purposes of transparency, it is recommended that, to the extent practical, emissions be disaggregated according to the Toes described in this framework. Aggregated data may be used, however, and the data may be organized differently than suggested in this framework, where it is appropriate for the intended use of the footprint.
biomass carbon and biomass-derived Co2: Carbon sequestration and the use of biomass fuels are important attributes of the forest products value chain. There are a number of approaches for characterizing the role of carbon sequestration. Some of these approaches generate estimates of net sequestration (or net emissions) that can be used in greenhouse gas balance sheets while others are useful primarily as tools for educating stakeholders. Several approaches for characterizing the effects of biomass carbon are discussed in Appendix F. It is important to understand that estimates of CO2 emissions from biomass burning have no meaning in themselves because they represent only one of many places along the value chain where carbon is transferred to and from the atmosphere. While estimates of CO2 emissions from biomass burning are often included as “additional information” they are not combined with CO2 emissions from fossil fuels in greenhouse gas emissions totals. The European Trading Scheme, the WRI/WBCSD gHg Protocol, and the 2006 IPCC National Reporting guidelines recognize this convention. Likewise, in this carbon footprint framework, emissions of biomass-derived CO2 are not included in greenhouse gas totals but recorded as additional information.
INTR
OD
UC
TIO
N A
ND
ExP
LAN
ATIO
N -
gEN
ERA
L g
UID
AN
CE
17
d. proposal For a Common approaCh For paper and board produCts
In order to come to a common approach as much as it seems possible today, with the establishment of this carbon footprint framework and the remaining open questions and debates, CEPI proposes that the industry as a whole:
1. Work from the common understanding and background information established in this carbon footprint framework.
2. Include in all carbon footprints two qualitative statements on the two unique positive aspects of paper and board products:
− The fact that our products are based on a renewable raw material, using the starting point of our products – the capacity of forests to bind CO2.
− The fact that our products store carbon and, furthermore, that recycling of paper and board products keeps this CO2 from returning to the atmosphere.
3. Use the statement that Sustainable Forest Management (SFM) ensures that carbon stocks in forests stay stable or even improve over time and build on this statement.
4. Use as much as possible the same system boundaries (i.e. which elements are to be included). Define carbon footprints for basic paper and board products from the forest/the collection of the recycled fiber to the delivery to the customer of the product (1-7).
5. Decide at the level of industry sectors or converters of these basic paper and board products whether more aspects of a life cycle approach, the use phase of the product, end of life emissions and avoided emission concepts are included in the footprint (8-10). A key argument can be to make these footprints comparable to products of competing materials and existing databases.
6. Discuss at the level of the different industry sectors if the development and use of an industry average number is desirable and in the best interest of sector members.
7. Include in the footprint all relevant and significant emissions for the product, both the emissions under the companies’ control and the emissions not under companies’ control (e.g. of purchased electricity).
8. Aim to include 90% of all emissions within the system boundaries in the carbon footprint of the product (a cut-off criterion).
9. Advocate the choice of this 90% as a first paper industry proposal, discussing with other industrial sectors and standardization processes until a final industry-wide consensus is reached on how much of the total emissions should at least be included.
10. Include the option of carbon offsetting (e.g. planting trees to offset fuel use), but be very transparent about it and add additional information when using it in the carbon footprint.
11. Initiate the development of generic data on, for example, transport emissions and harvesting emissions in the forest.
12. Develop knowledge base on carbon storage in products and carbon storage in forests, in advocating in international organisations to acknowledge carbon storage in forests and forest products in policy development
13. Maintain the existing CEPI group structure to coordinate between the different industry sectors and see where more harmonisation is possible
INTR
OD
UC
TIO
N A
ND
ExP
LAN
ATIO
N -
gEN
ERA
L g
UID
AN
CE
18
The thirteen points above should form the common approach. They take into consideration competition between different grades and processes. Further work on the common approach is ongoing at the level of the different industry sectors, based on the CEPI framework.
The general approach to decisions that still need to be made is the following – where consensus is not possible, transparency is key. As long as all involved in developing the carbon footprints are clear and transparent on their choices, the different approaches can be understood.
Many choices will be made in the next years, especially when further standardization takes place. In this respect, there is a huge interest for our industry to bring forward the key elements that are important for our sector into the public debate. The sector needs to make sure that the elements that underline the positive attributes of paper and board products are included in the carbon footprints indeed. This is where CEPI can do further work.
Finally, it must be said that the establishment of a carbon footprint framework or the calculation of a carbon footprint of a product does not guarantee a positive or neutral result in itself. This framework does bring the positive attributes of our product forward and shows the way to get the most realistic results possible.
INTR
OD
UC
TIO
N A
ND
ExP
LAN
ATIO
N -
gEN
ERA
L g
UID
AN
CE
19
INTR
OD
UC
TIO
N A
ND
ExP
LAN
ATIO
N -
gEN
ERA
L g
UID
AN
CEthe 10 toes oF the Carbon Footprint
PAR
T 2
20
THE
TEN
TO
ES O
F C
ARB
ON
FO
OTP
RIN
T
21
introduction:
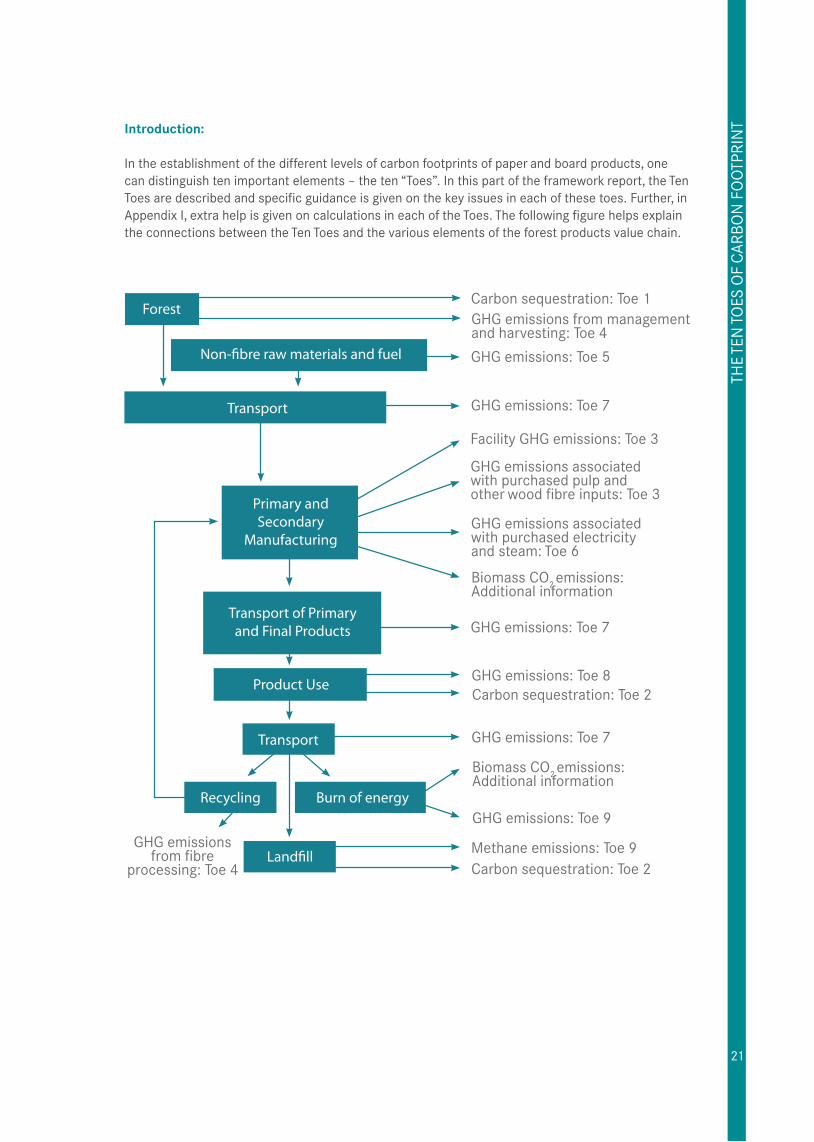
In the establishment of the different levels of carbon footprints of paper and board products, one can distinguish ten important elements – the ten “Toes”. In this part of the framework report, the Ten Toes are described and specific guidance is given on the key issues in each of these toes. Further, in Appendix I, extra help is given on calculations in each of the Toes. The following figure helps explain the connections between the Ten Toes and the various elements of the forest products value chain.
THE
TEN
TO
ES O
F C
ARB
ON
FO
OTP
RIN
T
Forest
Transport
Primary andSecondary
Manufacturing
Transport of Primaryand Final Products
Product Use
Transport
Recycling Burn of energy
Carbon sequestration: Toe 1
Carbon sequestration: Toe 2
Carbon sequestration: Toe 2
gHg emissions: Toe 5
gHg emissions: Toe 7
gHg emissions: Toe 7
gHg emissionsfrom fibre
processing: Toe 4
gHg emissions: Toe 8
gHg emissions: Toe 7
gHg emissions: Toe 9
Methane emissions: Toe 9
Facility gHg emissions: Toe 3
gHg emissions associatedwith purchased pulp and other wood fibre inputs: Toe 3
gHg emissions associatedwith purchased electricityand steam: Toe 6
Biomass CO2 emissions:Additional information
Biomass CO2 emissions:Additional information
gHg emissions from managementand harvesting: Toe 4
22
introduCtion
The first item to address in a carbon footprint for paper and board products is information on the importance of forest carbon. Forests sequester biomass carbon while providing raw materials for industry, important environmental services and employment. The industry’s use of wood fiber provides an incentive to keep land in forest where it can “bind carbon” and sustainable forest management practices ensure that new biomass carbon is grown to replace the biomass carbon that is removed during harvest. Biomass carbon sequestration and storage are attributes that are missing from the value chains of most other industries but are central features of the value chain of the forest products industry.
While forests are critical to the environmental attributes of paper products, it can be difficult to determine the precise effect of an individual product on forest carbon. Therefore, the approach below allows companies to use various types of information, from quantitative to descriptive.
issues/disCussions
A simple way to deliver the message:
The concept of biomass carbon in forests can be difficult to understand. A simple way to deliver the message is to Use the starting point that sustainable forest management (SFM) secures the stocks of carbon in forests to stay stable or even improve in time.
Forest carbon stocks
Due to the use of sustainable forest management practices, forest carbon stocks are stable or increasing in the developed world, even though most of the worlds industrial harvesting is done in these same countries. According to the European gHg inventory, forests of the EU-15 are a net carbon sink, with net CO2 removals by forests having increased by 27 % between 1990 and 2004. Indeed, throughout the developed world, sustainable management practices are largely in place to ensure the future availability of wood. By replenishing the forests, these practices help maintain stable stocks of forest carbon. It is difficult, however, to isolate the effects attributable to a specific product. Also complicating the calculations is the reliance on imported wood in some places.
Economic incentives enable
A very important impact of the forest products industry on forest carbon is the economic incentives that the industry provides by creating demand for wood. Without this demand, the pressures to convert land to non-forest uses might result in large losses of forest carbon due to land clearing. Where this effect can be estimated, it may be possible to include it as an avoided emission (see Toe 10 for more information.) More often, it can be used as additional information explaining the important connections between the industry and the global carbon cycle. Information on the influence of the increased demand for biomass fuels can also be useful.
THE
TEN
TO
ES O
F C
ARB
ON
FO
OTP
RIN
T toe 1biomass carbon sequestration in forests
23
Qualitative and quantitative
Some companies may be able to estimate changes in forest carbon stocks and attribute a portion of those changes to individual products. In these cases, the footprint may include quantitative information in the form of a number indicating the net additions to forest carbon stocks per unit of product, averaged over appropriate areas and times. The considerations involved in using biomass carbon information in balance sheets are explored in Appendix F.
Companies that do not have the possibility to make quantitative statements about forest carbon sequestration in a footprint should still address this issue in the footprint by describing how a company’s sustainable forest management practices and fibre procurement practices are helping to ensure that forest carbon stocks are not being depleted. Reliance on fibre from sustainably managed forests should allow a product to be characterized as having, at worst, a “net zero” impact on forest carbon.
To help stakeholders understand the importance of the industry’s use of sustainably managed forests to the carbon cycle, companies may also want to calculate how much carbon is maintained, on average, in that area of sustainably managed forests needed to supply fibre for the product on a continuing basis. Appendix F has more information on this approach.
Relation with carbon sequestration in products
Over large areas and times, sustainably managed forests do not have a large effect on atmospheric CO2 because while some trees are harvested, others are growing, accumulating additional carbon that replaces the carbon lost from the forest in harvested wood. Due to the carbon stored in products, the estimates derived in Toe 1 usually understate the net sequestration accomplished by the forest products value chain and should therefore be seen in combination with the issue of carbon sequestration in products, discussed in Toe 2.
THE
TEN
TO
ES O
F C
ARB
ON
FO
OTP
RIN
T
24
introduCtion
The second item to address in a carbon footprint for forest products is information on the importance of the biomass carbon in products. The largest biomass carbon impacts from sustainably managed forests are usually not in the forest, because these biomass carbon stocks remain relatively stable. More important are effects related to (a) biomass carbon stored in products (in this Toe), (b) avoided emissions related to substitution of many forest products for more greenhouse gas intensive alternatives (discussed in Toe 10).
To understand why the biomass carbon in products is significant, it is important to think back to where it comes from. In the forest, carbon is removed from the atmosphere and is converted into wood. If this biomass carbon is returned to the atmosphere as fast as additional carbon is removed from the atmosphere, there is no effect on the atmosphere. However, if the return of the biomass carbon to the atmosphere is delayed due to its being stored in products, it may be possible to removed CO2 from the atmosphere faster than it is returned to the atmosphere, having a net positive effect on atmospheric carbon. Studies have shown that on a global basis, the growth in the amounts of biomass carbon stored in products is large enough to offset a large fraction of the emissions from the forest products value chain.
issues/disCussion
A simple way to deliver the messageThe concept of biomass carbon sequestration in products can be difficult to understand. A simple way to deliver the message is to show the product – e.g. this product contains biomass carbon and as long as it is in use, it will keep this biomass carbon from the atmosphere.
Estimates
The amount of biomass carbon in a product can be easily estimated and included in a footprint to document the amount of biomass carbon stored in the product as it is put into commerce. For footprints with system boundaries that end after manufacturing, this is all that will be included in the footprint regarding product carbon.
To use product carbon storage estimates in a balance sheet as sequestration, however, one should include only the carbon that is expected to remain out of the atmosphere for an extended length of time. This will be less than the amount in the product as it is put into commerce. Depending on the footprint’s system boundaries, estimates of sequestration attributable to biomass carbon in products can be limited to products in use, or can include both products in use and in landfills. The considerations involved in using Toe 2 information in balance sheets are examined in Appendix F.
Long-term storage
The long-term storage of biomass carbon during product use can sometimes be estimated with reasonable confidence because it is closely related to the function of the product, which is part of the product design. The further the product moves through the value chain, however, the more uncertain the biomass carbon storage estimates become. After use, the fate of the product is
THE
TEN
TO
ES O
F C
ARB
ON
FO
OTP
RIN
T toe 2biomass carbon in forest products
25
primarily determined by public policy decisions regarding solid waste management, which are out of the company’s control and vary considerably from one region to another. As a result, including products in landfills in the system boundaries of the footprint can cause large differences between footprints that are solely due to different public policies regarding waste management in different regions.
Recycling
keeping fibre in the recycling loop could be considered as storage of carbon during product use. A calculation approach for accounting for this extended storage is presented in Example 3 of ISO/TR 14047:2003.
THE
TEN
TO
ES O
F C
ARB
ON
FO
OTP
RIN
T
26
introduCtion
The next item to address in a carbon footprint for paper and board products is emissions from fossil fuel combustion at manufacturing facilities that produce forest products, including primary manufacturers (e.g. pulp mills, paper mills, board mills) and final manufacturing facilities (e.g. box plants). This includes all facilities involved in converting wood fibre or recovered fibre into final products regardless of who owns them. It also includes fuels used to operate pollution control devices that are treating releases from the manufacturing operations. Toe 3 emissions are usually included in greenhouse gas balance sheets.
issues/disCussions
Data sources
In many cases, emissions from facilities controlled by the company preparing the footprint are estimated for other purposes (e.g. gHg reporting requirements). These estimates can be used here. In some cases, however, these may not be available. For instance, the footprint may be prepared by a company that owns the converting operations but not the primary manufacturing facilities, or a company may purchase pulp from a different company. In some cases, this information can be obtained directly from the facilities of interest. In other cases, it will be necessary to use generic information describing facilities of the same general type. The company should be willing to identify data sources.
Greenhouse gasses
Fossil fuel-derived CO2 emissions represent the large majority of greenhouse gas emissions from forest products manufacturing. Other gases or emissions sources may be important, however for certain uses of carbon footprints. The combustion of fuels may release CH4 and N2O. An analysis of the existing data sources suggests that these non-CO2 greenhouse gases contribute 1-5% to the total CO2-equivalents in fossil fuel combustion, although there are exceptions, especially for coal combustion. The decision to include these emissions in the footprint or not depends on the cut-off criteria used, which must be consistent with the intended use of the carbon footprint. Appendix I contains information that can be helpful in identifying significant sources of minor greenhouse gases. CO2 from biomass combustion is not included in Toe 3, but is recorded as “additional information” and may be included in overall assessments of biomass carbon stocks or flows, as discussed in Appendix F.
Multiple products
For facilities that produce more than one product (or produce co-products), greenhouse gas releases from the facilities will need to be allocated among the various outputs. In lifecycle studies, emissions are usually not allocated to by-products. Allocation methods are discussed in more detail in ISO 14044:2006.
THE
TEN
TO
ES O
F C
ARB
ON
FO
OTP
RIN
T
toe 3biomass greenhouse gas emissions from forest products manufacturing facilities
27
Sales and purchases of electricity and steam
Pulp and paper mills sometimes sell excess electricity or steam. There are several options for adjusting carbon footprint calculations to address the effects of these practices on Toe 3 emissions. These are discussed in Toe 6, Toe 10 and Appendix I.
Combined heat and power
If product or co-product electricity, steam or heat is produced by combined heat and power systems (CHP), it may be necessary to allocate emissions from the CHP system to the various outputs. Information on CHP allocation options is available in the greenhouse gas Calculation Tools for Pulp and Paper Mills issued under the WRI/WBCSD gHg Protocol.
Emission factors for fuelsSome fossil fuel emission factors include emissions from the operations involved in producing the fuel. These emissions factors should not be used here. If these upstream emissions are included in the system boundaries, they should be calculated in Toe 5.
Miscellaneous sources of greenhouse gases from forest product manufacturing facilitiesThere is a variety of small sources of greenhouse gas emissions from manufacturing facilities. These miscellaneous sources are often excluded from greenhouse gas reporting standards. In some cases, however, it may be necessary to consider some of these miscellaneous emissions, Examples include wastewater treatment plants that have anaerobic zones, mill sludge and wood waste landfills, combustion of waste that is derived from fossil fuels (e.g. oil-based plastics) and losses of refrigerant from air conditioning/cooling systems. CO2 emissions from kraft mill lime kilns are a combination of fossil fuel CO2 and biomass CO2. Only the fossil fuel CO2, associated with burning fossil fuel in the lime kiln, should be reported as a greenhouse gas emission. All of these miscellaneous sources are part of Toe 3 regardless of whether they are conducted on-site or off-site.
THE
TEN
TO
ES O
F C
ARB
ON
FO
OTP
RIN
T
28
introduCtion
The fourth item to address in a carbon footprint for paper and board products is the greenhouse gas emissions generated in producing wood fibre and recovered fibre. For virgin fibre, this includes forest management and harvesting. For recovered fibre, it includes collection, sorting and processing of recovered paper before it enters the recycling process. Transport emissions are not included. The emissions in this toe will often be outside of the control of the manufacturer of the product described in the footprint, especially those involving recovered fibre. The emissions can usually be included in balances sheets.
issues/disCussions
Size of the emissions
The greenhouse gas emissions associated with producing usable wood fibre from forests or discarded products are usually small compared to emissions associated with manufacturing, purchased electricity and transport emissions. In many cases, therefore, using the default cut-off criteria of 90%, it may be possible to exclude these emissions. If they are included, it is reasonable to estimate them using generic emission factors if company-specific information is not available.
The importance of cut-off criteria
Because of the small size of the emissions, cut-off criteria will be essential in deciding how many sources to include in the analysis. Past lifecycle and footprint studies have generally shown that non-transport emissions associated with wood procurement are small relative to emissions elsewhere in the value chain. Where these emissions are included, they usually include emissions associated with purchased electricity, steam and heat. given the small size of these emissions, it may not be necessary to include CH4, N2O and miscellaneous sources of emissions.
Multiple products
If the forests or processing facilities producing fibre produce more than one product (or produce co-products), greenhouse gas releases from the facilities will need to be allocated among the various outputs. This may be necessary, for instance, for facilities that separate different sources of recovered fibre or for forests that produce wood fuels as well as pulpwood. Emissions from harvesting might be allocated by identifying how harvested wood from different fellings is used. For instance, first fellings might be used for energy production, second fellings for fibre/paper production, and final fellings for a range of products including wood furniture, building materials, and even paper and paperboard – reflecting the use of wood product plant residuals at pulp mills. For these fellings different equipment is used, leading to different emissions which could be allocated to the appropriate products.
THE
TEN
TO
ES O
F C
ARB
ON
FO
OTP
RIN
T
toe 4greenhouse gas emissions associated with producing fibre
29
Natural changes
Forest management and harvesting may change from year to year, depending on natural causes, e.g. storms causing unintended felling of large amounts of trees so it may be necessary to average these emissions over several years.
Tracing raw material emissions
Pulp and paper mills may purchase bark and saw mill residues for their production processes and find it impossible to track back to a specific forest. generic estimates may be required in these cases. Some of these emissions may be from sources owned by the company developing the footprint. The remaining information may be available from the companies producing the fibre. In other cases, however it will be necessary to use generic information describing emissions associated with producing virgin and recovered fibre.
Allocation in systems involving product recycling
Where fibre inputs contain recovered fibre, a decision must be made on whether and how to allocate various lifecycle emissions between virgin and recycled fibres. There are several approaches for making these allocations. Useful references are ISO 14040:2006 and 14044:2006 and FEFCO European Database for Corrugated Board Life Cycle Studies (2006).
THE
TEN
TO
ES O
F C
ARB
ON
FO
OTP
RIN
T
30
introduCtion
The fifth item to address in a carbon footprint for paper and board products is the greenhouse gas emissions generated during the manufacturing of fuels and non-wood-based raw materials (e.g. chemicals and additives) used in manufacturing forest products. These include direct emissions and emissions associated with purchased electricity to manufacture these raw materials. Normally these emissions will be largely outside of the control of the manufacturer of the product described in the footprint. They can usually be included in balances sheets unless the balance sheet includes only emissions within the company’s control.
issues/disCussions
Size of the emissions
These emissions are usually much smaller than emissions from pulp and paper manufacturing, purchased electricity and transport. In many cases, therefore, it may be possible to exclude these from the analysis based on cut-off criteria. In some cases, however, it may be relevant to include raw materials that are used in large quantities (e.g. sodium hydroxide, calcium carbonate or calcium oxide) and feedstocks made of fossil fuels or requiring fossil fuels in manufacturing.This also suggests that there will often be little need to include greenhouse gases other than CO2 from fossil fuel combustion.
The importance of cut-off criteria
Cut-off criteria will be essential in deciding how many inputs to include in the analysis. In most cases, these inputs are not produced by the company developing the footprint. It may be possible to obtain the needed information (e.g. fuel types and consumption) from the companies selling the materials. In many other cases, however, it will be necessary to use generic information describing typical emissions associated with manufacturing these inputs. Past lifecycle and footprint studies may be helpful. Information on the emissions associated with producing fossil fuels is readily available from lifecycle databases.
THE
TEN
TO
ES O
F C
ARB
ON
FO
OTP
RIN
T
toe 5greenhouse gas emissions associated with producing other raw materials and fuels
31
introduCtion
The sixth item to address in a carbon footprint for paper and board products is the CO2 emissions associated with purchased electricity, steam and heat used at facilities that manufacture forest products, including chip mills, pulp mills, paper and paperboard mills and final manufacturing facilities (e.g. box plants). This includes electricity for pollution control equipment used to treat manufacturing-derived wastes and emissions. Emissions associated with electricity used at facilities that manufacture other inputs to manufacturing are included in Toe 5.
issues/disCussions
Fuel mix
CO2 emissions associated with purchased electricity, steam and heat vary greatly depending on the fuels and methods used to produce the energy. This has consequences for calculating a footprint since a paper producer will receive lower or higher emissions depending on the location of the production site even if the producer is purchasing the same amount of energy as a paper producer from another country or region. This is one of the reasons why it is often useful to divide emissions according to control. In recent years, it has become possible to buy electricity from specific sources, which will influence the emissions in this Toe.
Emission factors
There are large differences in emission factors for grid electricity based on the fuel mix of the electricity produced. In some cases, purchase contracts may specify emission factors or generation methods. Where specific information is not available, emission factors for the regional or national grid may be best. In other cases, it may be appropriate to use the European average emission factor for electricity produced. Some emission factors are based on the average fuels used to produce electricity while other are based on the fuels used to produce marginal electricity (e.g. to meet peak demands). In most cases, average factors are more appropriate for carbon footprints. Some factors include emissions associated with producing the fuel and others include emissions from power dissipated via transmission losses.
THE
TEN
TO
ES O
F C
ARB
ON
FO
OTP
RIN
T
toe 6greenhouse gas emissions associated with purchased and sold electricity, steam, heat and hot and cold water
32
Accounting for sales of electricity, steam, heat or hot or cold water.
There are three methods for adjusting carbon footprints to account for sales of electricity, steam or heat. One approach is to identify electricity, steam or heat sales as products or co-products and allocate emissions to them under Toe 3. Another approach especially suited to situations where sales are small is to deduct electricity sales from purchases in Toe 6 and estimate emissions for net purchases instead of total purchases. yet another approach is to estimate the avoided emissions associated with sales of electricity under Toe 10. If purchased electricity, steam or heat are used to make products other than the product for which the footprint is being prepared, one should use appropriate allocation methods. Care is warranted to ensure that emissions are not double counted.
Greenhouse gasses
Fossil fuel-derived CO2 emissions usually represent the large majority of greenhouse gas emissions associated with purchased electricity, steam and heat.
Combined heat and power
If the electricity or steam from a combined heat and power (CHP) system is sold (or purchased), the emissions from CHP systems will usually need to be allocated between the steam and electricity outputs so that the emissions attributable to manufacturing operations can be calculated. There are a number of methods for allocating emissions in CHP systems. (See, for instance, Annex B of the pulp and paper greenhouse gas calculation tools issued under the WRI/WBCSD gHg Protocol.)
Cutoff criteria
The combustion of fossil fuels and biomass fuels may release CH4 and N2O. These are relatively small compared to CO2 emissions but are included in many reporting protocols. They are sometimes included in emission factors for purchased electricity. The decision on whether to include them must be consistent with the intended use of the carbon footprint and the cut-off criteria used in the footprint. One can also decide to include transmission losses in the purchased energy if these can be calculated and are consistent with the intended use of the footprint.
THE
TEN
TO
ES O
F C
ARB
ON
FO
OTP
RIN
T
33
introduCtion
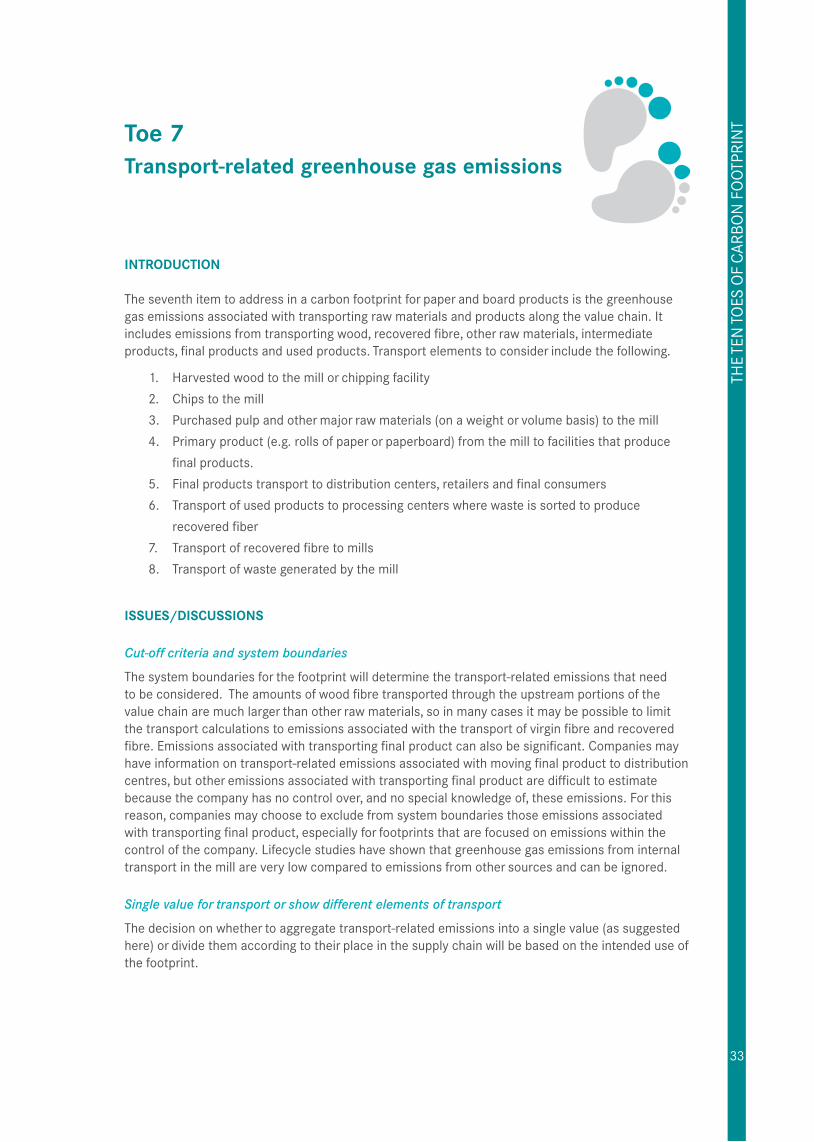
The seventh item to address in a carbon footprint for paper and board products is the greenhouse gas emissions associated with transporting raw materials and products along the value chain. It includes emissions from transporting wood, recovered fibre, other raw materials, intermediate products, final products and used products. Transport elements to consider include the following.
1. Harvested wood to the mill or chipping facility
2. Chips to the mill
3. Purchased pulp and other major raw materials (on a weight or volume basis) to the mill
4. Primary product (e.g. rolls of paper or paperboard) from the mill to facilities that produce
final products.
5. Final products transport to distribution centers, retailers and final consumers
6. Transport of used products to processing centers where waste is sorted to produce
recovered fiber
7. Transport of recovered fibre to mills
8. Transport of waste generated by the mill
issues/disCussions
Cut-off criteria and system boundaries
The system boundaries for the footprint will determine the transport-related emissions that need to be considered. The amounts of wood fibre transported through the upstream portions of the value chain are much larger than other raw materials, so in many cases it may be possible to limit the transport calculations to emissions associated with the transport of virgin fibre and recovered fibre. Emissions associated with transporting final product can also be significant. Companies may have information on transport-related emissions associated with moving final product to distribution centres, but other emissions associated with transporting final product are difficult to estimate because the company has no control over, and no special knowledge of, these emissions. For this reason, companies may choose to exclude from system boundaries those emissions associated with transporting final product, especially for footprints that are focused on emissions within the control of the company. Lifecycle studies have shown that greenhouse gas emissions from internal transport in the mill are very low compared to emissions from other sources and can be ignored.
Single value for transport or show different elements of transport
The decision on whether to aggregate transport-related emissions into a single value (as suggested here) or divide them according to their place in the supply chain will be based on the intended use of the footprint.
THE
TEN
TO
ES O
F C
ARB
ON
FO
OTP
RIN
Ttoe 7transport-related greenhouse gas emissions
34
Estimating the transport emissions
The estimation methods for transport emissions will vary depending on data availability. If the transport vehicles are owned by the company doing the footprint, it may be possible to estimate emissions based on fuel consumption. In most cases, however, estimates will be based on knowledge of (or assumptions about) the distances involved, the mode of transport and the expected emissions per kilometer. There are different types of emission factors for estimating transport-related emissions. The most accurate approach is to base the estimates on fuel consumption records. Lacking fuel consumption records, the best estimates are derived from detailed information on the modes of transport and distances travelled. In many cases, especially for transporting final products and for the end-of-life phase, it may be necessary to use generic information to estimate transport-related emissions.
Greenhouse gasses
CH4 and N2O emissions are normally much lower than CO2 emissions related to fossil fuel combustion in transport. These gases can be included, however, if they exceed the cutoff criteria and are needed to satisfy the intended use of the footprint.
THE
TEN
TO
ES O
F C
ARB
ON
FO
OTP
RIN
T
35
introduCtion
When one decides to expand the system boundaries, the eighth item to address in a carbon footprint for paper and board products is the emissions that occur when a product is used. These are very unusual for forest products and this is a key asset of forest products compared to for example electronic media. This is a reason to mention these as well in your footprint.
issues/disCussions
Clear definitions
It is extremely unusual for forest products to release greenhouse gases during use or to cause greenhouse gases to be released during use. Forest products, however, are frequently used to manufacture other products whose function is separately defined. This separate function may cause greenhouse gases to be released. In Toe 8, it is important to include only those emissions that are from products defined by a functional unit that itself results in greenhouse gas releases during use.
THE
TEN
TO
ES O
F C
ARB
ON
FO
OTP
RIN
Ttoe 8emissions associated with product use
36
introduCtion
When one decides to expand the system boundaries, the ninth item to address in a carbon footprint for paper and board products is emissions that occur after a product is used. They consist primarily of CH4 resulting from the anaerobic decomposition of forest products in landfills.
issues/disCussions
Uncertainty
The estimates for these emissions are inherently uncertain for many reasons:
The end-of-life conditions and emissions are highly site-specific.•The • product manufacturer has minimal control over, or special knowledge of, when and where a
product will be discarded.
The• most significant end-of-life emissions are CH4 emissions associated with discarded forest products in landfills but the use of landfills for waste management varies considerably from one region to another. In Europe, common legislation prohibits landfilling of degradable waste, but
the law has not yet reached full force (there are exemptions).
Emission • estimates for CH4 from landfills are greatly influenced by several parameters that also vary considerably from one region to another – in particular (a) the use of cover systems to collect and use as fuel or destroy CH4, and (b) degradation rates.
System boundaries
Because of the high uncertainty, the potential for distorted comparisons between footprints, and the almost complete lack of control by the product manufacturer, we propose for product footprints to construct system boundaries that exclude end-of-life. Where included, it will often be necessary to estimate these emissions using average data reflecting the regions where it is expected the product will be disposed. Alternatively, results can be developed for a number of different end-of-life options to show a range of possible effects. Certain end-of-life options may be precluded by public policies that, for instance, prohibit landfilling of certain wastes.
Waste policies
End-of-life emissions are inherently uncertain and vary enormously depending on public policies on waste management and site characteristics. As a result, including end-of-life emissions within system boundaries can result in large differences between products that are outside of the control of the producer.
THE
TEN
TO
ES O
F C
ARB
ON
FO
OTP
RIN
T
toe 9greenhouse gas emissions associated with producing other raw materials and fuels
37
Estimating emissions
Appendix I examines the methods for estimating CH4 emissions from landfills receiving used forest products.
Emissions from burning waste
Where used products are burned, the biogenic CO2 emissions from burning the biomass are carbon neutral and not included in greenhouse gas totals (but should be included under “additional information” and may be used to examine carbon sequestration along the value chain as explained in Appendix F). Other greenhouse gas emissions from burning used forest products (CH4 and N2O or CO2 liberated from calcium carbonate) are small compared to emissions associated with Toe 3 (manufacturing), Toe 6 (purchased electricity) and Toe 7 (transport), and can usually be ignored consistent with the default cut-off criteria of 90%.
Discard rate
The discard rates used to estimate emissions associated with used products at the end of life should be consistent with those used to characterize carbon stored in products. (See Toe 2 for additional discussion of carbon storage in landfills.)
Key message
What can be said however when discussing these emissions is the fact that a high percentage of recycling and a low rate of landfilling prevents CH4 emissions from taking place. As long as products are recycled, the majority of the carbon is stored in the product chain, extending carbon sequestration benefits. Burning with energy recovery, of course, can also be helpful from a greenhouse gas emissions standpoint.
THE
TEN
TO
ES O
F C
ARB
ON
FO
OTP
RIN
T
38
introduCtion
When one decides to expand the system boundaries, the tenth item to address in a carbon footprint for paper and board products is information on emissions that do not occur (i.e. are avoided) because of an attribute of the product or an activity of the company making the product.
The credibility of avoided emissions is directly dependent on the scenario used to describe what would have happened in the absence of the product attribute or company activity. There are an almost infinite number of possible avoided emissions so it is not possible to offer specific guidance.
While avoided emissions can be very useful in illustrating important connections to the climate change issue, their use in balance sheets can be controversial. The decision on whether to allow avoided emissions to be netted against other emissions in a balance sheet is primarily a policy issue that will be decided differently in different situations.
When using avoided emissions in a carbon footprint, it is important that the assumptions and methods be transparent and explainable to interested parties.
issues/disCussions
Examples
The least controversial avoided emissions are those that involve company activities that reduce emissions not controlled by the company. This is because avoided emissions may be the only way for a company to get “credit” for actions that reduce these emissions. Some avoided emissions of interest to the forest products industry include the following:
When• a mill exports electricity to the grid or heat to a local city, it may displace electricity from the grid or hot water that would have been produced by more greenhouse gas-intensive methods. Thus, these emissions are avoided by the mill’s activities. In producing this electricity, the mill’s emissions may have increased. The use of such avoided emissions should be transparently described, and depends on the purpose of the carbon footprint.
Several• national authorities have developed information to assist in calculating the greenhouse gas emissions avoided by recycling paper. The avoided emissions are extremely dependent on local conditions and are especially significant in situations where the paper would have been landfilled if it was not recycled. The avoided emissions will also depend on whether the alternative use of the used paper is burning for energy to displace fossil fuels for heat and electricity production.
Wood• -based building products reduce lifecycle greenhouse gas emissions compared to most other building materials when the comparisons involve structures with comparable heating and cooling requirements. Therefore, the use of wood for construction can be said to avoid greenhouse gas emissions compared to a scenario where more greenhouse gas-intensive materials are used.
THE
TEN
TO
ES O
F C
ARB
ON
FO
OTP
RIN
T
toe 10avoided emissions (optional)
39
If• mill waste materials are used as fertilizers, they may avoid the emissions associated with production of fertilizers that would have been used.
Burning• used products or waste materials as a source of biomass energy can avoid emissions associated with the fuels that would have been used otherwise.
If• a mill produces small amounts of co-products, they may avoid alternative production of these co-products
Using avoided emissions in balance sheets
Avoided emissions can be netted against other emissions only where it is consistent with the intended use of the footprint.
THE
TEN
TO
ES O
F C
ARB
ON
FO
OTP
RIN
T
40
additional information (optional):
There are many complex and important connections between the forest products industry and the climate change issue. Some of these are difficult or impossible to quantify. Nonetheless, it may be important for stakeholders to understand these connections. For this reason, this framework encourages providing additional information where appropriate.
Some examples of useful additional information might include the following:
The• forest products industry supports infrastructure that can be used to grow, collect and transport biomass for a range of uses that benefit the atmosphere.
The• industry continues to increase the efficiency with which it uses wood, making additional amounts available for other uses that benefit the atmosphere.
AD
DIT
ION
AL
INFO
RMAT
ION
41
the Carbon Footprint balance sheet
The balance sheet is that part of the footprint that includes emissions and sequestration that that can be quantified and logically added or subtracted. The decision to use footprint estimates in a balance sheet needs to be consistent with the intended use of the footprint. In addition to the intended use of the footprint, several other factors must be considered, including the following.
Only• emissions and sequestration within system boundaries should be included in a balance sheet.
It• is important that balance sheets for product-level carbon footprints communicated externally contain estimates in each Toe that are not limited to those emissions that the company controls. Doing so would result in balance sheets for a single product that varied greatly depending on where in the value chain the company preparing the footprint was located. Of course, if the footprint is company-level instead of product-level, and focuses on sources owned or controlled by the company, it may be appropriate to limit the footprint to such sources.
The• accuracy of the estimates should be adequate to meet the intended use of the footprint.
Companies• should be willing to document, and provide to stakeholders, the assumptions, methods and data used to develop estimates contained in balance sheets that are available to the public. In particular, companies should be prepared to explain the following.
The functional unit o (i.e. the unit of product for which the calculations were done, and the function of the product)
System boundaries o (including which sources and avoided emissions that are included and which greenhouse gases that are included)
Sources for emission factors and other datao
Calculation methodso
Main assumptions made o
Treatment of data gapso
The• special considerations involved in using estimates of biomass carbon sequestration in balance sheets are discussed in Appendix F.
Example formats for reporting the results of a carbon footprint for forest products shown in Appendix L may also be suitable as a balance sheet, but would include only those Toes whose estimates were suitable for use in a balance sheet.
THE
CA
RBO
N F
OO
TPRI
NT
BALA
NC
E SH
EET
42
glossary
The following material is taken from Annex I of the report of Working group I to the Fourth Assessment Report of the Intergovernmental Panel in Climate Change:
afforestationPlanting of new forests on lands that historically have not contained forests.
biomassThe total mass of living organisms in a given area or volume; dead plant material can be included as dead biomass.
Carbon cycleThe term used to describe the flow of carbon (in various forms, e.g., as carbon dioxide) through the atmosphere, ocean, terrestrial biosphere and lithosphere.
Carbon dioxide (Co2)A naturally occurring gas, also a by-product of burning fossil fuels from fossil carbon deposits, such as oil, gas and coal, of burning biomass and of land use changes and other industrial processes. It is the principal anthropogenic greenhouse gas that affects the Earth’s radiative balance. It is the reference gas against which other greenhouse gases are measured and therefore has a global Warming Potential of 1.
Co2-equivalentSee Equivalent carbon dioxide emission.
deforestationConversion of forest to non-forest.
equivalent carbon dioxide (Co2) emissionThe amount of carbon dioxide emission that would cause the same integrated radiative forcing, over a given time horizon, as an emitted amount of a well mixed greenhouse gas or a mixture of well mixed greenhouse gases. The equivalent carbon dioxide emission is obtained by multiplying the emission of a well mixed greenhouse gas by its global Warming Potential for the given time horizon. For a mix of greenhouse gases it is obtained by summing the equivalent carbon dioxide emissions of each gas. Equivalent carbon dioxide emission is a standard and useful metric for comparing emissions of different greenhouse gases but does not imply exact equivalence of the corresponding climate change responses.
global warming potential (gwp)An index, based upon radiative properties of well-mixed greenhouse gases, measuring the radiative forcing of a unit mass of a given well-mixed greenhouse gas in the present-day atmosphere integrated over a chosen time horizon, relative to that of carbon dioxide. The gWP represents the combined effect of the differing times these gases remain in the atmosphere and their relative effectiveness in absorbing outgoing thermal infrared radiation. The kyoto Protocol is based on gWPs from pulse emissions over a 100-year time frame.
greenhouse effectgreenhouse gases effectively absorb thermal infrared radiation, emitted by the Earth’s surface, by the atmosphere itself due to the same gases, and by clouds. Atmospheric radiation is emitted to all sides, including downward to the Earth’s surface. Thus, greenhouse gases trap heat within the surface-troposphere system. This is called the greenhouse effect.
gLO
SSA
Ry
43
greenhouse gas (ghg)greenhouse gases are those gaseous constituents of the atmosphere, both natural and anthropogenic, that absorb and emit radiation at specific wavelengths within the spectrum of thermal infrared radiation emitted by the Earth’s surface, the atmosphere itself, and by clouds. This property causes the greenhouse effect. Water vapour (H2O), carbon dioxide (CO2), nitrous oxide (N2O), methane (CH4) and ozone (O3) are the primary greenhouse gases in the Earth’s atmosphere.
reforestationPlanting of forests on lands that have previously contained forests but that have been converted to some other use.
sequestrationSee Uptake
sinkAny process, activity or mechanism that removes a greenhouse gas, an aerosol or a precursor of a greenhouse gas or aerosol from the atmosphere.
uptakeThe addition of a substance of concern to a reservoir. The uptake of carbon containing substances, in particular carbon dioxide, is often called (carbon) sequestration.
gLO
SSA
Ry