Embed Size (px)
Citation preview

© 2008 International Monetary Fund April 2008 IMF Country Report No. 08/145
March 27, 2008 January 29, 2001 January 29, 2001 April 18, 2008 January 29, 2001
France, Greece, Italy, Portugal, and Spain— Competitiveness in the Southern Euro Area
This cross-country paper covering France, Greece, Italy, Portugal, and Spain was prepared by a staff team of the International Monetary Fund as background documentation for the Article IV consultation with each of these member countries. It is based on the information available at the time it was completed on March 27, 2008. The views expressed in this document are those of the staff team and do not necessarily reflect the views of the governments of France, Greece, Italy, Portugal, and Spain or the Executive Board of the IMF. The policy of publication of staff reports and other documents by the IMF allows for the deletion of market-sensitive information.
Copies of this report are available to the public from
International Monetary Fund • Publication Services 700 19th Street, N.W. • Washington, D.C. 20431
Telephone: (202) 623-7430 • Telefax: (202) 623-7201 E-mail: [email protected] Internet: http://www.imf.org
Price: $18.00 a copy
International Monetary Fund
Washington, D.C.

INTERNATIONAL MONETARY FUND
FRANCE, GREECE, ITALY, PORTUGAL, AND SPAIN
Competitiveness in the Southern Euro Area
Prepared by Herman Bennett (MCM), Julio Escolano (EUR), Stefania Fabrizio (EUR), Eva Gutiérrez (EUR), Iryna Ivaschenko (EUR), Bogdan Lissovolik (EUR), Marialuz
Moreno-Badia (EUR), Werner Schule (EUR), Stephen Tokarick (RES), Yuan Xiao (EUR), and Ziga Zarnic (LICOS - KU Leuven)
Approved by the European Department
March 27, 2008
Contents Page
I. Competitiveness of the Southern euro area: a Helicopter Tour ............................................6 A. Overall Performance .................................................................................................7 B. Exports of Goods.......................................................................................................9 C. Exports of Services .................................................................................................13 D. Other Aspects of Competitiveness..........................................................................13
II. SEA-5 Exports: Wind in the Sails from Global Growth? ...................................................17 A. Introduction.............................................................................................................17 B. Are SEA-5’s Exports Benefiting from Higher Partner Growth? ............................18 C. Are SEA-5’s Exports Poised to Gain from Global Sectoral Export Trends? .........23 D. Conclusions.............................................................................................................25
III. Southern euro area five Countries: Trends in Value-Added..............................................30 A. Introduction.............................................................................................................30 B. Data and Methodology............................................................................................30 C. Result Number 1: The SEA-5 is Moving in the Right Direction but Slower Than Others.......................................................................................................................32 D. Result Number 2: Because of Slower Restructuring the SEA-5 May Be Missing Growth Opportunities ..............................................................................................36
IV. Are the Southern euro area Countries Advancing in the Search for New and Better Products?............................................................................................................................40
A. Introduction.............................................................................................................40 B. Did the Export Structure of SEA-5 Countries Evolve Over the Last Decade?.......41 C. Have the Product Quality and the Technological Intensity of Exports Increased? 43 D. Conclusions.............................................................................................................51
2
V. Are the Southern euro area’s Exports Moving to Markets with Less Competition? .........55 A. Introduction.............................................................................................................55 B. Where are the Exports Going, and Who are the Main Competitors?......................57 C. Is Competition Becoming Tougher? .......................................................................58 D. Are the SEA-5’s Exports Moving to Markets with Less Competition? .................60
VI. Services Exports in SEA-5: Performance and Restructuring ............................................69 A. Introduction.............................................................................................................69 B. Trade in Services Specialization and Performance in the SEA-5 Countries ..........70 C. Dynamic Sectors and Markets Services Exports ....................................................72 D. Exports of Travel Services......................................................................................74 E. Exports of High Value-Added Services ..................................................................75
VII. The Role of Imports—Structural Shifts and Economic Benefits .....................................78 A. Conclusions.............................................................................................................81
VIII. Outsourcing and Competitiveness in Southern Europe ..................................................88 A. Offshoring in Five European Countries: What Do the Data Say? ..........................89 B. Offshoring, Productivity, and Competitiveness ......................................................91 C. Conclusions .............................................................................................................96
IX. Role of Foreign Direct Investment in Boosting Productivity and Exports in the Southern euro area Economies ..........................................................................................................98
A. Introduction.............................................................................................................98 B. Recent Trends of FDI in SEA-5 Countries .............................................................98 C. Could FDI Help Productivity and Exports? A Sectoral Analysis ...........................99 D. Scope for Further Attracting FDI in the SEA-5 Economies .................................105 E. Conclusions ...........................................................................................................106
X. International Competitiveness: Looking at Direct Competitors .......................................109 A. Introduction...........................................................................................................109 B. The Evolution of REER ........................................................................................111 C. The Profile of Competitors....................................................................................112
Tables I.1. Growth Indicators, 1996–2006............................................................................................8 I.2. Selected Competitiveness-Related Indicators, 1996–2006. ................................................8 I.3. Selected Competitivenss-Related Indicators: The Last Global Economic Upswing (2001–
06) ......................................................................................................................................9 I.4. Change in Export Market Shares (Goods), 1996–2006.......................................................9 II.1. SEA-5 Relative Underexporting Ranking, 2005..............................................................20 II.2. Sectoral Specialization and Subsequent Growth..............................................................24 II.3. Determinants of Market Shares in Manufacturing in Large SEA-5 Countries and
Germany...........................................................................................................................24
3
II.4. Relationship Between Changes in Manufacturing Export Shares and World Growth, 1995–2005........................................................................................................................24
III.1. Dynamic Rankingof Sectors: Top 10 Sectors by Real Value-Added Growth................31 III.2. Technological Classification of Industries .....................................................................32 III.3. Restructuring and Response to Global Growth Opportunities .......................................37 IV.1. Diversification of Exports of Manufacturing Products, 1994–2005 ..............................43 IV.2. SEA-5 Countries: Does Quality Help Increase Competitiveness?.................................48 V.1. Southern euro area Five: Main Geographic Destinations of Exports, 1995–2005 ..........57 V.2. Top Competitors ..............................................................................................................58 V.3. Net Entry: Contribution to Changes of Market Concentration by Geographic
Destination, 1995 and 2004 .............................................................................................62 VII.1. Import Elasticities, 1973–2006 .....................................................................................78 VII.2. Where do imports come from?......................................................................................82 VIII.1. Measures of Offshoring: Imports of Business and Computer Services in EU-15
Countries, 2005................................................................................................................89 VIII.2. Growth of Trade in Business and Computer Services in EU-15 Countries,
1995–2003........................................................................................................................90 X.1. Net Appreciation Diffential Since 1998: the Aggregate Effect of DPA Including Exports
of Services......................................................................................................................110 X.2. The Structure of Competitors: Goods ............................................................................112 X.3. The Structure of Competitors: Services .........................................................................113 X.4. Main Competitors in 2005: Goods.................................................................................114 X.5. Main Competitors in 2005: Services..............................................................................114
Figures I.1. World Imports of Goods and Services ................................................................................7 I.2. Manufacturing Export in SEA-5 and Germany, 1995–2005.............................................11 I.3. Market Concentration and Relative Unit Values, 1995 and 2004.....................................12 I.4. Services Exports in SEA-5 and Germany: 1996–2005 .....................................................15 II.1. SEA-5 and Key Comparators, Export Indicators, 1996–2006.........................................19 II.2. Exports to 43 Dynamic Economies, 2000–05..................................................................20 II.3. Gaps with Fast Growers’ World Import Share Gains, 2000–05. .....................................21 II.4. Lagging Export Growth to Fast Growers, 2000–05.........................................................22 II.5. Share of China’s Imports .................................................................................................22 II.6. Average Annual U.S. Dollar Growth of World Trade in the Fastest Growing
Manufacturing Sectors .....................................................................................................23 II.7. Manufacturing Exports in SEA-5 and Germany, 1995–2005..........................................26 III.1. The Dynamic Content .....................................................................................................33 III.2. Index of Dynamism.........................................................................................................34 III.3. Technological Content ....................................................................................................35 III.4. The Index of Technological Intensity.............................................................................38 IV.1. Has the Structure of Exports of Manufacturing Products Changed?..............................42
4
IV.2. To What Extent SEA-5 Countries Have Experienced Technology Upgrading?............44 IV.3. Are SEA-5 Countries Upgrading the Quality of Their Exports? Relative to EU-15
Competititors ...................................................................................................................46 IV.4. Are SEA-5 Countries Upgrading the Quality of Their Exports? Relative to World
Competitors......................................................................................................................47 IV.5. Have SEA-5 Countries Increased the Quality of Their Export in Sectors with High
Potential? .........................................................................................................................49 IV.6. Have Exports Shifted to Higher Quality Products?........................................................50 IV.7. Quality of Discotinued Products Vis-à-vis Quality of New Products, 1994 and 2005 ..51 V.1. Share in World Exports of Goods, 1995–2005 ................................................................55 V.2. Geographic Diversification, 1995–2005..........................................................................57 V.3. Index of Export Similarity, 1995–2004 ...........................................................................58 V.4. Market Concentration, 1995–2005 ..................................................................................59 V.5. Market Shares, 1995–2005 ..............................................................................................59 V.6. Market Concentration and Relative Unit Values, 1995 and 2004 ...................................59 V.7. Contributions to Changes in Market Concentration, 1995 and 2004...............................60 V.8. Contributions to Changes in Market Concentration, 1995 and 2004...............................61 V.9. Contributions to Changes in Market Concentration by Technology Groups, 1995 and
2004..................................................................................................................................63 V.10. Contributions to Changes in Market Share, 1995 and 2004 ..........................................64 V.11. Contributions to Changes in Relative Unit Values, 1995 and 2004 ..............................65 VI.1. Specialization in Trade in Services ................................................................................71 VI.2. Services Exports in SEA-5 and Germany, 1996–2005...................................................73 VII.1. Opennes to Trade ..........................................................................................................83 VII.2. Product Structure of Imports by Technology................................................................84 VII.3. Intra-Industry Trade ......................................................................................................85 VII.4. Import Penetration and Labor Productivity...................................................................86 VIII.1. Relationship Between Offshoring Intensity and Competitiveness ..............................93 VIII.2. Relationship Between Offshoring Intensity and Total Factor Productivity (TFP)......94 IX.1. FDI Inflows.....................................................................................................................98 IX.2. Cumulative Inward FDI in Manufacturing...................................................................100 IX.3. Technological Content of FDI Inflows in Manufacturing............................................101 IX.4. FDI Inflows to Manufacturing Sectors .........................................................................103 IX.5. Service Sector FDI........................................................................................................104 IX.6. Policy Environment and FDI ........................................................................................107
5
Appendixes II.A. Definitions and Information Sources ..............................................................................28 Appendix IV.A.........................................................................................................................53 V.A. Data Sources and Definitions..........................................................................................67
References Chapter I References................................................................................................................16 Chapter II References ..............................................................................................................27 Chapter III References .............................................................................................................39 Chapter IV References.............................................................................................................52 Chapter V References ..............................................................................................................66 Chapter VI References.............................................................................................................77 Chapter VII References ...........................................................................................................87 Chapter VIII References ..........................................................................................................97 Chapter IX References...........................................................................................................108 Chapter X References ............................................................................................................115
6
I. COMPETITIVENESS OF THE SOUTHERN EURO AREA: A HELICOPTER TOUR1 2
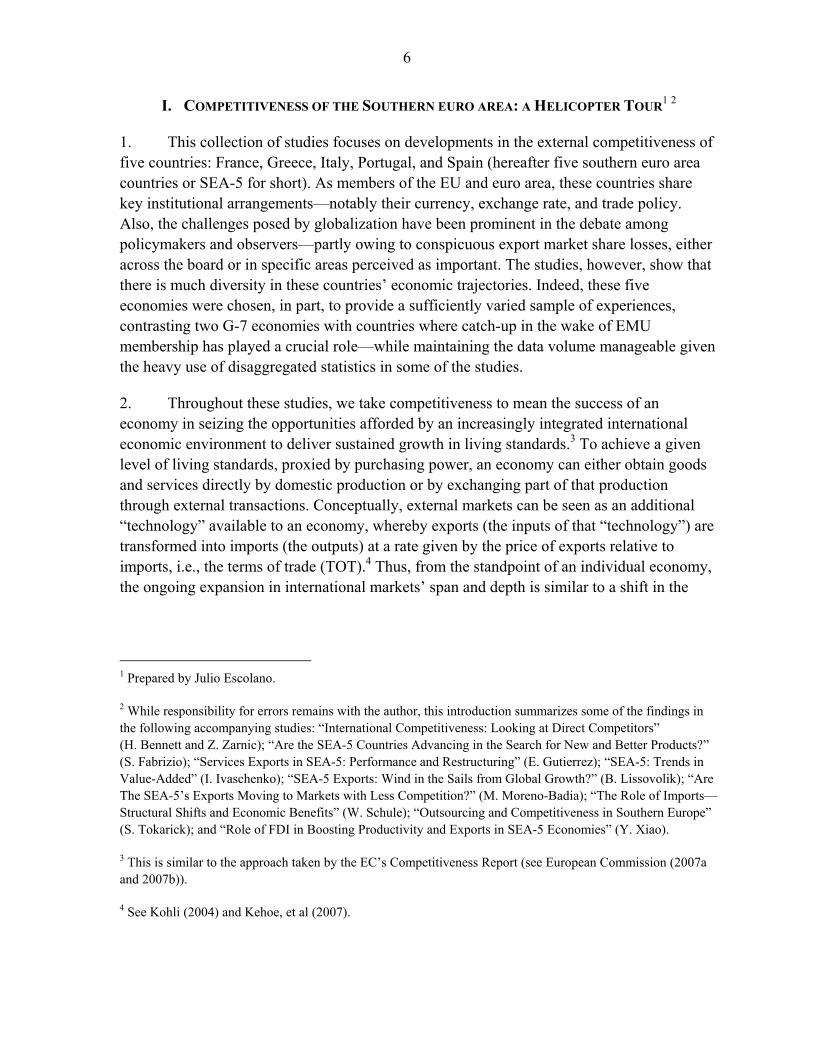
1. This collection of studies focuses on developments in the external competitiveness of five countries: France, Greece, Italy, Portugal, and Spain (hereafter five southern euro area countries or SEA-5 for short). As members of the EU and euro area, these countries share key institutional arrangements—notably their currency, exchange rate, and trade policy. Also, the challenges posed by globalization have been prominent in the debate among policymakers and observers—partly owing to conspicuous export market share losses, either across the board or in specific areas perceived as important. The studies, however, show that there is much diversity in these countries’ economic trajectories. Indeed, these five economies were chosen, in part, to provide a sufficiently varied sample of experiences, contrasting two G-7 economies with countries where catch-up in the wake of EMU membership has played a crucial role—while maintaining the data volume manageable given the heavy use of disaggregated statistics in some of the studies.
2. Throughout these studies, we take competitiveness to mean the success of an economy in seizing the opportunities afforded by an increasingly integrated international economic environment to deliver sustained growth in living standards.3 To achieve a given level of living standards, proxied by purchasing power, an economy can either obtain goods and services directly by domestic production or by exchanging part of that production through external transactions. Conceptually, external markets can be seen as an additional “technology” available to an economy, whereby exports (the inputs of that “technology”) are transformed into imports (the outputs) at a rate given by the price of exports relative to imports, i.e., the terms of trade (TOT).4 Thus, from the standpoint of an individual economy, the ongoing expansion in international markets’ span and depth is similar to a shift in the
1 Prepared by Julio Escolano.
2 While responsibility for errors remains with the author, this introduction summarizes some of the findings in the following accompanying studies: “International Competitiveness: Looking at Direct Competitors” (H. Bennett and Z. Zarnic); “Are the SEA-5 Countries Advancing in the Search for New and Better Products?” (S. Fabrizio); “Services Exports in SEA-5: Performance and Restructuring” (E. Gutierrez); “SEA-5: Trends in Value-Added” (I. Ivaschenko); “SEA-5 Exports: Wind in the Sails from Global Growth?” (B. Lissovolik); “Are The SEA-5’s Exports Moving to Markets with Less Competition?” (M. Moreno-Badia); “The Role of Imports—Structural Shifts and Economic Benefits” (W. Schule); “Outsourcing and Competitiveness in Southern Europe” (S. Tokarick); and “Role of FDI in Boosting Productivity and Exports in SEA-5 Economies” (Y. Xiao).
3 This is similar to the approach taken by the EC’s Competitiveness Report (see European Commission (2007a and 2007b)).
4 See Kohli (2004) and Kehoe, et al (2007).
7
frontier of available productive technologies.5 Also, in practice, the economic processes associated with adopting new technologies and with increasing participation in international markets are essentially the same: redeployment of resources across firms and sectors, restructuring of production and distribution chains, product innovation and quality upgrading, R&D and investment (including FDI), market development, etc. In this light, the ultimate test of competitiveness is productivity corrected for TOT effects6—over the long term, it closely tracks income per capita and other measures of living standards. Specifically, TOT-adjusted total factor productivity (TFP) is particularly pertinent to competitiveness as it epitomizes the efficiency of an economy in obtaining goods and services in a globalized world with its given resources.
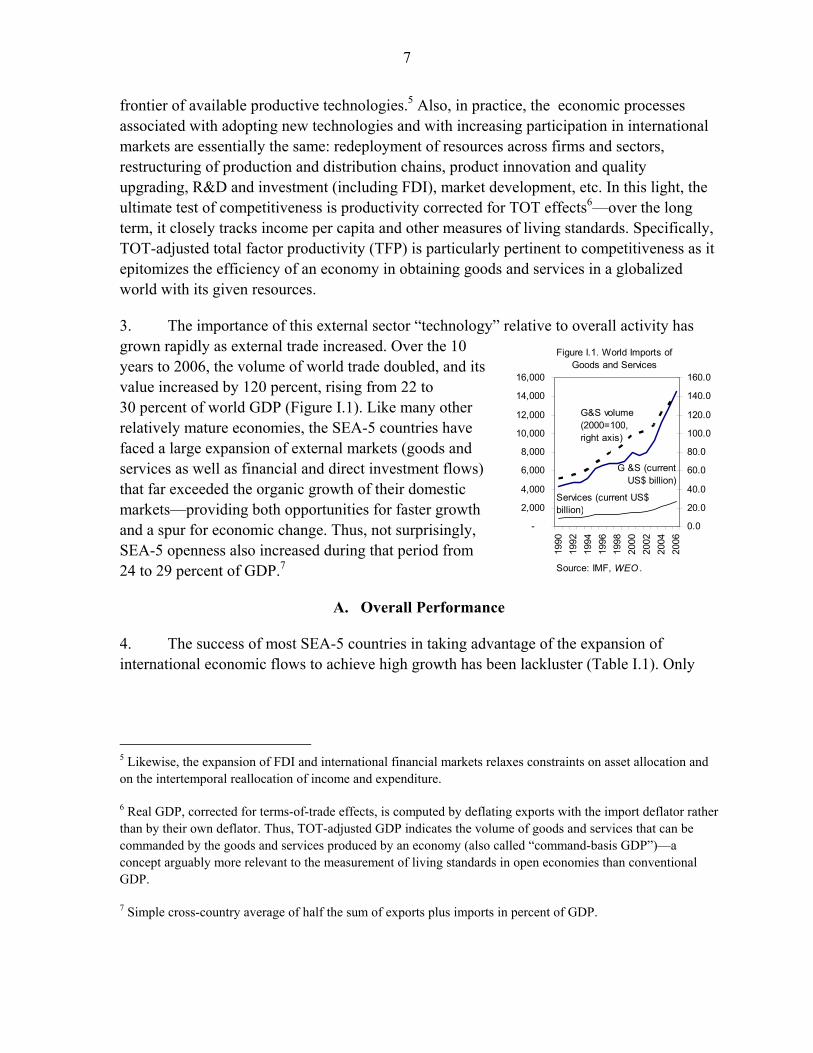
3. The importance of this external sector “technology” relative to overall activity has grown rapidly as external trade increased. Over the 10 years to 2006, the volume of world trade doubled, and its value increased by 120 percent, rising from 22 to 30 percent of world GDP (Figure I.1). Like many other relatively mature economies, the SEA-5 countries have faced a large expansion of external markets (goods and services as well as financial and direct investment flows) that far exceeded the organic growth of their domestic markets—providing both opportunities for faster growth and a spur for economic change. Thus, not surprisingly, SEA-5 openness also increased during that period from 24 to 29 percent of GDP.7
A. Overall Performance
4. The success of most SEA-5 countries in taking advantage of the expansion of international economic flows to achieve high growth has been lackluster (Table I.1). Only
5 Likewise, the expansion of FDI and international financial markets relaxes constraints on asset allocation and on the intertemporal reallocation of income and expenditure.
6 Real GDP, corrected for terms-of-trade effects, is computed by deflating exports with the import deflator rather than by their own deflator. Thus, TOT-adjusted GDP indicates the volume of goods and services that can be commanded by the goods and services produced by an economy (also called “command-basis GDP”)—a concept arguably more relevant to the measurement of living standards in open economies than conventional GDP.
7 Simple cross-country average of half the sum of exports plus imports in percent of GDP.
-
2,000
4,000
6,000
8,000
10,000
12,000
14,000
16,000
1990
1992
1994
1996
1998
2000
2002
2004
2006
0.0
20.0
40.0
60.0
80.0
100.0
120.0
140.0
160.0
G &S (current US$ billion)
G&S volume (2000=100, right axis)
Services (current US$ billion)
Figure I.1. World Imports of Goods and Services
Source: IMF, WEO .
8
Greece has experienced robust per capita growth underpinned by commensurable productivity gains.8 Spain’s significant GDP per capita growth stems mainly from an upward shift in the occupation rate (which must stabilize in the medium term) rather than from productivity growth, which—despite some recent acceleration—remains low.9 Other SEA-5 economies experienced lower real GDP per capita growth, below the U.S., U.K., or Canada, rooted in poor labor productivity and TFP growth.
5. Aggregate competitiveness indicators point to substantial export market share losses in some SEA-5 countries (France, Italy, and Portugal) compared to peer economies. In contrast, Greece and, to a lesser extent, Spain performed relatively well (Tables I.2 and I.3). Over the past 10–15 years, the entry of new global markets participants resulted in a substantial reduction in the export market shares of advanced economies, notably in the markets for goods (Table I.4).10 Thus, during 1996–2006, the OECD’s export share in goods and services world trade declined by about 11 percent (13 percent in goods and 1 percent in services)—the euro area experienced similar market share losses. In this context, France and Italy had lower export 8 The national accounts statistics referring to Greece in this and accompanying papers are based on data available before the revisions announced by the National Statistical Service of Greece on October 2007.
9 See Escolano (2006).
10 Export growth and export market shares are widely used, including here, as a measure of success in external markets (ECB, 2005). These indicators, however, have limitations in the presence of regional trade expansion and changing trade patterns (see Bennett, 2008).
Real GDP Real GDP Labor Total factorper capita per capita productivity productivity
adjusted for adjusted for adjusted forterms of trade terms of trade terms of trade
France 1.8 1.9 1.3 0.9Greece 3.6 3.7 3.0 2.2Italy 1.1 1.0 0.1 0.1Portugal 1.4 1.2 0.9 0.0Spain 2.6 2.8 0.2 0.1
euro area 1.7 1.5 0.6 0.4Germany 1.3 1.0 0.8 0.7United Kingdom 2.3 2.6 2.1 1.5United States 2.2 2.2 1.9 1.3Canada 2.5 3.1 1.9 1.8
Sources: AMECO; OECD; and IMF staff estimates.
Table I.1. Growth Indicators, 1996–2006(Average annual change in percent)
Terms of tradeG & S Goods Services G & S Goods Services (G & S) 3/
France -25.0 -23.3 -30.5 5.1 5.5 3.5 1.8Greece 3.4 -36.0 68.0 8.5 3.7 13.0 3.8Italy -26.4 -25.0 -31.1 4.9 5.3 3.4 -3.0Portugal -14.3 -21.6 13.1 6.5 5.8 8.7 -5.1Spain -0.4 -6.0 17.5 8.1 7.7 9.1 4.5
OECD -11.1 -13.4 -0.8 6.9 6.8 7.2 -1.7Industrial economies -13.8 -16.8 -0.6 6.6 6.4 7.3 -2.6euro area -10.7 -12.8 -1.2 7.0 6.9 7.2 -3.0Germany -1.4 -2.7 2.8 8.0 8.1 7.6 -6.2United Kingdom -11.9 -22.9 25.1 6.8 5.6 9.8 7.9United States -22.7 -25.3 -13.0 5.4 5.3 5.8 -1.1Canada -10.5 -12.6 -0.1 7.0 6.9 7.3 13.6Japan -28.7 -31.3 -14.6 4.6 4.4 5.6 -17.0World imports ... ... ... 8.2 8.4 7.3 ...
Sources: IMF, WEO ; OECD; and AMECO.1/ Change in percent of initial value. Nominal exports as percent of world imports.2/ Annual percentage change of nominal value in U.S. dollars.3/ Exports' deflator relative to that of imports. Change in percent of initial value.
Table I.2. Selected Competitiveness-Related Indicators, 1996–2006
World export market share 1/ Export growth 2/
9
growth and sustained substantially larger market share losses, in both goods and services, than the OECD or euro area. More detailed analysis in subsequent chapters indicates that these share losses were fairly generalized across manufacturing branches, tourism, and travel, and in the case of France, also business services. Portugal sustained significant losses in manufactures (notably textiles and apparel) only partly mitigated by gains in services. In contrast, Spain was less specialized in the highly contested sectors of textiles, clothes, and apparel, and sustained relatively lower losses in manufactures (which were concentrated in the key car sector) while substantially increasing its share in services. During the 1990s, Greece drastically shifted its export structure away from textile and clothing sectors, in which it sustained significant share losses, and towards transport and tourism—resulting in a remarkable 68 percent market share increase in services. Later, during the recent global economic upswing after 2001, Greece was able to increase its market share of both goods and services (Table I.3).11
B. Exports of Goods
6. Goods export share losses appear associated with less SEA-5’s flexibility relative to peers in the face of changing global trade patterns. With the exception of France, SEA-5 countries started off with an adverse manufacturing export specialization—subsequent performance in the different dimensions (sectoral, geographical, technological), analyzed in the accompanying studies, varies across countries. But overall, SEA-5 economies have been
11 During this later period, however, Greece experienced a small loss of share in the combined goods and services export market. This apparently paradoxical result is due to the high weight of Greece’s exports of services relative to goods—while the latter make up most of world exports and were the fastest growing sector.
Table I.4. Change in Export Market Shares(Goods), 1996–2006
ImportsWorld Industrial- EU-country
country
France -23.5 -23.2 -21.2Greece -15.3 -14.9 -23.2Italy -23.0 -20.7 -21.1Portugal -20.8 -24.3 -20.5Spain -5.2 -4.3 -1.7
Industrial countries -18.6 -10.8 -14.4Belgium/Luxembourg 0.9 9.7 9.4Germany -3.7 1.7 -3.2Netherlands 6.8 13.1 12.6United Kingdom -29.7 -26.4 -24.2United States -33.9 -35.2 -34.2Canada -18.9 -23.0 -12.7Japan -32.4 -42.1 -38.8Asia excluding Japan 31.6 33.6 24.7
Source: IMF, Direction of Trade Statistics.
Note: Differences in methodology and compilationsystems result in discrepancies with nationalaccounts-based data shown in other tables, e.g., TablesI.2 and I.3.
(Percent of initial 1996 share, shares in current prices)(2001–06)
Terms of tradeG & S Goods Services G & S Goods Services (G & S) 3/
France -15.4 -14.8 -17.0 9.9 10.5 7.5 2.0Greece -1.7 1.6 4.1 13.2 14.4 12.5 4.1Italy -9.5 -11.9 1.5 11.3 11.2 12.0 2.5Portugal -4.2 -7.7 9.1 12.6 12.2 13.6 -3.2Spain -1.5 -4.6 9.8 13.2 13.0 13.7 4.2
OECD -7.7 -9.5 0.2 11.8 11.8 11.7 0.0Industrial economies -8.6 -10.7 0.5 11.5 11.5 11.7 -0.9euro area -3.5 -5.2 4.3 12.8 12.8 12.5 -0.7Germany 5.7 3.9 13.3 14.9 14.9 14.4 -1.3United Kingdom -8.5 -14.2 9.5 11.6 10.6 13.7 3.3United States -23.9 -26.2 -14.7 7.5 7.3 8.1 -4.6Canada -21.4 -23.4 -11.8 8.2 8.1 8.9 14.7Japan -13.4 -16.8 5.1 10.3 9.9 12.7 -8.8World imports ... ... ... 13.6 14.1 11.6 ...
Sources: IMF, WEO ; OECD; and AMECO.1/ Change in percent of initial value. Nominal exports as percent of world imports.2/ Annual percentage change of nominal value in U.S. dollars.3/ Exports' deflator relative to that of imports. Change in percent of initial value.
Table I.3. Selected Competitiveness-Releted Indicators: The Last Global Economic Upswing
World Export market share 1/ Export growth 2/
10
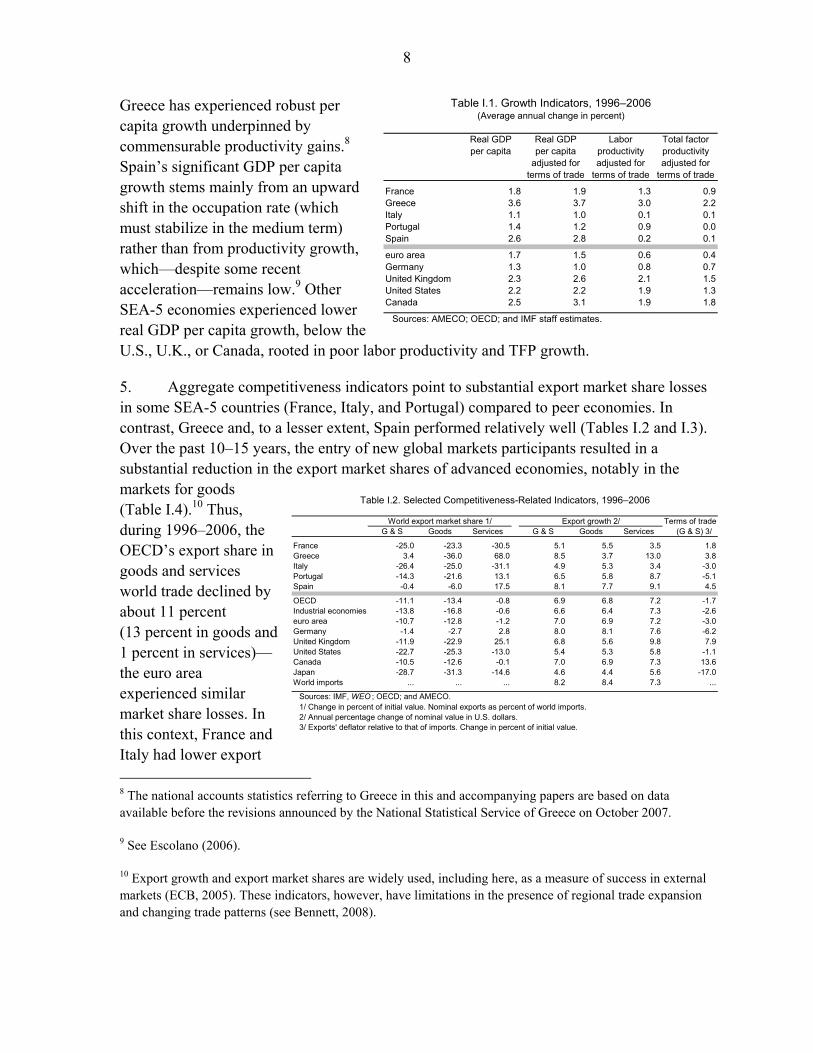
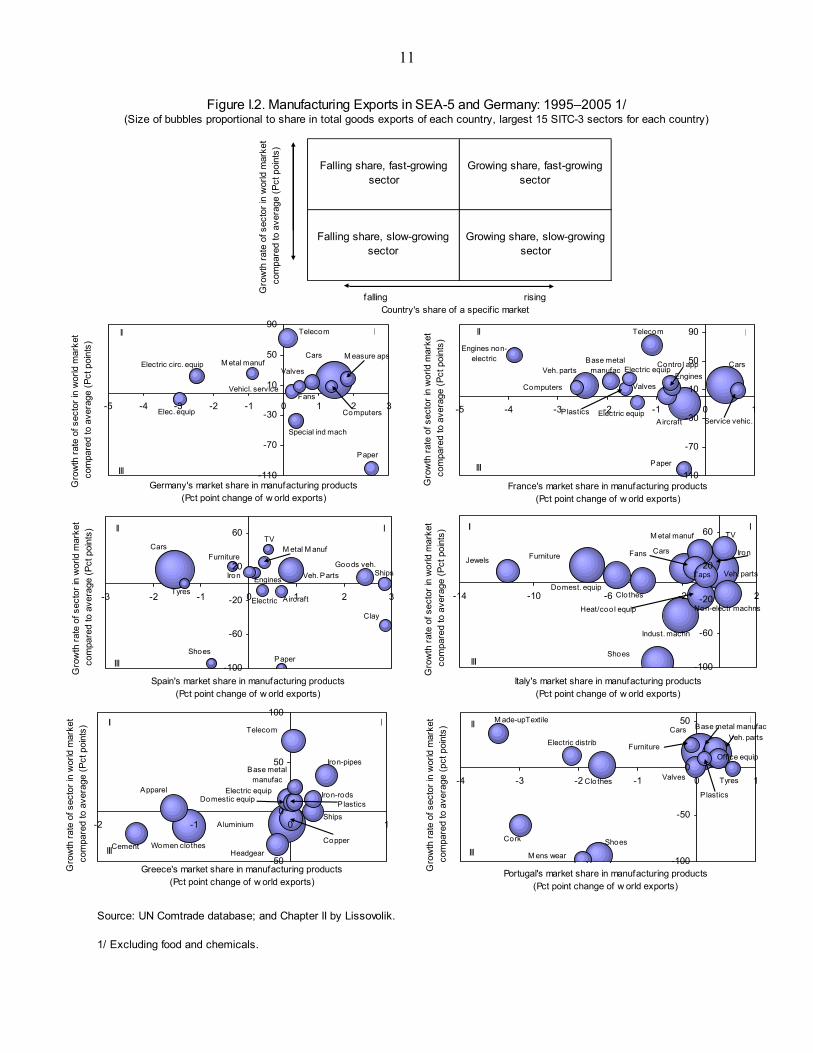
slower than relevant comparator groups (e.g., EU, OECD, or key trade partners) in redirecting activity and exports to fast-growing markets.12 Specifically, the export shares of France, Italy, and Portugal declined particularly in some of their largest and world’s fastest-growing export sectors, in contrast to Germany or Spain (Figure I.2). Regarding the geography of export markets, Spain, Portugal and France have been slower than the EU or OECD in redirecting their exports towards emerging Asia and eastern Europe. Overall, SEA-5 countries have a lower geographical diversification than Germany or the world average—particularly Portugal and Spain, whose exports remain concentrated in the EU-12. Other aspects, such as offshoring and inward FDI, which evidence suggests tend to support competitiveness, also lagged in the SEA-5.
7. SEA-5 countries faced high competition pressure in their goods export markets, which has generally increased—although often it increased less than for peer economies. Disaggregated product-level data13 show that exporters from SEA-5 countries operate in markets with more intense competition levels (measured by the reciprocal of the degree of concentration) than the world average or Germany—particularly Portugal, Greece, and Italy, partly reflecting the weight of textile, apparel, leather, and related exports. Moreover, the effective14 level of competition faced by SEA-5 exporters, except Greece, has risen during 1995–2005. This trend was shared by peer economies (Germany, U.K.) and by the world average. However, the increase in the level of competition faced by Spain and Portugal (and for Italy in the first half of the period) has been less pronounced than for the world average, Germany, or the U.K. Greece even reduced the overall level of competition it faced, partly owing to growing presence in southeast Europe markets. The increase in competition has been mainly driven by nonmanufacturing and low-tech manufacturing goods, while higher technology exports tended to palliate the increase in overall competition faced.
8. Analyses of SEA-5’s nonprice competitiveness dynamics—such as gaining “niche” markets and enhancing product quality—indicate some success (particularly in the case of Italy) and highlight the importance of flexible redirection of resources within and across exports. The analysis of export unit values by product relative to other world market
12 Rae and Sollie (2007) reach similar conclusions using a different methodology than the one employed in Chapter II by Lissovolik. Based on an analysis of revealed comparative advantage, it also documents the increased competition from emerging economies faced by southern European countries, particularly by Italy, Greece, and Portugal; and the weak (sometimes negative) correlation between SEA-5 exports and high-growth markets.
13 Goods, by product and destination country based on six-digit COMTRADE export data.
14 Weighted by the value of exports to each market.
11
Falling share, fast-growing sector
Growing share, fast-growing sector
Falling share, slow-growing sector
Growing share, slow-growing sector
Figure I.2. Manufacturing Exports in SEA-5 and Germany: 1995–2005 1/(Size of bubbles proportional to share in total goods exports of each country, largest 15 SITC-3 sectors for each country)
Cars
Telecom
M easure apsElectric circ. equip
Computers
Special ind mach
Valves
Elec. equip
Paper
M etal manuf
Vehicl. service Fans
-110
-70
-30
10
50
90
-5 -4 -3 -2 -1 0 1 2 3
Germany's market share in manufacturing products(Pct point change of w orld exports)
III
III
Gro
wth
rate
of s
ecto
r in
wor
ld m
arke
t co
mpa
red
to a
vera
ge (P
ct p
oint
s)
Cars
Aircraft
Veh. parts
Telecom
Valves
Electric equipEngines
Paper
Engines non-electric
Contro l app
Service vehic.Electric equipPlastics
Base metal manufac
Computers
-110
-70
-30
10
50
90
-5 -4 -3 -2 -1 0 1
France's market share in manufacturing products(Pct point change of w orld exports)
III
III
Gro
wth
rate
of s
ecto
r in
wor
ld m
arke
t co
mpa
red
to a
vera
ge (P
ct p
oint
s)
Tyres
Furniture
TV
PaperShoes
M etal M anuf
Electric
EnginesIron
Clay
Aircraft
ShipsGoods veh.
Veh. Parts
Cars
-100
-60
-20
20
60
-3 -2 -1 0 1 2 3
Spain's market share in manufacturing products(Pct point change of w orld exports)
III
III
Gro
wth
rate
of s
ecto
r in
wor
ld m
arke
t co
mpa
red
to a
vera
ge (P
ct p
oint
s)
FansJewels
TV
Taps
Iron
Clothes
Non-electr machnsHeat/coo l equip
Domest. equip
Cars
M etal manuf
Shoes
Indust. machn
Furniture
Veh. parts
-100
-60
-20
20
60
-14 -10 -6 -2 2
Italy's market share in manufacturing products(Pct point change of w orld exports)
III
III
Gro
wth
rate
of s
ecto
r in
wor
ld m
arke
t co
mpa
red
to a
vera
ge (P
ct p
oint
s)
A luminium
Women clothes
Apparel
Telecom
CopperCement
Headgear
Iron-pipes
Electric equip
Ships
Domestic equipPlastics
Iron-rods
Base metal manufac
-50
0
50
100
-2 -1 0 1
Greece's market share in manufacturing products(Pct point change of w orld exports)
I
III
II
Gro
wth
rate
of s
ecto
r in
wor
ld m
arke
t co
mpa
red
to a
vera
ge (P
ct p
oint
s)
P lastics
Base metal manufac
Tyres
M ens wear
Electric distrib
M ade-upTextile
Office equip
Valves
Furniture
Cork
Clo thes
Shoes
Veh. parts Cars
-100
-50
0
50
-4 -3 -2 -1 0 1
Portugal's market share in manufacturing products (Pct point change of w orld exports)
III
III
Gro
wth
rate
of s
ecto
r in
wor
ld m
arke
t co
mpa
red
to a
vera
ge (p
ct p
oint
s)
Source: UN Comtrade database; and Chapter II by Lissovolik.
1/ Excluding food and chemicals.
falling risingCountry's share of a specif ic market
Gro
wth
rate
of s
ecto
r in
wor
ld m
arke
t co
mpa
red
to a
vera
ge (P
ct p
oint
s)
12
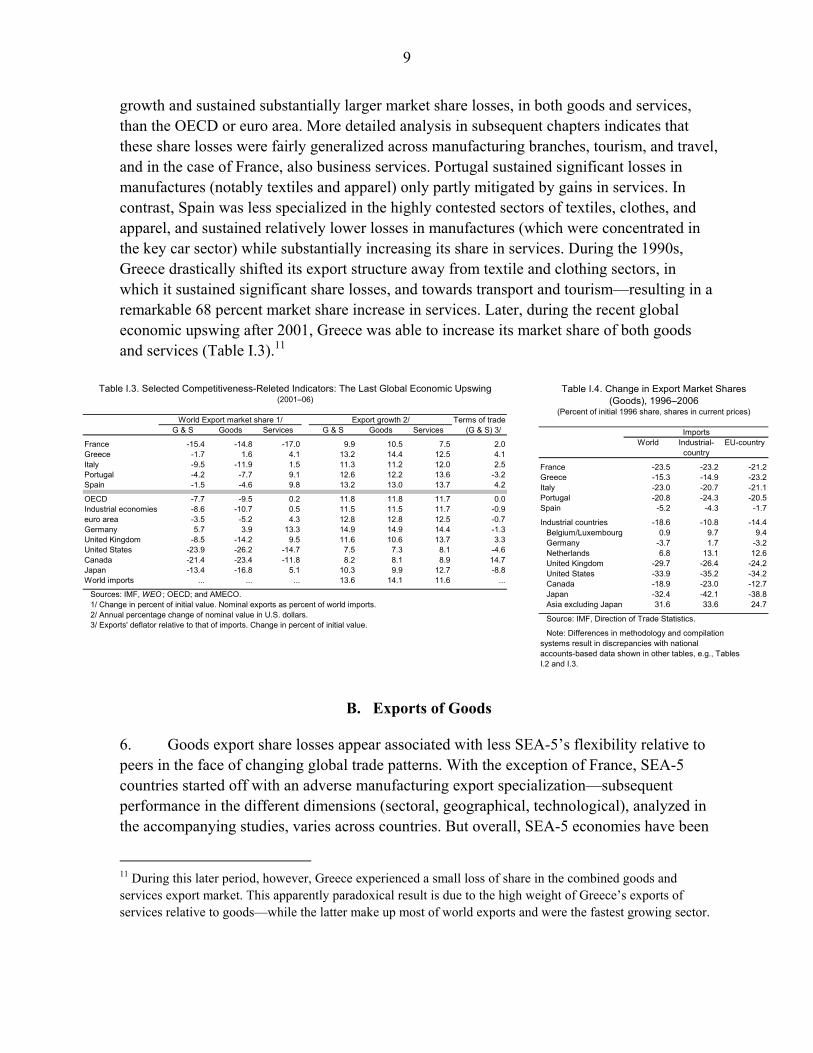
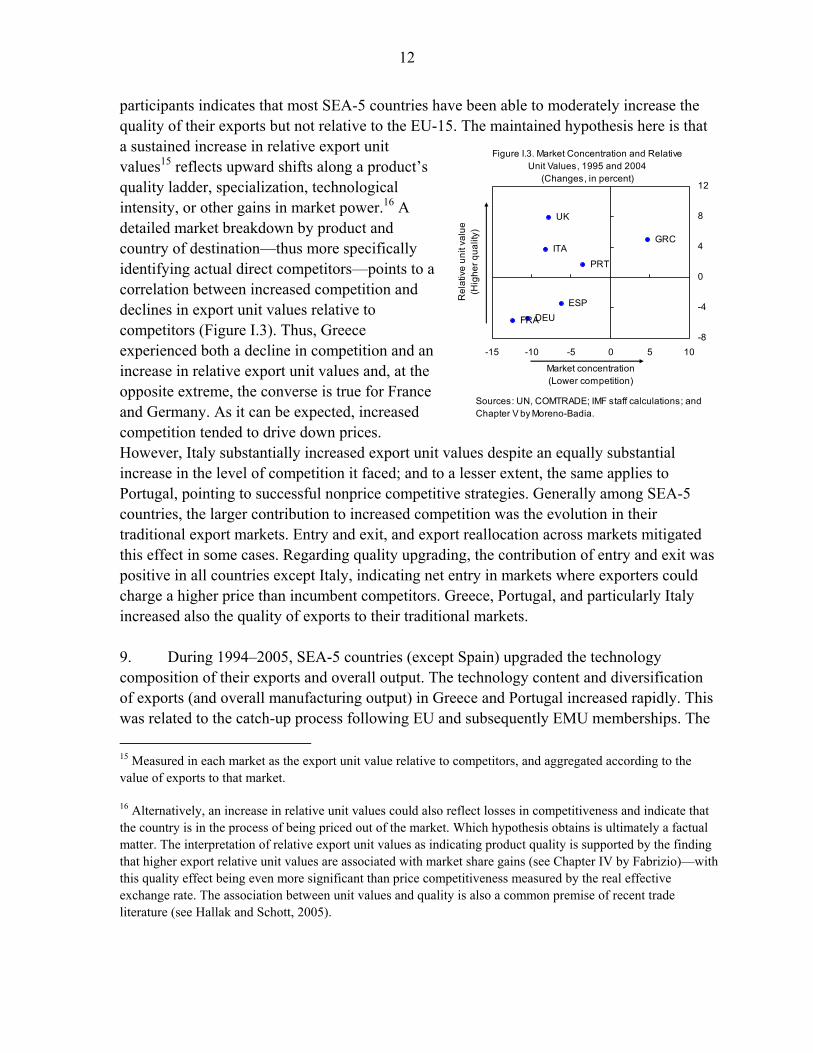
participants indicates that most SEA-5 countries have been able to moderately increase the quality of their exports but not relative to the EU-15. The maintained hypothesis here is that a sustained increase in relative export unit values15 reflects upward shifts along a product’s quality ladder, specialization, technological intensity, or other gains in market power.16 A detailed market breakdown by product and country of destination—thus more specifically identifying actual direct competitors—points to a correlation between increased competition and declines in export unit values relative to competitors (Figure I.3). Thus, Greece experienced both a decline in competition and an increase in relative export unit values and, at the opposite extreme, the converse is true for France and Germany. As it can be expected, increased competition tended to drive down prices. However, Italy substantially increased export unit values despite an equally substantial increase in the level of competition it faced; and to a lesser extent, the same applies to Portugal, pointing to successful nonprice competitive strategies. Generally among SEA-5 countries, the larger contribution to increased competition was the evolution in their traditional export markets. Entry and exit, and export reallocation across markets mitigated this effect in some cases. Regarding quality upgrading, the contribution of entry and exit was positive in all countries except Italy, indicating net entry in markets where exporters could charge a higher price than incumbent competitors. Greece, Portugal, and particularly Italy increased also the quality of exports to their traditional markets. 9. During 1994–2005, SEA-5 countries (except Spain) upgraded the technology composition of their exports and overall output. The technology content and diversification of exports (and overall manufacturing output) in Greece and Portugal increased rapidly. This was related to the catch-up process following EU and subsequently EMU memberships. The 15 Measured in each market as the export unit value relative to competitors, and aggregated according to the value of exports to that market.
16 Alternatively, an increase in relative unit values could also reflect losses in competitiveness and indicate that the country is in the process of being priced out of the market. Which hypothesis obtains is ultimately a factual matter. The interpretation of relative export unit values as indicating product quality is supported by the finding that higher export relative unit values are associated with market share gains (see Chapter IV by Fabrizio)—with this quality effect being even more significant than price competitiveness measured by the real effective exchange rate. The association between unit values and quality is also a common premise of recent trade literature (see Hallak and Schott, 2005).
Figure I.3. Market Concentration and Relative Unit Values, 1995 and 2004
(Changes, in percent)
FRADEU
GRCITA
PRT
ESP
UK
-8
-4
0
4
8
12
-15 -10 -5 0 5 10
Market concentration(Lower competition)
Rel
ativ
e un
it va
lue
(Hig
her q
ualit
y)
Sources: UN, COMTRADE; IMF staff calculations; and Chapter V by Moreno-Badia.
13
technology and diversification indices for Spain, however, did not materially change, which appears linked to weak investment in manufacturing for most of the period. Changes in France and Italy paralleled the evolution of the EU-12.
C. Exports of Services
10. Services exports strongly enhanced the competitiveness of Greece, Spain, and Portugal with substantial gains in export revenue, market share, and TOT—in contrast to Italy and France, which performed poorly in this area. Sustained TOT gains (Table I.2) were often made possible by the idiosyncratic features of services markets. First, demand for travel and tourism (key for SEA-5 countries), and other services exhibits high income elasticity as reflected in the services’ increasing share of spending in OECD countries (the main destination of SEA-5 services exports). And second, on the supply side, productivity growth was lower in services than in manufacturing and competition from low-cost competitors more limited. Greece, in addition, expanded its exports of maritime and other transport services by an impressive 76 percent in a market boosted by booming world trade.
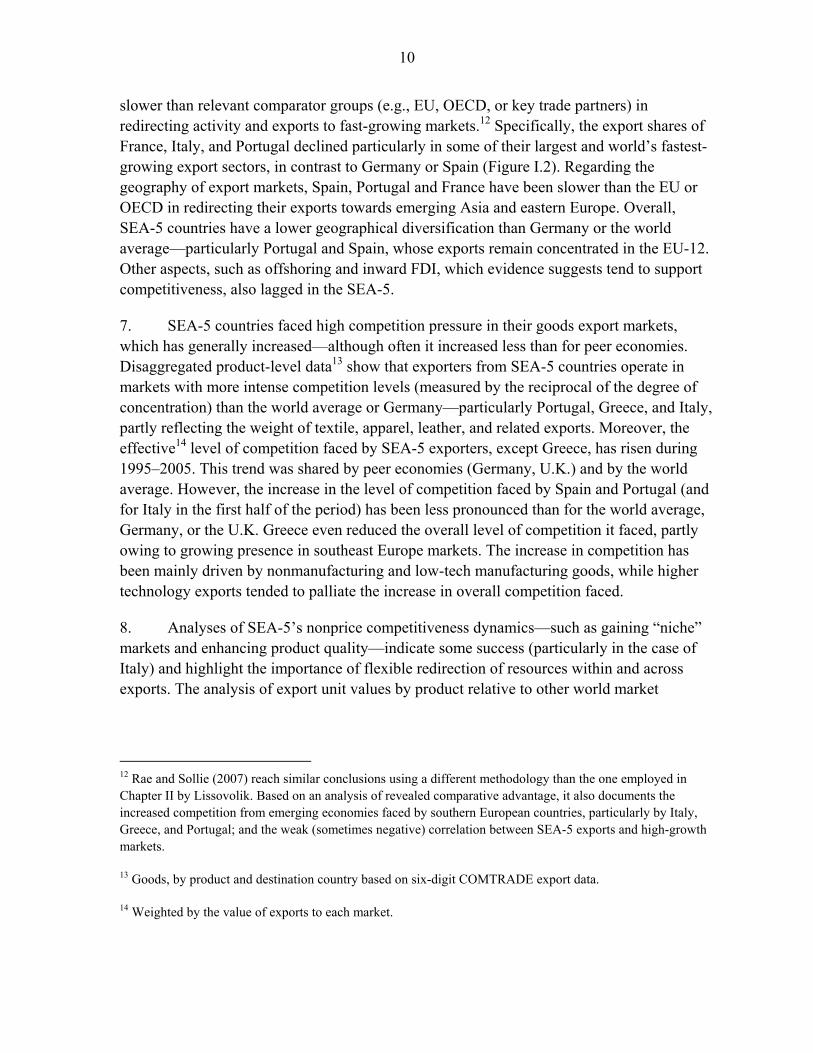
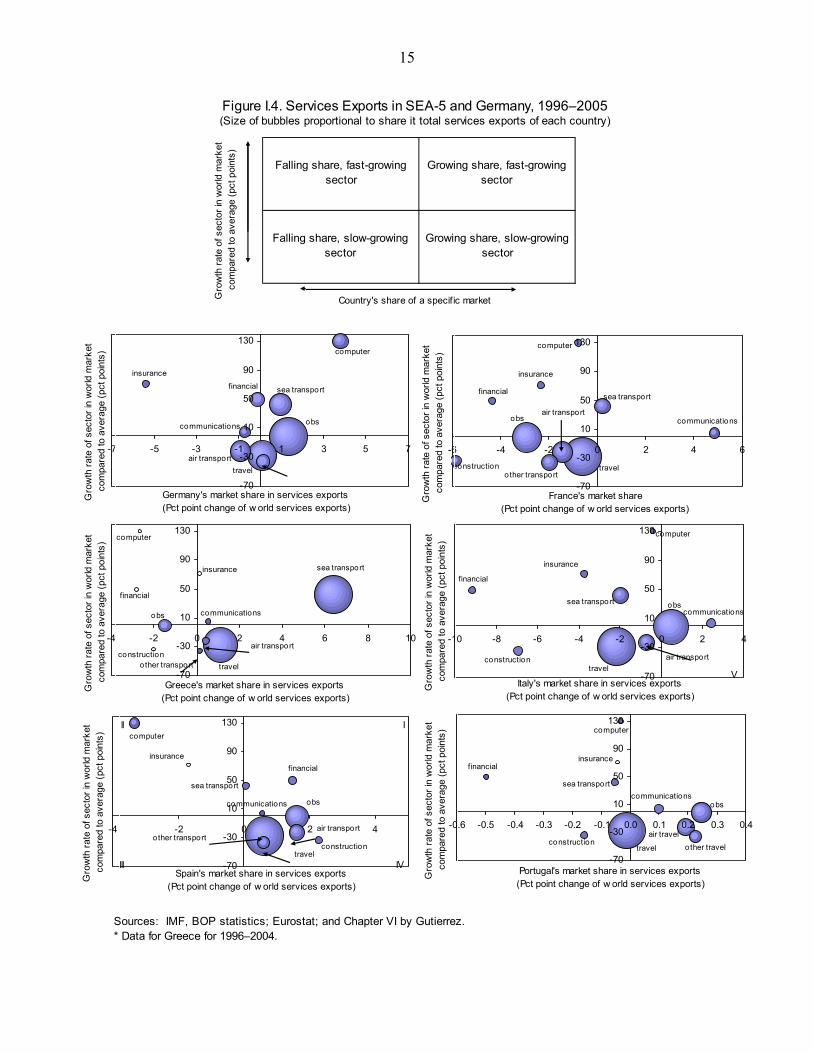
11. Some high-growth, high value-added services exports have expanded rapidly in Greece, Italy, Portugal, and Spain—pointing to prospective productivity gains (Figure I.4). Service sectors with the highest growth and productivity include transport, insurance and financial activities, computer and communication services, and other business services. Increasing output and exports of many of these services would support productivity growth directly—as they typically have high productivity levels—and indirectly, as their output, particularly ICT and business services, increases efficiency in the production of other goods and services (including through outsourcing and offshoring). From the standpoint of export levels, SEA-5 countries are relatively underspecialized (except Greece) in the export of these high value-added services. This category of services exports, however, is showing strong dynamism in most SEA-5 countries, with the exception of France. The export growth of Greece in this area has been limited mainly to transport while in the case of Spain, it shows recently a broader base and rapid market share gains. Italy has gained share in other business services and communications. Performance in this group of high value-added services exports has been poor in France (except in communications).
D. Other Aspects of Competitiveness
12. Price competitiveness appears to play a minor role (at least in the short term) on imports. Analyses of competitiveness typically assign a secondary role to imports; they are seen as determined mainly by the evolution of domestic demand. The statistical evidence for SEA-5 countries supports this view with a role for price competitiveness (as measured by real effective exchange rate) significantly lower than for domestic demand.
13. Imports, however, are relevant to an economy’s competitiveness since they can reduce costs and increase production efficiency. They allow firms to focus on segments of
14
the production chain for which they have a comparative advantage, while offshoring other segments or purchasing inputs in international markets. There may also be technology and know-how spillovers. Indeed, there is evidence of a positive correlation between sectoral import penetration and productivity growth in each of the SEA-5 countries. These effects are likely to be strongest for intra-industry trade, which accounts for about 50 to 80 percent of all manufacturing imports in SEA-5 countries (except in Greece where it is below 30 percent). Intra-industry imports have increased significantly (as a percent of goods imports) in Spain where they have reached levels similar to those of Germany. In contrast, French intra-industry imports fell sharply after peaking at the end of the 1990s. Imports have also become more technology intensive across SEA-5 countries. Regarding specifically offshoring activity, the evidence points to a positive relationship with productivity and more depreciated real exchange rates, although sometimes with weak statistical significance. This activity, however, remains low in SEA-5 countries.
14. Inflows of FDI appear to have played only a minor role in fostering SEA-5 countries’ competitiveness. FDI inflows to Greece and Italy were among the lowest in the OECD, while those to France, Portugal, and Spain were only about the OECD average. Moreover, FDI to Portugal and Spain was inversely correlated with the increase in world demand for those sectors. A large share of FDI targeted services sectors, where its distribution was largely uncorrelated with sectoral productivity. Only in the case of France, FDI into services was increasingly directed toward high productivity sectors.
15
Falling share, fast-growing sector
Growing share, fast-growing sector
Falling share, slow-growing sector
Growing share, slow-growing sector
Figure I.4. Services Exports in SEA-5 and Germany, 1996–2005(Size of bubbles proportional to share it total services exports of each country)
Sources: IMF, BOP statistics; Eurostat; and Chapter VI by Gutierrez.* Data for Greece for 1996–2004.
sea transport
communications
travelair transport
financial
insurance
obs
computer
-70
-30
10
50
90
130
-7 -5 -3 -1 1 3 5 7
Germany's market share in services exports (Pct point change of w orld services exports)
Gro
wth
rate
of s
ecto
r in
wor
ld m
arke
t co
mpa
red
to a
vera
ge (p
ct p
oint
s)
sea transport
communications
travelconstruction
financial
insurance
other transport
air transportobs
computer
-70
-30
10
50
90
130
-6 -4 -2 0 2 4 6
France's market share(Pct point change of w orld services exports)
Gro
wth
rate
of s
ecto
r in
wor
ld m
arke
t co
mpa
red
to a
vera
ge (p
ct p
oint
s)
sea transport
communications
travelconstruction
financial
insurance
other transport
air transport
obs
computer
-70
-30
10
50
90
130
-4 -2 0 2 4 6 8 10
Greece's market share in services exports (Pct point change of w orld services exports)
Gro
wth
rate
of s
ecto
r in
wor
ld m
arke
t co
mpa
red
to a
vera
ge (p
ct p
oint
s)
computer
obssea transport
air transport
insurance
financial
constructiontravel
communications
-70
-30
10
50
90
130
-10 -8 -6 -4 -2 0 2 4
Italy's market share in services exports (Pct point change of w orld services exports)
V
Gro
wth
rate
of s
ecto
r in
wor
ld m
arke
t co
mpa
red
to a
vera
ge (p
ct p
oint
s)
sea transport
communications
travelconstruction
financialinsurance
air transportother transport
obs
computer
-70
-30
10
50
90
130
-4 -2 0 2 4
Spain's market share in services exports (Pct point change of w orld services exports)
III
III IV
Gro
wth
rate
of s
ecto
r in
wor
ld m
arke
t co
mpa
red
to a
vera
ge (p
ct p
oint
s)
computer
obs
other travel
air travel
insurancefinancial
constructiontravel
communicationssea transport
-70
-30
10
50
90
130
-0.6 -0.5 -0.4 -0.3 -0.2 -0.1 0.0 0.1 0.2 0.3 0.4
Portugal's market share in services exports (Pct point change of w orld services exports)
Gro
wth
rate
of s
ecto
r in
wor
ld m
arke
t co
mpa
red
to a
vera
ge (p
ct p
oint
s)
Country's share of a specif ic marketGro
wth
rate
of s
ecto
r in
wor
ld m
arke
t co
mpa
red
to a
vera
ge (p
ct p
oint
s)
16
References
Bennett, H., 2008, “Export Market Shares,” IMF Working Paper, forthcoming. ECB, 2005, “Competitiveness and Export Performance of the Euro Area,” Occasional
Paper No. 30. Escolano, J., 2006, Spain’s Productivity: A Cross-Country Perspective, IMF Country
Report No. 06/213. European Commission, 2007a, Communication from the Commission, Raising Productivity
Growth: Key Messages from the European Competitiveness Report 2007, COM 666. ———, 2007b, Accompanying document to the Communication from the Commission,
Raising Productivity Growth: Key Messages from the European Competitiveness Report 2007, Commission Staff Working Document SEC 1444.
Hallak, J.C., and P.K. Schott, 2005, “Estimating Cross-Country Differences in Product
Quality,” Working Paper. Kehoe, T. J., and K. J. Ruhl, 2007, Are Shocks to the Terms of Trade Shocks to productivity?
Staff Report 391 (Federal Reserve Bank of Minneapolis, Research Department). Kohli, U., 2004, “Real GDP, Real Domestic Income, and Terms of Trade Changes,” Journal
of International Economics No. 62, pp. 83–106. Rae, D., and M. Sollie, 2007, “Globalisation and the European Union: Which Countries are
Best Placed to Cope?” OECD Economics Department Working Paper, ECO/WKP(2007)46.
17
II. SEA-5 EXPORTS: WIND IN THE SAILS FROM GLOBAL GROWTH?1
A. Introduction
1. Exporting to fast-growing markets and sectors, especially in the current period of strong and varied world growth, is considered important for economic performance. For example, Arora and Vamvakidis (2004) showed that, controlling for convergence and other standard determinants, dynamic trading partners may substantially contribute to growth, with industrial countries particularly benefiting from trade with fast-growing developing countries. Recent literature also emphasizes the growth impact of export specialization (Plümper and Graff, 2001) compared to the more agnostic “traditional” view. And surging global export competition underscores the classic case for flexibility in reallocating to new, more promising, activities.2
2. The “high-growth” exports may also help external competitiveness, beyond their impact through standard aggregate measures. To be sure, past export gains in fast-growing markets/sectors are already part of overall export and balance of payments indicators. But many high-growing markets have been consistent high-performers and may be expected to stay so in the future, promising additional longer-term benefits to success there. Moreover, “adaptability” of exports may by itself be a factor in a better performance, even if growth patterns shift in the future. Thus, Fabrizio, et al (2007) find that partner growth favored the expansion of emerging economies’ export shares, while Danninger and Joutz (2007) rank it higher than cost competitiveness in the export success of Germany.
3. This section suggests that the southern euro area (SEA-5) countries have so far taken comparatively little advantage of these channels to enhance competitiveness. Located mainly amid slow growers, these economies stand to benefit from diversifying their traditional (neighboring) export destinations toward more dynamic markets. Globalization is facilitating and prodding this process—through reducing transport costs and putting competitive pressure on traditional geographical or sectoral patterns. But while there is anecdotal evidence that the SEA-5 countries had some success in promoting their products or tailoring them to dynamic destinations, the magnitude and other characteristics of these trends often lag those of key industrialized comparators.
1 Prepared by Bogdan Lissovolik.
2 There may also be disadvantages to an export structure that is geared to high-growth destinations and sectors, for example due to a possibility of high volatility of this growth or of a less “sophisticated” quality of demand from the dynamic-but-not-yet advanced countries. However, there is no evidence yet that these disadvantages could be substantial enough to outweigh the advantages.
18
4. The paper investigates the SEA-5’s geographical and sectoral export performance in “stock” (structure) and “flow” (reorientation) terms. The research is structured as follows. First, stylized facts of geographical export performance are analyzed, highlighting the role of fast-growing countries in the structure of SEA-5’s trade and of changes in this structure. Several simple indicators (elaborated in Appendix II.A) permit relevant cross-country comparisons. Second, sectoral specialization and reorientation—from the point of view of fast-growing activities—are explored through an analysis of manufacturing market shares. The research is mostly focused on nominal export measures, to account for the view that measured real exports may misrepresent “true” performance.3 Only trade in goods is considered; trade in services is analyzed separately as part of this project. With respect to the timeframe of the study, the main focus is on the decade of 1995–2005. The data for 2006–07 have generally not been used, partly reflecting incomplete and provisional nature of the information in key foreign trade databases (i.e., Comtrade) at the time of the preparation of this study.
B. Are SEA-5’s Exports Benefiting from Higher Partner Growth?
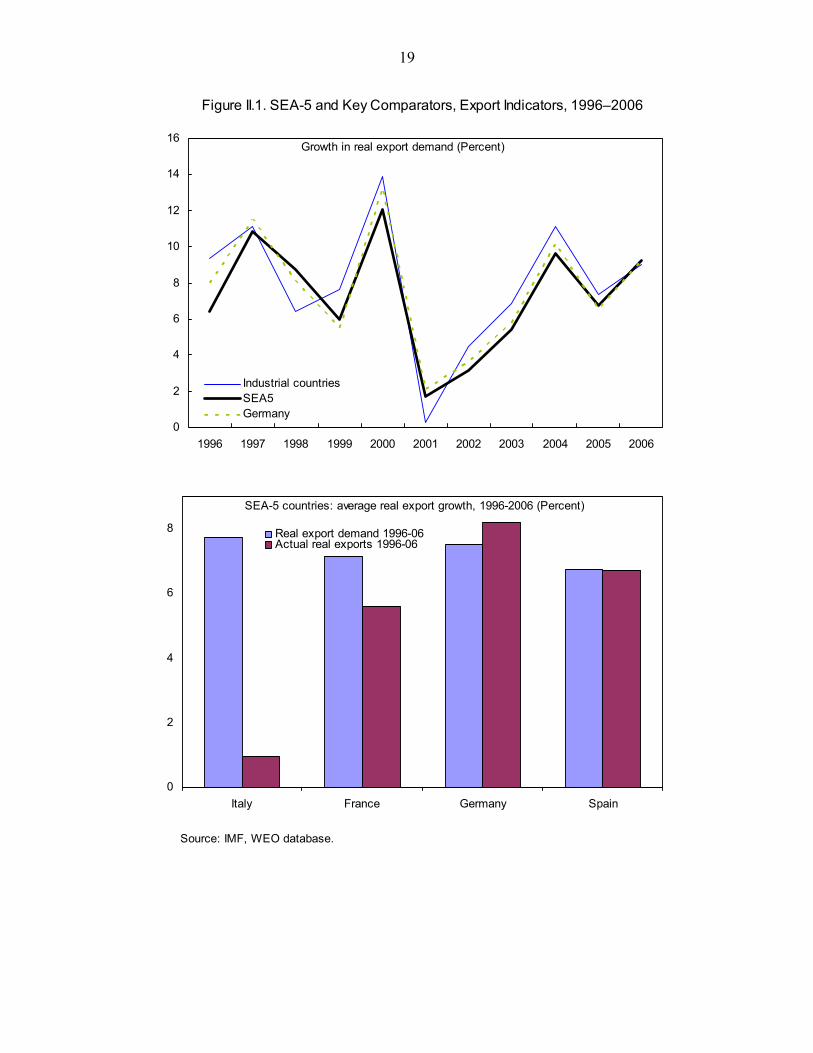
5. Total real export demand growth has been slightly lower for SEA-5 than for its key comparators. According to an index of trade-share weighted real import growth of trading partners (Figure II.1), SEA-5 countries have on average faced weaker export demand compared to that for industrialized countries or euro area (as a whole). While this measure is comprehensive (covers all countries), the effect of fast-growing markets cannot be disentangled from cyclical conditions or special factors in a country’s economy or location, as exports are usually inversely dependent on distance between countries (as per the standard “gravity” model of trade). For example, SEA-5’s negative export demand growth differential was volatile and tended to reverse during spells of EU’s cyclical strength, notably in 2006. Among individual SEA-5 countries, Spain faced the lowest export demand growth, since some of its neighboring trading partners were particularly sluggish. But the relatively robust real growth in Spain (compared to other countries in the region) tended to be a comparatively positive influence on export demand for its SEA-5 trading partners. At the same time, data on actual real export growth suggest that capacity to get traction from the growth of partners varied markedly, with Spain benefiting the most and Italy the least.
6. A more detailed, albeit somewhat selective, approach involves an analysis of trade flows with a subset of dynamic economies, which are mostly emerging markets. Several definitions of such economies have been used (see Appendix II.A for details), with the key
3 For example, measured export deflators may well understate quality upgrading (important in at least some SEA-5 countries), while the use of unit value indices as proxies is a source of biases (see Silver, 2007).
19
Figure II.1. SEA-5 and Key Comparators, Export Indicators, 1996–2006
Source: IMF, WEO database.
Growth in real export demand (Percent)
0
2
4
6
8
10
12
14
16
1996 1997 1998 1999 2000 2001 2002 2003 2004 2005 2006
Industrial countriesSEA5Germany
SEA-5 countries: average real export growth, 1996-2006 (Percent)
0
2
4
6
8
Italy France Germany Spain
Real export demand 1996-06Actual real exports 1996-06
20
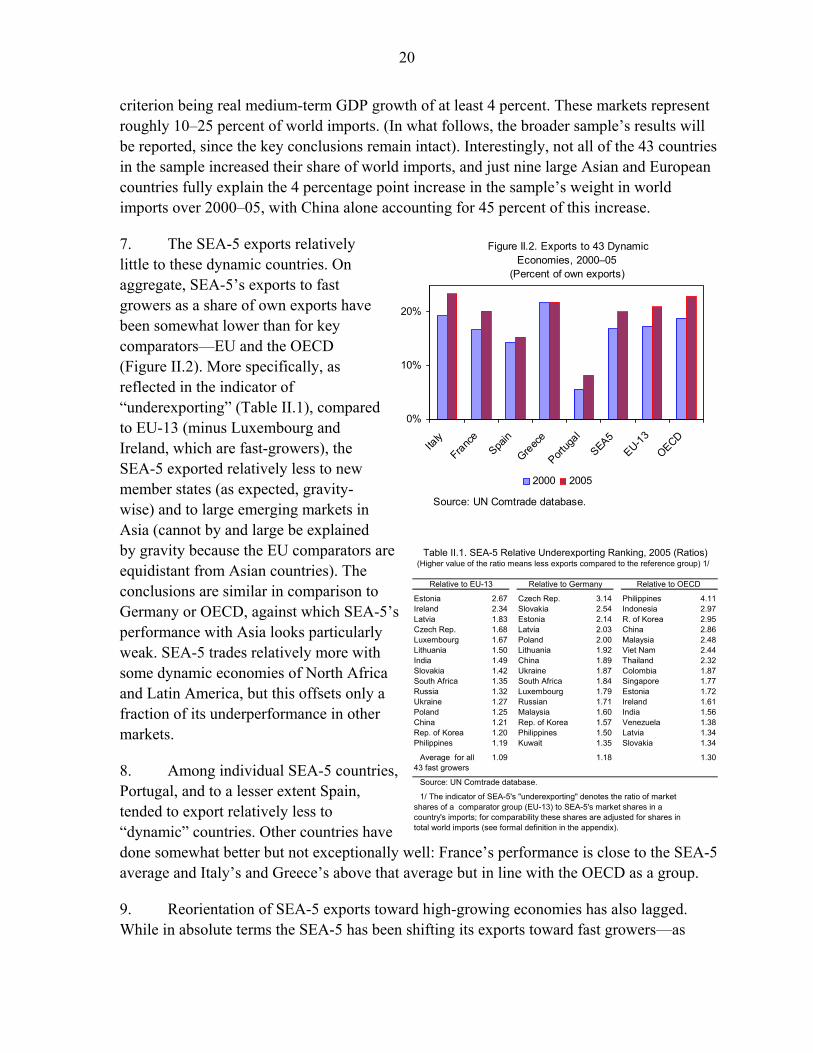
criterion being real medium-term GDP growth of at least 4 percent. These markets represent roughly 10–25 percent of world imports. (In what follows, the broader sample’s results will be reported, since the key conclusions remain intact). Interestingly, not all of the 43 countries in the sample increased their share of world imports, and just nine large Asian and European countries fully explain the 4 percentage point increase in the sample’s weight in world imports over 2000–05, with China alone accounting for 45 percent of this increase.
7. The SEA-5 exports relatively little to these dynamic countries. On aggregate, SEA-5’s exports to fast growers as a share of own exports have been somewhat lower than for key comparators—EU and the OECD (Figure II.2). More specifically, as reflected in the indicator of “underexporting” (Table II.1), compared to EU-13 (minus Luxembourg and Ireland, which are fast-growers), the SEA-5 exported relatively less to new member states (as expected, gravity-wise) and to large emerging markets in Asia (cannot by and large be explained by gravity because the EU comparators are equidistant from Asian countries). The conclusions are similar in comparison to Germany or OECD, against which SEA-5’s performance with Asia looks particularly weak. SEA-5 trades relatively more with some dynamic economies of North Africa and Latin America, but this offsets only a fraction of its underperformance in other markets.
8. Among individual SEA-5 countries, Portugal, and to a lesser extent Spain, tended to export relatively less to “dynamic” countries. Other countries have done somewhat better but not exceptionally well: France’s performance is close to the SEA-5 average and Italy’s and Greece’s above that average but in line with the OECD as a group.
9. Reorientation of SEA-5 exports toward high-growing economies has also lagged. While in absolute terms the SEA-5 has been shifting its exports toward fast growers—as
0%
10%
20%
Italy
France
Spain
Greece
Portug
al
SEA5EU-13
OECD
2000 2005
Figure II.2. Exports to 43 Dynamic Economies, 2000–05
(Percent of own exports)
Source: UN Comtrade database.
Table II.1. SEA-5 Relative Underexporting Ranking, 2005 (Ratios)(Higher value of the ratio means less exports compared to the reference group) 1/
Relative to EU-13 Relative to Germany Relative to OECD
Estonia 2.67 Czech Rep. 3.14 Philippines 4.11Ireland 2.34 Slovakia 2.54 Indonesia 2.97Latvia 1.83 Estonia 2.14 R. of Korea 2.95Czech Rep. 1.68 Latvia 2.03 China 2.86Luxembourg 1.67 Poland 2.00 Malaysia 2.48Lithuania 1.50 Lithuania 1.92 Viet Nam 2.44India 1.49 China 1.89 Thailand 2.32Slovakia 1.42 Ukraine 1.87 Colombia 1.87South Africa 1.35 South Africa 1.84 Singapore 1.77Russia 1.32 Luxembourg 1.79 Estonia 1.72Ukraine 1.27 Russian 1.71 Ireland 1.61Poland 1.25 Malaysia 1.60 India 1.56China 1.21 Rep. of Korea 1.57 Venezuela 1.38Rep. of Korea 1.20 Philippines 1.50 Latvia 1.34Philippines 1.19 Kuwait 1.35 Slovakia 1.34
Average for all 1.09 1.18 1.3043 fast growers
Source: UN Comtrade database.
1/ The indicator of SEA-5's "underexporting" denotes the ratio of marketshares of a comparator group (EU-13) to SEA-5's market shares in acountry's imports; for comparability these shares are adjusted for shares intotal world imports (see formal definition in the appendix).
21
reflected in the accelerated growth of its exports to these destinations relative to the rest of the world—in “adjusted” or comparative terms, its performance has been less impressive:
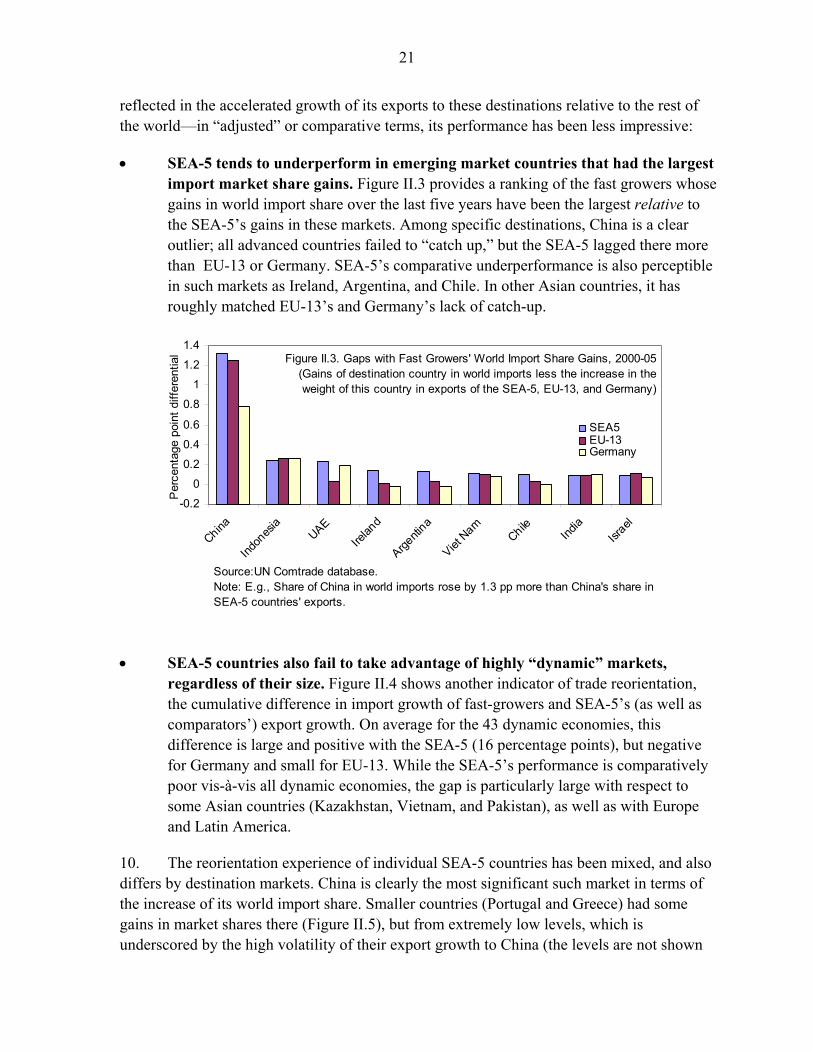
• SEA-5 tends to underperform in emerging market countries that had the largest import market share gains. Figure II.3 provides a ranking of the fast growers whose gains in world import share over the last five years have been the largest relative to the SEA-5’s gains in these markets. Among specific destinations, China is a clear outlier; all advanced countries failed to “catch up,” but the SEA-5 lagged there more than EU-13 or Germany. SEA-5’s comparative underperformance is also perceptible in such markets as Ireland, Argentina, and Chile. In other Asian countries, it has roughly matched EU-13’s and Germany’s lack of catch-up.
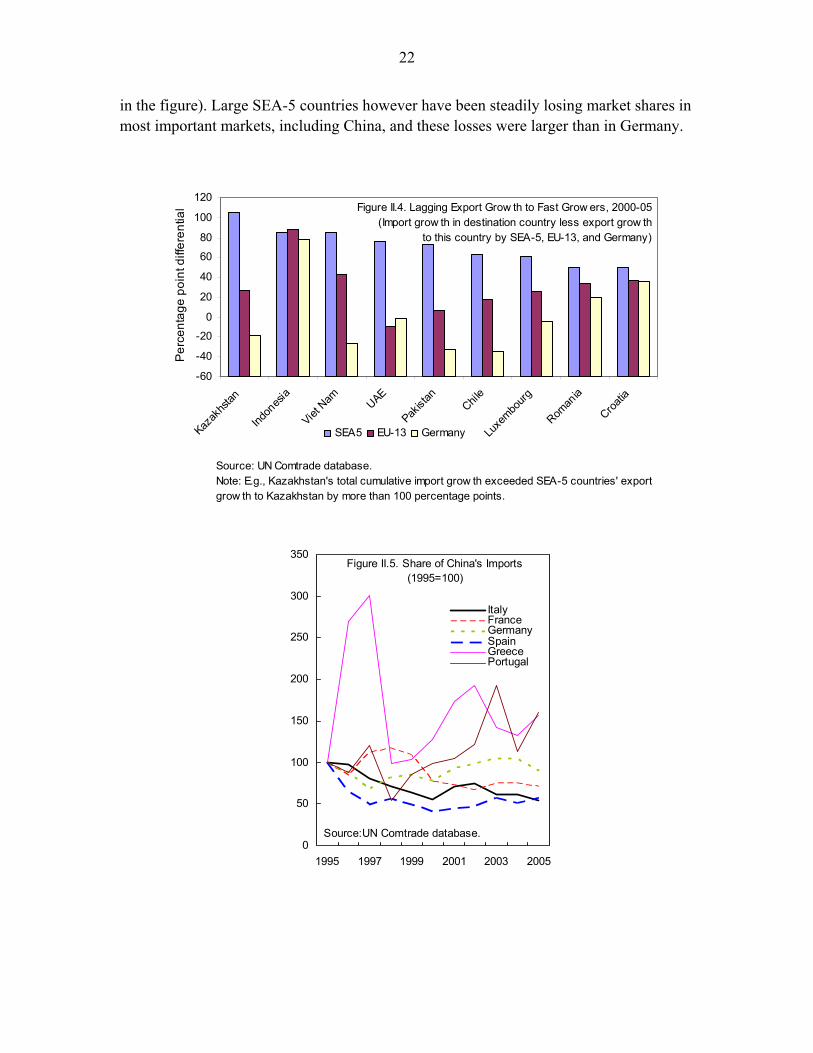
• SEA-5 countries also fail to take advantage of highly “dynamic” markets, regardless of their size. Figure II.4 shows another indicator of trade reorientation, the cumulative difference in import growth of fast-growers and SEA-5’s (as well as comparators’) export growth. On average for the 43 dynamic economies, this difference is large and positive with the SEA-5 (16 percentage points), but negative for Germany and small for EU-13. While the SEA-5’s performance is comparatively poor vis-à-vis all dynamic economies, the gap is particularly large with respect to some Asian countries (Kazakhstan, Vietnam, and Pakistan), as well as with Europe and Latin America.
10. The reorientation experience of individual SEA-5 countries has been mixed, and also differs by destination markets. China is clearly the most significant such market in terms of the increase of its world import share. Smaller countries (Portugal and Greece) had some gains in market shares there (Figure II.5), but from extremely low levels, which is underscored by the high volatility of their export growth to China (the levels are not shown
Figure II.3. Gaps with Fast Growers' World Import Share Gains, 2000-05 (Gains of destination country in world imports less the increase in the weight of this country in exports of the SEA-5, EU-13, and Germany)
-0.2
0
0.2
0.4
0.6
0.8
1
1.2
1.4
China
Indon
esia
UAEIre
land
Argenti
na
Viet N
amChile
India
Israel
Per
cent
age
poin
t diff
eren
tial
SEA5EU-13Germany
Source:UN Comtrade database.Note: E.g., Share of China in world imports rose by 1.3 pp more than China's share in SEA-5 countries' exports.
22
in the figure). Large SEA-5 countries however have been steadily losing market shares in most important markets, including China, and these losses were larger than in Germany.
Figure II.4. Lagging Export Grow th to Fast Grow ers, 2000-05(Import grow th in destination country less export grow th
to this country by SEA-5, EU-13, and Germany)
-60
-40
-20
0
20
40
60
80
100
120
Kazak
hstan
Indon
esia
Viet N
am UAE
Pakist
anChil
e
Luxe
mbourg
Roman
ia
Croatia
Per
cent
age
poin
t diff
eren
tial
SEA5 EU-13 Germany
Source: UN Comtrade database.Note: E.g., Kazakhstan's total cumulative import grow th exceeded SEA-5 countries' export grow th to Kazakhstan by more than 100 percentage points.
Figure II.5. Share of China's Imports (1995=100)
0
50
100
150
200
250
300
350
1995 1997 1999 2001 2003 2005
ItalyFranceGermanySpainGreecePortugal
Source:UN Comtrade database.
23
C. Are SEA-5’s Exports Poised to Gain from Global Sectoral Export Trends?
11. It has been argued that SEA-5’s specialization in traditional products may be largely undesirable. In particular, Faini and Sapir (2006) suggested that Italy’s persistent, and at times increasing, specialization in traditional, more contested, and slower-growing sectors may be a drag on economic growth. On the other hand, it has been countered that such traditional sectors (i.e., textiles, clothing, leather, etc.) may well exhibit higher growth in unit values, including in luxury niches. This may offset at least some of the adverse effect on volumes from more intense competition (see Italian Ministry of Economy and Finance, 2007).
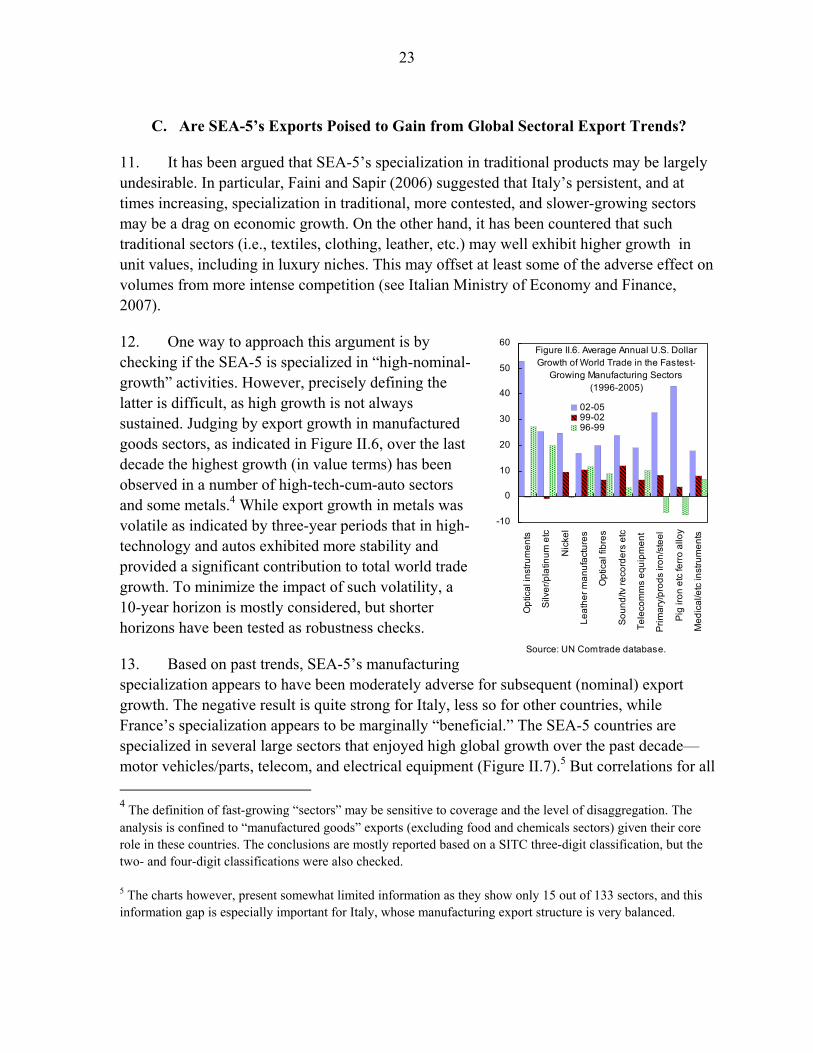
12. One way to approach this argument is by checking if the SEA-5 is specialized in “high-nominal-growth” activities. However, precisely defining the latter is difficult, as high growth is not always sustained. Judging by export growth in manufactured goods sectors, as indicated in Figure II.6, over the last decade the highest growth (in value terms) has been observed in a number of high-tech-cum-auto sectors and some metals.4 While export growth in metals was volatile as indicated by three-year periods that in high-technology and autos exhibited more stability and provided a significant contribution to total world trade growth. To minimize the impact of such volatility, a 10-year horizon is mostly considered, but shorter horizons have been tested as robustness checks.
13. Based on past trends, SEA-5’s manufacturing specialization appears to have been moderately adverse for subsequent (nominal) export growth. The negative result is quite strong for Italy, less so for other countries, while France’s specialization appears to be marginally “beneficial.” The SEA-5 countries are specialized in several large sectors that enjoyed high global growth over the past decade—motor vehicles/parts, telecom, and electrical equipment (Figure II.7).5 But correlations for all 4 The definition of fast-growing “sectors” may be sensitive to coverage and the level of disaggregation. The analysis is confined to “manufactured goods” exports (excluding food and chemicals sectors) given their core role in these countries. The conclusions are mostly reported based on a SITC three-digit classification, but the two- and four-digit classifications were also checked. 5 The charts however, present somewhat limited information as they show only 15 out of 133 sectors, and this information gap is especially important for Italy, whose manufacturing export structure is very balanced.
Figure II.6. Average Annual U.S. Dollar Growth of World Trade in the Fastest-
Growing Manufacturing Sectors (1996-2005)
-10
0
10
20
30
40
50
60
Opt
ical
inst
rum
ents
Silv
er/p
latin
um e
tc
Nic
kel
Leat
her m
anuf
actu
res
Opt
ical
fibr
es
Soun
d/tv
reco
rder
s et
c
Tele
com
ms
equi
pmen
t
Prim
ary/
prod
s iro
n/st
eel
Pig
iron
etc
ferr
o al
loy
Med
ical
/etc
inst
rum
ents
02-0599-0296-99
Source: UN Comtrade database.
24
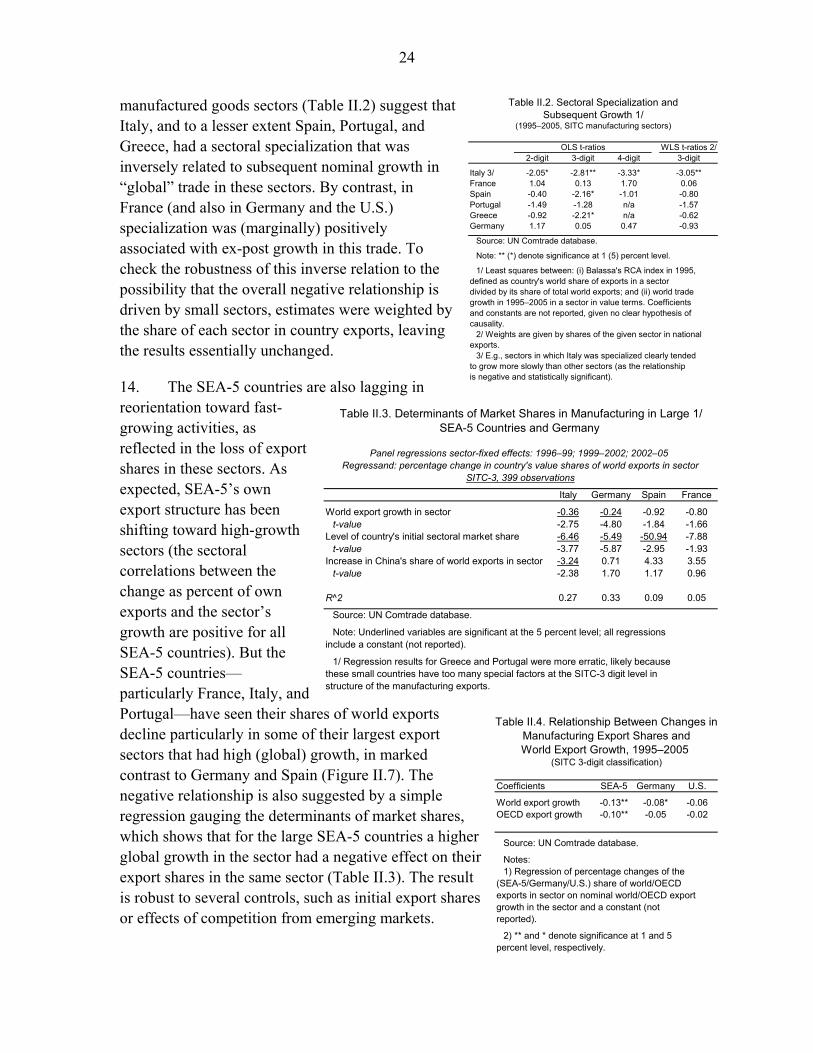
manufactured goods sectors (Table II.2) suggest that Italy, and to a lesser extent Spain, Portugal, and Greece, had a sectoral specialization that was inversely related to subsequent nominal growth in “global” trade in these sectors. By contrast, in France (and also in Germany and the U.S.) specialization was (marginally) positively associated with ex-post growth in this trade. To check the robustness of this inverse relation to the possibility that the overall negative relationship is driven by small sectors, estimates were weighted by the share of each sector in country exports, leaving the results essentially unchanged.
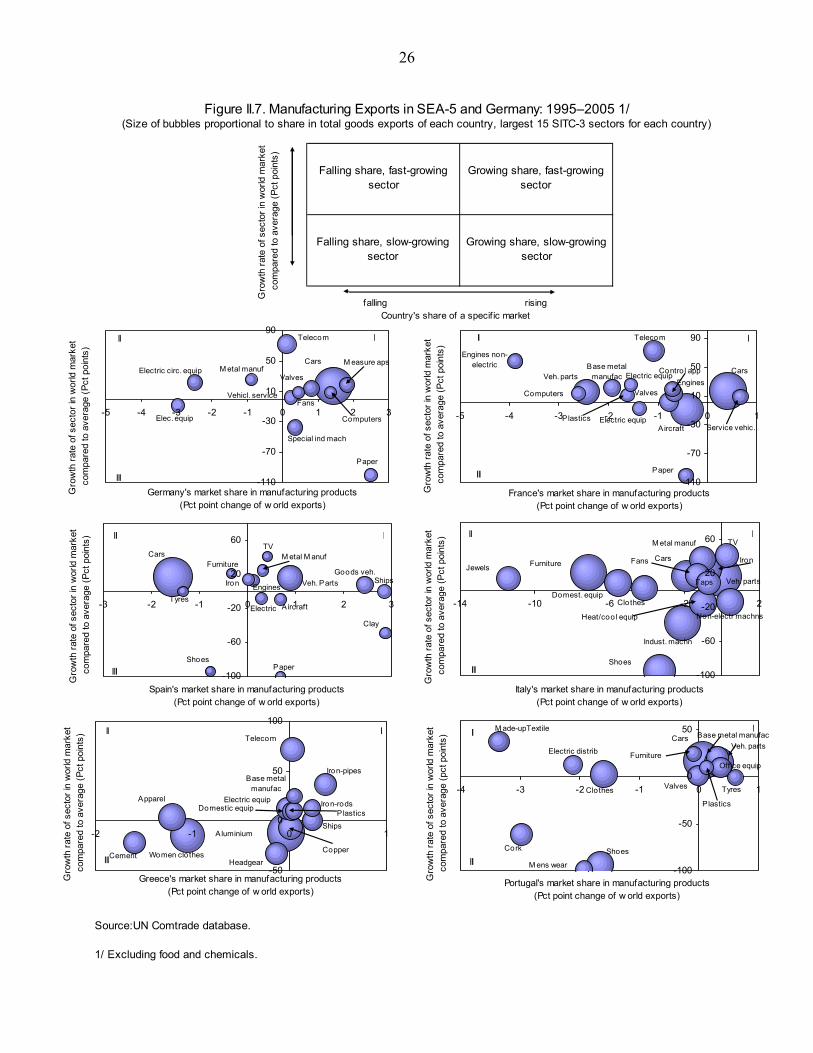
14. The SEA-5 countries are also lagging in reorientation toward fast-growing activities, as reflected in the loss of export shares in these sectors. As expected, SEA-5’s own export structure has been shifting toward high-growth sectors (the sectoral correlations between the change as percent of own exports and the sector’s growth are positive for all SEA-5 countries). But the SEA-5 countries—particularly France, Italy, and Portugal—have seen their shares of world exports decline particularly in some of their largest export sectors that had high (global) growth, in marked contrast to Germany and Spain (Figure II.7). The negative relationship is also suggested by a simple regression gauging the determinants of market shares, which shows that for the large SEA-5 countries a higher global growth in the sector had a negative effect on their export shares in the same sector (Table II.3). The result is robust to several controls, such as initial export shares or effects of competition from emerging markets.
Table II.2. Sectoral Specialization andSubsequent Growth 1/
(1995–2005, SITC manufacturing sectors)
WLS t-ratios 2/2-digit 3-digit 4-digit 3-digit
Italy 3/ -2.05* -2.81** -3.33* -3.05**France 1.04 0.13 1.70 0.06Spain -0.40 -2.16* -1.01 -0.80Portugal -1.49 -1.28 n/a -1.57Greece -0.92 -2.21* n/a -0.62Germany 1.17 0.05 0.47 -0.93
Source: UN Comtrade database.
Note: ** (*) denote significance at 1 (5) percent level.
1/ Least squares between: (i) Balassa's RCA index in 1995,defined as country's world share of exports in a sectordivided by its share of total world exports; and (ii) world tradegrowth in 1995–2005 in a sector in value terms. Coefficientsand constants are not reported, given no clear hypothesis ofcausality.
2/ Weights are given by shares of the given sector in nationalexports.
3/ E.g., sectors in which Italy was specialized clearly tendedto grow more slowly than other sectors (as the relationshipis negative and statistically significant).
OLS t-ratios
Table II.3. Determinants of Market Shares in Manufacturing in Large 1/SEA-5 Countries and Germany
Panel regressions sector-fixed effects: 1996–99; 1999–2002; 2002–05 Regressand: percentage change in country's value shares of world exports in sector
SITC-3, 399 observations
Italy Germany Spain France
World export growth in sector -0.36 -0.24 -0.92 -0.80t-value -2.75 -4.80 -1.84 -1.66
Level of country's initial sectoral market share -6.46 -5.49 -50.94 -7.88t-value -3.77 -5.87 -2.95 -1.93
Increase in China's share of world exports in sector -3.24 0.71 4.33 3.55t-value -2.38 1.70 1.17 0.96
R^2 0.27 0.33 0.09 0.05
Source: UN Comtrade database.
Note: Underlined variables are significant at the 5 percent level; all regressionsinclude a constant (not reported).
1/ Regression results for Greece and Portugal were more erratic, likely becausethese small countries have too many special factors at the SITC-3 digit level instructure of the manufacturing exports.
Table II.4. Relationship Between Changes inManufacturing Export Shares andWorld Export Growth, 1995–2005
(SITC 3-digit classification)
Coefficients SEA-5 Germany U.S.
World export growth -0.13** -0.08* -0.06OECD export growth -0.10** -0.05 -0.02
Source: UN Comtrade database.
Notes:1) Regression of percentage changes of the
(SEA-5/Germany/U.S.) share of world/OECDexports in sector on nominal world/OECD exportgrowth in the sector and a constant (notreported).
2) ** and * denote significance at 1 and 5percent level, respectively.
25
15. SEA-5’s lack of reorientation toward growing sectors may in part reflect expanding shares of emerging markets. Germany—despite its recent broad export success—also tended to systematically lose market shares in high-growing sectors. But if one restricts the analysis to manufacturing exports by OECD, such negative link for Germany is no longer statistically significant, while this continued to be so (only slightly weaker) for the SEA-5 (Table II.4). Interestingly, the U.S., unlike the SEA-5, did not have a perceptible “bias” against fast-growing sectors despite its overall loss of market shares. One potential explanation (not formally tested) is that the U.S. may be more flexible in reallocating resources across activities, including to nonmanufacturing (services) sectors.
D. Conclusions
16. While the SEA-5 countries have been deriving some benefits from exports to high-growth markets, they seem to be comparatively limited (at least based on data through 2005).They underperformed the EU or OECD on most aspects of “pro-growth” export structure and reorientation. Only part of this gap may be ascribed to “gravity” factors. The destination market with the greatest absolute untapped potential is China, but these opportunities are scattered across many emerging markets. From the perspective of high-growth sectors, SEA-5’s indicators of manufacturing export specialization and reorientation were also subpar. The overall underperformance was distributed differently across individual countries, with Italy particularly lagging in “sectoral,” and other countries on most “geographical,” measures.
17. While there is a clear scope to improve the profile of export markets and sectors, realizing these benefits for the SEA-5 countries would not be easy. The share of high-growing countries in world imports is so far limited, and most of them are geographically remote from the SEA-5. But potential opportunities could be understated by recent data, given that dynamic countries on aggregate have further scope to increase imports in tune with their strong external positions. Rigidities to resource allocation and small firm size in most SEA-5 countries are some of the factors that may need to be investigated to better understand what has been inhibiting these gains.
26
Falling share, fast-growing sector
Growing share, fast-growing sector
Falling share, slow-growing sector
Growing share, slow-growing sector
Figure II.7. Manufacturing Exports in SEA-5 and Germany: 1995–2005 1/(Size of bubbles proportional to share in total goods exports of each country, largest 15 SITC-3 sectors for each country)
Cars
Telecom
M easure apsElectric circ. equip
Computers
Special ind mach
Valves
Elec. equip
Paper
M etal manuf
Vehicl. service Fans
-110
-70
-30
10
50
90
-5 -4 -3 -2 -1 0 1 2 3
Germany's market share in manufacturing products(Pct point change of w orld exports)
III
III
Gro
wth
rate
of s
ecto
r in
wor
ld m
arke
t co
mpa
red
to a
vera
ge (P
ct p
oint
s)
Cars
Aircraft
Veh. parts
Telecom
Valves
Electric equipEngines
Paper
Engines non-electric
Contro l app
Service vehic.Electric equipPlastics
Base metal manufac
Computers
-110
-70
-30
10
50
90
-5 -4 -3 -2 -1 0 1
France's market share in manufacturing products(Pct point change of w orld exports)
III
III
Gro
wth
rate
of s
ecto
r in
wor
ld m
arke
t co
mpa
red
to a
vera
ge (P
ct p
oint
s)
Tyres
Furniture
TV
PaperShoes
M etal M anuf
Electric
EnginesIron
Clay
Aircraft
ShipsGoods veh.
Veh. Parts
Cars
-100
-60
-20
20
60
-3 -2 -1 0 1 2 3
Spain's market share in manufacturing products(Pct point change of w orld exports)
III
III
Gro
wth
rate
of s
ecto
r in
wor
ld m
arke
t co
mpa
red
to a
vera
ge (P
ct p
oint
s)
FansJewels
TV
Taps
Iron
Clothes
Non-electr machnsHeat/coo l equip
Domest. equip
Cars
M etal manuf
Shoes
Indust. machn
Furniture
Veh. parts
-100
-60
-20
20
60
-14 -10 -6 -2 2
Italy's market share in manufacturing products(Pct point change of w orld exports)
III
III
Gro
wth
rate
of s
ecto
r in
wor
ld m
arke
t co
mpa
red
to a
vera
ge (P
ct p
oint
s)
A luminium
Women clo thes
Apparel
Telecom
CopperCement
Headgear
Iron-pipes
Electric equip
Ships
Domestic equipPlastics
Iron-rods
Base metal manufac
-50
0
50
100
-2 -1 0 1
Greece's market share in manufacturing products(Pct point change of w orld exports)
I
III
II
Gro
wth
rate
of s
ecto
r in
wor
ld m
arke
t co
mpa
red
to a
vera
ge (P
ct p
oint
s)
P lastics
Base metal manufac
Tyres
M ens wear
Electric distrib
M ade-upTextile
Office equip
Valves
Furniture
Cork
Clothes
Shoes
Veh. parts Cars
-100
-50
0
50
-4 -3 -2 -1 0 1
Portugal's market share in manufacturing products (Pct point change of w orld exports)
III
III
Gro
wth
rate
of s
ecto
r in
wor
ld m
arke
t co
mpa
red
to a
vera
ge (p
ct p
oint
s)
Source:UN Comtrade database.
1/ Excluding food and chemicals.
falling risingCountry's share of a specific market
Gro
wth
rate
of s
ecto
r in
wor
ld m
arke
t co
mpa
red
to a
vera
ge (P
ct p
oint
s)
27
References
Arora, V., and A. Vamvakidis, 2004, “How Much Do Trading Partners Matter for Economic
Growth,” IMF Working Paper No. 04/26. Balassa, B., 1965, Trade Liberalization and Revealed Comparative Advantage, The
Manchester School, 33, 99–123. Danninger, S., and F. Joutz, 2007, “What Explains Germany’s Rebounding Export Market
Share?” IMF Working Paper No. 07/24. Fabrizio, S., D. Igan, and A. Mody, 2007, “The Dynamics of Product Quality and
International Competitiveness,” IMF Working Paper No. 07/97 (April). Faini, R., and A. Sapir, 2006, “Un Modelo obsoleto? Crescita e specializazzione
dell’economia italiana,” mimeo. Italian Ministry of Economy, 2007, “Economic and Financial Planning Document,”
pp. 130–8. Madariaga, N., 2007, “La France s’est-elle adaptée aux tendances récentes du commerce
mondial?” Trésor-Eco No 17. Plümper, T., and M. Graff, 2001, “Export specialization and economic growth” Review of
International Political Economy, Issue 4 (December). Available via the Internet: http://www.informaworld.com/smpp/title~content=t713393878~db=all~tab=issueslist~branches=8 - v8.
Silver, M., 2007, “Do Unit Value Export, Import, or Terms of Trade Indices Represent or
Misrepresent Price Indices,” IMF Working Paper No. 07/121.
28
Appendix II.A. Definitions and Information Sources
1. Selected measures of trade performance vis-à-vis fast-growing economies:
• Index of trade share weighted import growth of the trading partners—computed from the IMF WEO database;
• Indicator of the level of “underexporting” to country j for the SEA-5 and a comparator (EU-13, OECD, Germany) is reported in Table II.1 for 2005 and defined
as: worldworld
jj
SEAMScomparatorMSSEAMScomparatorMS
)5(/)()5(/)(
where MS stands for share of the
comparator or SEA-5 in j’s (or world’s) total imports; SEA-5 would “underexport” to country j if the indicator is higher than unity;
• Indicator of falling behind relative to world import market share (WIMS) gains of country i between 2000 and 2005 is reported in Figure II.3 and defined as:
)()( 2005200520002000iiii SeaESWIMSSeaESWIMS −−− where SeaES is the share of
country i in SEA-5’s exports;
• Indicator of export dynamics gap between the SEA-5 and country i is reported in Figure II.4 and is given by: 05000500 exp −
−− − iSEAi grimpgr where impgr is cumulative
nominal import growth of country i and expgr is the cumulative rate of nominal export growth from the SEA-5 to country i.
2. Lists of fast-growing economies:
Following Madariaga (2007), the definition of fast-growing economies is • Forty-three economies whose average annual real growth in 2004–08 has been
estimated/projected at 4 percent or higher according to the Spring 2007 IMF World Economic Outlook (accounting for some 25 percent of world imports); another constraint is that at least 500 French enterprises export to these markets—this makes the broader sample somewhat France-centered, but it includes all relatively large countries and in many ways would fit the SEA-5 due to its geographical proximity to France; Taiwan was dropped since there are no data in the Comtrade database, but Kazakhstan was added;
• Nineteen of the 43 economies above, whose average annual real growth in 2004–08 was estimated/projected at 6 percent or higher;
• Eighteen economies whose actual and projected average annual real growth in 2004–08 was 4 percent or higher and whose share in world trade is at least 0.5 percent;
29
• Eight economies whose actual and projected average annual real growth in 2004–08 was 6 percent or higher and whose share in world trade is at least 0.5 percent;
Note: Since Ireland and Luxembourg are listed as high-growing economies, they are excluded from the comparator market for the SEA-5. 3. Notes on data sources and definitions:
• Geographical structure and reorientation—WEO and UN Comtrade databases.
• Sectoral structure and reorientation—UN Comtrade data, SITC two–four digit classification, “manufactured goods” data (excludes food and chemicals).
4. Definition of “market shares” used here—share of a country’s exports of a particular sector in world trade of this sector (this is different from the definition of “export market shares” that adjusts for own-country imports).
30
III. SOUTHERN EURO AREA FIVE COUNTRIES: TRENDS IN VALUE-ADDED1
European companies compete more on differentiation, less on cost. Whereas 86 percent of them consider differentiation to be important, low cost is important for only 58 percent. Europe is focusing more and more on
high value-added goods and services. Best of European Business competition survey, 2006
A. Introduction
1. This chapter analyzes whether the southern euro area five (SEA-5) countries changed their production structure in a “competitive” way and compares the pace of restructuring to that of other industrial countries over the past 15 years. This is defined as a reallocation of resources towards more dynamic (fastest growing) and higher-tech sectors, which are associated with stronger competitiveness and higher growth potential. Such restructuring that could boost overall competitiveness toward more dynamic and higher-tech sectors over the past 15 years. The dynamic sectors are defined as those with the highest growth of real value-added in the world, and the technological ranking of each sector is defined following the OECD classification. In order to compare relative restructuring performance across countries, indices of dynamism and technological intensity were also constructed.
2. The results indicate that since the second half of the 90s the SEA-5 countries had been relocating resources toward more dynamic sectors but starting from a lower level and at a slower pace than the EU peers and the United States. In addition, the share of high-tech sectors in their production had increased. However, the SEA-5 (except France) still remains specialized in “traditional,” slow-growing and (generally) low-tech sectors. The slower pace of restructuring in the SEA-5 countries is found to be associated with the lower ability to respond to global growth opportunities.
B. Data and Methodology
3. The dynamics of the value-added is best seen in the firm-level data. However, since the aggregate trends are ultimately reflected in the industry-level despite firms’ heterogeneity (Hawanini et al, 2003) and due to cross-country data limitations, industry-level data are used. The data are from the EU KLEMS data base, spanning EU countries, Japan, and the United States, 61 industries (defined in accordance with the NACE two-digit classification), and the period 1981–2004.2 This paper will henceforth use terms industry and sector interchangeably. While the dataset contains both manufacturing and services sectors, this study concentrates on the tradable goods industries (manufacturing). In order to eliminate annual volatility, the analysis is performed using nonoverlapping five-year averages.
1 Prepared by Iryna Ivaschenko.
2 See Timmer, et al (2007) for a detailed description of the dataset.
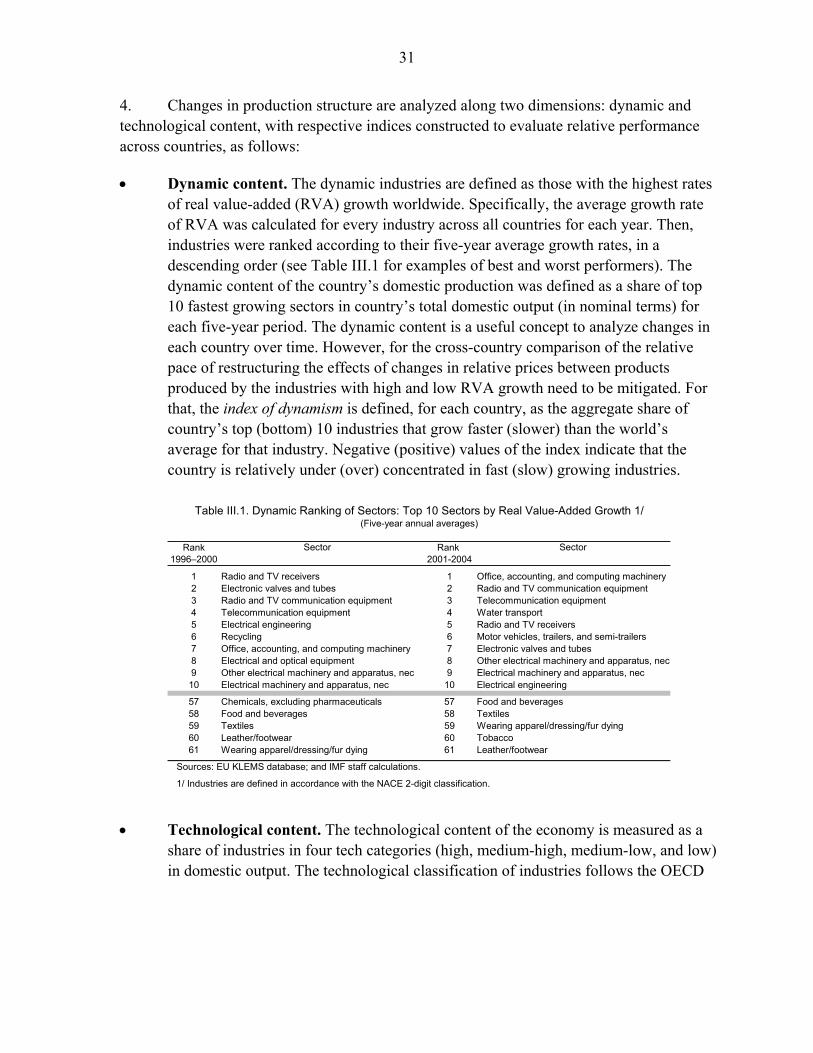
31
4. Changes in production structure are analyzed along two dimensions: dynamic and technological content, with respective indices constructed to evaluate relative performance across countries, as follows:
• Dynamic content. The dynamic industries are defined as those with the highest rates of real value-added (RVA) growth worldwide. Specifically, the average growth rate of RVA was calculated for every industry across all countries for each year. Then, industries were ranked according to their five-year average growth rates, in a descending order (see Table III.1 for examples of best and worst performers). The dynamic content of the country’s domestic production was defined as a share of top 10 fastest growing sectors in country’s total domestic output (in nominal terms) for each five-year period. The dynamic content is a useful concept to analyze changes in each country over time. However, for the cross-country comparison of the relative pace of restructuring the effects of changes in relative prices between products produced by the industries with high and low RVA growth need to be mitigated. For that, the index of dynamism is defined, for each country, as the aggregate share of country’s top (bottom) 10 industries that grow faster (slower) than the world’s average for that industry. Negative (positive) values of the index indicate that the country is relatively under (over) concentrated in fast (slow) growing industries.
• Technological content. The technological content of the economy is measured as a share of industries in four tech categories (high, medium-high, medium-low, and low) in domestic output. The technological classification of industries follows the OECD
Table III.1. Dynamic Ranking of Sectors: Top 10 Sectors by Real Value-Added Growth 1/(Five-year annual averages)
Rank Sector Rank Sector 1996–2000 2001-2004
1 Radio and TV receivers 1 Office, accounting, and computing machinery2 Electronic valves and tubes 2 Radio and TV communication equipment3 Radio and TV communication equipment 3 Telecommunication equipment4 Telecommunication equipment 4 Water transport5 Electrical engineering 5 Radio and TV receivers6 Recycling 6 Motor vehicles, trailers, and semi-trailers7 Office, accounting, and computing machinery 7 Electronic valves and tubes8 Electrical and optical equipment 8 Other electrical machinery and apparatus, nec9 Other electrical machinery and apparatus, nec 9 Electrical machinery and apparatus, nec10 Electrical machinery and apparatus, nec 10 Electrical engineering
57 Chemicals, excluding pharmaceuticals 57 Food and beverages58 Food and beverages 58 Textiles59 Textiles 59 Wearing apparel/dressing/fur dying60 Leather/footwear 60 Tobacco61 Wearing apparel/dressing/fur dying 61 Leather/footwear
Sources: EU KLEMS database; and IMF staff calculations.
1/ Industries are defined in accordance with the NACE 2-digit classification.
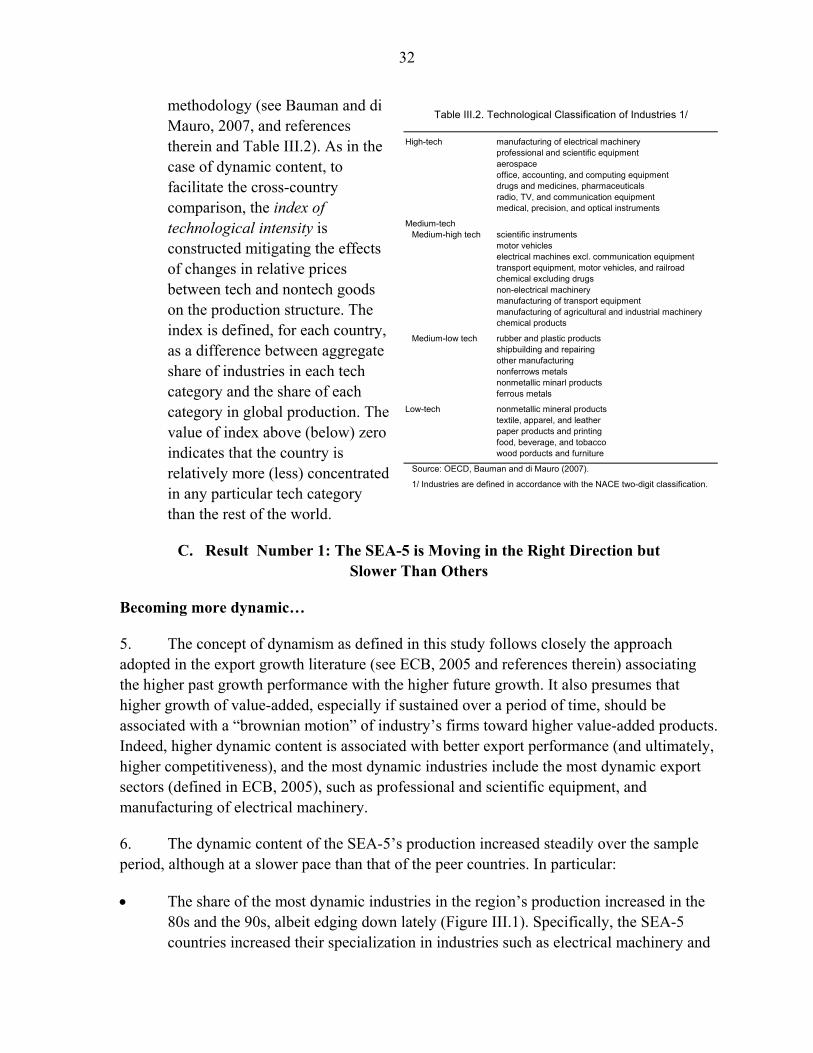
32
methodology (see Bauman and di Mauro, 2007, and references therein and Table III.2). As in the case of dynamic content, to facilitate the cross-country comparison, the index of technological intensity is constructed mitigating the effects of changes in relative prices between tech and nontech goods on the production structure. The index is defined, for each country, as a difference between aggregate share of industries in each tech category and the share of each category in global production. The value of index above (below) zero indicates that the country is relatively more (less) concentrated in any particular tech category than the rest of the world.
C. Result Number 1: The SEA-5 is Moving in the Right Direction but Slower Than Others
Becoming more dynamic…
5. The concept of dynamism as defined in this study follows closely the approach adopted in the export growth literature (see ECB, 2005 and references therein) associating the higher past growth performance with the higher future growth. It also presumes that higher growth of value-added, especially if sustained over a period of time, should be associated with a “brownian motion” of industry’s firms toward higher value-added products. Indeed, higher dynamic content is associated with better export performance (and ultimately, higher competitiveness), and the most dynamic industries include the most dynamic export sectors (defined in ECB, 2005), such as professional and scientific equipment, and manufacturing of electrical machinery.
6. The dynamic content of the SEA-5’s production increased steadily over the sample period, although at a slower pace than that of the peer countries. In particular:
• The share of the most dynamic industries in the region’s production increased in the 80s and the 90s, albeit edging down lately (Figure III.1). Specifically, the SEA-5 countries increased their specialization in industries such as electrical machinery and
High-tech manufacturing of electrical machineryprofessional and scientific equipmentaerospaceoffice, accounting, and computing equipmentdrugs and medicines, pharmaceuticalsradio, TV, and communication equipmentmedical, precision, and optical instruments
Medium-techMedium-high tech scientific instruments
motor vehicleselectrical machines excl. communication equipmenttransport equipment, motor vehicles, and railroadchemical excluding drugsnon-electrical machinerymanufacturing of transport equipmentmanufacturing of agricultural and industrial machinerychemical products
Medium-low tech rubber and plastic products shipbuilding and repairingother manufacturingnonferrows metalsnonmetallic minarl productsferrous metals
Low-tech nonmetallic mineral productstextile, apparel, and leatherpaper products and printingfood, beverage, and tobaccowood porducts and furniture
Source: OECD, Bauman and di Mauro (2007).
1/ Industries are defined in accordance with the NACE two-digit classification.
Table III.2. Technological Classification of Industries 1/
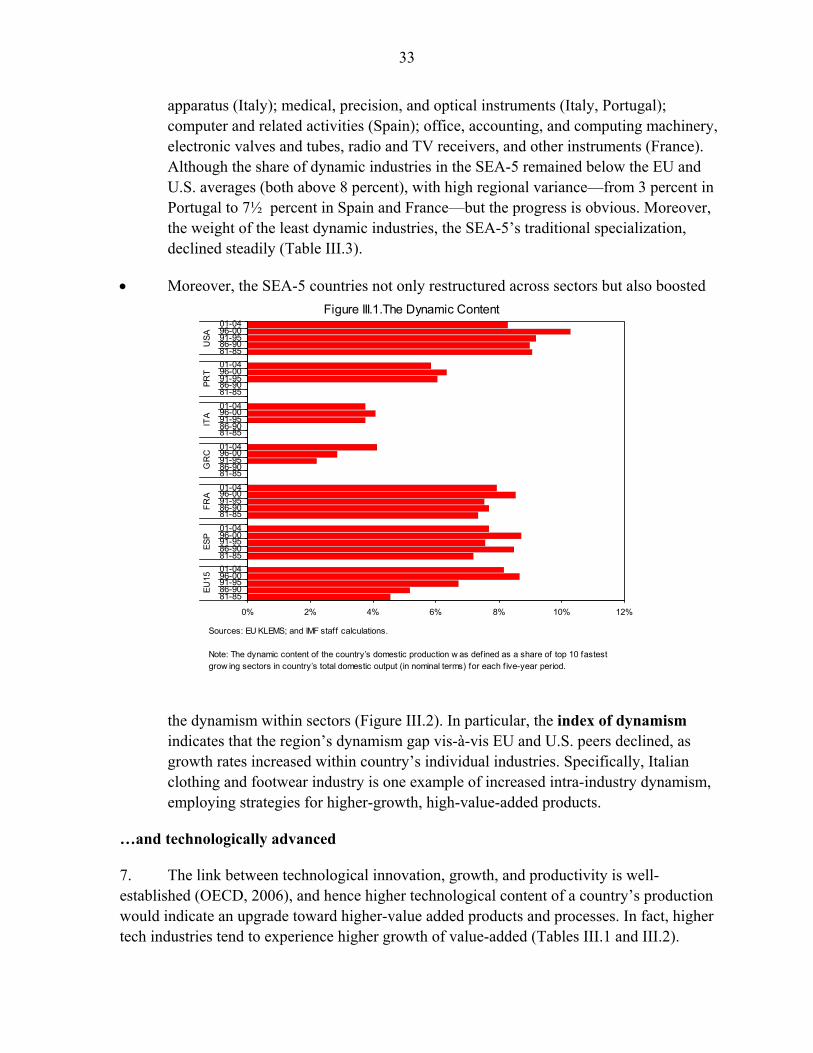
33
apparatus (Italy); medical, precision, and optical instruments (Italy, Portugal); computer and related activities (Spain); office, accounting, and computing machinery, electronic valves and tubes, radio and TV receivers, and other instruments (France). Although the share of dynamic industries in the SEA-5 remained below the EU and U.S. averages (both above 8 percent), with high regional variance—from 3 percent in Portugal to 7½ percent in Spain and France—but the progress is obvious. Moreover, the weight of the least dynamic industries, the SEA-5’s traditional specialization, declined steadily (Table III.3).
• Moreover, the SEA-5 countries not only restructured across sectors but also boosted
the dynamism within sectors (Figure III.2). In particular, the index of dynamism indicates that the region’s dynamism gap vis-à-vis EU and U.S. peers declined, as growth rates increased within country’s individual industries. Specifically, Italian clothing and footwear industry is one example of increased intra-industry dynamism, employing strategies for higher-growth, high-value-added products.
…and technologically advanced
7. The link between technological innovation, growth, and productivity is well-established (OECD, 2006), and hence higher technological content of a country’s production would indicate an upgrade toward higher-value added products and processes. In fact, higher tech industries tend to experience higher growth of value-added (Tables III.1 and III.2).
0% 2% 4% 6% 8% 10% 12%
81-8586-9091-9596-0001-0481-8586-9091-9596-0001-0481-8586-9091-9596-0001-0481-8586-9091-9596-0001-0481-8586-9091-9596-0001-0481-8586-9091-9596-0001-0481-8586-9091-9596-0001-04
EU15
ESP
FRA
GR
CIT
APR
TU
SA
Sources: EU KLEMS; and IMF staff calculations.
Note: The dynamic content of the country’s domestic production w as defined as a share of top 10 fastest grow ing sectors in country’s total domestic output (in nominal terms) for each f ive-year period.
Figure III.1.The Dynamic Content
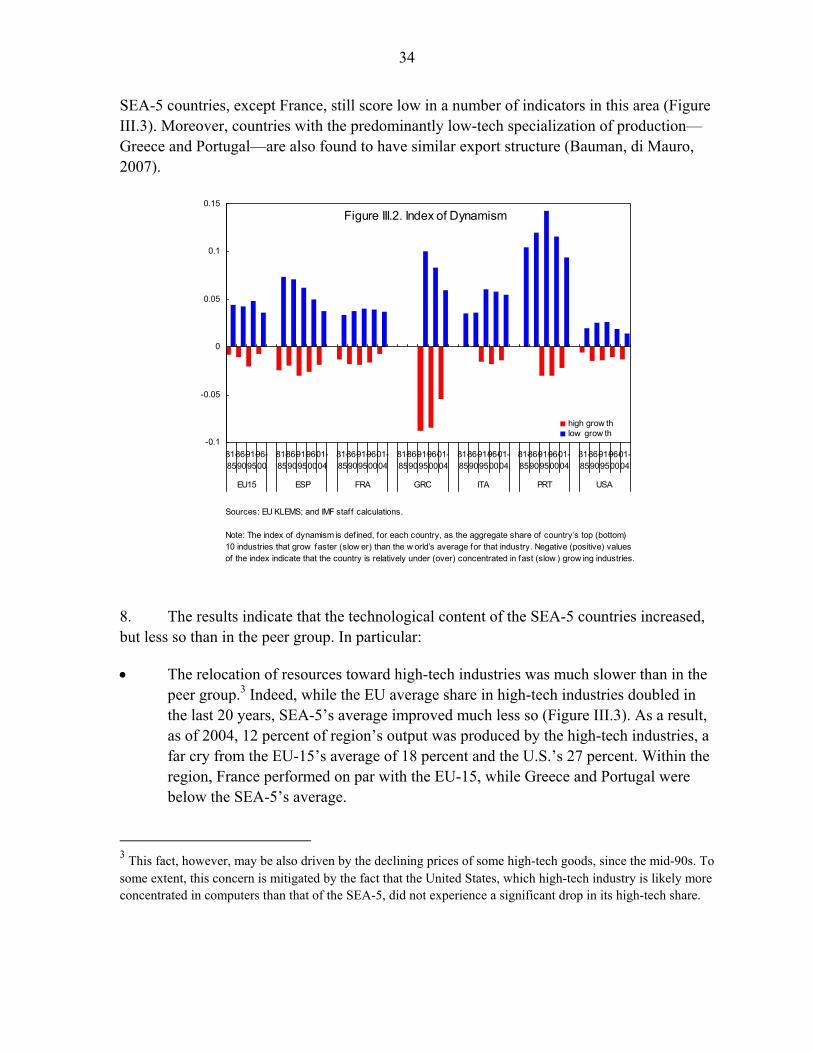
34
SEA-5 countries, except France, still score low in a number of indicators in this area (Figure III.3). Moreover, countries with the predominantly low-tech specialization of production—Greece and Portugal—are also found to have similar export structure (Bauman, di Mauro, 2007).
8. The results indicate that the technological content of the SEA-5 countries increased, but less so than in the peer group. In particular:
• The relocation of resources toward high-tech industries was much slower than in the peer group.3 Indeed, while the EU average share in high-tech industries doubled in the last 20 years, SEA-5’s average improved much less so (Figure III.3). As a result, as of 2004, 12 percent of region’s output was produced by the high-tech industries, a far cry from the EU-15’s average of 18 percent and the U.S.’s 27 percent. Within the region, France performed on par with the EU-15, while Greece and Portugal were below the SEA-5’s average.
3 This fact, however, may be also driven by the declining prices of some high-tech goods, since the mid-90s. To some extent, this concern is mitigated by the fact that the United States, which high-tech industry is likely more concentrated in computers than that of the SEA-5, did not experience a significant drop in its high-tech share.
Figure III.2. Index of Dynamism
-0.1
-0.05
0
0.05
0.1
0.15
81-85
86-90
91-95
96-00
81-85
86-90
91-95
96-00
01-04
81-85
86-90
91-95
96-00
01-04
81-85
86-90
91-95
96-00
01-04
81-85
86-90
91-95
96-00
01-04
81-85
86-90
91-95
96-00
01-04
81-85
86-90
91-95
96-00
01-04
EU15 ESP FRA GRC ITA PRT USA
high grow thlow grow th
Sources: EU KLEMS; and IMF staff calculations.
Note: The index of dynamism is defined, for each country, as the aggregate share of country’s top (bottom) 10 industries that grow faster (slow er) than the w orld’s average for that industry. Negative (positive) values of the index indicate that the country is relatively under (over) concentrated in fast (slow ) grow ing industries.
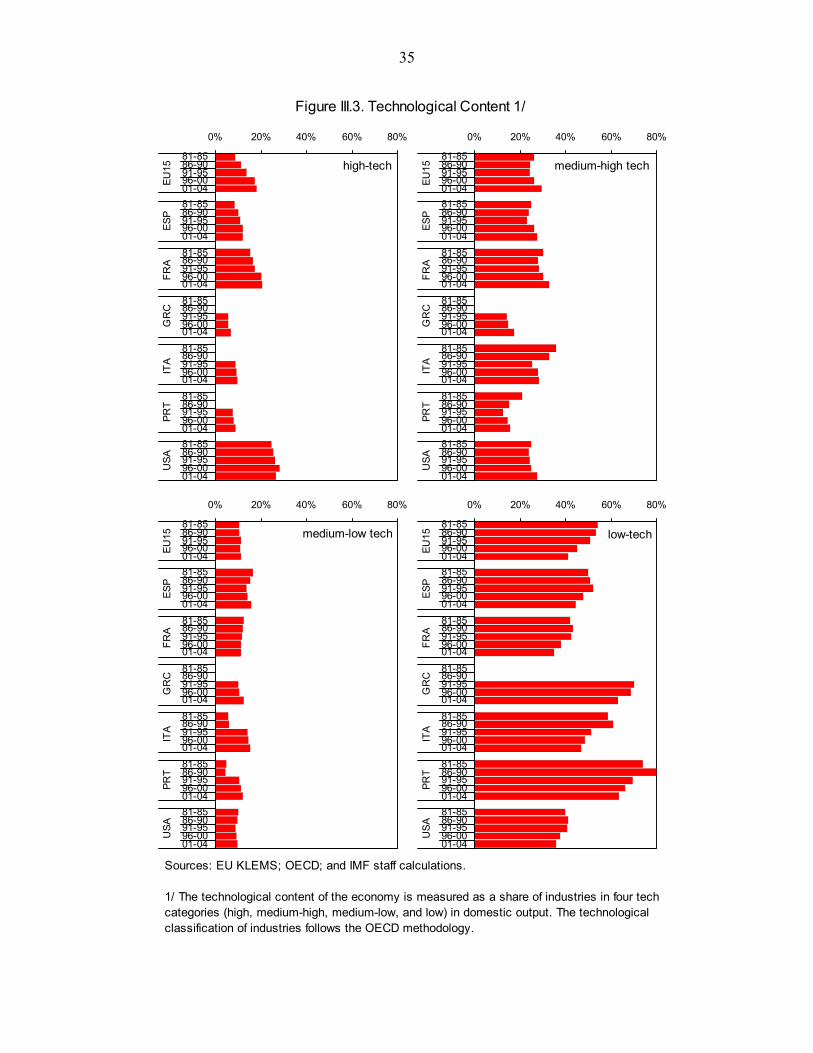
35
Figure III.3. Technological Content 1/
Sources: EU KLEMS; OECD; and IMF staff calculations.
1/ The technological content of the economy is measured as a share of industries in four tech categories (high, medium-high, medium-low, and low) in domestic output. The technological classification of industries follows the OECD methodology.
high-tech
0% 20% 40% 60% 80%
81-8586-9091-9596-0001-0481-8586-9091-9596-0001-0481-8586-9091-9596-0001-0481-8586-9091-9596-0001-0481-8586-9091-9596-0001-0481-8586-9091-9596-0001-0481-8586-9091-9596-0001-04
EU15
ESP
FRA
GR
CIT
A PR
TU
SAmedium-high tech
0% 20% 40% 60% 80%
81-8586-9091-9596-0001-0481-8586-9091-9596-0001-0481-8586-9091-9596-0001-0481-8586-9091-9596-0001-0481-8586-9091-9596-0001-0481-8586-9091-9596-0001-0481-8586-9091-9596-0001-04
EU15
ESP
FRA
GR
CIT
A PR
TU
SA
medium-low tech
0% 20% 40% 60% 80%
81-8586-9091-9596-0001-0481-8586-9091-9596-0001-0481-8586-9091-9596-0001-0481-8586-9091-9596-0001-0481-8586-9091-9596-0001-0481-8586-9091-9596-0001-0481-8586-9091-9596-0001-04
EU15
ESP
FRA
GR
CIT
A PR
TU
SA
low-tech
0% 20% 40% 60% 80%
81-8586-9091-9596-0001-0481-8586-9091-9596-0001-0481-8586-9091-9596-0001-0481-8586-9091-9596-0001-0481-8586-9091-9596-0001-0481-8586-9091-9596-0001-0481-8586-9091-9596-0001-04
EU15
ESP
FRA
GR
CIT
A PR
TU
SA
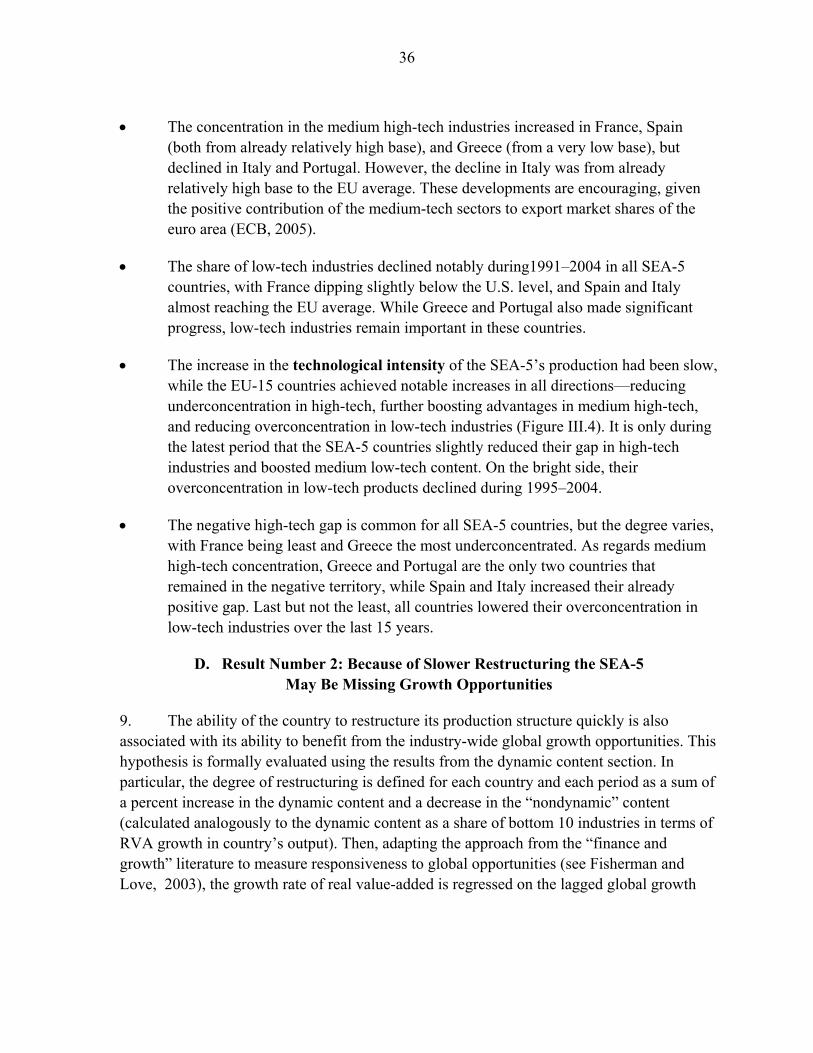
36
• The concentration in the medium high-tech industries increased in France, Spain
(both from already relatively high base), and Greece (from a very low base), but declined in Italy and Portugal. However, the decline in Italy was from already relatively high base to the EU average. These developments are encouraging, given the positive contribution of the medium-tech sectors to export market shares of the euro area (ECB, 2005).
• The share of low-tech industries declined notably during1991–2004 in all SEA-5 countries, with France dipping slightly below the U.S. level, and Spain and Italy almost reaching the EU average. While Greece and Portugal also made significant progress, low-tech industries remain important in these countries.
• The increase in the technological intensity of the SEA-5’s production had been slow, while the EU-15 countries achieved notable increases in all directions—reducing underconcentration in high-tech, further boosting advantages in medium high-tech, and reducing overconcentration in low-tech industries (Figure III.4). It is only during the latest period that the SEA-5 countries slightly reduced their gap in high-tech industries and boosted medium low-tech content. On the bright side, their overconcentration in low-tech products declined during 1995–2004.
• The negative high-tech gap is common for all SEA-5 countries, but the degree varies, with France being least and Greece the most underconcentrated. As regards medium high-tech concentration, Greece and Portugal are the only two countries that remained in the negative territory, while Spain and Italy increased their already positive gap. Last but not the least, all countries lowered their overconcentration in low-tech industries over the last 15 years.
D. Result Number 2: Because of Slower Restructuring the SEA-5 May Be Missing Growth Opportunities
9. The ability of the country to restructure its production structure quickly is also associated with its ability to benefit from the industry-wide global growth opportunities. This hypothesis is formally evaluated using the results from the dynamic content section. In particular, the degree of restructuring is defined for each country and each period as a sum of a percent increase in the dynamic content and a decrease in the “nondynamic” content (calculated analogously to the dynamic content as a share of bottom 10 industries in terms of RVA growth in country’s output). Then, adapting the approach from the “finance and growth” literature to measure responsiveness to global opportunities (see Fisherman and Love, 2003), the growth rate of real value-added is regressed on the lagged global growth
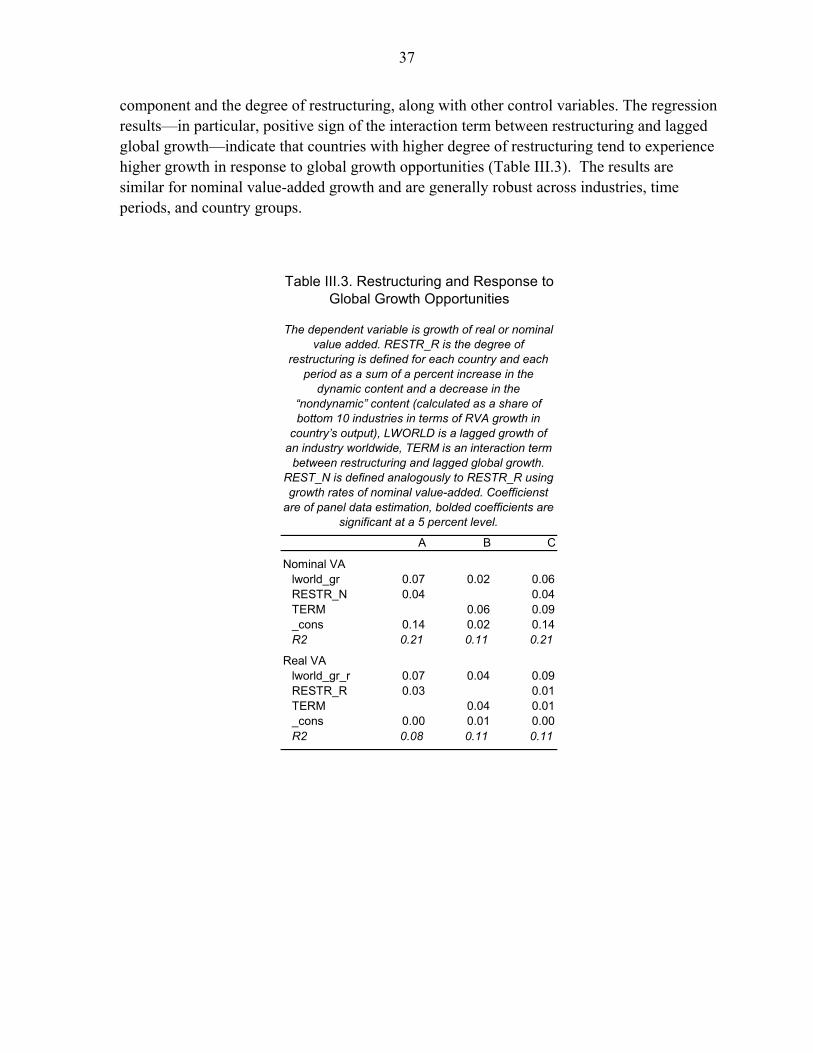
37
component and the degree of restructuring, along with other control variables. The regression results—in particular, positive sign of the interaction term between restructuring and lagged global growth—indicate that countries with higher degree of restructuring tend to experience higher growth in response to global growth opportunities (Table III.3). The results are similar for nominal value-added growth and are generally robust across industries, time periods, and country groups.
A B C
Nominal VAlworld_gr 0.07 0.02 0.06RESTR_N 0.04 0.04TERM 0.06 0.09_cons 0.14 0.02 0.14R2 0.21 0.11 0.21
Real VAlworld_gr_r 0.07 0.04 0.09RESTR_R 0.03 0.01TERM 0.04 0.01_cons 0.00 0.01 0.00R2 0.08 0.11 0.11
The dependent variable is growth of real or nominal value added. RESTR_R is the degree of
restructuring is defined for each country and each period as a sum of a percent increase in the
dynamic content and a decrease in the “nondynamic” content (calculated as a share of bottom 10 industries in terms of RVA growth in
country’s output), LWORLD is a lagged growth of an industry worldwide, TERM is an interaction term
between restructuring and lagged global growth. REST_N is defined analogously to RESTR_R using growth rates of nominal value-added. Coefficienst
are of panel data estimation, bolded coefficients are significant at a 5 percent level.
Table III.3. Restructuring and Response to Global Growth Opportunities
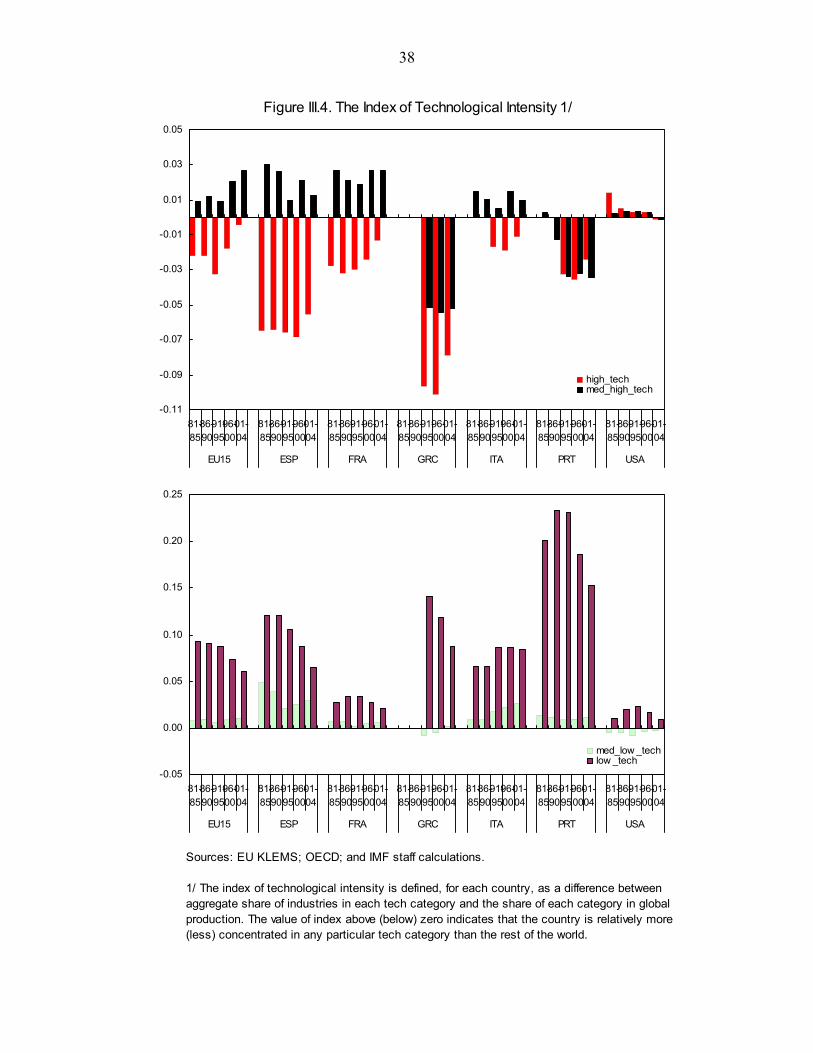
38
Figure III.4. The Index of Technological Intensity 1/
Sources: EU KLEMS; OECD; and IMF staff calculations.
1/ The index of technological intensity is defined, for each country, as a difference between aggregate share of industries in each tech category and the share of each category in global production. The value of index above (below) zero indicates that the country is relatively more (less) concentrated in any particular tech category than the rest of the world.
-0.11
-0.09
-0.07
-0.05
-0.03
-0.01
0.01
0.03
0.05
81-85
86-90
91-95
96-00
01-04
81-85
86-90
91-95
96-00
01-04
81-85
86-90
91-95
96-00
01-04
81-85
86-90
91-95
96-00
01-04
81-85
86-90
91-95
96-00
01-04
81-85
86-90
91-95
96-00
01-04
81-85
86-90
91-95
96-00
01-04
EU15 ESP FRA GRC ITA PRT USA
high_techmed_high_tech
-0.05
0.00
0.05
0.10
0.15
0.20
0.25
81-85
86-90
91-95
96-00
01-04
81-85
86-90
91-95
96-00
01-04
81-85
86-90
91-95
96-00
01-04
81-85
86-90
91-95
96-00
01-04
81-85
86-90
91-95
96-00
01-04
81-85
86-90
91-95
96-00
01-04
81-85
86-90
91-95
96-00
01-04
EU15 ESP FRA GRC ITA PRT USA
med_low _techlow _tech
39
References
Bauman, U., and F. di Mauro, 2007, “Globalization and Euro Area Trade Interactions and Challenges,” ECB Occasional Paper Series No. 55 (March).
European Central Bank, 2005, “Competitiveness and the Export Performance if the Euro
Area,” Occasional Paper No. 30 (June). Hawanini, G., V. Subramanian, and P. Verdin, 2003, “Is performance driven by industry- or
firm-specific factors? A new look at the evidence,” Strategic Management Journal, No. 24, pp. 1–16.
McGahan, A., and M. Porter, 2002, “What do we know about variance in accounting
profitability?” Management Science, No. 48, pp. 834–51. OECD, 2006, Economic Policy Reforms: Going for Growth. Timmer, M., M. O’Mahony, and B. van Ark, 2007, “EU KLEMS Growth and Productivity
Accounts: An Overwiev” (Groningen Growth and Development Centre University of Groningen).
40
IV. ARE THE SOUTHERN EURO AREA COUNTRIES ADVANCING IN THE SEARCH FOR NEW AND BETTER PRODUCTS?1
A. Introduction
1. Globalization is posing major challenges to the southern euro area (SEA-5) countries2—new products of better quality can be an alternative to increase their competitiveness. In this context, the main finding of this chapter is that product quality has not shown a marked improvement over the last decade. This slow progress appears associated with a loss of market share.
2. The importance of product quality in international trade has been extensively documented in the recent theoretical and empirical literature. As countries become richer, their consumers tend to demand not only more goods but also goods of better quality. Copeland and Kotwal (1996, p. 1,746) emphasize this point, “…it is the quality of a differentiated good that responds to an income change: richer people buy fancier cars rather than more cars.” Hummels and Klenow (1995) find that within product categories, richer countries export higher quantities at modestly higher prices. This, they infer, implies that rich countries sell higher quality products. At the same time, Hallack (2006) finds that rich countries tend to import relatively more from countries that produce higher quality goods. Therefore, improving exports’ quality, which, to some extent, is associated with technology upgrading, is crucial for export competitiveness. In this context, using a sample of 54 countries, covering almost 94 percent of world trade, Fabrizio, Igan, and Mody (2007) show that, controlling for the initial market share and the initial quality, an increase of export quality helps expand market share with, as one can expected, diminishing returns.
3. In this context, this chapter analyzes the evolution of these countries’ export structure from different angles, focusing particularly on technology and quality upgrading. The export structure is analyzed using six-digit data for export of manufacturing goods from COMTRADE (a description of the data and methodologies is reported in the Appendix), which implies a breakdown of exports into more than 4,000 differentiated product categories on average per country per year. This chapter assesses to what extent SEA-5 countries’ exports have been subject to a shift in composition, quality, and technology intensity during the period 1994–2005, and if there is the scope for further enhancing the relative sophistication of their exports.
4. The empirical analysis shows that the export structure of the SEA-5 countries changed over the last decade. Greece and Portugal, which had the highest export 1 Prepared by Stefania Fabrizio.
2 SEA-5 countries comprise France, Greece, Italy, Portugal, and Spain.
41
concentration in a few sectors in mid-1990s, diversified their export substantially between 1994 and 2005, while Italy and France, whose exports were more diversified at the beginning of the period. Spain, which had already diversified its export before 1994, as it joined the European Union, maintained broadly the same level of diversification. In general, countries tended to shift away from textile to chemicals and fabricated metals.
5. SEA-5 countries also moved up the technology ladder. SEA-5 countries upgraded export technology over the past decade, with the exception of Spain, which presented already a relative high degree of technology content during the second half of the 1990s and broadly maintained the same share of low- medium low-tech exports during 2000–05. Technology upgrading was particularly rapid in Greece and Portugal, the exports of which were mostly of a low-tech content in the mid-1990s. Although technology tends to improve together with quality, this is not always the case. Moreover, when considered together with quality upgrading as possible determinants of competitiveness, the primary factor in gaining market share appears to be quality improvement (Fabrizio, Igan, and Mody, 2007).
6. But improvements in export quality were limited. SEA-5 countries did not increase their export quality relative to their main competitors, the other European Union (EU-15) countries, over the last decade, although they improved it somewhat relative to the pool of other competitors. Furthermore, quality did not increase for goods with higher potential. Looking to the extent at which new products have affected the overall relative quality of exports, the results suggest that Greece, Portugal, and Spain and, to a lesser degree, Italy shifted to products of higher quality than the goods traditionally exported, while France moved to products of slightly lower quality. At the same time, these countries discontinued products of relatively higher quality, and, comparing the contribution to overall quality of newly exported goods with that of products discontinued during the period under consideration, only for Greece and Portugal does the change in export structure appears to have been favorable during 1994–2005.
7. The rest of this chapter is organized as follows. Section B studies the evolution of exports by industry. Section C presents the results of the analysis of technology and the quality of exports. Section D concludes.
B. Did the Export Structure of SEA-5 Countries Evolve Over the Last Decade?
8. Export structure by industry changed during 1994–2005; in particular, in countries with an initial high concentration in a few sectors. Though export structure differs across SEA-5 countries, some similarities in the evolution of this structure can be identified (Figure IV.1). With the exception of France, all countries increased their proportion of exports of chemical and chemical products, which have became an important share of their
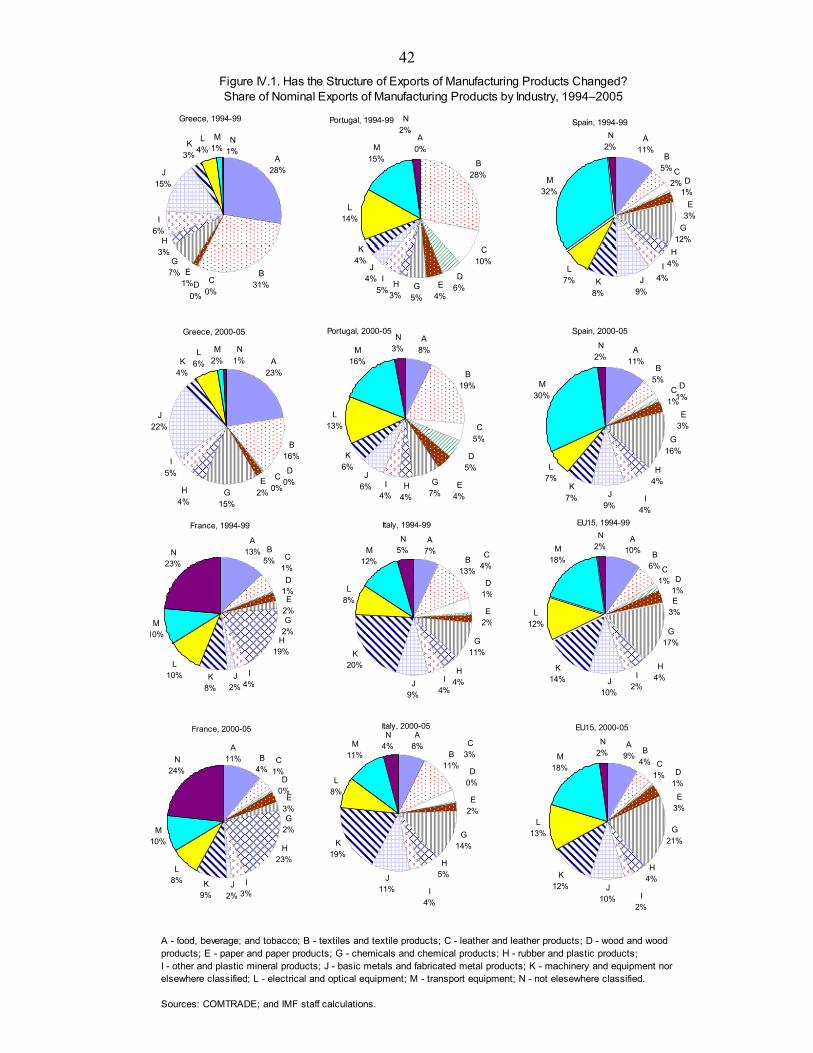
42
France, 1994-99
M10%
L10% K
8%J
2%
I4%
H19%
G2%
E2%
D1%
C1%
B5%
A13%N
23%
Italy, 1994-99
M12%
L8%
K20%
J9%
I4%
H4%
G11%
E2%
D1%
C4%
B13%
A7%
N5%
EU15, 1994-99N
2%A
10% B6% C
1% D1%E
3%
G17%
H4%I
2%J10%
K14%
L12%
M18%
France, 2000-05
N24%
A11% B
4%C
1%D
0%E
3%G
2%
H23%
I3%
J2%
K9%
L8%
M10%
Italy, 2000-05
M11%
L8%
K19%
J11% I
4%
H5%
G14%
E2%
D0%
C3%B
11%
A8%
N4%
EU15, 2000-05
N2%
A9% B
4% C1% D
1%E
3%
G21%
H4%
I2%
J10%
K12%
L13%
M18%
A - food, beverage; and tobacco; B - textiles and textile products; C - leather and leather products; D - wood and wood products; E - paper and paper products; G - chemicals and chemical products; H - rubber and plastic products; I - other and plastic mineral products; J - basic metals and fabricated metal products; K - machinery and equipment nor elsewhere classified; L - electrical and optical equipment; M - transport equipment; N - not elesewhere classified.
Sources: COMTRADE; and IMF staff calculations.
Figure IV.1. Has the Structure of Exports of Manufacturing Products Changed?Share of Nominal Exports of Manufacturing Products by Industry, 1994–2005
Greece, 1994-99
M1%
L4%
K3%
J15%
I6%
H3%
G7% E
1%D0%
C0%
B31%
A28%
N1%
Portugal, 1994-99
M15%
L14%
K4%
J4% I
5%H
3%G
5%E
4%
D6%
C10%
B28%
A0%
N2%
Spain, 1994-99N
2%A
11%B
5% C2% D
1%E
3%G
12%H
4%I4%J
9%K
8%
L7%
M32%
Greece, 2000-05
N1% A
23%
B16%
C0%
D0%E
2%G15%
H4%
I5%
J22%
K4%
L6%
M2%
Portugal, 2000-05
M16%
L13%
K6%
J6% I
4%H
4%
G7%
E4%
D5%
C5%
B19%
A8%
N3%
Spain, 2000-05
N2%
A11%
B5%
C1%
D1%
E3%
G16%
H4%
I4%
J9%
K7%
L7%
M30%
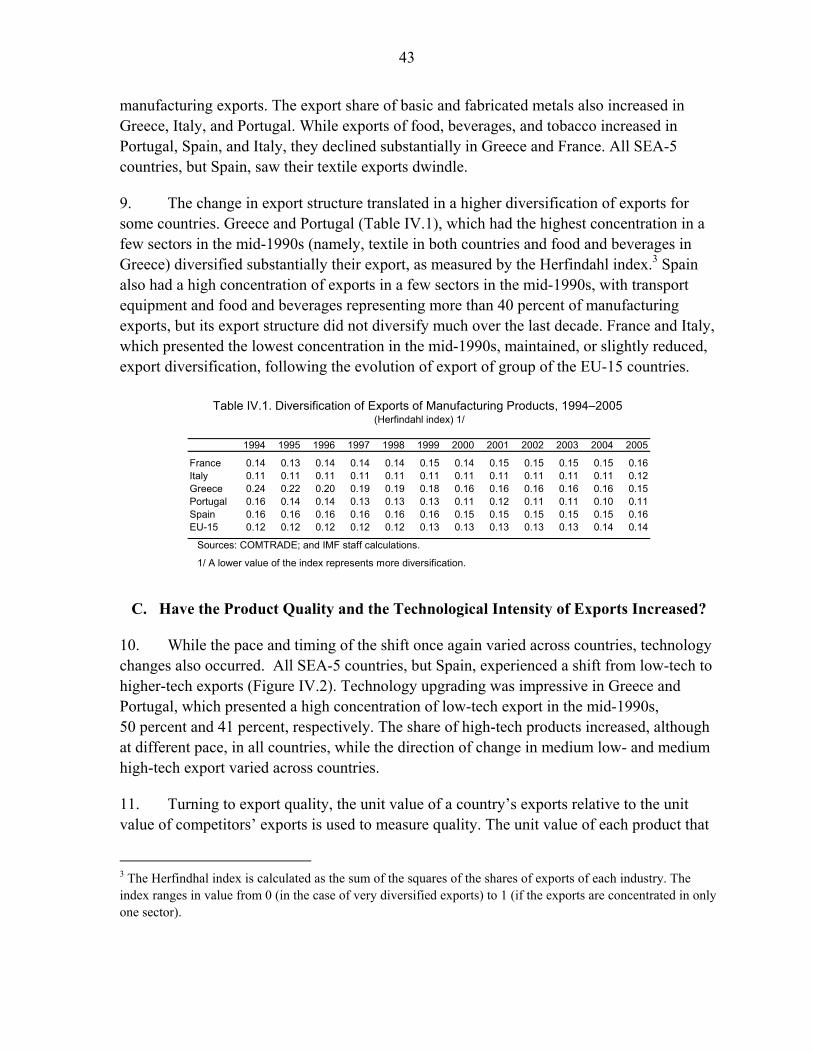
43
manufacturing exports. The export share of basic and fabricated metals also increased in Greece, Italy, and Portugal. While exports of food, beverages, and tobacco increased in Portugal, Spain, and Italy, they declined substantially in Greece and France. All SEA-5 countries, but Spain, saw their textile exports dwindle.
9. The change in export structure translated in a higher diversification of exports for some countries. Greece and Portugal (Table IV.1), which had the highest concentration in a few sectors in the mid-1990s (namely, textile in both countries and food and beverages in Greece) diversified substantially their export, as measured by the Herfindahl index.3 Spain also had a high concentration of exports in a few sectors in the mid-1990s, with transport equipment and food and beverages representing more than 40 percent of manufacturing exports, but its export structure did not diversify much over the last decade. France and Italy, which presented the lowest concentration in the mid-1990s, maintained, or slightly reduced, export diversification, following the evolution of export of group of the EU-15 countries.
C. Have the Product Quality and the Technological Intensity of Exports Increased?
10. While the pace and timing of the shift once again varied across countries, technology changes also occurred. All SEA-5 countries, but Spain, experienced a shift from low-tech to higher-tech exports (Figure IV.2). Technology upgrading was impressive in Greece and Portugal, which presented a high concentration of low-tech export in the mid-1990s, 50 percent and 41 percent, respectively. The share of high-tech products increased, although at different pace, in all countries, while the direction of change in medium low- and medium high-tech export varied across countries.
11. Turning to export quality, the unit value of a country’s exports relative to the unit value of competitors’ exports is used to measure quality. The unit value of each product that
3 The Herfindhal index is calculated as the sum of the squares of the shares of exports of each industry. The index ranges in value from 0 (in the case of very diversified exports) to 1 (if the exports are concentrated in only one sector).
1994 1995 1996 1997 1998 1999 2000 2001 2002 2003 2004 2005
France 0.14 0.13 0.14 0.14 0.14 0.15 0.14 0.15 0.15 0.15 0.15 0.16Italy 0.11 0.11 0.11 0.11 0.11 0.11 0.11 0.11 0.11 0.11 0.11 0.12Greece 0.24 0.22 0.20 0.19 0.19 0.18 0.16 0.16 0.16 0.16 0.16 0.15Portugal 0.16 0.14 0.14 0.13 0.13 0.13 0.11 0.12 0.11 0.11 0.10 0.11Spain 0.16 0.16 0.16 0.16 0.16 0.16 0.15 0.15 0.15 0.15 0.15 0.16EU-15 0.12 0.12 0.12 0.12 0.12 0.13 0.13 0.13 0.13 0.13 0.14 0.14
Sources: COMTRADE; and IMF staff calculations.
1/ A lower value of the index represents more diversification.
Table IV.1. Diversification of Exports of Manufacturing Products, 1994–2005 (Herfindahl index) 1/
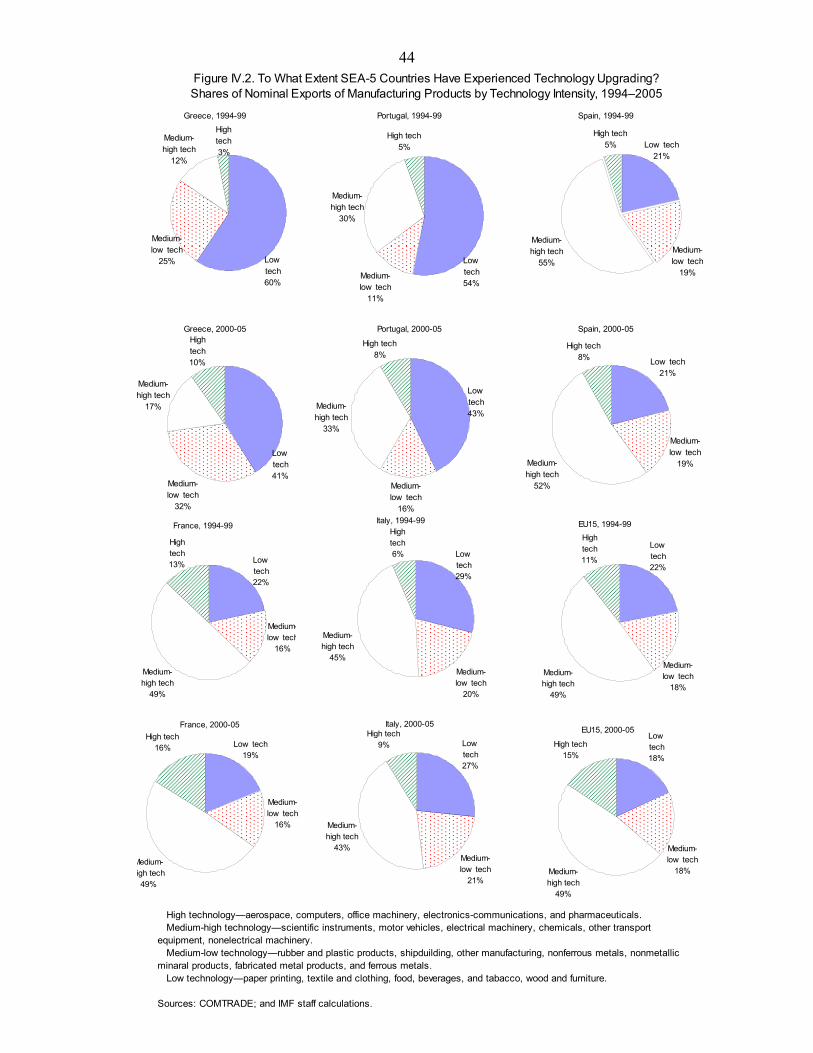
44
France, 1994-99
High tech13%
Medium-high tech
49%
Medium-low tech
16%
Low tech22%
Italy, 1994-99
Low tech29%
Medium-low tech
20%
Medium-high tech
45%
High tech6%
France, 2000-05High tech
16%
Medium-igh tech49%
Medium-low tech
16%
Low tech19%
Italy, 2000-05High tech
9%
Medium-high tech
43%Medium-low tech
21%
Low tech27%
EU15, 1994-99
Low tech22%
Medium-low tech
18%
Medium-high tech
49%
High tech11%
EU15, 2000-05Low tech18%
Medium-low tech
18%Medium-high tech
49%
High tech15%
High technology—aerospace, computers, office machinery, electronics-communications, and pharmaceuticals. Medium-high technology—scientific instruments, motor vehicles, electrical machinery, chemicals, other transport equipment, nonelectrical machinery. Medium-low technology—rubber and plastic products, shipduilding, other manufacturing, nonferrous metals, nonmetallic minaral products, fabricated metal products, and ferrous metals. Low technology—paper printing, textile and clothing, food, beverages, and tabacco, wood and furniture.
Sources: COMTRADE; and IMF staff calculations.
Figure IV.2. To What Extent SEA-5 Countries Have Experienced Technology Upgrading?Shares of Nominal Exports of Manufacturing Products by Technology Intensity, 1994–2005
Greece, 1994-99High tech3%
Medium-high tech
12%
Medium-low tech
25% Low tech60%
Portugal, 1994-99
Low tech54%
Medium-low tech
11%
Medium-high tech
30%
High tech5%
Spain, 1994-99
Low tech21%
Medium-low tech
19%
Medium-high tech
55%
High tech5%
Greece, 2000-05
Low tech41%
Medium-low tech
32%
Medium-high tech
17%
High tech10%
Portugal, 2000-05
High tech8%
Medium-high tech
33%
Medium-low tech
16%
Low tech43%
Spain, 2000-05
Low tech21%
Medium-low tech
19%Medium-high tech
52%
High tech8%
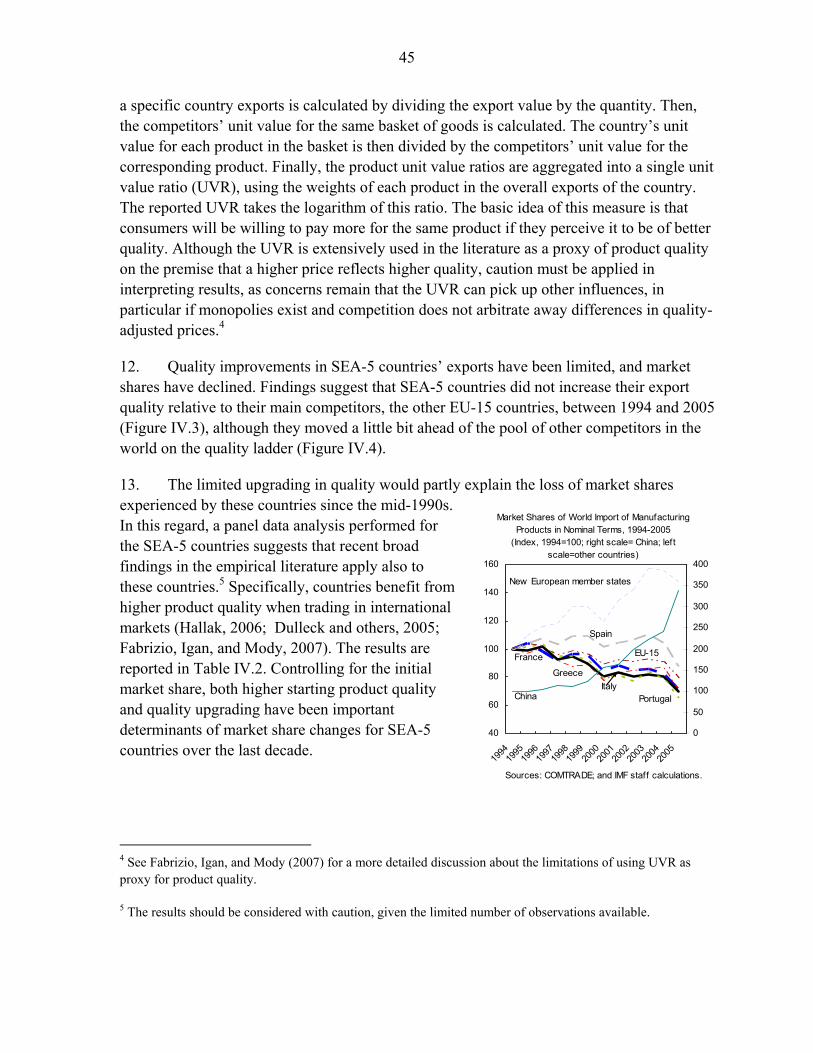
45
a specific country exports is calculated by dividing the export value by the quantity. Then, the competitors’ unit value for the same basket of goods is calculated. The country’s unit value for each product in the basket is then divided by the competitors’ unit value for the corresponding product. Finally, the product unit value ratios are aggregated into a single unit value ratio (UVR), using the weights of each product in the overall exports of the country. The reported UVR takes the logarithm of this ratio. The basic idea of this measure is that consumers will be willing to pay more for the same product if they perceive it to be of better quality. Although the UVR is extensively used in the literature as a proxy of product quality on the premise that a higher price reflects higher quality, caution must be applied in interpreting results, as concerns remain that the UVR can pick up other influences, in particular if monopolies exist and competition does not arbitrate away differences in quality-adjusted prices.4
12. Quality improvements in SEA-5 countries’ exports have been limited, and market shares have declined. Findings suggest that SEA-5 countries did not increase their export quality relative to their main competitors, the other EU-15 countries, between 1994 and 2005 (Figure IV.3), although they moved a little bit ahead of the pool of other competitors in the world on the quality ladder (Figure IV.4).
13. The limited upgrading in quality would partly explain the loss of market shares experienced by these countries since the mid-1990s. In this regard, a panel data analysis performed for the SEA-5 countries suggests that recent broad findings in the empirical literature apply also to these countries.5 Specifically, countries benefit from higher product quality when trading in international markets (Hallak, 2006; Dulleck and others, 2005; Fabrizio, Igan, and Mody, 2007). The results are reported in Table IV.2. Controlling for the initial market share, both higher starting product quality and quality upgrading have been important determinants of market share changes for SEA-5 countries over the last decade.
4 See Fabrizio, Igan, and Mody (2007) for a more detailed discussion about the limitations of using UVR as proxy for product quality.
5 The results should be considered with caution, given the limited number of observations available.
40
60
80
100
120
140
160
1994
1995
1996
1997
1998
1999
2000
2001
2002
2003
2004
2005
0
50
100
150
200
250
300
350
400
France
Italy
Spain
Portugal
Greece
EU-15
China
New European member states
Market Shares of World Import of Manufacturing Products in Nominal Terms, 1994-2005
(Index, 1994=100; right scale= China; left scale=other countries)
Sources: COMTRADE; and IMF staff calculations.
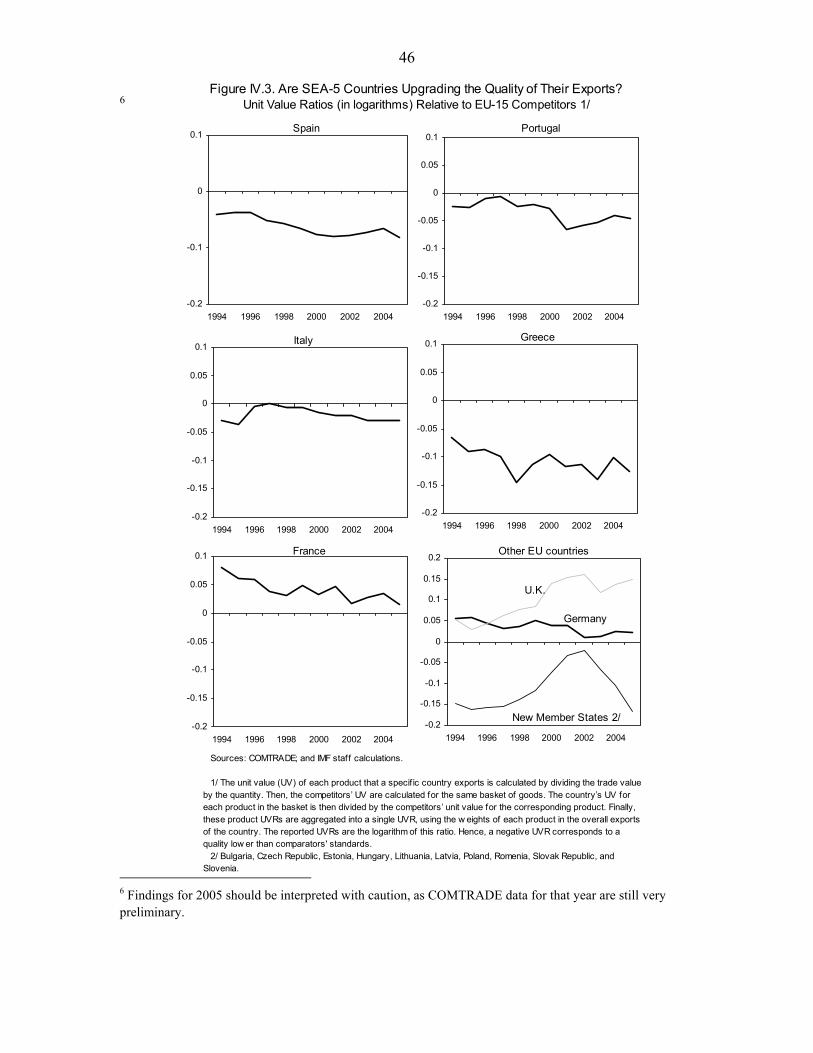
46
6
6 Findings for 2005 should be interpreted with caution, as COMTRADE data for that year are still very preliminary.
Figure IV.3. Are SEA-5 Countries Upgrading the Quality of Their Exports?Unit Value Ratios (in logarithms) Relative to EU-15 Competitors 1/
Sources: COMTRADE; and IMF staff calculations.
1/ The unit value (UV) of each product that a specif ic country exports is calculated by dividing the trade value by the quantity. Then, the competitors’ UV are calculated for the same basket of goods. The country’s UV for each product in the basket is then divided by the competitors’ unit value for the corresponding product. Finally, these product UVRs are aggregated into a single UVR, using the w eights of each product in the overall exports of the country. The reported UVRs are the logarithm of this ratio. Hence, a negative UVR corresponds to a quality low er than comparators' standards. 2/ Bulgaria, Czech Republic, Estonia, Hungary, Lithuania, Latvia, Poland, Romenia, Slovak Republic, and Slovenia.
Spain
-0.2
-0.1
0
0.1
1994 1996 1998 2000 2002 2004
Portugal
-0.2
-0.15
-0.1
-0.05
0
0.05
0.1
1994 1996 1998 2000 2002 2004
Italy
-0.2
-0.15
-0.1
-0.05
0
0.05
0.1
1994 1996 1998 2000 2002 2004
Greece
-0.2
-0.15
-0.1
-0.05
0
0.05
0.1
1994 1996 1998 2000 2002 2004
France
-0.2
-0.15
-0.1
-0.05
0
0.05
0.1
1994 1996 1998 2000 2002 2004
Other EU countries
-0.2
-0.15
-0.1
-0.05
0
0.05
0.1
0.15
0.2
1994 1996 1998 2000 2002 2004
Germany
U.K.
New Member States 2/
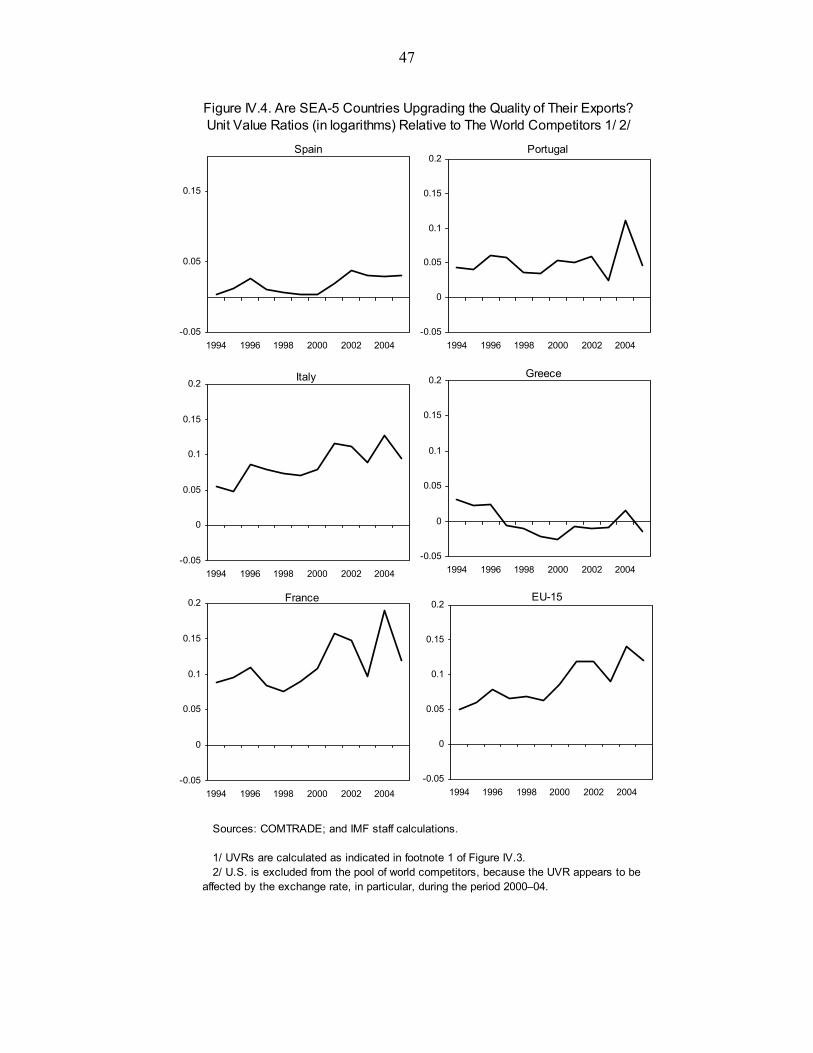
47
Figure IV.4. Are SEA-5 Countries Upgrading the Quality of Their Exports?Unit Value Ratios (in logarithms) Relative to The World Competitors 1/ 2/
Sources: COMTRADE; and IMF staff calculations.
1/ UVRs are calculated as indicated in footnote 1 of Figure IV.3. 2/ U.S. is excluded from the pool of world competitors, because the UVR appears to be affected by the exchange rate, in particular, during the period 2000–04.
Spain
-0.05
0.05
0.15
1994 1996 1998 2000 2002 2004
Portugal
-0.05
0
0.05
0.1
0.15
0.2
1994 1996 1998 2000 2002 2004
Italy
-0.05
0
0.05
0.1
0.15
0.2
1994 1996 1998 2000 2002 2004
Greece
-0.05
0
0.05
0.1
0.15
0.2
1994 1996 1998 2000 2002 2004
France
-0.05
0
0.05
0.1
0.15
0.2
1994 1996 1998 2000 2002 2004
EU-15
-0.05
0
0.05
0.1
0.15
0.2
1994 1996 1998 2000 2002 2004
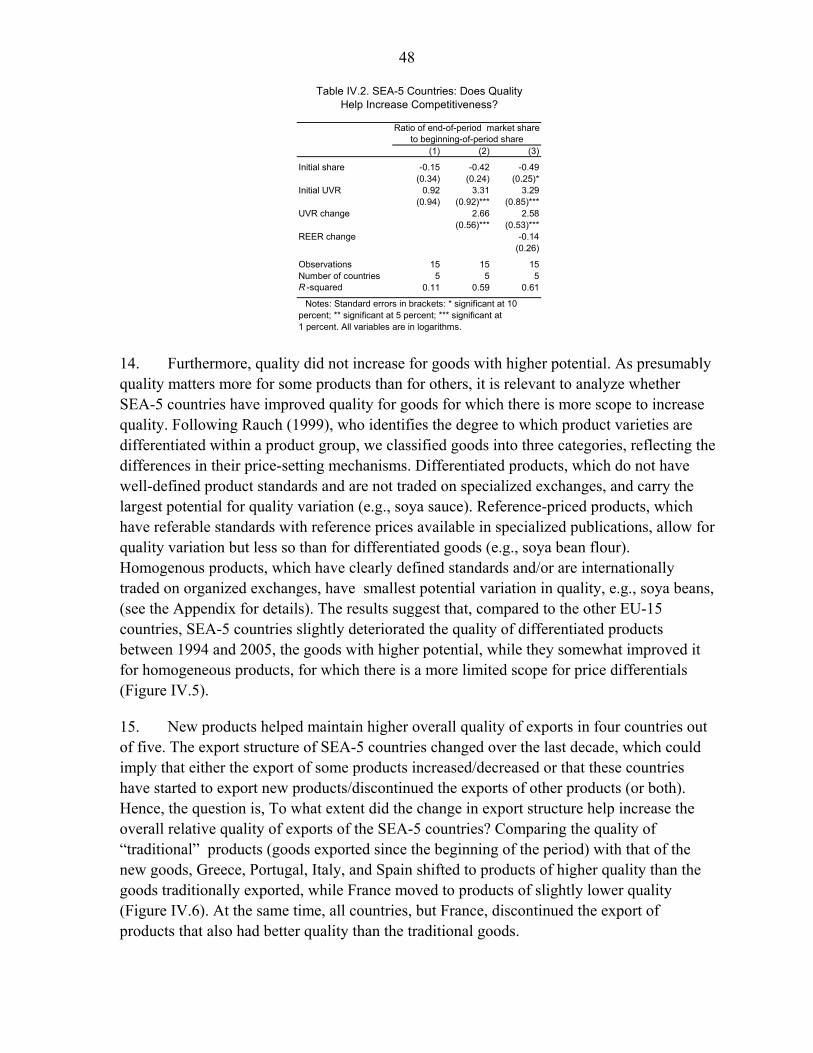
48
14. Furthermore, quality did not increase for goods with higher potential. As presumably quality matters more for some products than for others, it is relevant to analyze whether SEA-5 countries have improved quality for goods for which there is more scope to increase quality. Following Rauch (1999), who identifies the degree to which product varieties are differentiated within a product group, we classified goods into three categories, reflecting the differences in their price-setting mechanisms. Differentiated products, which do not have well-defined product standards and are not traded on specialized exchanges, and carry the largest potential for quality variation (e.g., soya sauce). Reference-priced products, which have referable standards with reference prices available in specialized publications, allow for quality variation but less so than for differentiated goods (e.g., soya bean flour). Homogenous products, which have clearly defined standards and/or are internationally traded on organized exchanges, have smallest potential variation in quality, e.g., soya beans, (see the Appendix for details). The results suggest that, compared to the other EU-15 countries, SEA-5 countries slightly deteriorated the quality of differentiated products between 1994 and 2005, the goods with higher potential, while they somewhat improved it for homogeneous products, for which there is a more limited scope for price differentials (Figure IV.5).
15. New products helped maintain higher overall quality of exports in four countries out of five. The export structure of SEA-5 countries changed over the last decade, which could imply that either the export of some products increased/decreased or that these countries have started to export new products/discontinued the exports of other products (or both). Hence, the question is, To what extent did the change in export structure help increase the overall relative quality of exports of the SEA-5 countries? Comparing the quality of “traditional” products (goods exported since the beginning of the period) with that of the new goods, Greece, Portugal, Italy, and Spain shifted to products of higher quality than the goods traditionally exported, while France moved to products of slightly lower quality (Figure IV.6). At the same time, all countries, but France, discontinued the export of products that also had better quality than the traditional goods.
Table IV.2. SEA-5 Countries: Does QualityHelp Increase Competitiveness?
Ratio of end-of-period market share to beginning-of-period share
(1) (2) (3)
Initial share -0.15 -0.42 -0.49(0.34) (0.24) (0.25)*
Initial UVR 0.92 3.31 3.29(0.94) (0.92)*** (0.85)***
UVR change 2.66 2.58(0.56)*** (0.53)***
REER change -0.14(0.26)
Observations 15 15 15Number of countries 5 5 5R -squared 0.11 0.59 0.61
Notes: Standard errors in brackets: * significant at 10percent; ** significant at 5 percent; *** significant at1 percent. All variables are in logarithms.
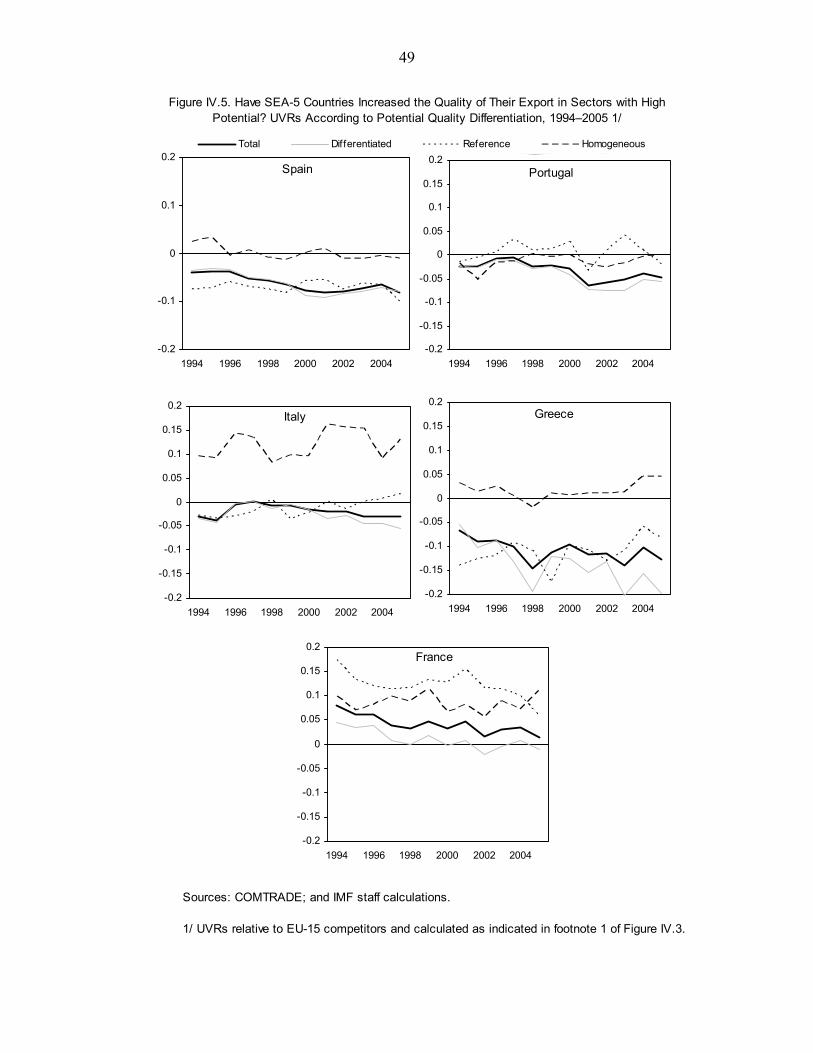
49
Figure IV.5. Have SEA-5 Countries Increased the Quality of Their Export in Sectors with High Potential? UVRs According to Potential Quality Differentiation, 1994–2005 1/
Sources: COMTRADE; and IMF staff calculations.
1/ UVRs relative to EU-15 competitors and calculated as indicated in footnote 1 of Figure IV.3.
Spain
-0.2
-0.1
0
0.1
0.2
1994 1996 1998 2000 2002 2004
Portugal
-0.2
-0.15
-0.1
-0.05
0
0.05
0.1
0.15
0.2
1994 1996 1998 2000 2002 2004
Italy
-0.2
-0.15
-0.1
-0.05
0
0.05
0.1
0.15
0.2
1994 1996 1998 2000 2002 2004
Greece
-0.2
-0.15
-0.1
-0.05
0
0.05
0.1
0.15
0.2
1994 1996 1998 2000 2002 2004
France
-0.2
-0.15
-0.1
-0.05
0
0.05
0.1
0.15
0.2
1994 1996 1998 2000 2002 2004
Total Differentiated Reference Homogeneous
50
Figure IV.6. Have Exports Shifted to Higher Quality Products? Quality (UVRs) by Products 1/ 2/
Sources: COMTRADE; and IMF staff calculations.
1/ UVRs are calculated as indicated in footnote 1 of Figure IV.3. In the comparison, it is important to consider that the overall quality of exports depends on the quality of the products as well as on their weight in the export basket. As such, not only quality but also quantity matters of the single product to determine the overall quality of exports. 2/ Unit value ratios relative to EU-15 competitors.
Spain
-0.5
-0.4
-0.3
-0.2
-0.1
0
0.1
0.2
1994 1996 1998 2000 2002 2004
Portugal
-0.5
-0.4
-0.3
-0.2
-0.1
0
0.1
0.2
1994 1996 1998 2000 2002 2004
Italy
-0.5
-0.4
-0.3
-0.2
-0.1
0
0.1
0.2
1994 1996 1998 2000 2002 2004
Greece
-0.5
-0.4
-0.3
-0.2
-0.1
0
0.1
0.2
1994 1996 1998 2000 2002 2004
France
-0.5
-0.4
-0.3
-0.2
-0.1
0
0.1
0.2
1994 1996 1998 2000 2002 2004
Traditional and new products Traditional and Discontinued productsProducts exported on a continuous basis (traditional products)
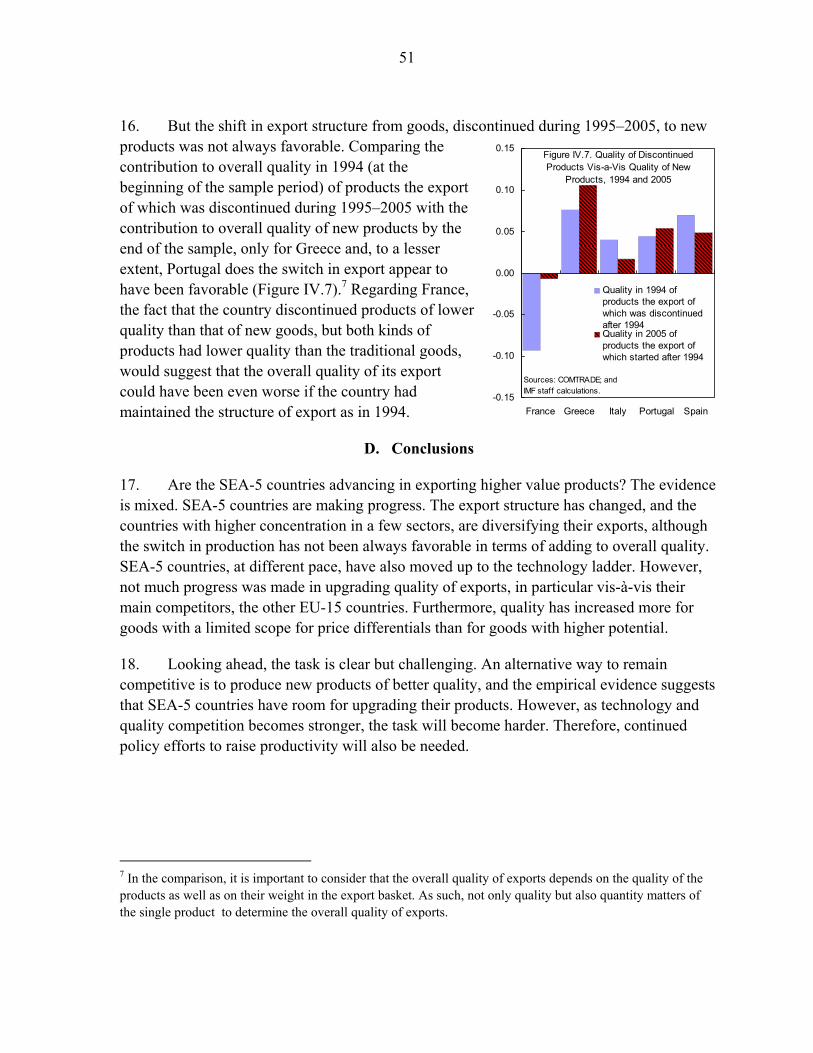
51
16. But the shift in export structure from goods, discontinued during 1995–2005, to new products was not always favorable. Comparing the contribution to overall quality in 1994 (at the beginning of the sample period) of products the export of which was discontinued during 1995–2005 with the contribution to overall quality of new products by the end of the sample, only for Greece and, to a lesser extent, Portugal does the switch in export appear to have been favorable (Figure IV.7).7 Regarding France, the fact that the country discontinued products of lower quality than that of new goods, but both kinds of products had lower quality than the traditional goods, would suggest that the overall quality of its export could have been even worse if the country had maintained the structure of export as in 1994.
D. Conclusions
17. Are the SEA-5 countries advancing in exporting higher value products? The evidence is mixed. SEA-5 countries are making progress. The export structure has changed, and the countries with higher concentration in a few sectors, are diversifying their exports, although the switch in production has not been always favorable in terms of adding to overall quality. SEA-5 countries, at different pace, have also moved up to the technology ladder. However, not much progress was made in upgrading quality of exports, in particular vis-à-vis their main competitors, the other EU-15 countries. Furthermore, quality has increased more for goods with a limited scope for price differentials than for goods with higher potential.
18. Looking ahead, the task is clear but challenging. An alternative way to remain competitive is to produce new products of better quality, and the empirical evidence suggests that SEA-5 countries have room for upgrading their products. However, as technology and quality competition becomes stronger, the task will become harder. Therefore, continued policy efforts to raise productivity will also be needed.
7 In the comparison, it is important to consider that the overall quality of exports depends on the quality of the products as well as on their weight in the export basket. As such, not only quality but also quantity matters of the single product to determine the overall quality of exports.
Figure IV.7. Quality of Discontinued Products Vis-a-Vis Quality of New
Products, 1994 and 2005
-0.15
-0.10
-0.05
0.00
0.05
0.10
0.15
France Greece Italy Portugal Spain
Quality in 1994 ofproducts the export ofwhich was discontinuedafter 1994Quality in 2005 ofproducts the export ofwhich started after 1994
Sources: COMTRADE; and IMF staff calculations.
52
References
Copeland, B. R., and A. Kotwal, 1996, “Product Quality and the Theory of Comparative Advantage,” European Economic Review, Vol. 40, pp. 1745–60.
Dulleck, U., and others, 2005, “Dimensions of Quality Upgrading,” Economics of Transition,
Vol. 13 (No. 1), pp. 51–76. Fabrizio, S., D. Igan, and A. Mody, 2007, “The Dynamics of Product Quality and
International Competitiveness,” IMF Working Paper No. 07/97. Hallak, J.C., 2006, “Product Quality and the Direction of Trade,” Journal of International
Economics, Vol. 68 (January), pp. 238–65. ———, and P. Schott, 2005, “Estimating Cross-Country Differences in Product Quality,”
Working Paper (University of Michigan, Ann Arbor and Yale University). Hatzichronoglou, T., 1997, “Revision of the High-Technology Sector and Product
Classification,” OECD Science, Technology and Industry Working Papers 1997/2, (Paris: OECD, Directorate for Science, Technology and Industry).
Hummels, D., and P. Klenow, 2005, “The Variety and Quality of a Nation’s Exports,”
American Economic Review, Vol. 95, pp. 704–23. Landesmann, M., 2003, “Structural Features of Economic Integration in an Enlarged Europe:
Patterns of Catching-Up and Industrial Specialization,” European Commission DG-EcoFin Economic Papers No. 181.
Murphy, K., and A. Shleifer, 1997, “Quality and Trade,” Journal of Development
Economics, Vol. 53, pp. 1–15. Rauch, J. E., 1999, “Networks versus Markets in International Trade,” Journal of
International Economics, Vol. 48 (No. 1), pp. 959–73.
53
Appendix IV.A
The Appendix reports on the data sources, industry taxonomies, construction of the UVR, and selected products under the Rauch classification of goods.
Data sources
The trade data are from the UN Comtrade database and consist the trade values and quantities of export flows. The export data are at the six-digit product level, according to the Harmonized System (HS) classification. For each product, an observation consists of the country of origin, time, trade value in dollars, quantity, and units in which the quantity is expressed. Construction of variables
We construct measures of technology and quality change at the country level using the detailed trade data at the product level. As in similar studies, the sample of products is limited to those of the manufacturing sectors. We use the Classification of Economic Activities in the European Community (NACE). Manufactures of coke products, refined petroleum products, and nuclear fuel are excluded from the analysis.
The technology content of products is based on the taxonomy provided by Hatzichronoglou (1997). Products are classified into four groups: high technology, medium-high technology, medium-low technology, and low technology. This classification is based on a cutoff procedure using R&D intensities in select OECD economies in two-digit International Standard Industrial Classification (ISIC) product categories.
The measure of product quality is the relative unit value of a country’s exports with respect to the unit value of competitors’ exports to a given market. Referred to as the “unit value ratio (UVR)” and commonly used in the trade literature, this concept of measuring quality by relative unit value has its basis in the idea that consumers would be willing to pay more for the same product if they perceive it to be of better quality.
We first calculate the unit value of each product that a specific country exports by dividing the trade value by the quantity. Then, we calculate the competitors’ unit value for the same basket of goods. We then divide the country’s unit value for each product in the basket by the competitors’ unit value for the corresponding products. Finally, we aggregate these product unit value ratios into a single unit value ratio, using the weights of each product in the overall exports of the country. The reported UVR takes the logarithm of this ratio. Hence, a negative UVR corresponds to a quality lower than world standard.
Note: First, to calculate the UVR, we considered quantities expressed in the same units across the sample of countries. Second, the weights used in aggregating the country’s
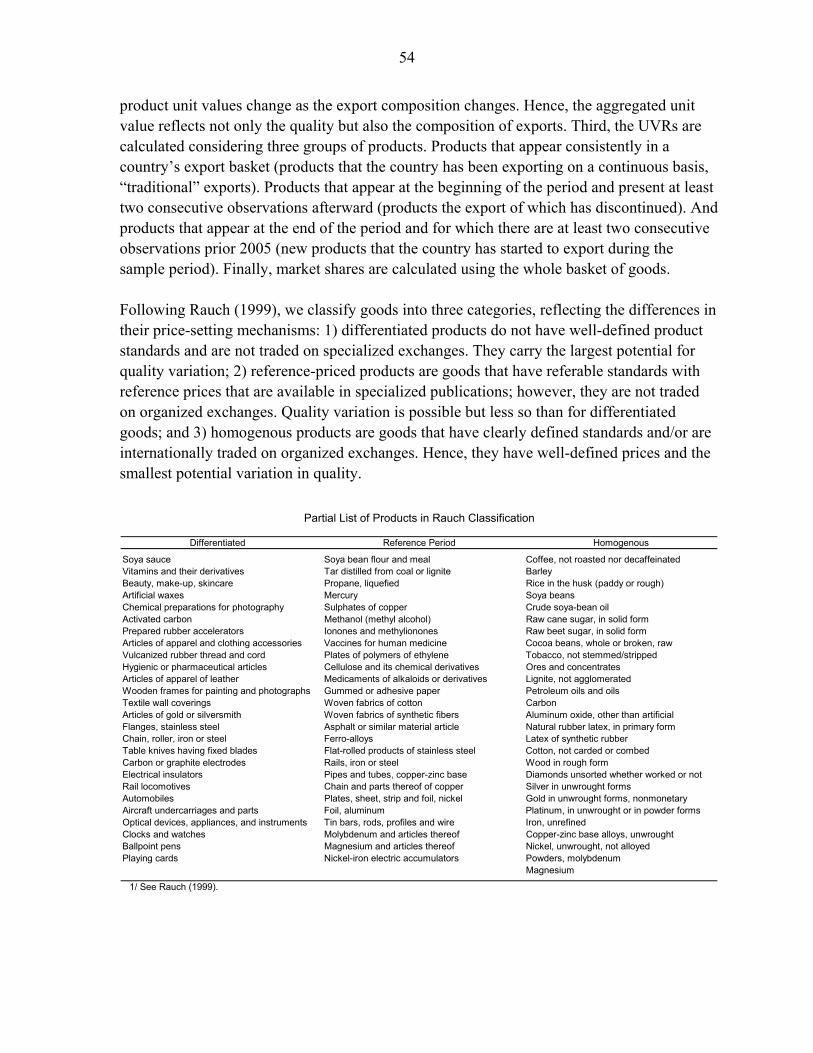
54
product unit values change as the export composition changes. Hence, the aggregated unit value reflects not only the quality but also the composition of exports. Third, the UVRs are calculated considering three groups of products. Products that appear consistently in a country’s export basket (products that the country has been exporting on a continuous basis, “traditional” exports). Products that appear at the beginning of the period and present at least two consecutive observations afterward (products the export of which has discontinued). And products that appear at the end of the period and for which there are at least two consecutive observations prior 2005 (new products that the country has started to export during the sample period). Finally, market shares are calculated using the whole basket of goods. Following Rauch (1999), we classify goods into three categories, reflecting the differences in their price-setting mechanisms: 1) differentiated products do not have well-defined product standards and are not traded on specialized exchanges. They carry the largest potential for quality variation; 2) reference-priced products are goods that have referable standards with reference prices that are available in specialized publications; however, they are not traded on organized exchanges. Quality variation is possible but less so than for differentiated goods; and 3) homogenous products are goods that have clearly defined standards and/or are internationally traded on organized exchanges. Hence, they have well-defined prices and the smallest potential variation in quality.
Partial List of Products in Rauch Classification
Differentiated Reference Period Homogenous
Soya sauce Soya bean flour and meal Coffee, not roasted nor decaffeinatedVitamins and their derivatives Tar distilled from coal or lignite BarleyBeauty, make-up, skincare Propane, liquefied Rice in the husk (paddy or rough)Artificial waxes Mercury Soya beansChemical preparations for photography Sulphates of copper Crude soya-bean oilActivated carbon Methanol (methyl alcohol) Raw cane sugar, in solid formPrepared rubber accelerators Ionones and methylionones Raw beet sugar, in solid formArticles of apparel and clothing accessories Vaccines for human medicine Cocoa beans, whole or broken, rawVulcanized rubber thread and cord Plates of polymers of ethylene Tobacco, not stemmed/strippedHygienic or pharmaceutical articles Cellulose and its chemical derivatives Ores and concentratesArticles of apparel of leather Medicaments of alkaloids or derivatives Lignite, not agglomeratedWooden frames for painting and photographs Gummed or adhesive paper Petroleum oils and oilsTextile wall coverings Woven fabrics of cotton CarbonArticles of gold or silversmith Woven fabrics of synthetic fibers Aluminum oxide, other than artificialFlanges, stainless steel Asphalt or similar material article Natural rubber latex, in primary formChain, roller, iron or steel Ferro-alloys Latex of synthetic rubberTable knives having fixed blades Flat-rolled products of stainless steel Cotton, not carded or combedCarbon or graphite electrodes Rails, iron or steel Wood in rough formElectrical insulators Pipes and tubes, copper-zinc base Diamonds unsorted whether worked or notRail locomotives Chain and parts thereof of copper Silver in unwrought formsAutomobiles Plates, sheet, strip and foil, nickel Gold in unwrought forms, nonmonetaryAircraft undercarriages and parts Foil, aluminum Platinum, in unwrought or in powder formsOptical devices, appliances, and instruments Tin bars, rods, profiles and wire Iron, unrefinedClocks and watches Molybdenum and articles thereof Copper-zinc base alloys, unwroughtBallpoint pens Magnesium and articles thereof Nickel, unwrought, not alloyedPlaying cards Nickel-iron electric accumulators Powders, molybdenum
Magnesium
1/ See Rauch (1999).
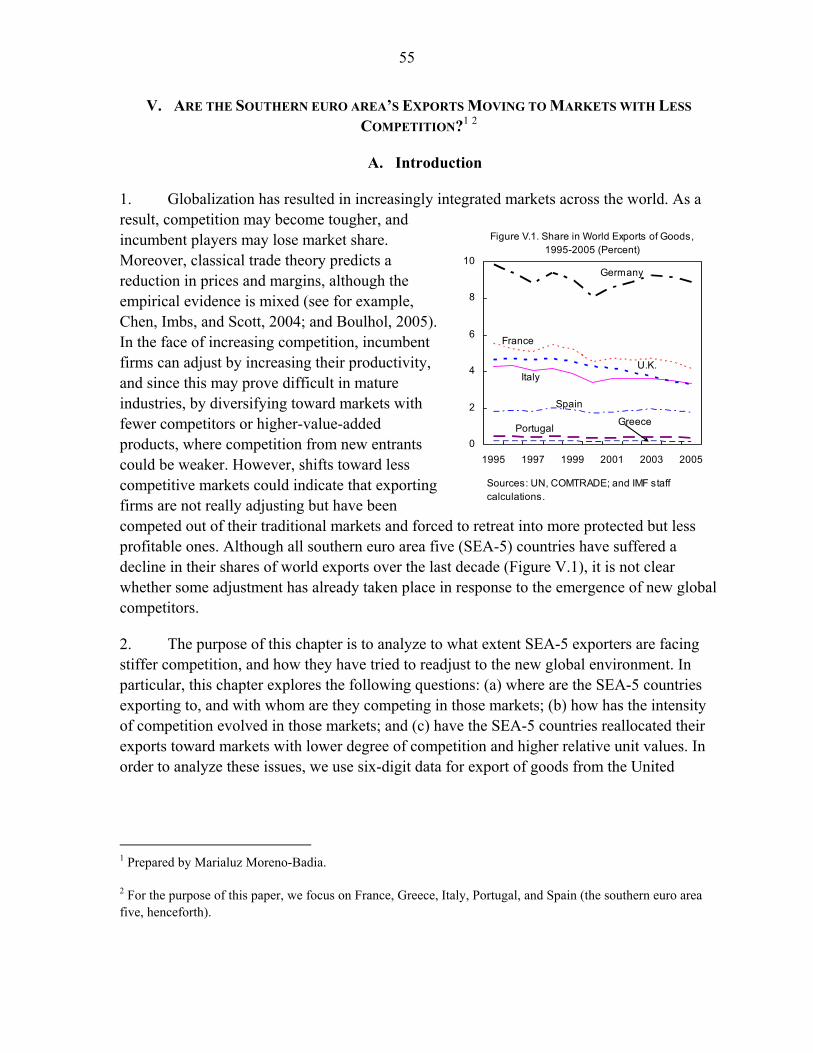
55
V. ARE THE SOUTHERN EURO AREA’S EXPORTS MOVING TO MARKETS WITH LESS COMPETITION?1 2
A. Introduction
1. Globalization has resulted in increasingly integrated markets across the world. As a result, competition may become tougher, and incumbent players may lose market share. Moreover, classical trade theory predicts a reduction in prices and margins, although the empirical evidence is mixed (see for example, Chen, Imbs, and Scott, 2004; and Boulhol, 2005). In the face of increasing competition, incumbent firms can adjust by increasing their productivity, and since this may prove difficult in mature industries, by diversifying toward markets with fewer competitors or higher-value-added products, where competition from new entrants could be weaker. However, shifts toward less competitive markets could indicate that exporting firms are not really adjusting but have been competed out of their traditional markets and forced to retreat into more protected but less profitable ones. Although all southern euro area five (SEA-5) countries have suffered a decline in their shares of world exports over the last decade (Figure V.1), it is not clear whether some adjustment has already taken place in response to the emergence of new global competitors.
2. The purpose of this chapter is to analyze to what extent SEA-5 exporters are facing stiffer competition, and how they have tried to readjust to the new global environment. In particular, this chapter explores the following questions: (a) where are the SEA-5 countries exporting to, and with whom are they competing in those markets; (b) how has the intensity of competition evolved in those markets; and (c) have the SEA-5 countries reallocated their exports toward markets with lower degree of competition and higher relative unit values. In order to analyze these issues, we use six-digit data for export of goods from the United
1 Prepared by Marialuz Moreno-Badia.
2 For the purpose of this paper, we focus on France, Greece, Italy, Portugal, and Spain (the southern euro area five, henceforth).
Figure V.1. Share in World Exports of Goods, 1995-2005 (Percent)
0
2
4
6
8
10
1995 1997 1999 2001 2003 2005
France
Spain
Italy
GreecePortugal
Germany
U.K.
Sources: UN, COMTRADE; and IMF staff calculations.
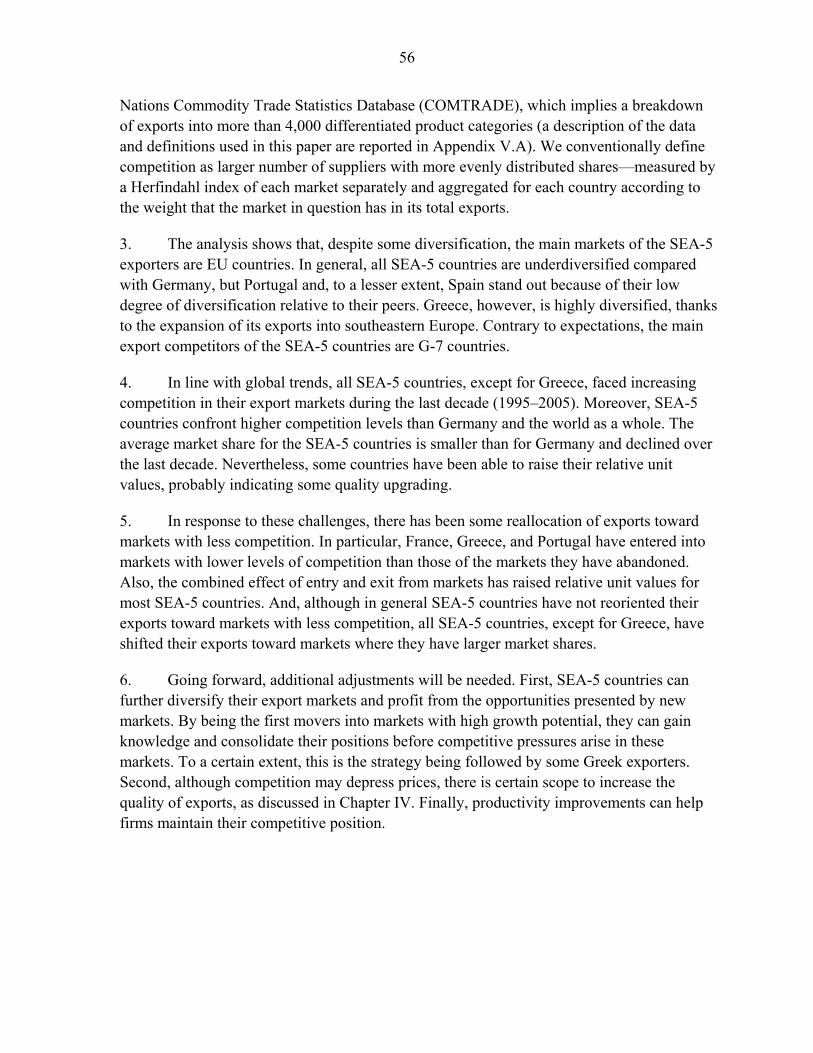
56
Nations Commodity Trade Statistics Database (COMTRADE), which implies a breakdown of exports into more than 4,000 differentiated product categories (a description of the data and definitions used in this paper are reported in Appendix V.A). We conventionally define competition as larger number of suppliers with more evenly distributed shares—measured by a Herfindahl index of each market separately and aggregated for each country according to the weight that the market in question has in its total exports.
3. The analysis shows that, despite some diversification, the main markets of the SEA-5 exporters are EU countries. In general, all SEA-5 countries are underdiversified compared with Germany, but Portugal and, to a lesser extent, Spain stand out because of their low degree of diversification relative to their peers. Greece, however, is highly diversified, thanks to the expansion of its exports into southeastern Europe. Contrary to expectations, the main export competitors of the SEA-5 countries are G-7 countries.
4. In line with global trends, all SEA-5 countries, except for Greece, faced increasing competition in their export markets during the last decade (1995–2005). Moreover, SEA-5 countries confront higher competition levels than Germany and the world as a whole. The average market share for the SEA-5 countries is smaller than for Germany and declined over the last decade. Nevertheless, some countries have been able to raise their relative unit values, probably indicating some quality upgrading.
5. In response to these challenges, there has been some reallocation of exports toward markets with less competition. In particular, France, Greece, and Portugal have entered into markets with lower levels of competition than those of the markets they have abandoned. Also, the combined effect of entry and exit from markets has raised relative unit values for most SEA-5 countries. And, although in general SEA-5 countries have not reoriented their exports toward markets with less competition, all SEA-5 countries, except for Greece, have shifted their exports toward markets where they have larger market shares.
6. Going forward, additional adjustments will be needed. First, SEA-5 countries can further diversify their export markets and profit from the opportunities presented by new markets. By being the first movers into markets with high growth potential, they can gain knowledge and consolidate their positions before competitive pressures arise in these markets. To a certain extent, this is the strategy being followed by some Greek exporters. Second, although competition may depress prices, there is certain scope to increase the quality of exports, as discussed in Chapter IV. Finally, productivity improvements can help firms maintain their competitive position.

57
B. Where are the Exports Going, and Who are the Main Competitors?
7. SEA-5 countries have diversified their exports across geographic markets since the mid-1990s, but the European Union remains the most important export destination (Table V.1). Although all SEA-5 countries are underdiversified compared with Germany, there are considerable differences among them (Figure V.2). Greece, which had one of the highest levels of export concentration in 1995, has become the most diversified country of the SEA-5 countries, thanks to its entry into southeastern Europe. By contrast, Portugal, which was the least diversified at the beginning of the period, is still lagging behind, partly due to its dependence on the Spanish market. Spain, despite improvements, has also a low degree of diversification compared with its peers, while Italy and France have increased their diversification, and are now close to world market averages.
8. The SEA-5’s main export competitors are G-7 countries. However, China is among the top five competitors for Greece, Portugal, and Italy (Table V.2). In order to measure the overlap between SEA countries’ export bundles and those of their main competitors, we use the export similarity index developed by Finger and Kreinin (1979). This index takes a value of 1 if two countries have identical exports and a value of 0 if their export patterns are totally
Destination Share 2005 2/ Destination Share
2005 2/ Destination Share 2005 2/ Destination Share
2005 2/ Destination Share 2005 2/
BEL 8.7 ALB 2.7 AUT 2.4 AUT 1.3 BEL 3.2CHE 2.7 BEL 1.5 BEL 3.0 BEL 4.8 DEU 12.5CHN 2.1 BGR 5.7 CHE 3.9 DEU 13.6 FRA 18.9DEU 15.7 CYP 6.8 CHN 2.1 ESP 25.4 GBR 9.8ESP 9.7 DEU 13.6 DEU 13.3 FRA 12.4 ITA 9.1GBR 8.8 ESP 4.0 ESP 7.3 GBR 9.2 MEX 1.9ITA 9.0 FRA 4.1 FRA 12.2 ITA 4.7 NLD 2.8JPN 2.0 GBR 7.8 GBR 6.6 NLD 3.3 PRT 9.9NLD 3.3 ITA 12.0 GRC 2.0 SWE 1.0 TUR 2.0USA 8.3 NLD 2.1 JPN 2.0 USA 6.6 USA 5.1
ROM 2.9 NLD 1.9RUS 1.2 POL 2.1TUR 4.5 ROM 1.9USA 6.3 TUR 2.2
USA 9.6
Sources: UN, COMTRADE; and IMF staff calculations.
1/ Top geographic markets accounting for at least 70 percent of the corresponding southern euro area fivecountry's exports during 1995–2005.
2/ Percentage of the corresponding southern euro area five country's exports that went to a particulargeographic destination in 2005.
Spain
Table V.1. Southern euro area Five: Main Geographic Destinations of Exports, 1995–2005 1/
France Greece Italy Portugal
(Share, in percent)
Figure V.2. Geographic Diversification (1995-2005) 1/
0.02
0.04
0.06
0.08
0.10
0.12
0.14
1995 1997 1999 2001 2003 2005
Her
finda
hl in
dex
Portugal
Spain
Greece
FranceItalyU.K.
GermanyWorld
Sources: UN, COMTRADE; and IMF staff calculations.1/ A higher Herfindahl index indicates less diversification.

58
dissimilar. Based on this measure, Greece, Italy, and Spain’s overlap with their main competitors decreased over the last decade while the opposite applied to Portugal (Figure V.3). France’s export similarity with its main competitors—the highest among the SEA-5—remained broadly unchanged.
C. Is Competition Becoming Tougher?
9. Concentration among exporters in a given market is measured by the Herfindahl index. This index has been extensively used in the literature to convey information about the distribution of market shares among firms in a specific market (Hennessy and Lapan, 2007; and Mirza, 2006). For this analysis, we define a market as a pair consisting a geographic destination and a product. The indicator of overall concentration is the sum of Herfindahl indices across all markets, weighted by the export shares of each market. Similar results are obtained using entropy as a measure of market concentration. The basic idea of this measure is that the higher the number of countries exporting into a market and the smaller their market share (lower Herfindahl index), the stiffer will be the competition in that market. However, caution must be applied in interpreting results, since we focus on the competition among exporters in a given market without considering domestic producers, the number of firms involved, or the evolution of markups.
10. Based on the Herfindahl indices, all SEA-5 countries, except for Greece, faced increasing competition in their export markets during the last decade. This trend is similar to that of other large European countries (Germany and the U.K.), although the increase was smaller for Italy, Spain, and Portugal (Figure V.4). SEA-5 countries face stiffer competition than Germany and the world as a whole, but the difference is not large for Spain and France. The average market share for the SEA-5 countries is lower than for Germany and, not surprisingly, has declined over time, even in the case of Greece, where the intensity of competition has declined as well (Figure V. 5).
France Italy Greece Portugal SpainDEU DEU DEU DEU DEUNLD CHN ITA FRA FRAUSA FRA FRA CHN USAGBR USA NLD ITA NLDITA NLD CHN NLD ITAJPN GBR USA GBR
USA
Sources: UN, COMTRADE; and IMF staffcalculations.
1/ Countries that were among the top fivecompetitors during 1995–2005. Importance ofa competitor is determined by its exportshare in each geographic destination/industry(double weighting). Competitors are sorted inorder of importance (as of 2005), startingfrom the top.
Table V.2. Top Competitors 1/ Figure V.3. Index of Export Similarity, 1995-2004 1/
0.00
0.15
0.30
0.45
1995 1996 1997 1998 1999 2000 2001 2002 2003 2004
France
Spain
Italy
Portugal
Greece
Sources: UN, COMTRADE; and IMF staff calculations.1/ Weighted average of the indices of export similarity with main competitors. A higher index indicates greater export similarity.
U.K.
Germany
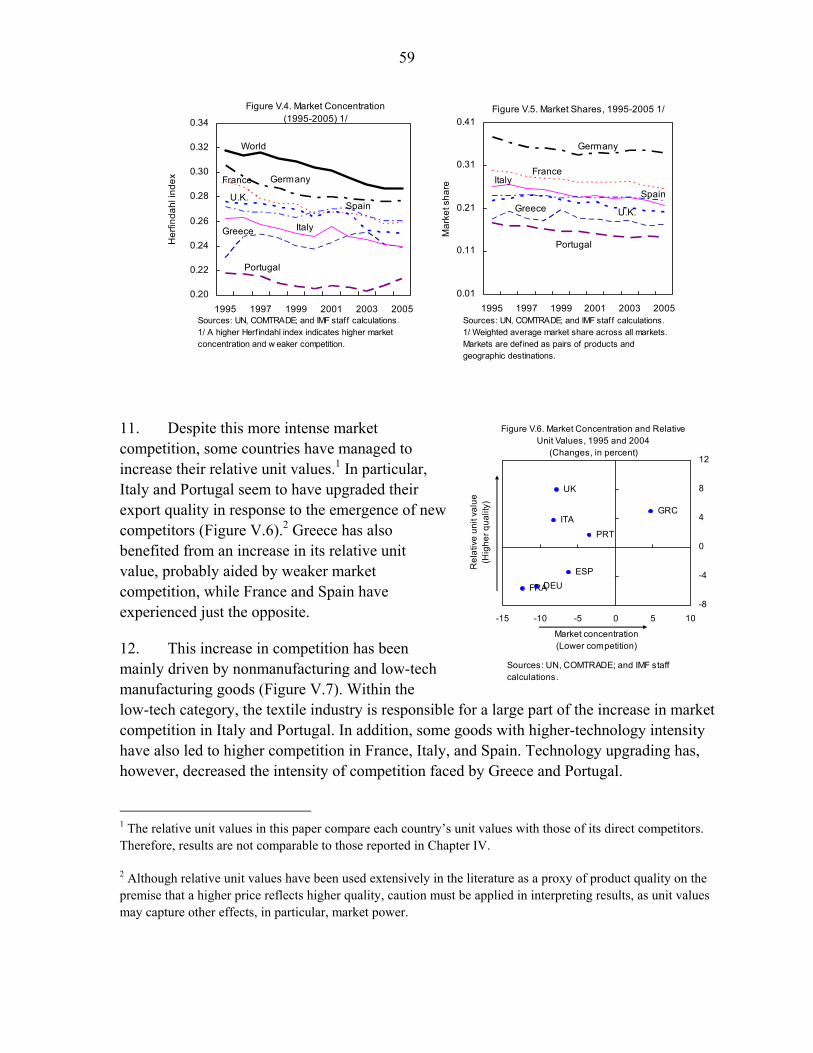
59
11. Despite this more intense market competition, some countries have managed to increase their relative unit values.1 In particular, Italy and Portugal seem to have upgraded their export quality in response to the emergence of new competitors (Figure V.6).2 Greece has also benefited from an increase in its relative unit value, probably aided by weaker market competition, while France and Spain have experienced just the opposite.
12. This increase in competition has been mainly driven by nonmanufacturing and low-tech manufacturing goods (Figure V.7). Within the low-tech category, the textile industry is responsible for a large part of the increase in market competition in Italy and Portugal. In addition, some goods with higher-technology intensity have also led to higher competition in France, Italy, and Spain. Technology upgrading has, however, decreased the intensity of competition faced by Greece and Portugal.
1 The relative unit values in this paper compare each country’s unit values with those of its direct competitors. Therefore, results are not comparable to those reported in Chapter IV.
2 Although relative unit values have been used extensively in the literature as a proxy of product quality on the premise that a higher price reflects higher quality, caution must be applied in interpreting results, as unit values may capture other effects, in particular, market power.
Figure V.4. Market Concentration(1995-2005) 1/
0.20
0.22
0.24
0.26
0.28
0.30
0.32
0.34
1995 1997 1999 2001 2003 2005
Her
finda
hl in
dex
World
France
Spain
ItalyGreece
Portugal
Germany
U.K.
Sources: UN, COMTRADE; and IMF staff calculations.1/ A higher Herfindahl index indicates higher market concentration and w eaker competition.
Figure V.5. Market Shares, 1995-2005 1/
0.01
0.11
0.21
0.31
0.41
1995 1997 1999 2001 2003 2005
Mar
ket s
hare
France
SpainItaly
Greece
Portugal
Germany
U.K.
Sources: UN, COMTRADE; and IMF staff calculations.1/ Weighted average market share across all markets. Markets are defined as pairs of products and geographic destinations.
Figure V.6. Market Concentration and Relative Unit Values, 1995 and 2004
(Changes, in percent)
FRADEU
GRCITA
PRT
ESP
UK
-8
-4
0
4
8
12
-15 -10 -5 0 5 10
Market concentration(Lower competition)
Rel
ativ
e un
it va
lue
(Hig
her q
ualit
y)
Sources: UN, COMTRADE; and IMF staff calculations.
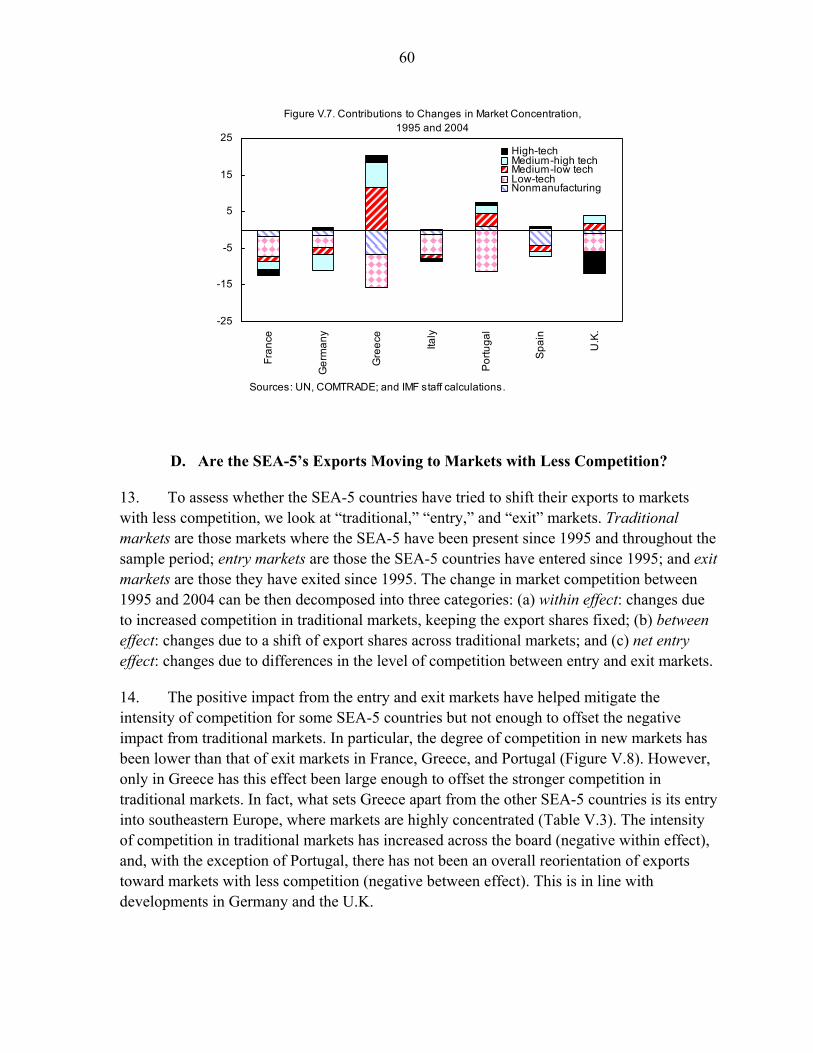
60
D. Are the SEA-5’s Exports Moving to Markets with Less Competition?
13. To assess whether the SEA-5 countries have tried to shift their exports to markets with less competition, we look at “traditional,” “entry,” and “exit” markets. Traditional markets are those markets where the SEA-5 have been present since 1995 and throughout the sample period; entry markets are those the SEA-5 countries have entered since 1995; and exit markets are those they have exited since 1995. The change in market competition between 1995 and 2004 can be then decomposed into three categories: (a) within effect: changes due to increased competition in traditional markets, keeping the export shares fixed; (b) between effect: changes due to a shift of export shares across traditional markets; and (c) net entry effect: changes due to differences in the level of competition between entry and exit markets.
14. The positive impact from the entry and exit markets have helped mitigate the intensity of competition for some SEA-5 countries but not enough to offset the negative impact from traditional markets. In particular, the degree of competition in new markets has been lower than that of exit markets in France, Greece, and Portugal (Figure V.8). However, only in Greece has this effect been large enough to offset the stronger competition in traditional markets. In fact, what sets Greece apart from the other SEA-5 countries is its entry into southeastern Europe, where markets are highly concentrated (Table V.3). The intensity of competition in traditional markets has increased across the board (negative within effect), and, with the exception of Portugal, there has not been an overall reorientation of exports toward markets with less competition (negative between effect). This is in line with developments in Germany and the U.K.
Figure V.7. Contributions to Changes in Market Concentration, 1995 and 2004
-25
-15
-5
5
15
25
Fran
ce
Ger
man
y
Gre
ece
Italy
Por
tuga
l
Spai
n
U.K
.
High-techMedium-high techMedium-low techLow-techNonmanufacturing
Sources: UN, COMTRADE; and IMF staff calculations.
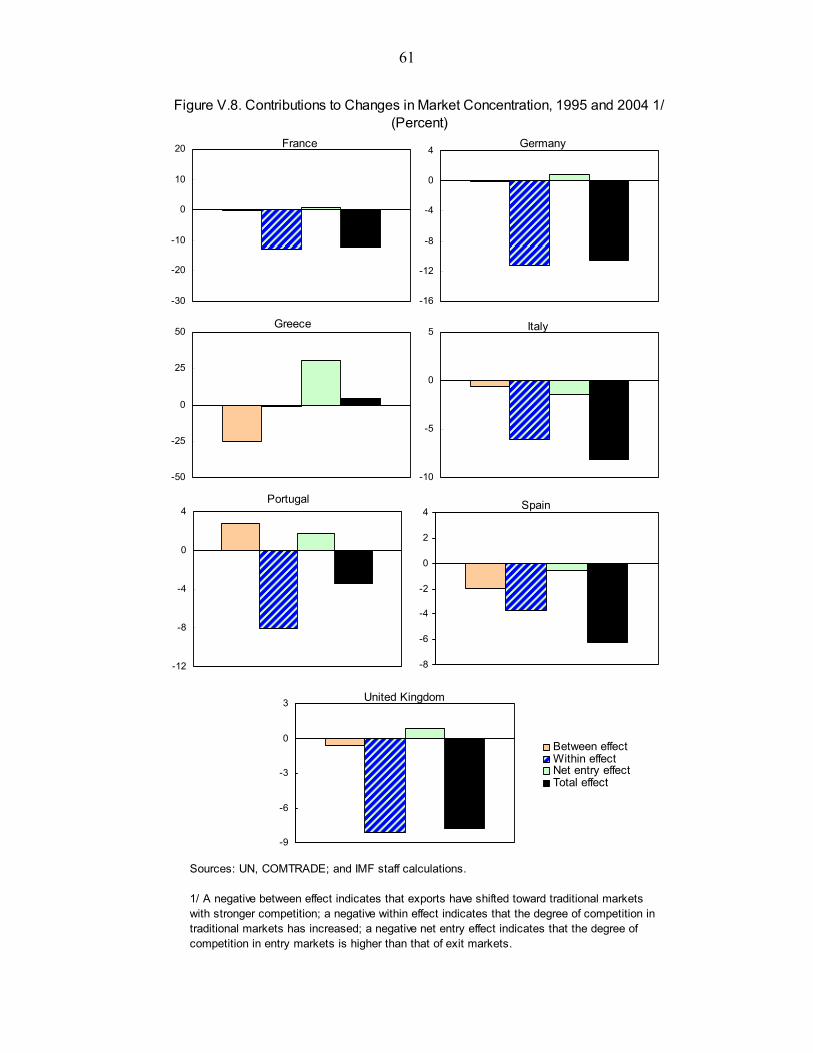
61
Figure V.8. Contributions to Changes in Market Concentration, 1995 and 2004 1/(Percent)
Sources: UN, COMTRADE; and IMF staff calculations.
1/ A negative between effect indicates that exports have shifted toward traditional markets with stronger competition; a negative within effect indicates that the degree of competition in traditional markets has increased; a negative net entry effect indicates that the degree of competition in entry markets is higher than that of exit markets.
France
-30
-20
-10
0
10
20 Germany
-16
-12
-8
-4
0
4
Greece
-50
-25
0
25
50 Italy
-10
-5
0
5
Spain
-8
-6
-4
-2
0
2
4
United Kingdom
-9
-6
-3
0
3
Between effect Within effectNet entry effectTotal effect
Portugal
-12
-8
-4
0
4
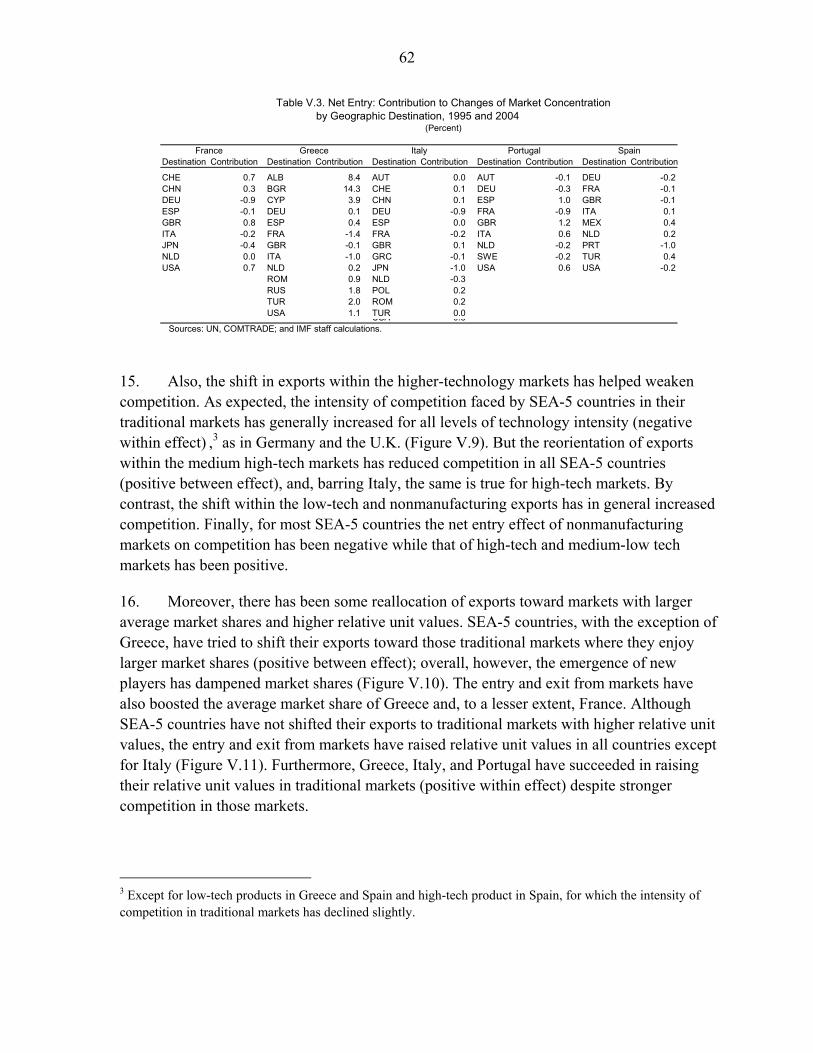
62
15. Also, the shift in exports within the higher-technology markets has helped weaken competition. As expected, the intensity of competition faced by SEA-5 countries in their traditional markets has generally increased for all levels of technology intensity (negative within effect) ,3 as in Germany and the U.K. (Figure V.9). But the reorientation of exports within the medium high-tech markets has reduced competition in all SEA-5 countries (positive between effect), and, barring Italy, the same is true for high-tech markets. By contrast, the shift within the low-tech and nonmanufacturing exports has in general increased competition. Finally, for most SEA-5 countries the net entry effect of nonmanufacturing markets on competition has been negative while that of high-tech and medium-low tech markets has been positive.
16. Moreover, there has been some reallocation of exports toward markets with larger average market shares and higher relative unit values. SEA-5 countries, with the exception of Greece, have tried to shift their exports toward those traditional markets where they enjoy larger market shares (positive between effect); overall, however, the emergence of new players has dampened market shares (Figure V.10). The entry and exit from markets have also boosted the average market share of Greece and, to a lesser extent, France. Although SEA-5 countries have not shifted their exports to traditional markets with higher relative unit values, the entry and exit from markets have raised relative unit values in all countries except for Italy (Figure V.11). Furthermore, Greece, Italy, and Portugal have succeeded in raising their relative unit values in traditional markets (positive within effect) despite stronger competition in those markets.
3 Except for low-tech products in Greece and Spain and high-tech product in Spain, for which the intensity of competition in traditional markets has declined slightly.
Table V.3. Net Entry: Contribution to Changes of Market Concentrationby Geographic Destination, 1995 and 2004
(Percent)
Destination Contribution Destination Contribution Destination Contribution Destination Contribution Destination Contribution
CHE 0.7 ALB 8.4 AUT 0.0 AUT -0.1 DEU -0.2CHN 0.3 BGR 14.3 CHE 0.1 DEU -0.3 FRA -0.1DEU -0.9 CYP 3.9 CHN 0.1 ESP 1.0 GBR -0.1ESP -0.1 DEU 0.1 DEU -0.9 FRA -0.9 ITA 0.1GBR 0.8 ESP 0.4 ESP 0.0 GBR 1.2 MEX 0.4ITA -0.2 FRA -1.4 FRA -0.2 ITA 0.6 NLD 0.2JPN -0.4 GBR -0.1 GBR 0.1 NLD -0.2 PRT -1.0NLD 0.0 ITA -1.0 GRC -0.1 SWE -0.2 TUR 0.4USA 0.7 NLD 0.2 JPN -1.0 USA 0.6 USA -0.2
ROM 0.9 NLD -0.3RUS 1.8 POL 0.2TUR 2.0 ROM 0.2USA 1.1 TUR 0.0USA 0.3
Sources: UN, COMTRADE; and IMF staff calculations.
France Greece Italy Portugal Spain
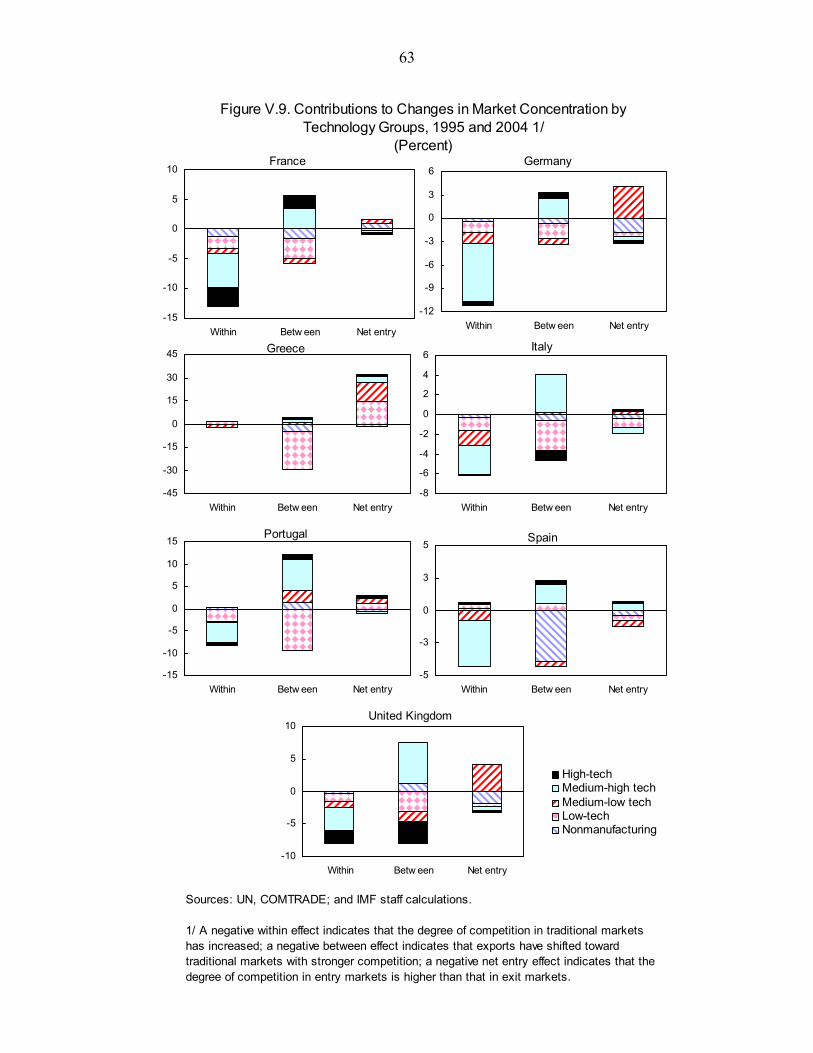
63
Figure V.9. Contributions to Changes in Market Concentration by Technology Groups, 1995 and 2004 1/
(Percent)
Sources: UN, COMTRADE; and IMF staff calculations.
1/ A negative within effect indicates that the degree of competition in traditional markets has increased; a negative between effect indicates that exports have shifted toward traditional markets with stronger competition; a negative net entry effect indicates that the degree of competition in entry markets is higher than that in exit markets.
France
-15
-10
-5
0
5
10
Within Betw een Net entry
Germany
-12
-9
-6
-3
0
3
6
Within Betw een Net entry
Greece
-45
-30
-15
0
15
30
45
Within Betw een Net entry
Italy
-8
-6
-4
-2
0
2
4
6
Within Betw een Net entry
Portugal
-15
-10
-5
0
5
10
15
Within Betw een Net entry
Spain
-5
-3
0
3
5
Within Betw een Net entry
United Kingdom
-10
-5
0
5
10
Within Betw een Net entry
High-tech Medium-high tech Medium-low techLow-tech Nonmanufacturing
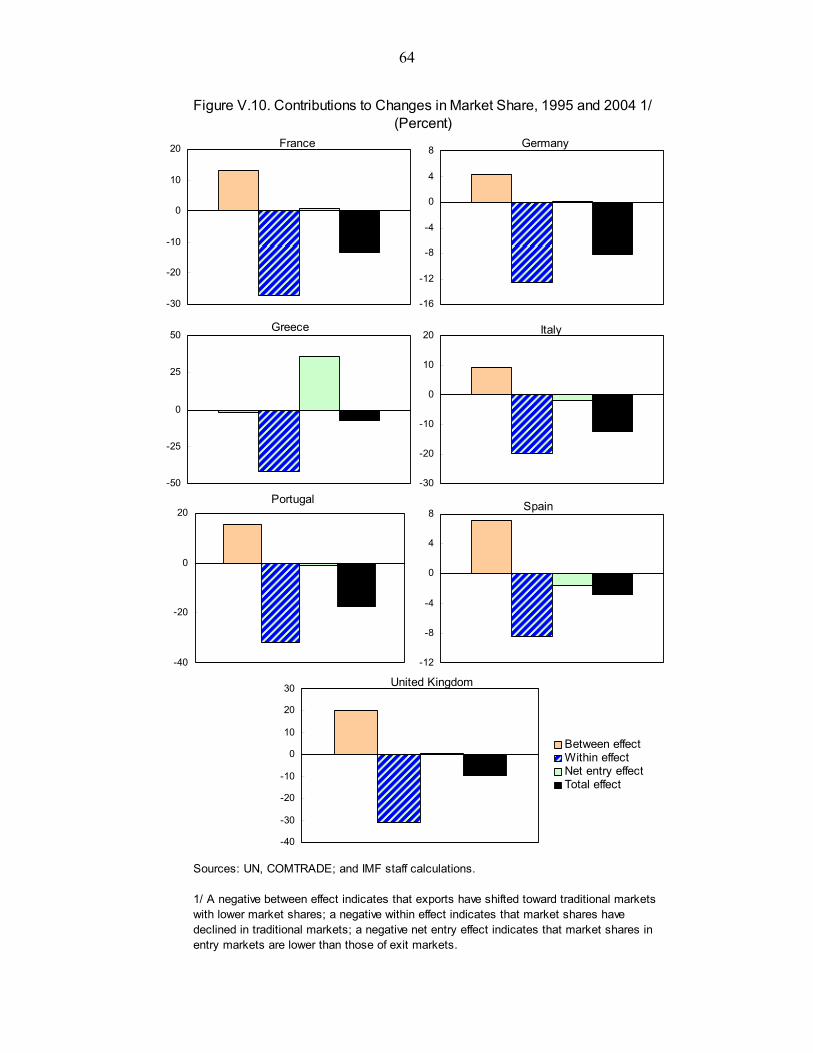
64
Figure V.10. Contributions to Changes in Market Share, 1995 and 2004 1/ (Percent)
Sources: UN, COMTRADE; and IMF staff calculations.
1/ A negative between effect indicates that exports have shifted toward traditional markets with lower market shares; a negative within effect indicates that market shares have declined in traditional markets; a negative net entry effect indicates that market shares in entry markets are lower than those of exit markets.
France
-30
-20
-10
0
10
20 Germany
-16
-12
-8
-4
0
4
8
Greece
-50
-25
0
25
50 Italy
-30
-20
-10
0
10
20
Spain
-12
-8
-4
0
4
8
United Kingdom
-40
-30
-20
-10
0
10
20
30
Between effectWithin effectNet entry effectTotal effect
Portugal
-40
-20
0
20
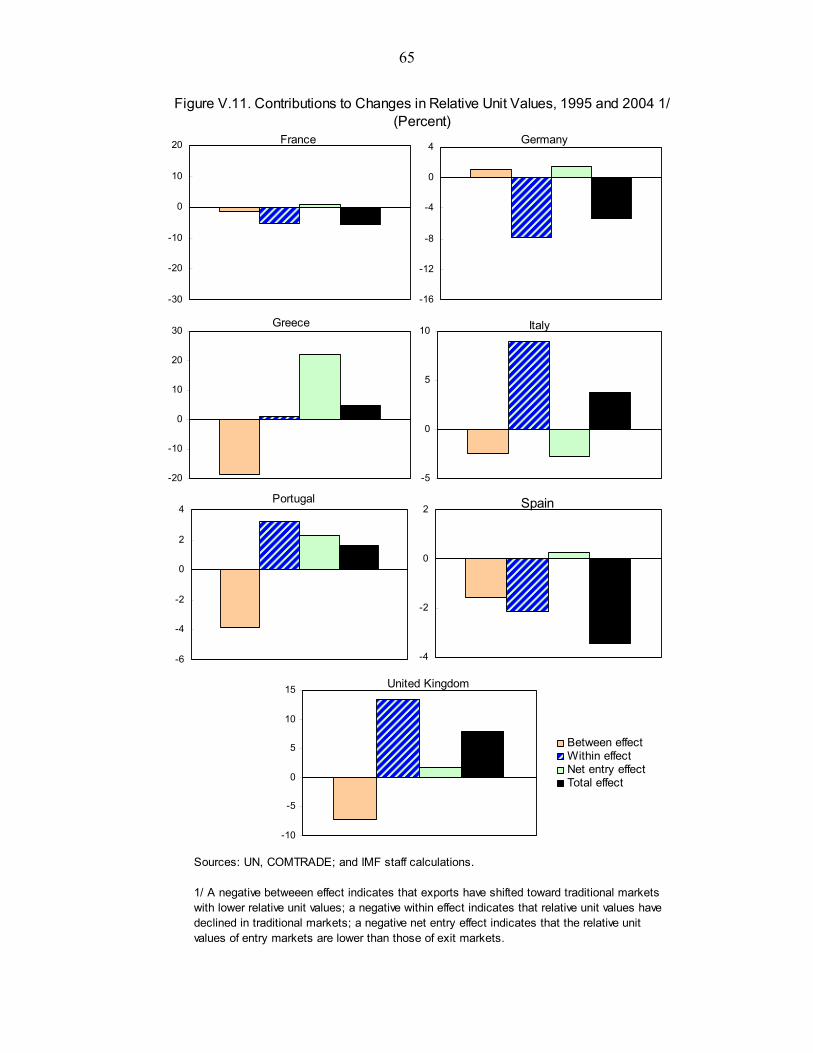
65
Figure V.11. Contributions to Changes in Relative Unit Values, 1995 and 2004 1/(Percent)
Sources: UN, COMTRADE; and IMF staff calculations.
1/ A negative betweeen effect indicates that exports have shifted toward traditional markets with lower relative unit values; a negative within effect indicates that relative unit values have declined in traditional markets; a negative net entry effect indicates that the relative unit values of entry markets are lower than those of exit markets.
France
-30
-20
-10
0
10
20 Germany
-16
-12
-8
-4
0
4
Greece
-20
-10
0
10
20
30 Italy
-5
0
5
10
Spain
-4
-2
0
2
United Kingdom
-10
-5
0
5
10
15
Between effectWithin effectNet entry effectTotal effect
Portugal
-6
-4
-2
0
2
4
66
References
Boulhol, H., 2005, “Why Haven’t Price-Cost Margins Decreased with Globalization?” unpublished (Paris: Université Panthéon-Sorbone).
Chen, N., J. Imbs, and A. Scott, 2004, “Competition, Globalization, and the Decline of
Inflation,” CEPR Discussion Papers No. 4695, (London: Centre for Economic Policy Research).
Fabrizio, S., 2008, “Are the Southern euro area Five Countries Advancing in the Search for
New and Better Products?” Competitiveness in the Southern euro area: France, Greece, Italy, Portugal, and Spain, Chapter IV, forthcoming (Washington: International Monetary Fund).
Finger, J. M., and M. E. Kreinin, 1979, “A Measure of Export ‘Similarity’ and Its Possible
Uses,” Economic Journal, Vol. 89 (No. 356), pp. 905–12. Hennessy, D. A., and H. Lapan, 2007, “When Different Market Concentration Indices
Agree,” Economics Letters, Vol. 95 (May), pp. 234–40. Mirza, D., 2006, “How Much Does Trade Contribute to Market Structure?,” Economica,
Vol. 73 (February), pp. 59–74. OECD, 2005, OECD Science, Technology, and Industry Scoreboard 2005 (Paris:
Organization for Economic Cooperation and Development).
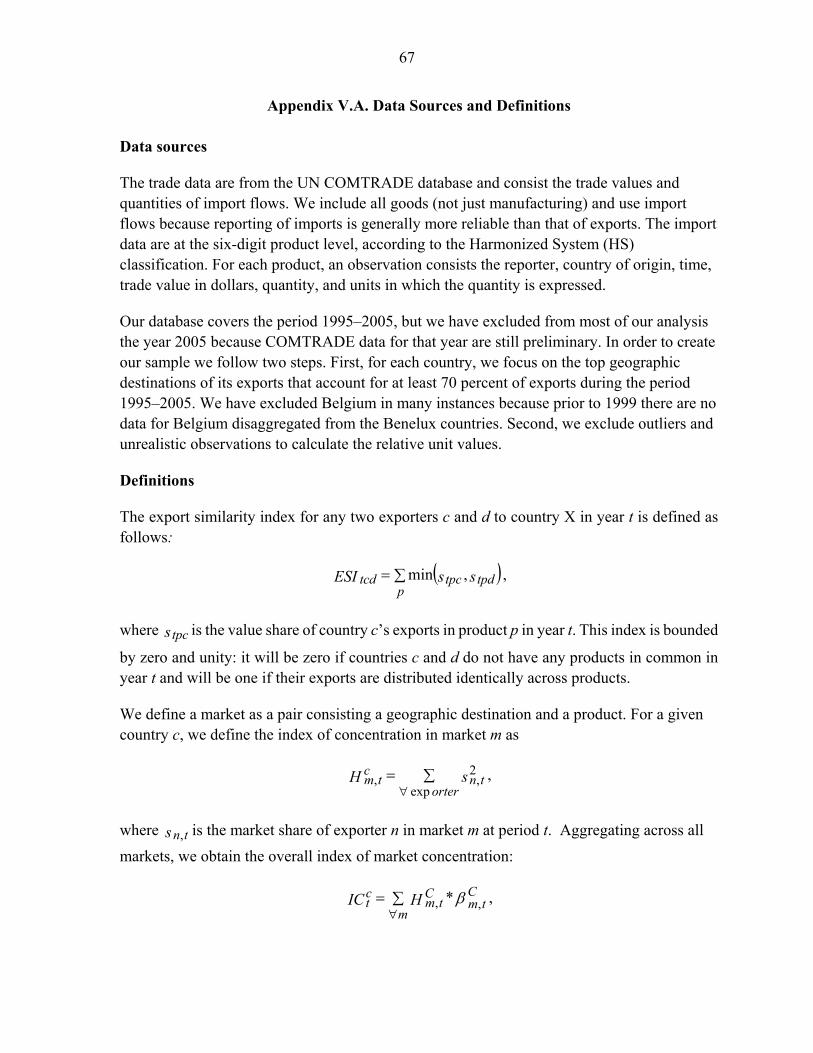
67
Appendix V.A. Data Sources and Definitions
Data sources
The trade data are from the UN COMTRADE database and consist the trade values and quantities of import flows. We include all goods (not just manufacturing) and use import flows because reporting of imports is generally more reliable than that of exports. The import data are at the six-digit product level, according to the Harmonized System (HS) classification. For each product, an observation consists the reporter, country of origin, time, trade value in dollars, quantity, and units in which the quantity is expressed.
Our database covers the period 1995–2005, but we have excluded from most of our analysis the year 2005 because COMTRADE data for that year are still preliminary. In order to create our sample we follow two steps. First, for each country, we focus on the top geographic destinations of its exports that account for at least 70 percent of exports during the period 1995–2005. We have excluded Belgium in many instances because prior to 1999 there are no data for Belgium disaggregated from the Benelux countries. Second, we exclude outliers and unrealistic observations to calculate the relative unit values.
Definitions
The export similarity index for any two exporters c and d to country X in year t is defined as follows:
( )∑=p
tpdtpctcd ssESI ,min ,
where stpc is the value share of country c’s exports in product p in year t. This index is bounded
by zero and unity: it will be zero if countries c and d do not have any products in common in year t and will be one if their exports are distributed identically across products.
We define a market as a pair consisting a geographic destination and a product. For a given country c, we define the index of concentration in market m as
∑=∀ orter
tnc
tm sHexp
2,, ,
where s tn, is the market share of exporter n in market m at period t. Aggregating across all markets, we obtain the overall index of market concentration:
∑=∀m
Ctm
Ctm
ct HIC β ,, * ,
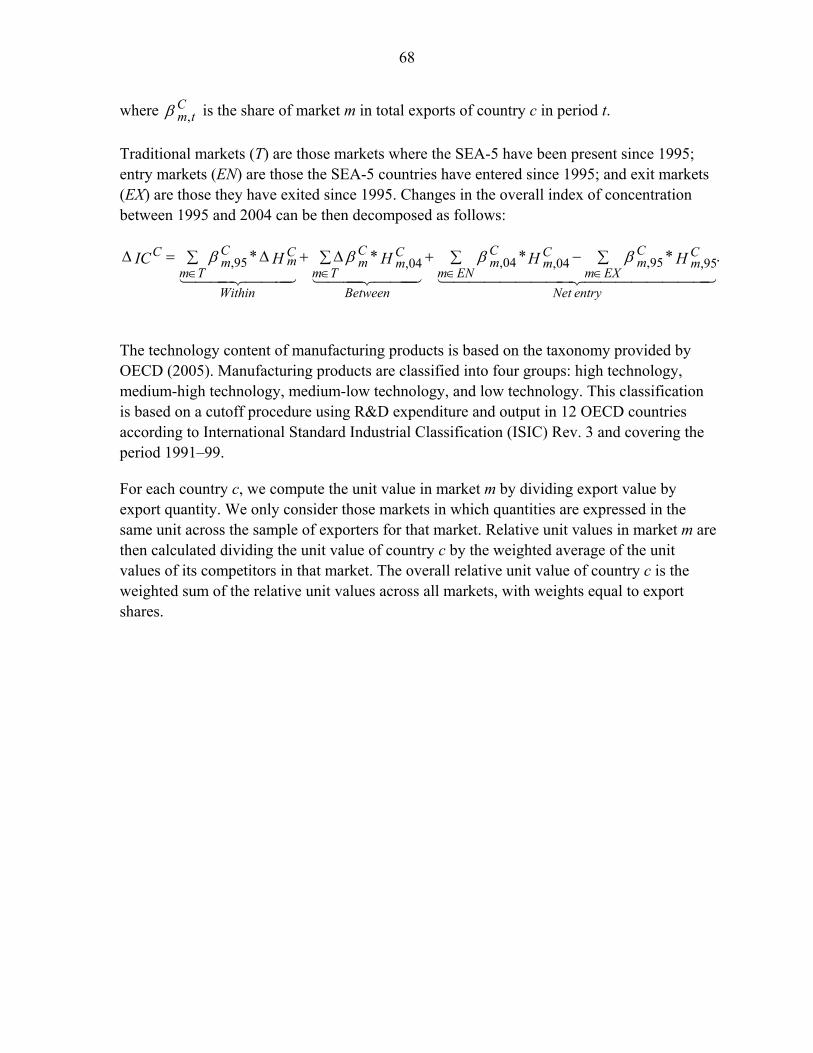
68
where β Ctm, is the share of market m in total exports of country c in period t.
Traditional markets (T) are those markets where the SEA-5 have been present since 1995; entry markets (EN) are those the SEA-5 countries have entered since 1995; and exit markets (EX) are those they have exited since 1995. Changes in the overall index of concentration between 1995 and 2004 can be then decomposed as follows:
.**** 95,95,04,04,04,95,
entryNet
Cm
EXm
Cm
Cm
ENm
Cm
Between
Cm
Tm
Cm
Within
Cm
Tm
Cm
C HHHHIC ∑−∑+∑Δ+Δ∑=Δ∈∈∈∈
ββββ
The technology content of manufacturing products is based on the taxonomy provided by OECD (2005). Manufacturing products are classified into four groups: high technology, medium-high technology, medium-low technology, and low technology. This classification is based on a cutoff procedure using R&D expenditure and output in 12 OECD countries according to International Standard Industrial Classification (ISIC) Rev. 3 and covering the period 1991–99.
For each country c, we compute the unit value in market m by dividing export value by export quantity. We only consider those markets in which quantities are expressed in the same unit across the sample of exporters for that market. Relative unit values in market m are then calculated dividing the unit value of country c by the weighted average of the unit values of its competitors in that market. The overall relative unit value of country c is the weighted sum of the relative unit values across all markets, with weights equal to export shares.
69
VI. SERVICES EXPORTS IN SEA-5: PERFORMANCE AND RESTRUCTURING1
A. Introduction
1. Economic development is accompanied by increased specialization in services at the expense of industrial production. But while services account for over 60 percent of world production, they make up only 20 percent of world trade. International trade in services is limited by the nontradable nature of many services, which require physical interaction between producers and consumers. In addition, liberalization of trade in services has lagged with respect to liberalization of trade in goods. However, new technologies such as the internet facilitate the delivery of services, and increasing trade liberalization has created new opportunities for trade in services. Specialization in trade in services could result in improvements in the terms of trade; services prices typically grow faster than good prices and raises income as productivity in services exceeds productivity in manufacturing.
2. This section analyzes the pattern of trade in services specialization in the southern euro area five (SEA-5) countries and the performance of the sector during the last decade.2 In particular, it explores whether SEA-5 countries have improved their competitiveness by increasing their specialization in exports of fast growing sectors and markets and high value-added services. The section also analyzes the impact of increased trade in services on terms of trade and discusses the factors that could hamper further growth in exports of services.
3. The degree of specialization on services exports and the performance of the sector varied across the SEA-5 countries. Traditionally, these countries have been specialized in relatively low-growth and low-productivity sectors, such as tourism, which hampers services export growth. The best performers among the SEA-5, Greece and Spain, relied on a strong growth in the tourism sector and increasing specialization in fast growing and/or high value-added sectors—sea transport in the case of Greece and business services in the case of Spain. However, performance lagged behind that of some other countries in Europe (notably Ireland and some Nordic countries). Services market liberalization and increased research intensity in the services sectors would further increase productivity growth and improve export performance in these sectors.
1 Prepared by Eva Gutiérrez.
2 SEA-5 countries comprise France, Greece, Italy, Spain, and Portugal.
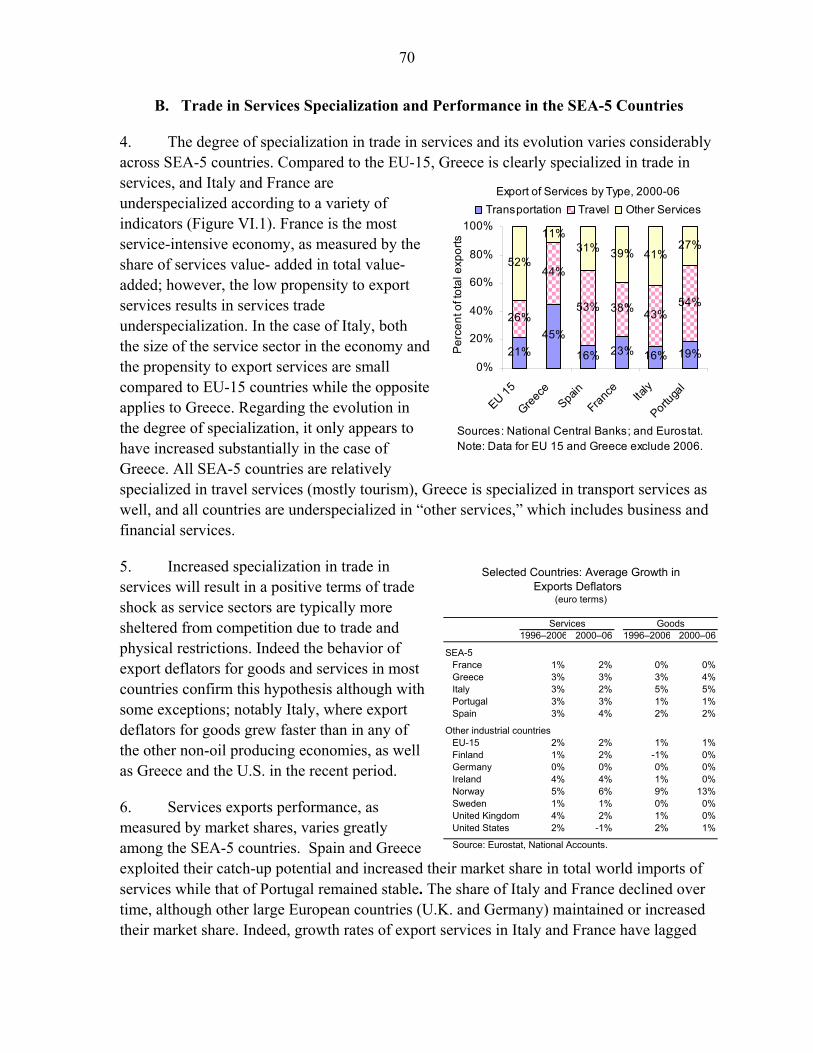
70
B. Trade in Services Specialization and Performance in the SEA-5 Countries
4. The degree of specialization in trade in services and its evolution varies considerably across SEA-5 countries. Compared to the EU-15, Greece is clearly specialized in trade in services, and Italy and France are underspecialized according to a variety of indicators (Figure VI.1). France is the most service-intensive economy, as measured by the share of services value- added in total value-added; however, the low propensity to export services results in services trade underspecialization. In the case of Italy, both the size of the service sector in the economy and the propensity to export services are small compared to EU-15 countries while the opposite applies to Greece. Regarding the evolution in the degree of specialization, it only appears to have increased substantially in the case of Greece. All SEA-5 countries are relatively specialized in travel services (mostly tourism), Greece is specialized in transport services as well, and all countries are underspecialized in “other services,” which includes business and financial services.
5. Increased specialization in trade in services will result in a positive terms of trade shock as service sectors are typically more sheltered from competition due to trade and physical restrictions. Indeed the behavior of export deflators for goods and services in most countries confirm this hypothesis although with some exceptions; notably Italy, where export deflators for goods grew faster than in any of the other non-oil producing economies, as well as Greece and the U.S. in the recent period.
6. Services exports performance, as measured by market shares, varies greatly among the SEA-5 countries. Spain and Greece exploited their catch-up potential and increased their market share in total world imports of services while that of Portugal remained stable. The share of Italy and France declined over time, although other large European countries (U.K. and Germany) maintained or increased their market share. Indeed, growth rates of export services in Italy and France have lagged
Export of Services by Type, 2000-06
21%45%
16% 23% 16% 19%
26%
44%
53% 38% 43%54%
52%
11%31% 39% 41%
27%
0%
20%
40%
60%
80%
100%
EU 15
Greece
Spain
Franc
eIta
ly
Portuga
l
Per
cent
of t
otal
exp
orts
Transportation Travel Other Services
Sources: National Central Banks; and Eurostat.Note: Data for EU 15 and Greece exclude 2006.
Selected Countries: Average Growth inExports Deflators
1996–2006 2000–06 1996–2006 2000–06
SEA-5France 1% 2% 0% 0%Greece 3% 3% 3% 4%Italy 3% 2% 5% 5%Portugal 3% 3% 1% 1%Spain 3% 4% 2% 2%
Other industrial countriesEU-15 2% 2% 1% 1%Finland 1% 2% -1% 0%Germany 0% 0% 0% 0%Ireland 4% 4% 1% 0%Norway 5% 6% 9% 13%Sweden 1% 1% 0% 0%United Kingdom 4% 2% 1% 0%United States 2% -1% 2% 1%
Source: Eurostat, National Accounts.
Services Goods
(euro terms)
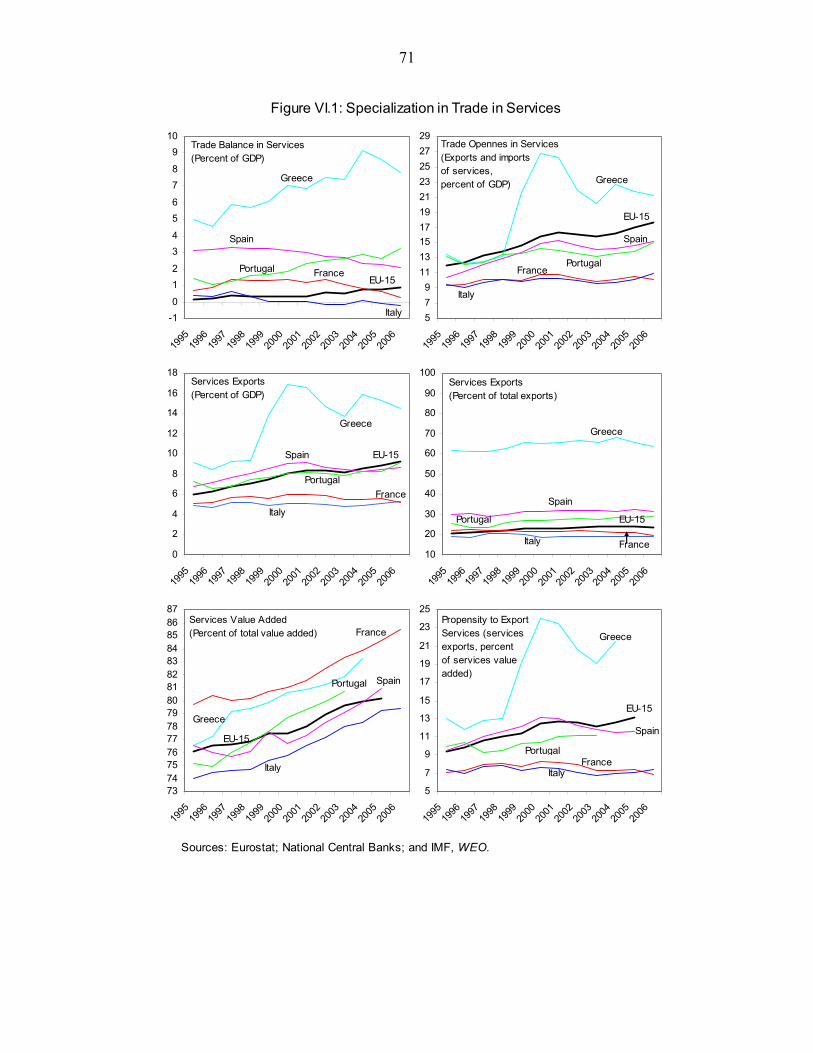
71
Figure VI.1: Specialization in Trade in Services
Sources: Eurostat; National Central Banks; and IMF, WEO.
Trade Balance in Services (Percent of GDP)
-10
12
34
56
78
910
1995
1996
1997
1998
1999
2000
2001
2002
2003
2004
2005
2006
Greece
France
Spain
Portugal
Italy
EU-15
Trade Opennes in Services (Exports and imports of services, percent of GDP)
579
11131517192123252729
1995
1996
1997
1998
1999
2000
2001
2002
2003
2004
2005
2006
Greece
France
Spain
Portugal
Italy
EU-15
Services Exports(Percent of GDP)
0
2
4
6
8
10
12
14
16
18
1995
1996
1997
1998
1999
2000
2001
2002
2003
2004
2005
2006
Greece
Spain EU-15
Portugal
Italy
France
Services Exports(Percent of total exports)
10
20
30
40
50
60
70
80
90
100
1995
1996
1997
1998
1999
2000
2001
2002
2003
2004
2005
2006
Greece
Spain
EU-15Portugal
FranceItaly
Services Value Added (Percent of total value added)
737475767778798081828384858687
1995
1996
1997
1998
1999
2000
2001
2002
2003
2004
2005
2006
Spain
France
Greece
EU-15
Portugal
Italy
Propensity to Export Services (servicesexports, percent of services value added)
5
7
9
11
13
15
17
19
21
23
25
1995
1996
1997
1998
1999
2000
2001
2002
2003
2004
2005
2006
Spain
France
Greece
EU-15
Portugal
Italy
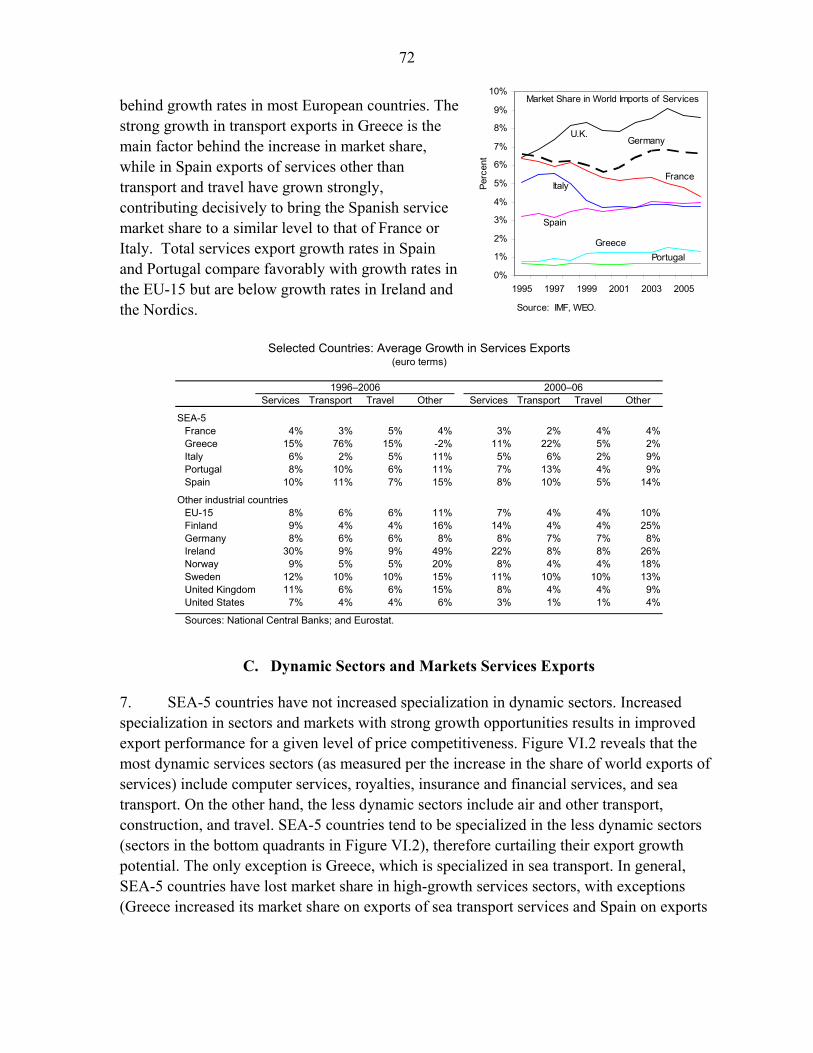
72
behind growth rates in most European countries. The strong growth in transport exports in Greece is the main factor behind the increase in market share, while in Spain exports of services other than transport and travel have grown strongly, contributing decisively to bring the Spanish service market share to a similar level to that of France or Italy. Total services export growth rates in Spain and Portugal compare favorably with growth rates in the EU-15 but are below growth rates in Ireland and the Nordics.
C. Dynamic Sectors and Markets Services Exports
7. SEA-5 countries have not increased specialization in dynamic sectors. Increased specialization in sectors and markets with strong growth opportunities results in improved export performance for a given level of price competitiveness. Figure VI.2 reveals that the most dynamic services sectors (as measured per the increase in the share of world exports of services) include computer services, royalties, insurance and financial services, and sea transport. On the other hand, the less dynamic sectors include air and other transport, construction, and travel. SEA-5 countries tend to be specialized in the less dynamic sectors (sectors in the bottom quadrants in Figure VI.2), therefore curtailing their export growth potential. The only exception is Greece, which is specialized in sea transport. In general, SEA-5 countries have lost market share in high-growth services sectors, with exceptions (Greece increased its market share on exports of sea transport services and Spain on exports
Market Share in World Imports of Services
0%
1%
2%
3%
4%
5%
6%
7%
8%
9%
10%
1995 1997 1999 2001 2003 2005
Perc
ent
PortugalGreece
Spain
ItalyFrance
U.K.Germany
Source: IMF, WEO.
1996–2006 2000–06Services Transport Travel Other Services Transport Travel Other
SEA-5France 4% 3% 5% 4% 3% 2% 4% 4%Greece 15% 76% 15% -2% 11% 22% 5% 2%Italy 6% 2% 5% 11% 5% 6% 2% 9%Portugal 8% 10% 6% 11% 7% 13% 4% 9%Spain 10% 11% 7% 15% 8% 10% 5% 14%
Other industrial countriesEU-15 8% 6% 6% 11% 7% 4% 4% 10%Finland 9% 4% 4% 16% 14% 4% 4% 25%Germany 8% 6% 6% 8% 8% 7% 7% 8%Ireland 30% 9% 9% 49% 22% 8% 8% 26%Norway 9% 5% 5% 20% 8% 4% 4% 18%Sweden 12% 10% 10% 15% 11% 10% 10% 13%United Kingdom 11% 6% 6% 15% 8% 4% 4% 9%United States 7% 4% 4% 6% 3% 1% 1% 4%
Sources: National Central Banks; and Eurostat.
Selected Countries: Average Growth in Services Exports (euro terms)
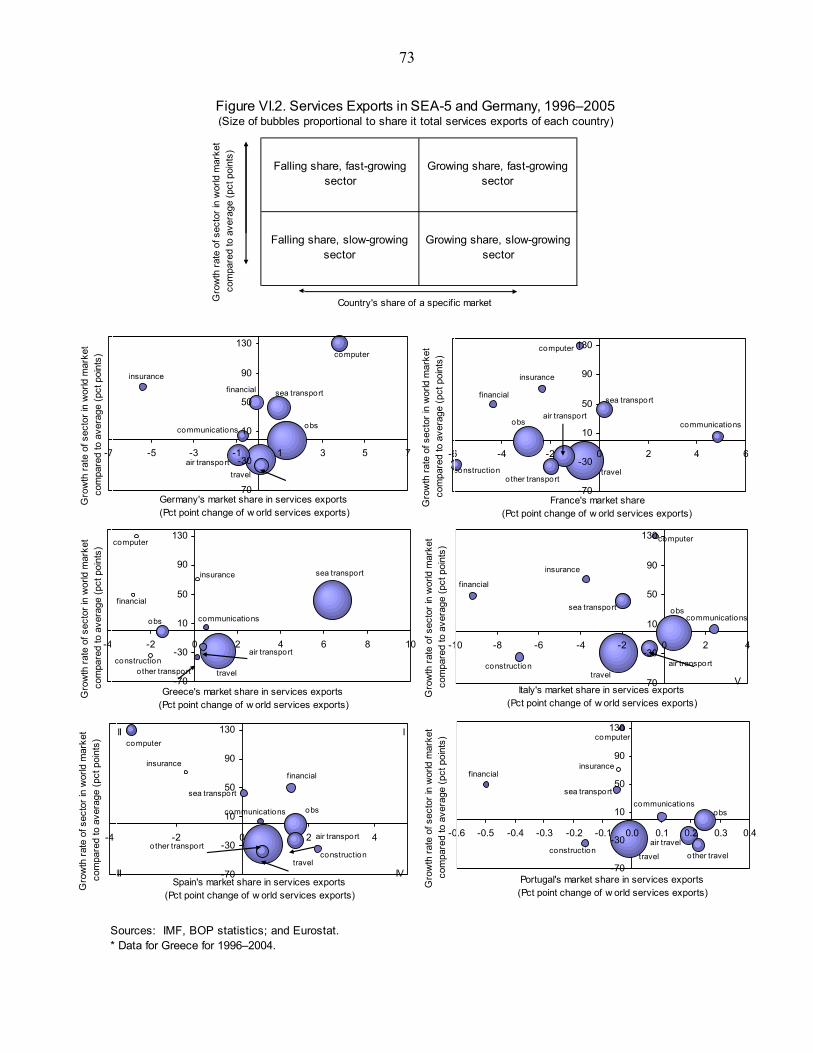
73
Falling share, fast-growing sector
Growing share, fast-growing sector
Falling share, slow-growing sector
Growing share, slow-growing sector
Figure VI.2. Services Exports in SEA-5 and Germany, 1996–2005(Size of bubbles proportional to share it total services exports of each country)
Sources: IMF, BOP statistics; and Eurostat.* Data for Greece for 1996–2004.
sea transport
communications
travelair transport
financial
insurance
obs
computer
-70
-30
10
50
90
130
-7 -5 -3 -1 1 3 5 7
Germany's market share in services exports (Pct point change of w orld services exports)
Gro
wth
rate
of s
ecto
r in
wor
ld m
arke
t co
mpa
red
to a
vera
ge (p
ct p
oint
s)
sea transport
communications
travelconstruction
financial
insurance
other transport
air transportobs
computer
-70
-30
10
50
90
130
-6 -4 -2 0 2 4 6
France's market share(Pct point change of w orld services exports)
Gro
wth
rate
of s
ecto
r in
wor
ld m
arke
t co
mpa
red
to a
vera
ge (p
ct p
oint
s)
sea transport
communications
travelconstruction
financial
insurance
other transport
air transport
obs
computer
-70
-30
10
50
90
130
-4 -2 0 2 4 6 8 10
Greece's market share in services exports (Pct point change of w orld services exports)
Gro
wth
rate
of s
ecto
r in
wor
ld m
arke
t co
mpa
red
to a
vera
ge (p
ct p
oint
s)
computer
obssea transport
air transport
insurance
financial
constructiontravel
communications
-70
-30
10
50
90
130
-10 -8 -6 -4 -2 0 2 4
Italy's market share in services exports (Pct point change of w orld services exports)
V
Gro
wth
rate
of s
ecto
r in
wor
ld m
arke
t co
mpa
red
to a
vera
ge (p
ct p
oint
s)
sea transport
communications
travelconstruction
financialinsurance
air transporto ther transport
obs
computer
-70
-30
10
50
90
130
-4 -2 0 2 4
Spain's market share in services exports (Pct point change of w orld services exports)
III
III IV
Gro
wth
rate
of s
ecto
r in
wor
ld m
arke
t co
mpa
red
to a
vera
ge (p
ct p
oint
s)
computer
obs
other travel
air travel
insurancefinancial
constructiontravel
communicationssea transport
-70
-30
10
50
90
130
-0.6 -0.5 -0.4 -0.3 -0.2 -0.1 0.0 0.1 0.2 0.3 0.4
Portugal's market share in services exports (Pct point change of w orld services exports)
Gro
wth
rate
of s
ecto
r in
wor
ld m
arke
t co
mpa
red
to a
vera
ge (p
ct p
oint
s)
Country's share of a specif ic marketGro
wth
rate
of s
ecto
r in
wor
ld m
arke
t co
mpa
red
to a
vera
ge (p
ct p
oint
s)
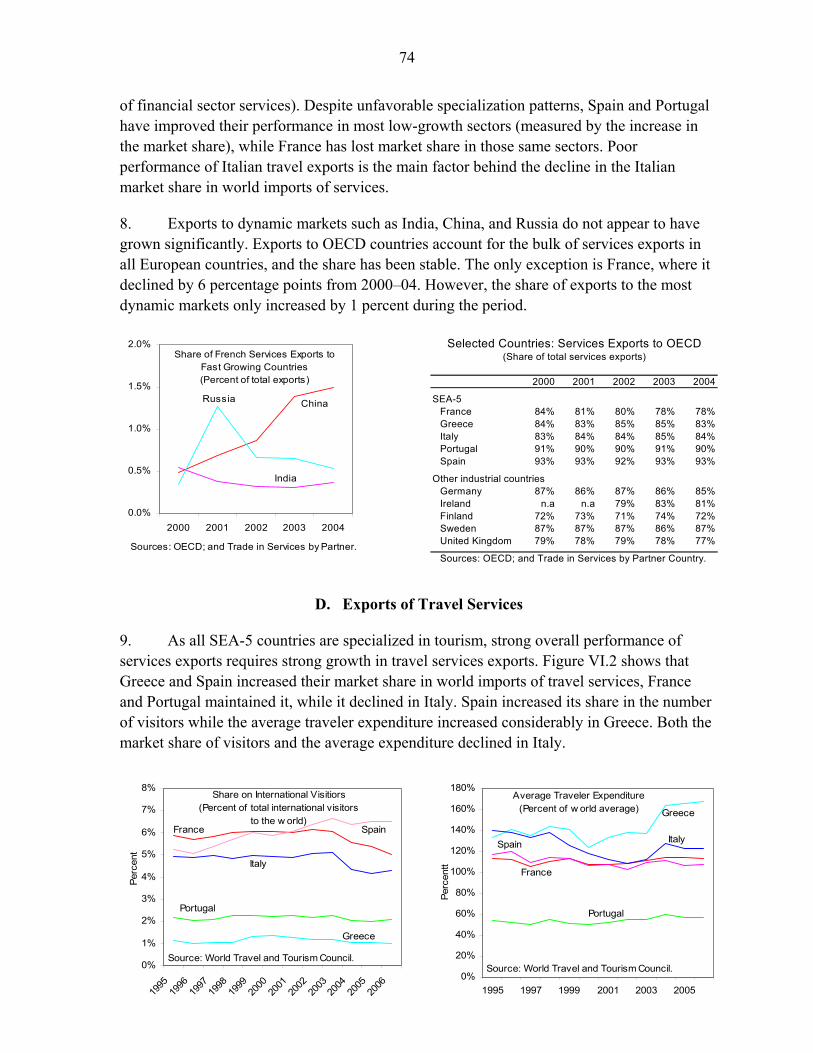
74
of financial sector services). Despite unfavorable specialization patterns, Spain and Portugal have improved their performance in most low-growth sectors (measured by the increase in the market share), while France has lost market share in those same sectors. Poor performance of Italian travel exports is the main factor behind the decline in the Italian market share in world imports of services.
8. Exports to dynamic markets such as India, China, and Russia do not appear to have grown significantly. Exports to OECD countries account for the bulk of services exports in all European countries, and the share has been stable. The only exception is France, where it declined by 6 percentage points from 2000–04. However, the share of exports to the most dynamic markets only increased by 1 percent during the period.
D. Exports of Travel Services
9. As all SEA-5 countries are specialized in tourism, strong overall performance of services exports requires strong growth in travel services exports. Figure VI.2 shows that Greece and Spain increased their market share in world imports of travel services, France and Portugal maintained it, while it declined in Italy. Spain increased its share in the number of visitors while the average traveler expenditure increased considerably in Greece. Both the market share of visitors and the average expenditure declined in Italy.
2000 2001 2002 2003 2004
SEA-5France 84% 81% 80% 78% 78%Greece 84% 83% 85% 85% 83%Italy 83% 84% 84% 85% 84%Portugal 91% 90% 90% 91% 90%Spain 93% 93% 92% 93% 93%
Other industrial countriesGermany 87% 86% 87% 86% 85%Ireland n.a n.a 79% 83% 81%Finland 72% 73% 71% 74% 72%Sweden 87% 87% 87% 86% 87%United Kingdom 79% 78% 79% 78% 77%
Sources: OECD; and Trade in Services by Partner Country.
Selected Countries: Services Exports to OECD(Share of total services exports)Share of French Services Exports to
Fast Growing Countries(Percent of total exports)
0.0%
0.5%
1.0%
1.5%
2.0%
2000 2001 2002 2003 2004
China
India
Russia
Sources: OECD; and Trade in Services by Partner.
Share on International Visitiors (Percent of total international visitors
to the w orld)
0%
1%
2%
3%
4%
5%
6%
7%
8%
1995
1996
1997
1998
1999
2000
2001
2002
2003
2004
2005
2006
Perc
ent
Source: World Travel and Tourism Council.
Greece
Spain
Portugal
Italy
France
Average Traveler Expenditure (Percent of w orld average)
0%
20%
40%
60%
80%
100%
120%
140%
160%
180%
1995 1997 1999 2001 2003 2005
Perc
entt
Source: World Travel and Tourism Council.
Greece
Spain
Portugal
Italy
France
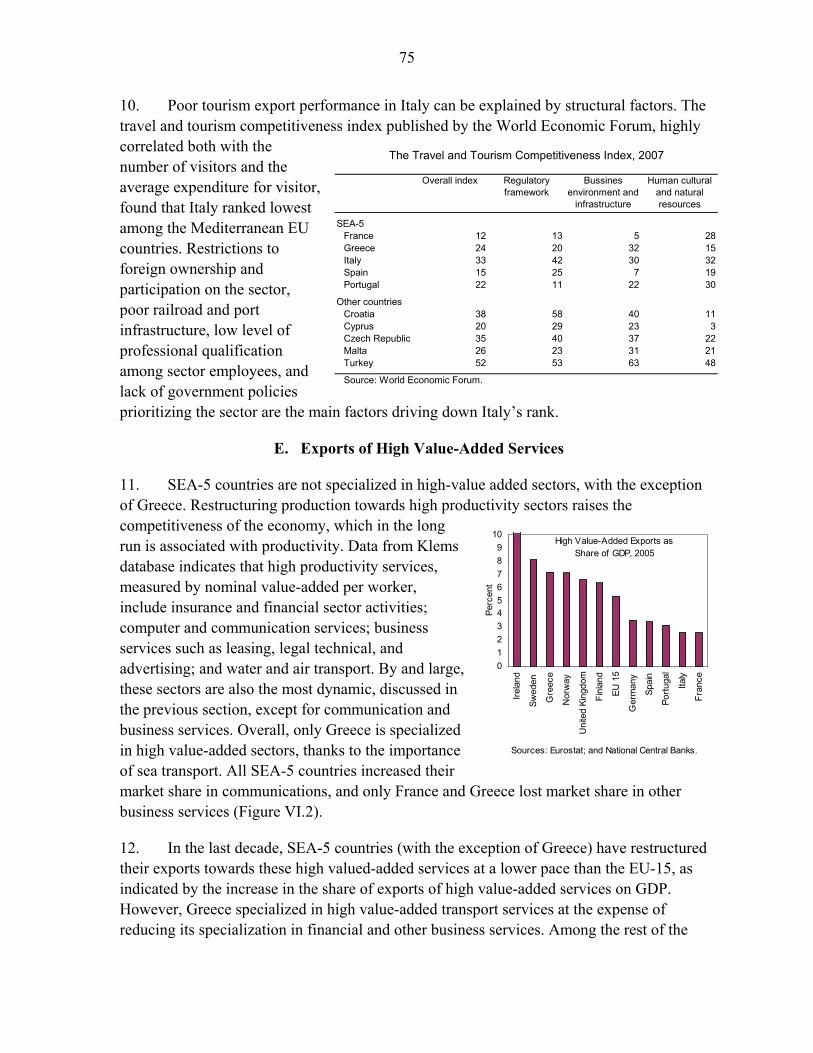
75
10. Poor tourism export performance in Italy can be explained by structural factors. The travel and tourism competitiveness index published by the World Economic Forum, highly correlated both with the number of visitors and the average expenditure for visitor, found that Italy ranked lowest among the Mediterranean EU countries. Restrictions to foreign ownership and participation on the sector, poor railroad and port infrastructure, low level of professional qualification among sector employees, and lack of government policies prioritizing the sector are the main factors driving down Italy’s rank.
E. Exports of High Value-Added Services
11. SEA-5 countries are not specialized in high-value added sectors, with the exception of Greece. Restructuring production towards high productivity sectors raises the competitiveness of the economy, which in the long run is associated with productivity. Data from Klems database indicates that high productivity services, measured by nominal value-added per worker, include insurance and financial sector activities; computer and communication services; business services such as leasing, legal technical, and advertising; and water and air transport. By and large, these sectors are also the most dynamic, discussed in the previous section, except for communication and business services. Overall, only Greece is specialized in high value-added sectors, thanks to the importance of sea transport. All SEA-5 countries increased their market share in communications, and only France and Greece lost market share in other business services (Figure VI.2).
12. In the last decade, SEA-5 countries (with the exception of Greece) have restructured their exports towards these high valued-added services at a lower pace than the EU-15, as indicated by the increase in the share of exports of high value-added services on GDP. However, Greece specialized in high value-added transport services at the expense of reducing its specialization in financial and other business services. Among the rest of the
The Travel and Tourism Competitiveness Index, 2007
Overall index Regulatory framework
Bussines environment and
infrastructure
Human cultural and natural resources
SEA-5France 12 13 5 28Greece 24 20 32 15Italy 33 42 30 32Spain 15 25 7 19Portugal 22 11 22 30
Other countriesCroatia 38 58 40 11Cyprus 20 29 23 3Czech Republic 35 40 37 22Malta 26 23 31 21Turkey 52 53 63 48
Source: World Economic Forum.
High Value-Added Exports as Share of GDP, 2005
0123456789
10
Irela
nd
Swed
en
Gre
ece
Nor
way
Uni
ted
King
dom
Finl
and
EU 1
5
Ger
man
y
Spai
n
Portu
gal
Italy
Fran
ce
Perc
ent
Sources: Eurostat; and National Central Banks.
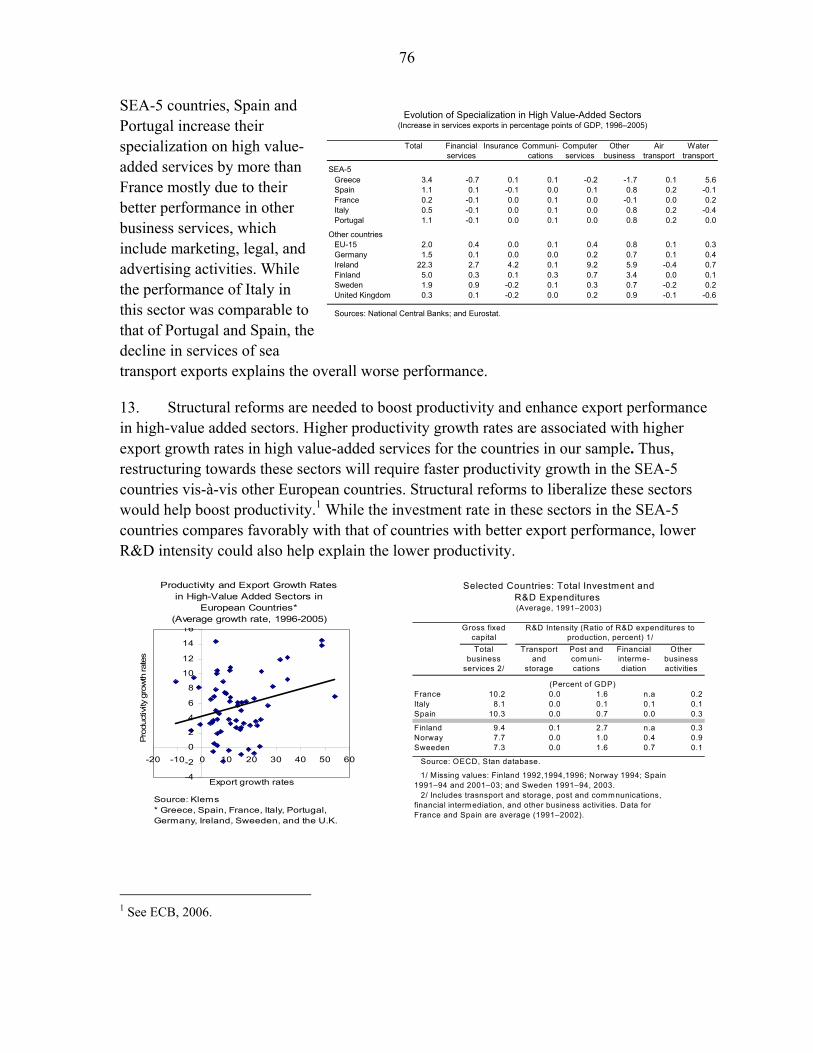
76
SEA-5 countries, Spain and Portugal increase their specialization on high value-added services by more than France mostly due to their better performance in other business services, which include marketing, legal, and advertising activities. While the performance of Italy in this sector was comparable to that of Portugal and Spain, the decline in services of sea transport exports explains the overall worse performance.
13. Structural reforms are needed to boost productivity and enhance export performance in high-value added sectors. Higher productivity growth rates are associated with higher export growth rates in high value-added services for the countries in our sample. Thus, restructuring towards these sectors will require faster productivity growth in the SEA-5 countries vis-à-vis other European countries. Structural reforms to liberalize these sectors would help boost productivity.1 While the investment rate in these sectors in the SEA-5 countries compares favorably with that of countries with better export performance, lower R&D intensity could also help explain the lower productivity.
1 See ECB, 2006.
Evolution of Specialization in High Value-Added Sectors(Increase in services exports in percentage points of GDP, 1996–2005)
Total Financial services
Insurance Communi-cations
Computer services
Other business
Air transport
Water transport
SEA-5 Greece 3.4 -0.7 0.1 0.1 -0.2 -1.7 0.1 5.6Spain 1.1 0.1 -0.1 0.0 0.1 0.8 0.2 -0.1France 0.2 -0.1 0.0 0.1 0.0 -0.1 0.0 0.2Italy 0.5 -0.1 0.0 0.1 0.0 0.8 0.2 -0.4Portugal 1.1 -0.1 0.0 0.1 0.0 0.8 0.2 0.0
Other countriesEU-15 2.0 0.4 0.0 0.1 0.4 0.8 0.1 0.3Germany 1.5 0.1 0.0 0.0 0.2 0.7 0.1 0.4Ireland 22.3 2.7 4.2 0.1 9.2 5.9 -0.4 0.7Finland 5.0 0.3 0.1 0.3 0.7 3.4 0.0 0.1Sweden 1.9 0.9 -0.2 0.1 0.3 0.7 -0.2 0.2United Kingdom 0.3 0.1 -0.2 0.0 0.2 0.9 -0.1 -0.6
Sources: National Central Banks; and Eurostat.
-4
-2
0
2
4
6
8
10
12
14
16
-20 -10 0 10 20 30 40 50 60
Export growth rates
Pro
duct
ivity
gro
wth
rate
s
Source: Klems* Greece, Spain, France, Italy, Portugal, Germany, Ireland, Sweeden, and the U.K.
Productivity and Export Growth Rates in High-Value Added Sectors in
European Countries*(Average growth rate, 1996-2005)
Selected Countries: Total Investment andR&D Expenditures
Gross fixed capital Total
business services 2/
Transport and
storage
Post and comuni-cations
Financial interme-diation
Other business activities
(Percent of GDP)France 10.2 0.0 1.6 n.a 0.2Italy 8.1 0.0 0.1 0.1 0.1Spain 10.3 0.0 0.7 0.0 0.3
Finland 9.4 0.1 2.7 n.a 0.3Norway 7.7 0.0 1.0 0.4 0.9Sweeden 7.3 0.0 1.6 0.7 0.1
Source: OECD, Stan database.
1/ Missing values: Finland 1992,1994,1996; Norway 1994; Spain1991–94 and 2001–03; and Sweden 1991–94, 2003.
2/ Includes trasnsport and storage, post and commnunications,financial intermediation, and other business activities. Data forFrance and Spain are average (1991–2002).
R&D Intensity (Ratio of R&D expenditures to production, percent) 1/
(Average, 1991–2003)
77
References
Bang, R., 2005, “Trade in Services: A Review,” Global Economic Journal, Vol. 5, Issue 2, Article 3.
European Central Bank, 2006, “Competition, Productivity and Prices in the Euro Area
Services Sector,” Occasional Paper No. 44. Freund, C., and D. Weinhold, 2002, “The Internet and International Trade in Services,”
American Economic Review, Vol. 92, Issue 2, pp. 236–40.’ Lipsey, R., “Measuring International Trade in Services,” NBER Working Paper No. 12271. Stern, R., 2005, “The Place of Services in the World Economy,” RSIE Discussion
Paper No. 530.
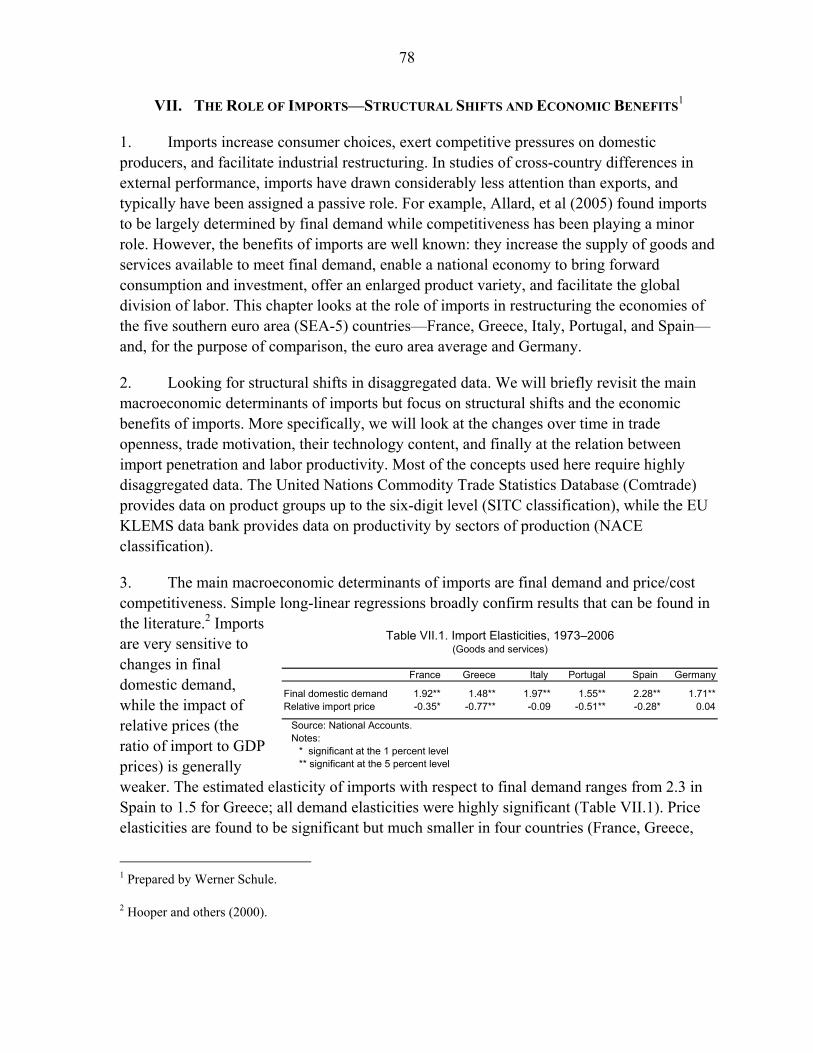
78
VII. THE ROLE OF IMPORTS—STRUCTURAL SHIFTS AND ECONOMIC BENEFITS1
1. Imports increase consumer choices, exert competitive pressures on domestic producers, and facilitate industrial restructuring. In studies of cross-country differences in external performance, imports have drawn considerably less attention than exports, and typically have been assigned a passive role. For example, Allard, et al (2005) found imports to be largely determined by final demand while competitiveness has been playing a minor role. However, the benefits of imports are well known: they increase the supply of goods and services available to meet final demand, enable a national economy to bring forward consumption and investment, offer an enlarged product variety, and facilitate the global division of labor. This chapter looks at the role of imports in restructuring the economies of the five southern euro area (SEA-5) countries—France, Greece, Italy, Portugal, and Spain—and, for the purpose of comparison, the euro area average and Germany.
2. Looking for structural shifts in disaggregated data. We will briefly revisit the main macroeconomic determinants of imports but focus on structural shifts and the economic benefits of imports. More specifically, we will look at the changes over time in trade openness, trade motivation, their technology content, and finally at the relation between import penetration and labor productivity. Most of the concepts used here require highly disaggregated data. The United Nations Commodity Trade Statistics Database (Comtrade) provides data on product groups up to the six-digit level (SITC classification), while the EU KLEMS data bank provides data on productivity by sectors of production (NACE classification).
3. The main macroeconomic determinants of imports are final demand and price/cost competitiveness. Simple long-linear regressions broadly confirm results that can be found in the literature.2 Imports are very sensitive to changes in final domestic demand, while the impact of relative prices (the ratio of import to GDP prices) is generally weaker. The estimated elasticity of imports with respect to final demand ranges from 2.3 in Spain to 1.5 for Greece; all demand elasticities were highly significant (Table VII.1). Price elasticities are found to be significant but much smaller in four countries (France, Greece,
1 Prepared by Werner Schule.
2 Hooper and others (2000).
Table VII.1. Import Elasticities, 1973–2006(Goods and services)
France Greece Italy Portugal Spain Germany
Final domestic demand 1.92** 1.48** 1.97** 1.55** 2.28** 1.71**Relative import price -0.35* -0.77** -0.09 -0.51** -0.28* 0.04
Source: National Accounts.Notes:
* significant at the 1 percent level** significant at the 5 percent level
79
Portugal, Spain) ranging from -0.8 to -0.3, but are not significantly different from zero in Italy and Germany. Without robustness test, these results should be interpreted prudently. Nevertheless, the estimates can serve at least illustrative purposes.
4. Openness to trade has increased dramatically over the past 30 years. The SEA-5 countries have become more open to trade, though progress toward opening up was uneven. Spain and Portugal are leading the field, with an increase in the openness measure (the sum of exports and imports in percent of GDP) from about 20 percent in the early 1970s to more than 70 percent in 2005. Italy and Greece have raised their degree of openness more than twofold during that period (Figure VII.1). Openness in Spain and Portugal has leapfrogged after EU accession, and the introduction of the EU single market (completed in 1992) has made a visible difference for all EU member countries. The positive effect of the single currency (euro) on trade that was found in a number of studies, however, is not evident for the SEA-5 countries probably because of the global cyclical slowdown around 2003 and structural demand weakness from Germany, their main trading partner.3 Contrary to the rule of thumb that smaller economies tend to export and import more than large countries relative to GDP, there does not seem to be a clear-cut relation between country size and openness within the SEA-5. For example, despite its larger size, external trade weighs more in Germany’s economy than in any of the SEA-5. Likewise, while the size of GDP in Portugal is close to that of Greece, Portugal is now significantly more open to trade. The experience of these two countries, which set off from a similar starting point in the early 1970s, also indicates that the speed of convergence toward a high degree of openness is not necessarily higher for countries with a lower initial position.
5. Most imported goods and services of the SEA-5 originate in the EU. During 2000–05, between 55 and 70 percent of imports to the SEA-5 were supplied by partner countries in the EU and between 50 and 65 percent by euro area countries. While the share of intra-EU imports has remained relatively stable, intra-euro area imports gained importance. Germany is clearly the most important provider of imported goods with a share ranging from 13 percent (Greece) to 28 percent (Portugal). While increasing, the role of China has remained small; the share of imports from China ranged from 1 percent (Portugal) to 3.7 percent (Italy). The United States is the most important non-European supplier of imported goods to the SEA-5—its share ranging between 2.5 percent in Portugal and 6 percent in France. While the weight of emerging market economies has been increasing fast, particularly in the past five years, products of advanced industrialized countries account for more than three-fourths of nonenergy imports.
3 Econometric work, controlling for these and other factors found that currency unions boost trade significantly. Frankel and Rose (2000) have estimated very large effects of EMU on trade. Follow-up work by others confirmed the positive effect on trade but found it to be of smaller magnitude.
80
6. Imports have become more technology intensive. Contrary to a common perception that highly advanced EU countries are specializing in the production and export high technology (or highly capital-intensive) products while importing predominantly low technology (or labor intensive products), the SEA-5 (and Germany) have moved away from importing low technology while increasing imports of high and medium-high technology products. The decline in the share of low-tech imports has been strongest where their level was particularly high in 1988 (France, Greece, Germany). The structure of imports by technology content has become more similar across the SEA-5 and with that of Germany: between 50 and 60 percent of imports are high- and medium-high technology goods.
7. The share of intra-industry trade is high and has increased in some countries.4 Following the literature, the fraction of trade that is intra-industry—more precisely, the fraction of external trade in very similar products in percent of aggregate external trade—is measured here by the Grubel-Lloyd Index (GLI).5 The index has a straightforward interpretation: if trade is balanced industry by industry (or better product by product), it equals one and all trade is intra-industry; if there is complete international specialization so that every industry is either an export or import industry, it equals zero (Krugman, 1981). To be meaningful, the index requires a sufficiently narrow definition of product families. For all SEA-5 countries, with the exception of Greece, intra-industry trade accounts for 50 to 80 percent of overall trade at the four-digit industry classification (SITC revision 3) level. The relative importance of intra-industry trade is not necessarily linked to country size (compare Portugal with Greece), although it’s more important in very large areas, such as the EU-15. In countries where the initial share of intra-industry trade has been relatively low (Greece, Portugal, Spain), it has become relatively more important over the period under review. More intra-industry trade may reflect a number of factors, including:
• Increasing demand for greater variety of products, as consumers have become wealthier. The change in consumers’ taste implies that strong market positions in specialized products have become more important.
• Intensified economic integration and cross-border production. Within Europe the creation of the EU single market and EU enlargement have been particularly import factors driving cross-border division of labor.
4 Delozier and Montout (2007) found that intra-industry has bounced back recently in the U.S. and the euro area. We did not find a similar rebound in the five countries under consideration.
5 ( )
1GLIi ii
i ii
X M
X M
−
= −
+
∑
∑
⎡ ⎤⎢ ⎥⎢ ⎥⎣ ⎦
, where Xi, Mi are exports and imports of product family i.
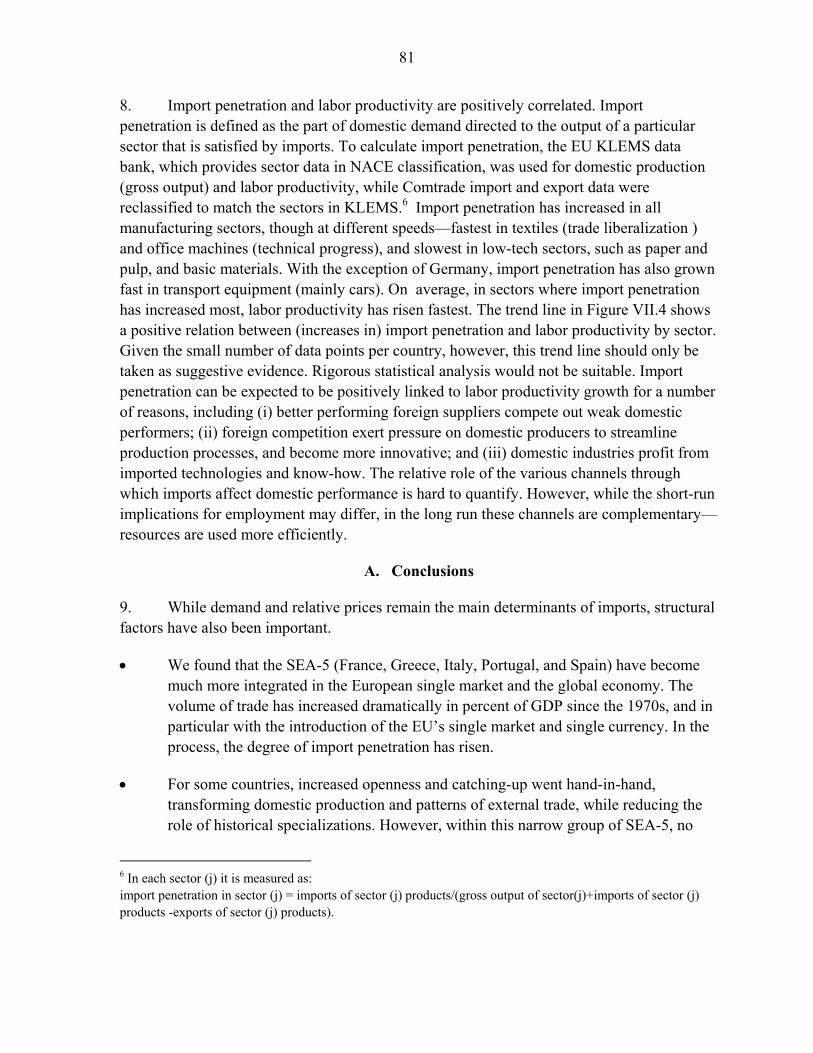
81
8. Import penetration and labor productivity are positively correlated. Import penetration is defined as the part of domestic demand directed to the output of a particular sector that is satisfied by imports. To calculate import penetration, the EU KLEMS data bank, which provides sector data in NACE classification, was used for domestic production (gross output) and labor productivity, while Comtrade import and export data were reclassified to match the sectors in KLEMS.6 Import penetration has increased in all manufacturing sectors, though at different speeds—fastest in textiles (trade liberalization ) and office machines (technical progress), and slowest in low-tech sectors, such as paper and pulp, and basic materials. With the exception of Germany, import penetration has also grown fast in transport equipment (mainly cars). On average, in sectors where import penetration has increased most, labor productivity has risen fastest. The trend line in Figure VII.4 shows a positive relation between (increases in) import penetration and labor productivity by sector. Given the small number of data points per country, however, this trend line should only be taken as suggestive evidence. Rigorous statistical analysis would not be suitable. Import penetration can be expected to be positively linked to labor productivity growth for a number of reasons, including (i) better performing foreign suppliers compete out weak domestic performers; (ii) foreign competition exert pressure on domestic producers to streamline production processes, and become more innovative; and (iii) domestic industries profit from imported technologies and know-how. The relative role of the various channels through which imports affect domestic performance is hard to quantify. However, while the short-run implications for employment may differ, in the long run these channels are complementary—resources are used more efficiently.
A. Conclusions
9. While demand and relative prices remain the main determinants of imports, structural factors have also been important.
• We found that the SEA-5 (France, Greece, Italy, Portugal, and Spain) have become much more integrated in the European single market and the global economy. The volume of trade has increased dramatically in percent of GDP since the 1970s, and in particular with the introduction of the EU’s single market and single currency. In the process, the degree of import penetration has risen.
• For some countries, increased openness and catching-up went hand-in-hand, transforming domestic production and patterns of external trade, while reducing the role of historical specializations. However, within this narrow group of SEA-5, no
6 In each sector (j) it is measured as: import penetration in sector (j) = imports of sector (j) products/(gross output of sector(j)+imports of sector (j) products -exports of sector (j) products).
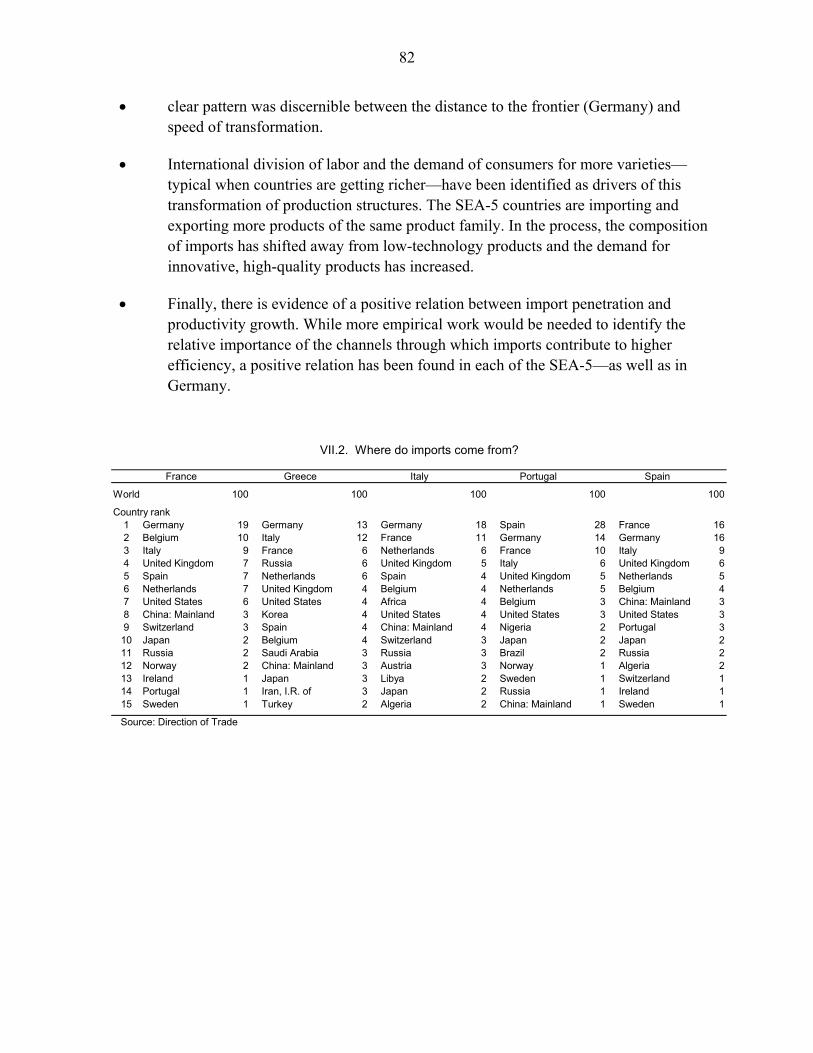
82
• clear pattern was discernible between the distance to the frontier (Germany) and speed of transformation.
• International division of labor and the demand of consumers for more varieties—typical when countries are getting richer—have been identified as drivers of this transformation of production structures. The SEA-5 countries are importing and exporting more products of the same product family. In the process, the composition of imports has shifted away from low-technology products and the demand for innovative, high-quality products has increased.
• Finally, there is evidence of a positive relation between import penetration and productivity growth. While more empirical work would be needed to identify the relative importance of the channels through which imports contribute to higher efficiency, a positive relation has been found in each of the SEA-5—as well as in Germany.
VII.2. Where do imports come from?
France Greece Italy Portugal Spain
World 100 100 100 100 100
Country rank1 Germany 19 Germany 13 Germany 18 Spain 28 France 162 Belgium 10 Italy 12 France 11 Germany 14 Germany 163 Italy 9 France 6 Netherlands 6 France 10 Italy 94 United Kingdom 7 Russia 6 United Kingdom 5 Italy 6 United Kingdom 65 Spain 7 Netherlands 6 Spain 4 United Kingdom 5 Netherlands 56 Netherlands 7 United Kingdom 4 Belgium 4 Netherlands 5 Belgium 47 United States 6 United States 4 Africa 4 Belgium 3 China: Mainland 38 China: Mainland 3 Korea 4 United States 4 United States 3 United States 39 Switzerland 3 Spain 4 China: Mainland 4 Nigeria 2 Portugal 3
10 Japan 2 Belgium 4 Switzerland 3 Japan 2 Japan 211 Russia 2 Saudi Arabia 3 Russia 3 Brazil 2 Russia 212 Norway 2 China: Mainland 3 Austria 3 Norway 1 Algeria 213 Ireland 1 Japan 3 Libya 2 Sweden 1 Switzerland 114 Portugal 1 Iran, I.R. of 3 Japan 2 Russia 1 Ireland 115 Sweden 1 Turkey 2 Algeria 2 China: Mainland 1 Sweden 1
Source: Direction of Trade
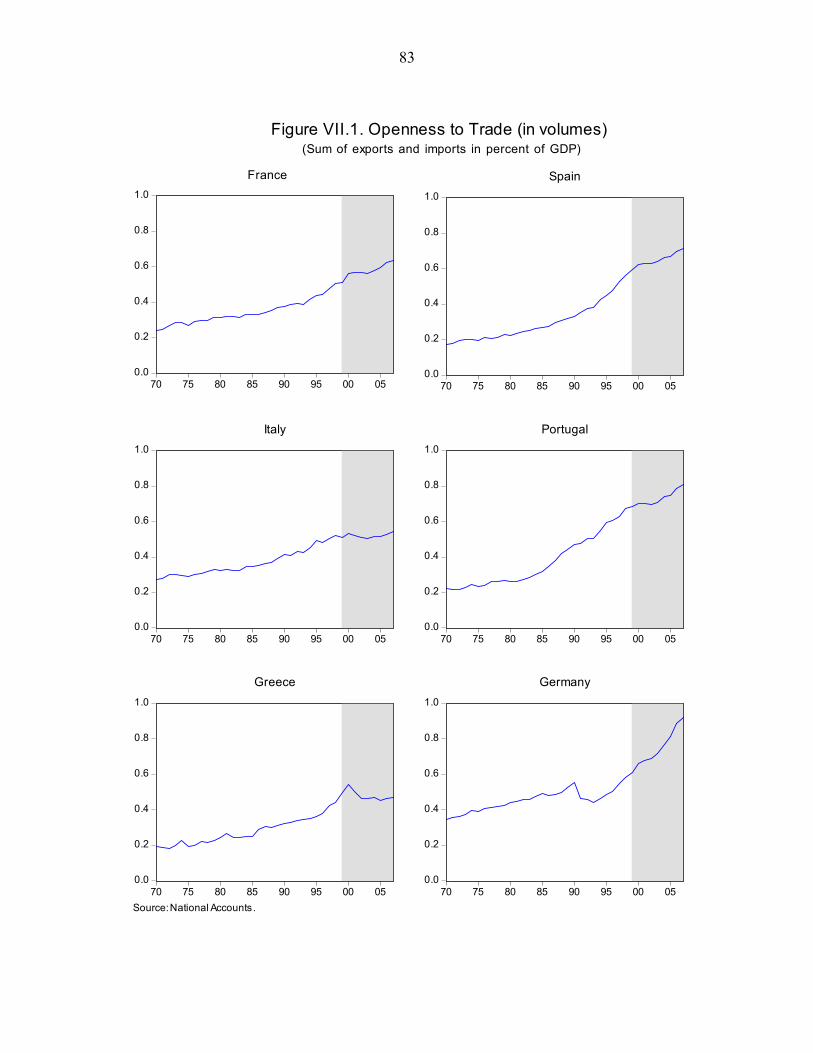
83
0.0
0.2
0.4
0.6
0.8
1.0
70 75 80 85 90 95 00 05
France
0.0
0.2
0.4
0.6
0.8
1.0
70 75 80 85 90 95 00 05
Spain
0.0
0.2
0.4
0.6
0.8
1.0
70 75 80 85 90 95 00 05
Italy
0.0
0.2
0.4
0.6
0.8
1.0
70 75 80 85 90 95 00 05
Portugal
0.0
0.2
0.4
0.6
0.8
1.0
70 75 80 85 90 95 00 05
Greece
0.0
0.2
0.4
0.6
0.8
1.0
70 75 80 85 90 95 00 05
Germany
Figure VII.1. Openness to Trade (in volumes)(Sum of exports and imports in percent of GDP)
Source: National Accounts.
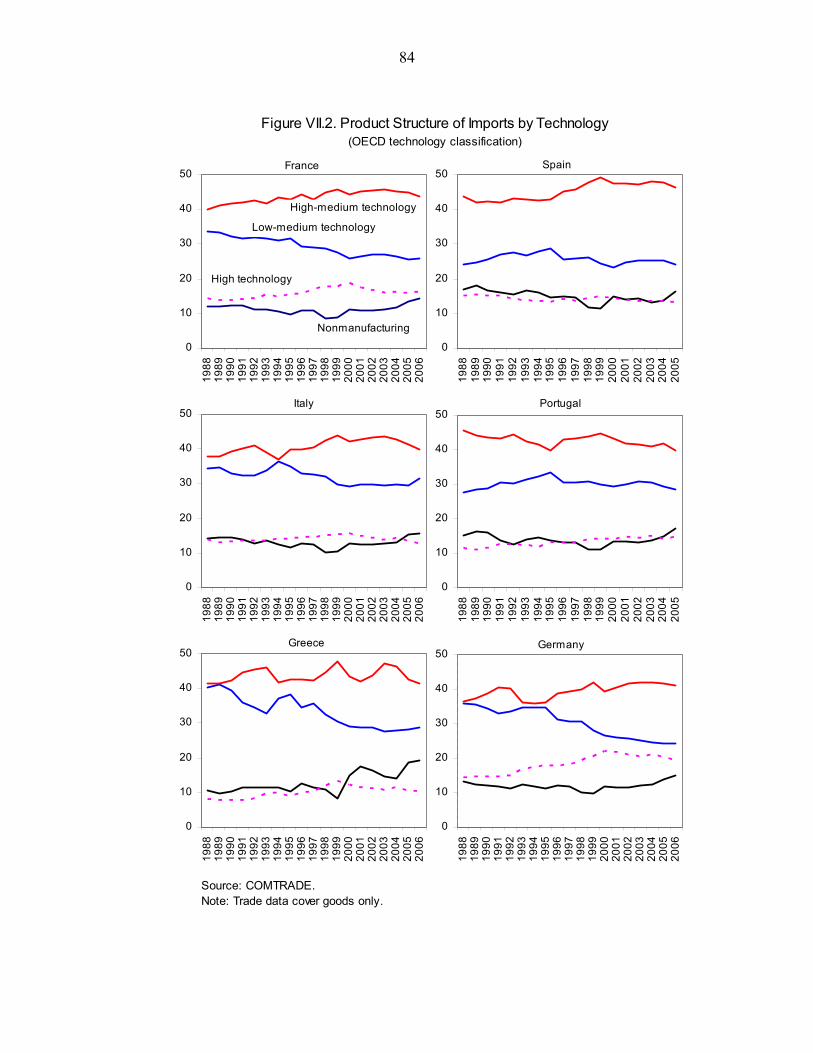
84
Figure VII.2. Product Structure of Imports by Technology(OECD technology classification)
Source: COMTRADE. Note: Trade data cover goods only.
France
0
10
20
30
40
50
1988
1989
1990
1991
1992
1993
1994
1995
1996
1997
1998
1999
2000
2001
2002
2003
2004
2005
2006
Spain
0
10
20
30
40
50
1988
1989
1990
1991
1992
1993
1994
1995
1996
1997
1998
1999
2000
2001
2002
2003
2004
2005
Italy
0
10
20
30
40
50
1988
1989
1990
1991
1992
1993
1994
1995
1996
1997
1998
1999
2000
2001
2002
2003
2004
2005
2006
Portugal
0
10
20
30
40
50
1988
1989
1990
1991
1992
1993
1994
1995
1996
1997
1998
1999
2000
2001
2002
2003
2004
2005
Greece
0
10
20
30
40
50
1988
1989
1990
1991
1992
1993
1994
1995
1996
1997
1998
1999
2000
2001
2002
2003
2004
2005
2006
Germany
0
10
20
30
40
50
1988
1989
1990
1991
1992
1993
1994
1995
1996
1997
1998
1999
2000
2001
2002
2003
2004
2005
2006
Low-medium technology
High-medium technology
High technology
Nonmanufacturing
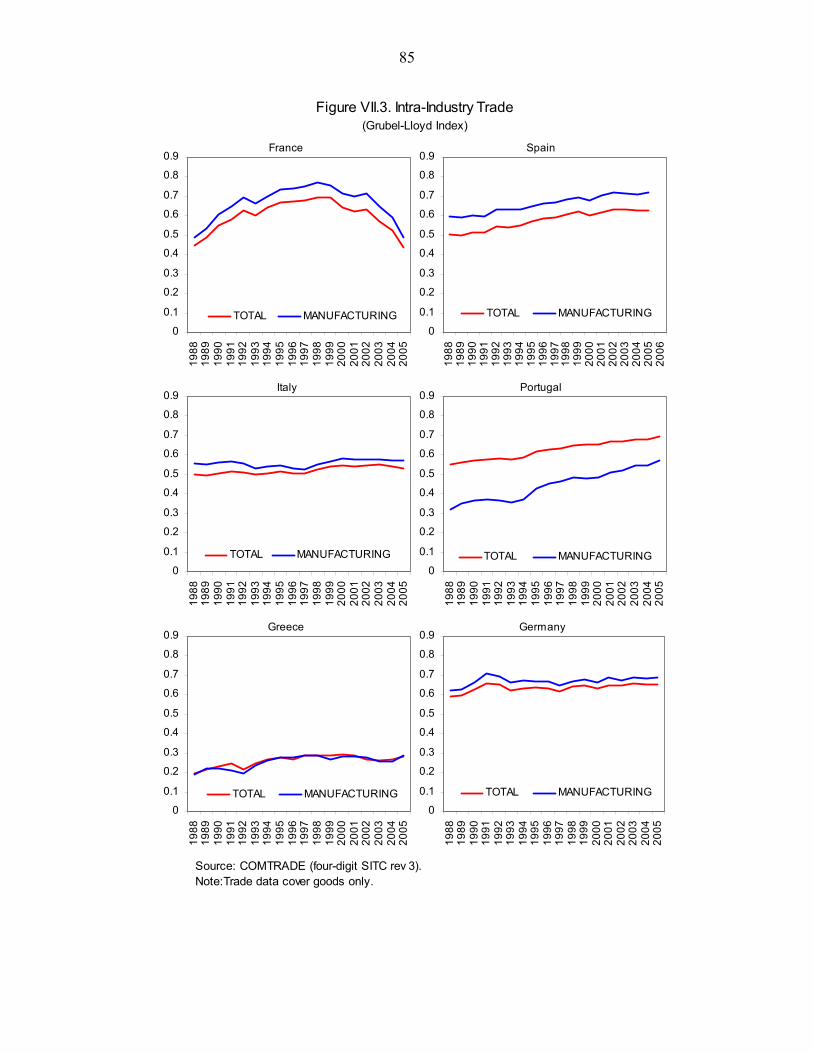
85
Figure VII.3. Intra-Industry Trade (Grubel-Lloyd Index)
Source: COMTRADE (four-digit SITC rev 3).Note:Trade data cover goods only.
France
0
0.1
0.2
0.3
0.4
0.5
0.6
0.7
0.8
0.9
1988
1989
1990
1991
1992
1993
1994
1995
1996
1997
1998
1999
2000
2001
2002
2003
2004
2005
TOTAL MANUFACTURING
Spain
0
0.1
0.2
0.3
0.4
0.5
0.6
0.7
0.8
0.9
1988
1989
1990
1991
1992
1993
1994
1995
1996
1997
1998
1999
2000
2001
2002
2003
2004
2005
2006
TOTAL MANUFACTURING
Italy
0
0.1
0.2
0.3
0.4
0.5
0.6
0.7
0.8
0.9
1988
1989
1990
1991
1992
1993
1994
1995
1996
1997
1998
1999
2000
2001
2002
2003
2004
2005
TOTAL MANUFACTURING
Portugal
0
0.1
0.2
0.3
0.4
0.5
0.6
0.7
0.8
0.9
1988
1989
1990
1991
1992
1993
1994
1995
1996
1997
1998
1999
2000
2001
2002
2003
2004
2005
TOTAL MANUFACTURING
Greece
0
0.1
0.2
0.3
0.4
0.5
0.6
0.7
0.8
0.9
1988
1989
1990
1991
1992
1993
1994
1995
1996
1997
1998
1999
2000
2001
2002
2003
2004
2005
TOTAL MANUFACTURING
Germany
0
0.1
0.2
0.3
0.4
0.5
0.6
0.7
0.8
0.9
1988
1989
1990
1991
1992
1993
1994
1995
1996
1997
1998
1999
2000
2001
2002
2003
2004
2005
TOTAL MANUFACTURING
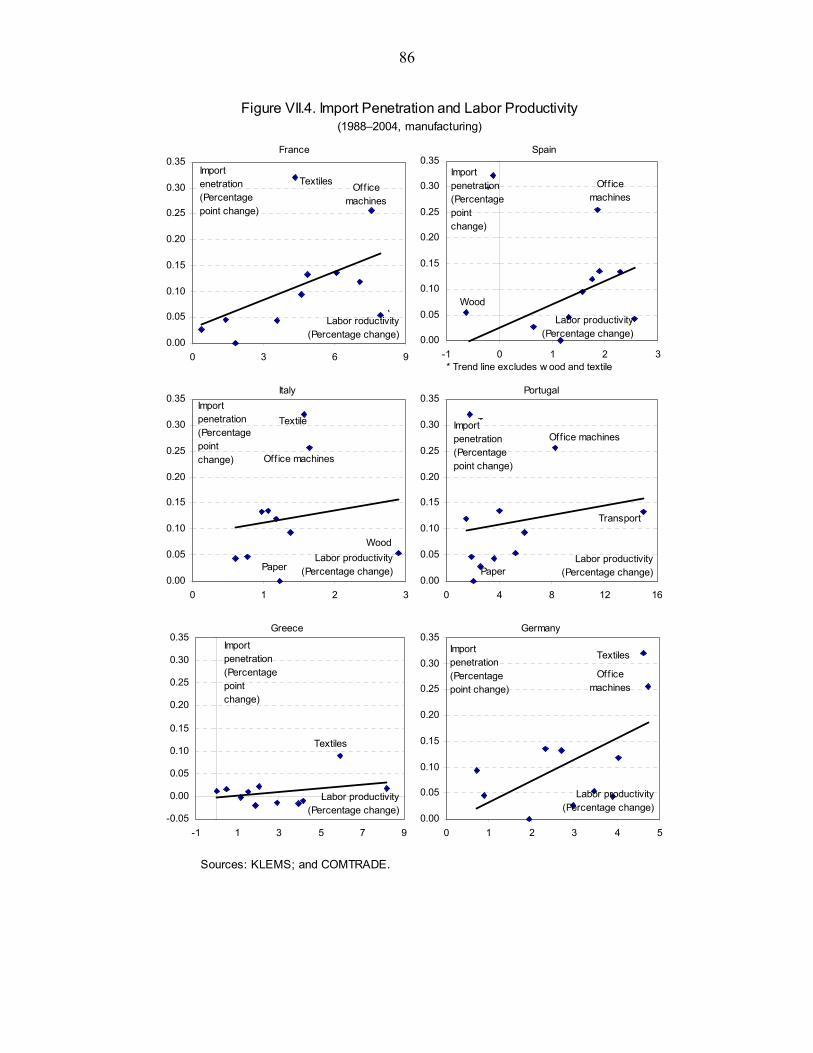
86
Figure VII.4. Import Penetration and Labor Productivity (1988–2004, manufacturing)
Sources: KLEMS; and COMTRADE.
France
0.00
0.05
0.10
0.15
0.20
0.25
0.30
0.35
0 3 6 9
Textiles
W
Office machines
Labor roductivity(Percentage change)
Import enetration (Percentage point change)
Spain
0.00
0.05
0.10
0.15
0.20
0.25
0.30
0.35
-1 0 1 2 3
T
Wood
Office machines
Import penetration (Percentage point change)
Labor productivity (Percentage change)
Italy
0.00
0.05
0.10
0.15
0.20
0.25
0.30
0.35
0 1 2 3
WoodLabor productivity
(Percentage change)
Import penetration (Percentage point change)
Textile
Off ice machines
Paper
Portugal
0.00
0.05
0.10
0.15
0.20
0.25
0.30
0.35
0 4 8 12 16
TOffice machines
Transport
Paper
Import penetration (Percentage point change)
Labor productivity (Percentage change)
Greece
-0.05
0.00
0.05
0.10
0.15
0.20
0.25
0.30
0.35
-1 1 3 5 7 9
Textiles
Labor productivity(Percentage change)
Import penetration (Percentage point change)
Germany
0.00
0.05
0.10
0.15
0.20
0.25
0.30
0.35
0 1 2 3 4 5
Import penetration (Percentage point change)
Labor productivity (Percentage change)
Textiles
Office machines
* Trend line excludes w ood and textile
87
References
Artus, P., and L. Fontagné, 2006, “Évolution récente du commerce extérieure français,” Rapport du Conseil d’Analyse Économique, La Documentation française (Paris).
Baumann, U., and F. di Mauro, 2007, “Globalization and Euro Area Trade-Interactions and Challenges,” ECB Occasional Paper No 55 (March).
Delozier, B., and S. Montout, 2007, “New trends in globalization and the international division of labor: Consequences for Europe?” Documents De Travail De La DGTPE, No 2007/03.
EU KLEMS, 2007, “Productivity in the European Union: A Comparative Industry Approach,” Available via the Internet: http://www.euklems.net/.
Fontagné, L., and M. Freudenberg, 1997, “Intra-Industry Trade: Methodological Issues Reconsidered,” CEPII document de travaille, No. 97-01.
Fontagné, L., G. Gaulier, and S. Zignago, 2007, “Specialization across varieties within products and North-South competition,” CEPII Working Paper No. 2007–06.
Frankel, Jeffrey A., and A.K. Rose, 2000, “Estimating the Effect of Currency Unions on Trade and Output,” CEPR Discussion Paper No. 2631 (December).
Hatzichronoglou, T., 1997, “Revision of the High-Technology Sector and Product Classification,” OECD Science, Technology and Industry Working Paper 1997/2.
Hooper, P., K. Johnson, and J. Marquez, 2000, “Trade Elasticities for the G-7 Countries,” Princeton Studies in International Economics, No. 87 (August).
Krugman, P., 1981, “Intraindustry Specialization and the Gains from Trade,” The Journal of Political Economy, Vol. 89, No. 5, pp. 959–73 (October).
———, and M. Obstfeld, 2003, International Economics, 6th edition (Addison-Wesley).
Madariaga, N., 2007, “Has France adjusted to recent trends in world trade?” Trésor-Economics, DGTPE, No 17, (September).
OECD, 2007, “Staying Competitive in the Global Economy-Moving up the Value Chain.”
———, 2002, “Intra-industry and intra-firm trade and the internationalization of production,” Economic Outlook 71, Chapter VI.
88
VIII. OUTSOURCING AND COMPETITIVENESS IN SOUTHERN EUROPE1
1. As a result of globalization, firms in countries around the world have been engaged in a “fragmentation” of the production process, i.e., breaking the production process into smaller tasks and carrying them out where they can be accomplished most cheaply. This process has been referred to as “outsourcing” and it can take a variety of forms. Outsourcing can take place domestically, as when a firm procures the services of an supplier who is located in the same country, or internationally, as when a foreign firm provides the service. When the latter occurs, it is termed “offshoring” and this practice has received a great deal of press attention in recent years because it is sometimes alleged that it leads to job losses in the home economy. Both domestic outsourcing and foreign outsourcing give rise to trade, either domestically between firms or internationally.
2. In terms of the simplest possible model of international trade—the Ricardian model—offshoring is beneficial to the economy that engages in it, based on the logic of comparative advantage. If an activity can be undertaken at a lower cost abroad rather than at home, it is beneficial for the home country to let a foreign provider produce the good or service and then import it. The home country benefits since it would enjoy gains from specialization and trade. To the extent that a country is able to reduce its production costs by importing components or services from countries where they can be produced at lower costs (for the same level of quality), industries in the importing country become more competitive—they can then produce the same level of output as they did prior to engaging in offshoring but at a lower cost. Exporters who use imported intermediate inputs would enjoy a cost advantage, relative to exporters who do not engage in offshoring. Offshoring should then improve the competitiveness of the country that engages in offshoring.
3. In addition to reducing production, i.e., inputs costs, offshoring may affect the competitiveness of the home economy through positive productivity spillovers. One reason why a domestic firm may engage in offshoring is that a foreign provider can produce a good or service with a superior technology. By offshoring an activity to a foreign provider and then importing the good or service, the domestic firm could learn from the better technology and eventually adopt it at home. Thus, offshoring could raise productivity at home to the extent that the domestic firm benefits from “spillovers” that arise from exposure to a better production activity.2 For example, a foreign firm may use a type of computer software that accomplishes a task more efficiently than the domestic firm. As a result of offshoring, the
1 Prepared by Stephen Tokarick.
2 Positive productivity spillovers may also arise as a result of direct foreign investment. For a discussion of this, see Gordo, Martin, and Patrocinio (2008).
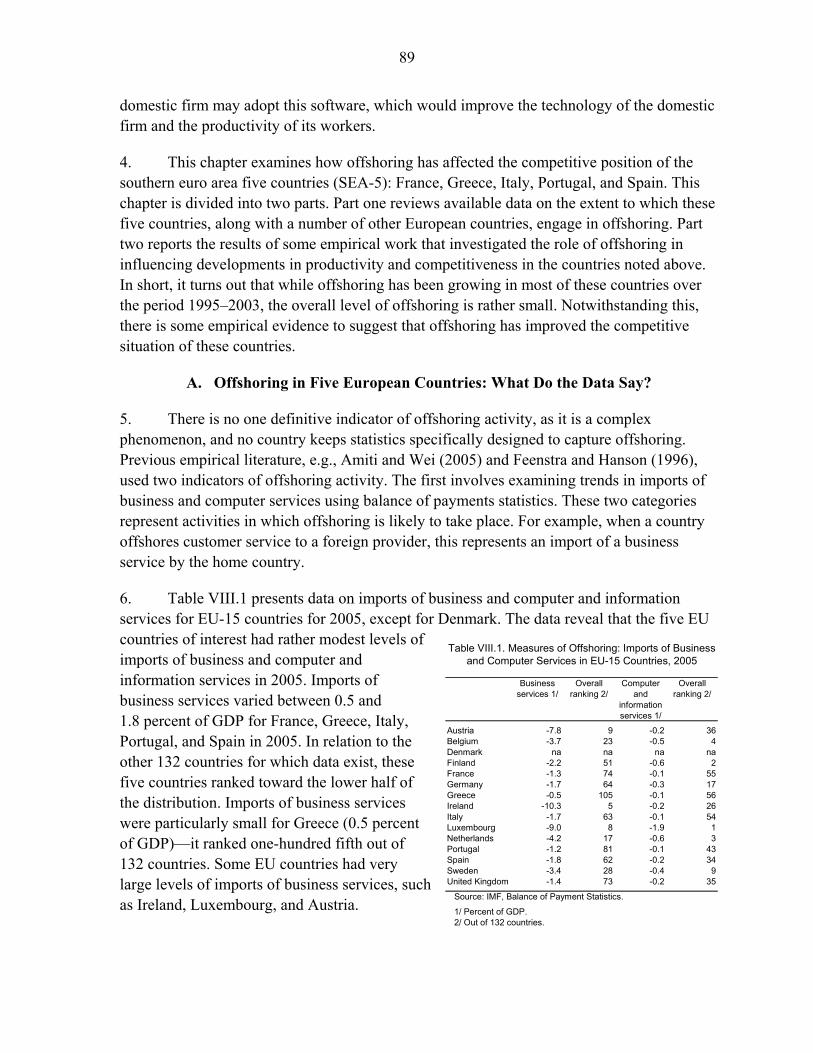
89
domestic firm may adopt this software, which would improve the technology of the domestic firm and the productivity of its workers.
4. This chapter examines how offshoring has affected the competitive position of the southern euro area five countries (SEA-5): France, Greece, Italy, Portugal, and Spain. This chapter is divided into two parts. Part one reviews available data on the extent to which these five countries, along with a number of other European countries, engage in offshoring. Part two reports the results of some empirical work that investigated the role of offshoring in influencing developments in productivity and competitiveness in the countries noted above. In short, it turns out that while offshoring has been growing in most of these countries over the period 1995–2003, the overall level of offshoring is rather small. Notwithstanding this, there is some empirical evidence to suggest that offshoring has improved the competitive situation of these countries.
A. Offshoring in Five European Countries: What Do the Data Say?
5. There is no one definitive indicator of offshoring activity, as it is a complex phenomenon, and no country keeps statistics specifically designed to capture offshoring. Previous empirical literature, e.g., Amiti and Wei (2005) and Feenstra and Hanson (1996), used two indicators of offshoring activity. The first involves examining trends in imports of business and computer services using balance of payments statistics. These two categories represent activities in which offshoring is likely to take place. For example, when a country offshores customer service to a foreign provider, this represents an import of a business service by the home country.
6. Table VIII.1 presents data on imports of business and computer and information services for EU-15 countries for 2005, except for Denmark. The data reveal that the five EU countries of interest had rather modest levels of imports of business and computer and information services in 2005. Imports of business services varied between 0.5 and 1.8 percent of GDP for France, Greece, Italy, Portugal, and Spain in 2005. In relation to the other 132 countries for which data exist, these five countries ranked toward the lower half of the distribution. Imports of business services were particularly small for Greece (0.5 percent of GDP)—it ranked one-hundred fifth out of 132 countries. Some EU countries had very large levels of imports of business services, such as Ireland, Luxembourg, and Austria.
Table VIII.1. Measures of Offshoring: Imports of Businessand Computer Services in EU-15 Countries, 2005
Business services 1/
Overall ranking 2/
Computer and
information services 1/
Overall ranking 2/
Austria -7.8 9 -0.2 36Belgium -3.7 23 -0.5 4Denmark na na na naFinland -2.2 51 -0.6 2France -1.3 74 -0.1 55Germany -1.7 64 -0.3 17Greece -0.5 105 -0.1 56Ireland -10.3 5 -0.2 26Italy -1.7 63 -0.1 54Luxembourg -9.0 8 -1.9 1Netherlands -4.2 17 -0.6 3Portugal -1.2 81 -0.1 43Spain -1.8 62 -0.2 34Sweden -3.4 28 -0.4 9United Kingdom -1.4 73 -0.2 35
Source: IMF, Balance of Payment Statistics.
1/ Percent of GDP.2/ Out of 132 countries.
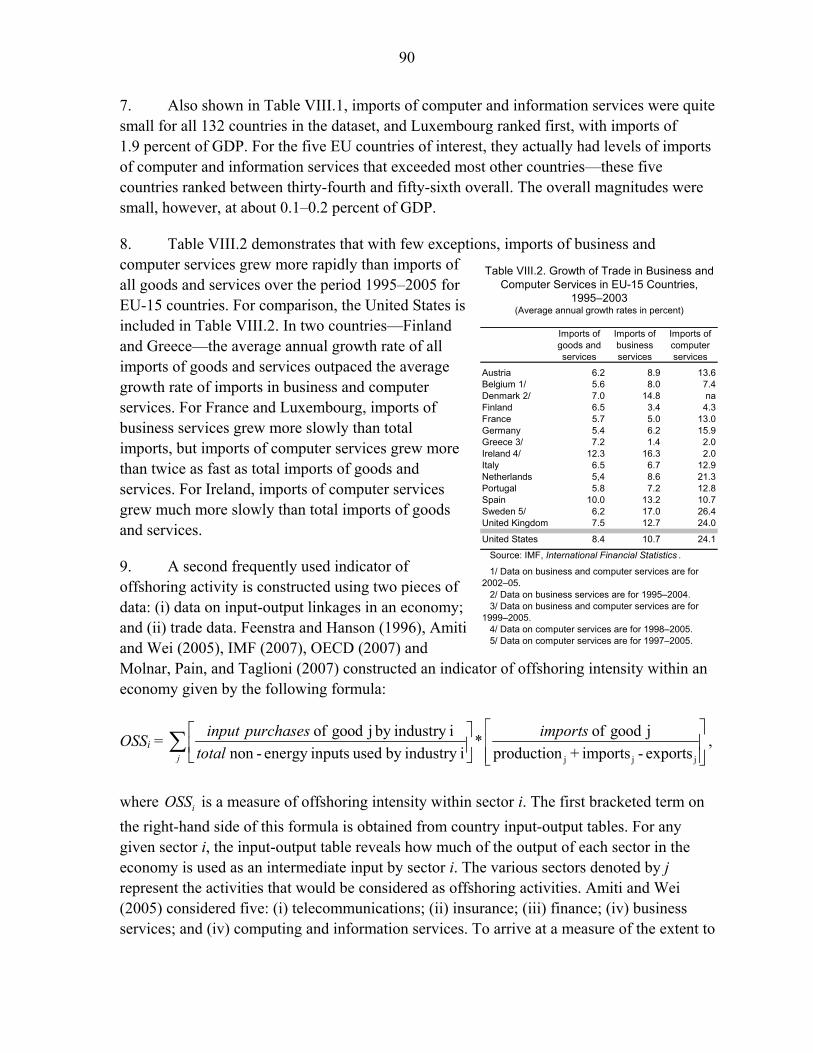
90
7. Also shown in Table VIII.1, imports of computer and information services were quite small for all 132 countries in the dataset, and Luxembourg ranked first, with imports of 1.9 percent of GDP. For the five EU countries of interest, they actually had levels of imports of computer and information services that exceeded most other countries—these five countries ranked between thirty-fourth and fifty-sixth overall. The overall magnitudes were small, however, at about 0.1–0.2 percent of GDP.
8. Table VIII.2 demonstrates that with few exceptions, imports of business and computer services grew more rapidly than imports of all goods and services over the period 1995–2005 for EU-15 countries. For comparison, the United States is included in Table VIII.2. In two countries—Finland and Greece—the average annual growth rate of all imports of goods and services outpaced the average growth rate of imports in business and computer services. For France and Luxembourg, imports of business services grew more slowly than total imports, but imports of computer services grew more than twice as fast as total imports of goods and services. For Ireland, imports of computer services grew much more slowly than total imports of goods and services.
9. A second frequently used indicator of offshoring activity is constructed using two pieces of data: (i) data on input-output linkages in an economy; and (ii) trade data. Feenstra and Hanson (1996), Amiti and Wei (2005), IMF (2007), OECD (2007) and Molnar, Pain, and Taglioni (2007) constructed an indicator of offshoring intensity within an economy given by the following formula:
OSSi = j j j
of good j by industry i of good j* non - energy inputs used by industry i production + imports - exportsj
input purchases importstotal
⎡ ⎤⎡ ⎤⎢ ⎥⎢ ⎥⎢ ⎥⎣ ⎦ ⎣ ⎦
∑ ,
where iOSS is a measure of offshoring intensity within sector i. The first bracketed term on the right-hand side of this formula is obtained from country input-output tables. For any given sector i, the input-output table reveals how much of the output of each sector in the economy is used as an intermediate input by sector i. The various sectors denoted by j represent the activities that would be considered as offshoring activities. Amiti and Wei (2005) considered five: (i) telecommunications; (ii) insurance; (iii) finance; (iv) business services; and (iv) computing and information services. To arrive at a measure of the extent to
Table VIII.2. Growth of Trade in Business andComputer Services in EU-15 Countries,
1995–2003(Average annual growth rates in percent)
Imports of goods and services
Imports of business services
Imports of computer services
Austria 6.2 8.9 13.6Belgium 1/ 5.6 8.0 7.4Denmark 2/ 7.0 14.8 naFinland 6.5 3.4 4.3France 5.7 5.0 13.0Germany 5.4 6.2 15.9Greece 3/ 7.2 1.4 2.0Ireland 4/ 12.3 16.3 2.0Italy 6.5 6.7 12.9Netherlands 5,4 8.6 21.3Portugal 5.8 7.2 12.8Spain 10.0 13.2 10.7Sweden 5/ 6.2 17.0 26.4United Kingdom 7.5 12.7 24.0
United States 8.4 10.7 24.1
Source: IMF, International Financial Statistics .
1/ Data on business and computer services are for2002–05.
2/ Data on business services are for 1995–2004.3/ Data on business and computer services are for
1999–2005.4/ Data on computer services are for 1998–2005.5/ Data on computer services are for 1997–2005.
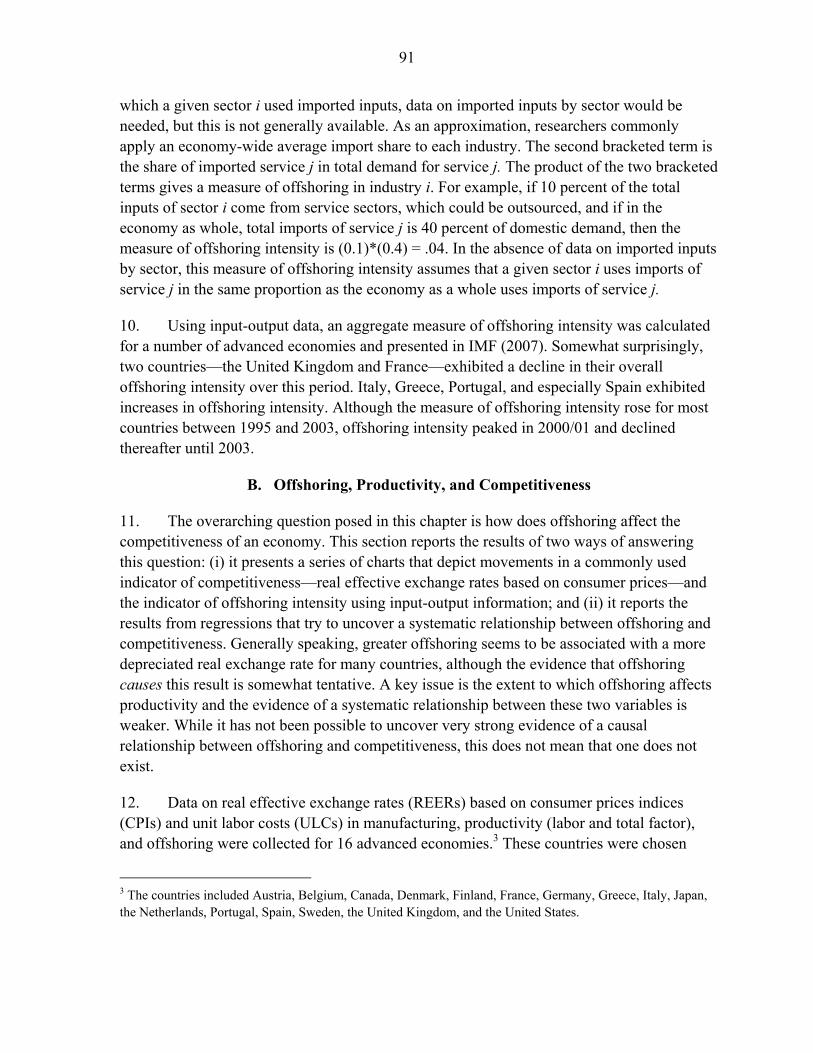
91
which a given sector i used imported inputs, data on imported inputs by sector would be needed, but this is not generally available. As an approximation, researchers commonly apply an economy-wide average import share to each industry. The second bracketed term is the share of imported service j in total demand for service j. The product of the two bracketed terms gives a measure of offshoring in industry i. For example, if 10 percent of the total inputs of sector i come from service sectors, which could be outsourced, and if in the economy as whole, total imports of service j is 40 percent of domestic demand, then the measure of offshoring intensity is (0.1)*(0.4) = .04. In the absence of data on imported inputs by sector, this measure of offshoring intensity assumes that a given sector i uses imports of service j in the same proportion as the economy as a whole uses imports of service j.
10. Using input-output data, an aggregate measure of offshoring intensity was calculated for a number of advanced economies and presented in IMF (2007). Somewhat surprisingly, two countries—the United Kingdom and France—exhibited a decline in their overall offshoring intensity over this period. Italy, Greece, Portugal, and especially Spain exhibited increases in offshoring intensity. Although the measure of offshoring intensity rose for most countries between 1995 and 2003, offshoring intensity peaked in 2000/01 and declined thereafter until 2003.
B. Offshoring, Productivity, and Competitiveness
11. The overarching question posed in this chapter is how does offshoring affect the competitiveness of an economy. This section reports the results of two ways of answering this question: (i) it presents a series of charts that depict movements in a commonly used indicator of competitiveness—real effective exchange rates based on consumer prices—and the indicator of offshoring intensity using input-output information; and (ii) it reports the results from regressions that try to uncover a systematic relationship between offshoring and competitiveness. Generally speaking, greater offshoring seems to be associated with a more depreciated real exchange rate for many countries, although the evidence that offshoring causes this result is somewhat tentative. A key issue is the extent to which offshoring affects productivity and the evidence of a systematic relationship between these two variables is weaker. While it has not been possible to uncover very strong evidence of a causal relationship between offshoring and competitiveness, this does not mean that one does not exist.
12. Data on real effective exchange rates (REERs) based on consumer prices indices (CPIs) and unit labor costs (ULCs) in manufacturing, productivity (labor and total factor), and offshoring were collected for 16 advanced economies.3 These countries were chosen
3 The countries included Austria, Belgium, Canada, Denmark, Finland, France, Germany, Greece, Italy, Japan, the Netherlands, Portugal, Spain, Sweden, the United Kingdom, and the United States.
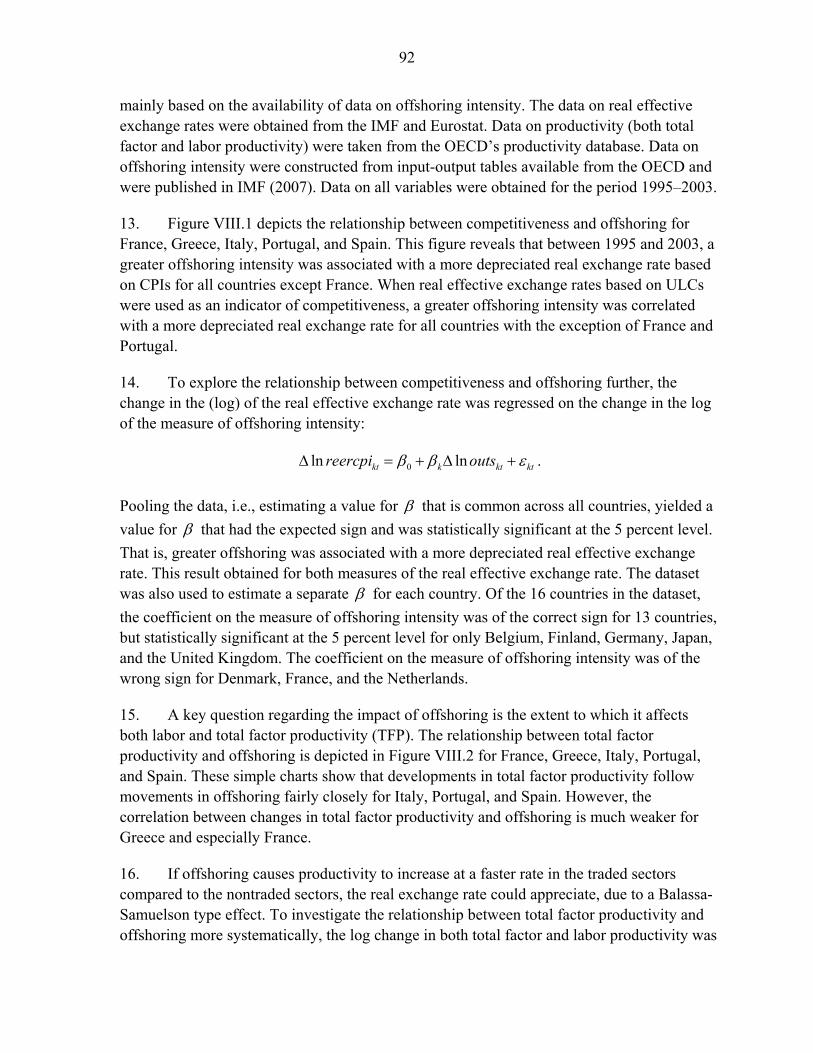
92
mainly based on the availability of data on offshoring intensity. The data on real effective exchange rates were obtained from the IMF and Eurostat. Data on productivity (both total factor and labor productivity) were taken from the OECD’s productivity database. Data on offshoring intensity were constructed from input-output tables available from the OECD and were published in IMF (2007). Data on all variables were obtained for the period 1995–2003.
13. Figure VIII.1 depicts the relationship between competitiveness and offshoring for France, Greece, Italy, Portugal, and Spain. This figure reveals that between 1995 and 2003, a greater offshoring intensity was associated with a more depreciated real exchange rate based on CPIs for all countries except France. When real effective exchange rates based on ULCs were used as an indicator of competitiveness, a greater offshoring intensity was correlated with a more depreciated real exchange rate for all countries with the exception of France and Portugal.
14. To explore the relationship between competitiveness and offshoring further, the change in the (log) of the real effective exchange rate was regressed on the change in the log of the measure of offshoring intensity:
0ln lnkt k kt ktreercpi outsβ β εΔ = + Δ + .
Pooling the data, i.e., estimating a value for β that is common across all countries, yielded a value for β that had the expected sign and was statistically significant at the 5 percent level. That is, greater offshoring was associated with a more depreciated real effective exchange rate. This result obtained for both measures of the real effective exchange rate. The dataset was also used to estimate a separate β for each country. Of the 16 countries in the dataset, the coefficient on the measure of offshoring intensity was of the correct sign for 13 countries, but statistically significant at the 5 percent level for only Belgium, Finland, Germany, Japan, and the United Kingdom. The coefficient on the measure of offshoring intensity was of the wrong sign for Denmark, France, and the Netherlands.
15. A key question regarding the impact of offshoring is the extent to which it affects both labor and total factor productivity (TFP). The relationship between total factor productivity and offshoring is depicted in Figure VIII.2 for France, Greece, Italy, Portugal, and Spain. These simple charts show that developments in total factor productivity follow movements in offshoring fairly closely for Italy, Portugal, and Spain. However, the correlation between changes in total factor productivity and offshoring is much weaker for Greece and especially France.
16. If offshoring causes productivity to increase at a faster rate in the traded sectors compared to the nontraded sectors, the real exchange rate could appreciate, due to a Balassa-Samuelson type effect. To investigate the relationship between total factor productivity and offshoring more systematically, the log change in both total factor and labor productivity was
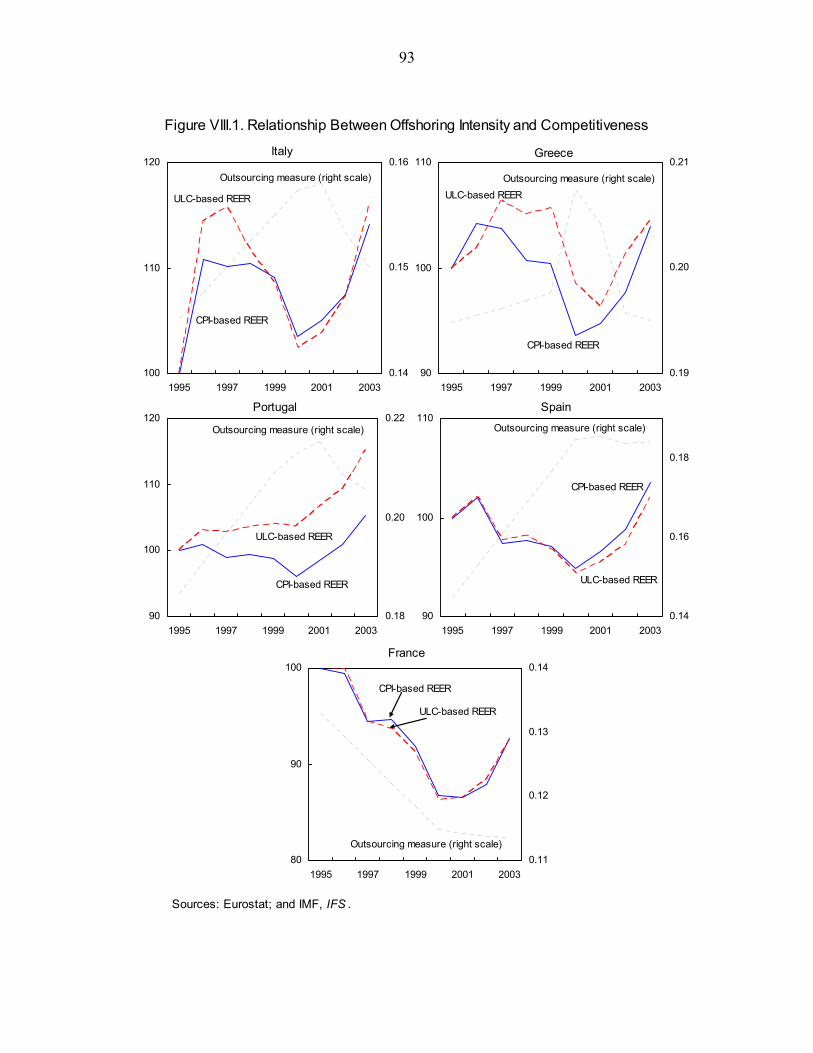
93
Figure VIII.1. Relationship Between Offshoring Intensity and Competitiveness
Sources: Eurostat; and IMF, IFS .
100
110
120
1995 1997 1999 2001 20030.14
0.15
0.16Outsourcing measure (right scale)
CPI-based REER
ULC-based REER
Italy
90
100
110
1995 1997 1999 2001 20030.19
0.20
0.21Outsourcing measure (right scale)
CPI-based REER
ULC-based REER
Greece
90
100
110
120
1995 1997 1999 2001 20030.18
0.20
0.22Outsourcing measure (right scale)
CPI-based REER
ULC-based REER
Portugal
90
100
110
1995 1997 1999 2001 20030.14
0.16
0.18
Outsourcing measure (right scale)
CPI-based REER
ULC-based REER
Spain
80
90
100
1995 1997 1999 2001 20030.11
0.12
0.13
0.14
Outsourcing measure (right scale)
CPI-based REER
ULC-based REER
France
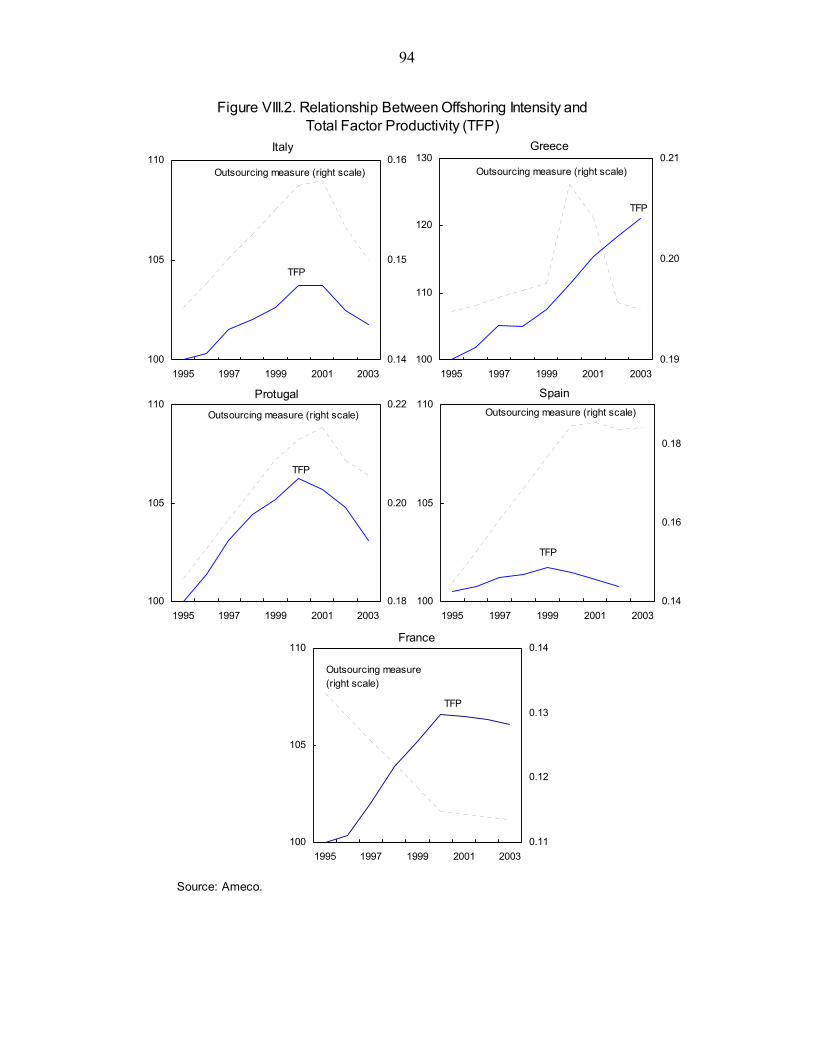
94
Figure VIII.2. Relationship Between Offshoring Intensity and Total Factor Productivity (TFP)
Source: Ameco.
100
105
110
1995 1997 1999 2001 20030.14
0.15
0.16Outsourcing measure (right scale)
TFP
Italy
100
110
120
130
1995 1997 1999 2001 20030.19
0.20
0.21Outsourcing measure (right scale)
TFP
Greece
100
105
110
1995 1997 1999 2001 20030.18
0.20
0.22Outsourcing measure (right scale)
TFP
Protugal
100
105
110
1995 1997 1999 2001 20030.14
0.16
0.18
Outsourcing measure (right scale)
Spain
TFP
100
105
110
1995 1997 1999 2001 20030.11
0.12
0.13
0.14
TFP
France
Outsourcing measure (right scale)
95
regressed on the log change in the offshoring intensity for the 16 countries in the dataset. As before, two sets of regressions are run—one that estimates a common coefficient for all countries and one that estimates a country-specific coefficient for the measure of offshoring intensity. In estimating a common coefficient for the measure of offshoring intensity, the results revealed that greater offshoring was associated with both higher TFP and labor productivity, but the results were not statistically significant for either type of productivity. Estimating a country specific impact of offshoring revealed a positive relationship between offshoring and total factor productivity for 10 countries, but only two were statistically significant at the 5 percent level: Finland and the Netherlands. For labor productivity, the results were similar. For 10 countries, the estimated relationship between offshoring intensity and labor productivity was positive but statistically significant at the 5 percent level for only Portugal and the Netherlands.
17. Existing studies of the impact of offshoring on productivity have failed to find convincing evidence of a causal relationship. For example, Egger and Egger (2006) examined the impact of materials offshoring in the manufacturing sector of the EU-12 on labor productivity and found that in the short run, the effect was negative but positive in the long run. One possible explanation for this is the low degree of flexibility in European labor markets. In the short run, it is difficult to reduce employment, so offshoring does not generate an improvement in labor productivity that would come from a reduction in employment. In a study of just Austria, Egger, Pfaffermayr, and Woldmayr-Schnitzer (2001) found that offshoring raised TFP in the manufacturing sector but less so in low-skilled sectors and more so in high-skilled sectors.
18. Finally, a much more complex set of regressions were run using the specification adopted in the IMF’s CGER exercise. Specifically, the “equilibrium exchange rate approach” was adopted, which uses panel regression techniques to estimate a relationship between real exchange rates a set of fundamentals.4 The equilibrium approach regresses the real exchange rate on the following variables: (i) the productivity of tradables to nontradables relative to trading partners; (ii) the commodity terms of trade; (iii) the ratio of net foreign assets to trade; and (iv) the ratio of government consumption to GDP. To this list was added the measure of offshoring intensity described above.
19. This empirical strategy reveals several strong results. First, when pooling data and estimating a common coefficient for the measure of offshoring intensity, the results showed that greater offshoring leads to a more depreciated exchange rate, and this relationship was highly significant. However, the inclusion of the measure of offshoring intensity in the regressions caused the sign of the coefficient on the relative productivity variable to switch
4 See “Methodology For CGER Exchange Rate Assessments,” 2006, for details.
96
from positive to negative—to contradict the Balassa-Samuelson effect. This same result occurred when a country-specific coefficient for the offshoring intensity was estimated.
C. Conclusions
20. The phenomenon of offshoring has received a great deal of attention in recent years as it has been growing in many advanced economies, albeit from low levels. Economic theory would suggest that offshoring would benefit an economy because it allows domestic producers to contact out various sub-activities of the production process to foreign providers who can produce the activity or component more cheaply and then import it. Thus, offshoring reduces production costs for domestic firms and makes them more efficient. Also, there are reasons to believe that offshoring can raise productivity at home.
21. For most European countries—the EU-15—offshoring activity has generally grown over the period between 1995 and 2003 and quite rapidly for some countries, although there has been a bit of a slowdown since 2000. Levels of offshoring activity—as measured by imports of business and computer services—are generally small: less than 2 percent of GDP for imports of business services and around 0.2 percent of GDP for imports of computer and information services for France, Greece, Italy, Portugal, and Spain in 2005. Data also suggest that changes in offshoring activity over the period between 1995 and 2003 have been associated with more depreciated real effective exchange rates for most of the countries examined, but this relationship is statistically significant for only five of 16 countries examined.
22. The data also reveal a positive relationship between offshoring and productivity (both TFP and labor productivity) for most countries over this same period, but this relationship is not statistically significant. The lack of very strong evidence of a positive relationship between offshoring and competitiveness and productivity could be due to a number of factors, including the lack of a direct measure of the extent to which a country engages in offshoring. All of the measures of offshoring used in this analysis were of an indirect nature. Also, data on offshoring intensity are only available for a relatively short time period for most countries. A longer time series might reveal a stronger relationship. Nevertheless, there is some empirical evidence to support at least some relationship between offshoring and improved competitiveness.
97
References Amiti, M., and S.J. Wei, 2005, “Service Offshoring, Productivity, and Employment:
Evidence From the United States.” Egger, H., and P. Egger, 2006, “International Outsourcing and the Productivity of Low-
skilled Labour in the EU,” Economic Inquiry, Vol. 44, Issue 1, pp. 98–108. Egger, P., M. Pfaffermayr, and Y. Wolfmayr-Schnitzer, 2001, “The International
Fragmentation of Austrian Manufacturing: The Effects of Outsourcing on Productivity and Wages,” North American Journal of Economics and Finance, Vol. 12, Issue 3. pp. 257–72.
Feenstra, R., and G. Hanson, 1996, “Globalization, Outsourcing, and Wage Inequality,”
American Economic Review, Vol. LXXXVI, pp. 240–45. Gordo, E., C. Martin, and T. Patrocinio, 2008, “La Internacionalizacion de las empresas
espanolas a través de la inversion extranjera directa,” Boletin Economico (Bank of Spain, January).
International Monetary Fund, 2006, “Methodology For CGER Exchange Rate Assessments.” ———, 2007, “The Globalization of Labor,” World Economic Outlook: Spillovers and
Cycles in the Global Economy, Chapter 5. Molnar, M., N. Pain, and D. Taglioni, 2007, “The Internationalisation of Production,
International Outsourcing, and Employment” Working Paper 561 (Paris: Organization For Economic Cooperation and Development, Economics Department).
Organization For Economic Cooperation and Development, 2007, OECD Employment
Outlook (Paris).
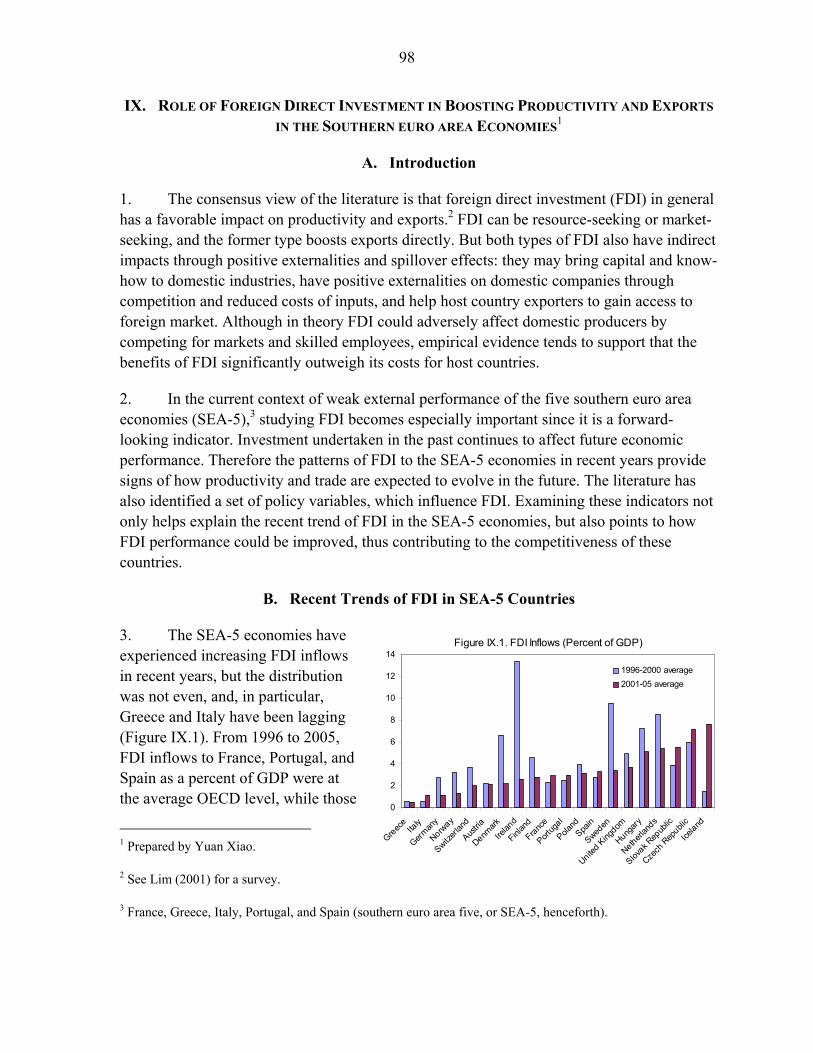
98
IX. ROLE OF FOREIGN DIRECT INVESTMENT IN BOOSTING PRODUCTIVITY AND EXPORTS IN THE SOUTHERN EURO AREA ECONOMIES1
A. Introduction
1. The consensus view of the literature is that foreign direct investment (FDI) in general has a favorable impact on productivity and exports.2 FDI can be resource-seeking or market-seeking, and the former type boosts exports directly. But both types of FDI also have indirect impacts through positive externalities and spillover effects: they may bring capital and know-how to domestic industries, have positive externalities on domestic companies through competition and reduced costs of inputs, and help host country exporters to gain access to foreign market. Although in theory FDI could adversely affect domestic producers by competing for markets and skilled employees, empirical evidence tends to support that the benefits of FDI significantly outweigh its costs for host countries.
2. In the current context of weak external performance of the five southern euro area economies (SEA-5),3 studying FDI becomes especially important since it is a forward-looking indicator. Investment undertaken in the past continues to affect future economic performance. Therefore the patterns of FDI to the SEA-5 economies in recent years provide signs of how productivity and trade are expected to evolve in the future. The literature has also identified a set of policy variables, which influence FDI. Examining these indicators not only helps explain the recent trend of FDI in the SEA-5 economies, but also points to how FDI performance could be improved, thus contributing to the competitiveness of these countries.
B. Recent Trends of FDI in SEA-5 Countries
3. The SEA-5 economies have experienced increasing FDI inflows in recent years, but the distribution was not even, and, in particular, Greece and Italy have been lagging (Figure IX.1). From 1996 to 2005, FDI inflows to France, Portugal, and Spain as a percent of GDP were at the average OECD level, while those
1 Prepared by Yuan Xiao.
2 See Lim (2001) for a survey.
3 France, Greece, Italy, Portugal, and Spain (southern euro area five, or SEA-5, henceforth).
0
2
4
6
8
10
12
14
Greece
Italy
German
y
Norway
Switzerl
and
Austria
Denmark
Irelan
d
Finlan
d
France
Portug
al
Poland
Spain
Sweden
United King
dom
Hungary
Netherlan
ds
Slovak R
epub
lic
Czech
Rep
ublic
Iceland
1996-2000 average2001-05 average
Figure IX.1. FDI Inflows (Percent of GDP)

99
to Greece and Italy were the lowest among the OECD countries. This pattern implies that FDI in general has not benefited the economies of Greece and Italy in the same way as might have happened in the other countries, and there is scope for promoting further FDI in Greece and Italy. It is worth noting, however, that FDI to Italy roughly doubled in 2001–05 compared with 1996–2000, while FDI in Greece remained stagnant.
4. Much of the FDI to the SEA-5 economies has been in the service sector, in line with the experience of other OECD countries. In particular, manufacturing FDI to Portugal was smaller than to the other SEA-5 countries. Since service is largely nontradable, this would imply that the direct impact of FDI on Portugal’s exports was more limited. Italy had relatively large FDI inflows to the quarrying sector. The main source countries for these FDI flows are the U.S., European countries, and Japan.
C. Could FDI Help Productivity and Exports? A Sectoral Analysis
5. Although FDI inflows to France, Portugal, and Spain have been at about the OECD average, their impact on productivity and exports depends on the sectoral distribution of FDI. The technological level of domestic industry could benefit more from FDI with a higher technological content, which could result in better export performance. If the FDI is targeted toward the sectors facing rapid growth in world demand, it could help the host country to gain market shares in those markets. Furthermore, as FDI is largely in the service sectors and these areas, e.g., infrastructure, often provide inputs to the tradable goods production, it would be desirable for FDI inflows to locate in service areas with higher levels of productivity, which would then have a stronger positive effect on the productivity of the tradable sector.
Has the technological content of FDI to the SEA-5 economies been rising? 6. While the SEA-5 countries in general received larger amounts of medium-tech FDI than low-tech and high-tech FDI, with the exception of Spain, there is no evidence that the overall technological composition was upgraded. Figures IX.2 and IX.3 show the trends of the technological content of FDI inflows to the manufacturing sector, based on the
Primary Manufacture Services
France 0.2 24.3 75.5 1996–2005Greece 1.4 20.1 78.5 2001–2004Italy 6.0 32.4 61.6 1996–2004Portugal 0.4 12.8 86.8 1994–2003Spain 0.8 22.1 77.0 1996–2004
Germany 0.2 7.7 92.2 1996–2005
Share of FDI Inflows(Percent of total)
100
Figure IX.2. Cumulative Inward FDI in Manufacturing (Millions of euros)
0
5000
10000
15000
20000
25000
Low Medium-low Medium-high High
1996-20002001-05
France
-400
-200
0
200
400
600
800
Low Medium-low Medium-high High
2001-04
Greece
0
2000
4000
6000
8000
10000
12000
Low Medium-low Medium-high High
1995-992000-04
Italy
0
500
1000
1500
2000
2500
Low Medium-low Medium-high High
1994-981999-03
Portugal
-1000
0
1000
2000
3000
4000
5000
6000
Low Medium-low Medium-high High
1997-20012002-06
Spain

101
0%
20%
40%
60%
80%
100%
1996 1998 2000 2002 2004
France
-20%
0%
20%
40%
60%
80%
100%
1995 1997 1999 2001 2003
Italy
Figure IX.3. Technological Content of FDI Inflows in Manufacturing
0%
20%
40%
60%
80%
100%
1994 1996 1998 2000 2002
Portugal
-20%
0%
20%
40%
60%
80%
100%
1997 1999 2001 2003 2005
Spain
Sources: OECD; UNCTAD; and national authorities.
Note: Each column, from bottom to top, consists the shares of FDI to low-, medium-low-, medium-high-, and high-technology industries, computed from the trend of FDI in each category. The classification is based on OECD (2005).
102
classification of OECD (2005).4 In France, medium low-technology FDI was replacing low-tech FDI, but medium high-technology FDI was also shrinking.5 In Italy, medium low-technology FDI was replacing high-tech FDI, while low-tech FDI remained stable. In Portugal, rising high-tech FDI was offset by increasing low-tech FDI. Overall, the technological compositions of FDI to these countries remained largely the same in the last decade. In Spain, however, there was a trend of disinvestment in low-tech industries and increasing medium-technology FDI.
Have the sectors facing fast growing world demand received expanding FDI inflows? 7. FDI appeared not to be targeted toward sectors with booming demand. Other things being equal, fast growing demand makes the investment more profitable. We calculate the sectoral trend of world demand based on COMTRADE data between 1997 and 2006. The fastest growing export markets in the world in the last decade are refined petroleum, metal products, chemical products, and certain high-tech sectors (medical, precision and optical instruments, electronic and communication equipments), while the demands for low-tech products (food, textile and footwear, and wood product) and computers have been growing slower. For each sector, Figure IX.4 plots the percent change of the sector’s share in FDI against the percent change of its share in world export demand. As can be seen, in all countries, there are no clear signs showing that sectors with faster growing demand received increasingly larger shares of FDI. Rather the opposite happened in Portugal and Spain, suggesting that FDI is not likely to contribute to boosting export performance in the most dynamic sectors.6
Have service FDI inflows been associated with higher productivity sectors? 8. The share of FDI flows in the service sectors with high levels of productivity has largely remained the same in the SEA-5 economies (except France and Spain). In Figure IX.5, we split service sector FDI inflows into two groups, those in the sectors with intrinsically high productivity and with low productivity. Based on the data from the Klems database, the service sectors with the highest value-added per worker in EU-15 are identified as: insurance and financial sector activities; computer and communication services; business
4 Since FDI flows are extremely volatile, the FDI shares in Figure IX.3 are computed by first estimating a linear trend for each category over the sample period. Greece is excluded due to the short sample (2001–04).
5 However, the high-tech FDI in France could have been rising as France received FDI inflows in the aircraft industry in recent years. But the missing data for earlier years prevent this category to be included in Figure IX.3.
6 The caveat here is that high productivity firms could increase market shares in slower growing markets.
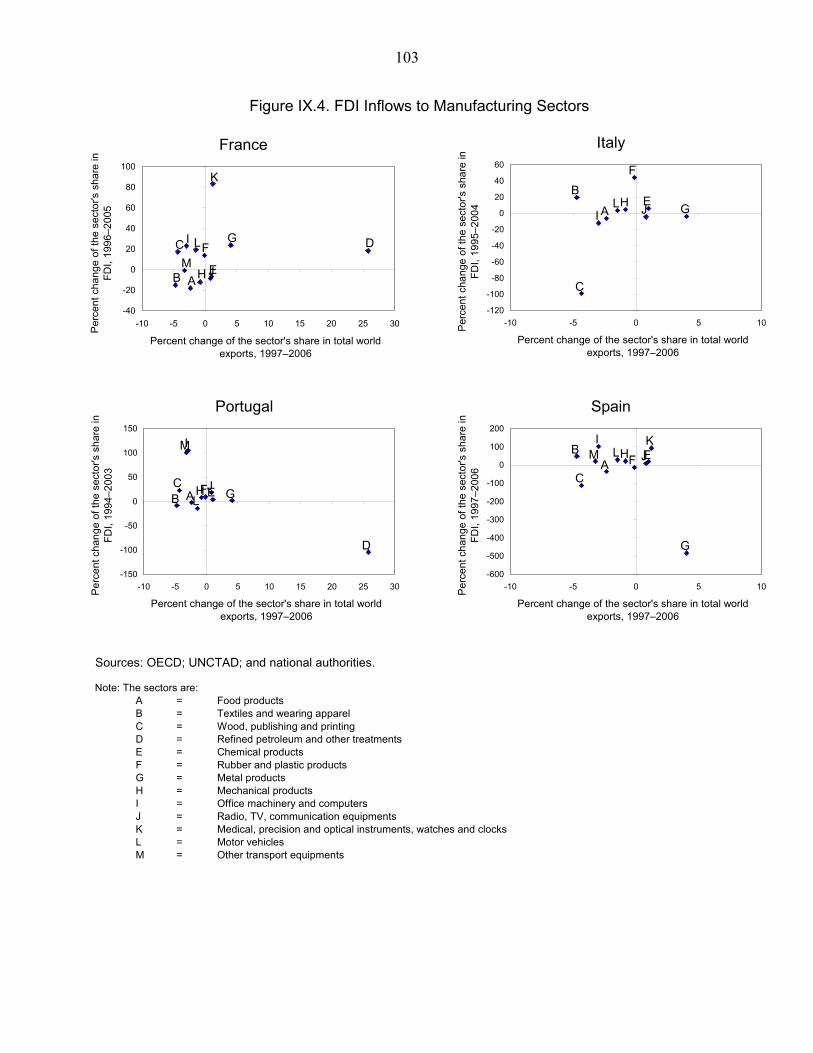
103
Sources: OECD; UNCTAD; and national authorities.
Note: The sectors are:A = Food products B = Textiles and wearing apparelC = Wood, publishing and printing D = Refined petroleum and other treatmentsE = Chemical productsF = Rubber and plastic productsG = Metal productsH = Mechanical productsI = Office machinery and computersJ = Radio, TV, communication equipmentsK = Medical, precision and optical instruments, watches and clocksL = Motor vehiclesM = Other transport equipments
Figure IX.4. FDI Inflows to Manufacturing Sectors
M
L
K
J
I
H
GF
E
DC
B A
-40
-20
0
20
40
60
80
100
-10 -5 0 5 10 15 20 25 30
France
Per
cent
cha
nge
of th
e se
ctor
's s
hare
in
FDI,
1996
–200
5
Percent change of the sector's share in total world exports, 1997–2006
L JIH G
F
E
C
B
A
-120
-100
-80
-60
-40
-20
0
20
40
60
-10 -5 0 5 10
Italy
Per
cent
cha
nge
of th
e se
ctor
's s
hare
in
FDI,
1995
–200
4
Percent change of the sector's share in total world exports, 1997–2006
M
LJ
I
H GFE
D
CB A
-150
-100
-50
0
50
100
150
-10 -5 0 5 10 15 20 25 30
Portugal
Per
cent
cha
nge
of th
e se
ctor
's s
hare
in
FDI,
1994
–200
3
Percent change of the sector's share in total world exports, 1997–2006
M LK
JI
H
G
F E
C
BA
-600
-500
-400
-300
-200
-100
0
100
200
-10 -5 0 5 10
Spain
Per
cent
cha
nge
of th
e se
ctor
's s
hare
in
FDI,
1997
–200
6
Percent change of the sector's share in total world exports, 1997–2006

104
Figure IX.5. Service Sector FDI (Millions of euros)
-10000
0
10000
20000
30000
40000
50000
1996 1997 1998 1999 2000 2001 2002 2003 2004 2005
High productivityLow productivity
France
-200
0
200
400
600
800
1000
1200
2001 2002 2003 2004
High productivityLow productivity
Greece
0
1000
2000
3000
4000
5000
6000
7000
8000
1995 1996 1997 1998 1999 2000 2001 2002 2003 2004
High productivityLow productivity
Italy
-1000
-500
0
500
1000
1500
2000
2500
3000
3500
4000
1994 1995 1996 1997 1998 1999 2000 2001 2002 2003
High productivityLow productivity
Portugal
-4000
-2000
0
2000
4000
6000
8000
10000
12000
14000
16000
1997 1998 1999 2000 2001 2002 2003 2004 2005 2006
High productivityLow productivity
Spain
105
services, such as leasing, legal technical, and advertising; and water and air transport. It appears that in Greece, Italy, and Portugal, FDI inflows were rising at similar paces in both high- and low-productivity sectors. In France, and to some extent Spain, there is evidence that FDI was increasingly concentrated in the high-productivity service sectors.
D. Scope for Further Attracting FDI in the SEA-5 Economies
9. What has contributed to low FDI inflows to Greece and Italy, and is there scope for further attracting FDI in all the SEA-5 countries? There is a vast literature on the determinants of FDI,7 suggesting that two types of factors are at play: nonpolicy factors (a country’s size and its distance to the source country) and policy variables, such as regulatory restrictions on FDI, labor market arrangements, product market regulations, and the business environment. A more restrictive policy environment would raise the production costs of the foreign and domestic firms and hamper competition and the flow of resources.
10. A salient observation is that the SEA-5 countries, especially Greece and Italy, score unfavorably in most of these indicators, suggesting a possible area for improvement. Figure IX.6 plots the main policy factors for the advanced OECD economies. The SEA-5 countries constitute the lowest five among OECD countries in the World Bank Ease of Doing Business Index. The bottom two—Italy and Greece—also ranked 82 and 109 among the 175 countries covered in the 2007 index. In the Economist Intelligence Unit’s Business Environment ratings, Italy and Greece ranked 40 and 43 among the 82 countries covered. OECD’s employment protection legislation indicator shows that the SEA-5 countries are among the strictest, and France and Italy are among the countries with very high tax wedges.8 OECD’s product market regulation index again shows that the SEA-5 countries are at the bottom, although these countries do not appear to have very high restrictions on FDI. These findings imply that the SEA-5 countries could make themselves more attractive to FDI by improving their business environments. For instance, the simulation in Nicoletti, et al (2003) suggests that lowering the product market restrictiveness to the level of the U.K. could result in 45–80 percent increase of their FDI positions from the levels in the 1990s for Portugal, France, Italy, and Greece.
7 For a review of the literature, see Lim (2001) and Blonigen (2005). Nicoletti, et al (2003) estimate the determinants of FDI in the OECD countries using panel regression.
8 The simple correlation between labor market indexes and FDI shown in the figure is biased because of missing factors. Rigorous econometric work in Nicoletti, et al (2003) finds that the correlation is negative when all the relevant variables are taking into account in the regression.
106
E. Conclusions
11. With the exception of France and Spain, FDI patterns of the SEA-5 countries cast doubts on whether FDI has played as significant a role as it could be in boosting external performance. Although FDI inflows have been rising, the patterns were different among the five countries. France and Spain appear to be relatively well positioned. FDI flows to Greece and Italy were the lowest in the OECD. As a result, they are likely to have had only limited externalities on productivity and trade. Portugal, although being able to attract larger inflows, did not seem to have a sectoral distribution conducive to future growth and also had lower manufacturing FDI than the rest. Furthermore, scope exists in improving the policy environment for FDI, as the SEA-5 countries score unfavorably on most of the policy criteria.
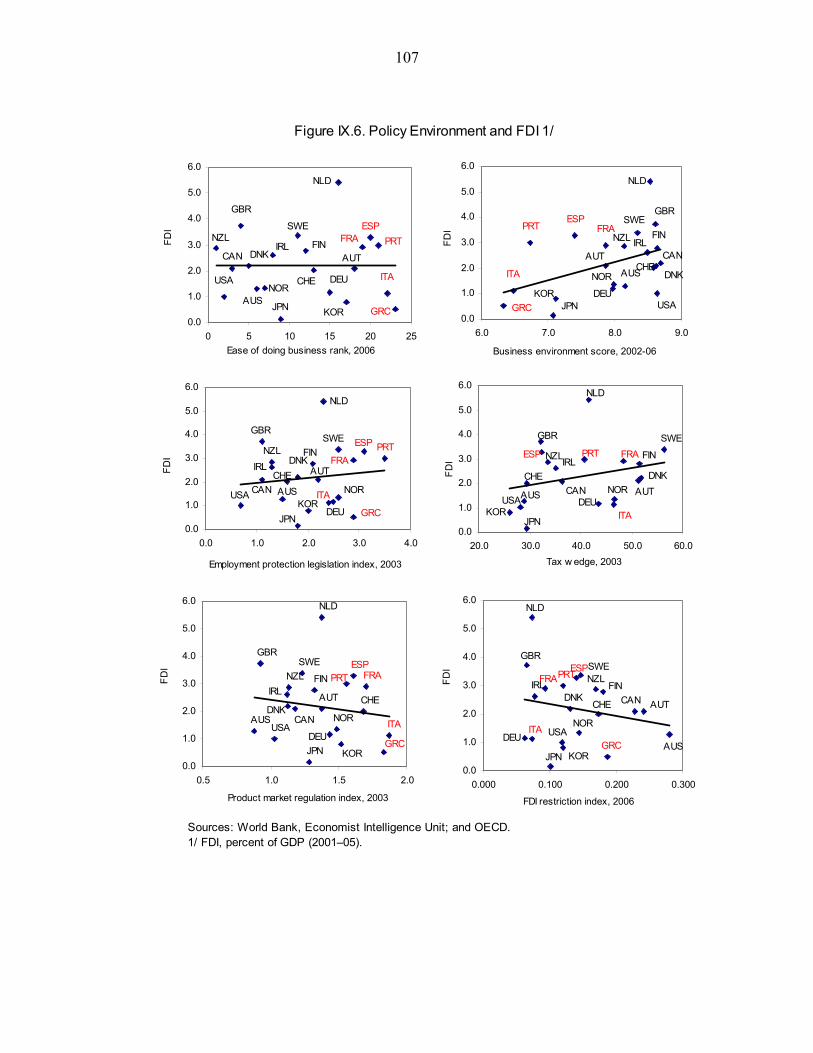
107
Sources: World Bank, Economist Intelligence Unit; and OECD.1/ FDI, percent of GDP (2001–05).
Figure IX.6. Policy Environment and FDI 1/
USA
GBR
CHE
SWEESPPRT
NOR
NZL
NLD
KORJPN
ITA
IRL
GRCDEU
FRA FIN
DNK
CANAUT
AUS
0.0
1.0
2.0
3.0
4.0
5.0
6.0
6.0 7.0 8.0 9.0
FDI
Business environment score, 2002-06
AUS
AUTCAN DNKFIN FRA
DEU
GRC
IRL
ITA
JPN KOR
NLD
NZL
NOR
PRTESPSWE
CHE
GBR
USA
0.0
1.0
2.0
3.0
4.0
5.0
6.0
0 5 10 15 20 25
FDI
Ease of doing business rank, 2006
AUS
AUT
CAN
DNKFIN
FRA
DEU GRC
IRL
ITA
JPNKOR
NLD
NZL
NOR
PRTESPSWE
CHE
GBR
USA
0.0
1.0
2.0
3.0
4.0
5.0
6.0
0.0 1.0 2.0 3.0 4.0
FDI
Employment protection legislation index, 2003
AUS AUTCANDNK
FINFRA
DEU
IRL
ITAJPNKOR
NLD
NZL
NOR
PRTESPSWE
CHE
GBR
USA
0.0
1.0
2.0
3.0
4.0
5.0
6.0
20.0 30.0 40.0 50.0 60.0
FDI
Tax w edge, 2003
AUS
AUT
CANDNK
FIN FRA
DEUGRC
IRL
ITA
JPN KOR
NLD
NZL
NOR
PRTESPSWE
CHE
GBR
USA
0.0
1.0
2.0
3.0
4.0
5.0
6.0
0.5 1.0 1.5 2.0
FDI
Product market regulation index, 2003
AUS
AUTCANDNKFIN
FRA
DEUGRC
IRL
ITA
JPN KOR
NLD
NZL
NOR
PRTESPSWE
CHE
GBR
USA
0.0
1.0
2.0
3.0
4.0
5.0
6.0
0.000 0.100 0.200 0.300
FDI
FDI restriction index, 2006
108
Reference Blonigen, B. A., 2005, “A review of the empirical literature on FDI determinants,” National
Bureau of Economic Research Working Paper No. 11299, pp. 1–37. Demekas, D. G., B. Horváth, E. Ribakova, and Y. Wu, 2005, “Foreign Direct Investment in
Southeastern Europe: How (and How Much) Can Policies Help?” IMF Working Paper No. 05/110.
Economist Intelligence Unit, 2007, World investment prospects to 2011. Lim, E-G, 2001, “Determinants of, and the Relation Between, Foreign Direct Investment and
Growth: A Summary of the Recent Literature,” IMF Working Paper No. 01/175. Nicoletti, G., S. Golub, D. Hajkova, D. Mirza, and K.Y. Yoo, 2003, “Policies and
international integration: influences on trade and foreign direct investment,” OECD Economics Department Working Paper No. 359.
OECD, 2005, Science, Technology and Industry Scoreboard 2005.

109
X. INTERNATIONAL COMPETITIVENESS: LOOKING AT DIRECT COMPETITORS1
A. Introduction
1. The common pattern of real appreciation observed during recent years in Greece, Italy, Portugal, and Spain has created concerns in policy and academic circles (Bini-Smaghi, 2007; EC, 2007; Roubini, 2007; and Papademos, 2007). It is argued that this real appreciation is associated with a loss of international competitiveness and could lead to a persistent period of slow growth, which has already materialized in the case of Italy and Portugal (Blanchard, 2006a and 2006b).
2. This study evaluates the evolution of international competitiveness, as measured by the ULC-based real effective exchange rate (REER2), incorporating two distinctive elements not considered in the current literature: a microbased approach of the structure of competitors and exports of services. For this purpose, we develop a complete methodology to estimate the REER that incorporates these two elements, and we take a closer look at their importance in France and in the four Mediterranean countries mentioned above (SEA-5). Our approach enriches the REER analysis by identifying more accurately each country’s direct competitors and providing an aggregate view of international competitiveness that encompasses the complete export sector.3
3. With respect to the structure of competitors, our methodology relaxes the common assumption used in the literature that all (or most) exported goods compete with each other in the destination market; we call this the homogenous-product approach (HPA). By contrast, we take a more microbased approach that analyzes countries' international price competitiveness by defining different markets for different types of products and destinations, and aggregating market-level REER indices to obtain a country-level REER; we call this the differentiated-product approach (DPA).
1 Prepared by Herman Bennett and Ziga Zarnic (LICOS - KU Leuven).
2 The concept of REER is the most commonly used measure of international competitiveness and is frequently used in policy and academic discussions. See Agenor (1995), Catao (2007), Chinn (2006), Fung and Klau (2006), Marsh and Tokarick (1996), Neary (2006), and Rogoff (1996) for further references to the concepts of REER and real exchange rate. 3 This study is based on Bennett and Zarnic (2007), which presents the complete description of the methodology, data and the full set of results. Due to lack of consistent data across countries, our analysis centers on the external markets where each country competes with local producers as well as with other foreign exporters. Our analysis suggests that incorporating internal market competition to this framework does not change the conclusions of this study (differences are below 1 percent).
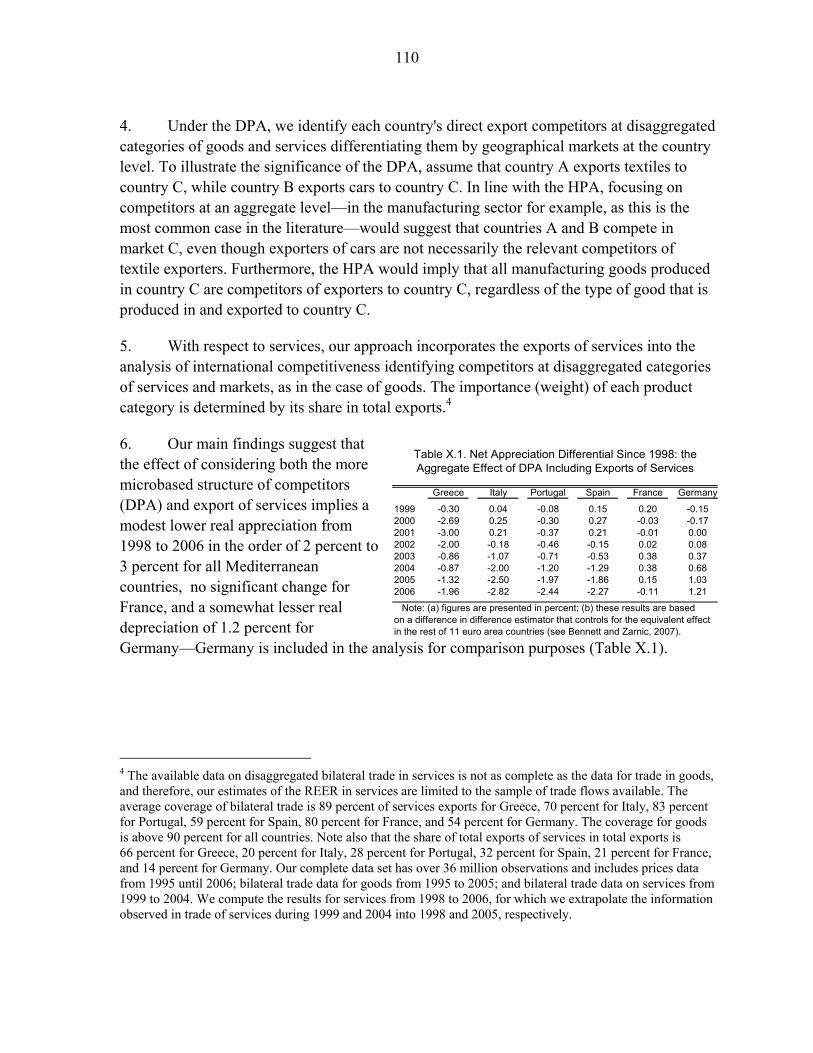
110
4. Under the DPA, we identify each country's direct export competitors at disaggregated categories of goods and services differentiating them by geographical markets at the country level. To illustrate the significance of the DPA, assume that country A exports textiles to country C, while country B exports cars to country C. In line with the HPA, focusing on competitors at an aggregate level—in the manufacturing sector for example, as this is the most common case in the literature—would suggest that countries A and B compete in market C, even though exporters of cars are not necessarily the relevant competitors of textile exporters. Furthermore, the HPA would imply that all manufacturing goods produced in country C are competitors of exporters to country C, regardless of the type of good that is produced in and exported to country C.
5. With respect to services, our approach incorporates the exports of services into the analysis of international competitiveness identifying competitors at disaggregated categories of services and markets, as in the case of goods. The importance (weight) of each product category is determined by its share in total exports.4
6. Our main findings suggest that the effect of considering both the more microbased structure of competitors (DPA) and export of services implies a modest lower real appreciation from 1998 to 2006 in the order of 2 percent to 3 percent for all Mediterranean countries, no significant change for France, and a somewhat lesser real depreciation of 1.2 percent for Germany—Germany is included in the analysis for comparison purposes (Table X.1).
4 The available data on disaggregated bilateral trade in services is not as complete as the data for trade in goods, and therefore, our estimates of the REER in services are limited to the sample of trade flows available. The average coverage of bilateral trade is 89 percent of services exports for Greece, 70 percent for Italy, 83 percent for Portugal, 59 percent for Spain, 80 percent for France, and 54 percent for Germany. The coverage for goods is above 90 percent for all countries. Note also that the share of total exports of services in total exports is 66 percent for Greece, 20 percent for Italy, 28 percent for Portugal, 32 percent for Spain, 21 percent for France, and 14 percent for Germany. Our complete data set has over 36 million observations and includes prices data from 1995 until 2006; bilateral trade data for goods from 1995 to 2005; and bilateral trade data on services from 1999 to 2004. We compute the results for services from 1998 to 2006, for which we extrapolate the information observed in trade of services during 1999 and 2004 into 1998 and 2005, respectively.
Table X.1. Net Appreciation Differential Since 1998: theAggregate Effect of DPA Including Exports of Services
Greece Italy Portugal Spain France Germany
1999 -0.30 0.04 -0.08 0.15 0.20 -0.152000 -2.69 0.25 -0.30 0.27 -0.03 -0.172001 -3.00 0.21 -0.37 0.21 -0.01 0.002002 -2.00 -0.18 -0.46 -0.15 0.02 0.082003 -0.86 -1.07 -0.71 -0.53 0.38 0.372004 -0.87 -2.00 -1.20 -1.29 0.38 0.682005 -1.32 -2.50 -1.97 -1.86 0.15 1.032006 -1.96 -2.82 -2.44 -2.27 -0.11 1.21
Note: (a) figures are presented in percent; (b) these results are basedon a difference in difference estimator that controls for the equivalent effectin the rest of 11 euro area countries (see Bennett and Zarnic, 2007).
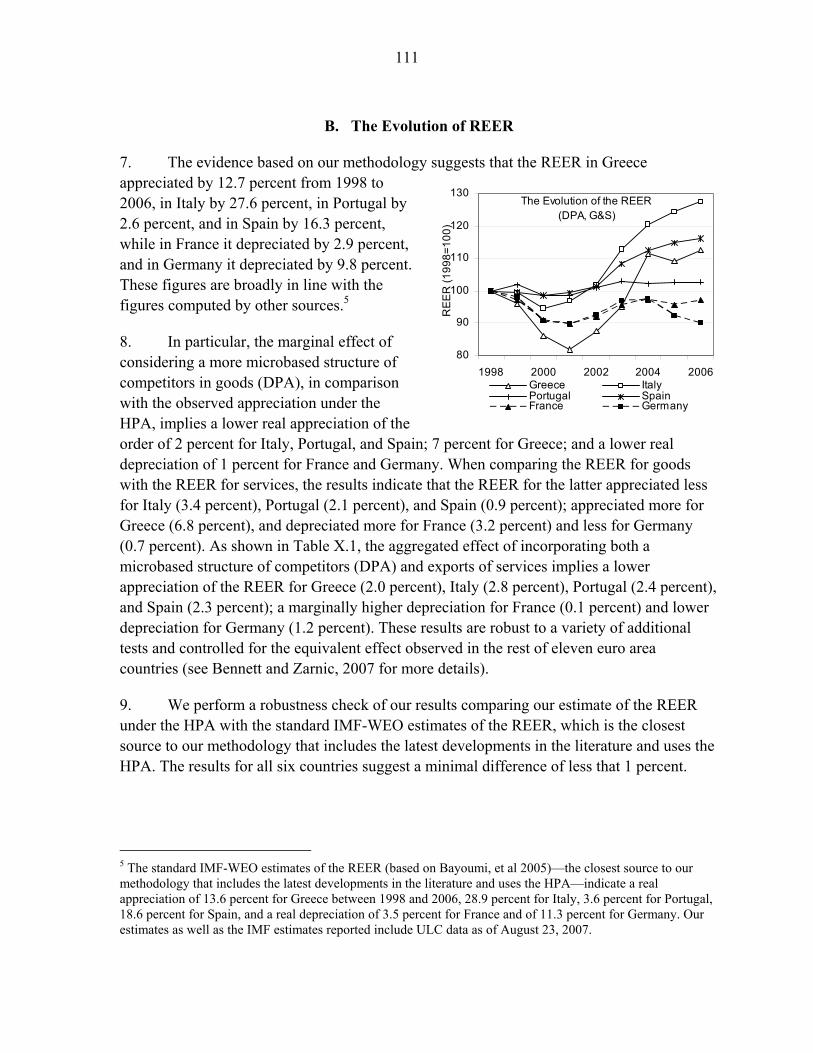
111
B. The Evolution of REER
7. The evidence based on our methodology suggests that the REER in Greece appreciated by 12.7 percent from 1998 to 2006, in Italy by 27.6 percent, in Portugal by 2.6 percent, and in Spain by 16.3 percent, while in France it depreciated by 2.9 percent, and in Germany it depreciated by 9.8 percent. These figures are broadly in line with the figures computed by other sources.5
8. In particular, the marginal effect of considering a more microbased structure of competitors in goods (DPA), in comparison with the observed appreciation under the HPA, implies a lower real appreciation of the order of 2 percent for Italy, Portugal, and Spain; 7 percent for Greece; and a lower real depreciation of 1 percent for France and Germany. When comparing the REER for goods with the REER for services, the results indicate that the REER for the latter appreciated less for Italy (3.4 percent), Portugal (2.1 percent), and Spain (0.9 percent); appreciated more for Greece (6.8 percent), and depreciated more for France (3.2 percent) and less for Germany (0.7 percent). As shown in Table X.1, the aggregated effect of incorporating both a microbased structure of competitors (DPA) and exports of services implies a lower appreciation of the REER for Greece (2.0 percent), Italy (2.8 percent), Portugal (2.4 percent), and Spain (2.3 percent); a marginally higher depreciation for France (0.1 percent) and lower depreciation for Germany (1.2 percent). These results are robust to a variety of additional tests and controlled for the equivalent effect observed in the rest of eleven euro area countries (see Bennett and Zarnic, 2007 for more details).
9. We perform a robustness check of our results comparing our estimate of the REER under the HPA with the standard IMF-WEO estimates of the REER, which is the closest source to our methodology that includes the latest developments in the literature and uses the HPA. The results for all six countries suggest a minimal difference of less that 1 percent.
5 The standard IMF-WEO estimates of the REER (based on Bayoumi, et al 2005)—the closest source to our methodology that includes the latest developments in the literature and uses the HPA—indicate a real appreciation of 13.6 percent for Greece between 1998 and 2006, 28.9 percent for Italy, 3.6 percent for Portugal, 18.6 percent for Spain, and a real depreciation of 3.5 percent for France and of 11.3 percent for Germany. Our estimates as well as the IMF estimates reported include ULC data as of August 23, 2007.
The Evolution of the REER(DPA, G&S)
80
90
100
110
120
130
1998 2000 2002 2004 2006
REE
R (1
998=
100)
Greece ItalyPortugal SpainFrance Germany
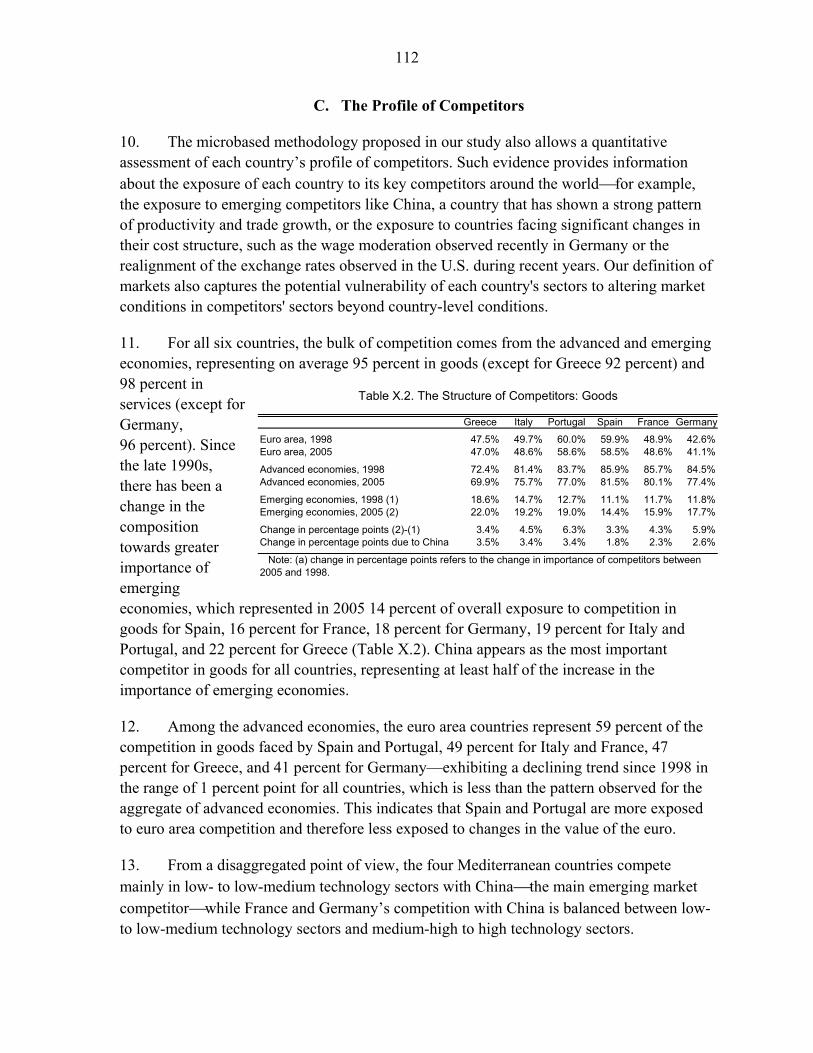
112
C. The Profile of Competitors
10. The microbased methodology proposed in our study also allows a quantitative assessment of each country’s profile of competitors. Such evidence provides information about the exposure of each country to its key competitors around the world⎯for example, the exposure to emerging competitors like China, a country that has shown a strong pattern of productivity and trade growth, or the exposure to countries facing significant changes in their cost structure, such as the wage moderation observed recently in Germany or the realignment of the exchange rates observed in the U.S. during recent years. Our definition of markets also captures the potential vulnerability of each country's sectors to altering market conditions in competitors' sectors beyond country-level conditions.
11. For all six countries, the bulk of competition comes from the advanced and emerging economies, representing on average 95 percent in goods (except for Greece 92 percent) and 98 percent in services (except for Germany, 96 percent). Since the late 1990s, there has been a change in the composition towards greater importance of emerging economies, which represented in 2005 14 percent of overall exposure to competition in goods for Spain, 16 percent for France, 18 percent for Germany, 19 percent for Italy and Portugal, and 22 percent for Greece (Table X.2). China appears as the most important competitor in goods for all countries, representing at least half of the increase in the importance of emerging economies.
12. Among the advanced economies, the euro area countries represent 59 percent of the competition in goods faced by Spain and Portugal, 49 percent for Italy and France, 47 percent for Greece, and 41 percent for Germany—exhibiting a declining trend since 1998 in the range of 1 percent point for all countries, which is less than the pattern observed for the aggregate of advanced economies. This indicates that Spain and Portugal are more exposed to euro area competition and therefore less exposed to changes in the value of the euro.
13. From a disaggregated point of view, the four Mediterranean countries compete mainly in low- to low-medium technology sectors with China⎯the main emerging market competitor⎯while France and Germany’s competition with China is balanced between low- to low-medium technology sectors and medium-high to high technology sectors.
Table X.2. The Structure of Competitors: Goods
Greece Italy Portugal Spain France Germany
Euro area, 1998 47.5% 49.7% 60.0% 59.9% 48.9% 42.6%Euro area, 2005 47.0% 48.6% 58.6% 58.5% 48.6% 41.1%
Advanced economies, 1998 72.4% 81.4% 83.7% 85.9% 85.7% 84.5%Advanced economies, 2005 69.9% 75.7% 77.0% 81.5% 80.1% 77.4%
Emerging economies, 1998 (1) 18.6% 14.7% 12.7% 11.1% 11.7% 11.8%Emerging economies, 2005 (2) 22.0% 19.2% 19.0% 14.4% 15.9% 17.7%
Change in percentage points (2)-(1) 3.4% 4.5% 6.3% 3.3% 4.3% 5.9%Change in percentage points due to China 3.5% 3.4% 3.4% 1.8% 2.3% 2.6%
Note: (a) change in percentage points refers to the change in importance of competitors between2005 and 1998.
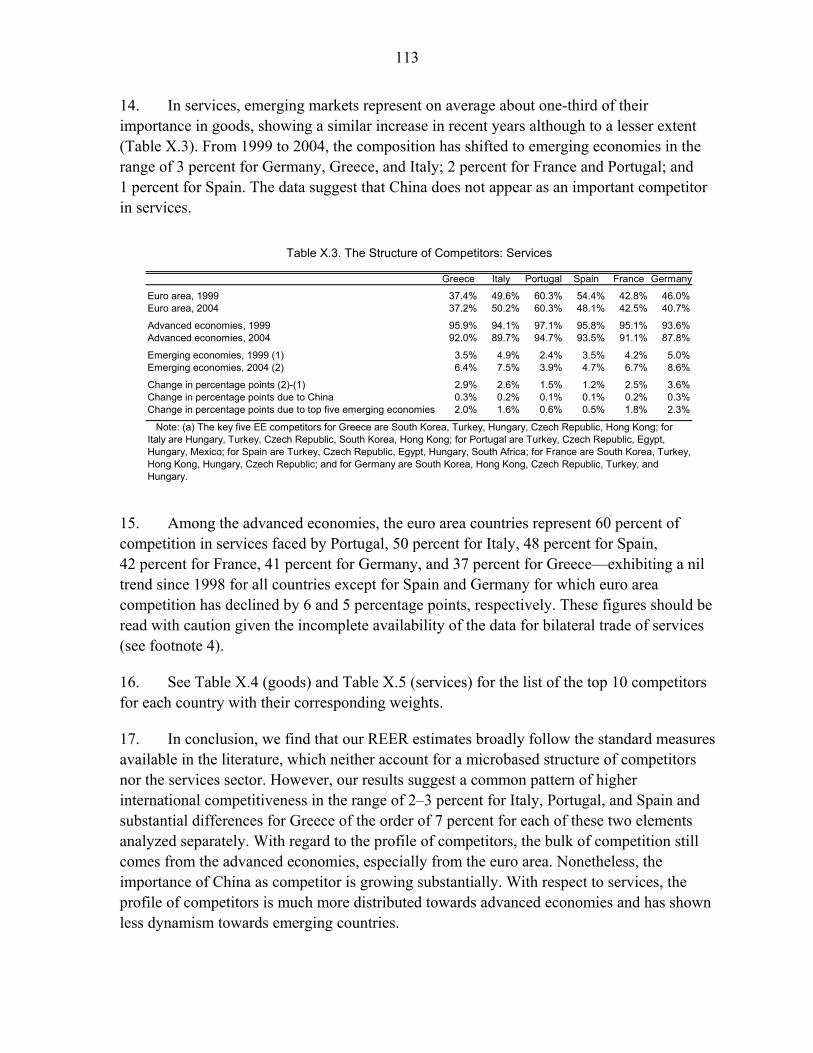
113
14. In services, emerging markets represent on average about one-third of their importance in goods, showing a similar increase in recent years although to a lesser extent (Table X.3). From 1999 to 2004, the composition has shifted to emerging economies in the range of 3 percent for Germany, Greece, and Italy; 2 percent for France and Portugal; and 1 percent for Spain. The data suggest that China does not appear as an important competitor in services.
15. Among the advanced economies, the euro area countries represent 60 percent of competition in services faced by Portugal, 50 percent for Italy, 48 percent for Spain, 42 percent for France, 41 percent for Germany, and 37 percent for Greece—exhibiting a nil trend since 1998 for all countries except for Spain and Germany for which euro area competition has declined by 6 and 5 percentage points, respectively. These figures should be read with caution given the incomplete availability of the data for bilateral trade of services (see footnote 4).
16. See Table X.4 (goods) and Table X.5 (services) for the list of the top 10 competitors for each country with their corresponding weights.
17. In conclusion, we find that our REER estimates broadly follow the standard measures available in the literature, which neither account for a microbased structure of competitors nor the services sector. However, our results suggest a common pattern of higher international competitiveness in the range of 2–3 percent for Italy, Portugal, and Spain and substantial differences for Greece of the order of 7 percent for each of these two elements analyzed separately. With regard to the profile of competitors, the bulk of competition still comes from the advanced economies, especially from the euro area. Nonetheless, the importance of China as competitor is growing substantially. With respect to services, the profile of competitors is much more distributed towards advanced economies and has shown less dynamism towards emerging countries.
Table X.3. The Structure of Competitors: Services
Greece Italy Portugal Spain France Germany
Euro area, 1999 37.4% 49.6% 60.3% 54.4% 42.8% 46.0%Euro area, 2004 37.2% 50.2% 60.3% 48.1% 42.5% 40.7%
Advanced economies, 1999 95.9% 94.1% 97.1% 95.8% 95.1% 93.6%Advanced economies, 2004 92.0% 89.7% 94.7% 93.5% 91.1% 87.8%
Emerging economies, 1999 (1) 3.5% 4.9% 2.4% 3.5% 4.2% 5.0%Emerging economies, 2004 (2) 6.4% 7.5% 3.9% 4.7% 6.7% 8.6%
Change in percentage points (2)-(1) 2.9% 2.6% 1.5% 1.2% 2.5% 3.6%Change in percentage points due to China 0.3% 0.2% 0.1% 0.1% 0.2% 0.3%Change in percentage points due to top five emerging economies 2.0% 1.6% 0.6% 0.5% 1.8% 2.3%
Note: (a) The key five EE competitors for Greece are South Korea, Turkey, Hungary, Czech Republic, Hong Kong; for Italy are Hungary, Turkey, Czech Republic, South Korea, Hong Kong; for Portugal are Turkey, Czech Republic, Egypt, Hungary, Mexico; for Spain are Turkey, Czech Republic, Egypt, Hungary, South Africa; for France are South Korea, Turkey, Hong Kong, Hungary, Czech Republic; and for Germany are South Korea, Hong Kong, Czech Republic, Turkey, and Hungary.

114
Rank Greece Italy Portugal Spain France Germany1 Italy Germany Spain Germany Germany US
(11.84%) (18.63%) (15.76%) (16.92%) (18.82%) (13.40%)2 Germany France Germany France US France
(11.50%) (11.60%) (12.52%) (16.46%) (12.20%) (11.68%)3 France US France Italy Italy Italy
(7.13%) (9.72%) (12.20%) (9.98%) (9.62%) (9.37%)4 US Spain Italy US UK UK
(6.54%) (6.26%) (8.52%) (7.23%) (7.76%) (7.70%)5 UK UK US UK Spain Japan
(6.14%) (6.25%) (5.81%) (6.49%) (6.82%) (6.85%)6 China China UK Belgium Japan Netherlands
(5.76%) (5.95%) (5.63%) (4.29%) (4.46%) (4.78%)7 Spain Japan China Netherlands Belgium Spain
(4.51%) (4.33%) (5.41%) (4.06%) (4.24%) (4.71%)8 Belgium Belgium Belgium Portugal Netherlands Belgium
(4.15%) (3.71%) (3.65%) (3.95%) (4.10%) (4.14%)9 Netherlands Netherlands Netherlands Japan China China
(3.93%) (3.23%) (3.35%) (3.37%) (3.80%) (3.83%)10 Turkey Austria Japan China Korea Sweden
(3.59%) (2.23%) (2.41%) (3.23%) (1.96%) (2.73%)
Table X.4. Main Competitors in 2005: Goods
Rank Greece Italy Portugal Spain France Germany1 US US UK UK US US
(29.57%) (15.85%) (17.73%) (26.40%) (16.20%) (15.97%)2 UK Germany Spain Germany UK France
(16.20%) (14.45%) (17.49%) (13.79%) (16.16%) (10.38%)3 Germany France France France Italy Japan
(9.60%) (13.12%) (14.53%) (11.74%) (10.38%) (10.20%)4 Italy UK US US Germany UK
(7.87%) (11.47%) (9.24%) (8.75%) (9.68%) (9.71%)5 France Spain Germany Italy Japan Italy
(7.33%) (6.04%) (8.98%) (7.63%) (8.60%) (9.38%)6 Spain Japan Italy Portugal Spain Netherlands
(2.89%) (5.21%) (6.77%) (3.79%) (5.88%) (4.89%)7 Netherlands Austria Belgium Austria Belgium Spain
(2.67%) (5.06%) (3.81%) (2.67%) (4.78%) (4.12%)8 Austria Belgium Netherlands Netherlands Netherlands Austria
(2.57%) (2.92%) (2.79%) (2.54%) (3.36%) (3.77%)9 Japan Netherlands Austria Sweden Austria Belgium
(2.51%) (2.76%) (1.95%) (2.52%) (2.65%) (3.41%)10 Belgium Greece Japan Belgium Sweden Denmark
(2.17%) (2.66%) (1.71%) (2.36%) (2.23%) (3.16%)
Table X.5. Main Competitors in 2004: Services
115
References
Agenor, P.R., 1995, “Competitiveness and External Trade Performance of the French Manufacturing Industry,” IMF Working Paper No. 95/137, pp. 1–23.
Bayoumi, T., et al, 2005, “New Rates from New Weights,” IMF Working Paper
No. 05/99, pp. 1–55. Bennett, H.Z., and Z. Zarnic, 2007, “International Competitiveness of the Mediterranean
Quartet: A Differentiated Product Approach,” IMF mimeo, pp. 1–45. Bini-Smaghi, L., 2007, “Asymmetric Adjustment in Monetary Unions: Evidence from the
euro area,” presented at the EMU Conference, The Eurozone under Stretch? Analyzing Regional Differences in EMU (Berlin).
Blanchard, O., 2006a, “A Macroeconomic Survey of Europe,” MIT, pp. 1–26 (September). ———, 2006b, “Portugal, Italy, Spain, and Germany: The Implications of a Suboptimal
Currency Area,” WEL-MIT, pp. 1–26 (April). Catao, L.A.V., 2007, “Why Real Exchange Rates?,” Finance and Development,
pp. 46–47 (September). Chinn, M.D., 2006, “A Primer on Real Effective Exchange Rates: Determinants,
Overvaluation, Trade Flows and Competitive Devaluation,” Open Economies Review, Vol. 17, pp. 115–43.
European Commission, 2006, “Adjustment Dynamics in the euro area: Experiences and
Challenges,” The EU Economy Review 2006, ECFIN REP.56908-EN, pp. 79–107. Fung, S.S., and M. Klau, 2006, “The New BIS Effective Exchange Rate Indices,” BIS
Quarterly Review, pp. 1–16 (March). Marsh, I.W., and S.P. Tokarick, 1996, “An Assessment of Three Measures of
Competitiveness,” Weltwirtschaftliches Archiv, Vol. 132, pp. 700–22. Neary, P., 2006. “Measuring Competitiveness,” IMF Working Paper No. 06/209, pp. 1–21. Papademos, L., 2007. “Inflation and Competitiveness Divergences in the euro area
Countries: Causes, Consequences and Policy Responses,” The ECB and its Watchers IX (Frankfurt: ECB).

116
Rogoff, K., 1996, “The Purchasing Power Parity Puzzle,” Journal of Economic Literature, Vol. 34, No. 2, pp. 647–68.
Roubini, N., 2007, “Le differenze che frenano l'Europa dell'euro - l'analisi,” La Repubblica
(August). English version is available via the Internet: http://www.rgemonitor.com/blog/roubini.