Embed Size (px)
Citation preview
HAL Id: hal-02983978https://hal.inria.fr/hal-02983978
Submitted on 30 Oct 2020
HAL is a multi-disciplinary open accessarchive for the deposit and dissemination of sci-entific research documents, whether they are pub-lished or not. The documents may come fromteaching and research institutions in France orabroad, or from public or private research centers.
L’archive ouverte pluridisciplinaire HAL, estdestinée au dépôt et à la diffusion de documentsscientifiques de niveau recherche, publiés ou non,émanant des établissements d’enseignement et derecherche français ou étrangers, des laboratoirespublics ou privés.
Student Dropout PredictionFrancesca del Bonifro, Maurizio Gabbrielli, Giuseppe Lisanti, Stefano Zingaro
To cite this version:Francesca del Bonifro, Maurizio Gabbrielli, Giuseppe Lisanti, Stefano Zingaro. Student DropoutPrediction. Artificial Intelligence in Education, pp.129-140, 2020, �10.1007/978-3-030-52237-7_11�.�hal-02983978�
Student Dropout Prediction
Francesca Del Bonifro1,2, Maurizio Gabbrielli1,2[0000−0003−0609−8662], GiuseppeLisanti1[0000−0002−0785−9972], and Stefano Pio Zingaro1,2[0000−0002−8462−5651]
1 University of Bologna, Italy2 INRIA, Italy
Abstract. Among the many open problems in the learning process,students dropout is one of the most complicated and negative ones, bothfor the student and the institutions, and being able to predict it couldhelp to alleviate its social and economic costs. To address this problemwe developed a tool that, by exploiting machine learning techniques,allows to predict the dropout of a first-year undergraduate student. Theproposed tool allows to estimate the risk of quitting an academic course,and it can be used either during the application phase or during the firstyear, since it selectively accounts for personal data, academic recordsfrom secondary school and also first year course credits. Our experimentshave been performed by considering real data of students from elevenschools of a major University.
Keywords: machine learning, educational data mining, decision sup-port tools
1 Introduction
Artificial Intelligence is changing many aspects of our society and our lives sinceit provides the technological basis for new services and tools that help decisionmaking in everyday life. Education is not immune to this revolution. Indeed AIand machine learning tools can help to improve in several ways the learningprocess. A critical aspect in this context is the possibility of developing newpredictive tools which can be used to help students improve their academiccareers.
Among the many different observable phenomena in the students’ careers,University dropout is one of the most complex and adverse events, both forstudents or institutions. A dropout is a potentially devastating event in the lifeof a student, and it also impacts negatively the University from an economicpoint of view [6]. Furthermore, it could also be a signal of potential issues in theorganisation and the quality of the courses. Dropout prediction is a task that canbe addressed by exploiting machine learning techniques, which already provedto be effective in the field of education for evaluating students’ performance [6,1, 10, 8, 9].
In this work, we face the challenge of early predicting the dropout for afreshman by adopting a data-driven approach. Trough an automated learning
2 Gabbrielli et al.
process, we aim to develop a model that is capable of capturing informationconcerning the particular context in which dropout takes place.
We built our model by taking into account the following three design prin-ciples. First, we want to estimate the risk of quitting an academic course atan early stage, either before the student starts the course or during the firstyear. Statistical evidence shows that this time frame is one of the most criticalperiods for dropout. Targeting first-year students means that the data we canuse to train our predictive models are only personal information and academicrecords from high school — e.g. gender, age, high school education, final mark— and the number of credits acquired during the first months of the first year.Second, we do not focus on a specific predictive model; instead, we conducteda thorough study considering several machine learning techniques in order toconstruct a baseline and assess the challenge of the problem under analysis.Last, we conducted the training and test processes on real data, collecting sam-ples of approximately 15,000 students from a specific academic year of a majorUniversity.
The remainder of this paper has the following structure. Related approachesare discussed in Section 2. In Section 3 we describe the machine learning methodsused in our analysis, the dataset we collected and the preprocessing techniquesapplied to it. In Section 4 we evaluate the selected models by comparing theirperformance: first, with the different values of the models’ parameters; second, tothe features used in the train and test sets and, finally, considering each academicschool separately. Then, we draw final remarks in Section 5 and present possibleuses and extensions of this work.
2 Related Work
Several papers recently addressed the prediction of students’ performances em-ploying machine learning techniques. In the case of University-level education [14]and [1] have designed machine learning models, based on different datasets, per-forming analysis similar to ours even though they use different features andassumptions. In [1] a balanced dataset, including features mainly about the stu-dent provenance, is used to train different machine learning models. Tests reportaccuracy, true positive rate and AUC-ROC measures. Also in [11] there is astudy in this direction but using a richer set of features involving family statusand life conditions for each student. The authors used a Fuzzy-ARTMAP Neu-ral Network gaining competitive performances. Moreover, as in our case, theyperformed the predictions using data at enrolment time. In [12] a set of featuressimilar to the previous work is exploited. An analysis with different classifica-tion algorithms from the WEKA environment is performed, in order to find thebest model for solving this kind of problem. It turns out that in this case thealgorithm ID3 reaches the best performance with respect to the classificationtask.
Another work on the University dropout phenomenon was proposed in [7].The proposed solution aim at predicting the student dropout but using a com-
Student Dropout Prediction 3
pletely different representation for the students. In fact, the approach exploitsdata acquisition by web cams, eye-trackers and other similar devices in the con-text of a smart class. Based on these data, it is possible to perform emotionanalysis and detection for the students in the room which will be then exploitedto predict the dropout. There also exist studies related to high school educa-tion [10]. However, in this case, different countries have quite different highschool systems, for example, the duration of the high school and the votingsystem can vary a lot among countries. Due to these differences, datasets fromdifferent countries can have very different meanings and, even if they includesimilar features, these are describing quite different situations. For this reason,works on lower levels of education are much less general and exportable to othersystems. On the contrary, University systems are more similar, or it is possibleto easily “translate” a system into another. Predictive models for students’ fi-nal performance in the context of blended education, partially exploiting onlineplatforms [9] or entirely online University courses [8, 15], have also been pro-posed. In these cases, the presence of the technological devices allows the use ofan augmented set of data — e.g. consulting homework submission logs — whichcan improve the quality of the models. However, the aim of these approaches isdifferent from the proposed solution. In fact, besides the analysis of the corre-lations between the features and the students’ performances discovered by themachine learning models, we propose to exploit the prediction at the moment ofthe students’ enrolment in order to prevent the problematic situations that canbring to the dropout occurrences. Prediction at application-time is one of ourmain contribution, in fact a model exploiting data which are available after theenrolment — e.g. considering the students’ performances and behaviour at theUniversity — is certainly more accurate, but the timing for the suggestions isnot optimal. Considering to take more courses or to change academic path whilethe mandatory courses at the University have already started could be highlyfrustrating for the students and do not enhance motivation in continuing theirstudies. Another important point in our work is the fact that we aim to performa careful analysis of fair results with respect to the statistical characteristicsof the dataset (in particular dealing with the unbalanced data). On the otherhand, most of the previous works while mentioning the problem do not focuson how this unbalance affects the exploited models and may produce misleadingresults, and often dot not provide a clear justifications for the best performancemeasures on real data affected by this problem. This lack of extensive statisti-cal analysis and evaluation of the limits and risks of the developed models hasalso been highlighted in [5], an excellent survey of different techniques for thestudents’ performances prediction and related considerations.
3 Methodology
We considered a specific set of well-known classification algorithms to provide atool enabling a reasonably accurate prediction of the dropout phenomenon. Inparticular, we considered the Linear Discriminant Analysis (LDA), Support Vec-
4 Gabbrielli et al.
tor Machine (SVM) [3] and Random Forest (RF), as they are the most commonlyused models in literature to solve similar problems.
LDA acts as a dimensional reduction algorithm, trying to reduce the datacomplexity, i.e. by projecting the actual feature space on a lower-dimensional one,while trying to retain relevant information; also, it does not involve parametersettings. SVM is a well-established technique for data classification and regression.It finds the best separating hyper-plane by maximising the margin in the featurespace. The training data participating in the maximisation process are calledsupport vectors. RF builds a collection of tree-structured classifiers combiningthem randomly. It has been adopted in the literature for a great variety ofregression and prediction tasks [2].
We verified our methodology in three steps, providing a proper set of evalua-tion measures as we discuss later in this section. First, we assessed the differentclassifiers performance for the model parameters. In our case, we validated theSVM model over seven different values of C, that is the regularisation parame-ter, and we analysed the behaviour of four number of estimators in the case ofRF. Moreover, we performed each validation considering two different re-scalingtechniques of the data instances. Second, we evaluated the classifiers over threetraining sets that considered different features. For LDA, RF and SVM we onlykept the best parameters’ choice and monitored their performance on the differ-ent datasets.
Dataset. The dataset used for this work has been extracted from a collectionof real data. More precisely, we considered pseudo-anonymized data describing15, 000 students enrolled in several courses of the academic year 2016/2017.The decision to focus our research within the limit of the first year lies in theanalysis of statistical evidence from the source data. This evidence indicates aconcentration of career dropouts in the first year of the course and a progressivedecrease of the phenomenon in the following years. More specifically, studentswho leave within the first year is 14.8% of the total registered, while those wholeave by the third year is 21.6%. This is equivalent to saying that the 6.8%of registered abandoned in subsequent years compared with 14.8% who leavesduring the first year; confirming the importance of acting within the first yearof the program to prevent the dropout phenomenon.
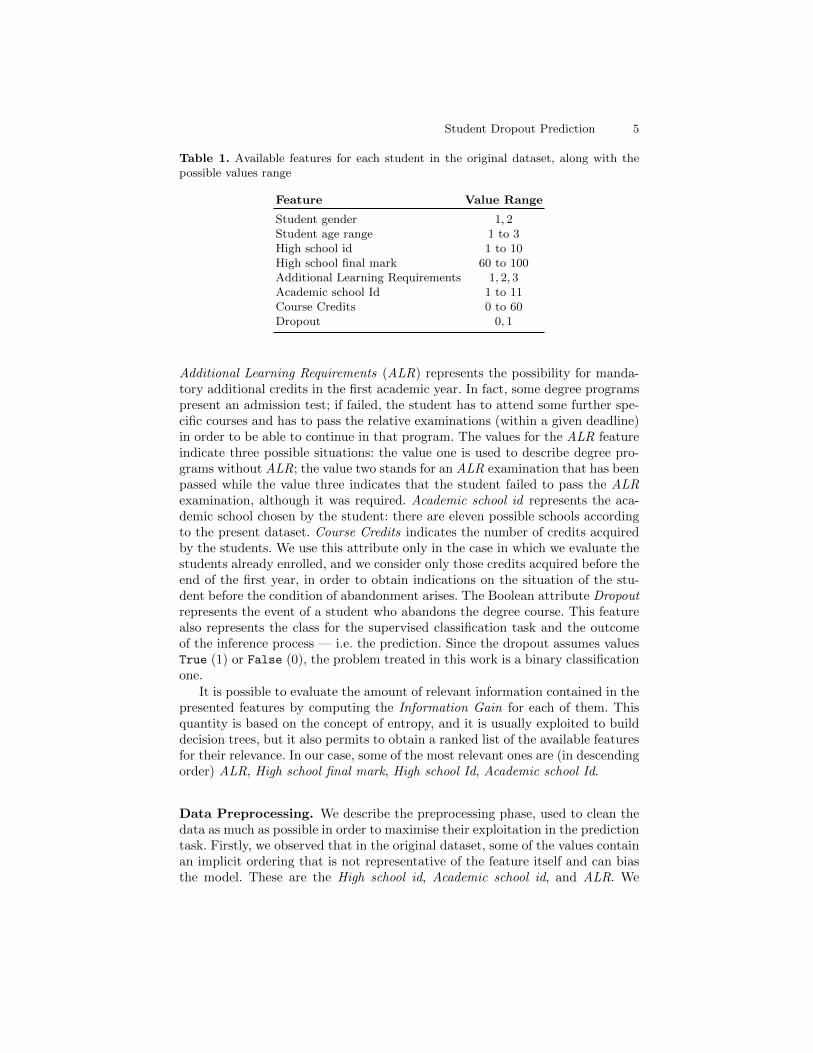
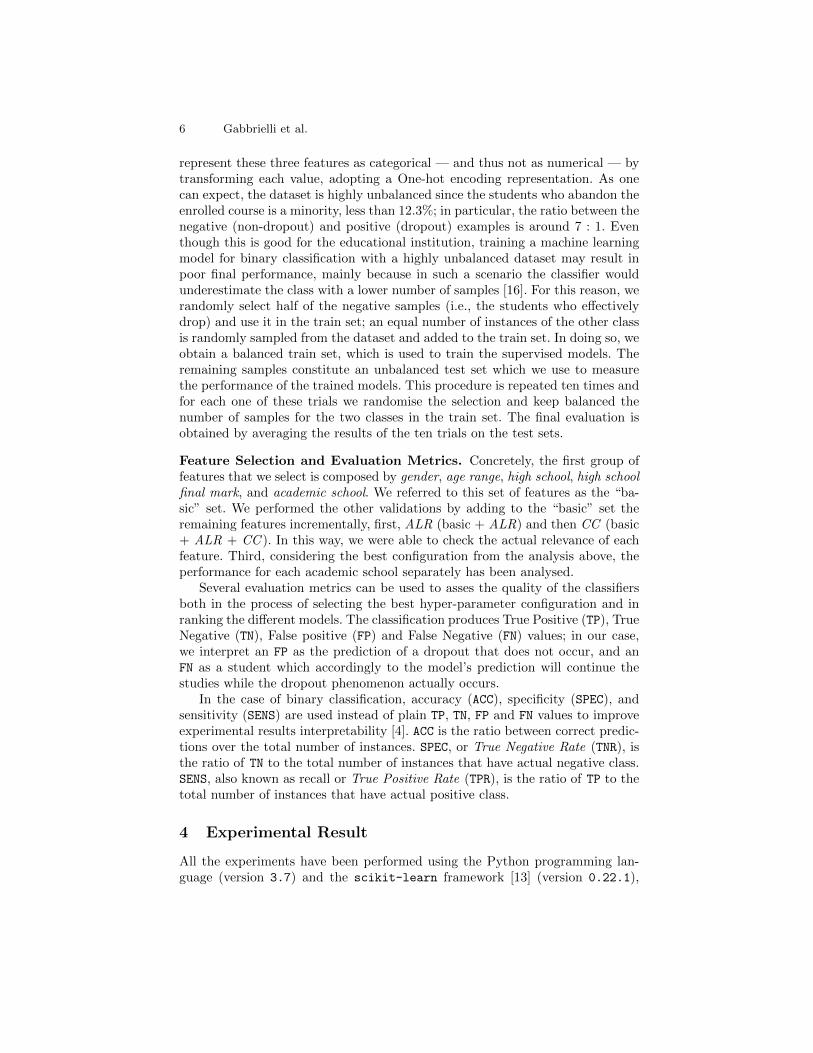
Table 1 shows a detailed description of the information available in thedataset. The first column lists the name of the features, while the second columndescribes the possible values or range. The first two features represent personaldata of students while the third and the fourth are information related to thehigh school attended by the student.
Concerning the Age feature, its three possible values represent three differentranges of ages at the moment of enrolment, the value 1 is assigned to studentsuntil 19 years old, 2 for student’s age between 20 and 23 years, and 3 other-wise. The values of High school id indicate ten different kinds of high schoolwhere the student obtained the diploma.The High school final mark representsthe mark that the student received when graduating in high school. The flag
Student Dropout Prediction 5
Table 1. Available features for each student in the original dataset, along with thepossible values range
Feature Value Range
Student gender 1, 2Student age range 1 to 3High school id 1 to 10High school final mark 60 to 100Additional Learning Requirements 1, 2, 3Academic school Id 1 to 11Course Credits 0 to 60Dropout 0, 1
Additional Learning Requirements (ALR) represents the possibility for manda-tory additional credits in the first academic year. In fact, some degree programspresent an admission test; if failed, the student has to attend some further spe-cific courses and has to pass the relative examinations (within a given deadline)in order to be able to continue in that program. The values for the ALR featureindicate three possible situations: the value one is used to describe degree pro-grams without ALR; the value two stands for an ALR examination that has beenpassed while the value three indicates that the student failed to pass the ALRexamination, although it was required. Academic school id represents the aca-demic school chosen by the student: there are eleven possible schools accordingto the present dataset. Course Credits indicates the number of credits acquiredby the students. We use this attribute only in the case in which we evaluate thestudents already enrolled, and we consider only those credits acquired before theend of the first year, in order to obtain indications on the situation of the stu-dent before the condition of abandonment arises. The Boolean attribute Dropoutrepresents the event of a student who abandons the degree course. This featurealso represents the class for the supervised classification task and the outcomeof the inference process — i.e. the prediction. Since the dropout assumes valuesTrue (1) or False (0), the problem treated in this work is a binary classificationone.
It is possible to evaluate the amount of relevant information contained in thepresented features by computing the Information Gain for each of them. Thisquantity is based on the concept of entropy, and it is usually exploited to builddecision trees, but it also permits to obtain a ranked list of the available featuresfor their relevance. In our case, some of the most relevant ones are (in descendingorder) ALR, High school final mark, High school Id, Academic school Id.
Data Preprocessing. We describe the preprocessing phase, used to clean thedata as much as possible in order to maximise their exploitation in the predictiontask. Firstly, we observed that in the original dataset, some of the values containan implicit ordering that is not representative of the feature itself and can biasthe model. These are the High school id, Academic school id, and ALR. We
6 Gabbrielli et al.
represent these three features as categorical — and thus not as numerical — bytransforming each value, adopting a One-hot encoding representation. As onecan expect, the dataset is highly unbalanced since the students who abandon theenrolled course is a minority, less than 12.3%; in particular, the ratio between thenegative (non-dropout) and positive (dropout) examples is around 7 : 1. Eventhough this is good for the educational institution, training a machine learningmodel for binary classification with a highly unbalanced dataset may result inpoor final performance, mainly because in such a scenario the classifier wouldunderestimate the class with a lower number of samples [16]. For this reason, werandomly select half of the negative samples (i.e., the students who effectivelydrop) and use it in the train set; an equal number of instances of the other classis randomly sampled from the dataset and added to the train set. In doing so, weobtain a balanced train set, which is used to train the supervised models. Theremaining samples constitute an unbalanced test set which we use to measurethe performance of the trained models. This procedure is repeated ten times andfor each one of these trials we randomise the selection and keep balanced thenumber of samples for the two classes in the train set. The final evaluation isobtained by averaging the results of the ten trials on the test sets.
Feature Selection and Evaluation Metrics. Concretely, the first group offeatures that we select is composed by gender, age range, high school, high schoolfinal mark, and academic school. We referred to this set of features as the “ba-sic” set. We performed the other validations by adding to the “basic” set theremaining features incrementally, first, ALR (basic + ALR) and then CC (basic+ ALR + CC ). In this way, we were able to check the actual relevance of eachfeature. Third, considering the best configuration from the analysis above, theperformance for each academic school separately has been analysed.
Several evaluation metrics can be used to asses the quality of the classifiersboth in the process of selecting the best hyper-parameter configuration and inranking the different models. The classification produces True Positive (TP), TrueNegative (TN), False positive (FP) and False Negative (FN) values; in our case,we interpret an FP as the prediction of a dropout that does not occur, and anFN as a student which accordingly to the model’s prediction will continue thestudies while the dropout phenomenon actually occurs.
In the case of binary classification, accuracy (ACC), specificity (SPEC), andsensitivity (SENS) are used instead of plain TP, TN, FP and FN values to improveexperimental results interpretability [4]. ACC is the ratio between correct predic-tions over the total number of instances. SPEC, or True Negative Rate (TNR), isthe ratio of TN to the total number of instances that have actual negative class.SENS, also known as recall or True Positive Rate (TPR), is the ratio of TP to thetotal number of instances that have actual positive class.
4 Experimental Result
All the experiments have been performed using the Python programming lan-guage (version 3.7) and the scikit-learn framework [13] (version 0.22.1),
Student Dropout Prediction 7
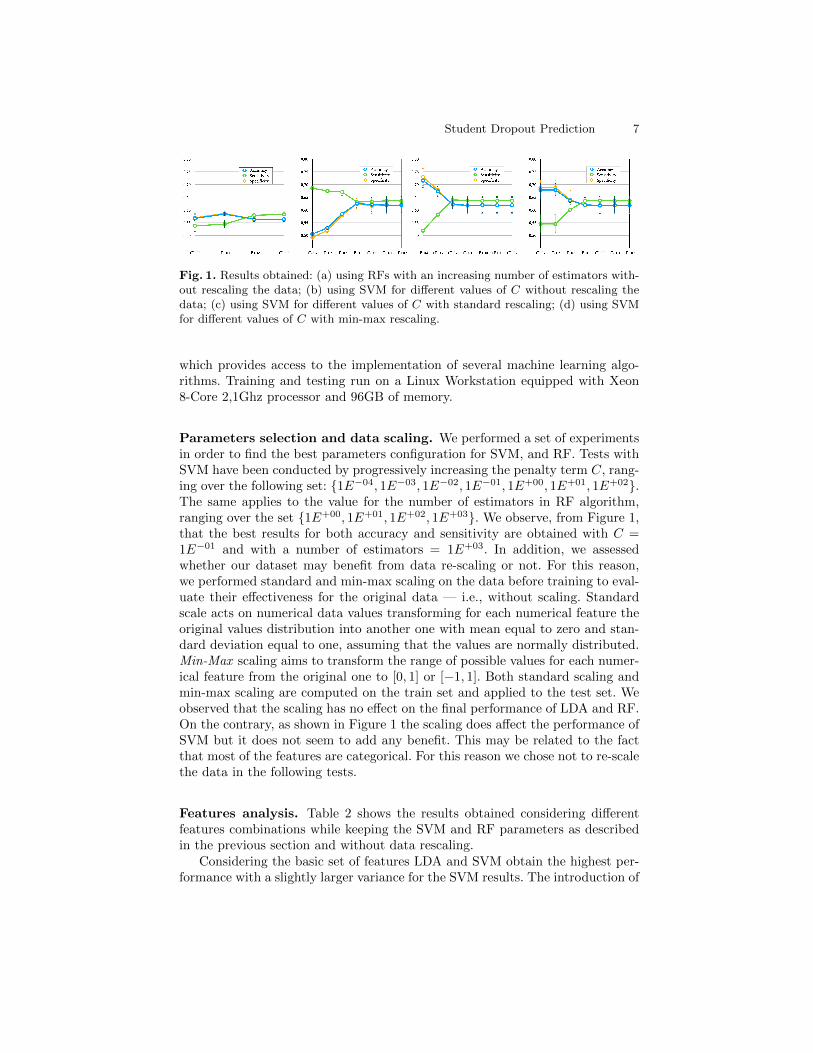
Fig. 1. Results obtained: (a) using RFs with an increasing number of estimators with-out rescaling the data; (b) using SVM for different values of C without rescaling thedata; (c) using SVM for different values of C with standard rescaling; (d) using SVMfor different values of C with min-max rescaling.
which provides access to the implementation of several machine learning algo-rithms. Training and testing run on a Linux Workstation equipped with Xeon8-Core 2,1Ghz processor and 96GB of memory.
Parameters selection and data scaling. We performed a set of experimentsin order to find the best parameters configuration for SVM, and RF. Tests withSVM have been conducted by progressively increasing the penalty term C, rang-ing over the following set: {1E−04, 1E−03, 1E−02, 1E−01, 1E+00, 1E+01, 1E+02}.The same applies to the value for the number of estimators in RF algorithm,ranging over the set {1E+00, 1E+01, 1E+02, 1E+03}. We observe, from Figure 1,that the best results for both accuracy and sensitivity are obtained with C =1E−01 and with a number of estimators = 1E+03. In addition, we assessedwhether our dataset may benefit from data re-scaling or not. For this reason,we performed standard and min-max scaling on the data before training to eval-uate their effectiveness for the original data — i.e., without scaling. Standardscale acts on numerical data values transforming for each numerical feature theoriginal values distribution into another one with mean equal to zero and stan-dard deviation equal to one, assuming that the values are normally distributed.Min-Max scaling aims to transform the range of possible values for each numer-ical feature from the original one to [0, 1] or [−1, 1]. Both standard scaling andmin-max scaling are computed on the train set and applied to the test set. Weobserved that the scaling has no effect on the final performance of LDA and RF.On the contrary, as shown in Figure 1 the scaling does affect the performance ofSVM but it does not seem to add any benefit. This may be related to the factthat most of the features are categorical. For this reason we chose not to re-scalethe data in the following tests.
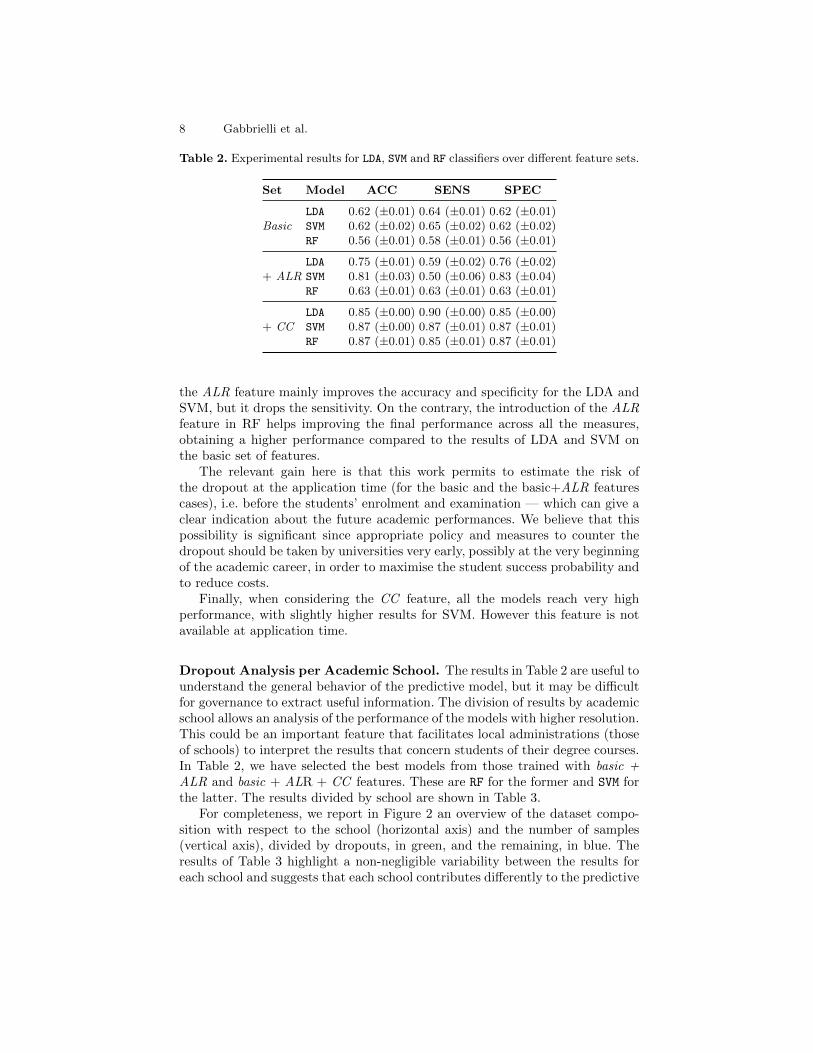
Features analysis. Table 2 shows the results obtained considering differentfeatures combinations while keeping the SVM and RF parameters as describedin the previous section and without data rescaling.
Considering the basic set of features LDA and SVM obtain the highest per-formance with a slightly larger variance for the SVM results. The introduction of
8 Gabbrielli et al.
Table 2. Experimental results for LDA, SVM and RF classifiers over different feature sets.
Set Model ACC SENS SPEC
BasicLDA 0.62 (±0.01) 0.64 (±0.01) 0.62 (±0.01)SVM 0.62 (±0.02) 0.65 (±0.02) 0.62 (±0.02)RF 0.56 (±0.01) 0.58 (±0.01) 0.56 (±0.01)
+ ALRLDA 0.75 (±0.01) 0.59 (±0.02) 0.76 (±0.02)SVM 0.81 (±0.03) 0.50 (±0.06) 0.83 (±0.04)RF 0.63 (±0.01) 0.63 (±0.01) 0.63 (±0.01)
+ CCLDA 0.85 (±0.00) 0.90 (±0.00) 0.85 (±0.00)SVM 0.87 (±0.00) 0.87 (±0.01) 0.87 (±0.01)RF 0.87 (±0.01) 0.85 (±0.01) 0.87 (±0.01)
the ALR feature mainly improves the accuracy and specificity for the LDA andSVM, but it drops the sensitivity. On the contrary, the introduction of the ALRfeature in RF helps improving the final performance across all the measures,obtaining a higher performance compared to the results of LDA and SVM onthe basic set of features.
The relevant gain here is that this work permits to estimate the risk ofthe dropout at the application time (for the basic and the basic+ALR featurescases), i.e. before the students’ enrolment and examination — which can give aclear indication about the future academic performances. We believe that thispossibility is significant since appropriate policy and measures to counter thedropout should be taken by universities very early, possibly at the very beginningof the academic career, in order to maximise the student success probability andto reduce costs.
Finally, when considering the CC feature, all the models reach very highperformance, with slightly higher results for SVM. However this feature is notavailable at application time.
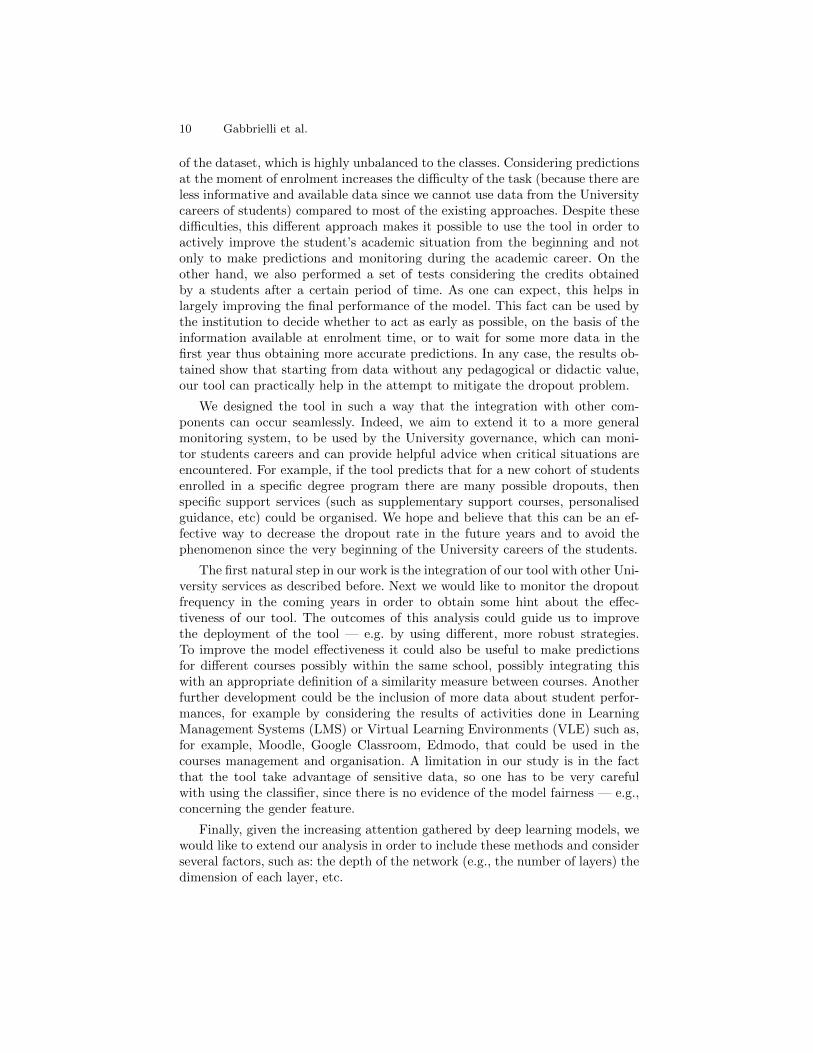
Dropout Analysis per Academic School. The results in Table 2 are useful tounderstand the general behavior of the predictive model, but it may be difficultfor governance to extract useful information. The division of results by academicschool allows an analysis of the performance of the models with higher resolution.This could be an important feature that facilitates local administrations (thoseof schools) to interpret the results that concern students of their degree courses.In Table 2, we have selected the best models from those trained with basic +ALR and basic + ALR + CC features. These are RF for the former and SVM forthe latter. The results divided by school are shown in Table 3.
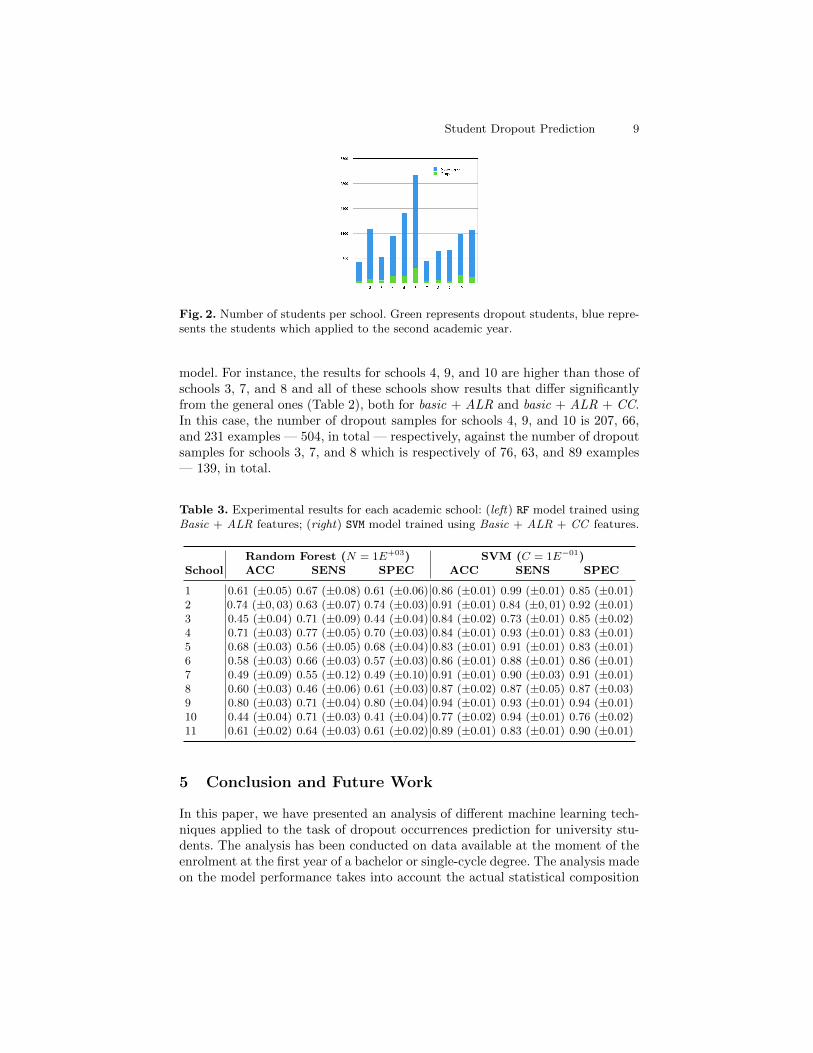
For completeness, we report in Figure 2 an overview of the dataset compo-sition with respect to the school (horizontal axis) and the number of samples(vertical axis), divided by dropouts, in green, and the remaining, in blue. Theresults of Table 3 highlight a non-negligible variability between the results foreach school and suggests that each school contributes differently to the predictive
Student Dropout Prediction 9
Fig. 2. Number of students per school. Green represents dropout students, blue repre-sents the students which applied to the second academic year.
model. For instance, the results for schools 4, 9, and 10 are higher than those ofschools 3, 7, and 8 and all of these schools show results that differ significantlyfrom the general ones (Table 2), both for basic + ALR and basic + ALR + CC.In this case, the number of dropout samples for schools 4, 9, and 10 is 207, 66,and 231 examples — 504, in total — respectively, against the number of dropoutsamples for schools 3, 7, and 8 which is respectively of 76, 63, and 89 examples— 139, in total.
Table 3. Experimental results for each academic school: (left) RF model trained usingBasic + ALR features; (right) SVM model trained using Basic + ALR + CC features.
Random Forest (N = 1E+03) SVM (C = 1E−01)School ACC SENS SPEC ACC SENS SPEC
1 0.61 (±0.05) 0.67 (±0.08) 0.61 (±0.06) 0.86 (±0.01) 0.99 (±0.01) 0.85 (±0.01)2 0.74 (±0, 03) 0.63 (±0.07) 0.74 (±0.03) 0.91 (±0.01) 0.84 (±0, 01) 0.92 (±0.01)3 0.45 (±0.04) 0.71 (±0.09) 0.44 (±0.04) 0.84 (±0.02) 0.73 (±0.01) 0.85 (±0.02)4 0.71 (±0.03) 0.77 (±0.05) 0.70 (±0.03) 0.84 (±0.01) 0.93 (±0.01) 0.83 (±0.01)5 0.68 (±0.03) 0.56 (±0.05) 0.68 (±0.04) 0.83 (±0.01) 0.91 (±0.01) 0.83 (±0.01)6 0.58 (±0.03) 0.66 (±0.03) 0.57 (±0.03) 0.86 (±0.01) 0.88 (±0.01) 0.86 (±0.01)7 0.49 (±0.09) 0.55 (±0.12) 0.49 (±0.10) 0.91 (±0.01) 0.90 (±0.03) 0.91 (±0.01)8 0.60 (±0.03) 0.46 (±0.06) 0.61 (±0.03) 0.87 (±0.02) 0.87 (±0.05) 0.87 (±0.03)9 0.80 (±0.03) 0.71 (±0.04) 0.80 (±0.04) 0.94 (±0.01) 0.93 (±0.01) 0.94 (±0.01)10 0.44 (±0.04) 0.71 (±0.03) 0.41 (±0.04) 0.77 (±0.02) 0.94 (±0.01) 0.76 (±0.02)11 0.61 (±0.02) 0.64 (±0.03) 0.61 (±0.02) 0.89 (±0.01) 0.83 (±0.01) 0.90 (±0.01)
5 Conclusion and Future Work
In this paper, we have presented an analysis of different machine learning tech-niques applied to the task of dropout occurrences prediction for university stu-dents. The analysis has been conducted on data available at the moment of theenrolment at the first year of a bachelor or single-cycle degree. The analysis madeon the model performance takes into account the actual statistical composition
10 Gabbrielli et al.
of the dataset, which is highly unbalanced to the classes. Considering predictionsat the moment of enrolment increases the difficulty of the task (because there areless informative and available data since we cannot use data from the Universitycareers of students) compared to most of the existing approaches. Despite thesedifficulties, this different approach makes it possible to use the tool in order toactively improve the student’s academic situation from the beginning and notonly to make predictions and monitoring during the academic career. On theother hand, we also performed a set of tests considering the credits obtainedby a students after a certain period of time. As one can expect, this helps inlargely improving the final performance of the model. This fact can be used bythe institution to decide whether to act as early as possible, on the basis of theinformation available at enrolment time, or to wait for some more data in thefirst year thus obtaining more accurate predictions. In any case, the results ob-tained show that starting from data without any pedagogical or didactic value,our tool can practically help in the attempt to mitigate the dropout problem.
We designed the tool in such a way that the integration with other com-ponents can occur seamlessly. Indeed, we aim to extend it to a more generalmonitoring system, to be used by the University governance, which can moni-tor students careers and can provide helpful advice when critical situations areencountered. For example, if the tool predicts that for a new cohort of studentsenrolled in a specific degree program there are many possible dropouts, thenspecific support services (such as supplementary support courses, personalisedguidance, etc) could be organised. We hope and believe that this can be an ef-fective way to decrease the dropout rate in the future years and to avoid thephenomenon since the very beginning of the University careers of the students.
The first natural step in our work is the integration of our tool with other Uni-versity services as described before. Next we would like to monitor the dropoutfrequency in the coming years in order to obtain some hint about the effec-tiveness of our tool. The outcomes of this analysis could guide us to improvethe deployment of the tool — e.g. by using different, more robust strategies.To improve the model effectiveness it could also be useful to make predictionsfor different courses possibly within the same school, possibly integrating thiswith an appropriate definition of a similarity measure between courses. Anotherfurther development could be the inclusion of more data about student perfor-mances, for example by considering the results of activities done in LearningManagement Systems (LMS) or Virtual Learning Environments (VLE) such as,for example, Moodle, Google Classroom, Edmodo, that could be used in thecourses management and organisation. A limitation in our study is in the factthat the tool take advantage of sensitive data, so one has to be very carefulwith using the classifier, since there is no evidence of the model fairness — e.g.,concerning the gender feature.
Finally, given the increasing attention gathered by deep learning models, wewould like to extend our analysis in order to include these methods and considerseveral factors, such as: the depth of the network (e.g., the number of layers) thedimension of each layer, etc.
Student Dropout Prediction 11
References
1. Aulck, L., Velagapudi, N., Blumenstock, J., West, J.: Predicting student dropoutin higher education. In: 2016 ICML Work. #Data4Good Mach. Learn. vol.abs/1606.06364, pp. 16–20. New York (2016)
2. Breiman, L.: Random forests. Machine learning 45(1), 5–32 (2001)3. Chang, C.C., Lin, C.J.: Libsvm: A library for support vector machines. ACM
transactions on intelligent systems and technology (TIST) 2(3), 27 (2011)4. Freeman, E.A., Moisen, G.G.: A comparison of the performance of threshold cri-
teria for binary classification in terms of predicted prevalence and kappa. Ecol.Modell. 217(1-2), 48–58 (2008)
5. Hellas, A., Ihantola, P., Petersen, A., Ajanovski, V.V., Gutica, M., Hynninen, T.,Knutas, A., Leinonen, J., Messom, C., Liao, S.N.: Predicting academic perfor-mance: a systematic literature review. In: Proceedings Companion of the 23rdAnnual ACM Conference on Innovation and Technology in Computer Science Ed-ucation. pp. 175–199. ACM (2018)
6. Jadric, M., Garaca, Z., Cukusic, M.: Student dropout analysis with application ofdata mining methods. Manag. J. Contemp. Manag. Issues 15(1), 31–46 (2010)
7. Kadar, M., Sarraipa, J., Guevara, J.C., y Restrepo, E.G.: An integrated approachfor fighting dropout and enhancing students’ satisfaction in higher education. In:Proceedings of the 8th International Conference on Software Development andTechnologies for Enhancing Accessibility and Fighting Info-exclusion, DSAI 2019,Thessaloniki, Greece, June 20-22, 2018. pp. 240–247 (2018)
8. Kotsiantis, S.B., Pierrakeas, C.J., Pintelas, P.E.: Preventing student dropout indistance learning using machine learning techniques. LNCS 2774, 267–274 (2003)
9. Li, H., Lynch, C.F., Barnes, T.: Early prediction of course grades: Models andfeature selection. In: Conf. Educ. Data Min. pp. 492–495 (2018)
10. Marquez-Vera, C., Romero Morales, C., Ventura Soto, S.: Predicting school failureand dropout by using data mining techniques. Rev. Iberoam. Tecnol. del Aprendiz.8(1), 7–14 (2013)
11. Martinho, V.R.D.C., Nunes, C., Minussi, C.R.: An intelligent system for predictionof school dropout risk group in higher education classroom based on artificial neuralnetworks. In: 2013 IEEE 25th International Conference on Tools with ArtificialIntelligence. pp. 159–166 (Nov 2013)
12. Pal, S.: Mining educational data using classification to decrease dropout rate ofstudents. CoRR abs/1206.3078 (2012)
13. Pedregosa, F., Varoquaux, G., Gramfort, A., Michel, V., Thirion, B., Grisel, O.,Blondel, M., Prettenhofer, P., Weiss, R., Dubourg, V., et al.: Scikit-learn: Ma-chine learning in python. Journal of machine learning research 12(Oct), 2825–2830(2011)
14. Serra, A., Perchinunno, P., B, M.B.: Predicting student dropouts in higher educa-tion using supervised classification algorithms. LNCS 3043, 18–33 (2004)
15. Whitehill, J., Mohan, K., Seaton, D.T., Rosen, Y., Tingley, D.: Delving deeper intoMOOC student dropout prediction. CoRR abs/1702.06404 (2017)
16. Zheng, Z., Li, Y., Cai, Y.: Oversampling method for imbalanced classification.Comput. Informatics 34, 1017–1037 (2015)